1. Introduction
Enhancing the load-bearing capacity of foundations, including pile foundations, constitutes a paramount concern in foundation engineering, especially when dealing with construction in soft soil conditions. One approach to address this challenge is the development and utilization of unconventional pile shaft shapes. Such variations encompass piles with shaft widening, thickening, profiled surfaces, telescopic geometries, among others [
1,
2,
3,
4,
5]. Owing to the distinctive characteristics of their shaft shapes, these piles demonstrate more efficient interaction with the surrounding soil, resulting in significantly greater load resistance than conventional prismatic or cylindrical piles. Field investigations [
6] and numerical simulations [
7] focusing on conical piles have revealed heightened stress concentration in the widening regions of the piles within the ground compared to their tips. This observation underscores the pivotal role of the widening sections in determining the load-bearing capacity of piles. Further research [
8,
9,
10,
11] indicates a 35-45% increase in the static load resistance of widened piles compared to their non-widened counterparts. In some numerical studies [
12], this beneficial effect has been shown to reach as high as 68%.
Another equally effective strategy for augmenting the load-bearing capacity of foundations, including pile foundations, is the incorporation of loose, rigid materials (such as crushed stone, gravel, dry cement-sand mixtures, concrete mortar, etc.) during construction. This technique results in a 2.0-2.4-fold increase in foundation resistance [
13]. It finds widespread application when establishing foundations in compacted excavations. The addition of rigid materials and their compaction at the base of the excavation serves as an effective means of compacting the surrounding soil, thereby increasing the foundation’s load-bearing capacity [
14,
15]. This, in turn, leads to reduced excavation volume, decreased consumption of concrete and reinforcement materials, and cost savings in constructing buildings and structures.
Regarding pile foundations within geotechnical engineering, there exists a body of experience in using rigid-material backfills to enhance the load-bearing capacity of driven, bored, and cast-in-place piles.
The literature reveals the technology for fabricating driven hollow reinforced concrete piles with a circular cross-section and an open lower end [
16,
17]. To heighten the load-bearing capacity of such piles, it is recommended to partially fill their internal cavities with rigid materials and subsequently compact them with a punch into the ground beneath the pile’s lower end. Crushed stone or dry concrete mixtures are proposed as suitable rigid materials. Consequently, the lower portion of the piles forms a compacted, broadened base comprised of rigid materials and soil. The application of such hollow piles with backfilling and rigid-material compaction is advised for deployment in weak, waterlogged soils, where the most significant improvement in load-bearing capacity is anticipated.
The construction of tubular piles featuring crushed stone widening in their lower sections is elucidated in [
2,
18]. To create the widening within the driven pile’s cavity, portions of crushed stone are backfilled and compacted through the pile’s cavity into the ground. Research has established that the dimensions of the widening in the lower part of the piles have a substantial influence on their static load resistance. Accordingly, the bearing capacity of a tubular pile with a widened, compacted crushed stone portion having a diameter equivalent to 2.5 times the pile’s diameter (denoted as ‘d’) is 1.7-2.45 times greater than that of similar piles lacking this feature. Researchers have further determined that the dimensions of the widening composed of rigid material are contingent on various factors, including the pile’s diameter, soil characteristics beneath the pile’s lower end, the volume of compacted crushed stone material, and its particle size distribution, among others [
19].
Numerical modeling results elucidate the performance of bored-tied piles, both with and without compacted crushed stone widening in their lower sections [
20]. It has been ascertained that the creation of crushed stone widening in the lower part of the piles leads to additional soil compaction at the base, resulting in a 1.04-1.12-fold reduction in pile settlement.
Recommendations for the design and construction of flat-profile piles underscore the importance of considering a coefficient accounting for the enhanced bearing capacity of piles driven with the addition of loose materials [
21]. These recommendations reveal that the bearing capacity of 5, 7, and 9-meter flat-profile piles is respectively 1.27, 1.30, and 1.32 times greater when driven with the addition of loose materials compared to their counterparts driven without such additions. The most pronounced effect of incorporating loose materials is observed in the case of 9-meter piles. The authors propose specific quantities of loose material per pile, corresponding to 200, 380, and 460 kilograms, for piles with lengths of 5, 7, and 9 meters, respectively.
A method involving the construction of a pile-slab foundation with crushed stone widening beneath the lower ends of the piles is described in [
22]. Piles, each measuring 8 meters in length and 53 centimeters in diameter, were installed within excavation pits with widening created in their lower sections through the gradual compaction of crushed stone, with a total volume of 1 cubic meter beneath each pile. The diameter of the widening beneath the piles’ lower ends measured 100 centimeters.
This approach, which significantly enhances the load-bearing capacity of piles by creating widening beneath their tips, also optimally distributes the load between the foundation’s slab and the piles. This innovative technique has led to a reduction of up to 50% in the number of required piles. The distances between piles in the foundation are established at 5 times the pile diameter (5‘d’), where ‘d’ represents the pile diameter. The design of such a pile-slab foundation with crushed stone widening for a 16-story building results in up to 20% in cost savings compared to the design involving driven prismatic piles, each measuring 17 meters in length and having a cross-sectional dimension of 30x30 centimeters.
In [
23], features related to the construction of cast-in-place piles with dual widening in their lower sections are expounded. These piles are formed by sequentially filling the excavation with large rigid materials (such as coarsely crushed stone) in layers, compacted with a lengthy tamper featuring a pointed angle ranging from 120-180 degrees. This process results in the creation of a broadened section in the lower part of the pile without significant lateral expansion. Subsequently, finer rigid material (crushed stone or fine gravel) is added on top of this widening and compacted using a tamper with a pointed angle ranging from 25-90 degrees. This procedure yields an upper widening. Following this, a reinforcement cage is inserted into the well, and its cavity is filled with concrete mortar. Experiments have revealed that the load-bearing capacity of cast-in-place piles featuring dual widening in the lower section surpasses that of piles without widening by 1.5-3.0 times. The authors attribute this effect to the increased soil resistance along the pile’s lateral surface.
[
23] Presents an alternative approach for constructing piles with dual widening. A distinguishing feature of this method is the driving of a pile into the well after the expansions have been created. The pile is driven by submerging its tip into the upper widening. Researchers have noted that such piles also exhibit a high load-bearing capacity.
The aforementioned works [
1,
2,
3,
4,
5,
6,
7,
8,
9,
10,
11,
12,
13,
14,
15,
16,
17,
18,
19,
20,
21,
22,
23] collectively underscore the significant role played by both geometric widening within the pile shaft and the application of rigid material backfills in enhancing the load-bearing capacity of piles. However, it is regrettable that, within a specific pile structure type, researchers have not addressed the combined impact of these two factors on load-bearing capacity enhancement. Additionally, researchers have overlooked the influence of rigid material type on pile resistance and the energy intensity of pile driving. This oversight is notable due to the wide variety of rigid materials used as backfill during pile installation.
Acknowledging the relevance of these issues, our research endeavors have included experimental investigations employing driven piles featuring from 1 to 4 flat widening along the shaft length [
24]. This research was conducted in two stages. The first stage assessed the impact of the number of widening on load-bearing capacity and pile driving energy intensity, while the second stage evaluated the influence of the type of rigid and soil material placed beneath the pile widening on their load-bearing capacity and energy-related parameters. The results of the first stage are presented in [
8], and the second stage is elucidated in the present paper. These experiments were conducted under laboratory conditions, using pile models and four types of backfill materials: loam, sand, gravel, and crushed stone.
The research aims to investigate the influence of backfill materials composed of soil and rigid substances on the energy intensity of pile driving and the resistance to static loads, taking into account piles featuring multiple shaft widening.
3. Research results and discussion
3.1. Test results of pile models with 4 widening
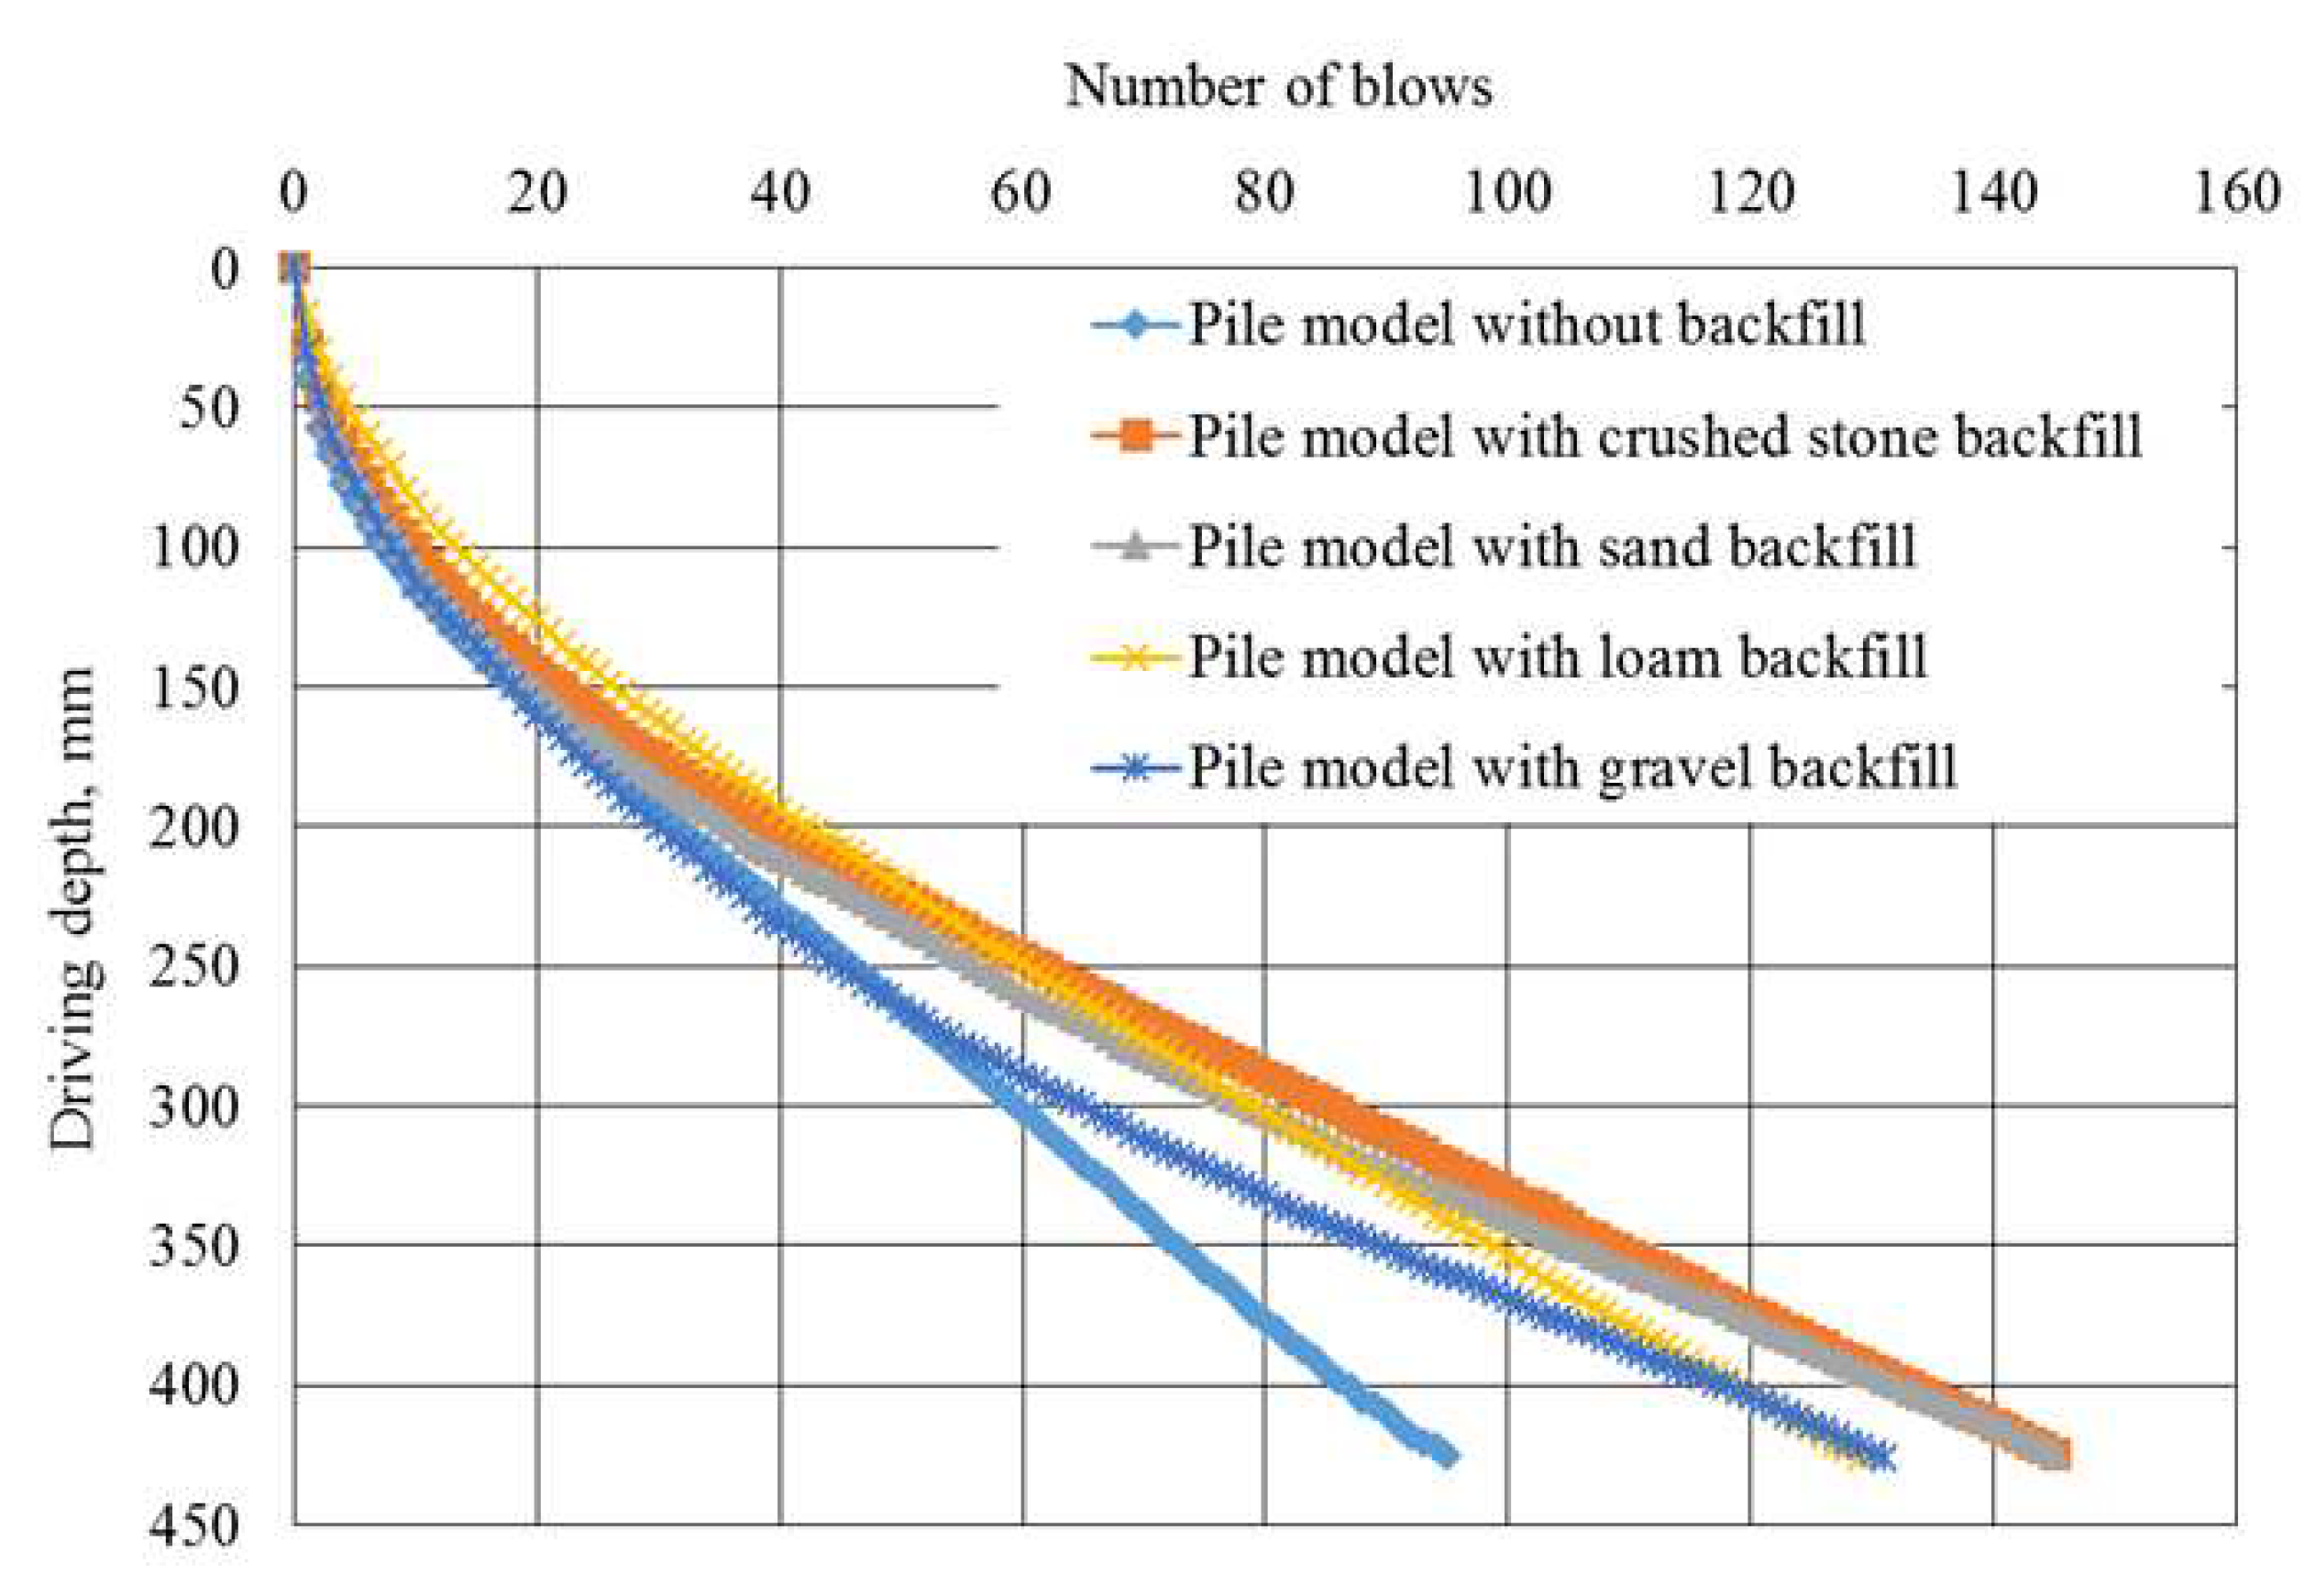
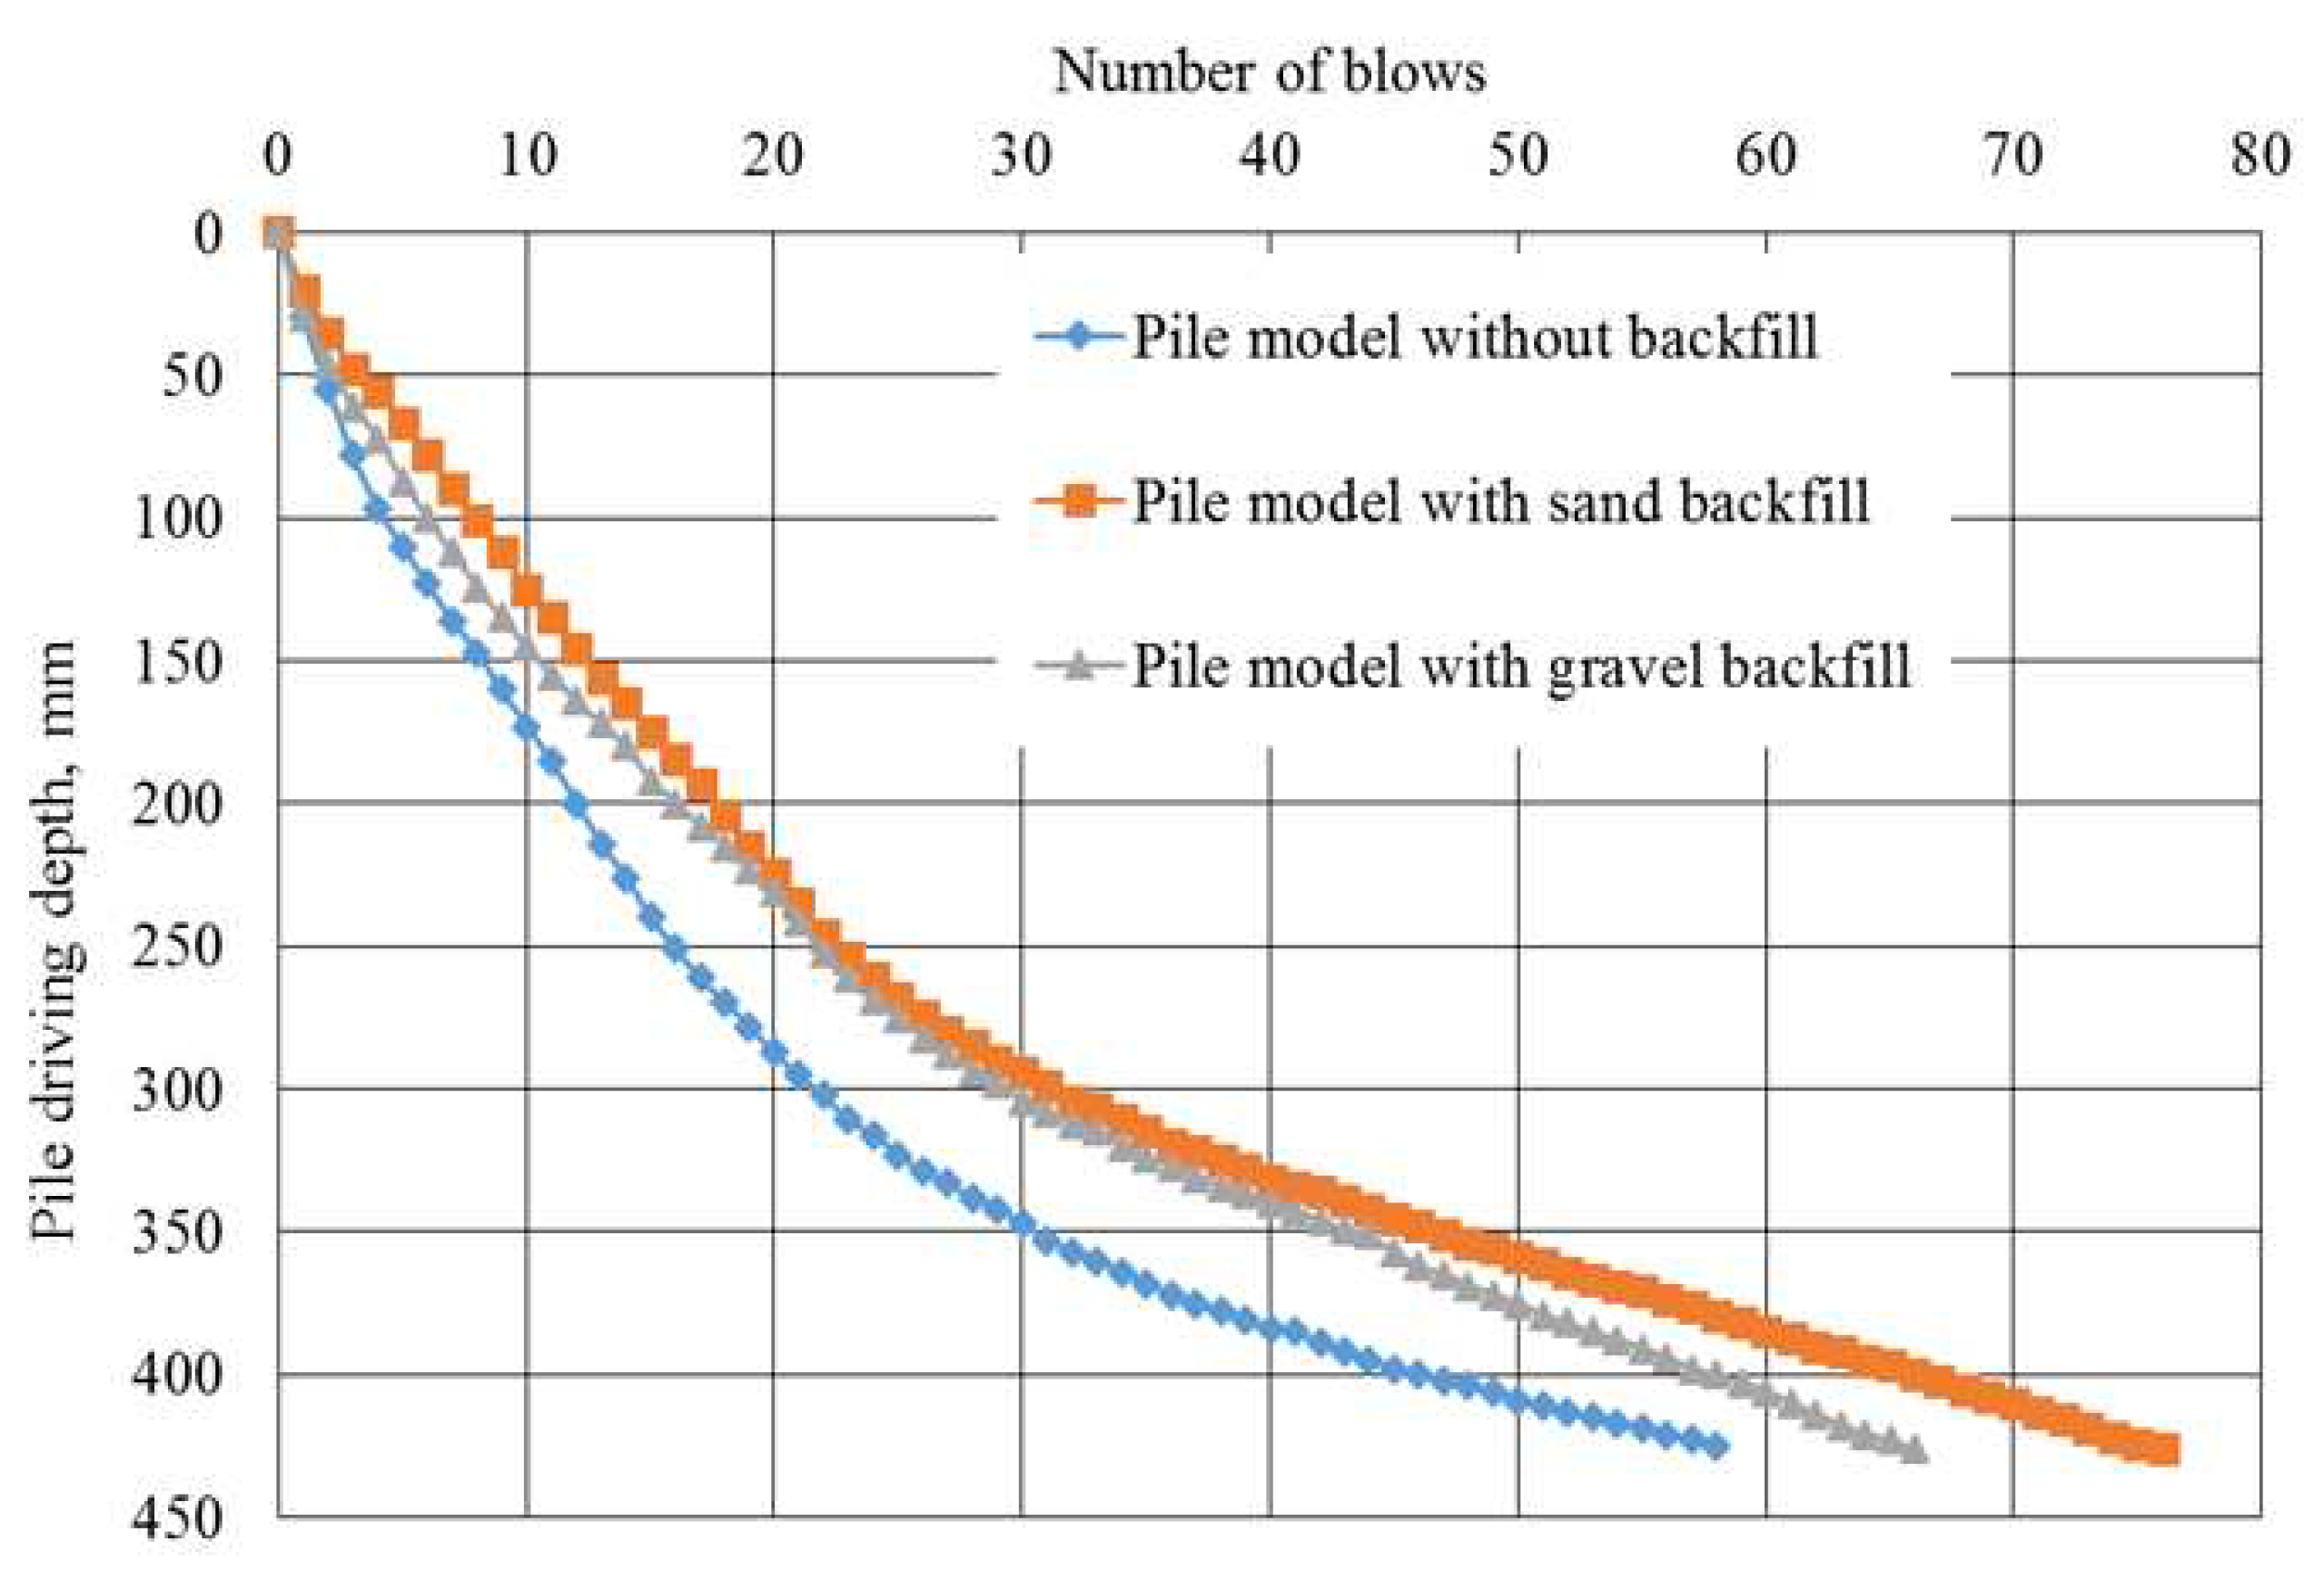
Testing results of driving pile models with 4 widening are presented in
Figure 6 and
Table 3. For a comparative assessment of the test results, the following indicators were adopted:
- the overall energy applied by the hammer , spent on burying the pile model to the required depth;
- the energy intensity of the hammer for driving a pile model , expressed per unit volume of the portion of the pile buried within the soil (calculated as the ratio of the total energy expended for driving a pile model to the volume of the section buried in the soil).
- the volume of backfilling material , introduced into the vicinity of the pile during the driving process;
- an indicator of enhanced energy intensity during driving , calculated as the ratio of the total driving energy required for the pile model with the inclusion of rigid material to the total driving energy necessary for the pile model without any backfill material.
The experimental findings presented above reveal several key observations regarding the driving of pile models featuring 4 widening:
- depending on the type of rigid material used as backfill, at the same depth of immersion, the experimental pile models (with backfill) exhibit 1.36-1.54 times higher energy intensity during driving compared to the control pile model (without backfill).
- the energy intensity of pile driving per unit volume is 1.356-1.535 times greater for pile models with backfill compared to those without any backfill material.
- when driving pile models to the same depth, the volume of backfill material varies, with loam requiring the least (62 cm³), sand the most (136 cm³), and crushed stone (96 cm³) and gravel (132 cm³) falling in between.
As can be seen from the test results (
Table 3), the spending on crushed stone for backfill in driving a model pile is 1.38 times less than the spending on gravel. However, at the same time, the total energy intensity for driving a model pile with crushed stone is 11.45% more than for driving a model pile with gravel. This can be attributed to the fact that crushed stone, unlike gravel, has a more consistent size distribution with fewer smaller particles. Moreover, the surface of crushed stone particles exhibits substantial roughness and irregularities, impeding their relative movement when impacting the pile model and consequently increasing soil resistance. Hence, between these two types of coarse materials, the preference for driving pile models should be given to gravel mixtures over crushed stone. This choice is further justified by the lower cost of gravel compared to crushed stone.
A comparison of the test results pertaining to the driving of a pile model using fine-grained backfill materials (loam and sand) reveals that the consumption of loam is 2.19 times less than that of sand (as indicated in
Table 3). With the reduced usage of loam, driving a model pile incurs a lower total energy expenditure from the hammer (1.13 times less) in comparison to driving a model pile filled with sand. This distinction, in our assessment, is attributed to the cohesive nature of loam particles, which exhibit better interconnection. Consequently, loam is less mobile within the soil when subjected to the impact of the pile model, leading to a smaller volume of loam being incorporated into the soil and a subsequent reduction in the energy intensity required to drive the pile model.
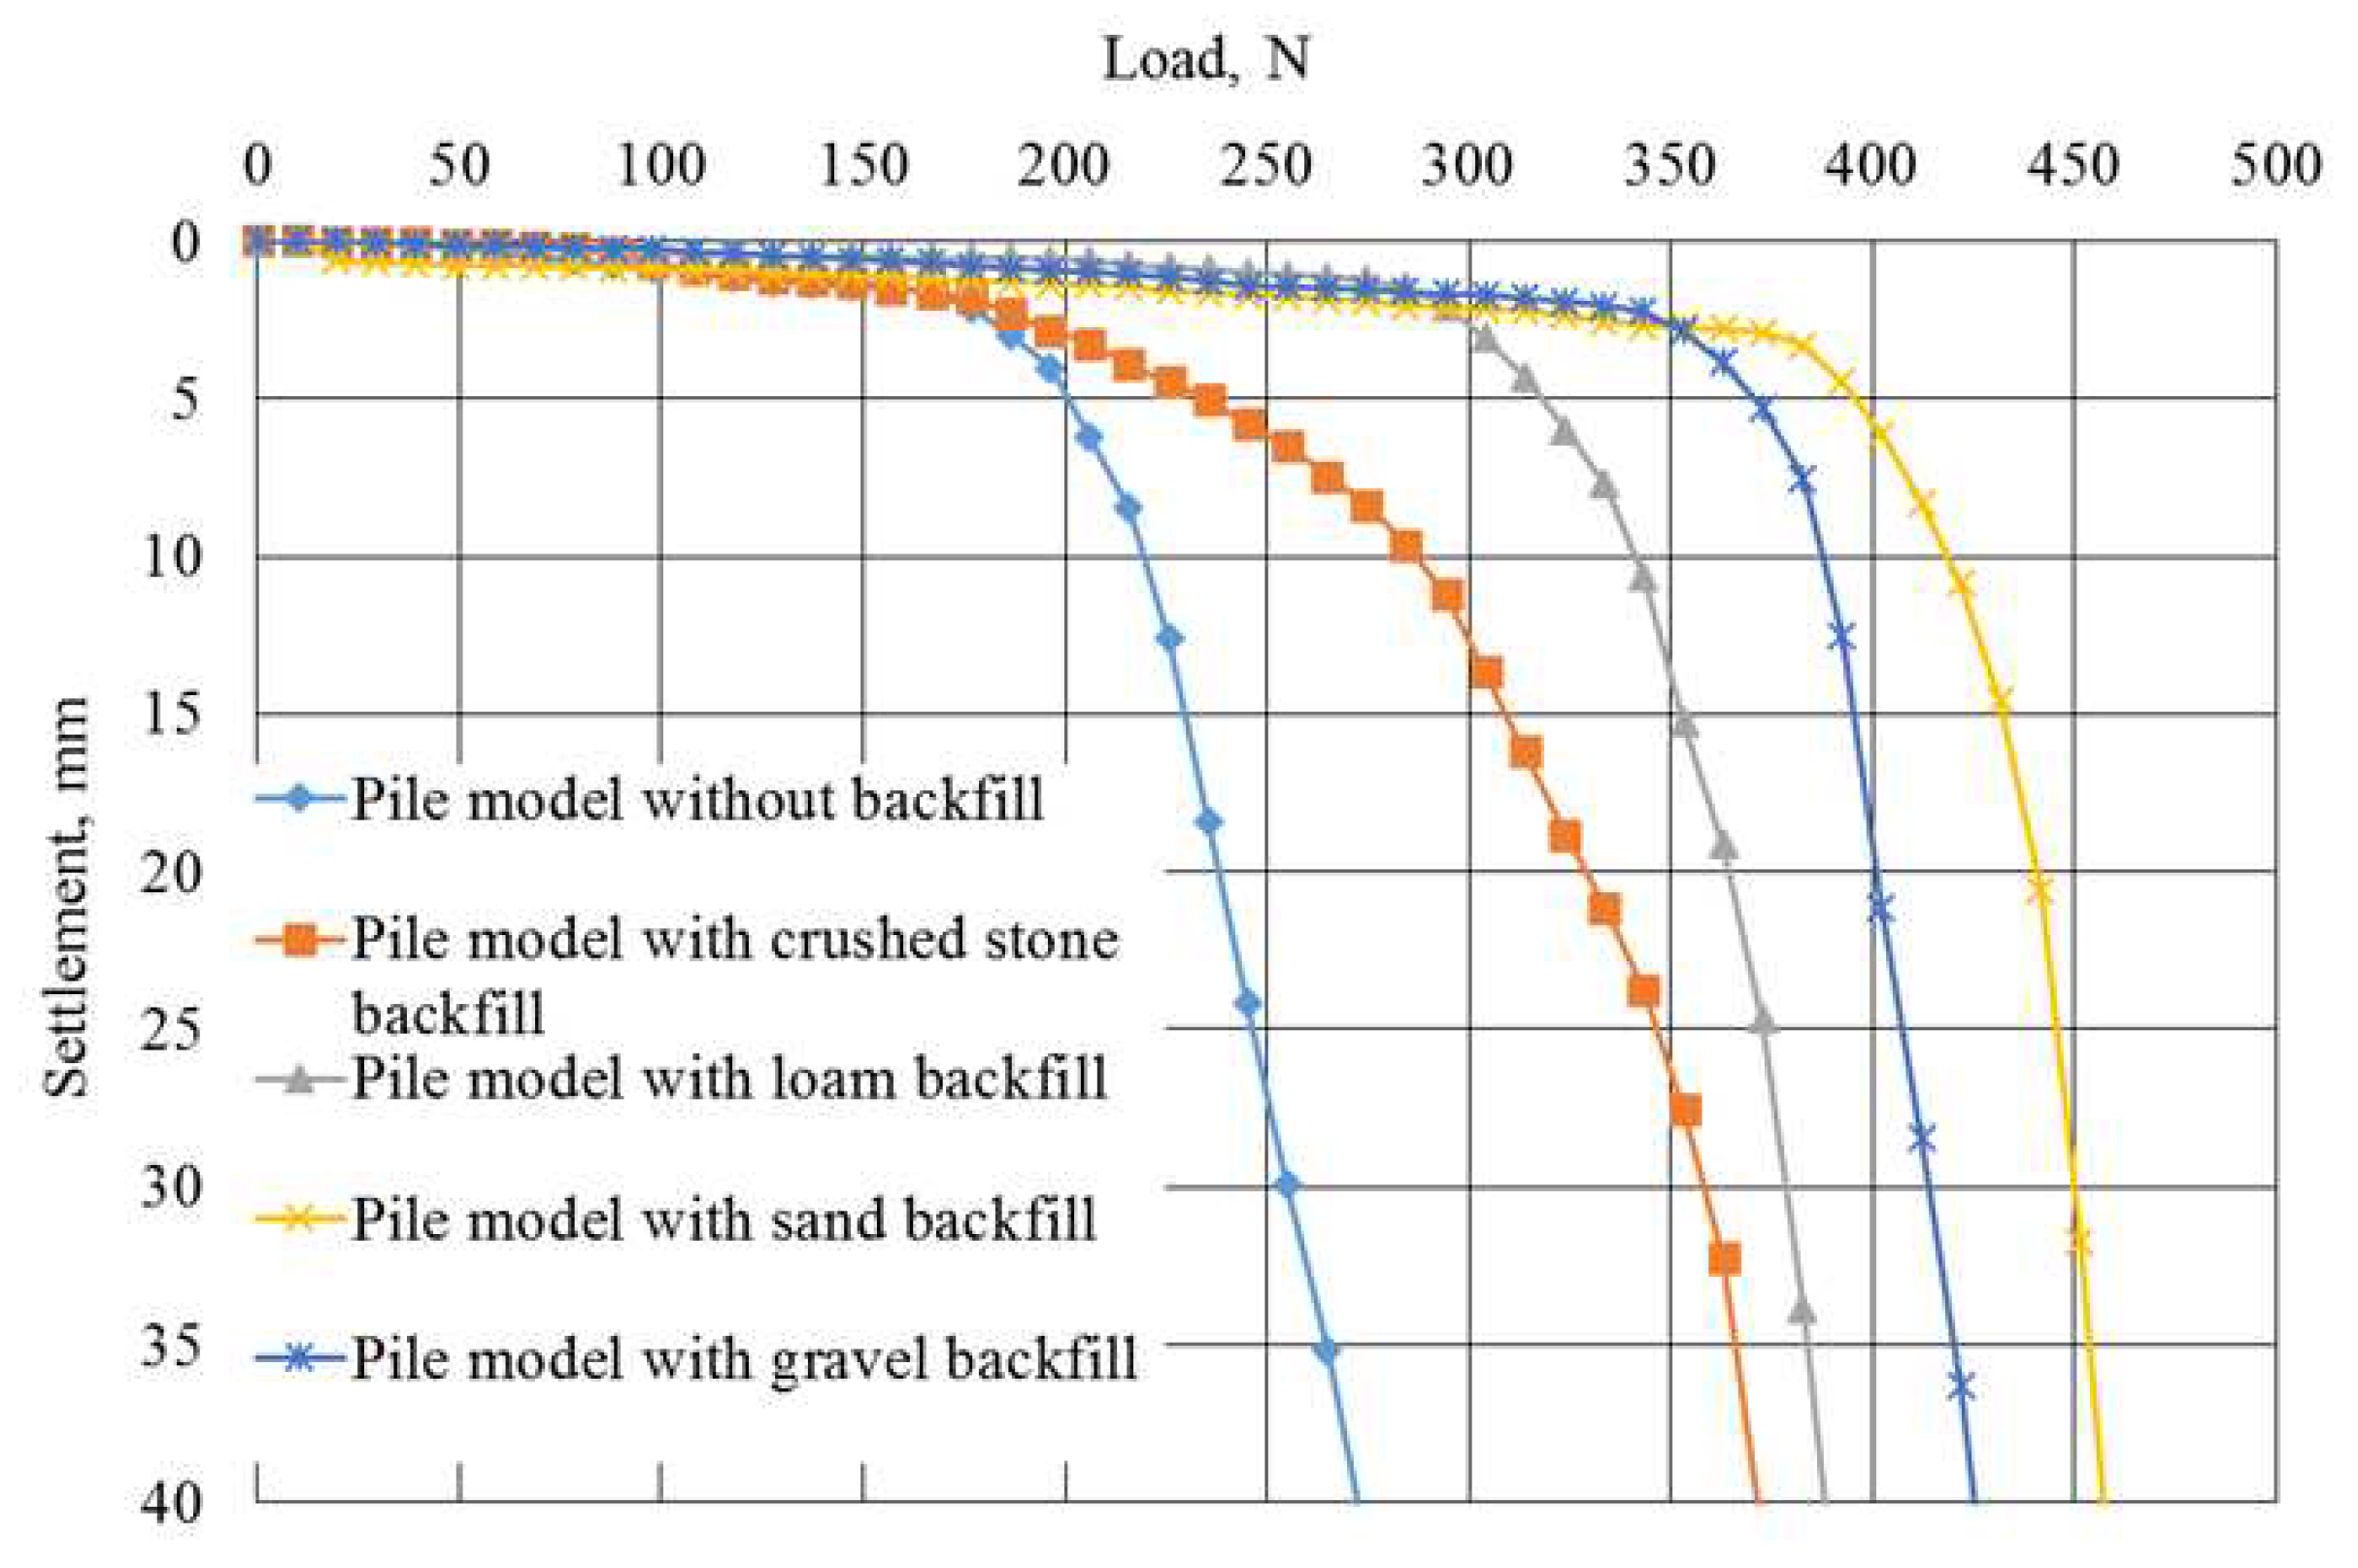
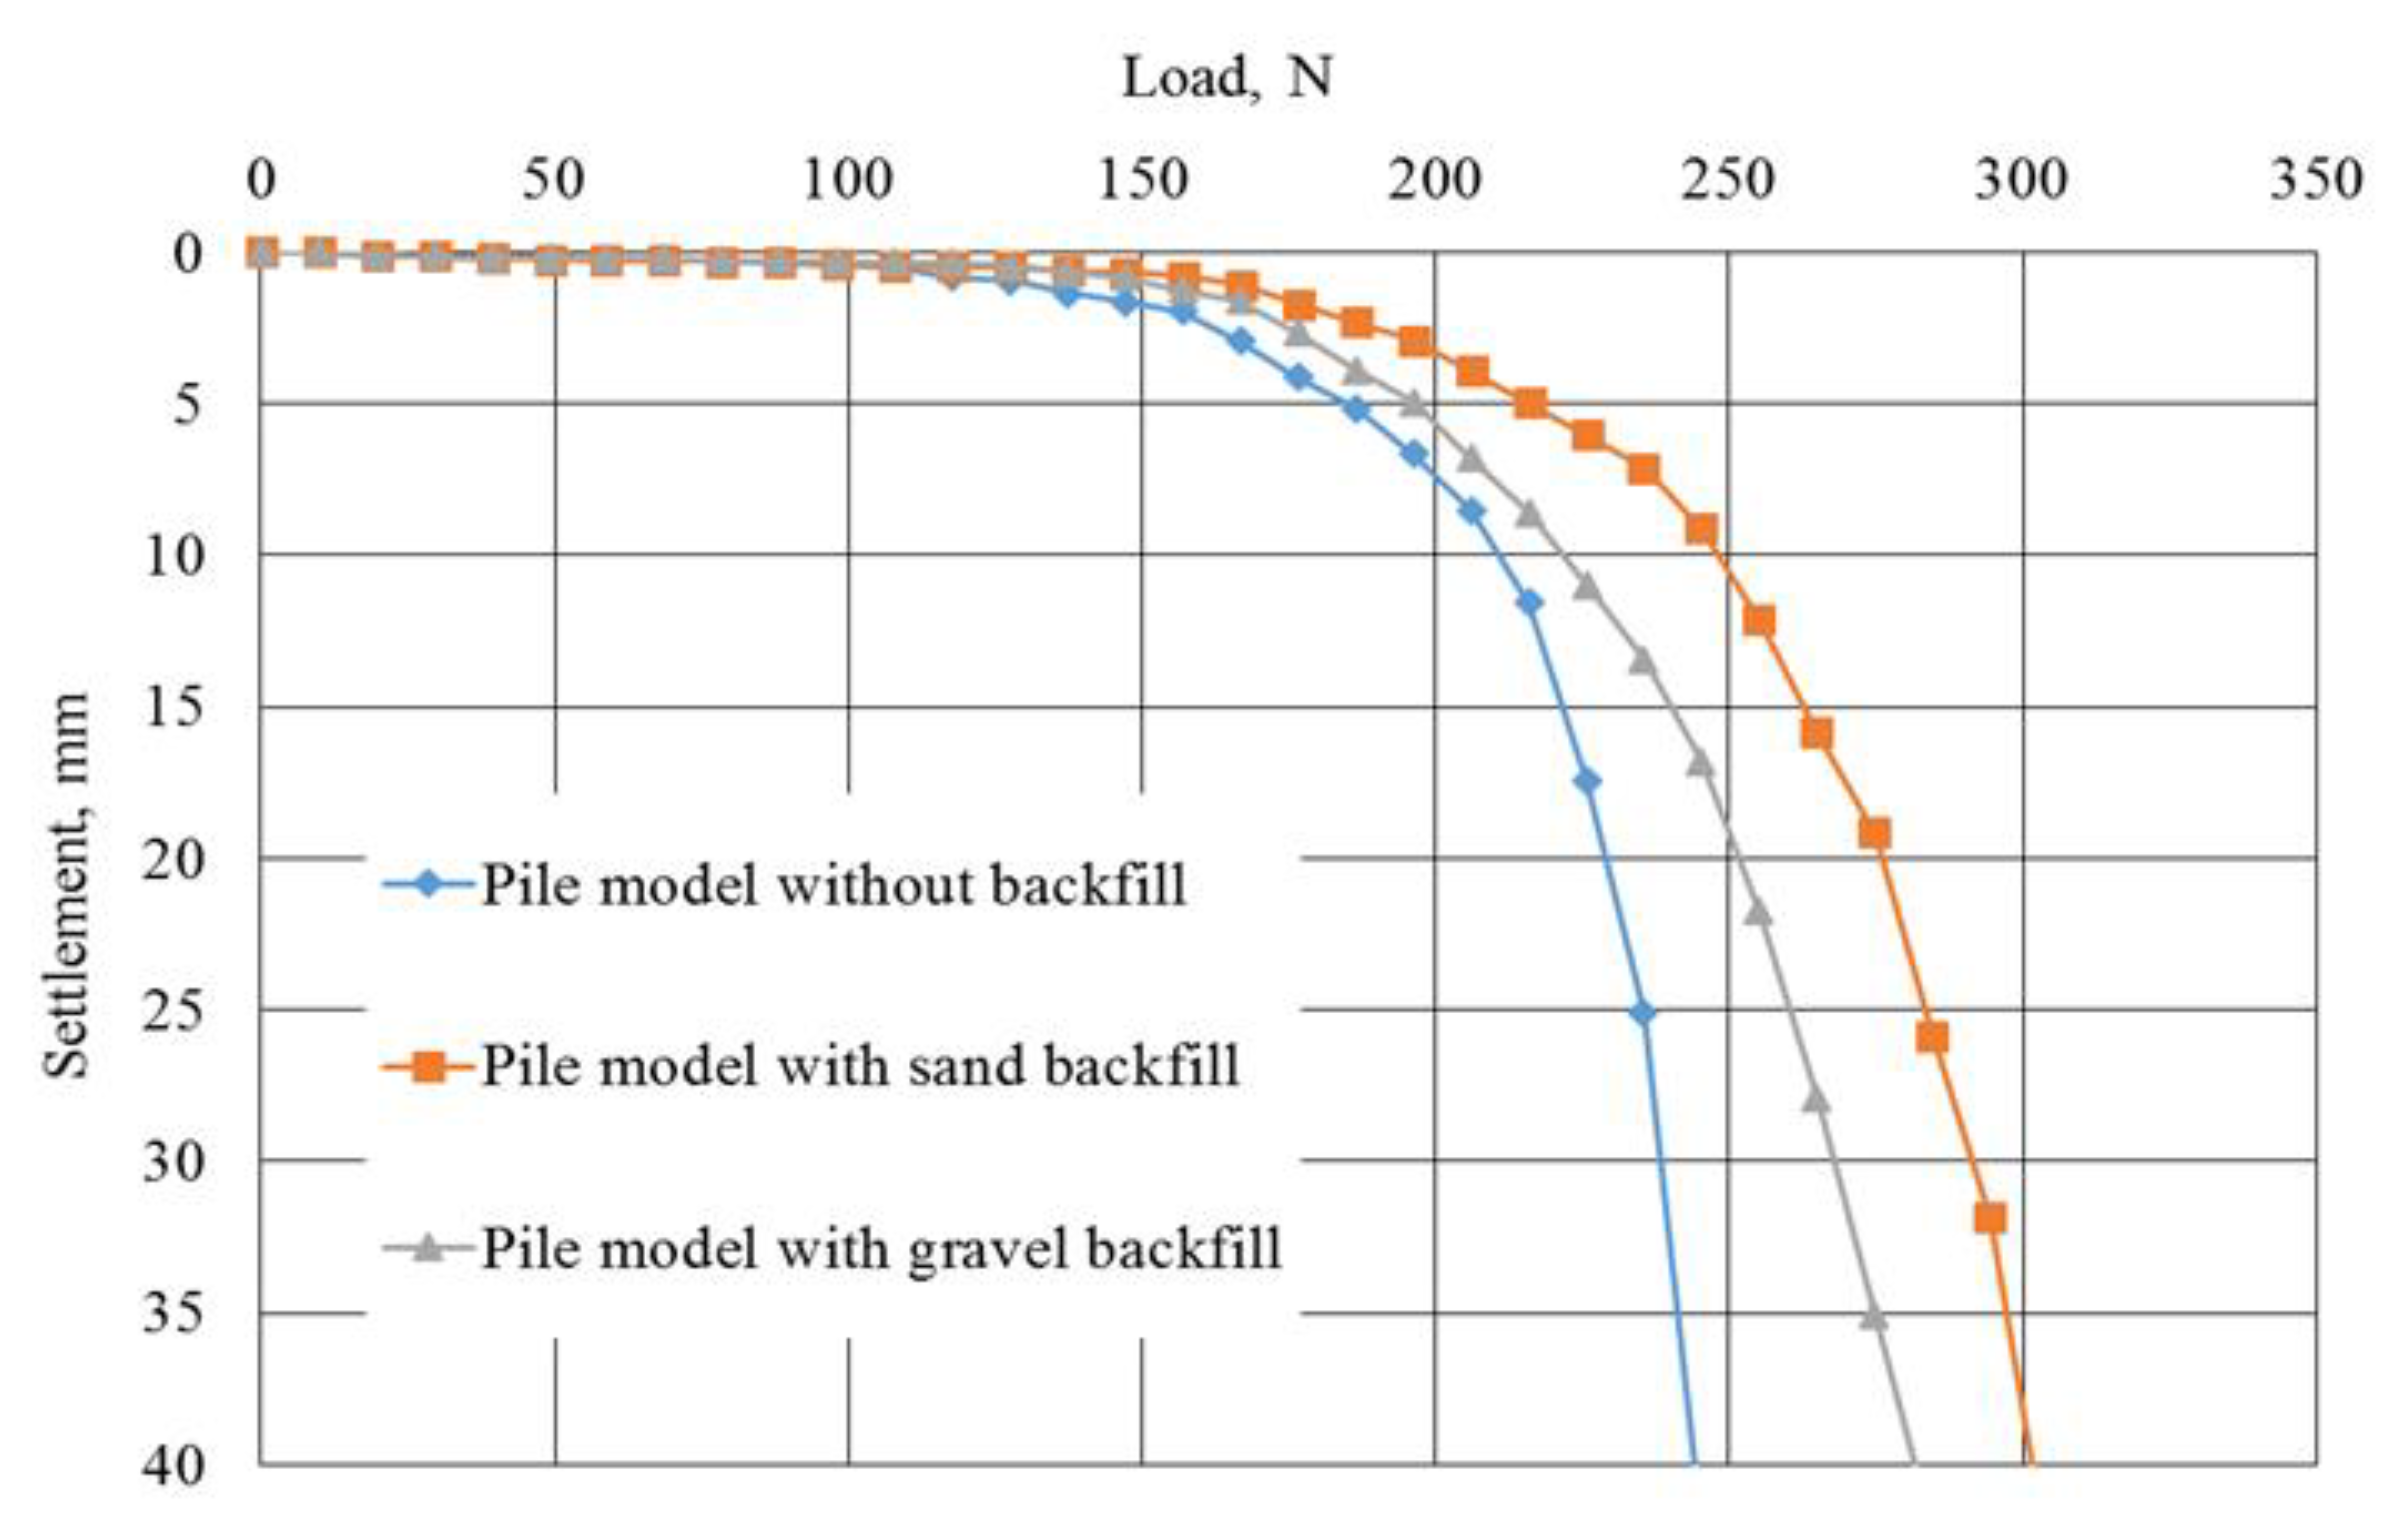
The resistance of pile models with 4 widening was assessed based on the results of their static tests of axial loads (
Table 4). The dependence of the settlement of pile models under an axial load is shown in
Figure 7.
The following indicators were adopted for comparative assessment of test results (
Table 4):
- load-bearing capacity
, established in accordance with the provisions of the regulatory document [
29];
- load-bearing capacity per unit volume , i.e., the ratio of the load-bearing capacity of the pile model to the buried volume of the pile in the soil;
- resistance-increasing index , which is the ratio of the resistance of the pile model with the addition of rigid material to the bearing capacity of the pile model without any addition.
The test results follow that pile models with backfilling (depending on the type of backfilling material) have a greater (1.36-1.68 times) load-bearing capacity compared to control pile models (without backfilling) with the same values of settlement. The highest load-bearing capacity values are found in pile models driven with added sand and gravel, and the lowest values are found in piles with added crushed stone and loam (
Table 4). The higher resistance of pile models with sand and gravel backfill, in our opinion, is due to large volumes of backfill material to the soil during driving. Thus, the volume of gravel filled into the soil is 1.38 and 2.13 times greater, than the volume of crushed stone and loam respectively, and the volume of sand is 1.42 and 2.19 times greater, respectively. The introduction of a larger volume of backfill material during driving helps to increase the compaction of the soil around the widening of the models, which ensures an increase in their bearing capacity.
The load-bearing capacity of a pile model with sand filling is 1.23 and 1.18 times greater than pile models with crushed stone and loam addition respectively, and the load-bearing capacity of a pile model with gravel addition is 1.14 and 1.10 times greater, respectively.
Taking into account the advantages of pile models driven with sand and gravel, the following tests regarding pile models with 2 and 3 shaft widening were carried out using only sand and gravel, as they are more effective in ensuring the load-bearing capacity of piles.
3.2. Test results of pile models with 3 widening
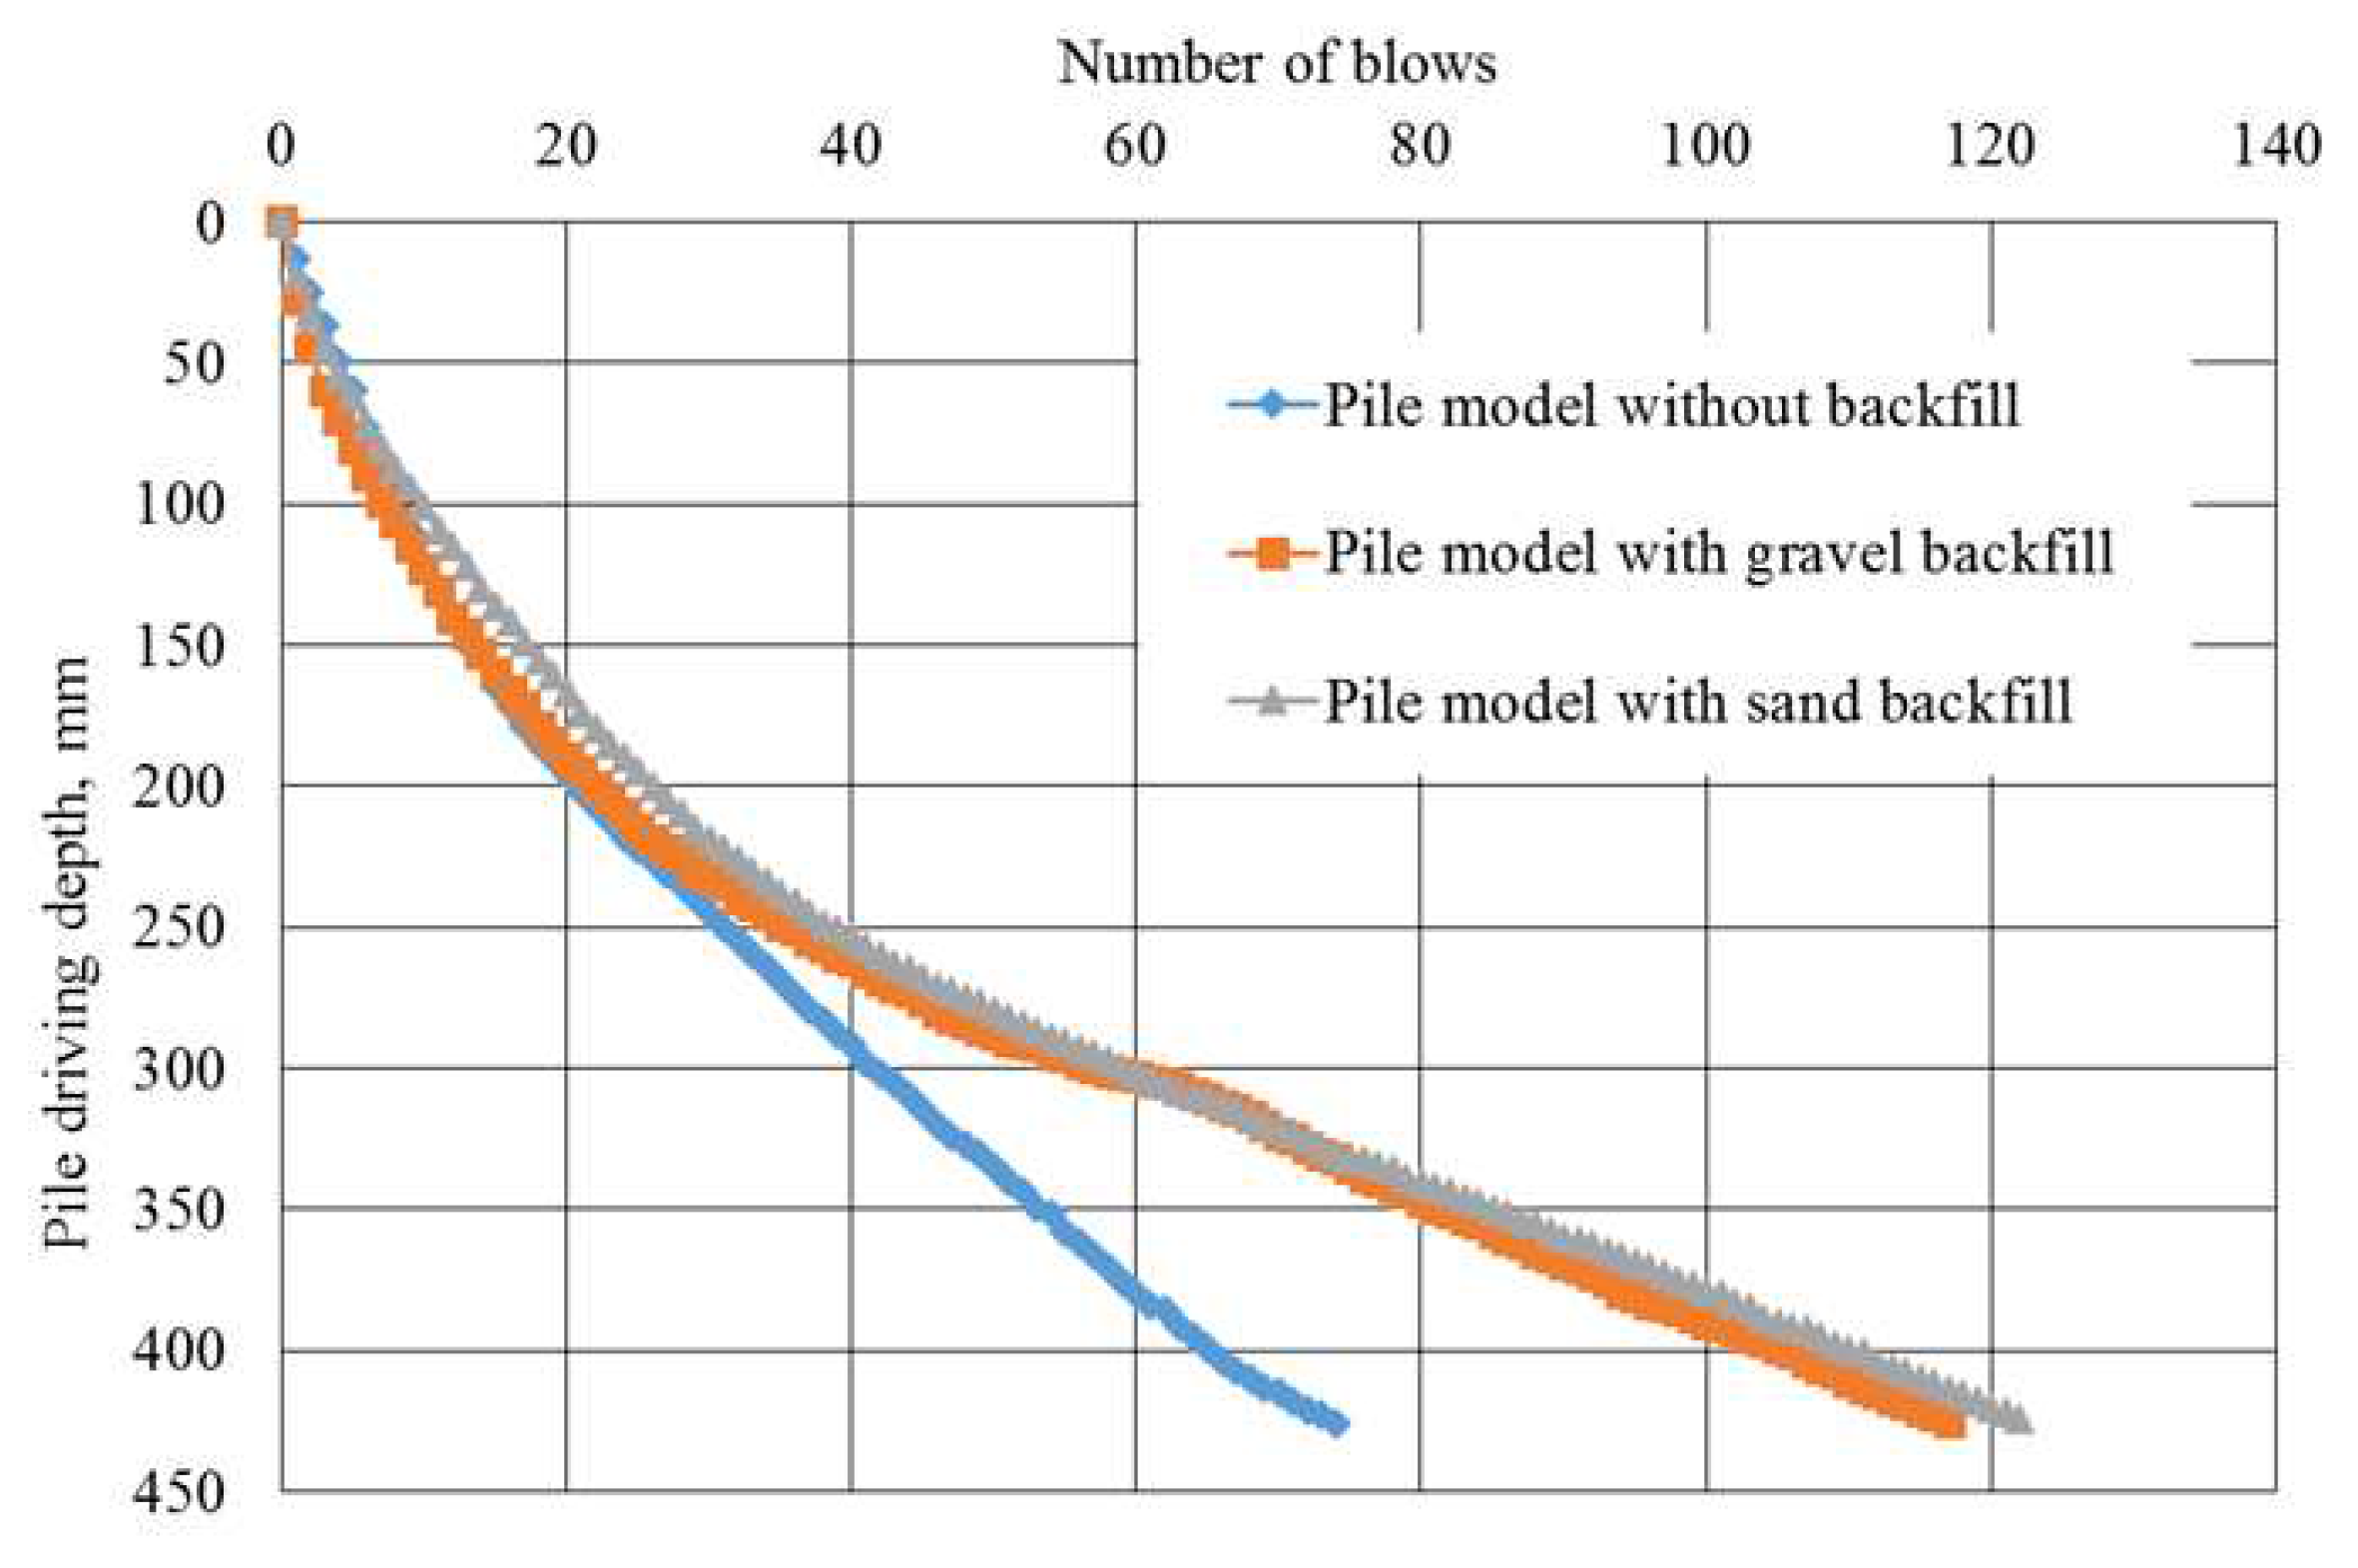
The energy intensity of the hammer for driving pile models with adding sand and gravel significantly exceeds the intensity for driving them without adding any bulk material (
Table 5). More energy-consuming (by 5.13%) was driving a pile model with sand addition than with gravel backfilling. This difference is due to the unequal volume of sand and gravel added to the soil during model driving. Consequently, 3.53% more energy was expended on driving a pile model with sand relative to gravel backfilling, leading to an escalation in energy intensity during pile driving when sand was used.
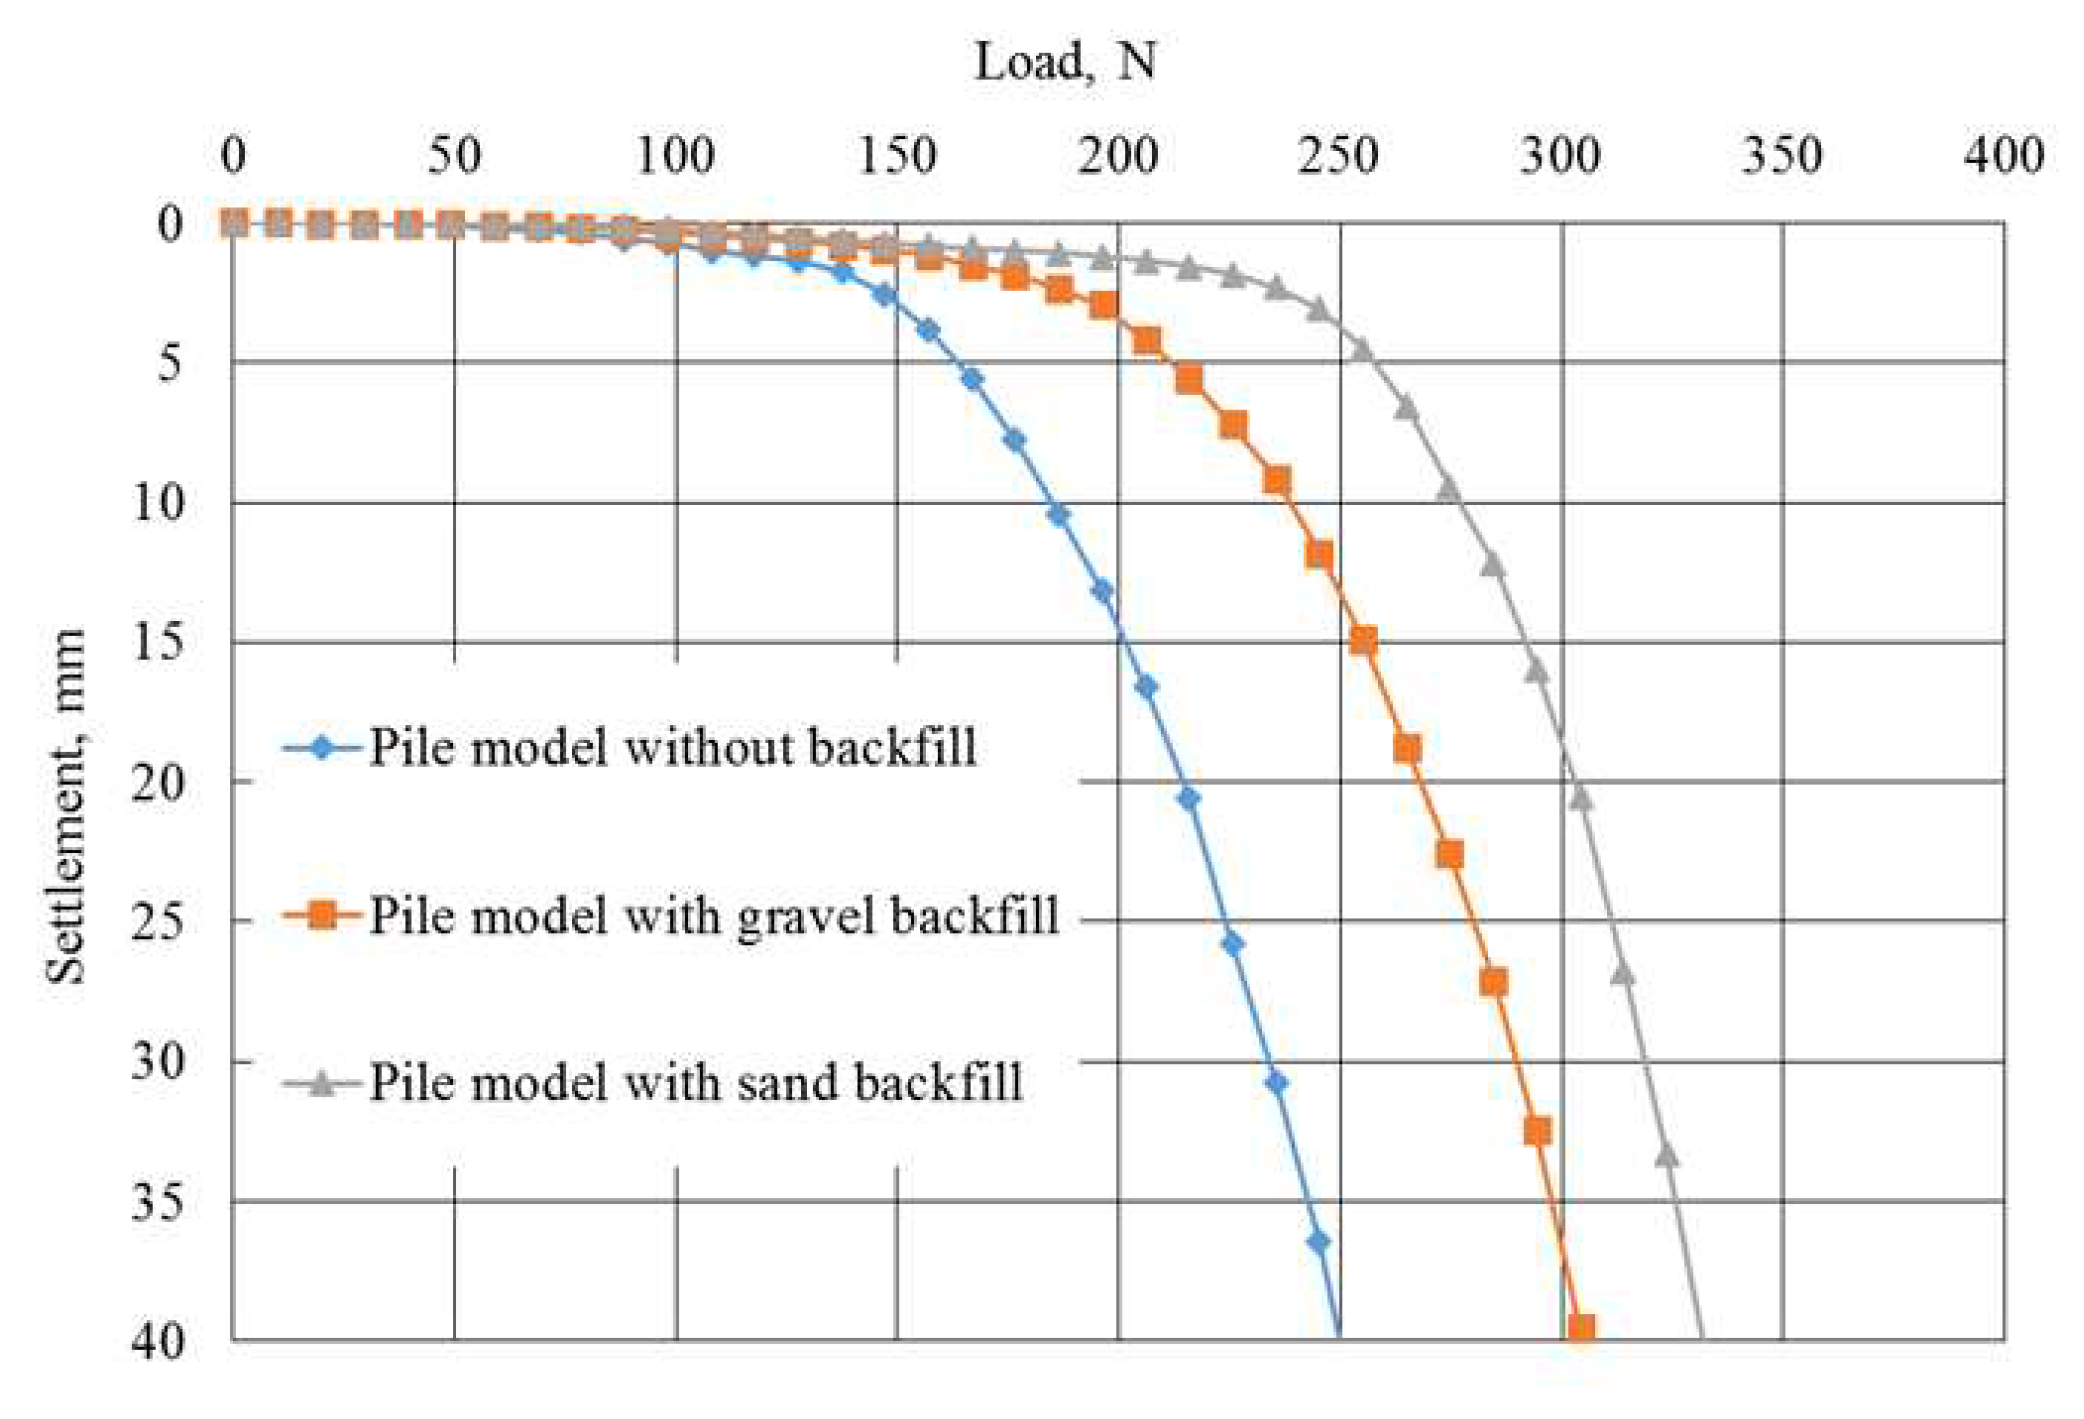
The bearing capacity of pile models with gravel and sand backfilling is higher than the bearing capacity of a pile model without backfilling (
Table 6). At the same time, the greatest load-bearing capacity belongs to the model of the pile driven with sand, which is 6.25% greater than the model with gravel.
3.3. Test results for pile models with 2 widening
The energy intensity of driving pile models by adding sand and gravel exceeds the intensity of pile driving without adding bulk material (
Table 7). Moreover, 15.2% more energy was spent on driving a pile model with sand addition than the gravel addition. This increased energy expenditure on driving a pile model with sand can be attributed to the fact that the consumption of sand during the pile driving process exceeded that of gravel by 5%, leading to the elevated energy intensity during pile driving when sand was employed.
Evident from the test results is that the load-bearing capacity of pile models filled with gravel and sand exceeds that of pile models lacking any backfill material (as outlined in
Table 8). Notably, the pile model driven with sand exhibits the highest load-bearing capacity, surpassing the pile model with gravel backfilling by 7.06%.
3.4. Test results comparison of pile models with 2-4 widening
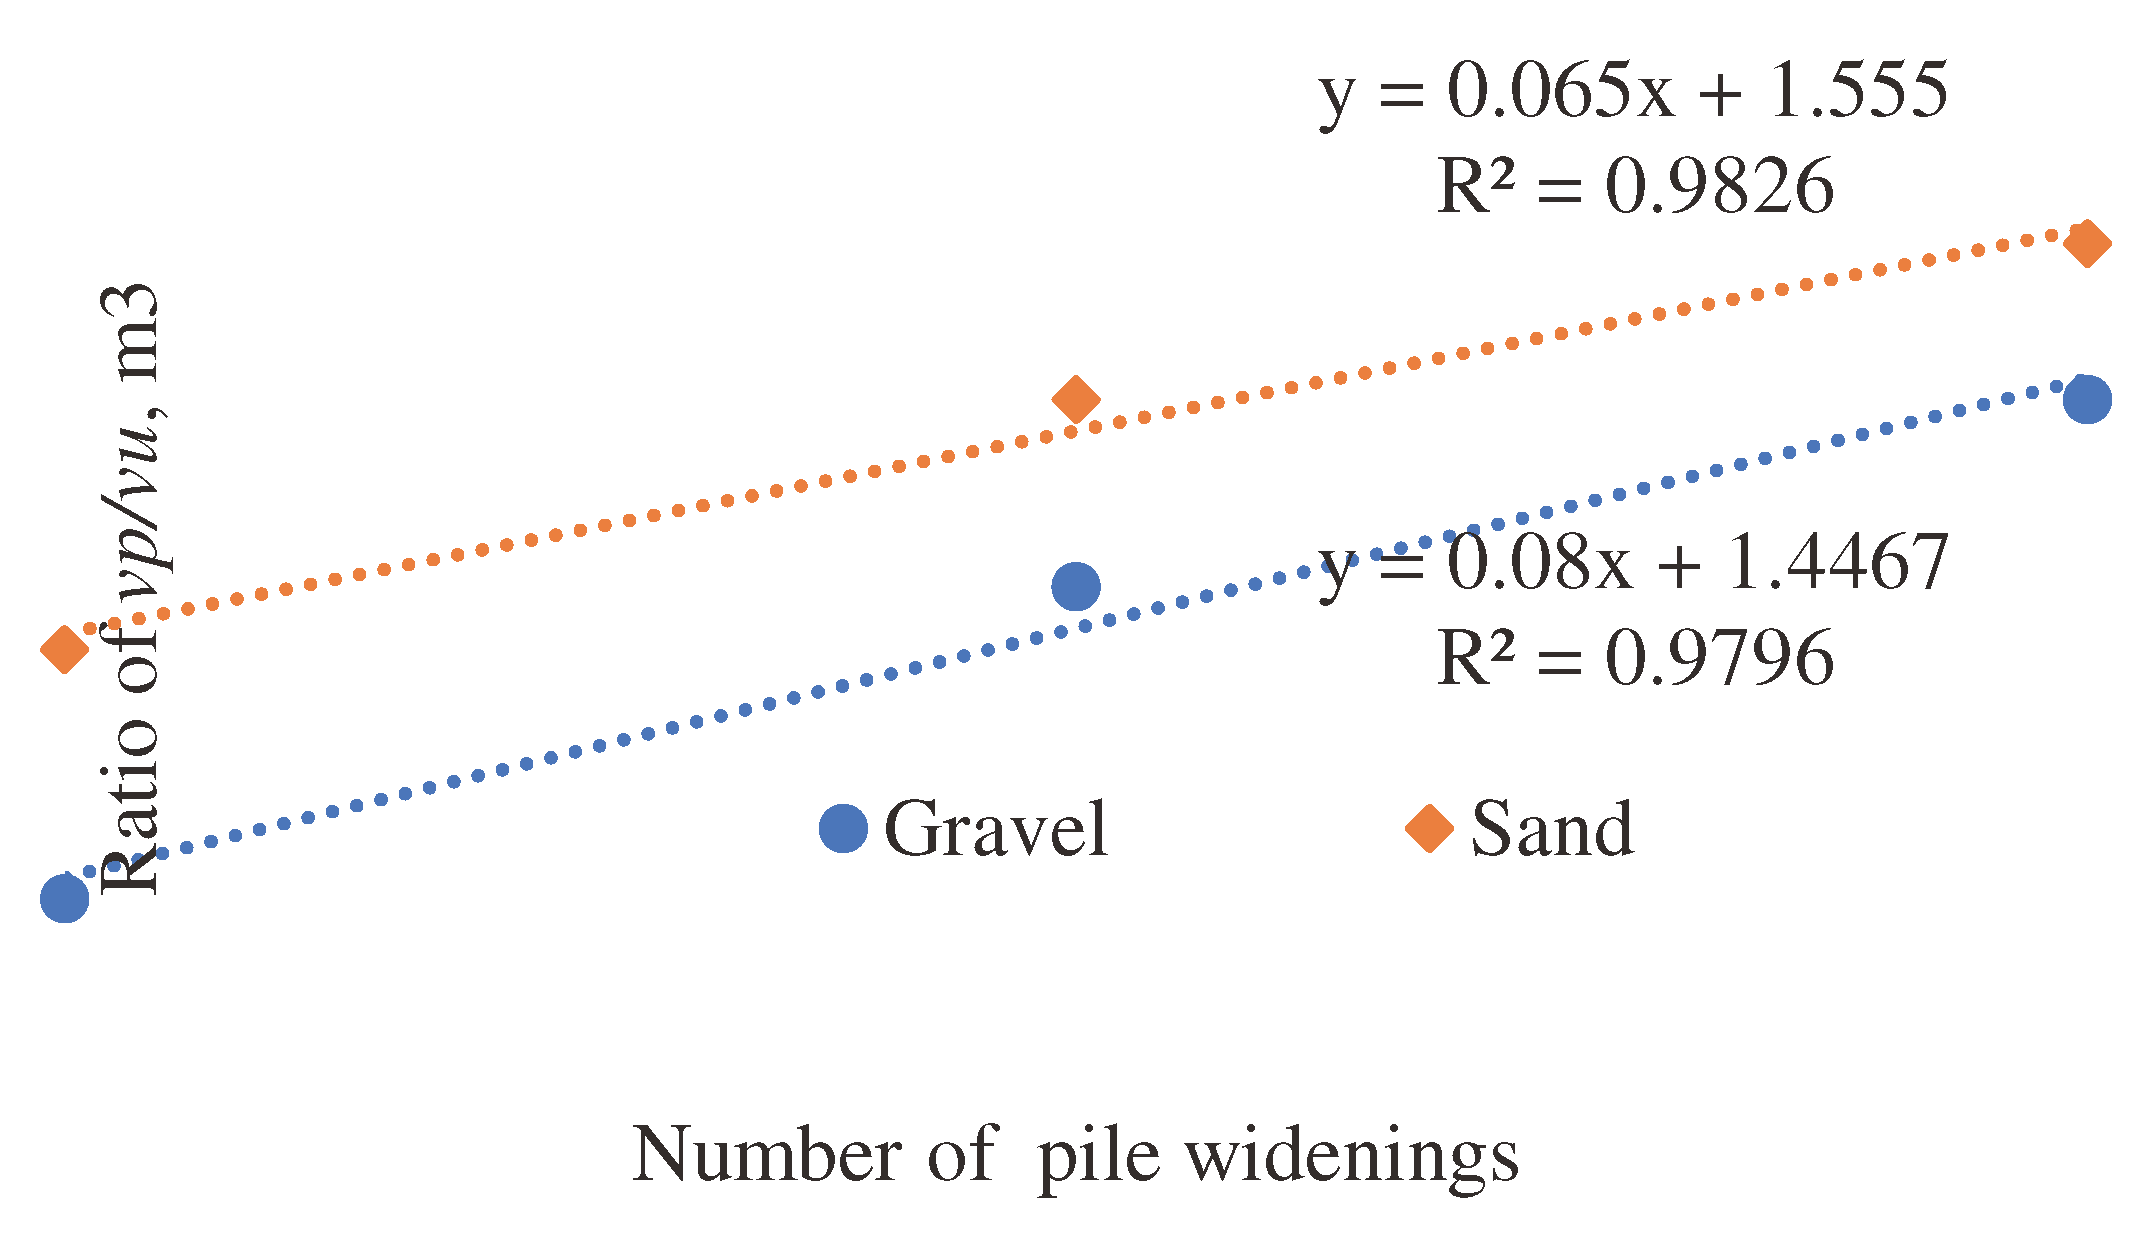
A comparison of the test results of driving pile models with 2-4 widening, buried with sand and gravel, shows the influence between the number of widening in pile models and the amount of backfilling material. An increase in the number of widening leads to an increase in the bulk material entrained by their widening into the soil (
Table 9).
According to
Table 9, correlation dependencies
are established (where:
- volume of widening of the pile model (backfilled volume), m
3;
- number of widening in the pile model), which are described by a linear function (3), (
Figure 12).
where:
t, w—coefficients accepted according to
Table 10;
n—number of widening in the pile model.
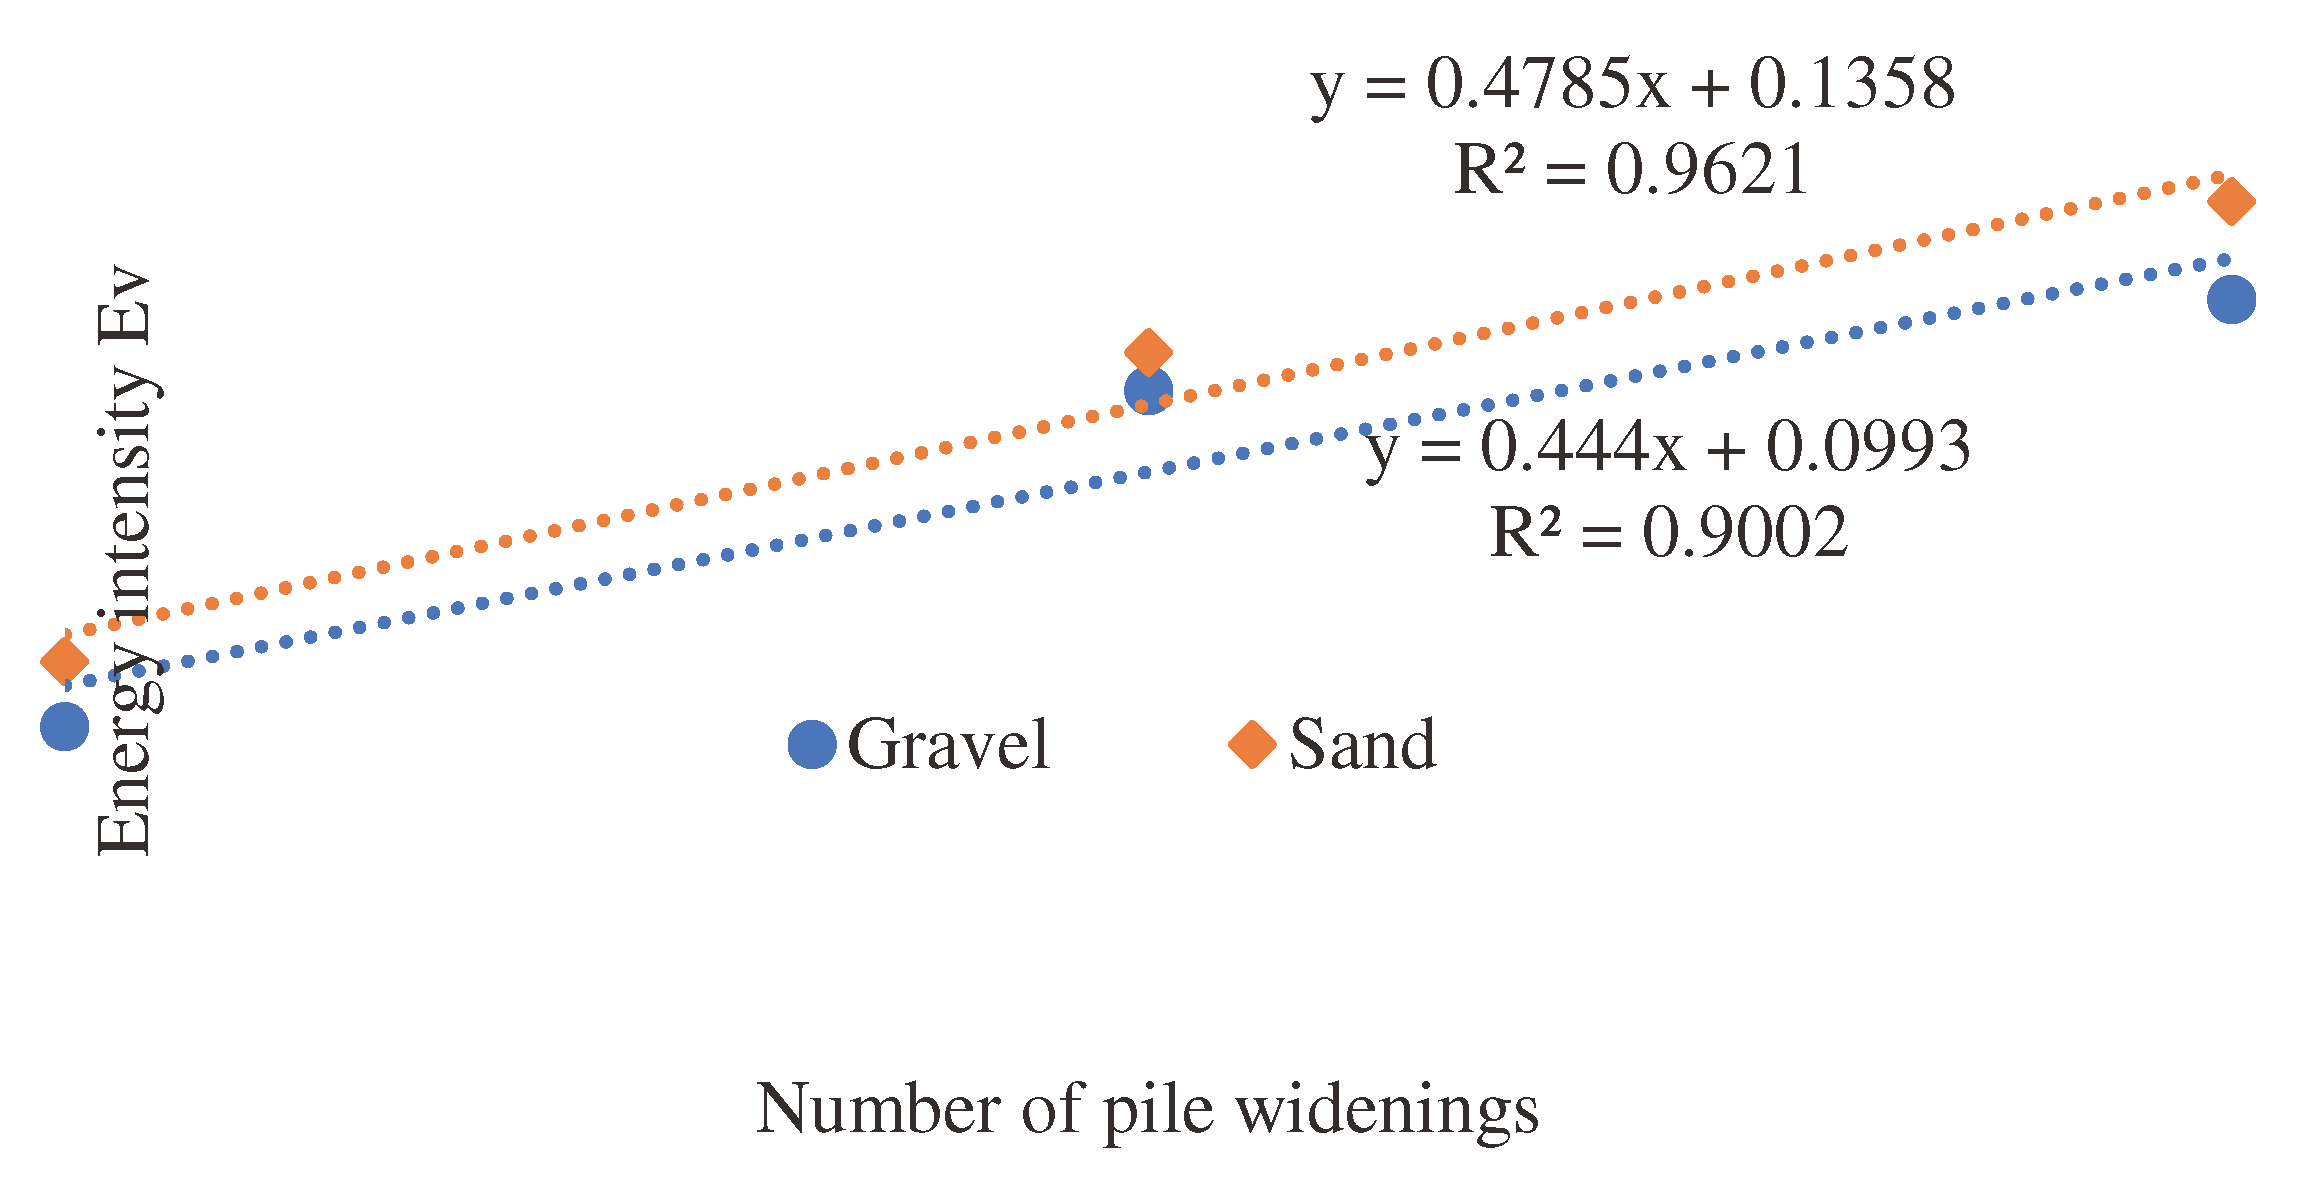
Increasing the widening numbers in pile models causes an increase in the energy intensity of their driving
(
Table 11,
Figure 13). This regularity is described by dependency given in equation (4).
where:
p, s—coefficients accepted according to
Table 12;
n—number of widening in the pile model.
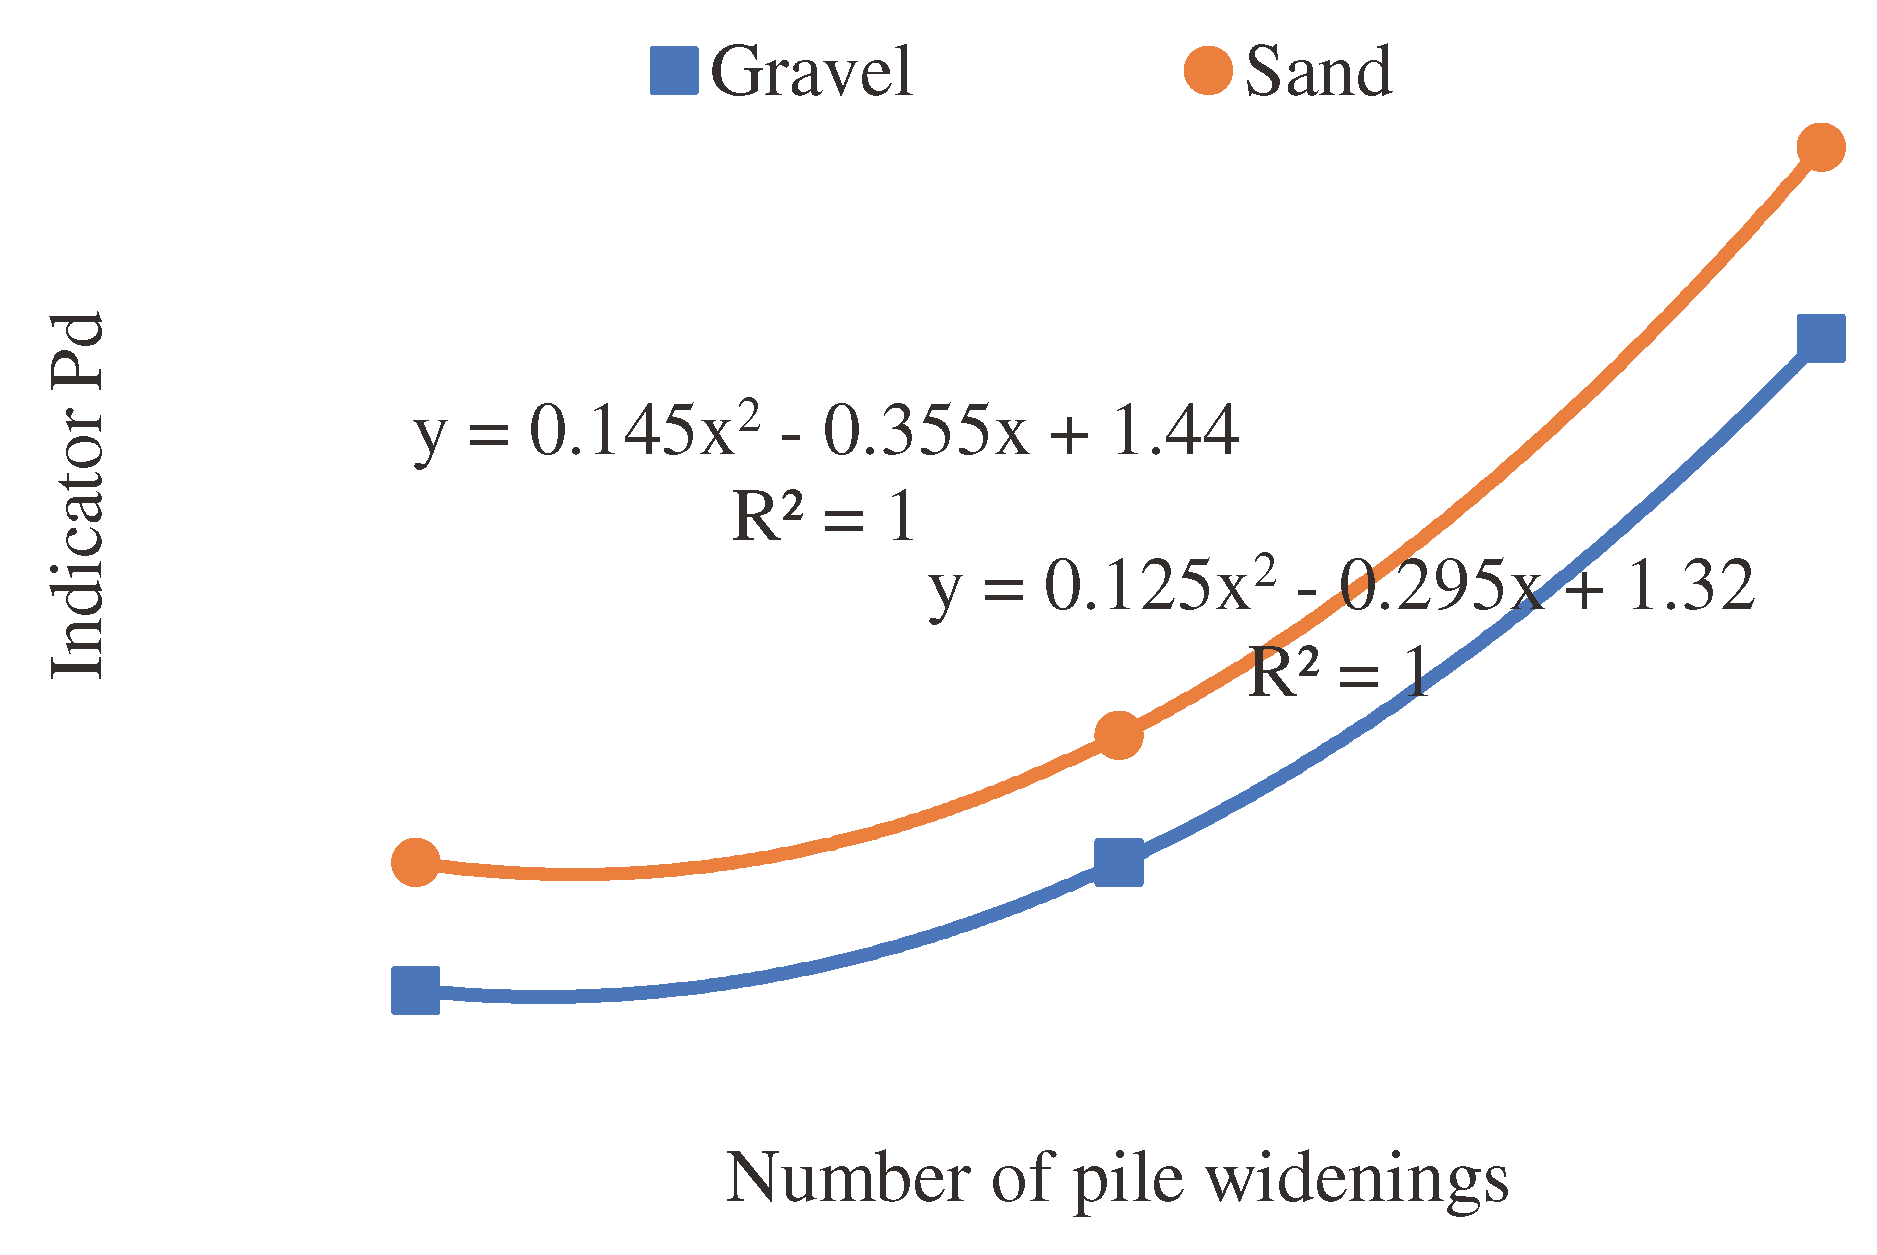
The load-bearing capacity of pile models increases with the number of widening in them (
Table 13). This regularity is well described by a polynomial function of the second degree (5), (
Figure 14).
where:
q, d, m—coefficients accepted according to
Table 14;
n—number of widening in the pile model.
3.5. Interrelation of the present test results with the experiments of the first stage of research
Comparative analysis of the energy intensity of driving pile models at the first stage of research [
8] and similar parameters presented in this paper allows us to make the following dependence
where:
– energy intensity for driving a pile model with widening and a backfilling of bulk material (gravel or sand);
– an indicator of the comparative energy intensity of a pile model with widening, buried without backfilling bulk material [
8];
– energy intensity for driving a pile model without shaft widening (prismatic or pyramidal pile models);
– coefficient that takes into account the number of widening in the pile model and the type of backfill of bulk material used in driving (
Table 15).
Equation (6) allows for a comparative assessment of the energy intensity of driving piles with shaft widening relative to piles without widening (prismatic and pyramidal piles).
Table 15 shows that the energy intensity for driving piles with widening and a backfilling of bulk material can be 1.4-5.1 times higher than the energy intensity for driving traditional piles without adding any bulk materials.
The formula (7) obtained similar to equation (6), allows for a comparative assessment of the load-bearing capacity of piles with shaft widening relative to piles without widening (prismatic and pyramidal piles).
where:
– load-bearing capacity of a pile model with widening and a backfilling of bulk material (gravel or sand);
– an indicator of the comparative load-bearing capacity of a pile with widening, buried without adding any bulk material [
8];
– load-bearing capacity of a pile model without shaft widening (prismatic or pyramidal pile models);
– coefficient that takes into account the number of widening in the pile model and the type of backfilling of bulk material used in driving (
Table 16).
As can be seen from
Table 16 the bearing capacity of piles with widening, driven with the addition of bulk material, can be 1.5-4.6 times higher than the bearing capacity of traditional piles driven without adding any bulk materials.
4. Conclusions
The results of experimental investigations detailed in this lead to the following main conclusions:
(1) Piles with widening in driving them with the addition of soil and rigid materials differ from higher (1.14-1.66 times) energy intensity than their driving without the mentioned addition. The energy intensity of pile driving is notably influenced by the choice of backfill material, with the lowest energy intensity observed when driving piles with loam backfill and the highest energy intensity evident when sand and crushed stone are used as backfill materials. Furthermore, the energy intensity of pile driving increases with the number of widening in the pile, as the inclusion of a greater quantity of backfill material into the soil during the driving process is necessitated.
(2) The bearing capacity of piles with widening, driven by the addition of soil and rigid materials, is higher (1.15-1.68 times) than the bearing capacity of piles driven without the use of filling material. This effect is more pronounced with an increasing number of widening in the piles, as a larger volume of backfill material becomes integrated into the soil during the driving process.
(3) The type of backfill material affects the resistance of piles to axial static loads. The greatest resistance is typical for piles driven with added sand, and the lowest—with added crushed stone. Specifically, the load-bearing capacity of piles filled with sand surpasses that of piles filled with crushed stone and loam by factors of 1.23 and 1.18, respectively. Similarly, the bearing capacity of piles filled with gravel is 1.15 and 1.10 times higher, respectively. Based on the load-bearing capacity of piles, it is preferable to use sand and gravel as backfill material.
(4) The energy intensity for driving piles with widening and adding bulk materials is greater (1.4-5.1 times) than the energy intensity for driving traditional piles (prismatic and pyramidal piles) without adding bulk materials. In addition, the load-bearing capacity of piles featuring widening and driven with the inclusion of bulk materials surpasses that of traditional piles (lacking shaft widening) driven without any bulk material, exhibiting an increase ranging from 1.5 to 4.6 times.
(5) The correlation dependencies established from the results of this research exhibit sufficient reliability and can be utilized for relatively approximate predictions of the energy and strength parameters of piles featuring shaft widening, buried in soil with gravel and sand backfill.
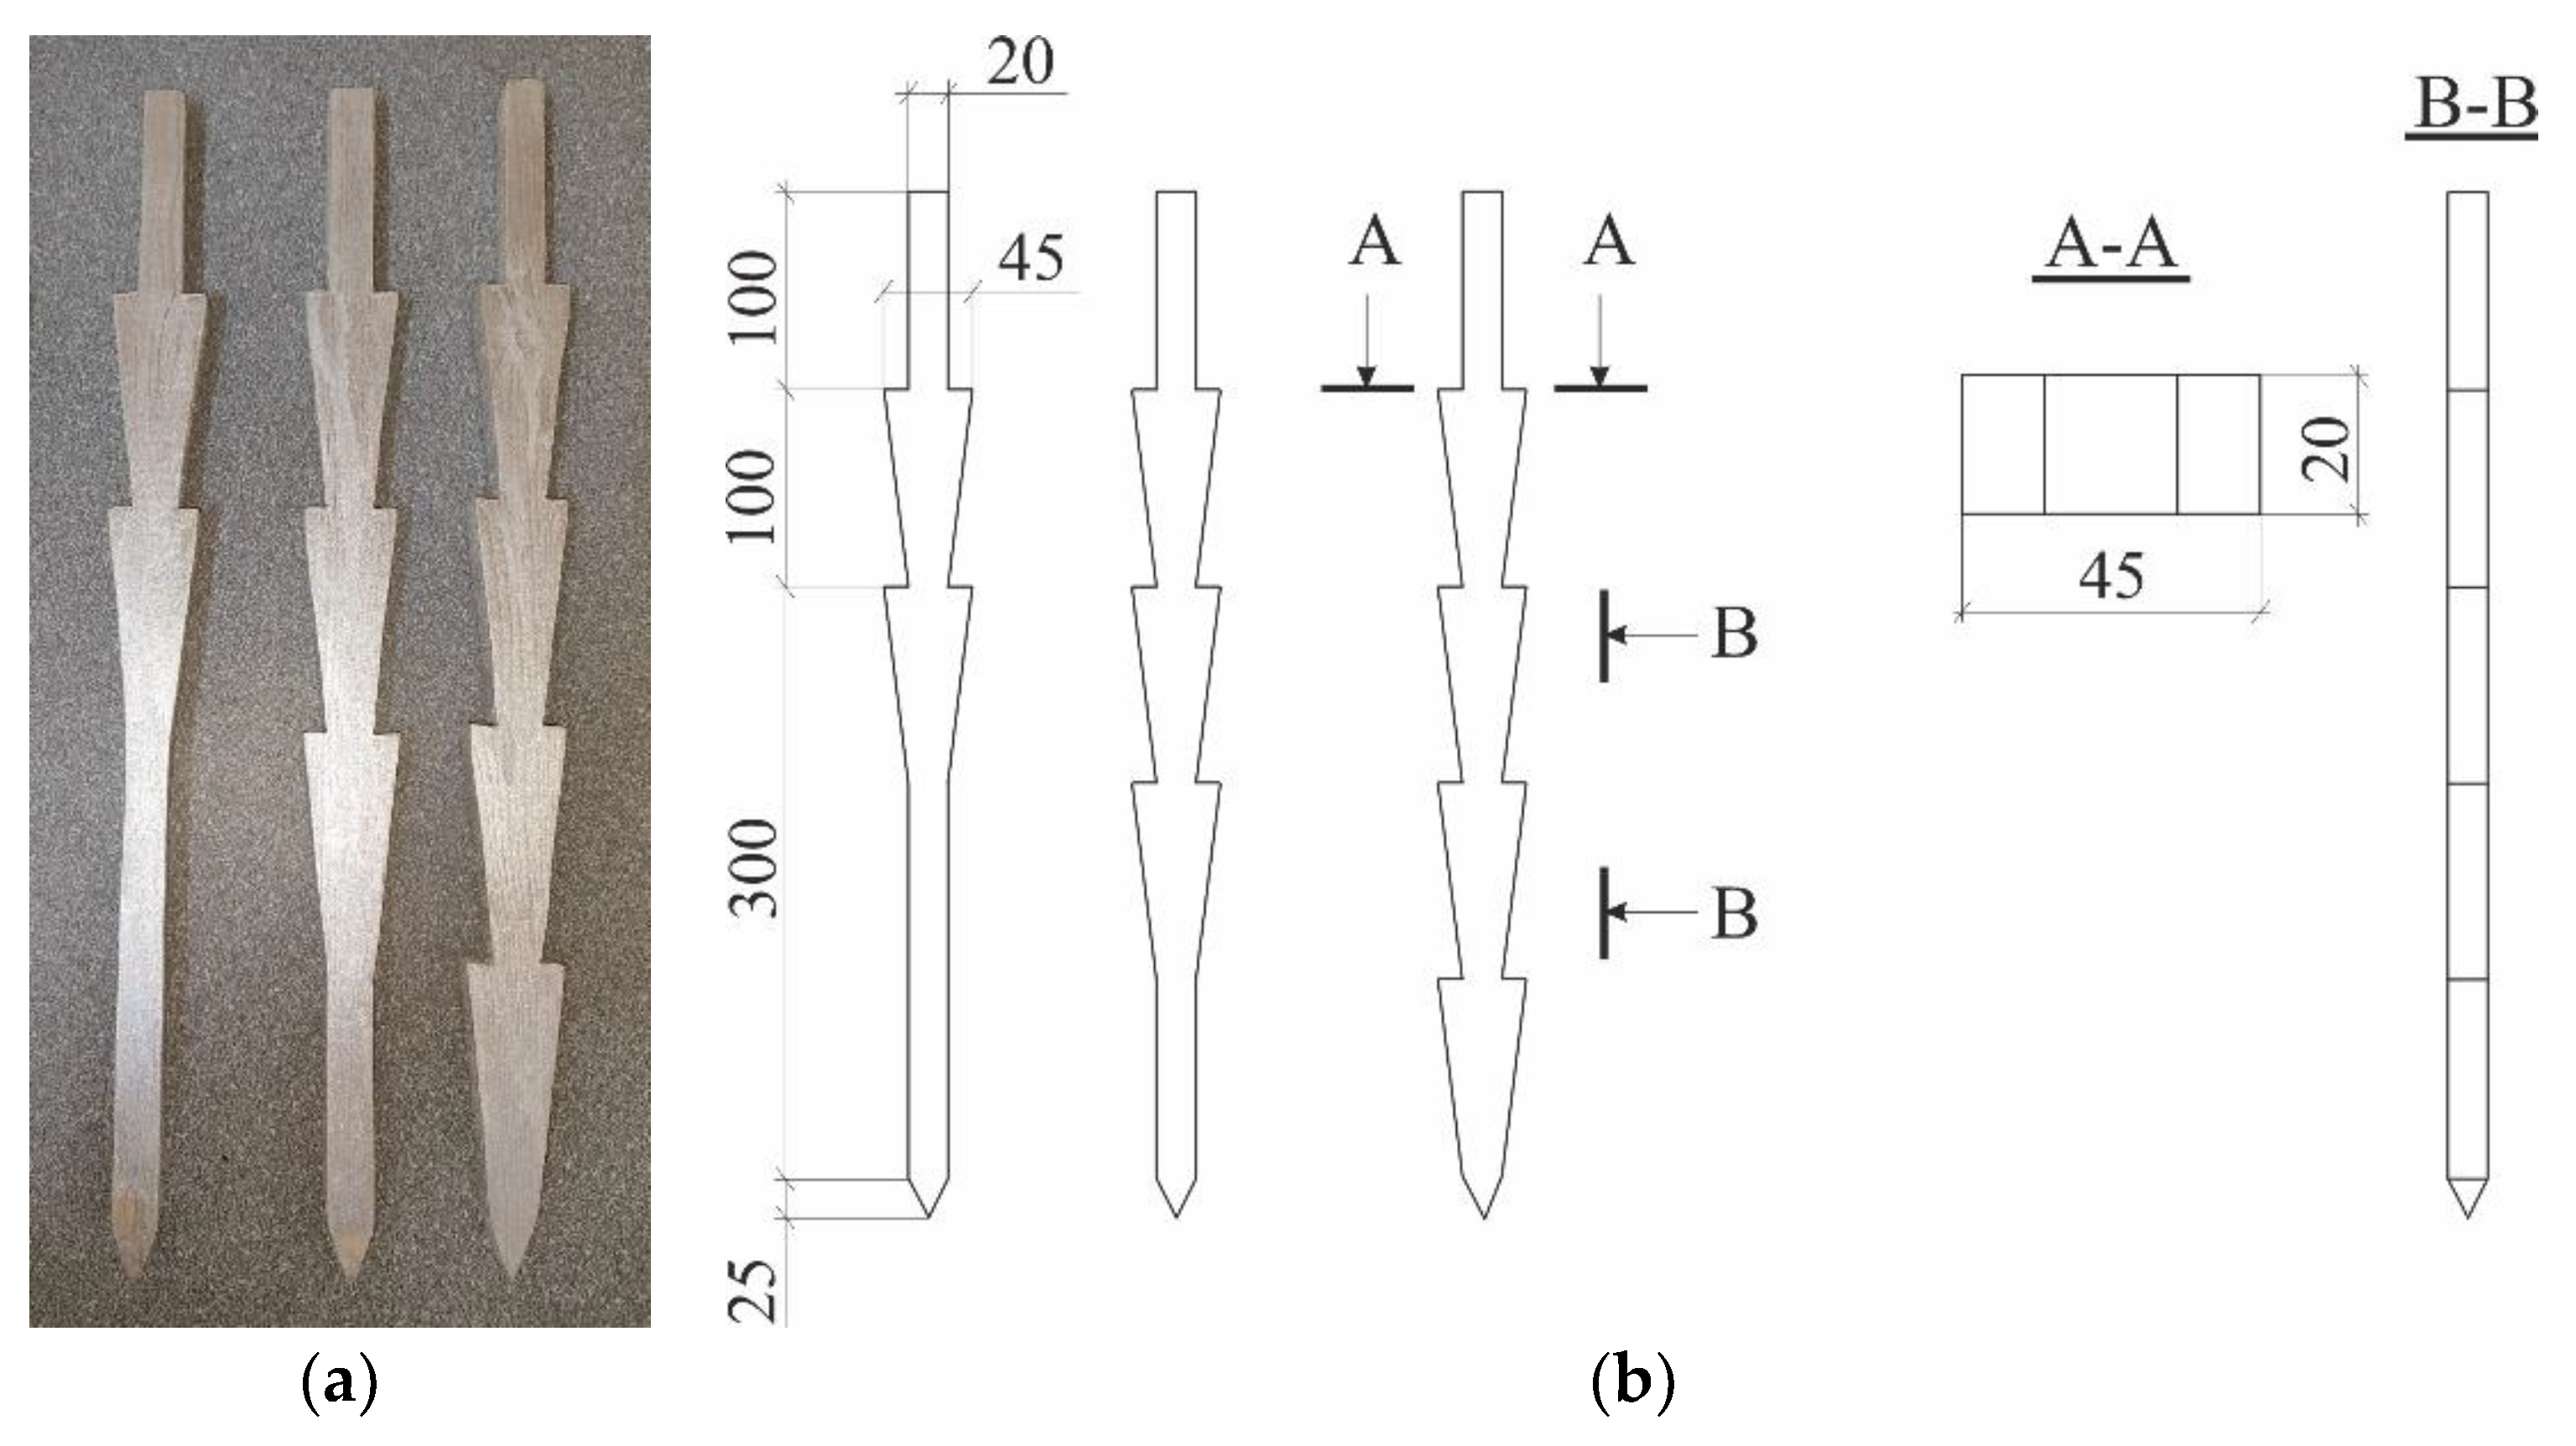
Figure 1.
General view (a) and scheme (b) of models of piles with widening.
Figure 1.
General view (a) and scheme (b) of models of piles with widening.
Figure 2.
Types of soil and rigid materials used as backfill material. 1—light sandy loam; 2—medium-sized sand; 3—gravel; 4—crushed stone.
Figure 2.
Types of soil and rigid materials used as backfill material. 1—light sandy loam; 2—medium-sized sand; 3—gravel; 4—crushed stone.
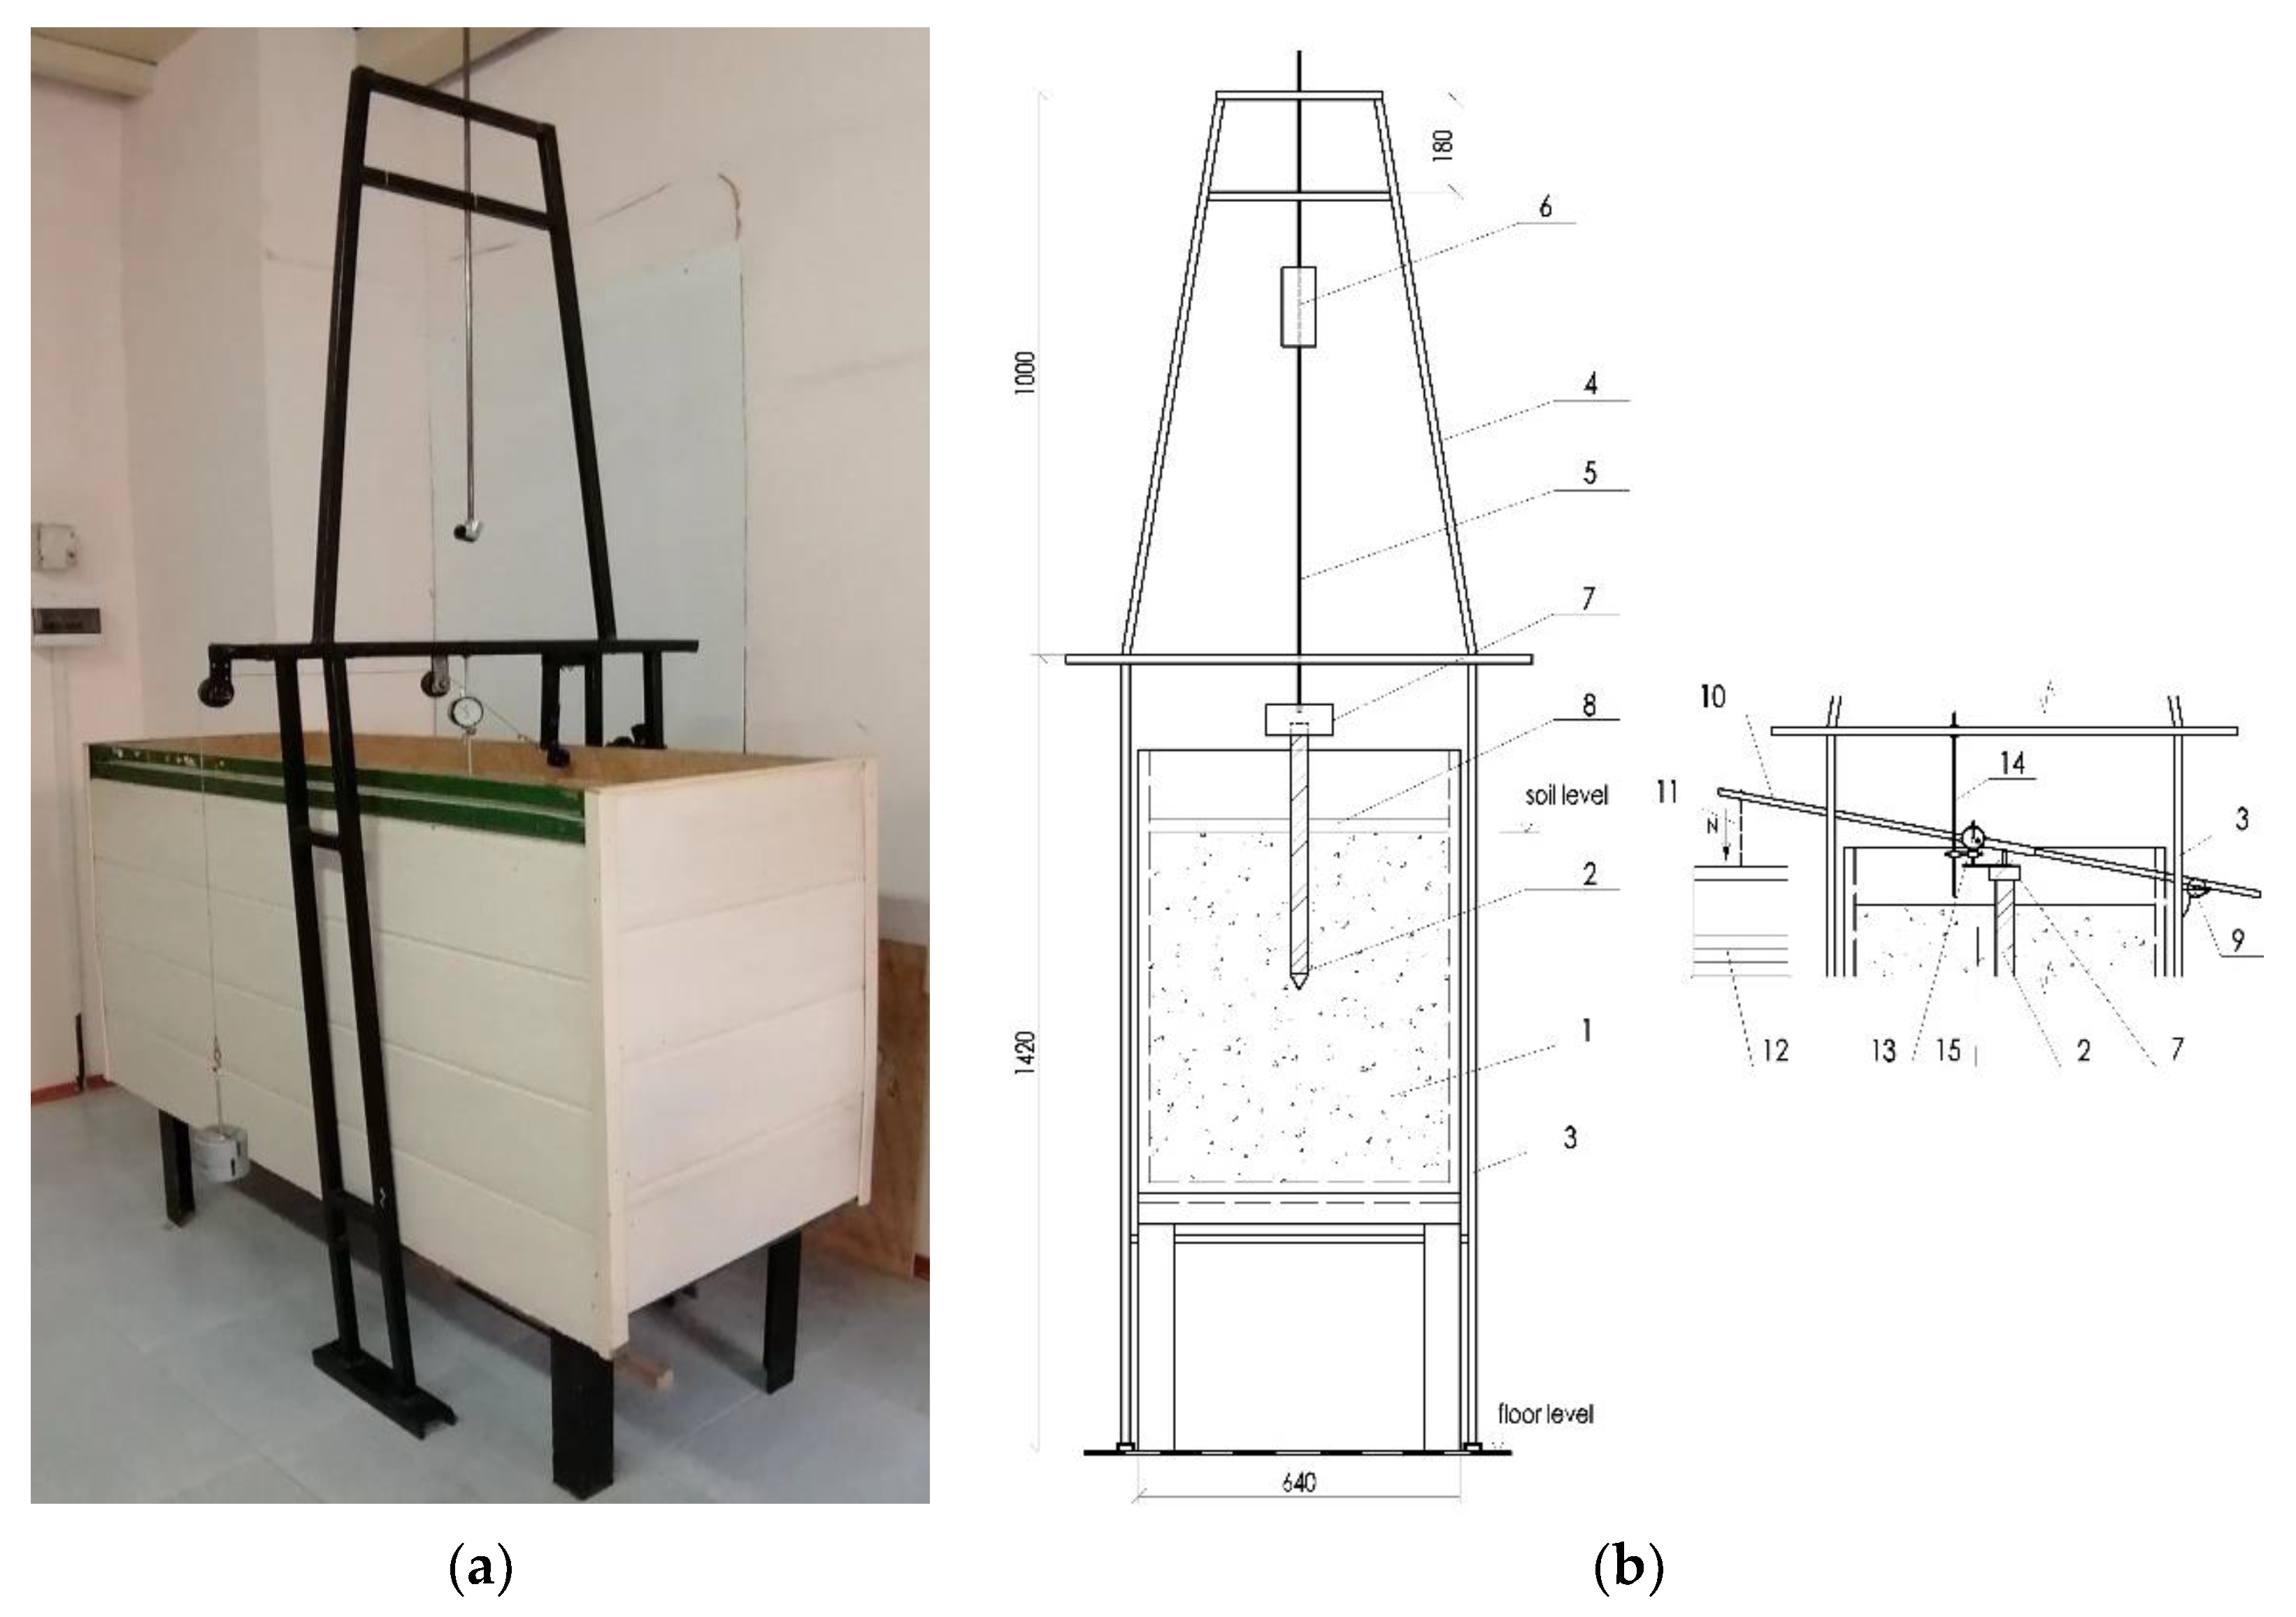
Figure 3.
General view (a) and scheme (b) of the soil tray and attachments for driving and testing pile models. 1—soil tray; 2—pile model; 3—inverted U-shaped lower frame; 4—upper frame with inclined racks; 5—guide rod; 6—hammer; 7—headrest; 8—removable guide beam; 9—hinged part of the lever system; 10—beam-lever; 11—cable; 12—container for cargo; 13—indicator; 14—rod for attaching the indicator; 15—cantilever plate.
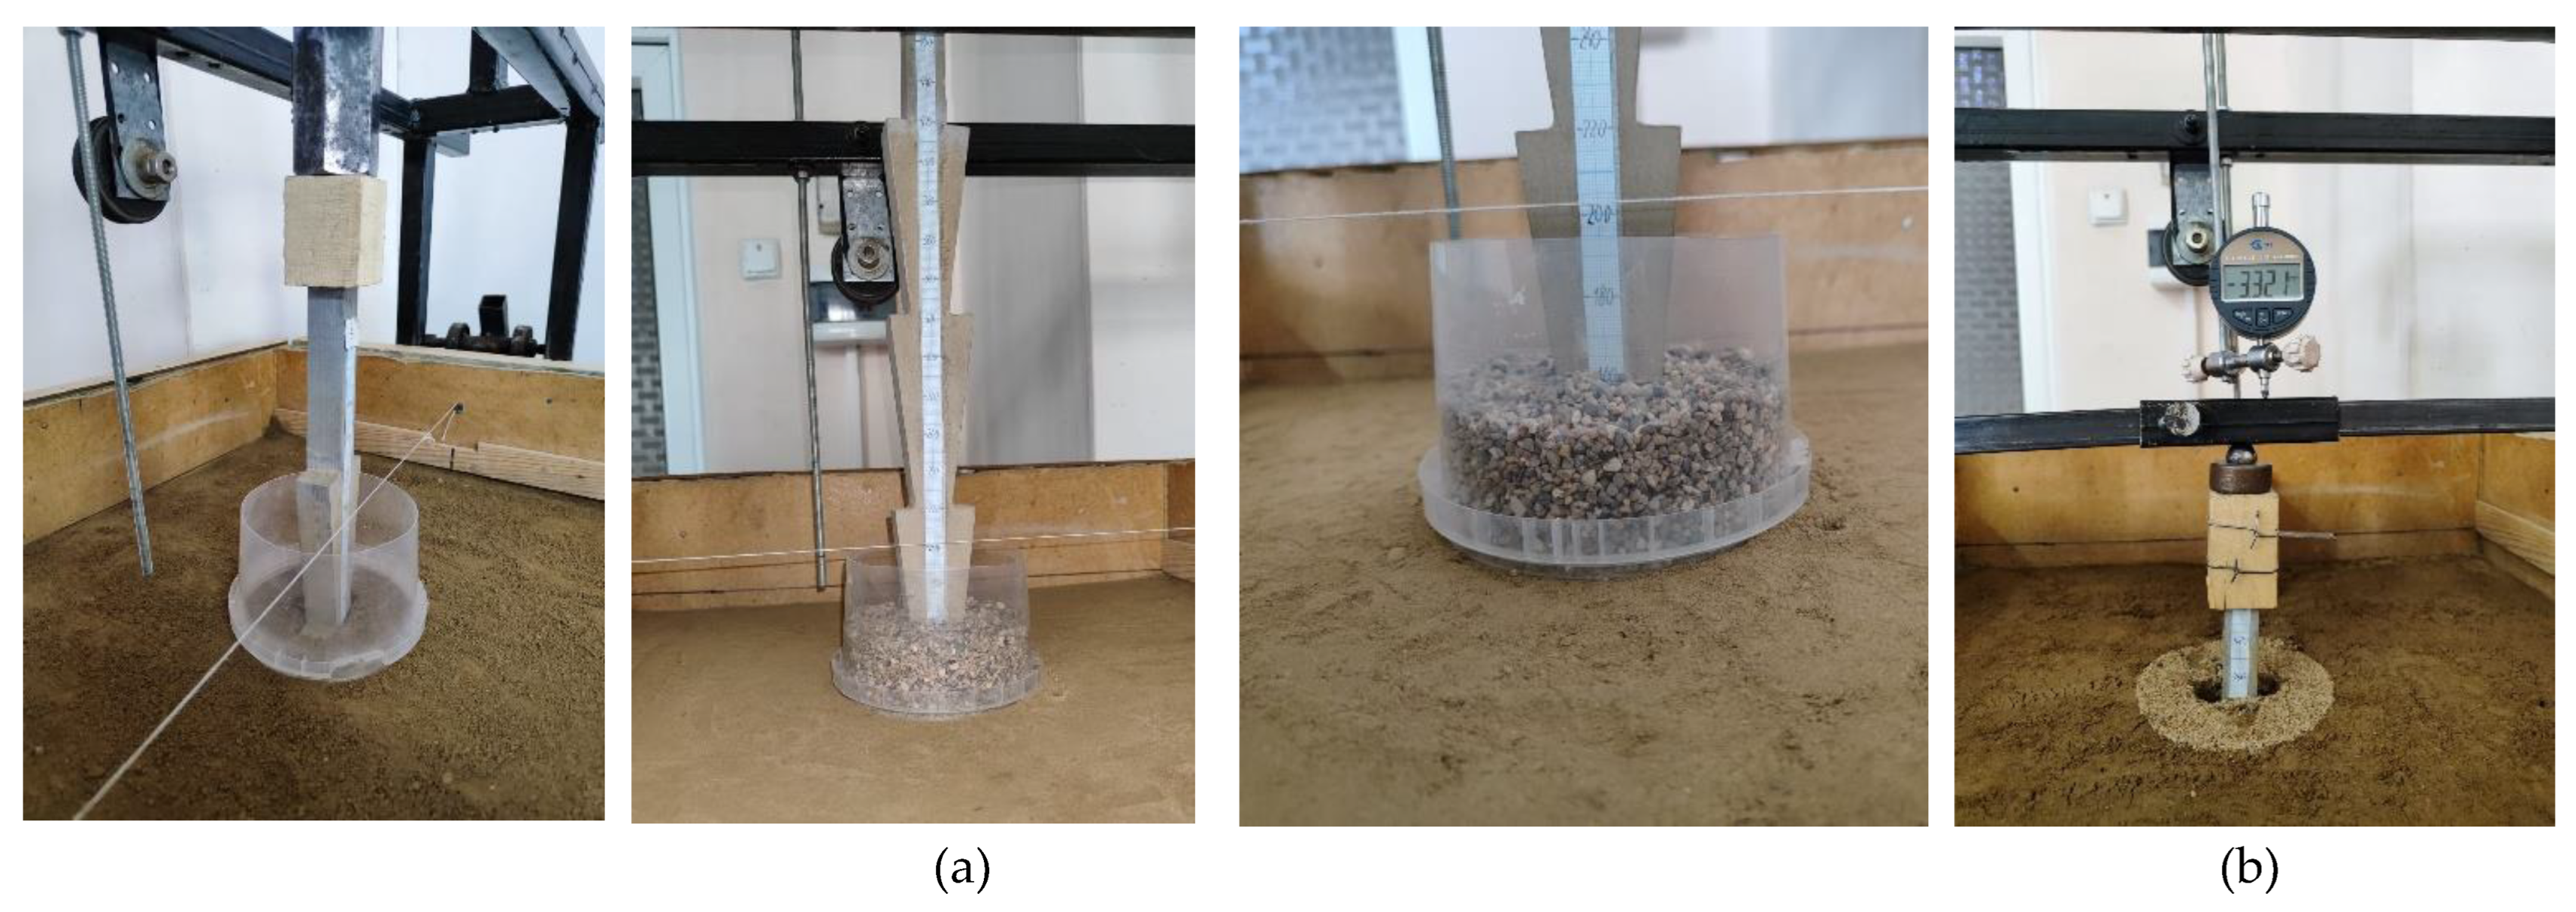
Figure 4.
Fragments of driving (a) and static tests (b) of piles models with widening, backfilling with rigid material.
Figure 4.
Fragments of driving (a) and static tests (b) of piles models with widening, backfilling with rigid material.
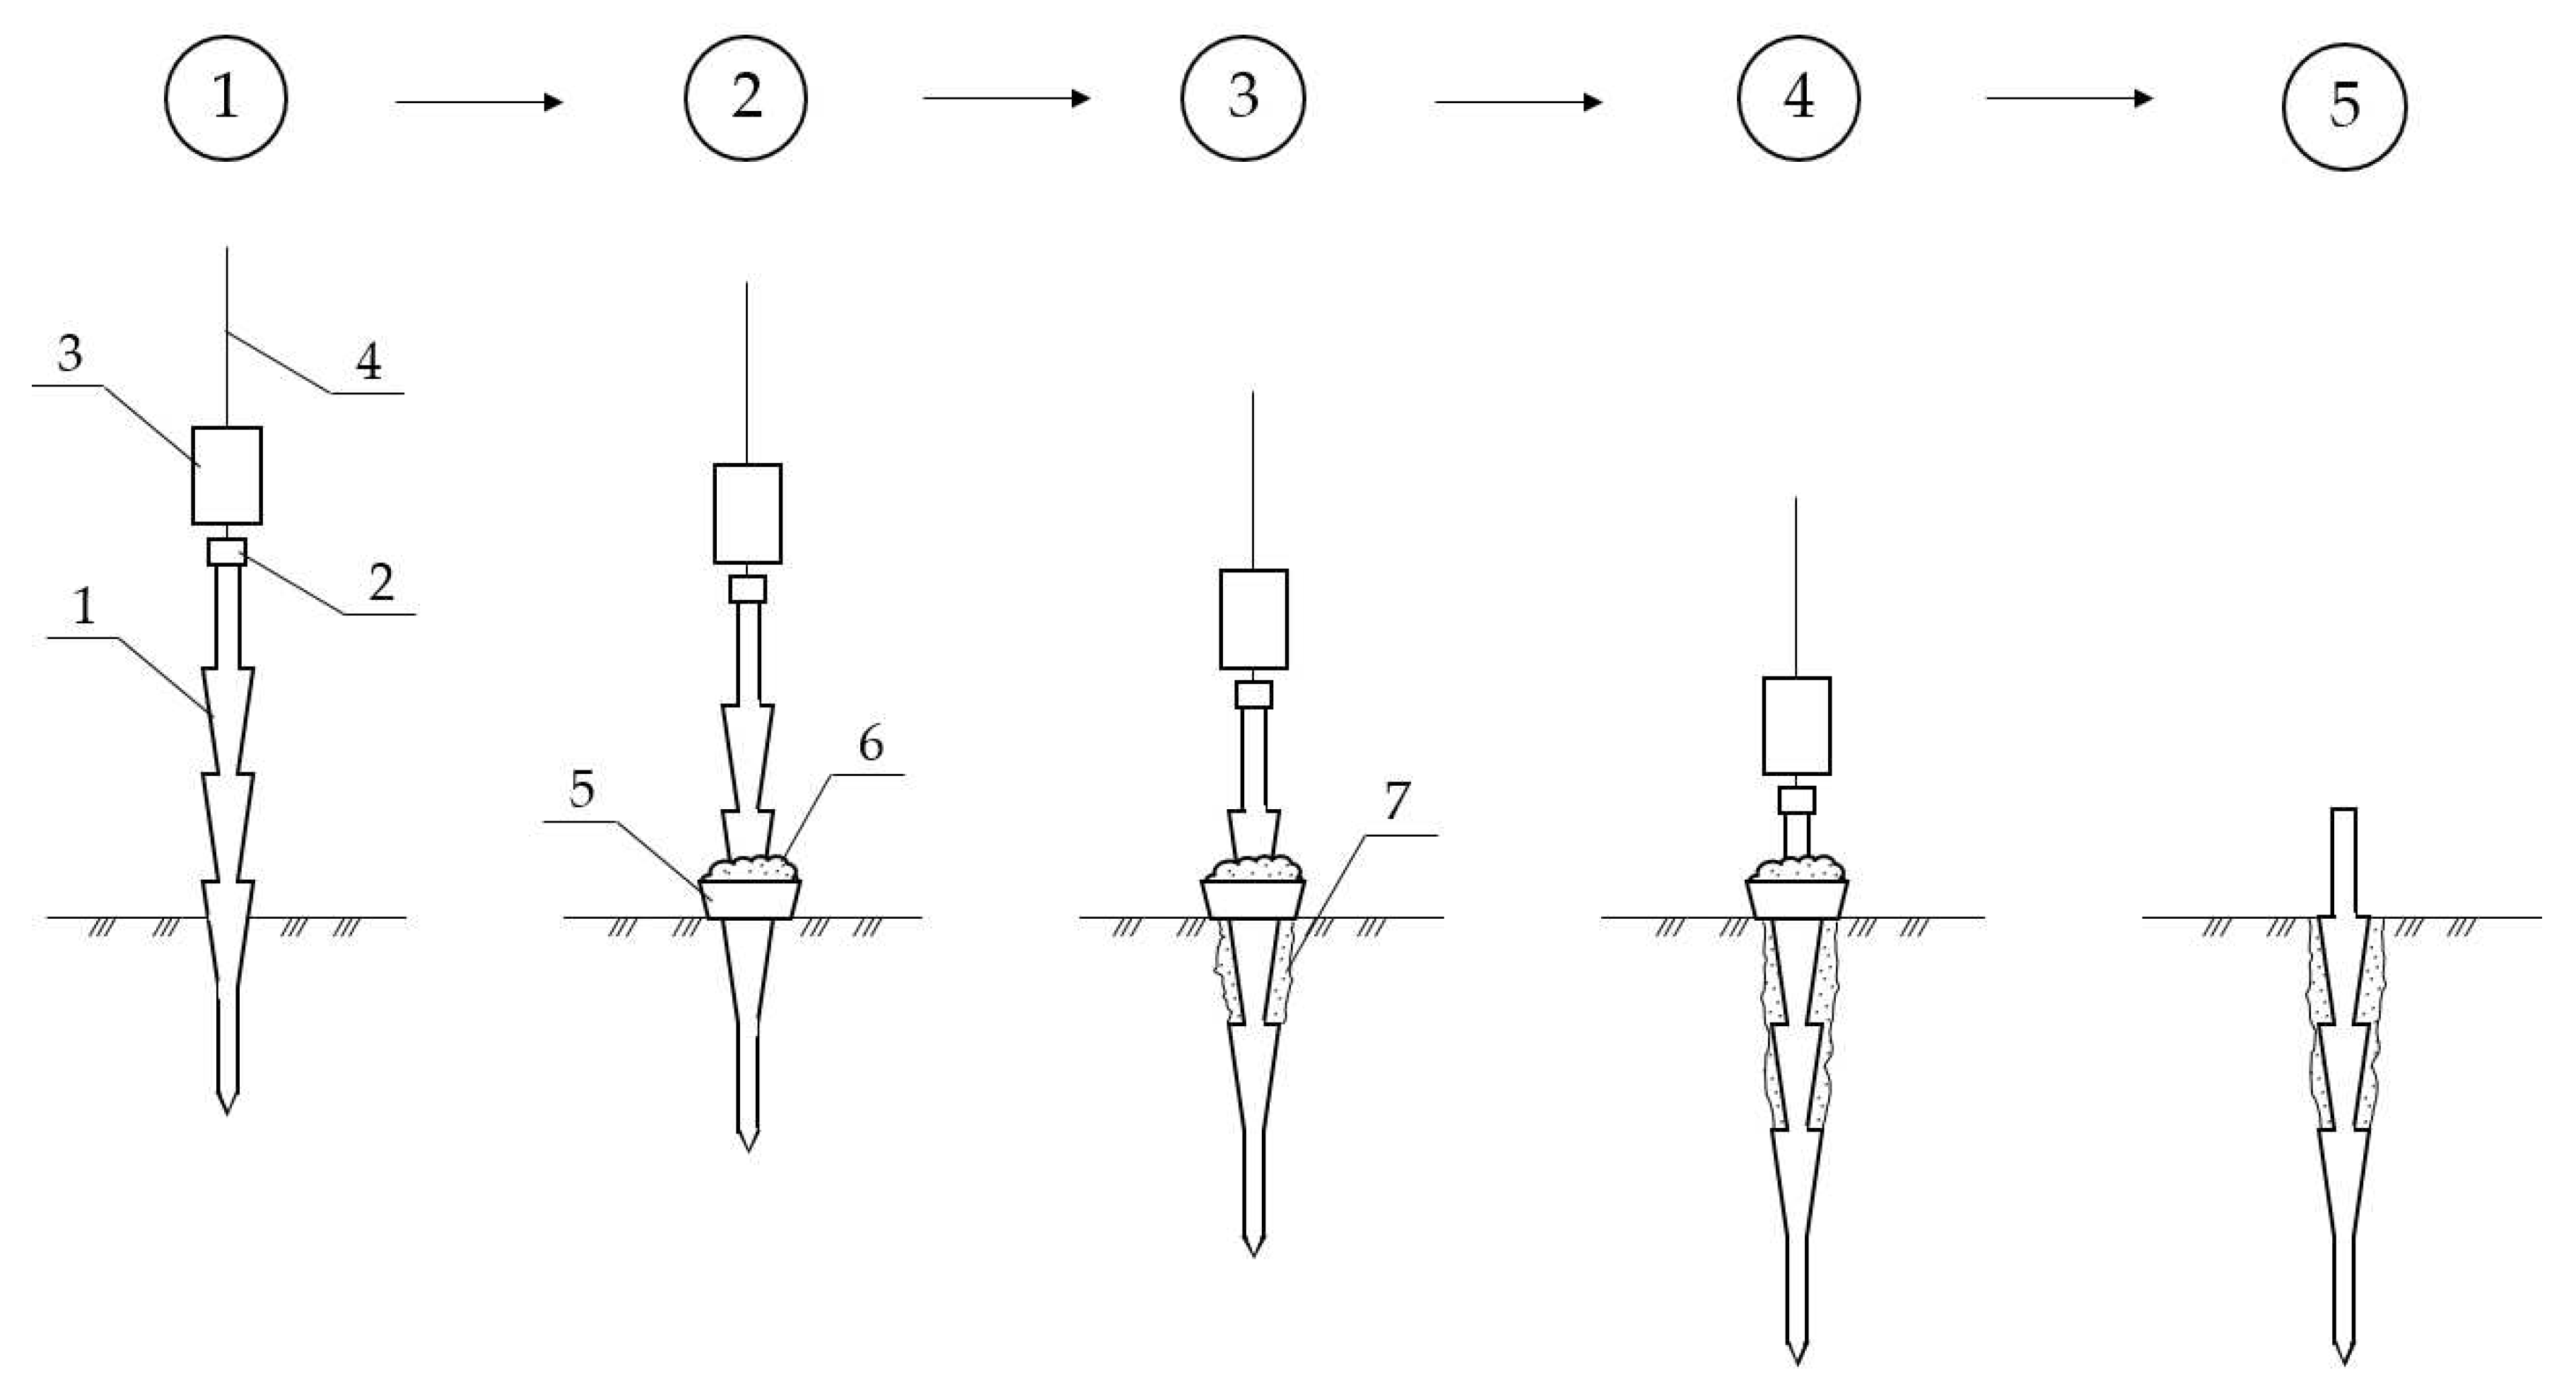
Figure 5.
Schematic view of driving piles with shaft widening with a backfill of soil or rigid material. 1—pile with widening; 2—headrest; 3—hammer; 4—guide rod; 5—funnel; 6—backfilling made of soil or rigid material; 7—compacted rigid material.
Figure 5.
Schematic view of driving piles with shaft widening with a backfill of soil or rigid material. 1—pile with widening; 2—headrest; 3—hammer; 4—guide rod; 5—funnel; 6—backfilling made of soil or rigid material; 7—compacted rigid material.
Figure 6.
Pile models driving with 4 widening.
Figure 6.
Pile models driving with 4 widening.
Figure 7.
4 widening pile models settlement versus static load.
Figure 7.
4 widening pile models settlement versus static load.
Figure 8.
Pile models driving with 3 widening.
Figure 8.
Pile models driving with 3 widening.
Figure 9.
Static test results for pile models with 3 widening.
Figure 9.
Static test results for pile models with 3 widening.
Figure 10.
Pile models driving with 2 widening.
Figure 10.
Pile models driving with 2 widening.
Figure 11.
Static test results for pile models with 2 widening.
Figure 11.
Static test results for pile models with 2 widening.
Figure 12.
Dependence of the ratio on the number of widening in the pile model.
Figure 12.
Dependence of the ratio on the number of widening in the pile model.
Figure 13.
Energy intensity of pile driving versus the number of widening in the pile model.
Figure 13.
Energy intensity of pile driving versus the number of widening in the pile model.
Figure 14.
Resistance-increasing index versus pile models on the number of widening.
Figure 14.
Resistance-increasing index versus pile models on the number of widening.
Table 1.
Geometric parameters of pile models and their weight.
Table 1.
Geometric parameters of pile models and their weight.
| Pile model view |
Geometric parameters, mm |
Weight, g |
| Shaft length |
Tip length |
Shaft cross-section dimensions |
Widening width |
Widening height |
Pile with 2 widening
Pile with 3 widening
Pile with 4 widening |
500 |
15 |
20×20 |
45 |
100 |
135
147
158 |
Table 2.
Physical and mechanical characteristics of soil base.
Table 2.
Physical and mechanical characteristics of soil base.
| Description |
Value |
| Water content, , % |
9.94-11.86 |
| Soil density, , g/cm3 |
1.29-1.47 |
| Liquid limit, , % |
25.05-25.17 |
| Plastic limit, , % |
13.23-15.03 |
| Plasticity index, |
9.93-11.96 |
| Maximum penetration resistance, , MPa |
0.268-0.275 |
| Compaction ratio, |
0.81-0.84 |
| Wetness index, (degree) |
1.73-1.98 |
| Strain modulus, , MPa |
15.2-16.0 |
| Angle of internal friction, , grade |
13.1-13.2 |
| Intercept cohesion, , MPa |
0.0302-0.0310 |
Table 3.
Driving test results of pile models with 4 widening.
Table 3.
Driving test results of pile models with 4 widening.
| Pile model |
, cm3
|
The total energy of pile driving, E, J (number of blows) |
Immersion depth of pile, L, mm |
Piles immersed part volume, V, cm3
|
Energy intensity of pile driving per unit volume, Ev, J/cm3
|
|
| Pile model with 4 widening (without backfill) |
- |
279.59 (95) |
425 |
215.0 |
1.300 |
- |
| Pile model with loam backfill |
62 |
379.65 (129) |
426 |
215.4 |
1.763 |
1.36 |
| Pile model with crushed stone backfill |
96 |
429.68 (146) |
426 |
215.4 |
1.995 |
1.54 |
| Pile model with gravel backfill |
132 |
385.53 (131) |
426 |
215.4 |
1.790 |
1.38 |
| Pile model with sand backfill |
136 |
429.68 (146) |
426 |
215.4 |
1.995 |
1.54 |
Table 4.
Values of , , and indicators of pile models with 4 widening.
Table 4.
Values of , , and indicators of pile models with 4 widening.
| Pile model |
, N |
, N |
, V/cm3
|
|
| Pile model with 4 widening (without backfill) |
272.8 |
259.81 |
1.269 |
- |
| Pile model with loam backfill |
388.0 |
369.52 |
1.801 |
1.42 |
| Pile model with crushed stone backfill |
371.9 |
354.19 |
1.727 |
1.36 |
| Pile model with gravel backfill |
425.8 |
405.52 |
1.977 |
1.56 |
| Pile model with sand backfill |
457.6 |
435.81 |
2.124 |
1.68 |
Table 5.
Driving test results of pile models with 3 widening.
Table 5.
Driving test results of pile models with 3 widening.
| Pile model |
, cm3
|
The total energy of pile driving, E, J (number of blows) |
Immersion depth of pile, L, mm |
Piles immersed part volume, V, cm3
|
Energy intensity of pile driving per unit volume, Ev, J/cm3
|
|
| Pile model with 3 widening (without backfill) |
- |
217.78 (74) |
426 |
215.4 |
1.011 |
- |
| Pile model with gravel backfill |
85 |
344.33 (117) |
425 |
215.0 |
1.602 |
1.58 |
| Pile model with sand backfill |
88 |
361.99 (123) |
426 |
215.4 |
1.681 |
1.66 |
Table 6.
Values of , , and indicators of pile models with 3 widening.
Table 6.
Values of , , and indicators of pile models with 3 widening.
| Pile model |
, N |
, N |
, V/cm3
|
|
| Pile model with 3 widening (without backfill) |
255.06 |
242.91 |
1.184 |
- |
| Pile model with gravel backfill |
313.92 |
298.97 |
1.460 |
1.23 |
| Pile model with sand backfill |
333.54 |
317.66 |
1.548 |
1.31 |
Table 7.
Driving test results of pile models with 2 widening.
Table 7.
Driving test results of pile models with 2 widening.
| Pile model |
, cm3
|
The total energy of pile driving, E, J
(number of blows) |
Immersion depth of pile, , mm |
Piles immersed part volume, , cm3
|
, J/cm3
|
|
| Pile model with 2 widening (without backfill) |
- |
170.69 (58) |
425 |
215.0 |
0.794 |
- |
| Pile model with gravel backfill |
40 |
194.24 (66) |
426 |
215.4 |
0.902 |
1.14 |
| Pile model with sand backfill |
42 |
223.67 (76) |
426 |
215.4 |
1.038 |
1.31 |
Table 8.
Values of , , and indicators of pile models with 2 widening.
Table 8.
Values of , , and indicators of pile models with 2 widening.
| Pile model |
, N |
, N |
, V/cm3
|
|
| Pile model with 2 widening (without backfill) |
244.4 |
232.76 |
1.137 |
- |
| Pile model with gravel backfill |
281.8 |
268.38 |
1.308 |
1.15 |
| Pile model with sand backfill |
301.7 |
287.33 |
1.401 |
1.23 |
Table 9.
The spending of backfilling during driving pile models with 2-4 widening.
Table 9.
The spending of backfilling during driving pile models with 2-4 widening.
| Backfilling type |
, cm3, during driving pile models with the number of widening |
| 2 |
3 |
4 |
| Gravel |
40 |
85 |
132 |
| Sand |
42 |
88 |
136 |
Table 10.
Coefficients t, w in equation (3).
Table 10.
Coefficients t, w in equation (3).
| Backfilling type |
Coefficient values |
Approximation index R2
|
| t |
w |
| Gravel |
0.08 |
1.4467 |
0.979 |
| Sand |
0.065 |
1.555 |
0.982 |
Table 11.
Energy intensity of pile driving per unit volume of pile models with 2-4 widening.
Table 11.
Energy intensity of pile driving per unit volume of pile models with 2-4 widening.
| Backfilling type |
related to pile models with the number of widening |
| 2 |
3 |
4 |
| Gravel |
0.902 |
1.602 |
1.790 |
| Sand |
1.038 |
1.681 |
1.995 |
Table 12.
Coefficients p, s in equation (4).
Table 12.
Coefficients p, s in equation (4).
| Backfilling type |
Coefficient values |
Approximation index R2
|
| p |
s |
| Gravel |
0.444 |
0.099 |
0.900 |
| Sand |
0.478 |
0.135 |
0.962 |
Table 13.
Values of the resistance-increasing index for pile models with 2-4 widening.
Table 13.
Values of the resistance-increasing index for pile models with 2-4 widening.
| Backfilling type |
index values related to pile models with the number of widening |
| 2 |
3 |
4 |
| Gravel |
1.15 |
1.23 |
1.56 |
| Sand |
1.23 |
1.31 |
1.68 |
Table 14.
Coefficients q, d, m in equation (5).
Table 14.
Coefficients q, d, m in equation (5).
| Backfilling type |
Coefficient values |
Approximation index R2
|
| q |
d |
m |
| Gravel |
0.125 |
0.295 |
1.32 |
1.0 |
| Sand |
0.145 |
0.355 |
1.44 |
1.0 |
Table 15.
coefficient values.
Table 15.
coefficient values.
| Traditional pile type |
coefficient values depending on the backfilling type and the number of widening in the pile |
| backfilling type |
number of widening |
| 2 |
3 |
4 |
| Prismatic pile with section dimensions of 20×20 cm |
gravel |
2.440 |
4.361 |
4.595 |
| sand |
2.803 |
4.582 |
5.128 |
| Prismatic pile with section dimensions of 30×30 cm |
gravel |
0.855 |
1.533 |
1.615 |
| sand |
0.983 |
1.610 |
1.802 |
| Pyramidal with cross-sectional dimensions of 30×30 cm at the top, 20×20 cm at the bottom |
gravel |
1.391 |
2.481 |
2.608 |
| sand |
1.598 |
2.606 |
2.911 |
Table 16.
coefficient values.
Table 16.
coefficient values.
| Traditional pile type |
coefficient values depending on the backfilling type and the number of widening in the pile
|
| backfilling type |
number of widening |
| 2 |
3 |
4 |
| Prismatic pile with section dimensions of 20×20 cm |
gravel |
2.312 |
2.792 |
4.259 |
| sand |
2.472 |
2.974 |
4.586 |
| Prismatic pile with section dimensions of 30×30 cm |
gravel |
1.599 |
1.931 |
2.933 |
| sand |
1.710 |
2.057 |
3.158 |
| Pyramidal with cross-sectional dimensions of 30×30 cm at the top, 20×20 cm at the bottom |
gravel |
1.507 |
1.820 |
2.777 |
| sand |
1.611 |
1.939 |
2.990 |
