1. Introduction
Despite significant technological progress, the aviation industry carbon footprint keeps growing due to the current air traffic growth [
1]. Meanwhile, the Air Transport Action Group forecast for 2050 conclude that the flight demand could grow by an average of 3.1% per year and that the CO
2 emissions could consequently grow to 2 Gt [
2] if no specific measures are put in place.
As for the entire air transportation, the Vertical and Take Off aircrafts, which are currently accounting for 1% of the total jet fuel consumption and CO
2 emissions [
3], will rely on Sustainable Aviation Fuels (SAF) to lower their carbon footprint [
2].
Air mobility is recognized as a “hard to abate” sector, and several technologies are considered to lower its CO
2 emissions: electrification with batteries (BE), electrification with Fuel Cell fed with H
2 (FCH
2), Gas Turbines burning H
2 (GTH
2) or sustainable aviation fuels (SAF) which can be issued from the biomass: biofuels or using electricity through the Fischer-Tropsch pathway with the conversion of H
2 + CO
2 + H
2O: efuels. Other pathways such as LNG, NH
3 and CH
4 are also sometimes cited [
4] but are not considered in this study.
Vertical Take Off and Landing (VTOL) and short-range aircrafts are often considered when studying the opportunity to switch from fossil jet fuel to a more disruptive energy vectors such as battery and / or H
2 fuel cell [
4,
5].
Since the path to low carbon energy for air mobility induces low yield energy vectors and that limited resources already reveals some tensions on biomass supplies for biofuels [
6,
7], this study reviews the combination of the most cited energy vectors based on electricity combined with the most studied propulsive energy concept for VTOL. While it could later be extended to fixed wing aircrafts, the study focuses on the VTOL aircraft as vertical take-off and hovering are the most demanding operations regarding energy requirements, thus magnifying the need of energy efficiency.
2. Materials and Methods
2.1. Previous Work
A significant number of articles cover alternative aviation fuels and propulsion systems. Grahn et al in 2022 reviewed the electrofuels cost and their environmental impact [
8] with no clear conclusions regarding the CO
2 impact. The Académie des Technologies report on the role SAF for air transport [
9] highlighted the needs and limits to the deployment of low carbon electricity to reach a viable production volume of efuel. In Europe, the ReFuel EU regulation will impose 70% of sustainable aviation fuel by 2050, of which half should be efuel [
10]. Rojas-Michaga et al [
11] reviewed the SAF production through power to liquid (efuel) and concluded that the dominant factor for the efuel CO
2 emissions is the electricity.
Dahal et al [
4] established a techno-economic review of alternative fuels and propulsion systems for the aviation sector. Using the available literature, the model is based on aircraft top level requirements applied to Airbus A321 and A350 models using the Pacelab APD design tool. The conclusions are expressed in US cent per passenger kilometers to allow a fair comparison between the different fuels evaluated and the biofuel appears to be the most competitive while H
2 and efuel are in the same ballpark. Compared to fossil jet fuel, the cost range is 15 to 500% higher. However, the specific characteristics of the VTOL which require significant thrust to provide the lift during the entire mission are not captured.
2.2. Methodology
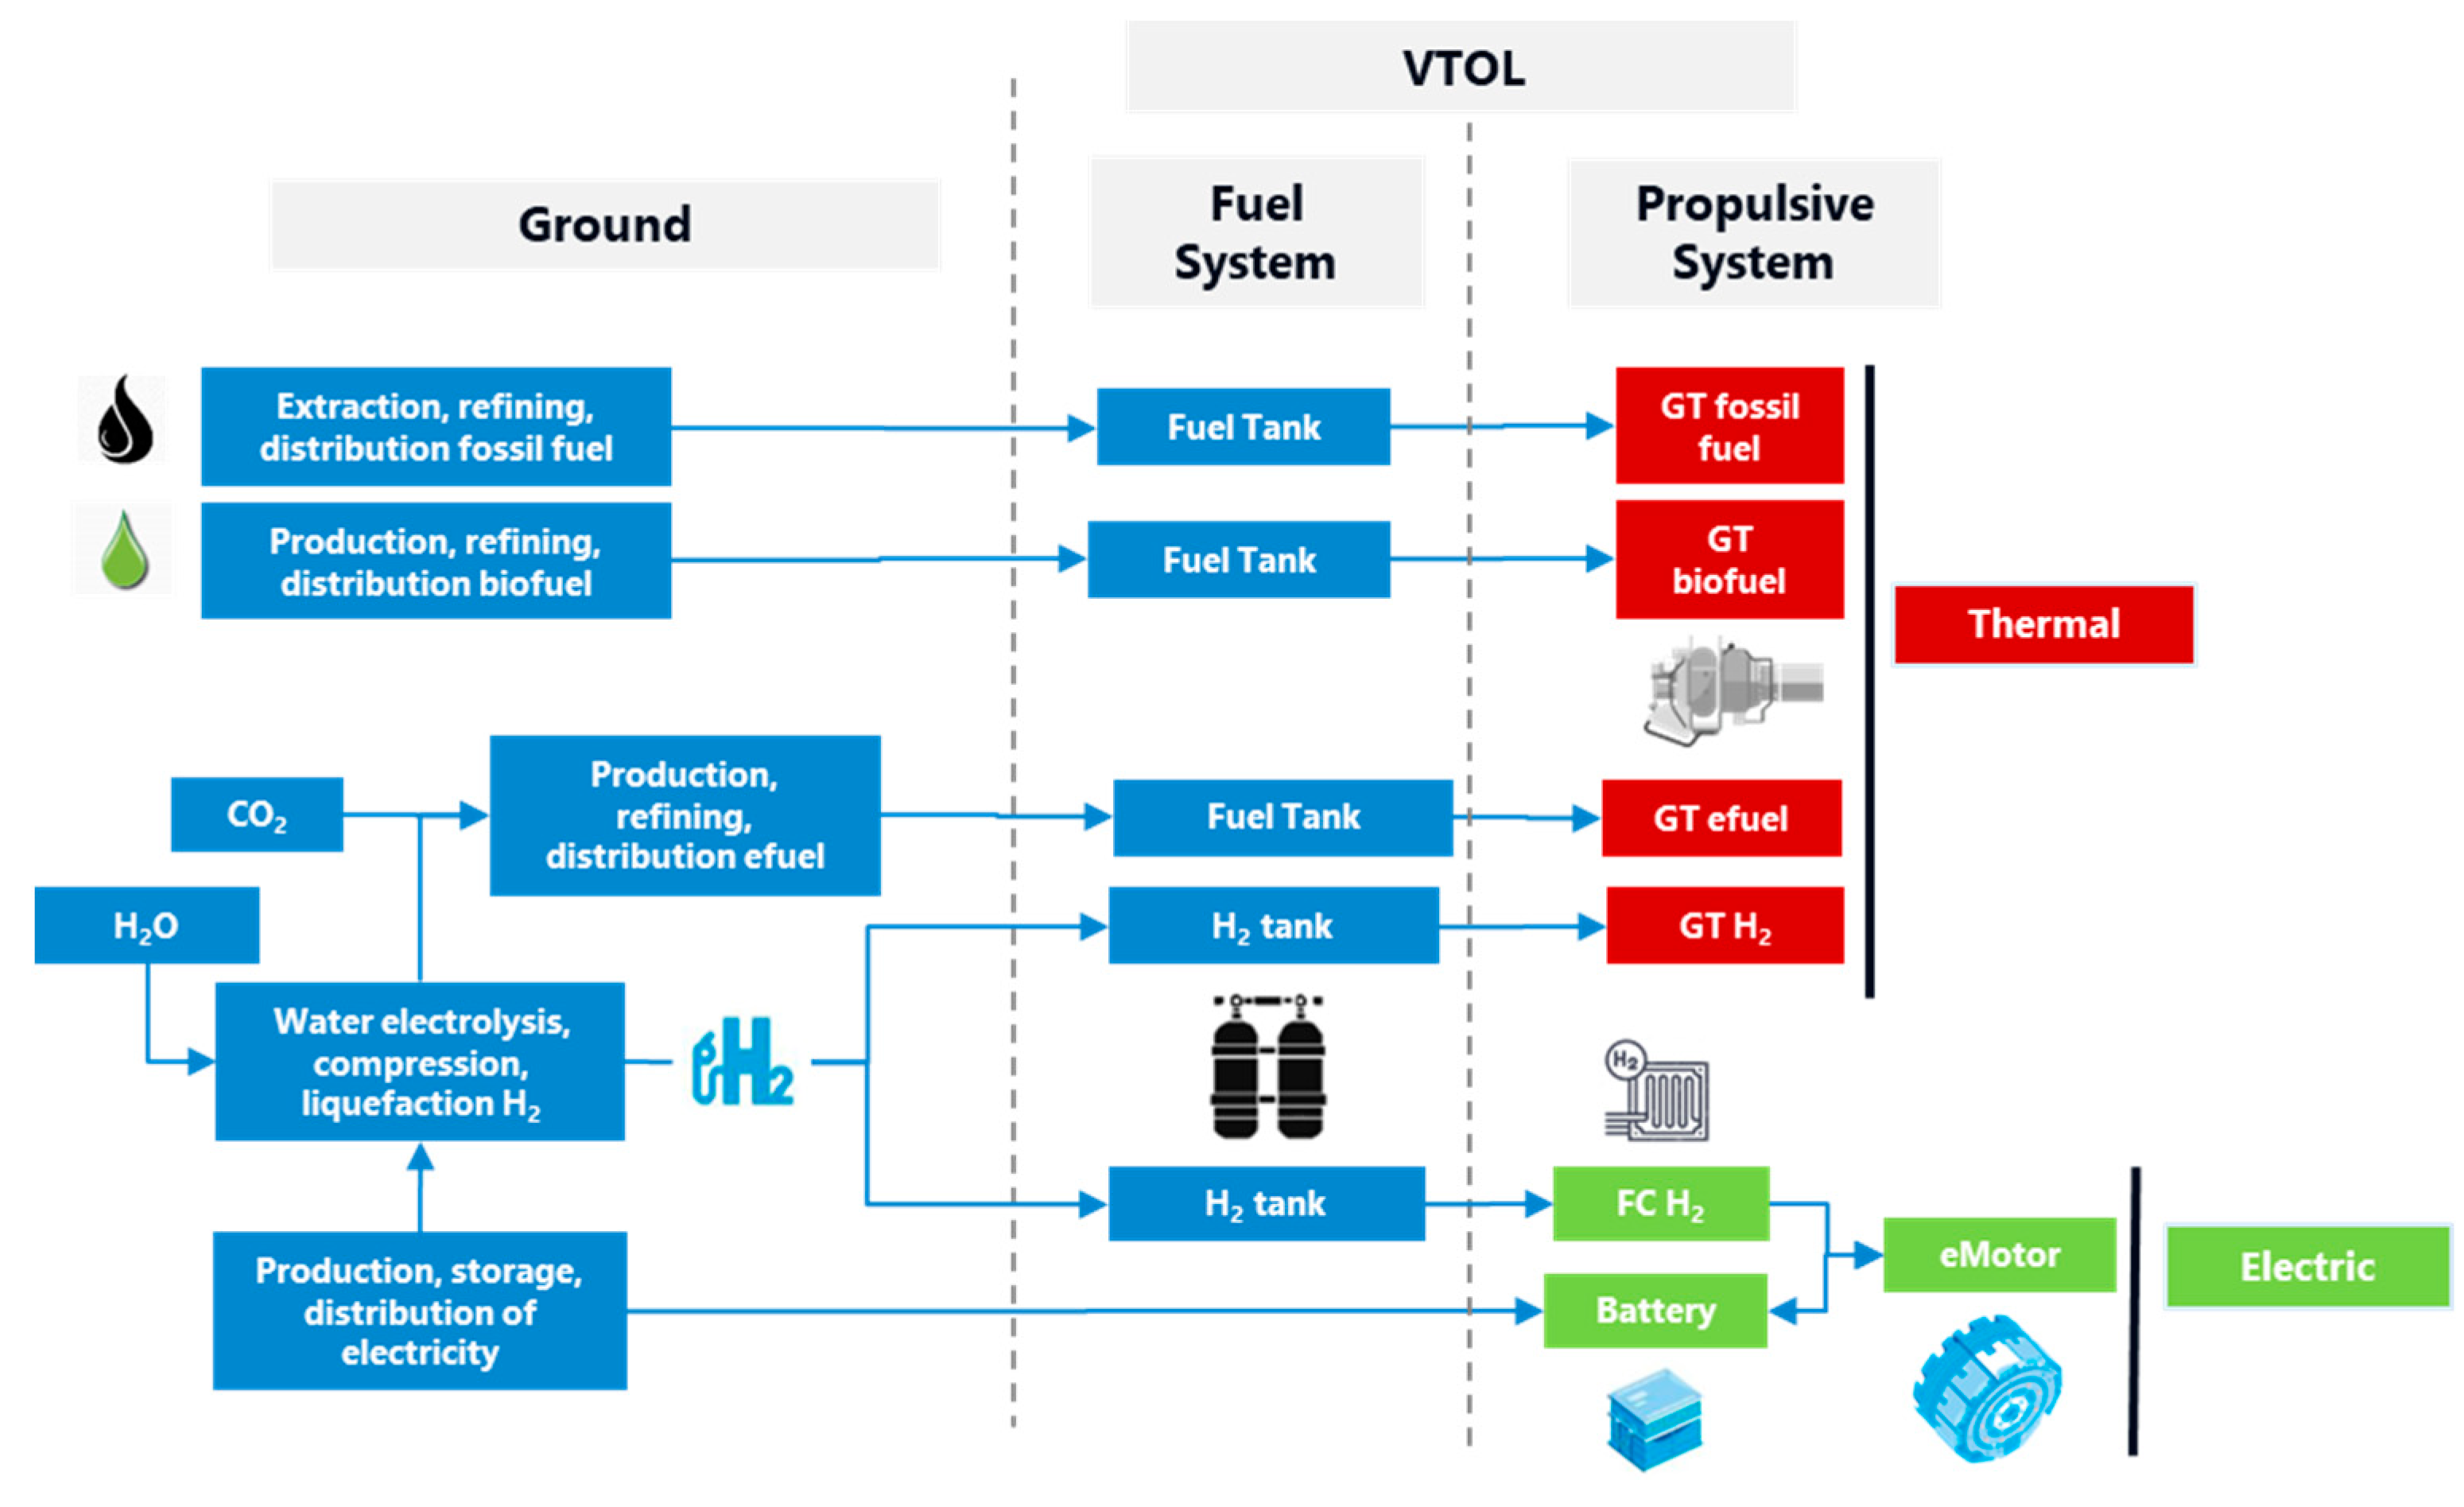
Electricity, expressed here in kWh, is the common and main feedstock for all energy vectors considered: direct electrification with battery (BE), H2 with fuel cells (FCH2), H2 with gas turbine (GTH2) and efuels. Fossil jet fuel and SAF issued from biomass will be used in section 4 for reference to compare the results, while LNG, CH4 and NH3 are not considered.
The electricity requirements to produce H
2 and efuel are significant [
9,
11,
12,
13,
14]. To compare the different energy vectors, we combine the efficiency of the energy vector from the electricity grid to the tank “well to tank” for each pathway. We then introduce the adaptation required by the associated propulsive system and its integration effects on the aircraft weight to determine the energy requirements, the “tank to rotor” efficiency.
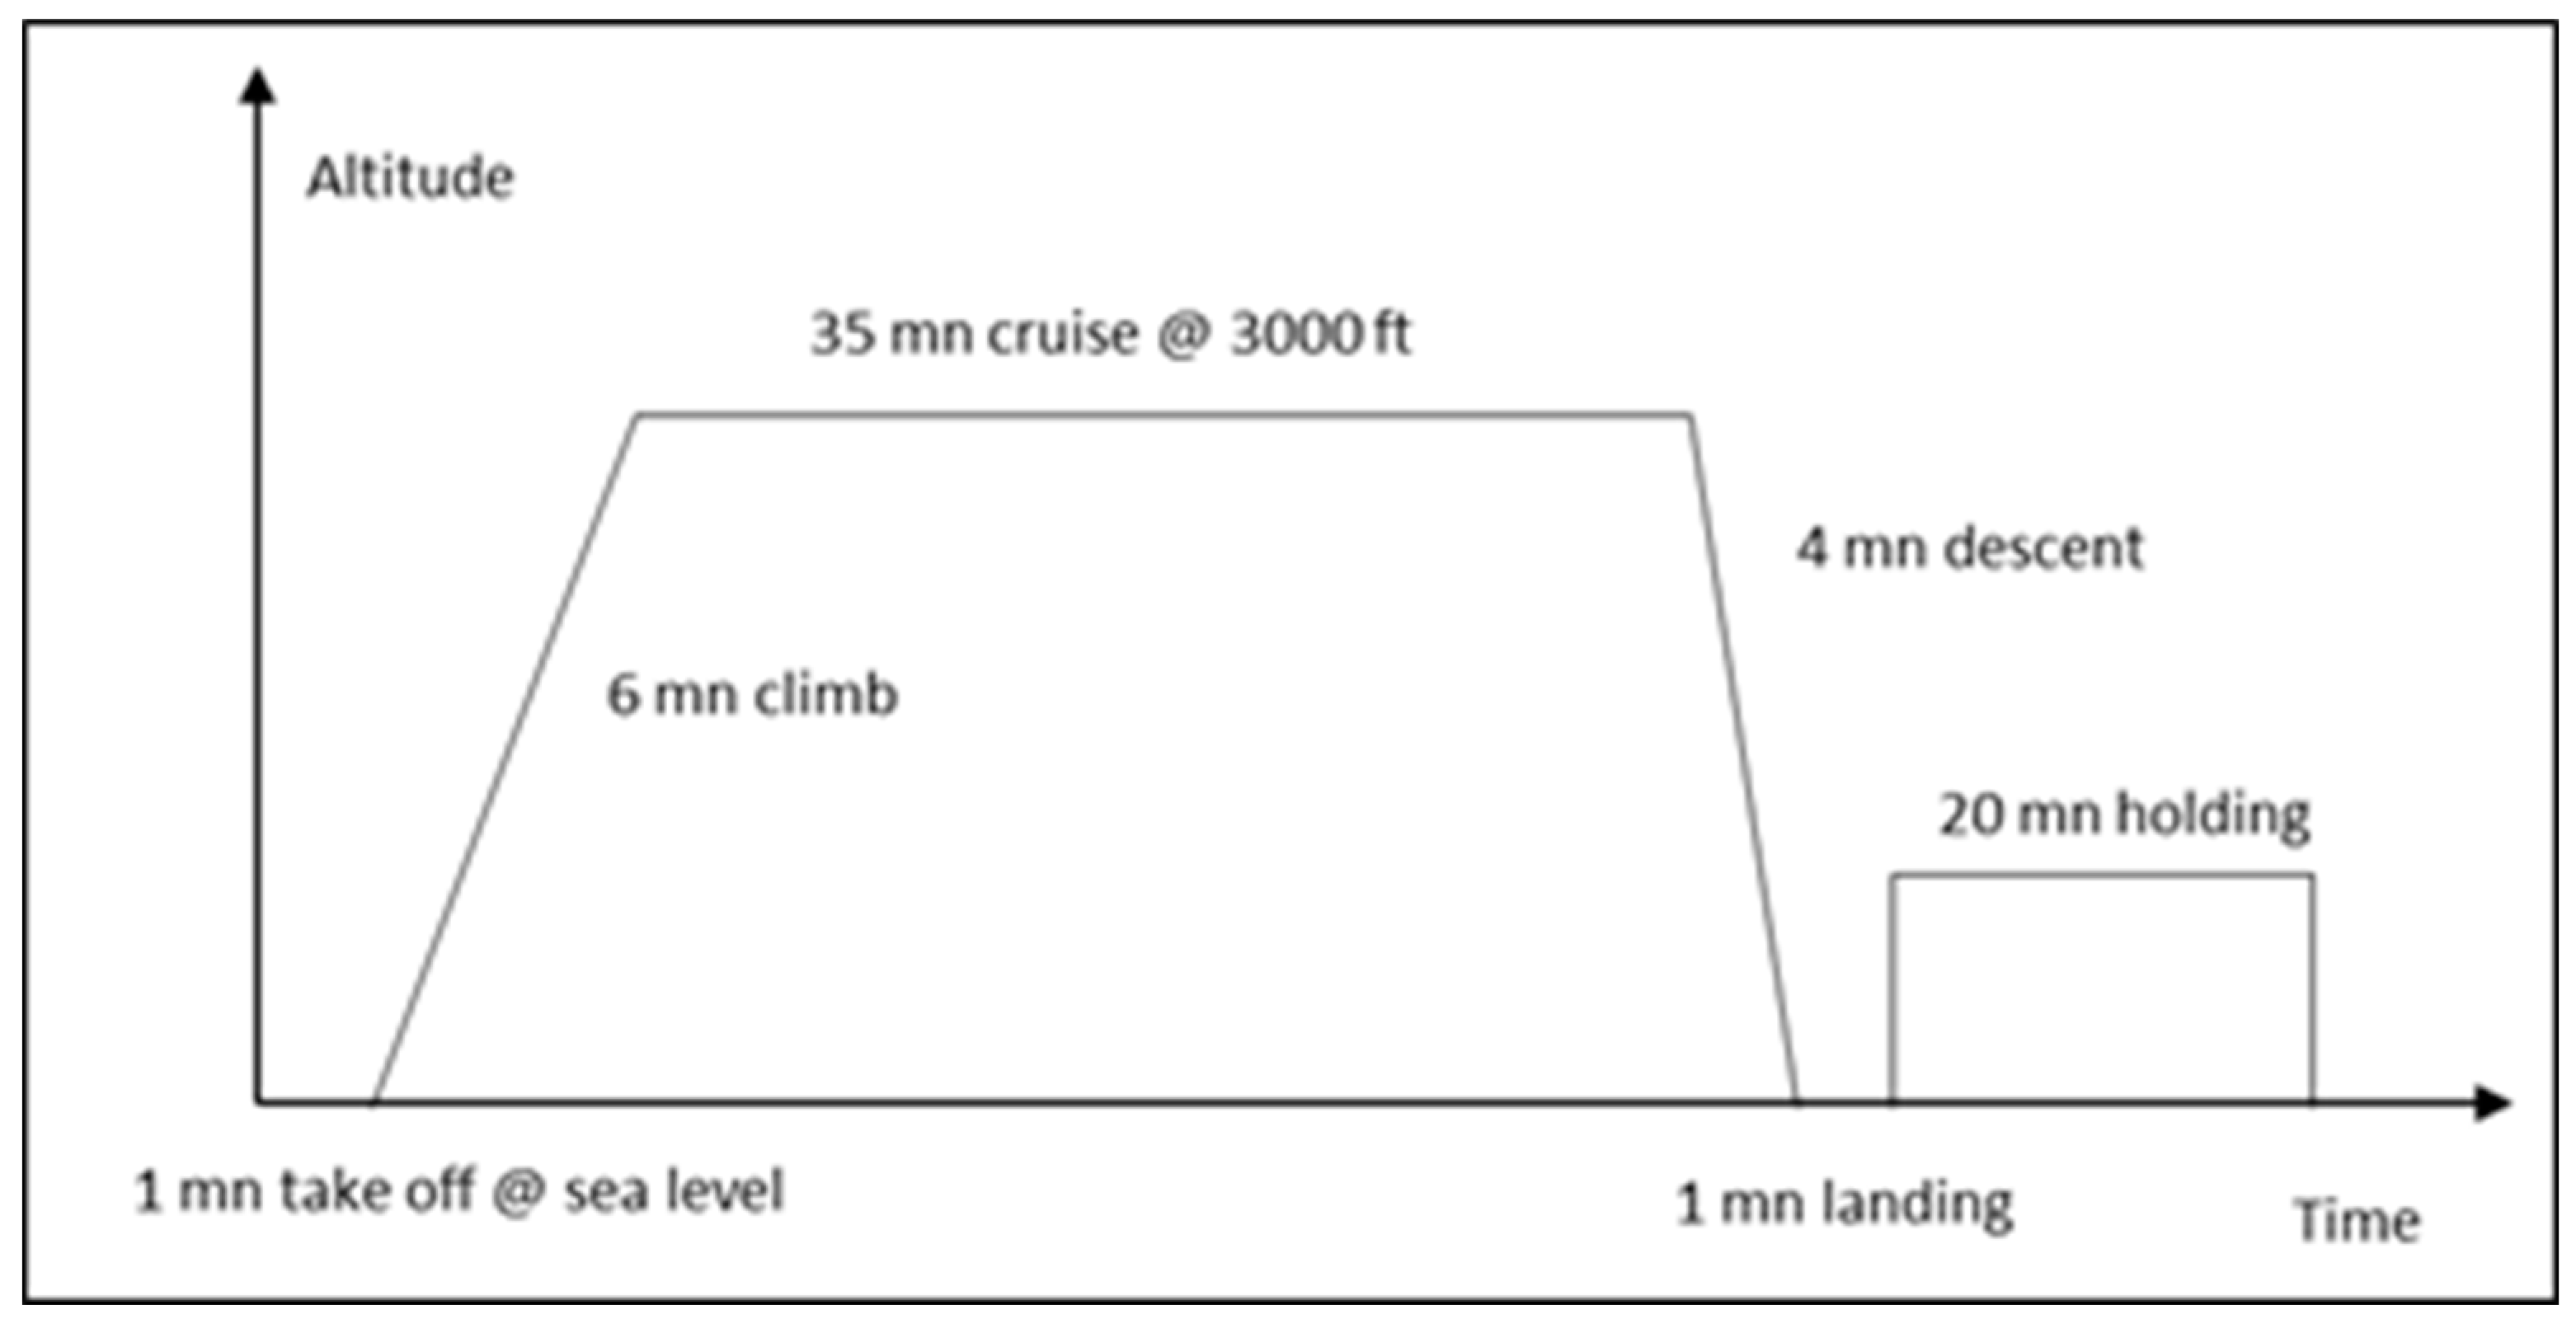
We apply these calculations to a standard VTOL mission, which is to carry 4 passenger or an equivalent of 400 kg of payload, over 80 nautic miles (nm) with a reserve of 20 nm. The mission profile is described below in
Figure 2.
As efficient as it can be, a VTOL aircraft need to continuously fight against gravity and will always consume more energy than a fixed wing aircraft with similar payload / range. The typical mission could be summarized with the transportation of an equivalent of 4 passengers (pax), or 400 kg of payload over a range of 80 nm (with a reserve of 20 nm) before refueling, so approximately 45 minutes of flight as described in figure 2. While helicopters range are often above 300 nm even for the smallest ones such as Bell 505 or the Airbus H120 [
15] and that typical missions often go beyond this range in between two refueling, the limit of 80 nm is there to reflect the opportunity of an air taxi mission as electric propulsion is considered for urban air mobility [
16]. The crew is limited to 1 pilot and the altitude to 4000 feet.
2.3. Design of VTOL
The properties of the energy vector is extremely important when designing an aircraft. An excellent gravimetric energy density can be penalized by a too low volumetric energetic density which will lead to larger tanks, penalizing drag and aircraft empty weight, thus leading to structural reinforcement, thus more weight, thus higher power requirements and finally an increased energy consumption. The payload and the range also have major contributive effects [
16].
We therefore simulated the weight rebound effects of a heavier and / or larger propulsive energy system with the associated tanks required for a given mission for each energy vectors. No modification is assumed on the aircraft and a standard configuration including a large main rotor and tail rotor to counter the main rotor torque is used. The modelling is based on the two main known principles: the Froude-Rankin theory and the statistical design method for VTOL in the range of 1500 to 3000 kg in this study. Each propulsion system is designed to meet the power and energy requirements which are issued from the aircraft modelling.
The weight breakdown WTO = WEP + WPS + WCR + WPL + WFL when WEP = αEW.WTO
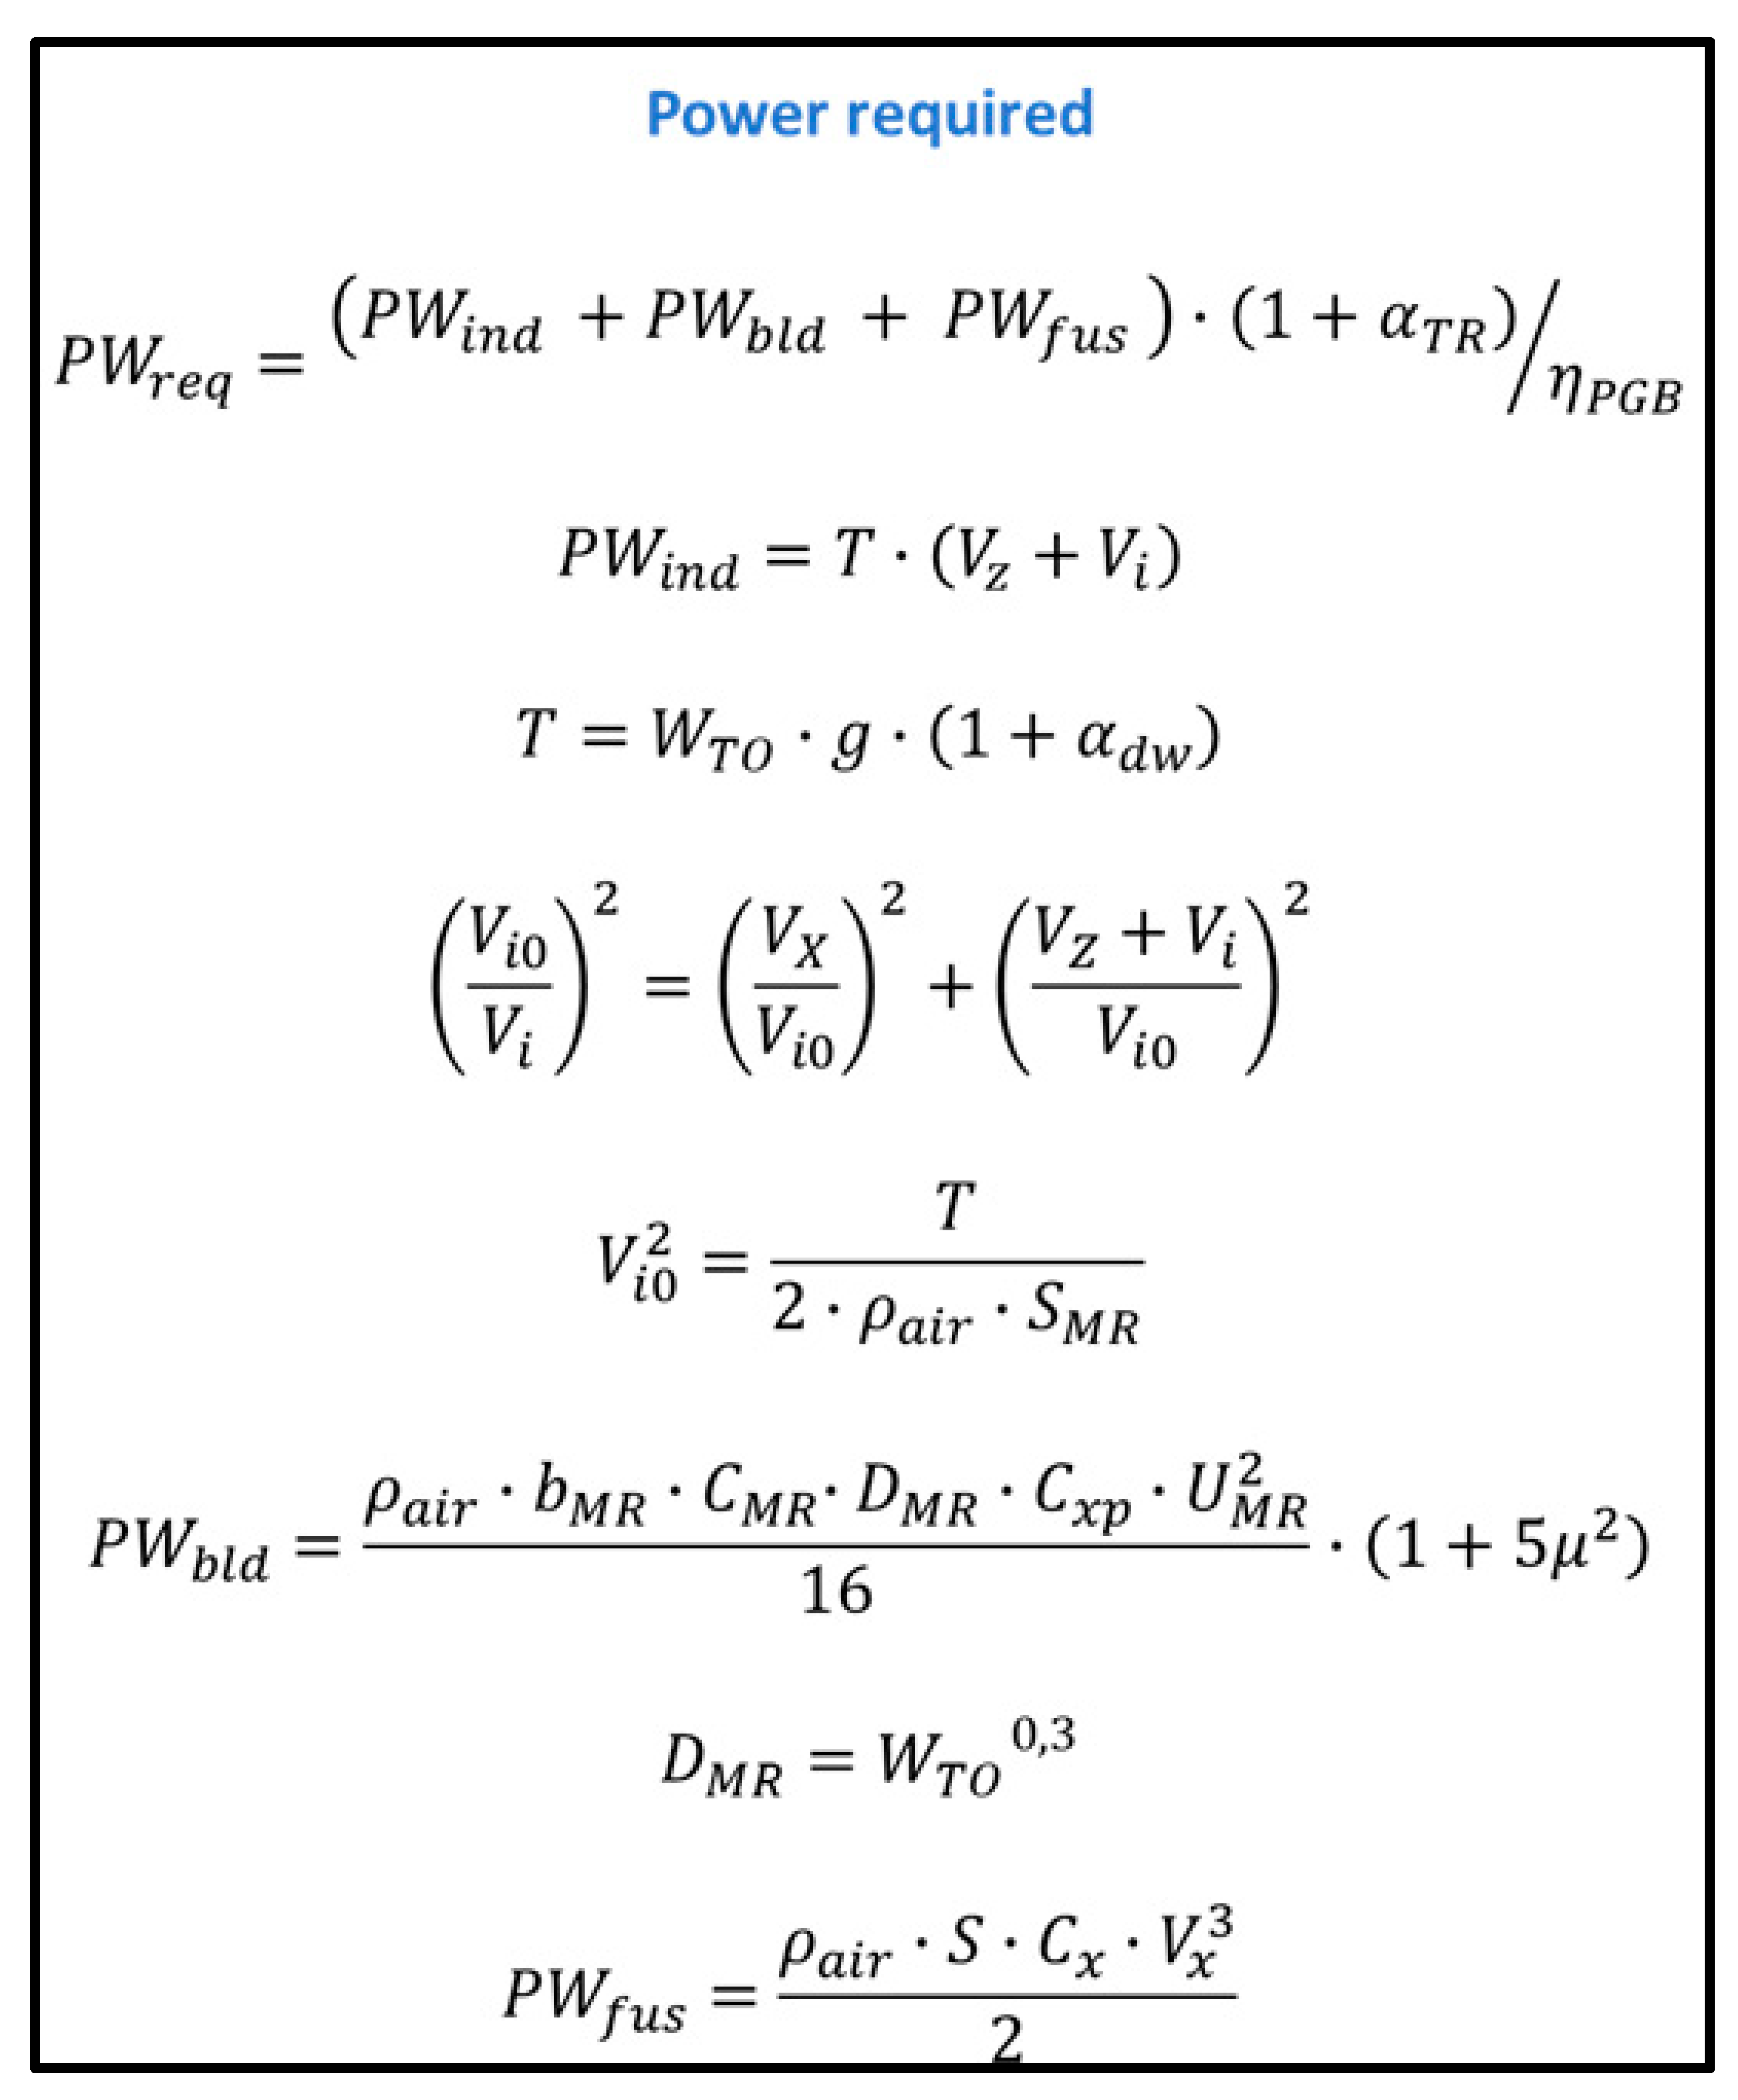
The calculation of the power required is defined in
Table 1.
The baseline VTOL is the Bell 505 [
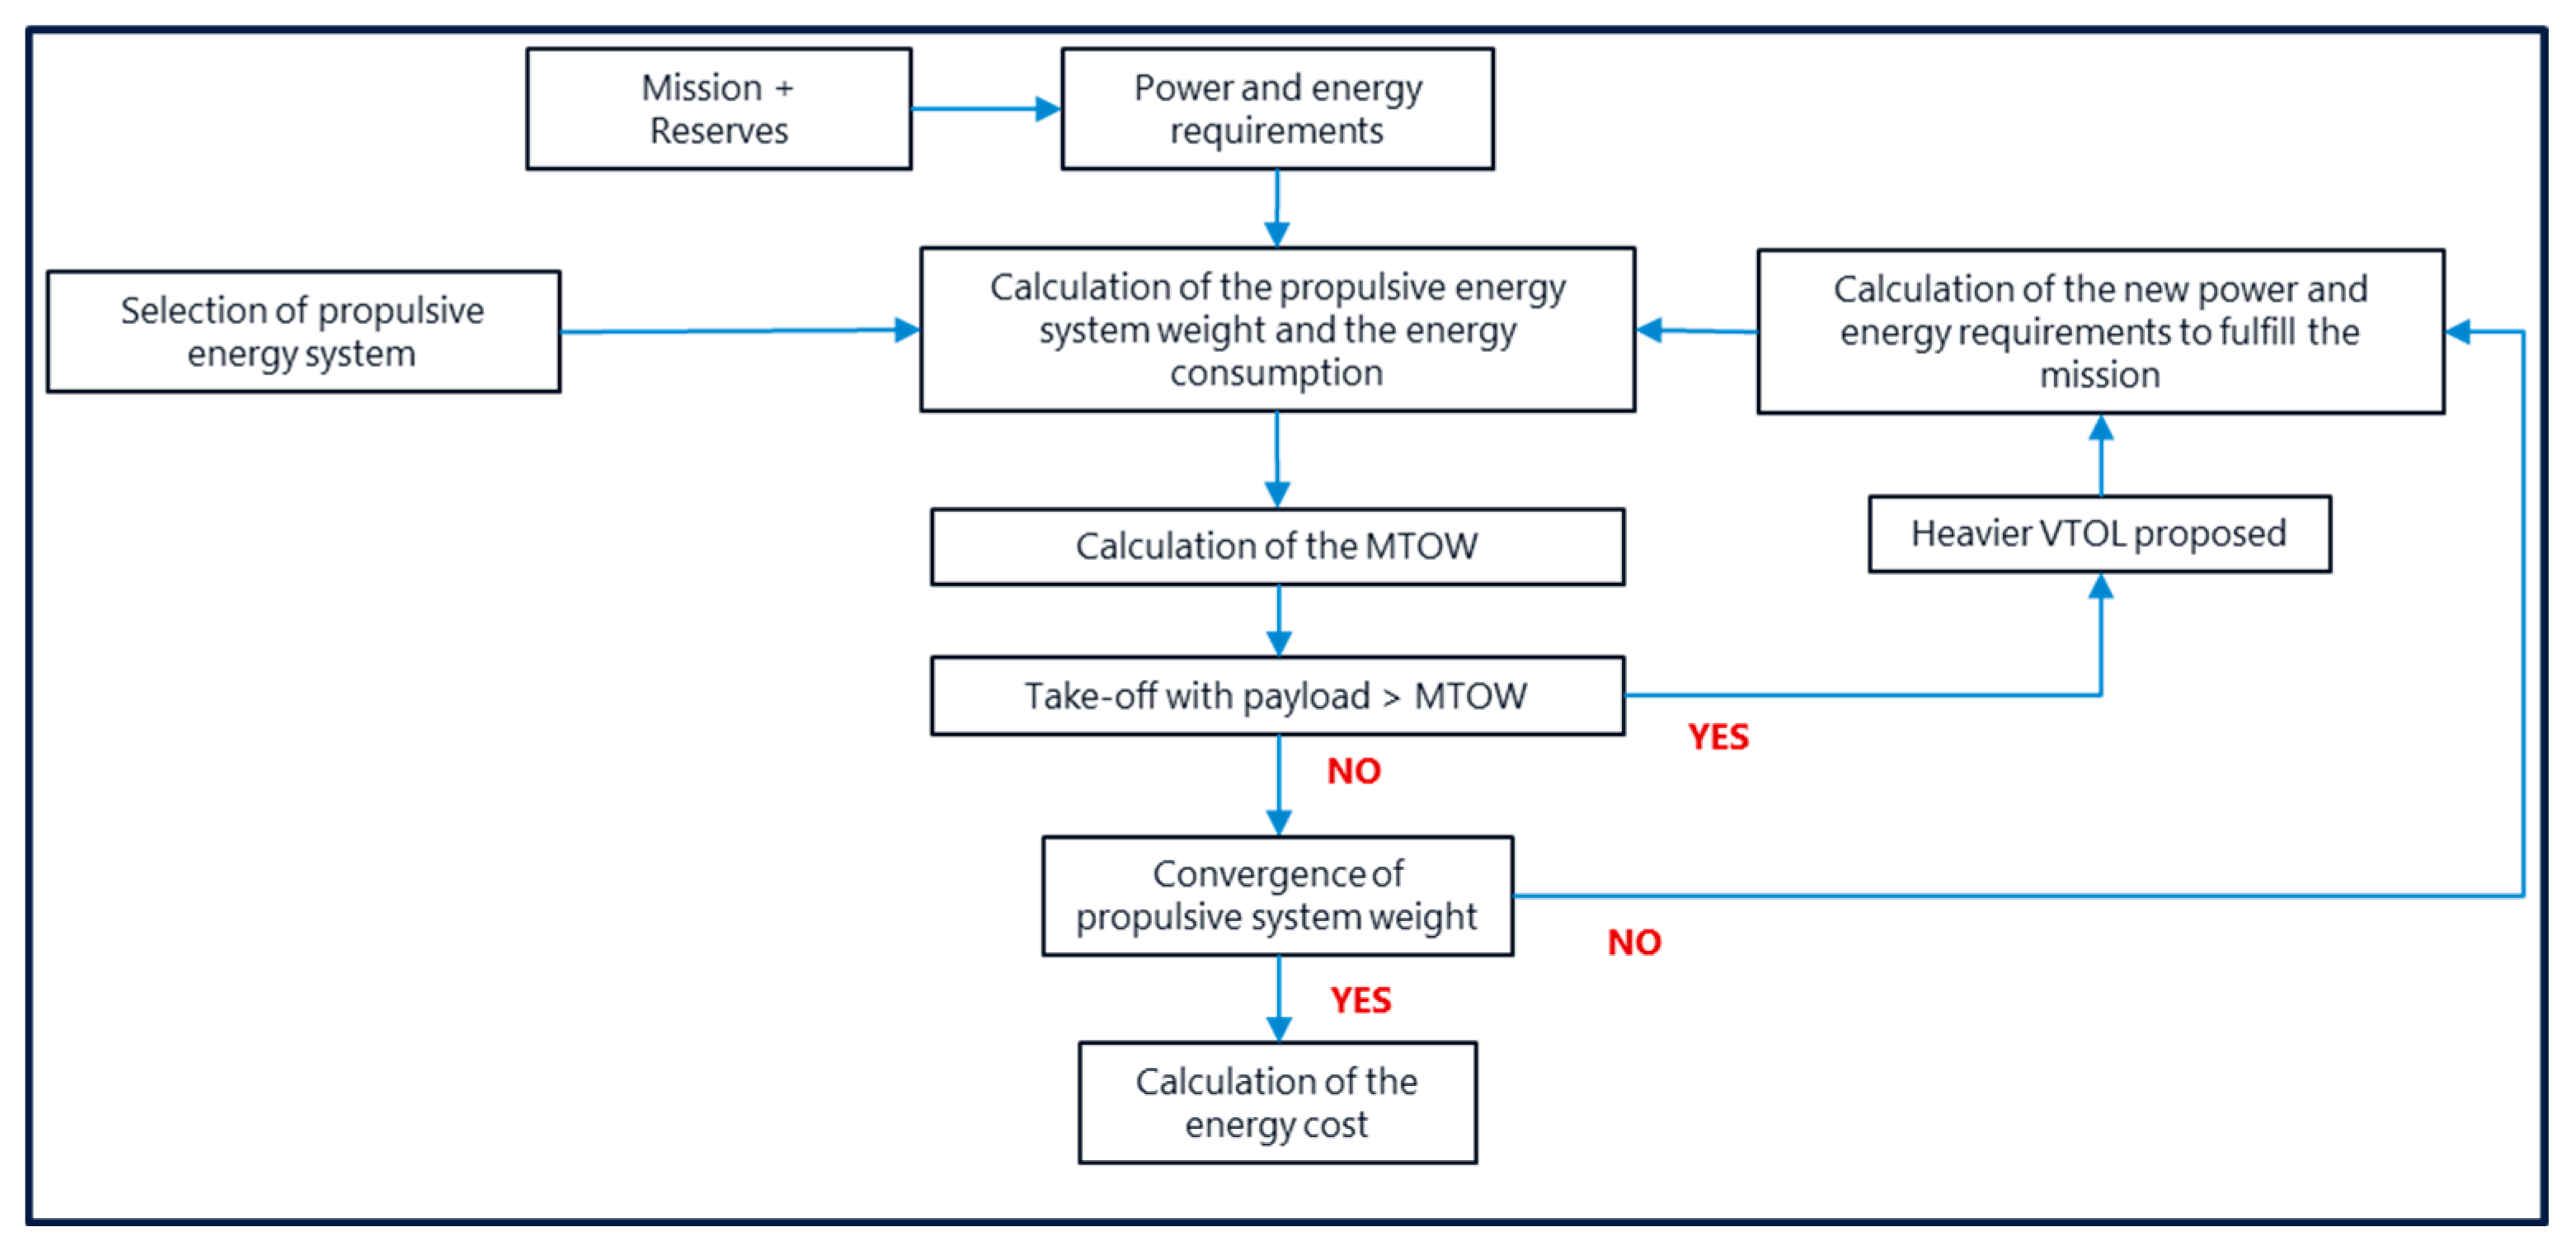
15], it is a 1.7 T Maximum Take Off Weight (MTOW) helicopter which can carry 4 passengers as required by the mission profile. If this baseline helicopter cannot fulfill the mission, either the range and / or the payload, i.e., if the take-off payload is above the MTOW or if the convergence of propulsive system weight does not match with a given combination of energy vector / propulsive energy system as described in figure 1 above, then a larger VTOL is chosen. The next VTOL in line in this study is the Bell 429 [
15] which has a 3.4 Tons MTOW. If this heavier VTOL cannot fulfill the mission, then a larger helicopter is chosen, the Leonardo 169 [
15] which has a 4.6 T MTOW. We describe in
Figure 3 below the process followed for these calculations.
The hypothesis used in this study for the propulsive system design are summarized in
Table 2 below:
2.4. Energy Vectors
In this study the jet fuel and the sustainable aviation fuels issued from biomass, biofuels, will only be used as a reference for comparing the CO
2 emissions in the discussion and conclusions section. Since biofuels can have different cost and CO
2 emissions [
17], we will use the HEFA-UCO biofuel as reference in section 4.
Fossil Jet Fuel: used as a reference with CO
2 emissions of 94 gCO
2/MJ [
18] with a LHV of 44.1 GJ/t [
20]
-
Biofuel: HEFA-UCO used as a reference with CO
2 emissions of 20 gCO
2/MJ [
19] with a LHV of 44.1 GJ/t [
20] Electricity: used for battery electrification (BE), the production of liquid H
2 and efuels. Electricity is considered as the raw material for all the combination of energy / propulsive systems studied here as described in figure 1 above. We assume that electricity is supplied by the grid with no consideration of load factor The carbon intensity is expressed in gCO
2/kWh and costs in €/kWh.
- o
Electricity for BE: 10% charging losses are added to the energy required to fulfill the mission; a figure slightly lower than the one proposed by Reick et al in 2021 [
21] which concluded to a mean efficiency of 87%.
- o
Electricity for liquid H
2: green LH
2 produced from water electrolysis will be either used in a gas turbine or in a fuel cell. Our hypothesis is that H
2 will be directly manufactured on site to avoid any long-distance transportation of LH
2 as carrying hydrogen from one place to another would significantly harm the cost and CO
2 emissions [
22]. The value for electrolysis is 20 g / kWh or 50 kWh per kg of H
2 [
23] while the energy cost for liquefaction adds 15 kWh per kg of H
2 [
24].
- o
Electricity for efuel: as for LH
2, electricity is the dominant element when producing efuel [
9,
25]. Low carbon efuel will require an optimized unit of production as proposed in [
25] using biogenic CO
2 or using direct air capture [
9]. The H
2 will be produced using the same value as above before being sent to a Fischer-Tropsch unit to be converted in efuel after addition of H
2O and CO
2. Our hypothesis is 22.2 kWh of electricity to produce 1 kg of efuel as proposed by the Académie des Technologies [
9].
2.5. Life Cycle Assessment
The energy used in operation represents more than 99% of the emissions of the aircraft and the impacts associated with the manufacturing are negligeable [
26,
27]. We therefore do not take in consideration the environmental impact, nor the CAPEX, associated to the various aircraft configurations except for the battery pack as battery manufacturing have a significative impact over the lifetime costs and CO
2 emissions of a vehicle [
28]. The hypothesis for the battery manufacturing is a GHG of 72.9 kg CO
2 / kWh [
29]. With frequent high-speed charge, our hypothesis for battery replacement is set at 200.000 km while the battery cost is set at 75
$ / kWh [
30].
For the FCLH
2 configuration (fuel cell with LH
2), a battery pack of 100 kWh is required to accommodate the transient and voltage stabilization [
31]. The above numbers will apply.
3. Results
3.1. VTOL Energy Requirements per Energy Vector and Total Electricity Consumption
While the mission (
Figure 2) can be realized with all the energy vectors considered, the results highlight that the energy vector has a significant impact on the take-off weight thus the energy required when applying the integration effects. As described in 2.3, when the take-off weight is above the MTOW of the VTOL considered, a heavier VTOL is evaluated. The results are synthetized in table 3 below.
The liquid hydrocarbons (efuel, or fossil fuel, or biofuel) have the lowest MTOW and will require 63 kg of liquid fuel.
When switching to LH
2, while the gravimetric density is favorable, the lower volumetric density and the need to accommodate wider and robust tanks lead to a heavier VTOL: MTOW is almost doubled compared to liquid hydrocarbons. 36 to 41 kg of LH
2, respectively when combined with gas turbine or a fuel cell, are required to realize the mission. The propulsive system based on fuel cell is penalized by the fuel cell weight and the need to integrate a 100-kWh battery pack [
31]. The gas turbine, while lighter, must accommodate a complex fuel system to allow the stored LH
2 @ 21°K to reach the combustion chamber without safety issues, leading to heavier pipes and additional monitoring and safety components [
32].
To calculate the battery electrification VTOL take-off weight, the battery pack size was calculated. With the baseline requirement of 360 kWh of electricity to perform the mission, the battery pack must grow to 625 kWh to include the safety reserve of 20 nm (90 kWh), the minimum of 10% state of charge before charging [
33], and the aging of the battery before replacement, with an hypothesis of 80% before reaching the battery knee-point [
34].

To calculate the total electricity consumption for each energy vector considered, we apply respectively 22.2 kWh to produce 1 kg of efuel [
9] and 65 kWh to produce 1 kg of LH
2 [
23,
24]. For battery we apply the charging losses, 10%, as described in 2.4 above.
The results are synthetized in Table 4 below:

3.2. CO2 Emissions
The CO2 emissions are proportional to the carbon intensity of the electricity in gCO2/kWh multiplied by the quantity of electricity required to perform the mission:
MkWh * gCO2. .kWh
This is true for all energy vectors except for Battery Electrification and FCH2 as the battery manufacturing implicates significant CO2 emissions as described in section 2.5.
For battery electrification, the hypothesis for the battery manufacturing is a GHG of 72.9 kg CO
2 / kWh [
29], which means 45562 kg of CO
2 for the 625 kWh battery pack which will be replaced every 200.000 km. We therefore assume that 0.228 kg of CO
2 should be added per km, or 33.7 kg of CO
2 per mission, 80 nm being equivalent to 148 km.
For FCH2, the 100 kWh battery pack, using the same formula, would add 5.4 kg of CO2 per mission.
Since the CO
2 emissions are proportional to the carbon intensity of the electricity and while this could be infinite, we used the European Union carbon intensity of electricity which decreased from 641 gCO2/kWh in 1990 to 334 gCO2/kWh in 2019 [
35] to modelize the results as shown in Figure 4 below.
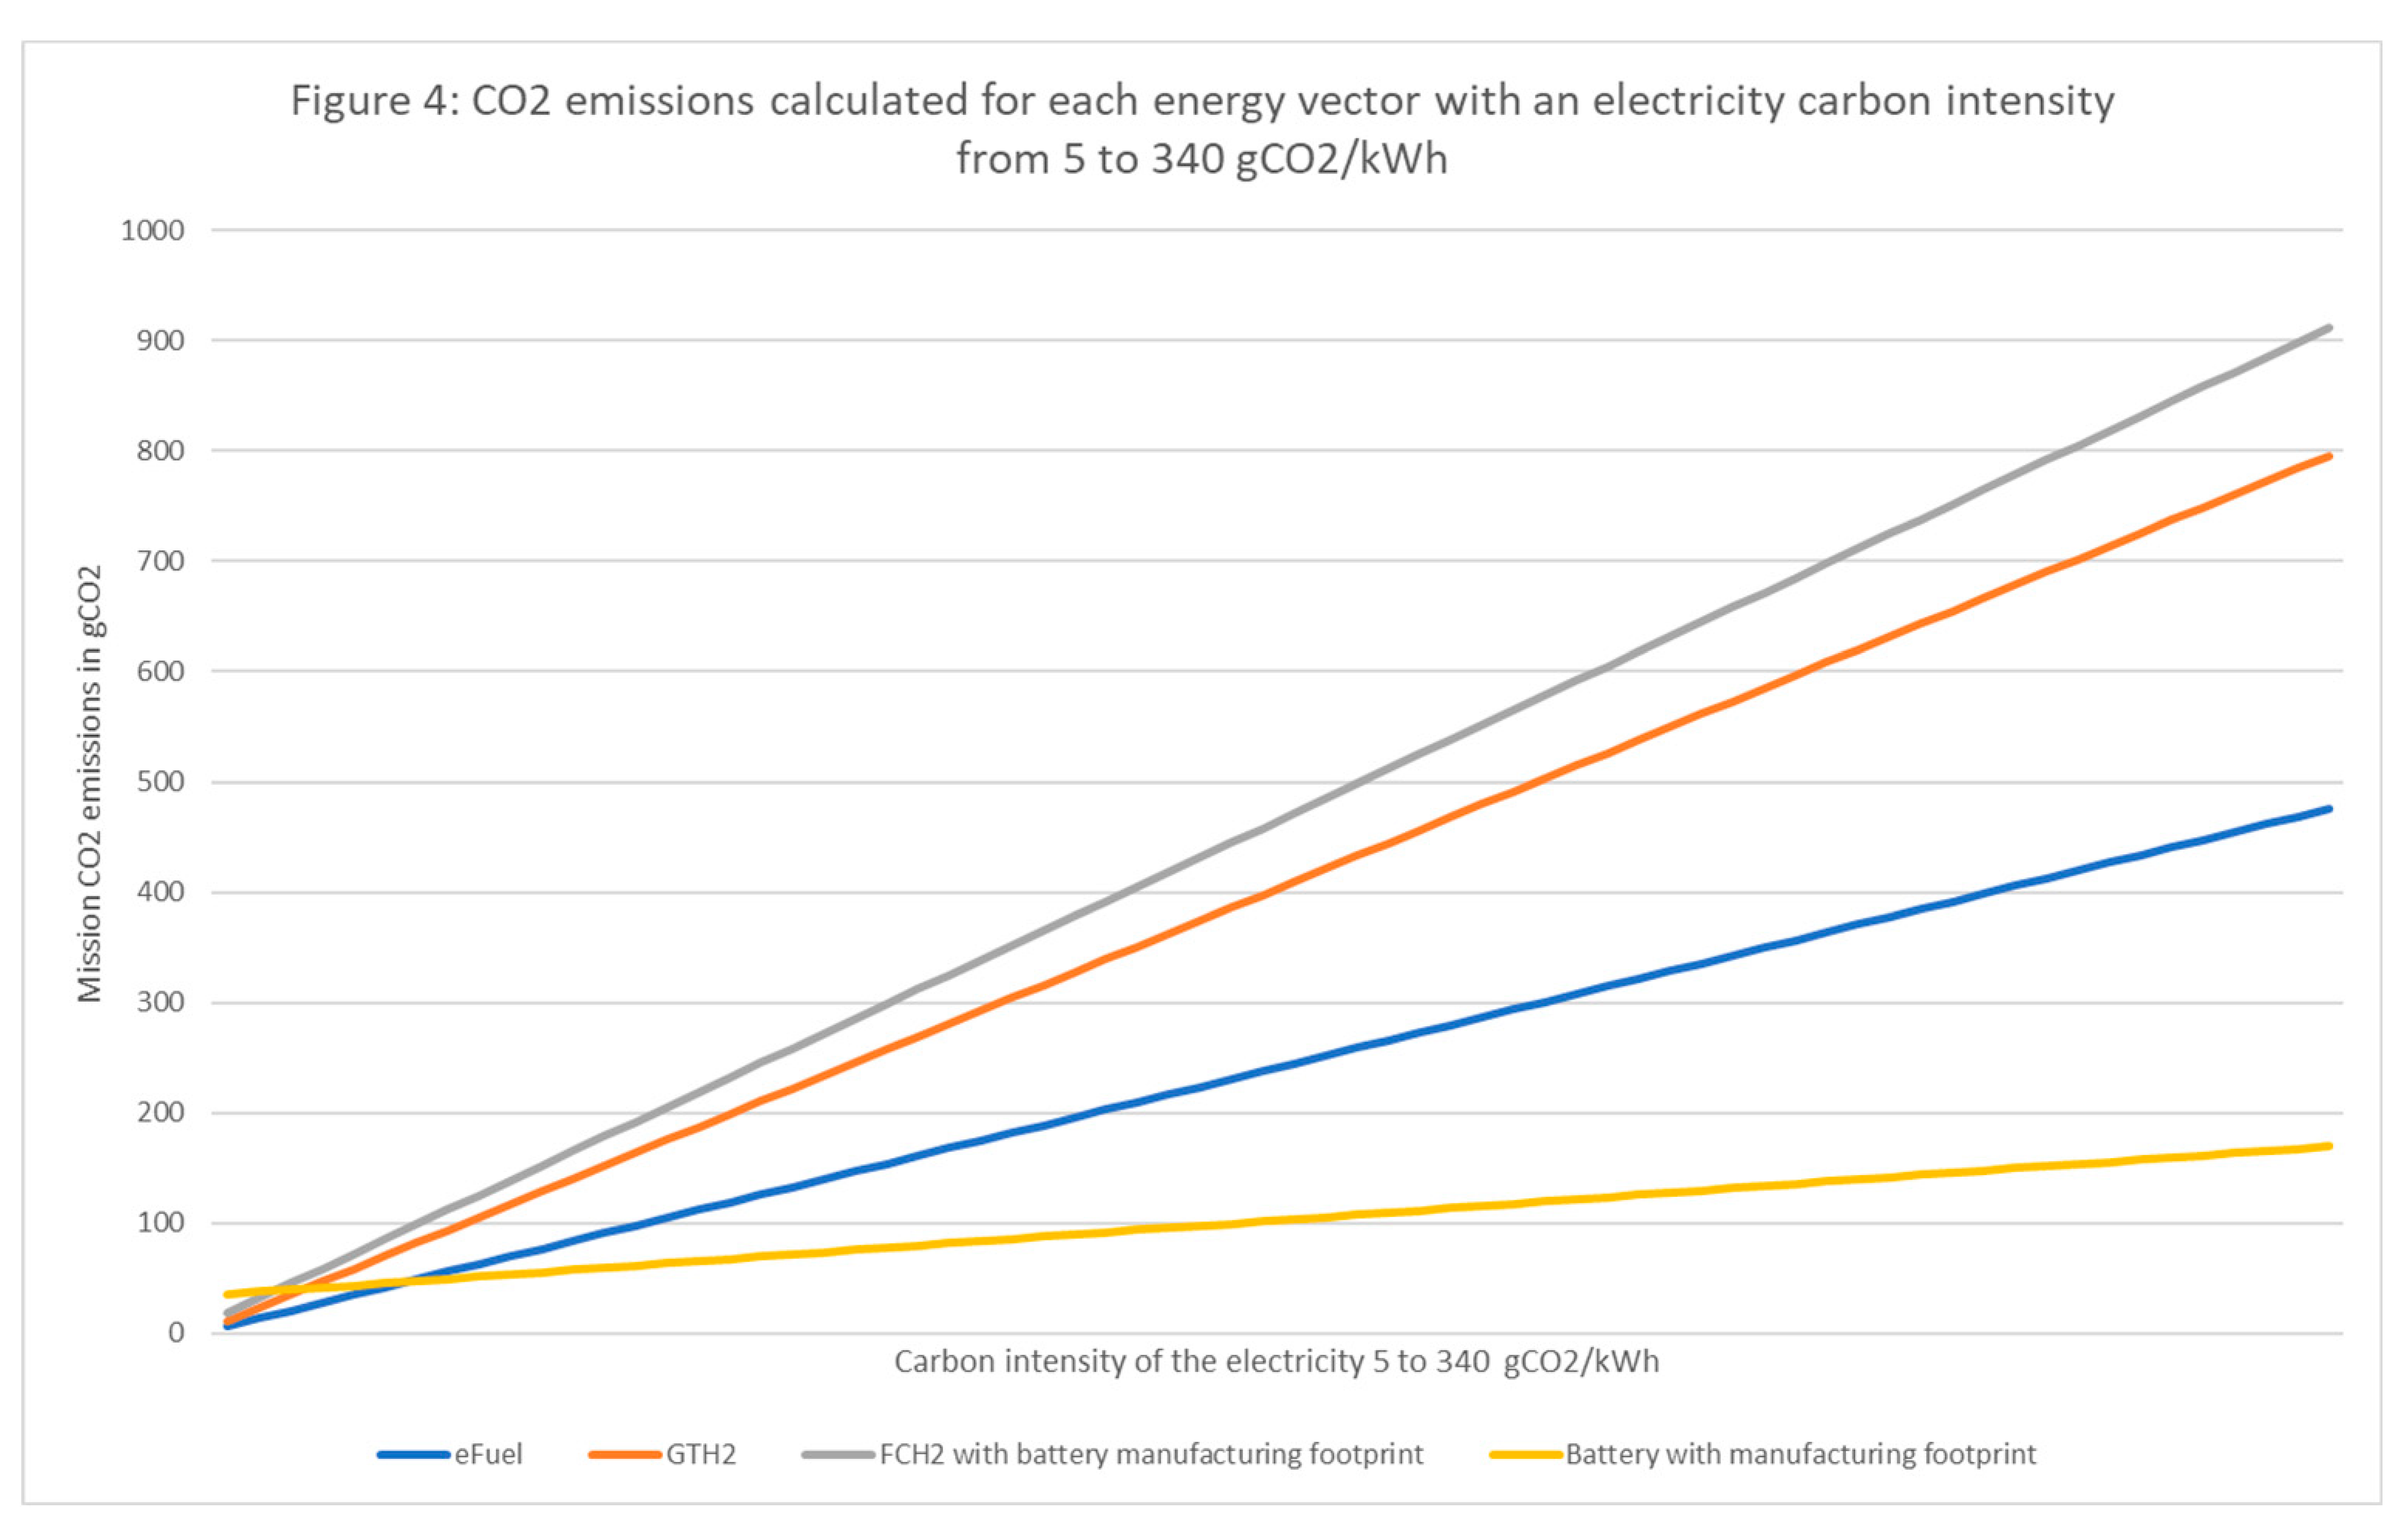
Results show that H2 energy vector has higher CO2 emissions than efuel. Battery electrification has the lowest CO2 emissions except when the carbon intensity is very low, which could be explained by the impact of the battery manufacturing.
Since the decarbonization of the energy is key and that several regulations are now in place, such as the European Regulation for Renewable and Low Carbon Fuels [
36], Figure 5 below focuses on carbon intensity of the electricity from 0 to 50 g CO
2/kWh:
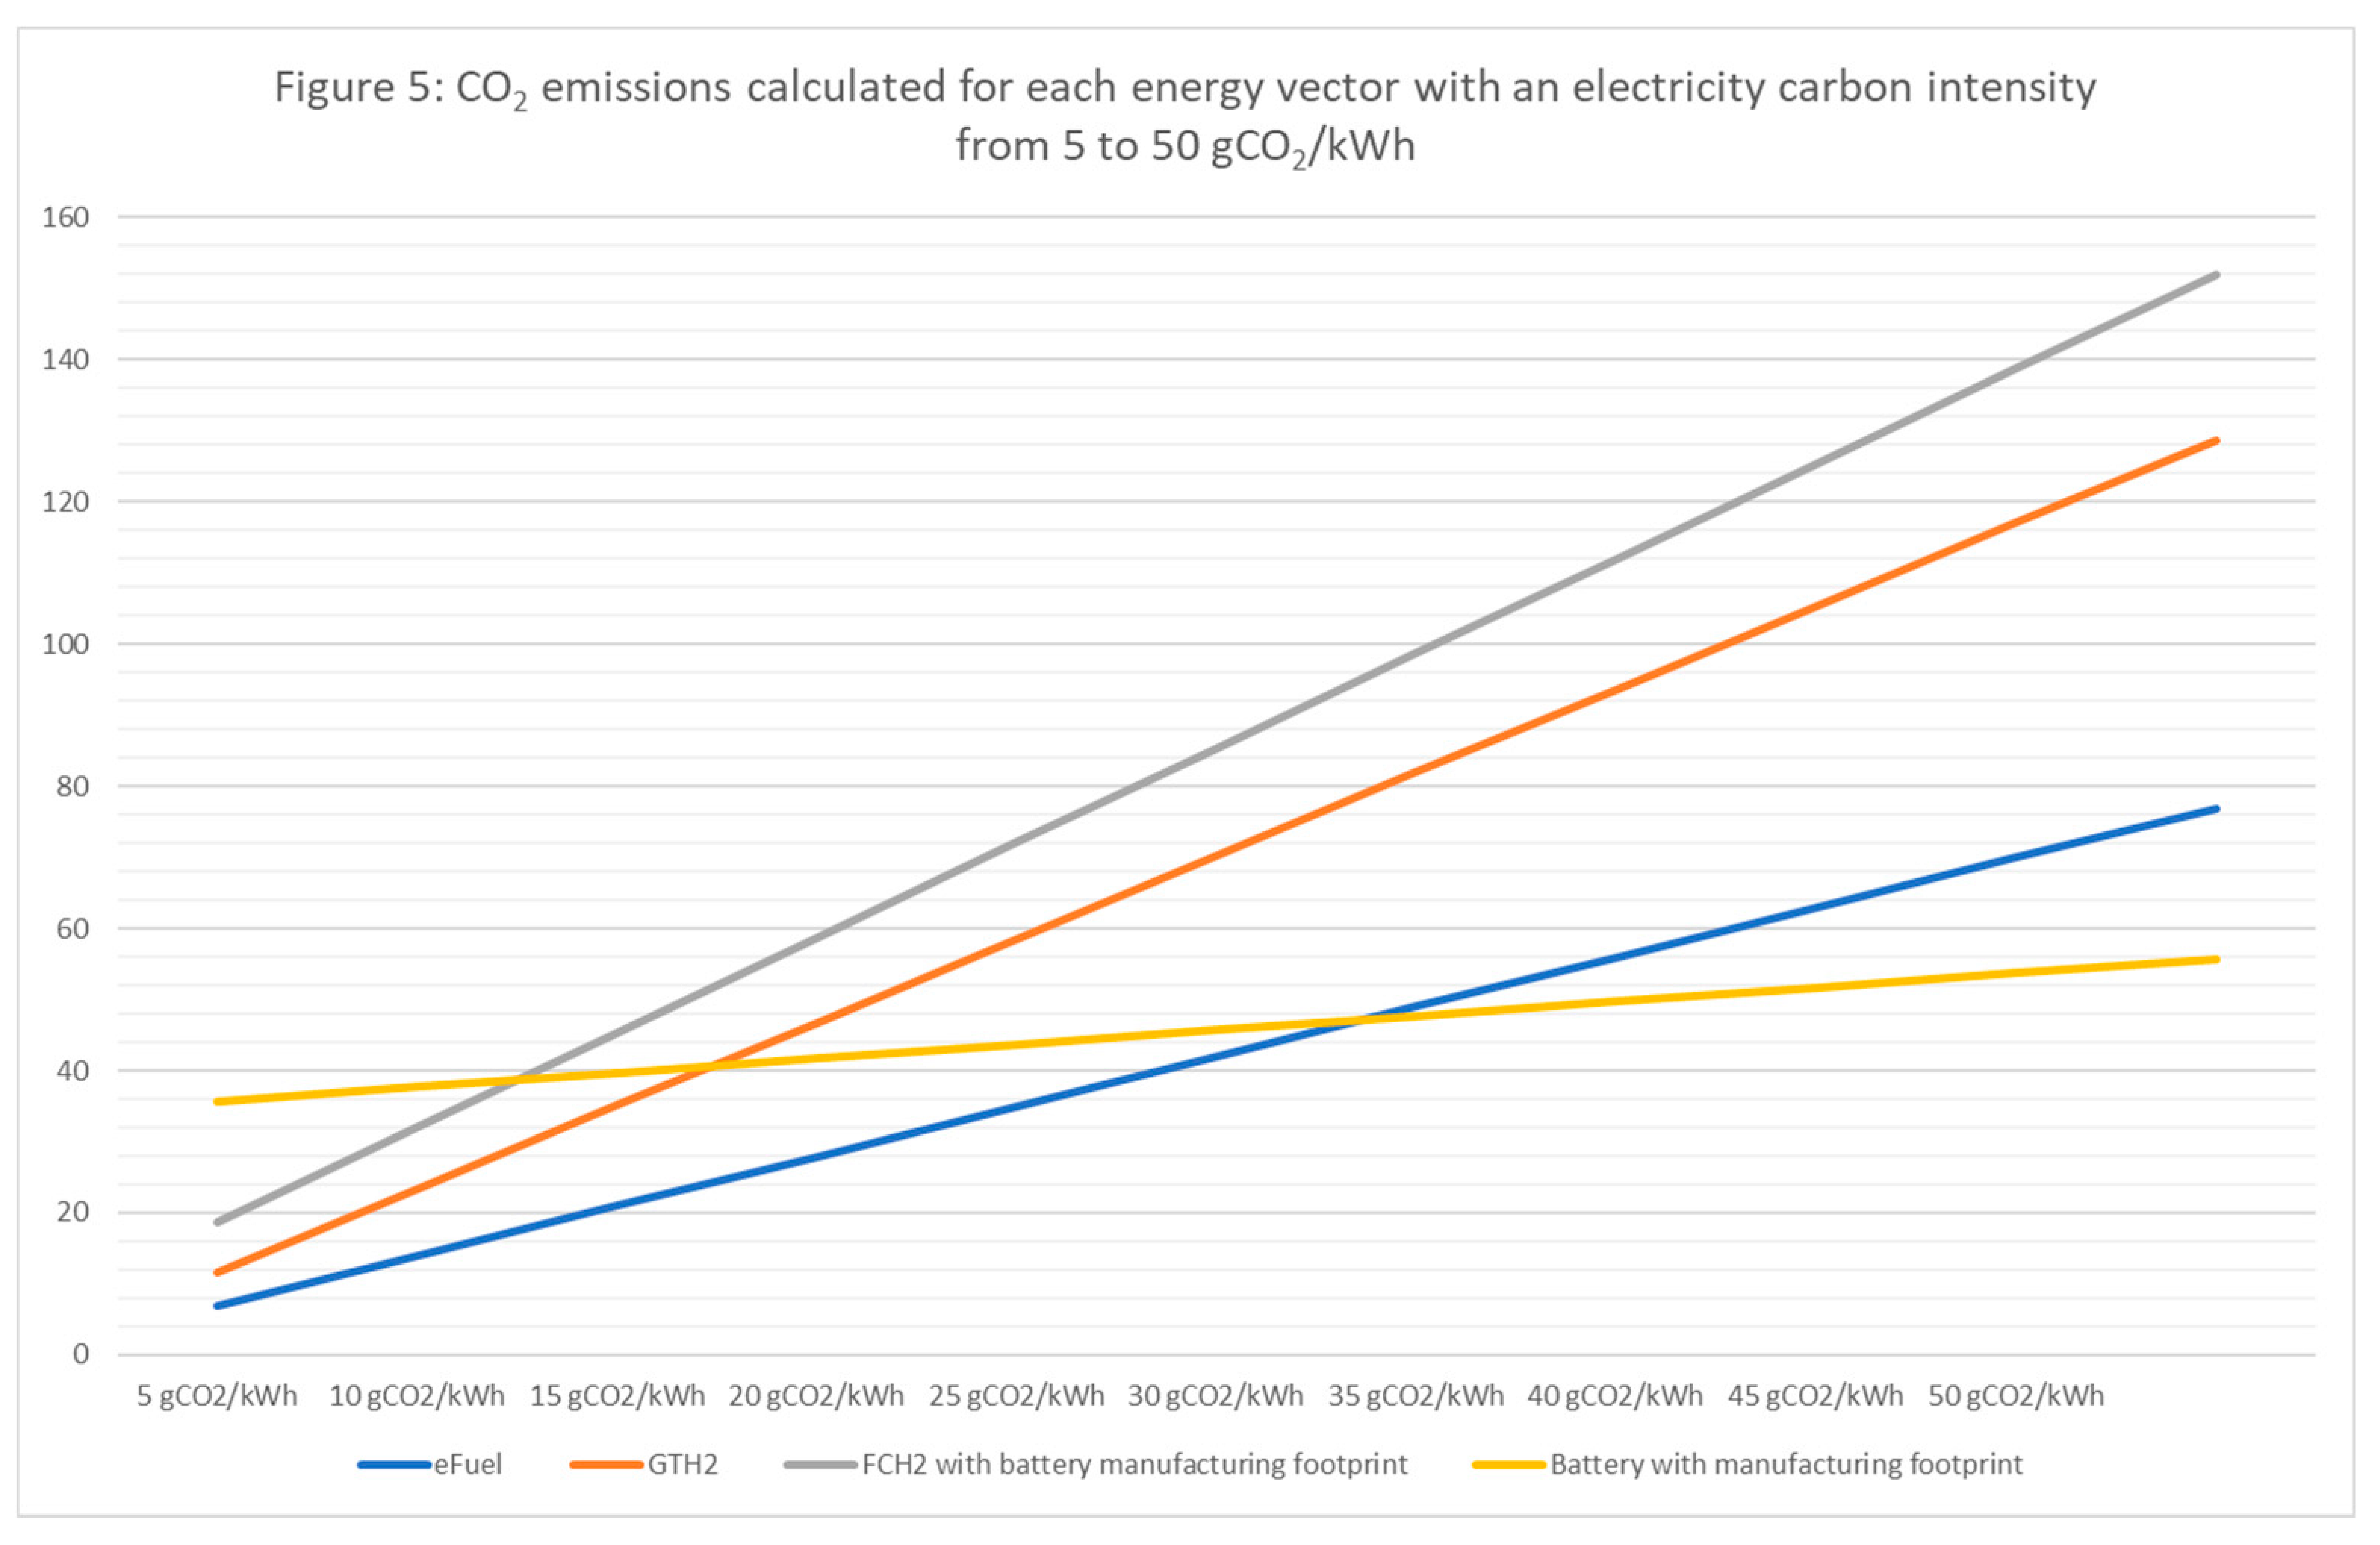
In figure 5 one can notice that the carbon intensity of the electricity plays a significant role when below 45 gCO2/kWh for the considered mission.
It is only when the carbon intensity of electricity is beyond 35 gCO2/kWh that battery electrification has lower CO2 emissions than efuel. This could be explained by the impact of the battery pack manufacturing.
Whatever the carbon intensity of the electricity, efuel has lower CO2 emissions than propulsive systems using H2 as energy carrier.
3.3. Cost of Electricity for the Mission
The costs calculated here apply to the cost of the electricity required to perform the mission and the cost of the battery when necessary. CAPEX are not considered.
The cost of the mission is proportional to the electricity price in $/kWh:
MkWh * $.kWh
This is true for all energy vectors except for Battery Electrification and FCH2 as the battery manufacturing implicates significant costs as described in section 2.5.
For battery electrification, the hypothesis for the battery manufacturing is a cost of 75
$/kWh [
30], which means 46875
$ for the 625 kWh battery pack which will be replaced every 200.000 km. We therefore assume that 0.234
$ should be added per km, or 34.7
$ for the selected mission, 80 nm being equivalent to 148 km.
For FCH2, the 100 kWh battery pack, using the same formula, would add 5.5 $.
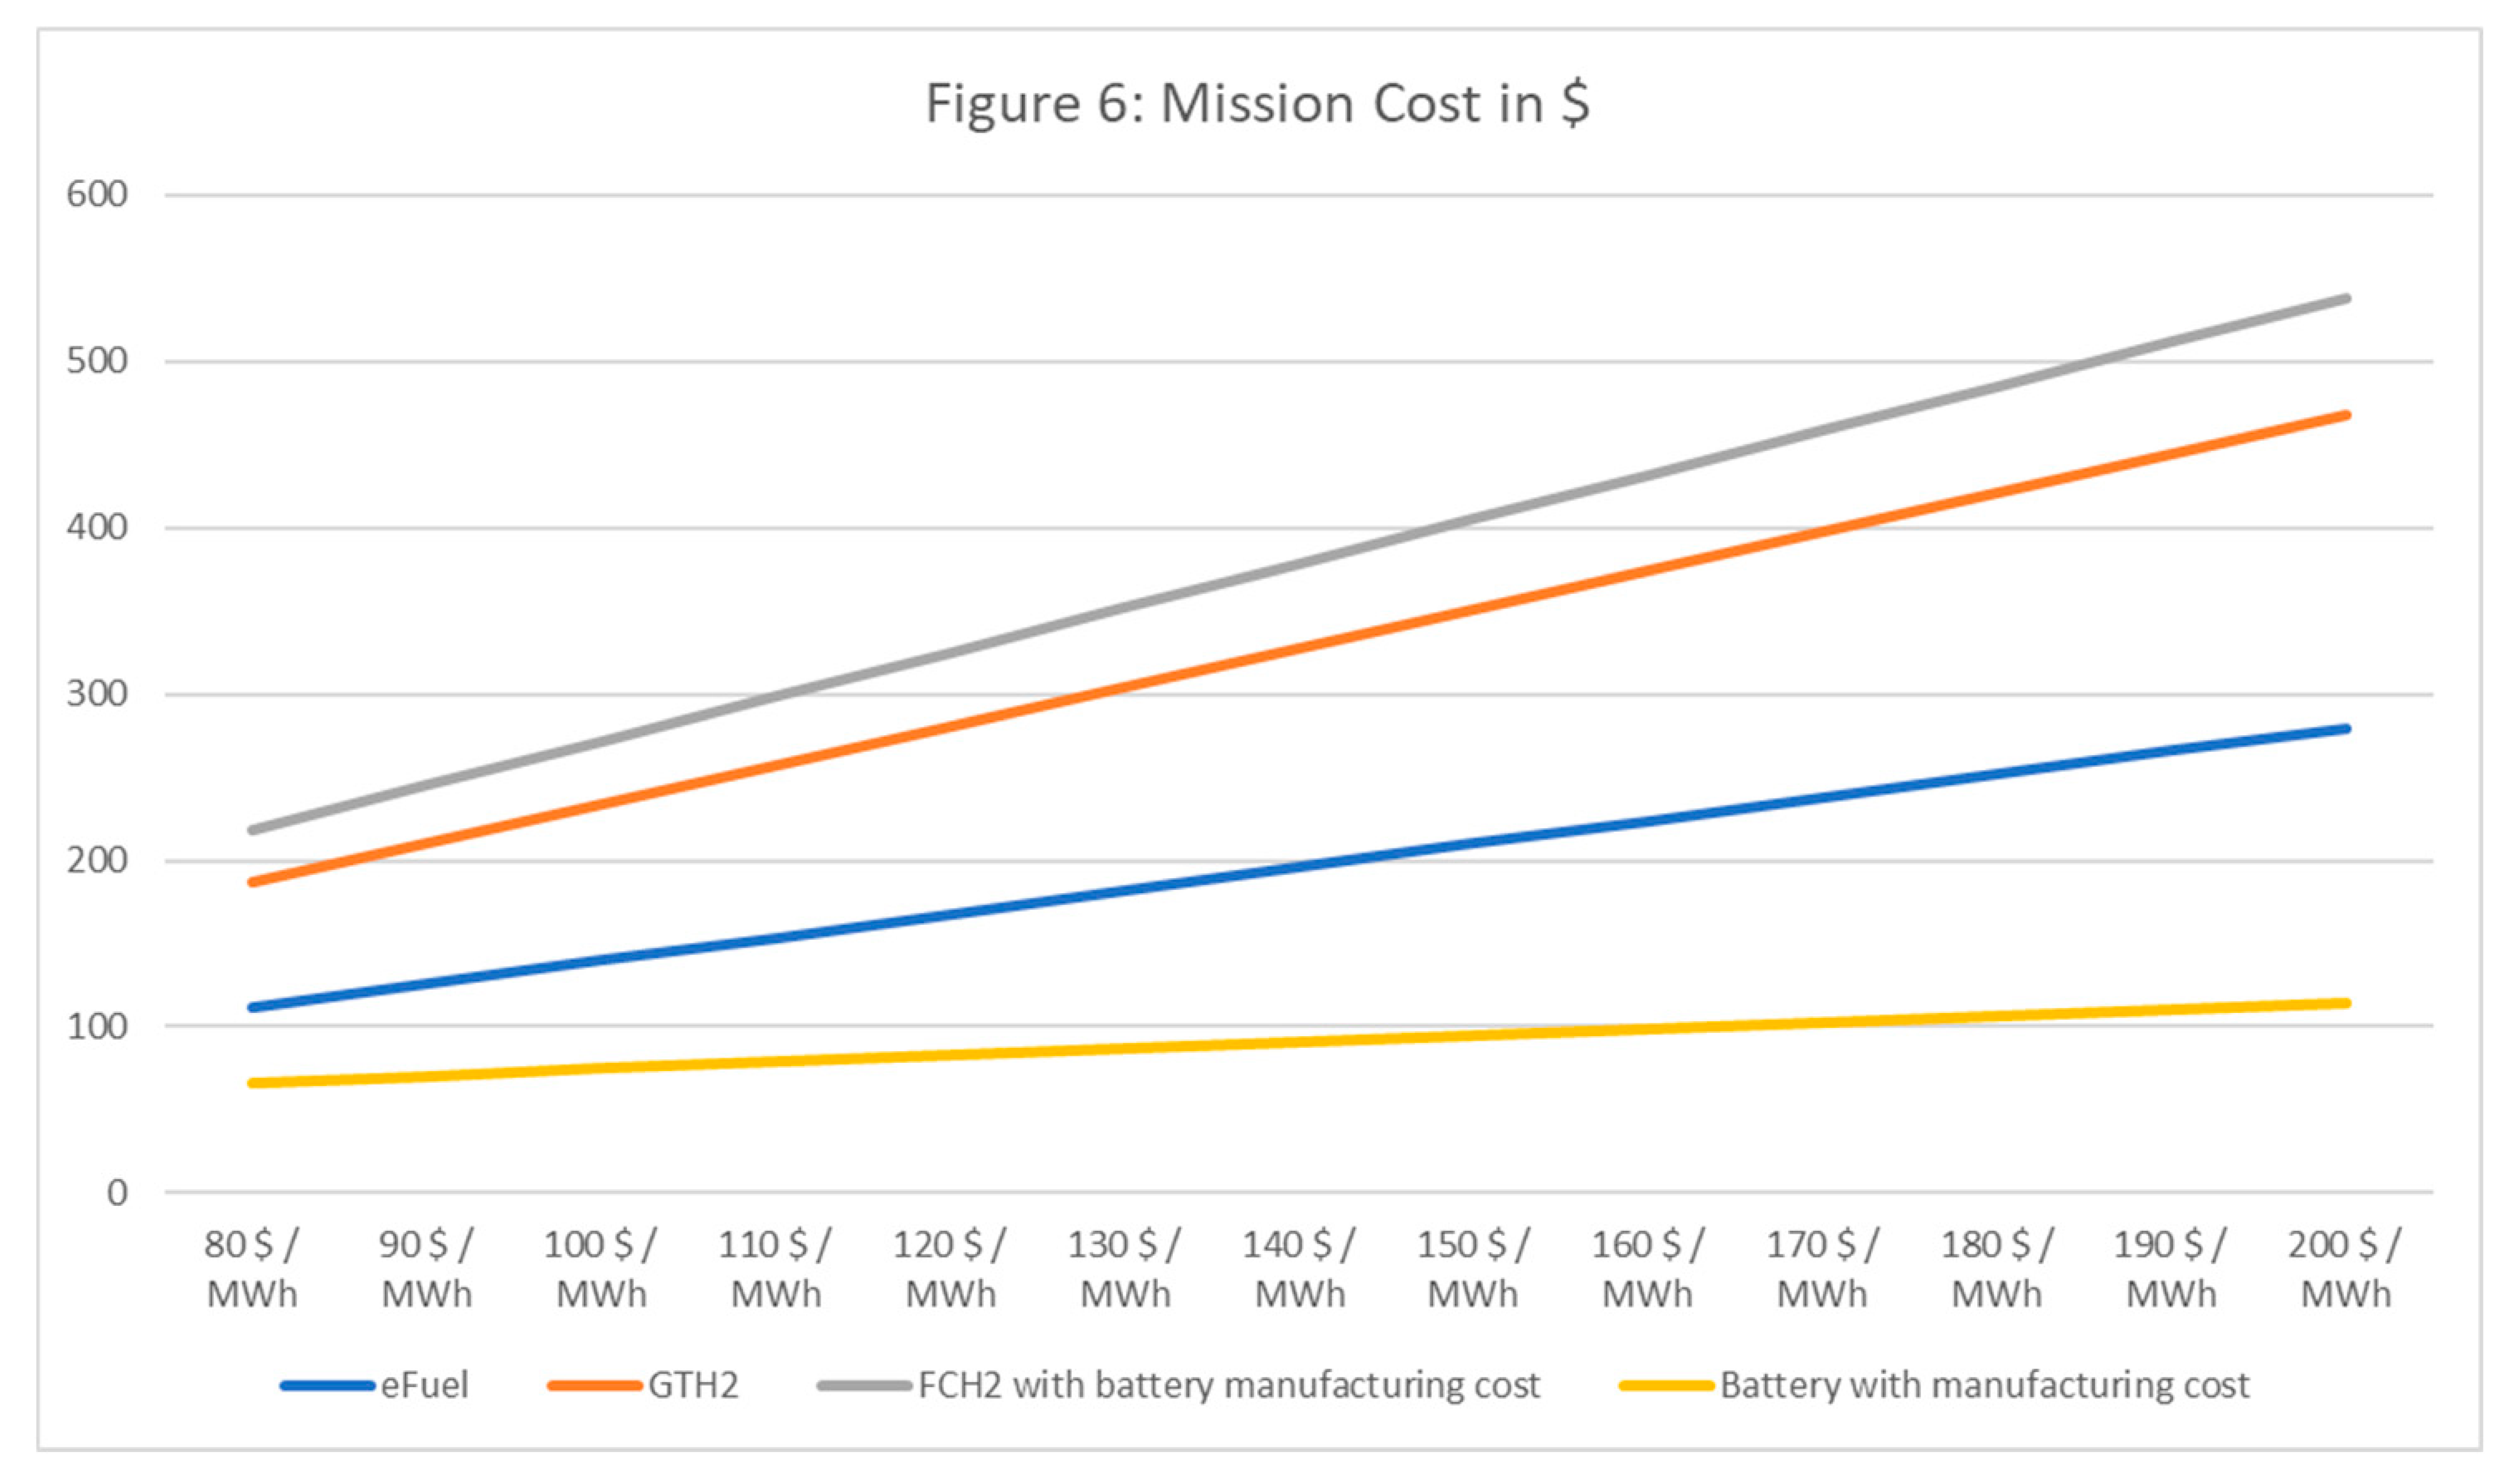
Since in our model the costs are proportional to the price of electricity, and while this could be infinite, we used the levelized full system costs of electricity applied to low carbon electricity plants with a load factor greater than 95%, so between 90 and 192
$ / MWh [
37].
Results are shown in Figure 6 above with the cost of the mission expressed in $ in the y-axis.
Whatever the price of electricity, battery electrification is the less expensive option when VTOL using H
2 either with a gas turbine or fuel cell are the most expensive options.
4. Discussion and Conclusions
In this study we compared the energy requirements of different energy vectors requiring electricity as a raw material when applied to a standard VTOL mission (4 passengers over 80 nm).
While there are various solutions when considering the implementation of renewable energy [
38], flying requires much more energy than floating or rolling and the integration effects when considering new energy vectors such as efuel, battery electrification or H
2, either coupled with a gas turbine or with fuel cells, shall be considered.
We found that energy vectors using electricity as a raw material can be directly compared, either to compare the CO2 emissions or the cost of energy when applied to a given mission.
Battery electrification should be the preferred option if the take-off weight is compatible with the payload and the range, which is in line with the conclusions of Zhang et al [
39]. However, battery electrification means heavier platforms and the opportunity of such a technology could remain limited to short distances and / or limited payload, thus in competition with public transportation and / or electric cars which are far more efficient [
16]. The impact on battery material could also be an issue as a medium and long-range aircraft often travel more than 2 million kilometers per year, consuming almost 1 battery pack per month as the average lifetime of a battery pack is 200.000 kilometers.
In all scenarios, efuel shows less CO
2 emissions and lower costs than H
2 based propulsive systems. It seems that carrying the most efficient molecule in an aircraft pays the extra energy cost spent on the ground with the Fischer-Tropsch process which combine H
2+CO
2+H
2O. This will be further investigated in future works since the VTOL requirements, such as hovering, are extremely energy demanding thus probably magnifying the results. The impacts on NOx, contrails and noise are not considered here and future works should be done to refine the FCH
2 potential for small fixed wing aircrafts which could accommodate a fuel cell. For larger aircrafts which would require a significant amount of power, thus switching from fuel cell to gas turbine to use the H
2, the eFuel option should be preferred in an energy perspective. Moreover, carrying H
2 over long distances is inefficient [
14] while eFuel characteristics are similar to fossil fuel, so it can travel easily and could manufactured in various locations before being transported. As the aviation industry intends to decarbonize its energy, the H
2 option is not only the most expensive, but it seems to be at risk since the cost of LH
2, which needs to be produced where it will used, could vary significantly. While efuel could be produced in areas where electricity prices remain low before being transported to the point of use, the need for H
2 to be produced locally could significantly harm the cost for airlines in countries where electricity prices are high as shown in Figure 7 below. In figure 7 we apply the price of electricity (€/kWh) of 3 European countries, using data from Statista [
40], respectively 150, 260 and 440 € per MWh in France, Germany, and Denmark.
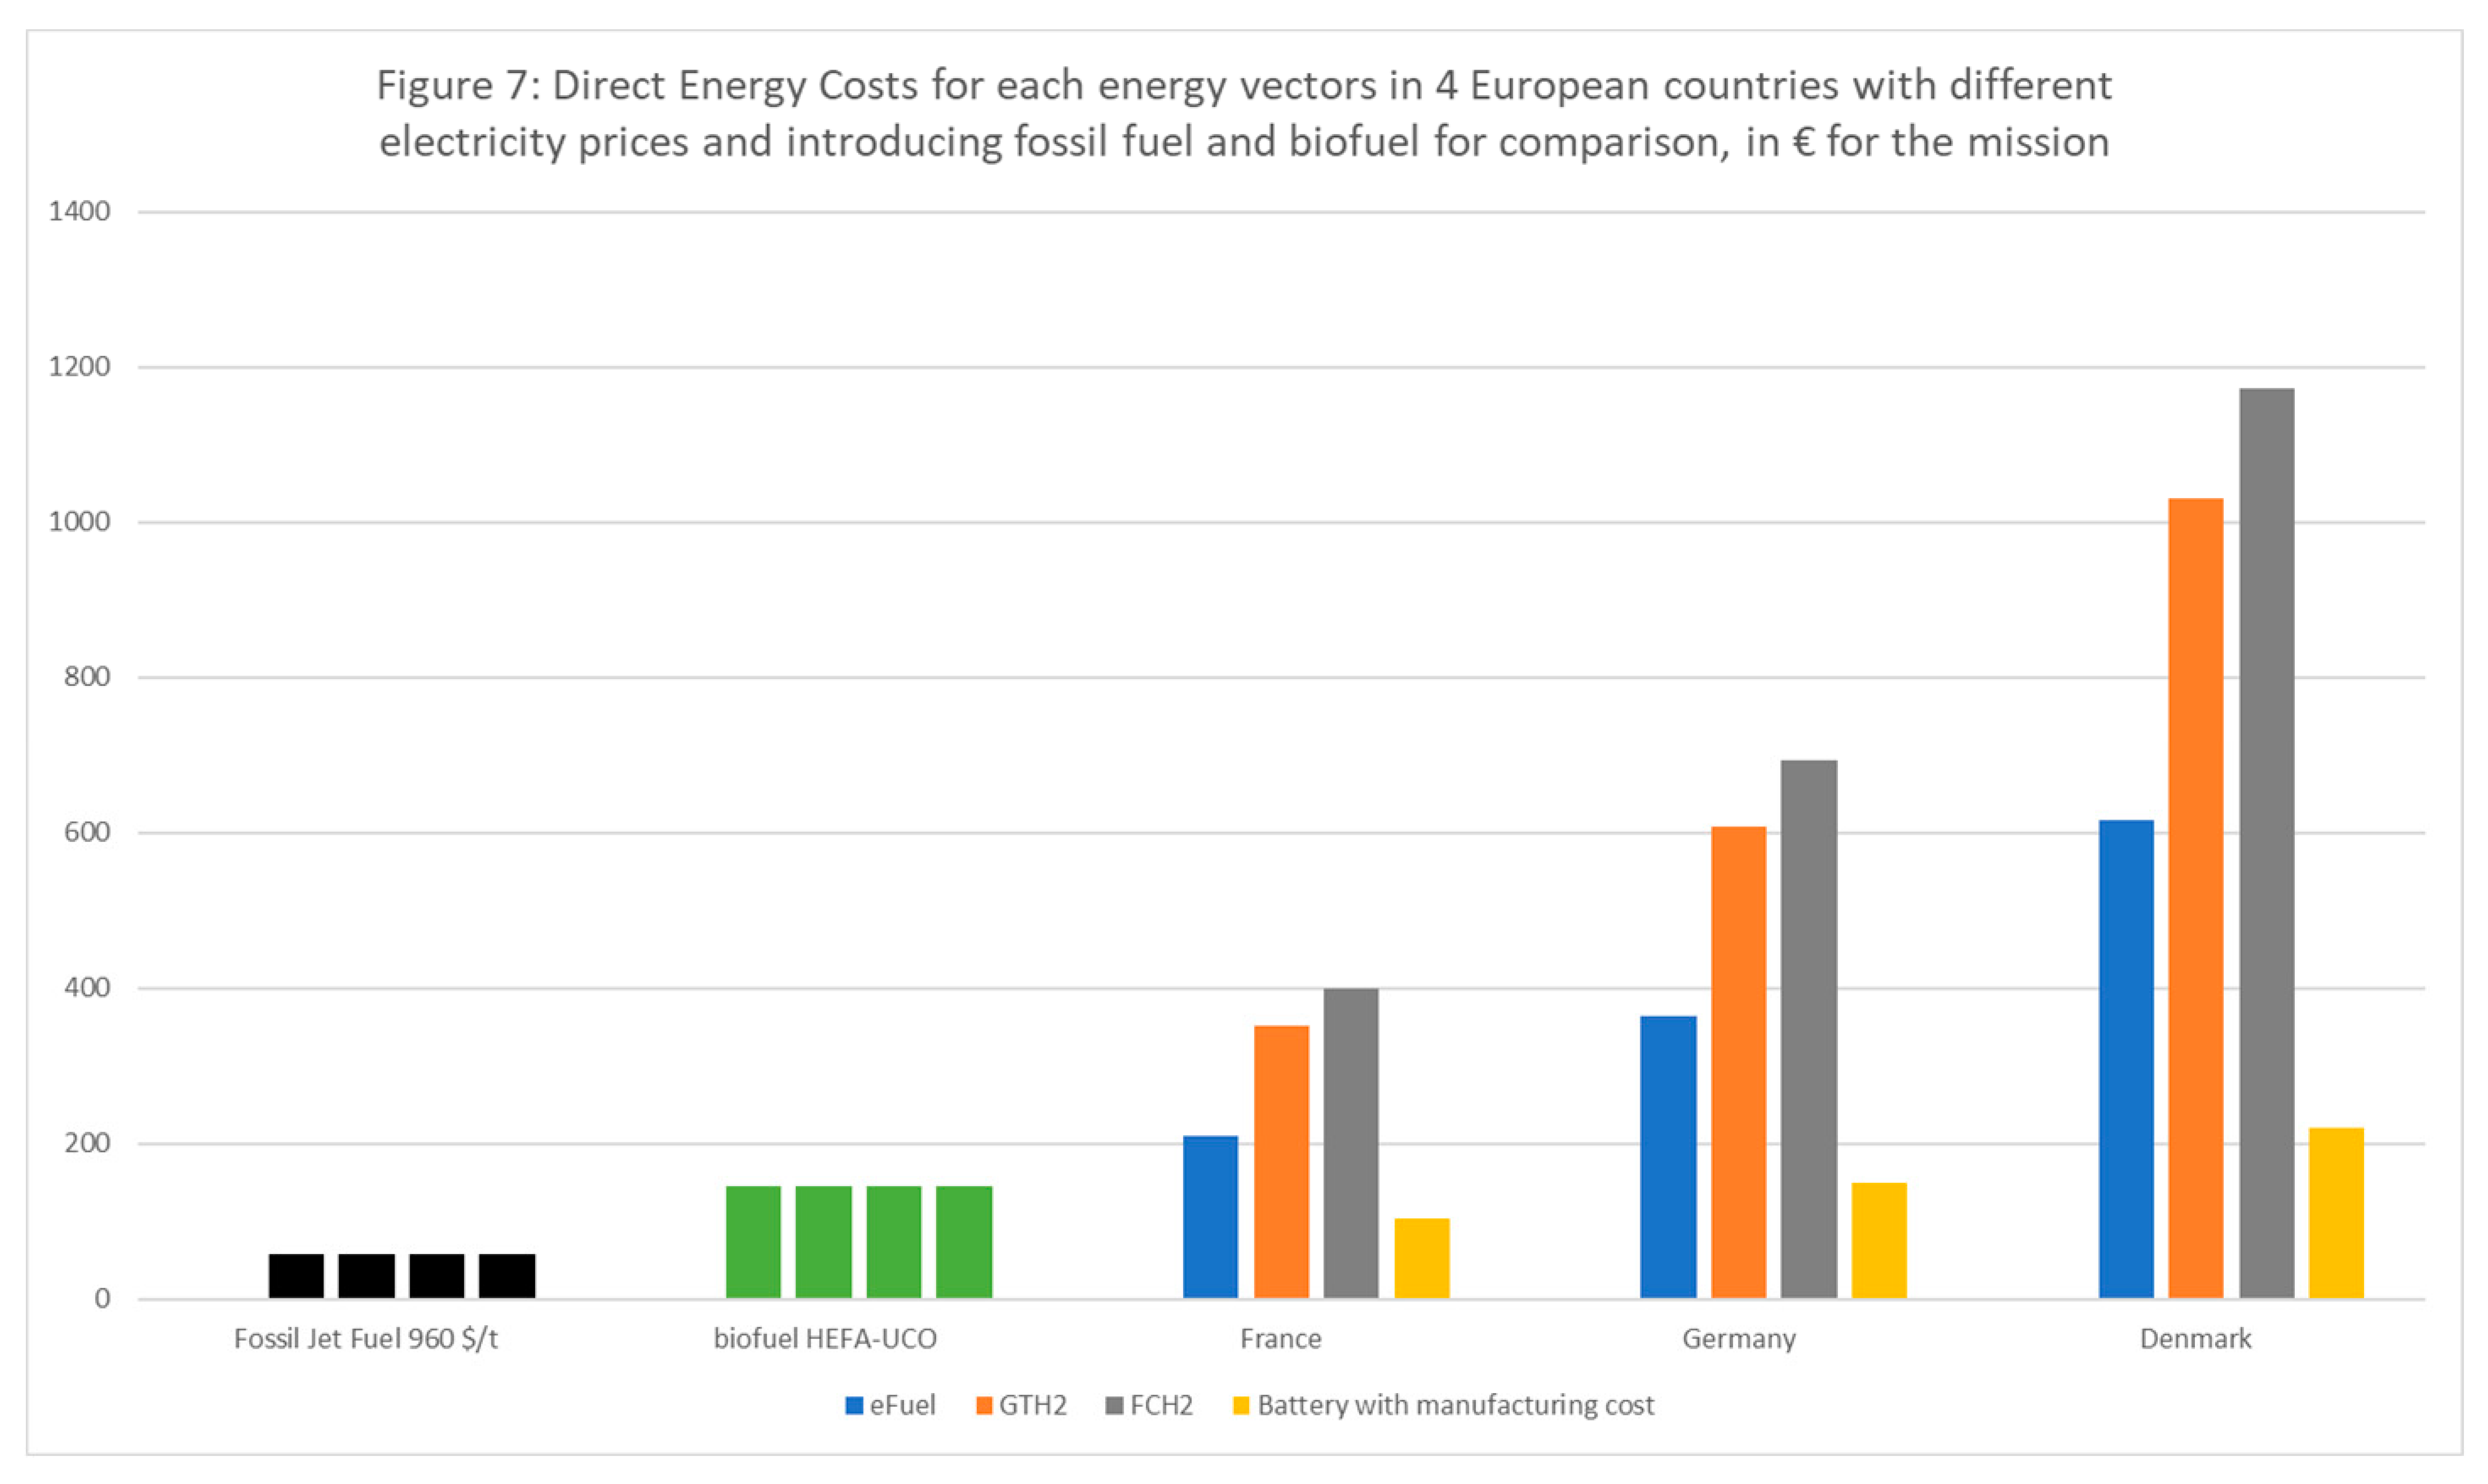
One can notice that fossil fuel remains the cheapest option, but also that biofuel can compete with battery electrification. More interestingly, a country with high electricity prices such as Denmark could consider importing efuel from France where electricity is much cheaper to optimize the mission cost.
Even as efuel seems to be the most efficient option in most scenarios, the impact on the electricity production should be considered. The European Union recently set the objective of 35% of RFNBO in its ReFuel EU regulation for 2050 [
41] and this will most probably be efuels. Would Europe require 50 Mt of Jet Fuel by 2050, this translates in 17.5 Mt of efuel. With a selectivity of 60% [
9], 37 TWh of electricity would be required per Mt of efuel for air mobility, or close to 650 TWh. In 2022 the EU produced 2641 TWh of which 23.5% of wind and solar, or 607 TWh [
42]. The production of efuel at scale would require significant amount of low carbon electricity and could therefore foster conflict of use issues. These conclusions are shared with [
7] and this will be further investigated in future works.
Supplementary Materials
The following supporting information can be downloaded at the website of this paper posted on Preprints.org.
Author Contributions
Conceptualization, JB Jarin; methodology, JB Jarin; software, S Beddok; validation, JB Jarin, S Beddok; formal analysis, JB Jarin, S Beddok; investigation, JB Jarin, S Beddok; resources, JB Jarin; data curation, JB Jarin, S Beddok; writing—original draft preparation, JB Jarin; writing—review and editing, JB Jarin, C Haritchabalet; visualization, JB Jarin; supervision, C Haritchabalet; project administration, JB Jarin, C Haritchabalet; funding acquisition, non-applicable. All authors have read and agreed to the published version of the manuscript.
Funding
This research received no external funding, the APC was funded by the University of Pau.
Data Availability Statement
We encourage all authors of articles published in MDPI journals to share their research data.
Conflicts of Interest
The authors declare no conflict of interest.
References
- Lee et al; The contribution of global aviation to anthropogenic climate forcing for 2000 to 2018, Atmospheric Environment, 2021. [CrossRef]
- ATAG Waypoint 2050 report, 2021, page 5 https://aviationbenefits.org/media/167418/w2050_v2021_27sept_summary.pdf.
- Tjandra et al, GHG reduction study for the rotorcraft industry, 76th Annual Forum & Technology Display Vertical Flight Society, 2020, page 7; https://hal.science/hal-03225084.
- Dahal et al, Techo-economic review of alternative fuels and propulsion systems for the aviation sector, Renewable and Sustainable Energy review, 2021. [CrossRef]
- Cazaurang et al, Introduction: UAVs and VTOL Mutli-Copter platforms, I.1., 2020. [CrossRef]
- Lark et al, Environmental outcomes of the US Renewable Fuel Standard, National Academy of Science, PNAS, 2022 https://www.pnas.org/doi/full/10.1073/pnas.2101084119].
- Becken et al, Implications of preferential access to land and clean energy for Sustainable Aviation Fuels, Science of the Total Environment, 2023. [CrossRef]
- Grahn et al, Review of electrofuels feasibility, Progress in Energy 4 032010, 2022, https://iopscience.iop.org/article/10.1088/2516-1083/ac7937/meta.
- Rapport de l’Académie des Technologies, la décarbonation du secteur aérien par la production de carburants durables, 2023, pages 54-58; https://www.academie-technologies.fr/wp-content/uploads/2023/03/Rapport-decarbonation-secteur-aerien-production-carburants-durables-AT-Mars-2023.
- European Parliament, September 2023, available online https://www.europarl.europa.eu/news/en/press-room/20230911IPR04913/70-of-jet-fuels-at-eu-airports-will-have-to-be-green-by-2050.
- Rojas-Michaga et al, Sustainable aviation fuel production through power-to-liquid: a combined techno-economic and life cycle assessment, Energy Conversion and Management, 2023. [CrossRef]
- Schmidt et al, Power to Liquids as renewable fuel option for aviation, Chemie Ingenieur Technik, 2018. [CrossRef]
- Younas et al, An Overview of Hydrogen Production: Current Status, Potential, and Challenges, Fuel, 2022. [CrossRef]
- Galimova et al, Impact of international transportation chains on cost of green e-hydrogen: Global cost of hydrogen and consequences for Germany and Finland, Applied Energy, 2023. [CrossRef]
- Information on the VTOL Bell 505, Airbus H120, Bell 429 and Leonardo 169 can be found on the manufacturers websites: https://www.bellflight.com/products/bell-505]; https://www.airbushelicopters.ca/product/h120/]; https://www.bellflight.com/products/bell-429; https://helicopters.leonardo.
- Liberacki et al, The Environmental Life Cycle Costs of Urban Air Mobility as an input for sustainable urban mobility, Journal of Cleaner Production, 2023. [CrossRef]
- Seber et al, Uncertainty in life cycle greenhouse gas emissions of sustainable aviation fuels from vegetable oils, Renewable and Sustainable Energy reviews, 2022. [CrossRef]
- Commission delegated regulation, EC Europa, 2023, page 2; https://energy.ec.europa.eu/system/files/2023-02/C_2023_1086_1_EN_annexe_acte_autonome_part1_v4.pdf.
- Shahriar, The current techno-economic, environmental, policy status and perspectives of sustainable aviation fuel (SAF), Fuel, 2022; [CrossRef]
- Boehm et al, Lower heating value of jet fuel from hydrocarbon class concentration data and thermo-chemical reference data: An uncertainty quantification, Fuel, 2022. [CrossRef]
- Reick et al, Influence of Charging Losses on Energy Consumption and CO2 Emissions of Battery-Electric Vehicles, Special Issue Advanced Battery States Estimation and Charging Techniques for Electric Vehicles, 2021. [CrossRef]
- HGalimova et al, Impact of international transportation chains on cost of green e-hydrogen, Applied Energy, 2023. [CrossRef]
- Younas et al in, An Overview of Hydrogen Production: Current Status, Potential, and Challenges an overview of hydrogen production, Fuel, 2022. [CrossRef]
- Al Ghafri et al, Hydrogen liquefaction: a review of the fundamental physics, engineering practice and future opportunities, Energy and Environmental Science, 2022. [CrossRef]
- Pio et al, Decarbonizing the aviation sector with Electro Sustainable Aviation Fuel (eSAF) from biogenic CO2 captured at pulp mills, Chemical Engineering Journal, 2023. [CrossRef]
- Howe et al, Environmental life cycle assessment of commercial passenger jet airliners, Transport and Environment, 2013. [CrossRef]
- Jakovljevic et al, Carbon dioxide emission during the life cycle of turbofan aircraft, Energy, 2018. [CrossRef]
- Ellingsen et al, Life cycle assessment of battery electric buses, Transport and Environment, 2022. [CrossRef]
- Dai et al, Life Cycle Analysis of Lithium-Ion Batteries for Automotive Applications, Batteries, 2019. [CrossRef]
- Lutsey and Nicholas, Update on electric vehicle costs through 2030, ICCT, 2019. [CrossRef]
- Graf et al, Low pressure influence on a direct fuel cell battery hybrid system for aviation, International Journal of Hydrogen Energy, 2023. [CrossRef]
- Manigandan et al, Role of hydrogen on aviation sector: A review on hydrogen storage, fuel flexibility, flame stability, and emissions reduction on gas turbines engines, Fuel, 2023. [CrossRef]
- Park et al, Techno-economic analysis for the electric vehicle battery aging management of charge point operator, Energy, 2023. [CrossRef]
- You et al, Nonlinear aging knee-point prediction for lithium-ion batteries faced with different application scenarios, eTransportation, 2023. [CrossRef]
- Scarlat et al, Quantification of the carbon intensity of electricity produced and used in Europe, Applied Energy, 2022. [CrossRef]
- Regulation of the European parliament and of the council on ensuring a level playing field for sustainable air transport https://eur-lex.europa.eu/resource.html?uri=cellar:00c59688-e577-11eb-a1a5-01aa75ed71a1.0001.02/DOC_1&format=PDF.
- Idel, Levelized Full System Costs of Electricity, Energy, 2022. [CrossRef]
- Connolly et al, A comparison between renewable transport fuels that can supplement or replace biofuels in a 100% renewable energy system, Energy, 2014. [CrossRef]
- Zhang et al, Techno-economic-environmental evaluation of aircraft propulsion electrification: Surrogate-based multi-mission optimal design approach, Renewable and Sustainable Energy Reviews, 2023. [CrossRef]
- Statista, the price of electricity in most European countries, website accessed on November 12th 2023, https://fr.statista.com/infographie/30253/comparaison-prix-electricite-pour-les-industriels-entreprises-par-pays-en-europe/.
- European Union press release September 13th 2023, website accessed on November 12, 2023; https://www.europarl.europa.eu/news/en/press-room/20230911IPR04913/70-of-jet-fuels-at-eu-airports-will-have-to-be-green-by-2050.
- European Council, How is electricity produced and sold, website accessed on November 12, 2023; https://www.consilium.europa.eu/en/infographics/how-is-eu-electricity-produced-and-sold/.
|
Disclaimer/Publisher’s Note: The statements, opinions and data contained in all publications are solely those of the individual author(s) and contributor(s) and not of MDPI and/or the editor(s). MDPI and/or the editor(s) disclaim responsibility for any injury to people or property resulting from any ideas, methods, instructions or products referred to in the content. |
© 2023 by the authors. Licensee MDPI, Basel, Switzerland. This article is an open access article distributed under the terms and conditions of the Creative Commons Attribution (CC BY) license (http://creativecommons.org/licenses/by/4.0/).


