1. Introduction
The pneumatic artificial muscle (PAM), well known as the McKibben actuator, was invented by Richard Gaylor in 1958 [
1,
2]. The actuator was used by Joseph L. McKibben for an artificial limb of a disabled person.
PAM reproduces the behavior of skeletal muscles by generating pulling force when they are pressurized [
3,
4].
In the literature, some studies generate an equivalent kinematic model of the PAM. The most modeled muscle is the McKibben muscle, which consists of an inner tube covered by a braided shell [
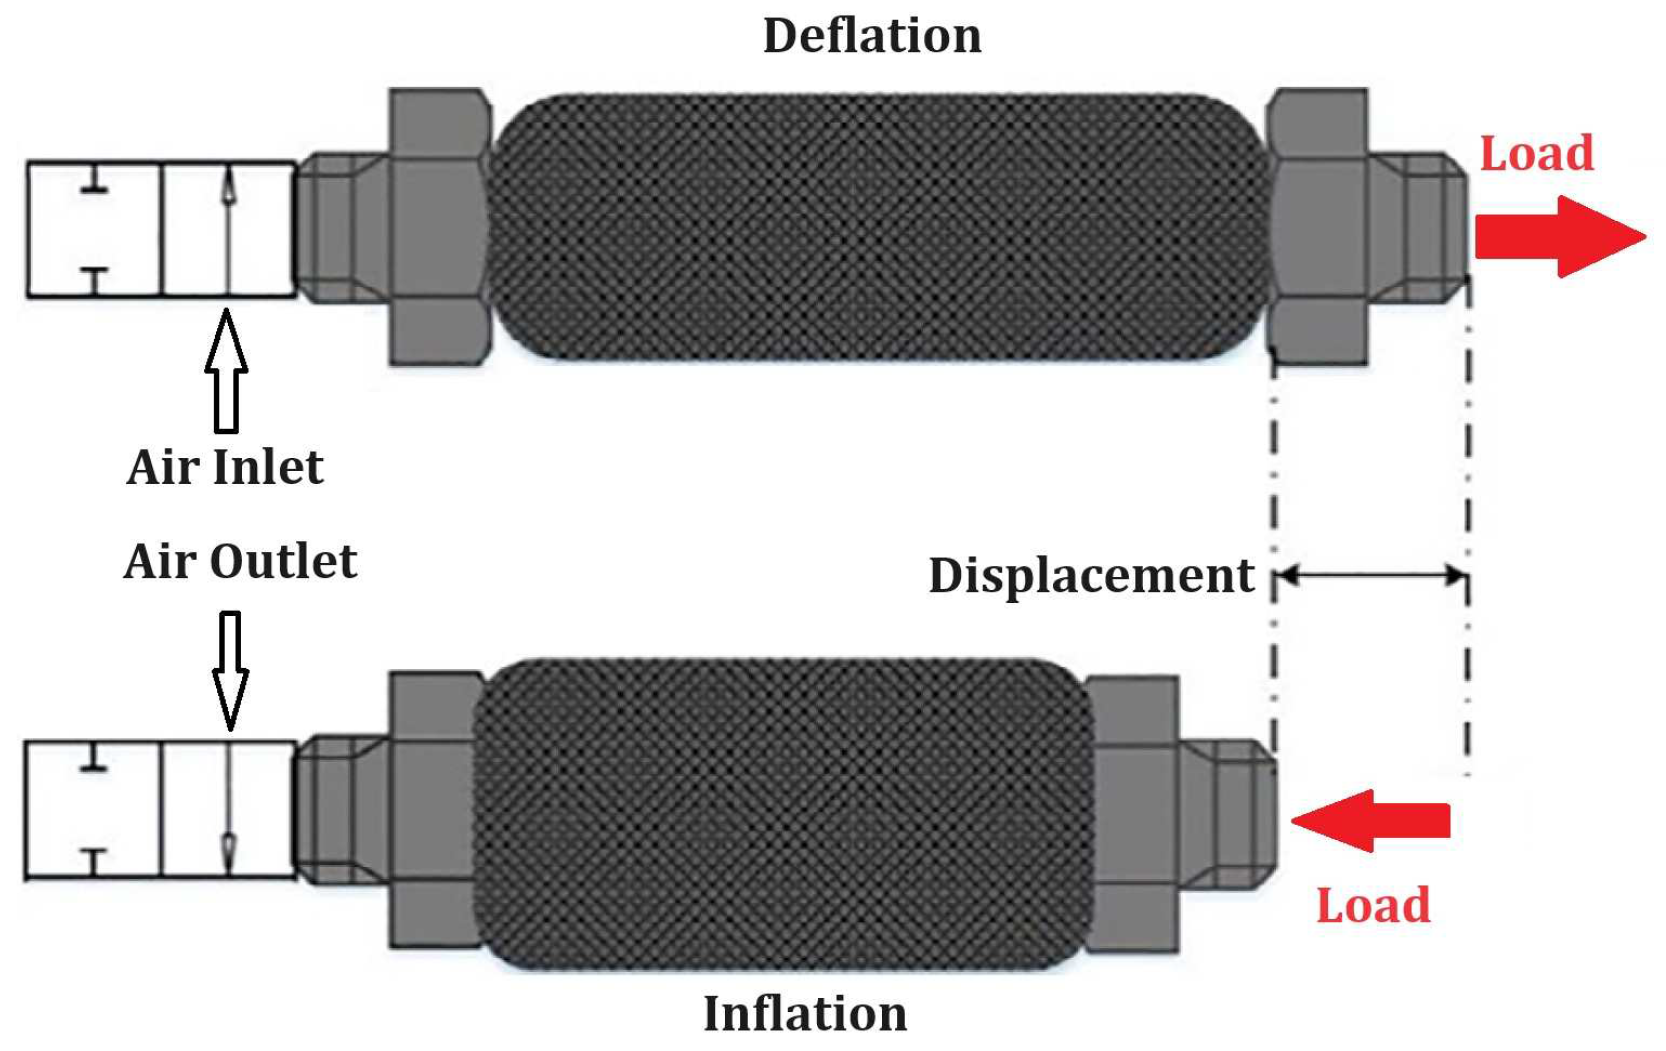
5]. The inner tube is usually made of an elastomeric material that allows large deformations under relatively small pressures. The functioning principle is illustrated in
Figure 1 [
3].
Thus, when the PAM is filled with compressed gas, it expands into a radial direction and contracts in axial direction, generating a significant force (for example FESTO DMSP-40-9000N the maximum theoretical force is up to 6000 [N] – [
6]). The threads are almost inextensible.
Over time, the most underlined advantages of PAM were high force-to-weight ratio, flexibility, no mechanical vibration, smooth speed adjustment [
7], longer operating life (for example FESTO DMSP-40-9000N has the 1 million load cycles endurance limit at 6000N – [
6]) relatively low cost compared to classical pneumatic actuators. However, the most challenging problem is still the highly non-linear characteristics due to compressibility of air and the properties of elastic material. These are the reasons that make PAM difficult to model and control, with relatively low repeatability accuracy.
During the last years significantly increase the application for these actuators. Thus, they are appropriated to be used as compliant actuators in rehabilitation application such as robots [
8,
9], elbow exoskeletons [
10,
11], and medical devices [
12,
13]. They have also been used in manipulators [
14,
15] driving systems because of the main advantage: a higher power/ weight ratio [
16].
All these researches are focused to solve or compensate PAM's hysteresis, caused by friction within the braiding nets and between the braiding nets and the rubber tube. This disadvantage determines a significant reduction of positional control accuracy [
17,
18,
19,
20,
21,
22].
There is significant research that indicates that the higher modeling accuracy of PAM (including the hysteresis model), the better performance for the trajectory control [
18]. Thus, it becomes crucial both from a technical and cost point of views, to obtain a precise mechanical model for PAM. In literature modeling of PAM has two approaches. The first one is the empirical model regardless of the mechanical nature of the inner tube that describes the relationship between applied pressure and generated force [
4]. These analyses were done by Gaylord (a double helix braided pneumatic muscle) [
2], Wickramatunge and Leephakpreeda (model based on a calibrated spring) [
23], Song et al. (Artificial Neural Network model) [
24], Reynolds (three-element model consisting of a contractile force generating, a spring element and a damping element) [
25] or Zhang et al. (finite element model that simulates the dynamic behavior of PAMs) [
26].
The second approach takes into consideration the mechanical nature of the inner tube and also all the surrounding elements. There are also here different concepts included: energy conservation [
27], the relation between inflation pressure and actuation force or elastic energy effect on PAM force. A different approach is that in [
3] where is developed a model based on the theory of limiting chain extensibility, a model available for McKibben PAMs.
Thus, in conclusion, there is a great challenge to obtain satisfactory control performance of a PMA-driven devices especially because of the highly nonlinear, time-varying, hysteresis properties of this type of actuator [
28,
29].
2. Static Model
The working principle of PAMs is based on three parameters: internal pressure, loading force and relative shortening (the degree of muscle shortening).
The tube of a PAM can be considered a thick-walled circular cylinder (
Figure 2) [
3].
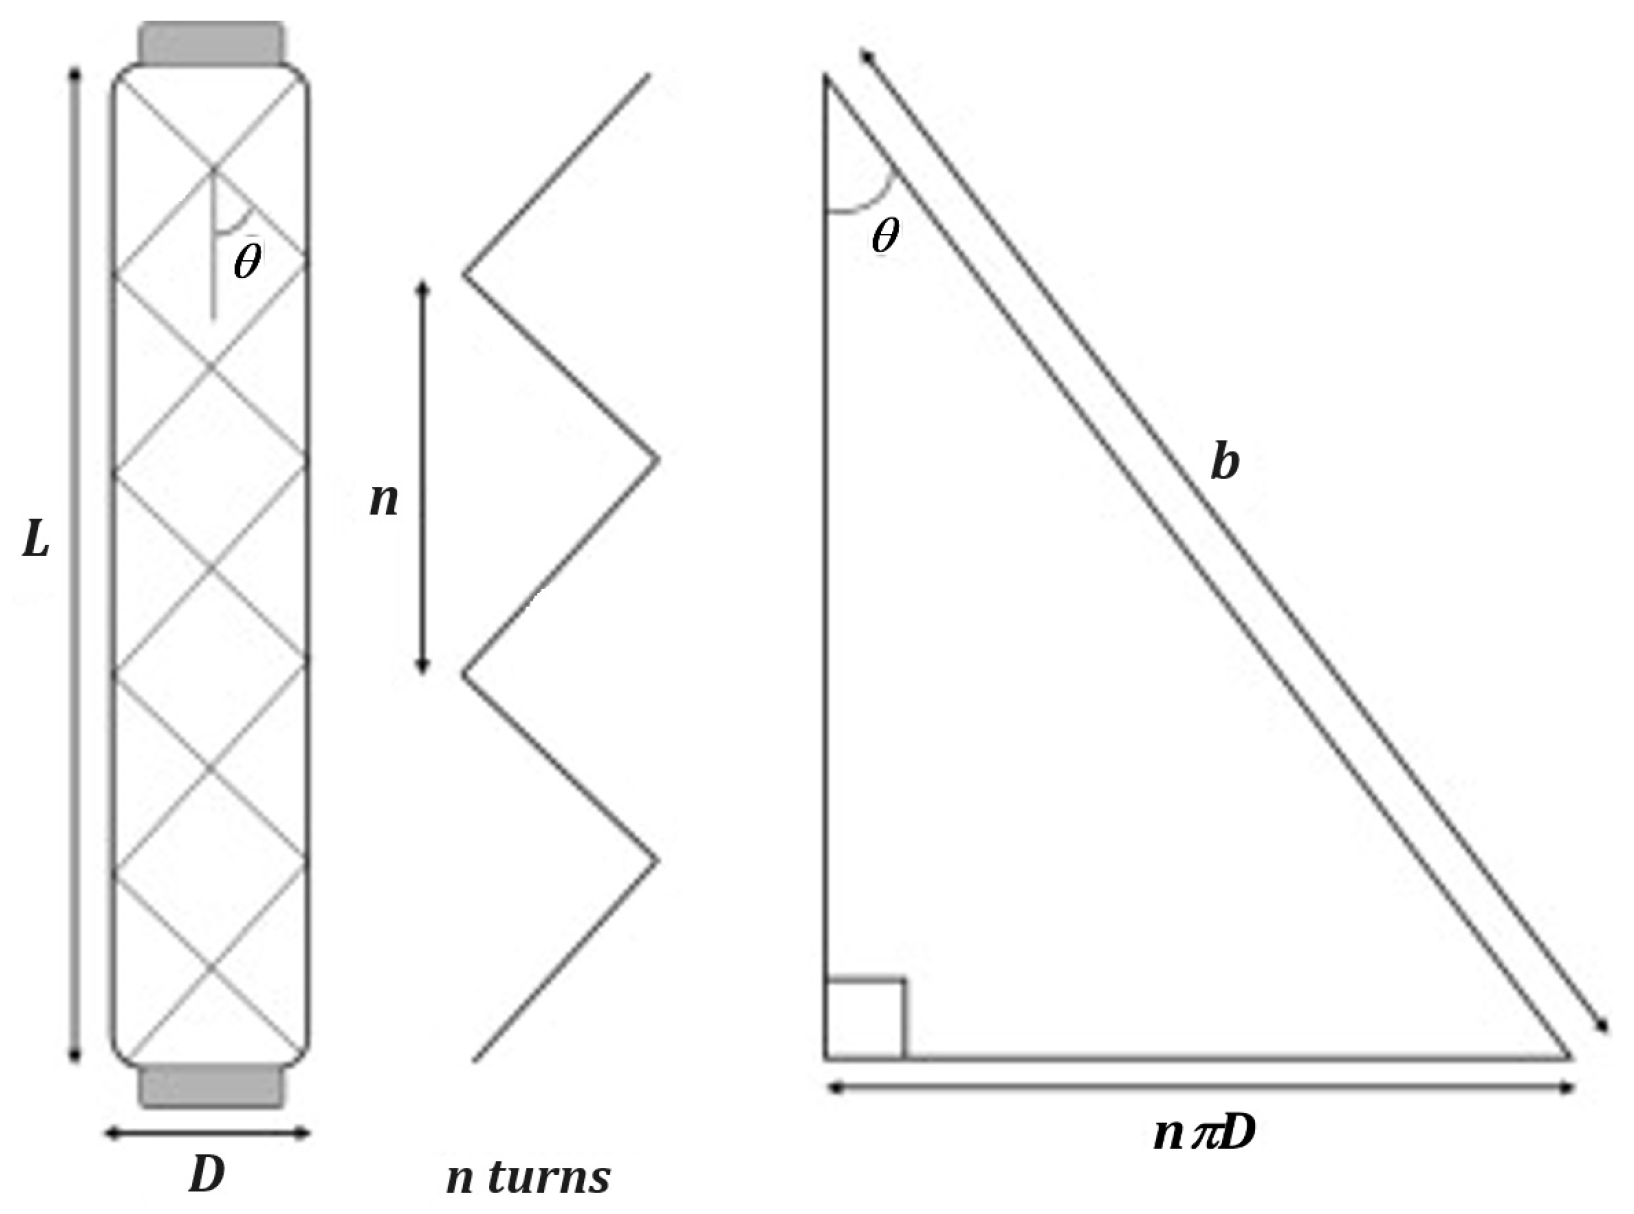
The static model is derived from principle of virtual mechanical work (
Figure 3), based on the manufacturing principle of the PAM.
The feature are: L is the PAM’s length; D - diameter; b – length of muscle’s thread; n – turns of thread; θ - net’s angle (between thread and cylinder axis). Static model may be determined by neglecting the non-cylindrical parts of PAMs and losses. Considering this hypothesis, the net angle is directly dependent on the inflation degree, and b and n are maintaining constant.
The volume of the associated cylinder is:
To determine the force of PAM as function of input pressure and length it should be applied the conservation of mechanical energy. To do that there may. Thus
result
where: P
abs is absolute inner pressure; P
atm – atmospheric pressure; P
m – measured pressure; s
i – total inner surface; ds – surface vector; dl
i – change in length of inner surface; dV – change in volume.
Mechanical energy at the output is generated by muscle contraction as response of volume change:
Knowing the mechanical energy conservation principle:
Thus, based on relations (5) and (7)
Using the geometric relations to determine the volume variation relative to length, (9) becomes:
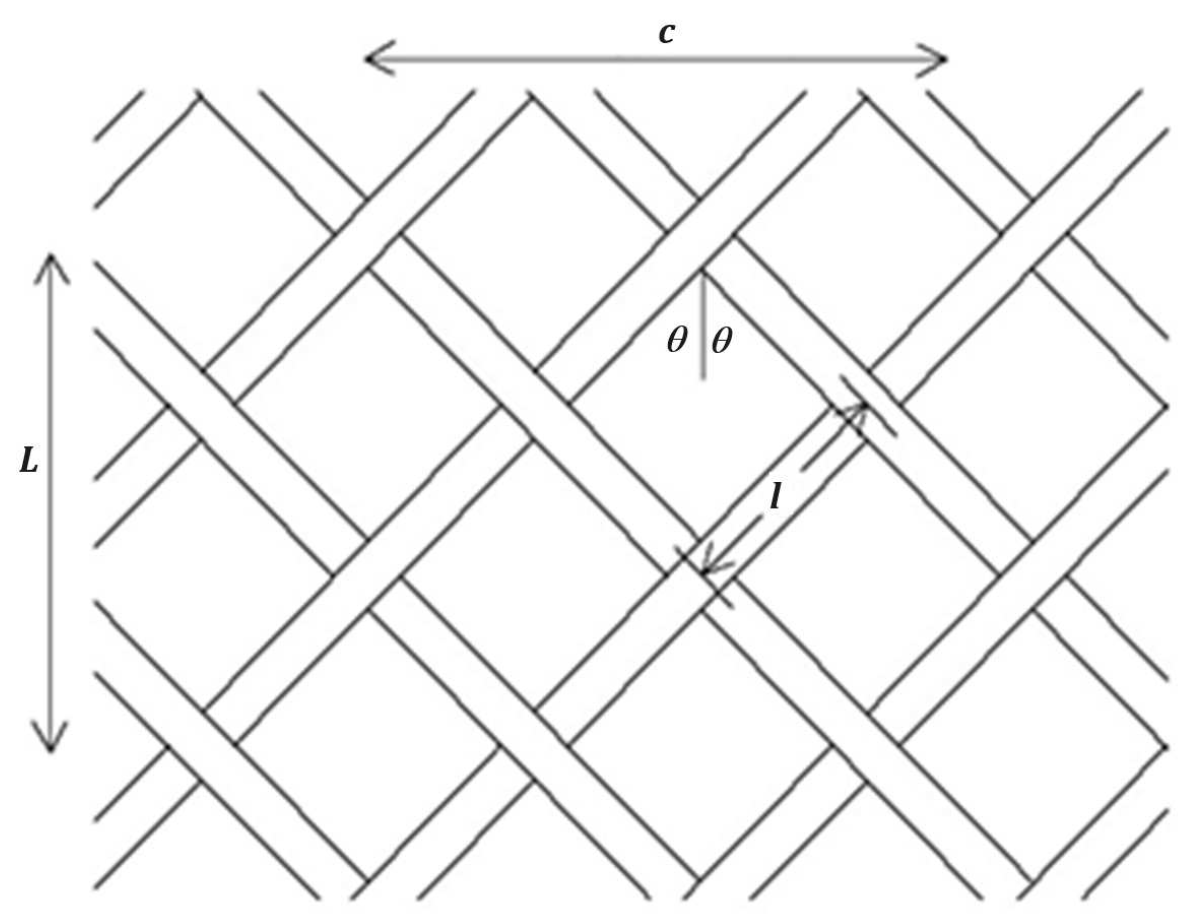
The lattice of PAM is shown in
Figure 4.
To determine the length of muscle’s thread and the number of turns, there should be known the number of rhombus in both directions (n
L, respectively n
C). Thus,
Considering eq. (1), (2), (11) and (12), it may be determined:
According to (13) and (14), to characterize a PAM are necessary only the parameters of the rhombus.
The above results are obtained considering the maximum value of θ. To be able to implement control, the mathematical model should not be get based on this angle because it is extremely difficult to be measured during running. It is much easier to measure, for example, the length of the muscle. So, for the simulation and control stage, these equations should only be written as force, pressure, and length dependence, measurable quantities at any moment of operation. This dependence may be determined using geometric equations resulted from
Figure 3.
Substituting (15) and (16) into (3) and (10) results in the volume and force of PAM:
Thus, as resulted in (18) the PAM has a behavior similar to that of a variable stiffness spring. The stiffness is determined as follows:
Considering P
m deduced from (10) the stiffness will be:
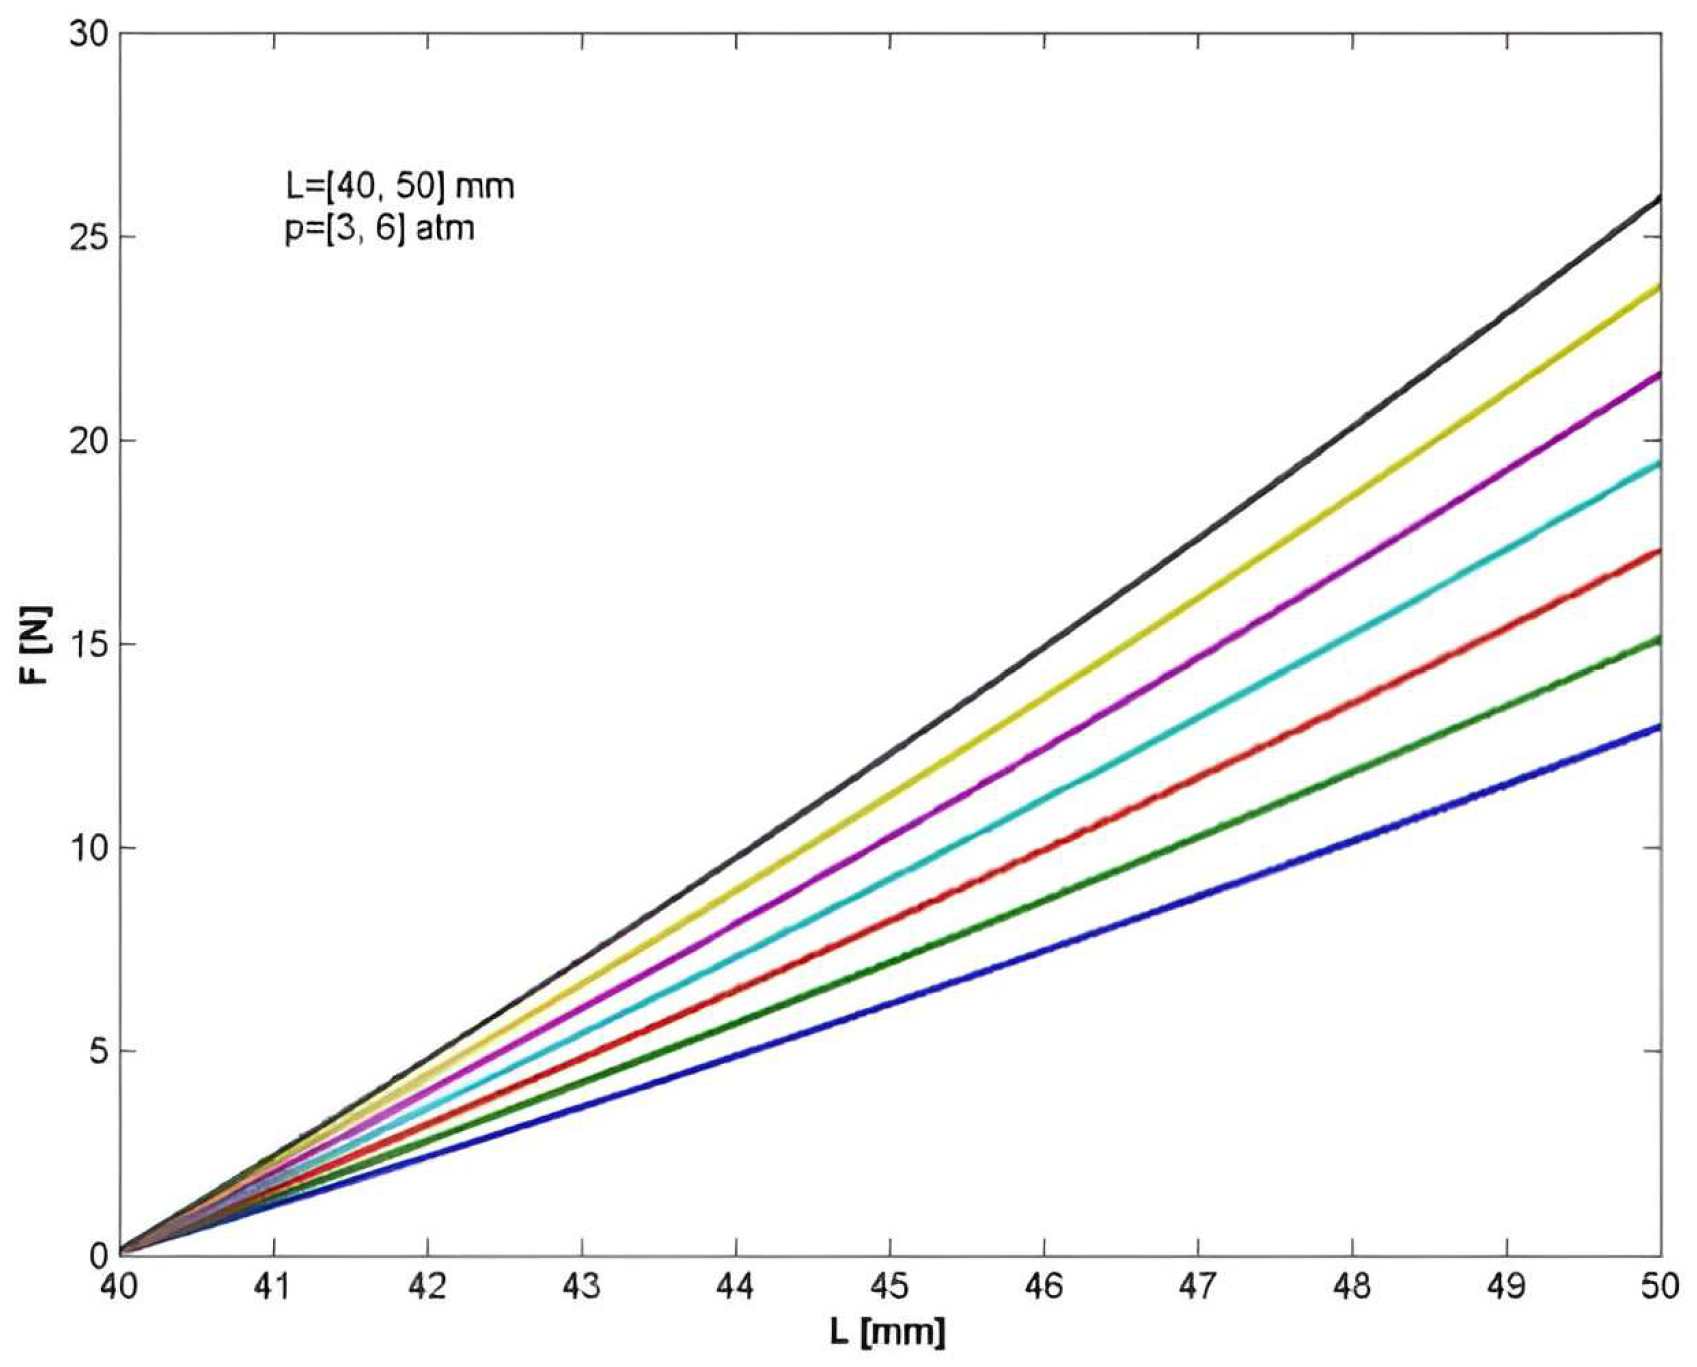
Using the model, there may be done some theoretical simulations (in Matlab) to raise the characteristics of stiffness (
Figure 5) and force (
Figure 6) related to the length of PAM (between 40 and 50 [mm]), diameter (higher than 10[mm]) and input pressure (between 3 and 6 [bar]).
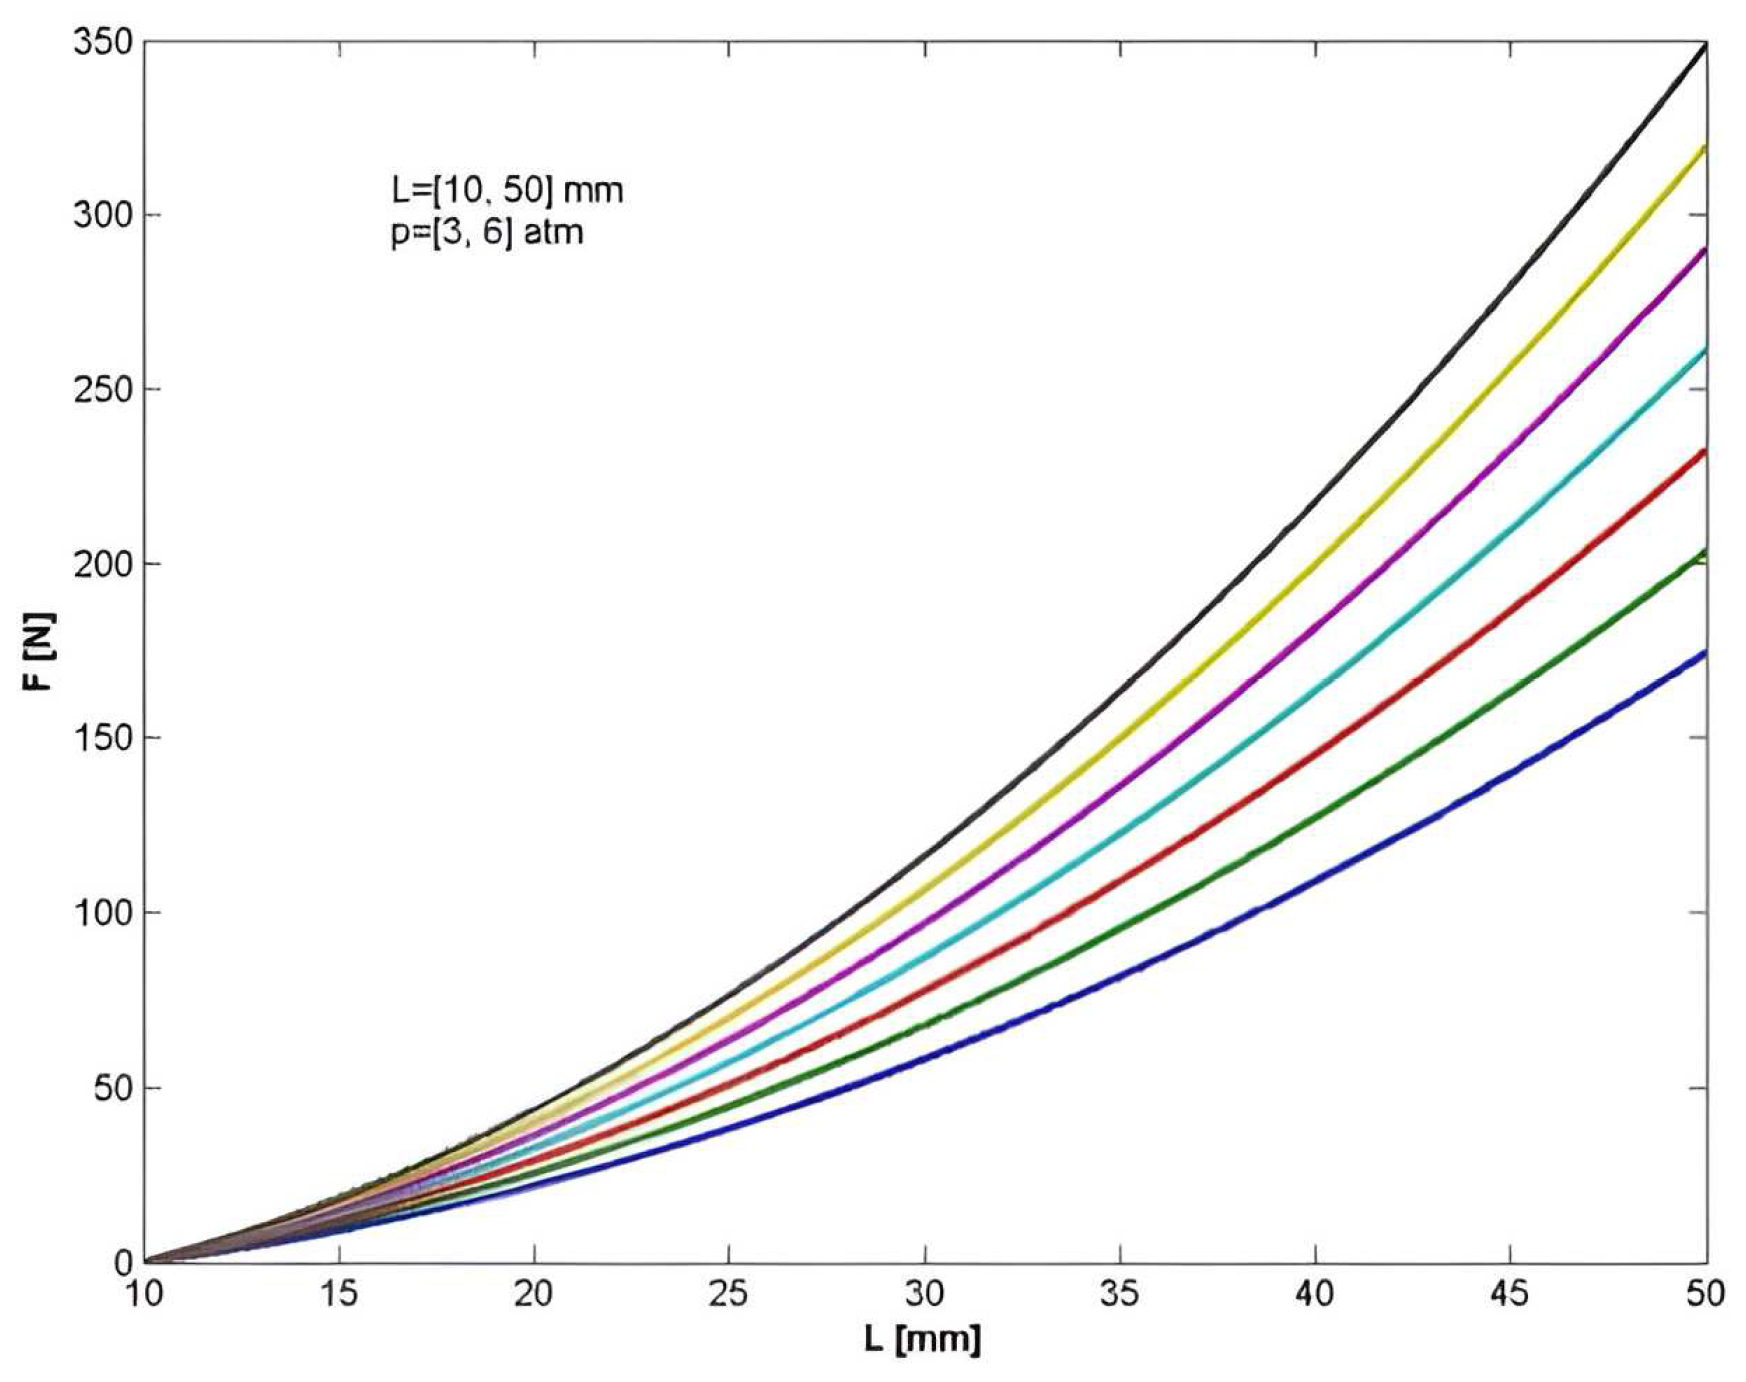
Force has a nonlinear variance with length, better underlined if the length of the muscle varies between 10 and 50 [mm] (
Figure 7).
The model described above does not consider the hysteresis determined by the ends of PAM. Therefore, it should be introduced an effectiveness term into the model. This term represents the measure of what percentage the actual force is to the predicted. The dependence between the force output and the length of PAM (
Figure 7) certifies that the effectiveness is a function of pressure [
30].
where: F
a is the actual force; E
f – effectiveness; F
th – theoretical force.
To the above model it will be improves if there will be added the end effects. In other words to model the long-end effect that occurs when the actuator is inflated. The solution is given by the mechanical properties of the PAM’s materials because the stiffness of the braiding material is very high relative to actuator’s stiffness (at maximum length). This behavior may be associated with one of very high-stiffness spring.
The model (18) predicts that if the length is smaller than the maximum, the force will be negative, which means that the actuator is pushing. If the length is less than the minimum length, the force output should become zero. Considering this and the end effect and effectiveness the model (18) becomes:
If consider the spring behavior,
where k
braid is the braid material stiffness.
The static model of PAM (22) will be verified through experimental data. Also, this static model was the base for the dynamic model and then will represent the target of the new model in simulation.
3. Experimental validation of static model
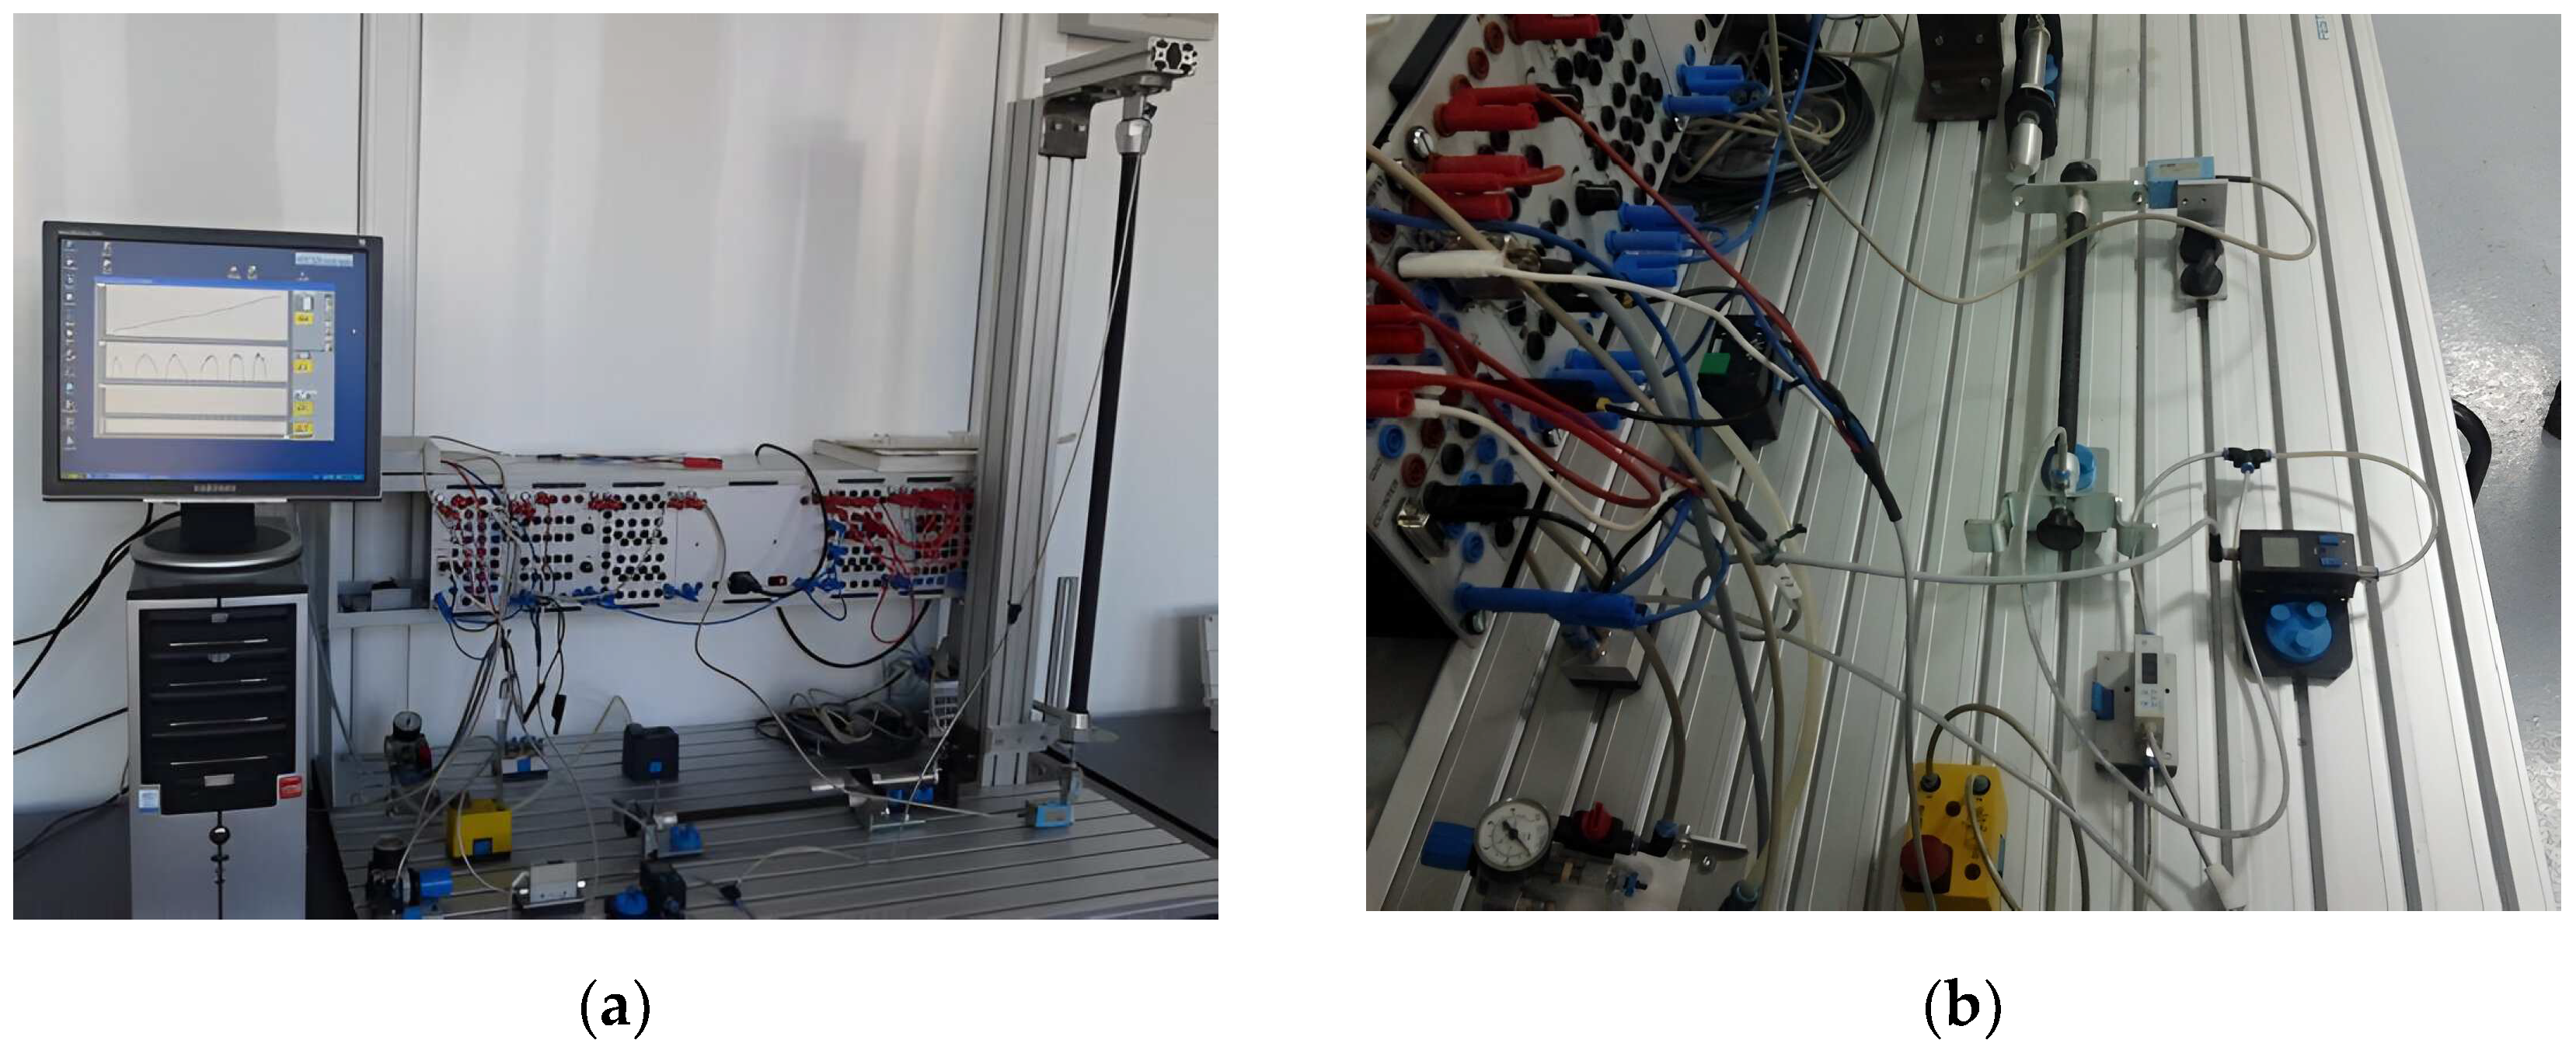
Experiments were done using the following components: two PAMS (MAS-10-N-100-AA-MCFK and MAS-20-750N-AA-MC-O-ER-BG), a force cell (RDP LOAD CELL MCL/1kN), a flow cell (SFE3-F500-L-W18-2PB-K), a pressure cell (SDE-1-D10), a 3/2 electro-pneumatic valve all from Festo (
Figure 8).
The main purpose of the experiments was to validate the above mathematical static model of different PAMs.
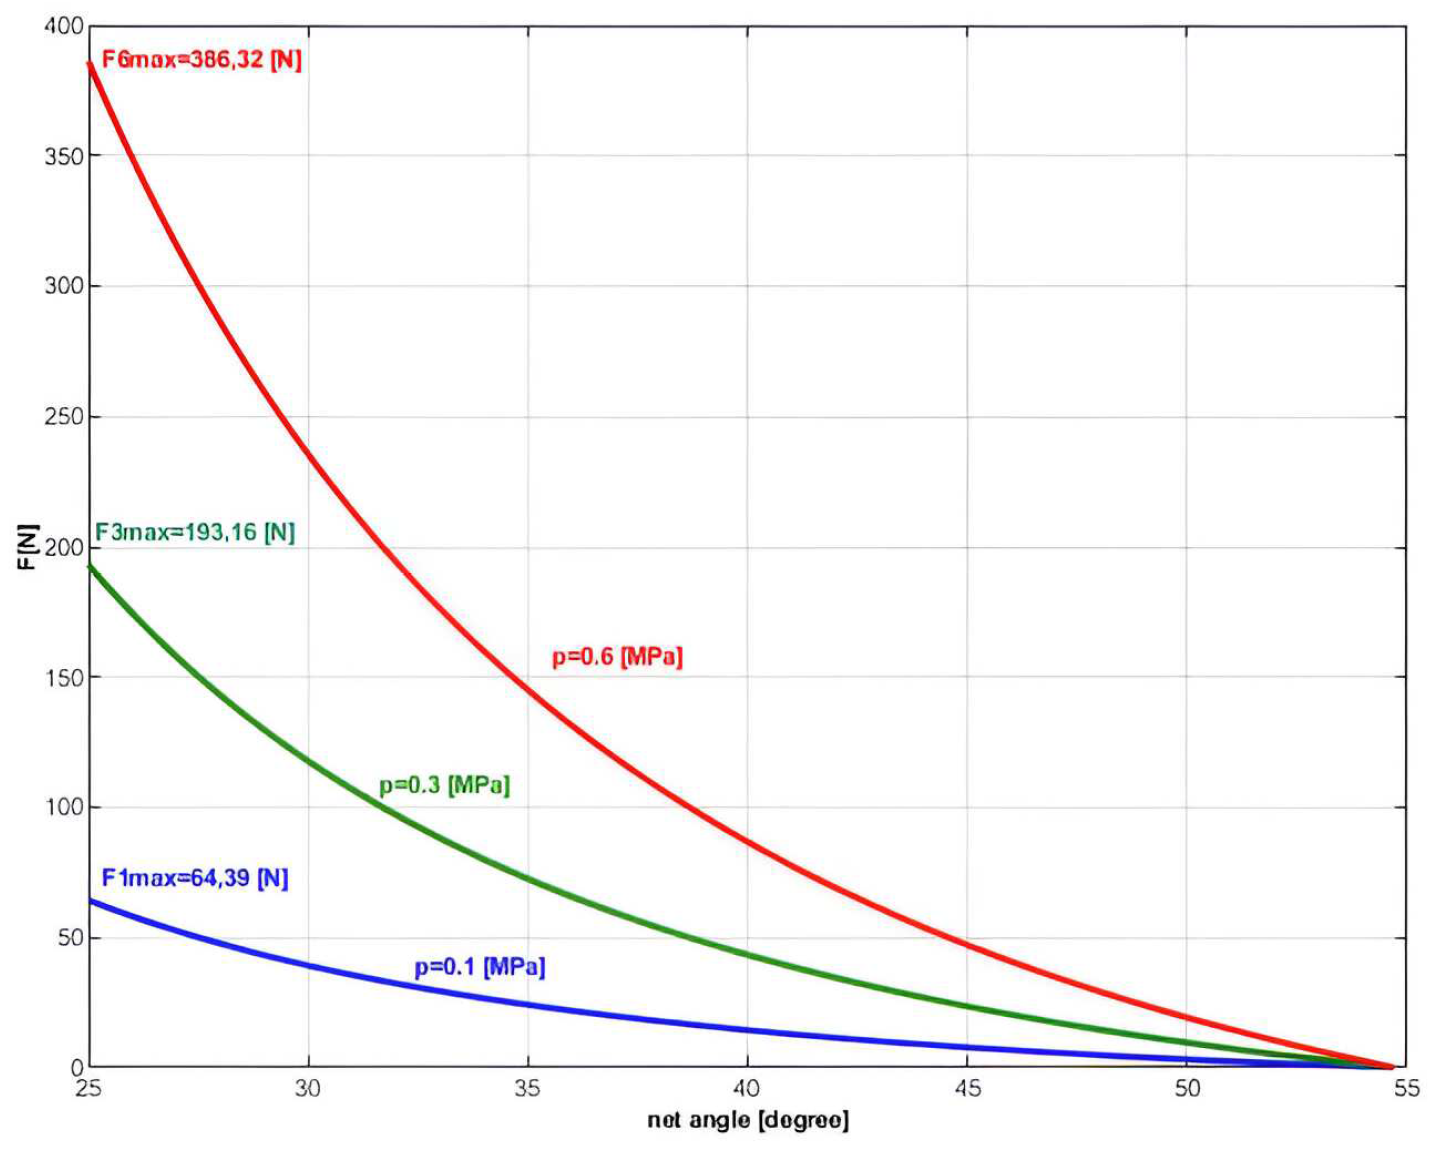
During measurements, it was considered that the net angle varies between 25° [
31] to the maximum value of 54,7°.
Thus the force output as dependent on θ is shown in
Figure 9. The characteristics were measured for three different pressures, obtaining three different values for maximum force. Thus, the maximum force was 64.39 [N] (at 0.1 [MPa]), 193.16 [N] (at 0.3[MPa]) and 386.32 [N] (at 0.6 [MPa]).
There is another important conclusion that follows, namely that for an elongated network (small angle of the winding network) the force developed by the muscle is much higher than in the case of a network with a large angle of the winding.
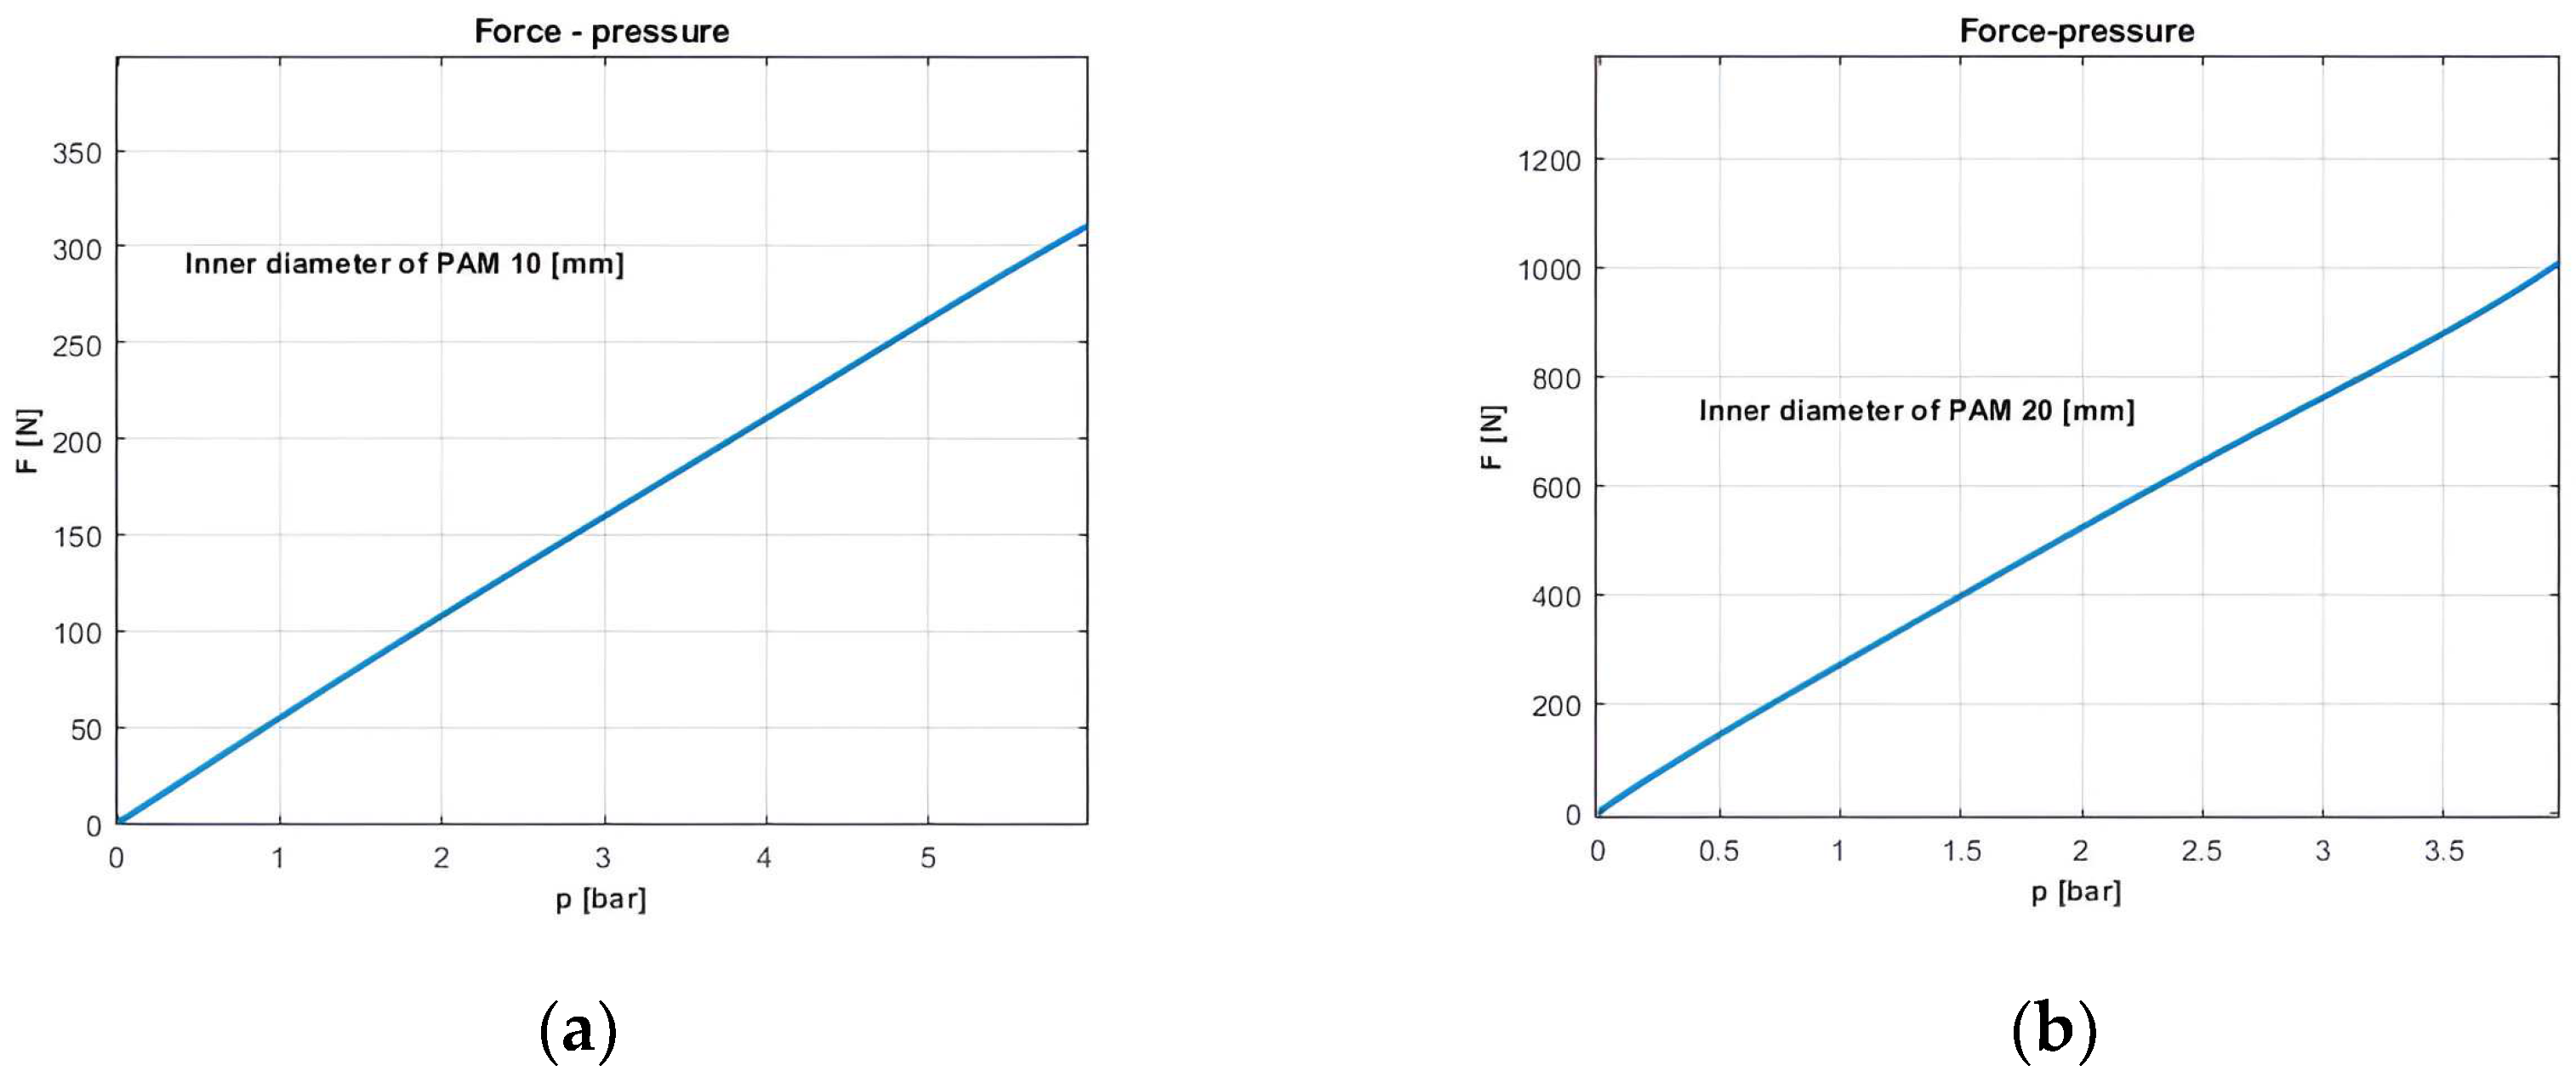
The force-pressure dependence was also determined experimentally. Thus, to a quasi-stationary increase of input pressure, were tested two PAMs: (10 [mm] diameter; 98[mm] length) –
Figure 10a and (20 [mm] diameter; 750 [mm] length) –
Figure 10b.
The experiments underlined that the slope of the force-pressure characteristic, at constant elongation, corresponds to the speed of muscle force variation, in relation to the input pressure. Thus, a greater slope of this characteristic implies a faster increase in force with increasing pressure.
The experiments validate the mathematical model according to which the slope of force-pressure dependence is increasing for the higher inner diameter of the PAMs.
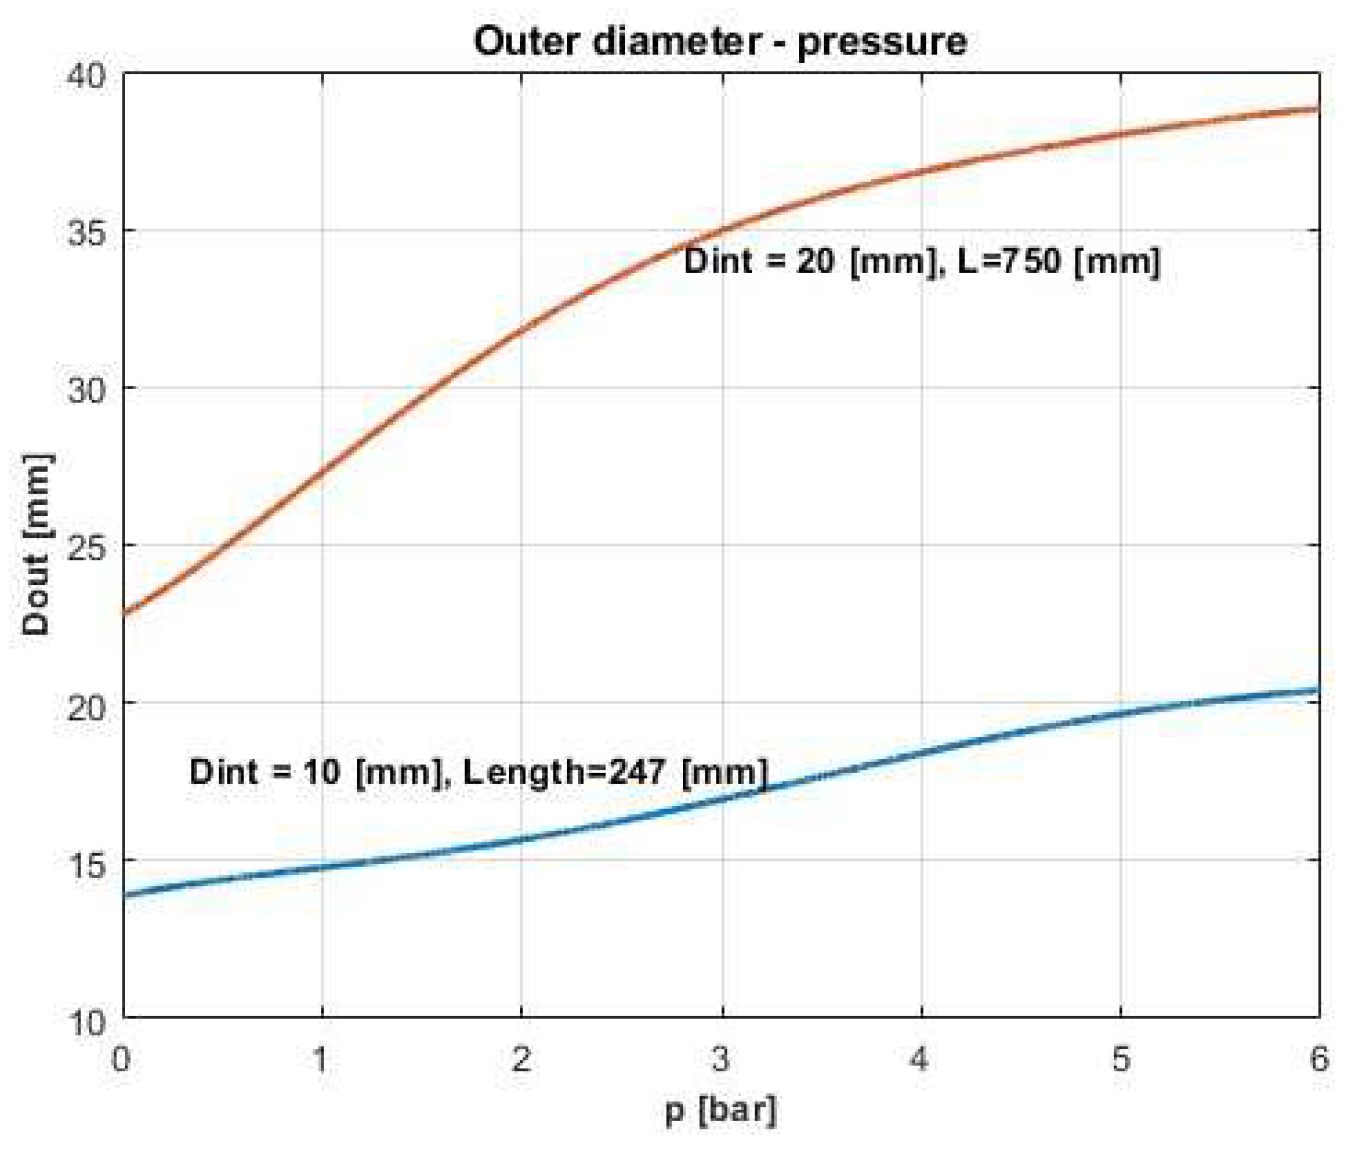
There were done other experiments that concerned the evolution of the length and diameter of the artificial pneumatic muscle in relation to the pressure, respectively their interdependence. These were done to validate the simplification assumed in the theoretical model.
Thus, it was measured the outer diameter relative to pressure variation, for two different of PAMs: inner diameter 10 [mm], length of 274 [mm] and, respectively, 20 [mm] inner diameter and 750 [mm] (
Figure 11). The first experimental data were gained by fixing one end of PAMs, the other being free to move.
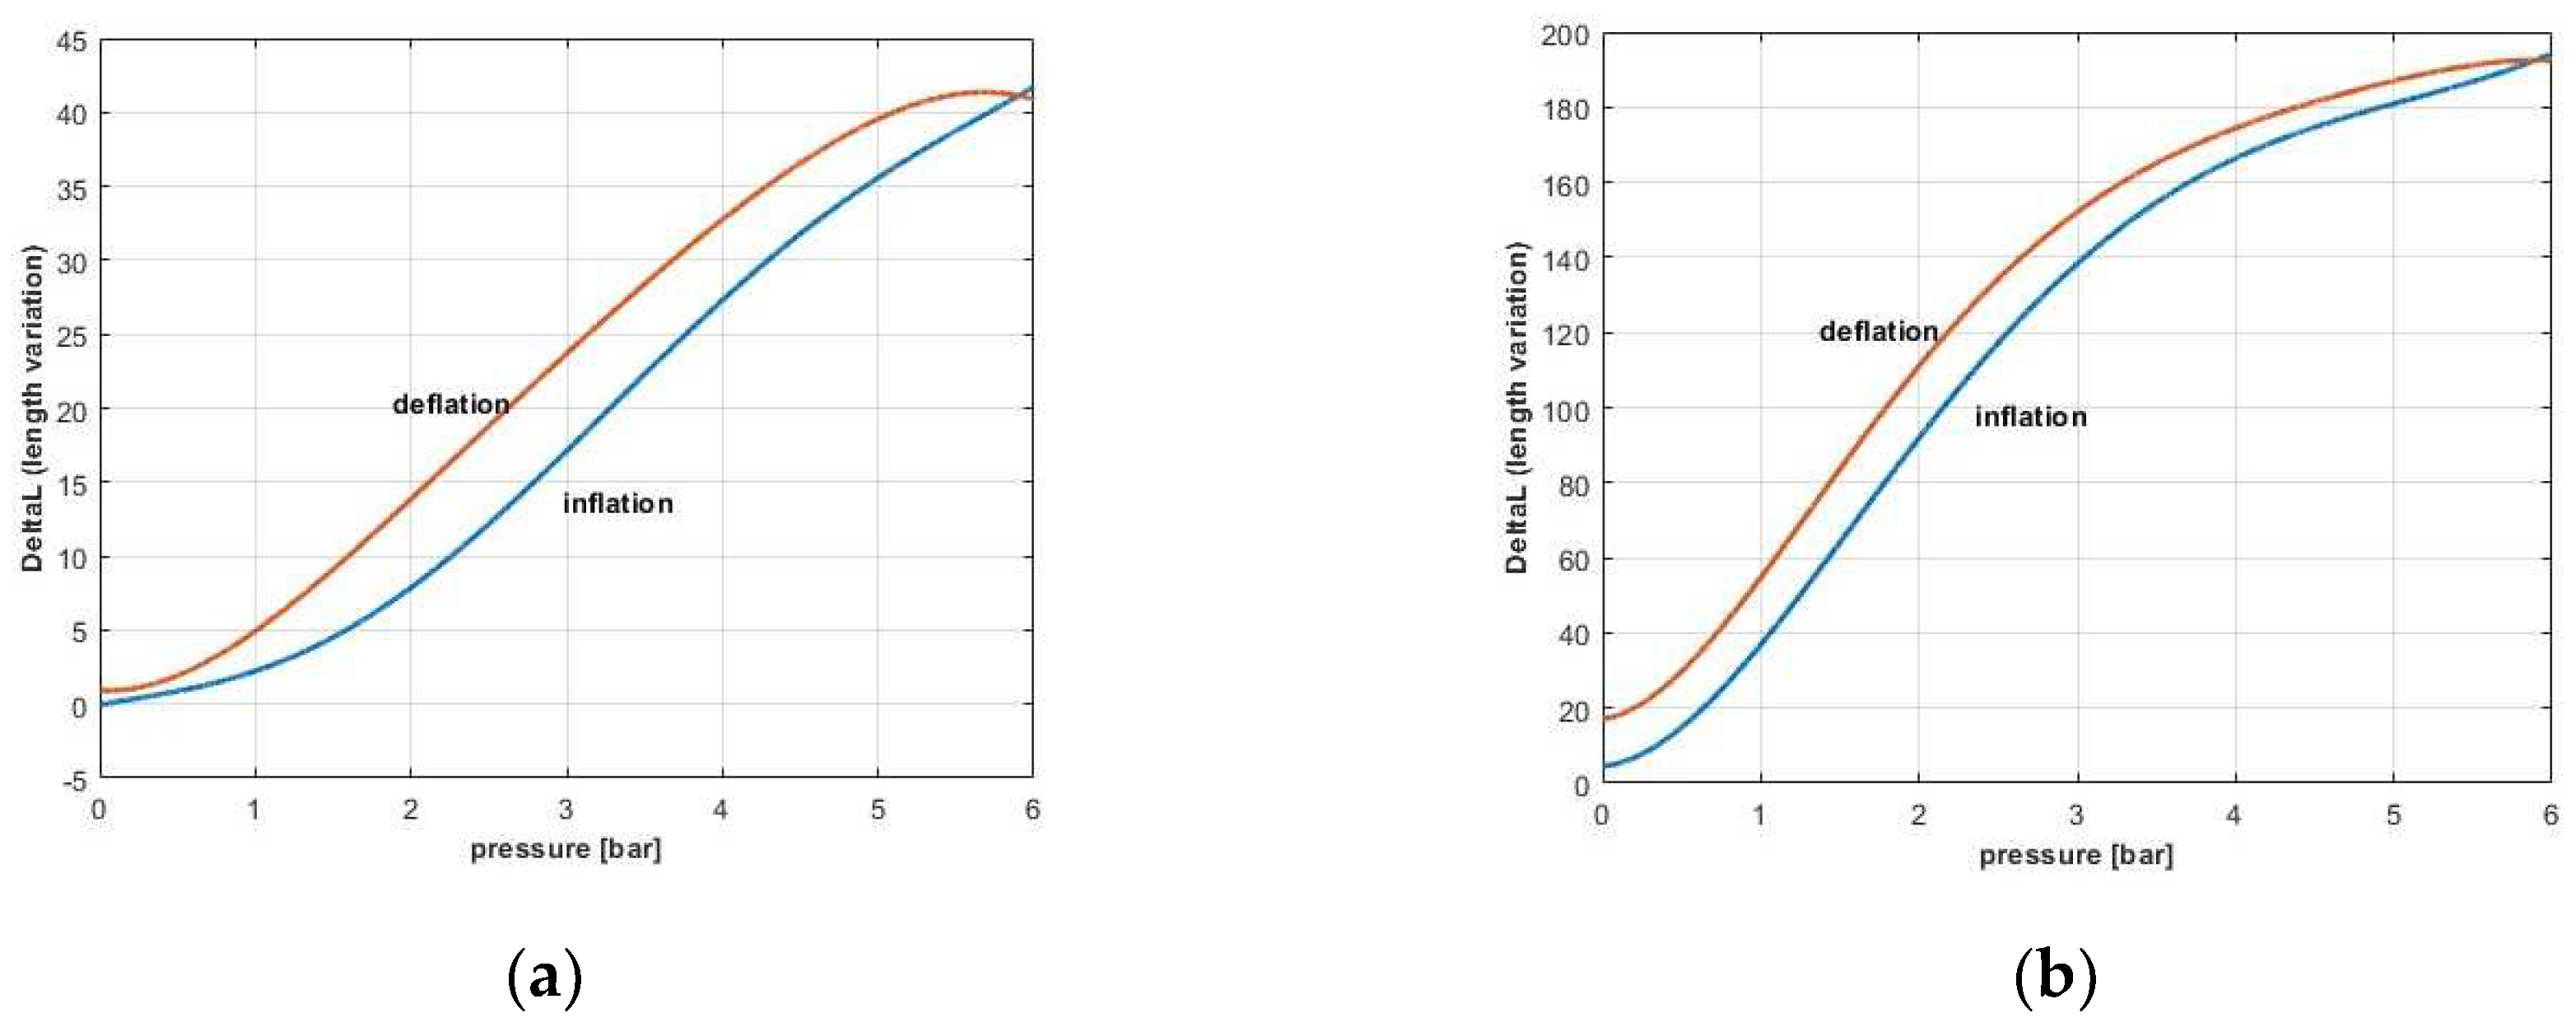
Also experimentally were determined the characteristics of PAM’s length variation with pressure, for both muscles: of 10 (
Figure 12a), and respectively 20 [mm] diameter (
Figure 12b).
These experiments sustain, once more, the elastic behavior of the muscle and validate the mathematical model.
The last experiment determined the variation of the outer diameter of the pneumatic muscle caused by the elasticity of the mechanical links of the artificial pneumatic muscle.
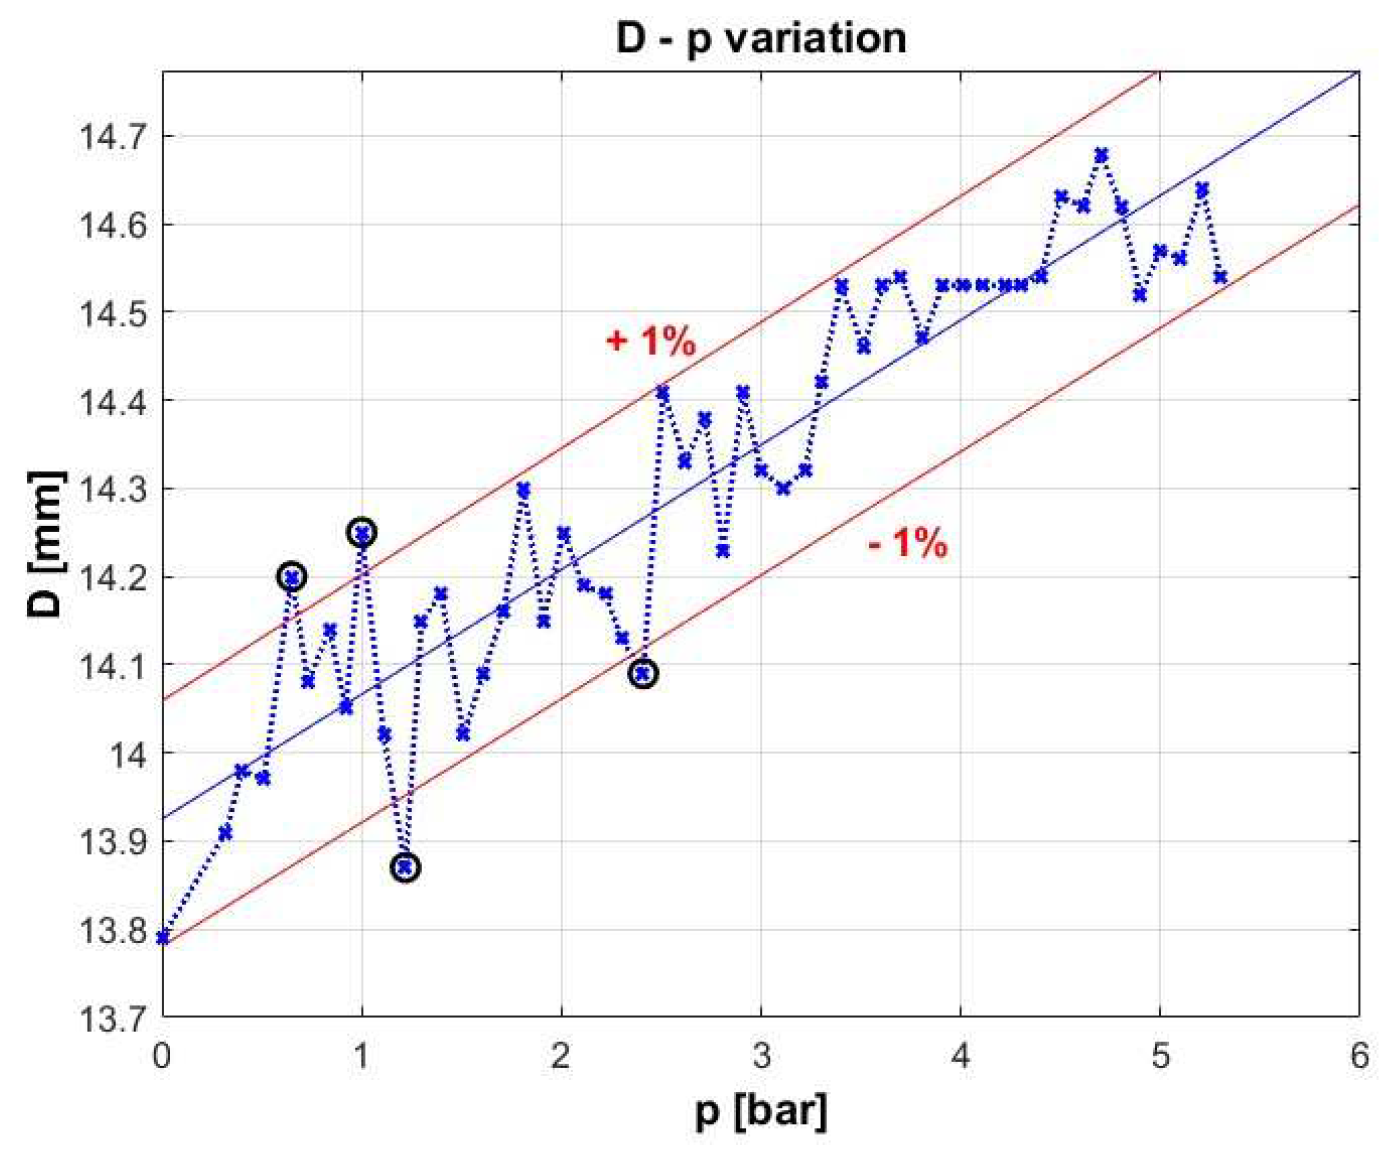
The linear dependence between the stiffness and the length of pneumatic muscle can lead to the conclusion of the association of the muscle with an elastic element, almost ideal, neglecting the influence of the ends the compressibility of the air. This conclusion, however, can only be validated if the physical structure of the muscle also shows a linear dependence. To obtain the diameter variation caused by the elasticity of the mechanical links of the artificial pneumatic muscle in relation to the supply pressure, a set of 52 determinations was made, which mainly concerned the variation of the outer diameter of the muscle depending on the pressure variation, considering muscle maintained at a constant length of 98 [mm] (
Figure 13).
As it can be seen in
Figure 13, 92.3% of measurements fall within the desired tolerance. This certifies the elastic behavior of PAM.
4. Mechanical Model
The static model offers an association of the PAM with an elastic element (22), model that was sustained by the experimental data obtained. This model does not consider the effect of ends and the phenomena determined by the behavior of ends. Based on these results, the dynamic model of PAM may be associated with a model of a spring, damper and a friction component.
Mathematically, to static model from (22) is added the Coulombian force and the damper. Thus
where F
static is expressed by relation (22); c – damper coefficient; v – PAM speed and linear stiffness is:
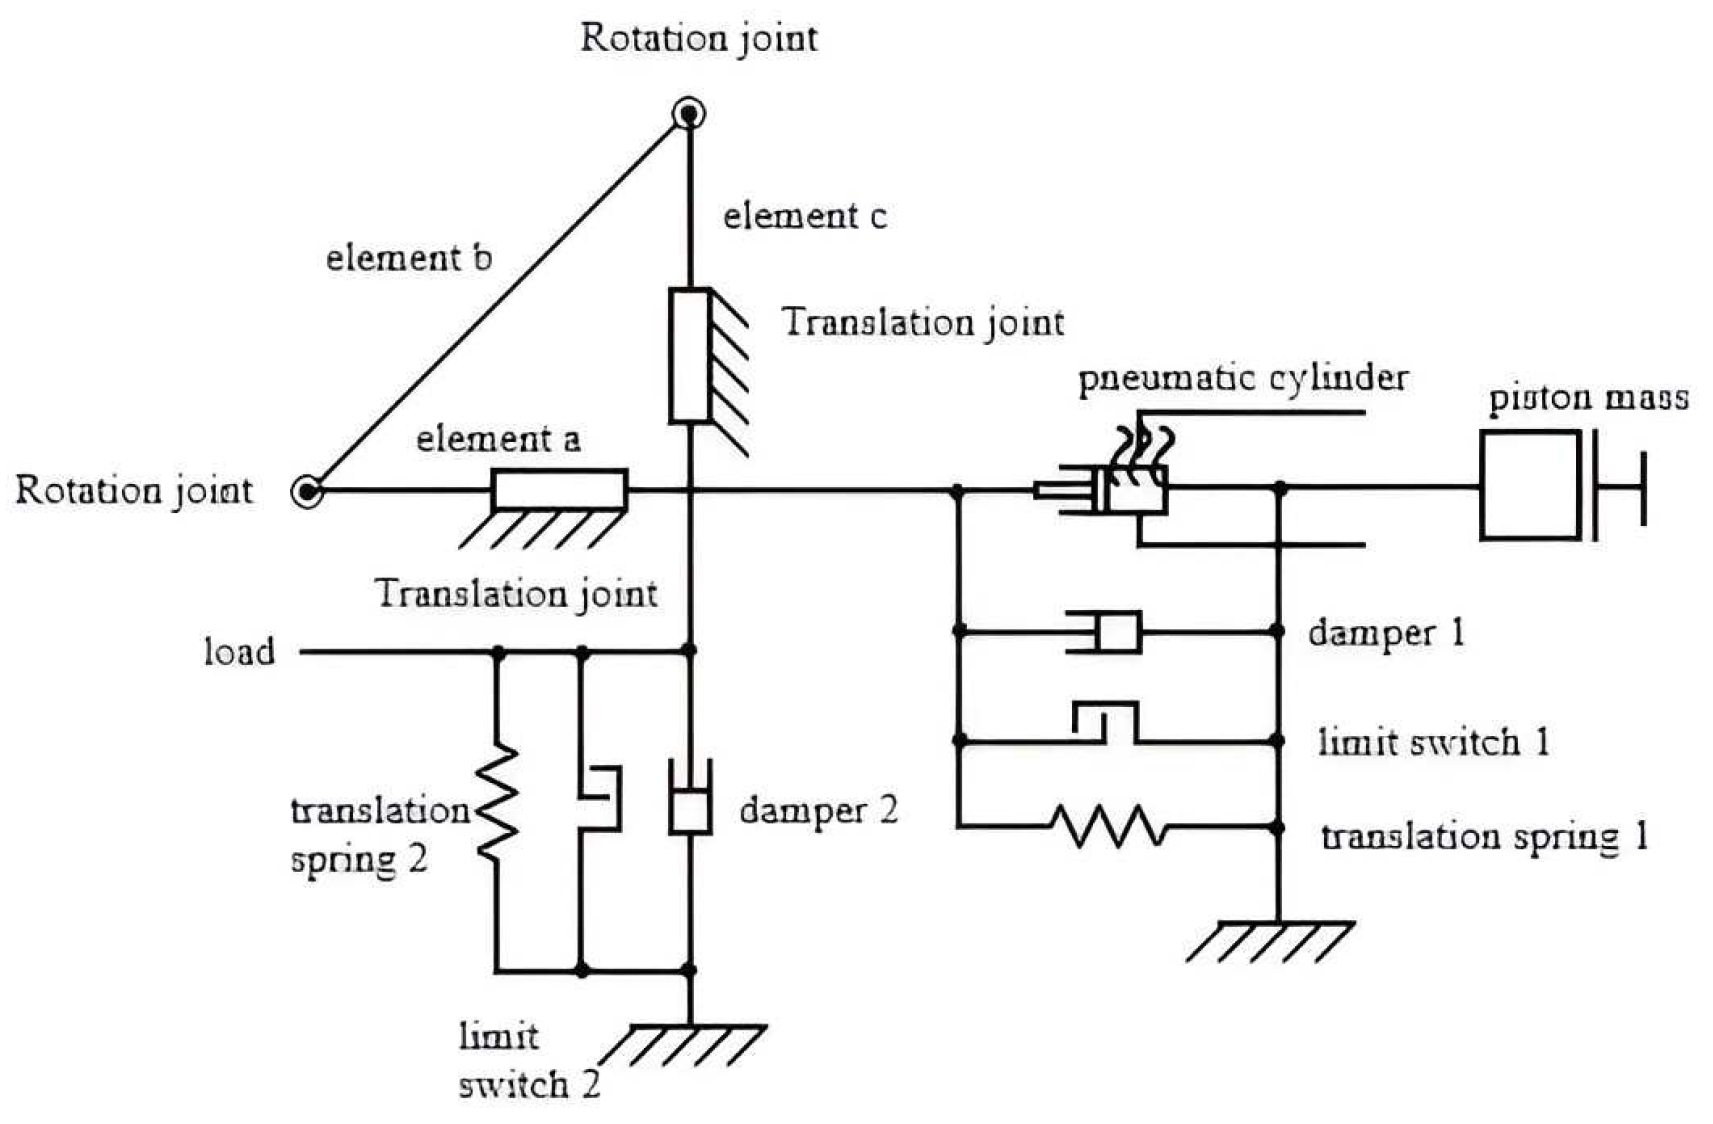
Based on this mathematical model it was designed a mechanical-pneumatic model that may be associated with a PAM (
Figure 14).
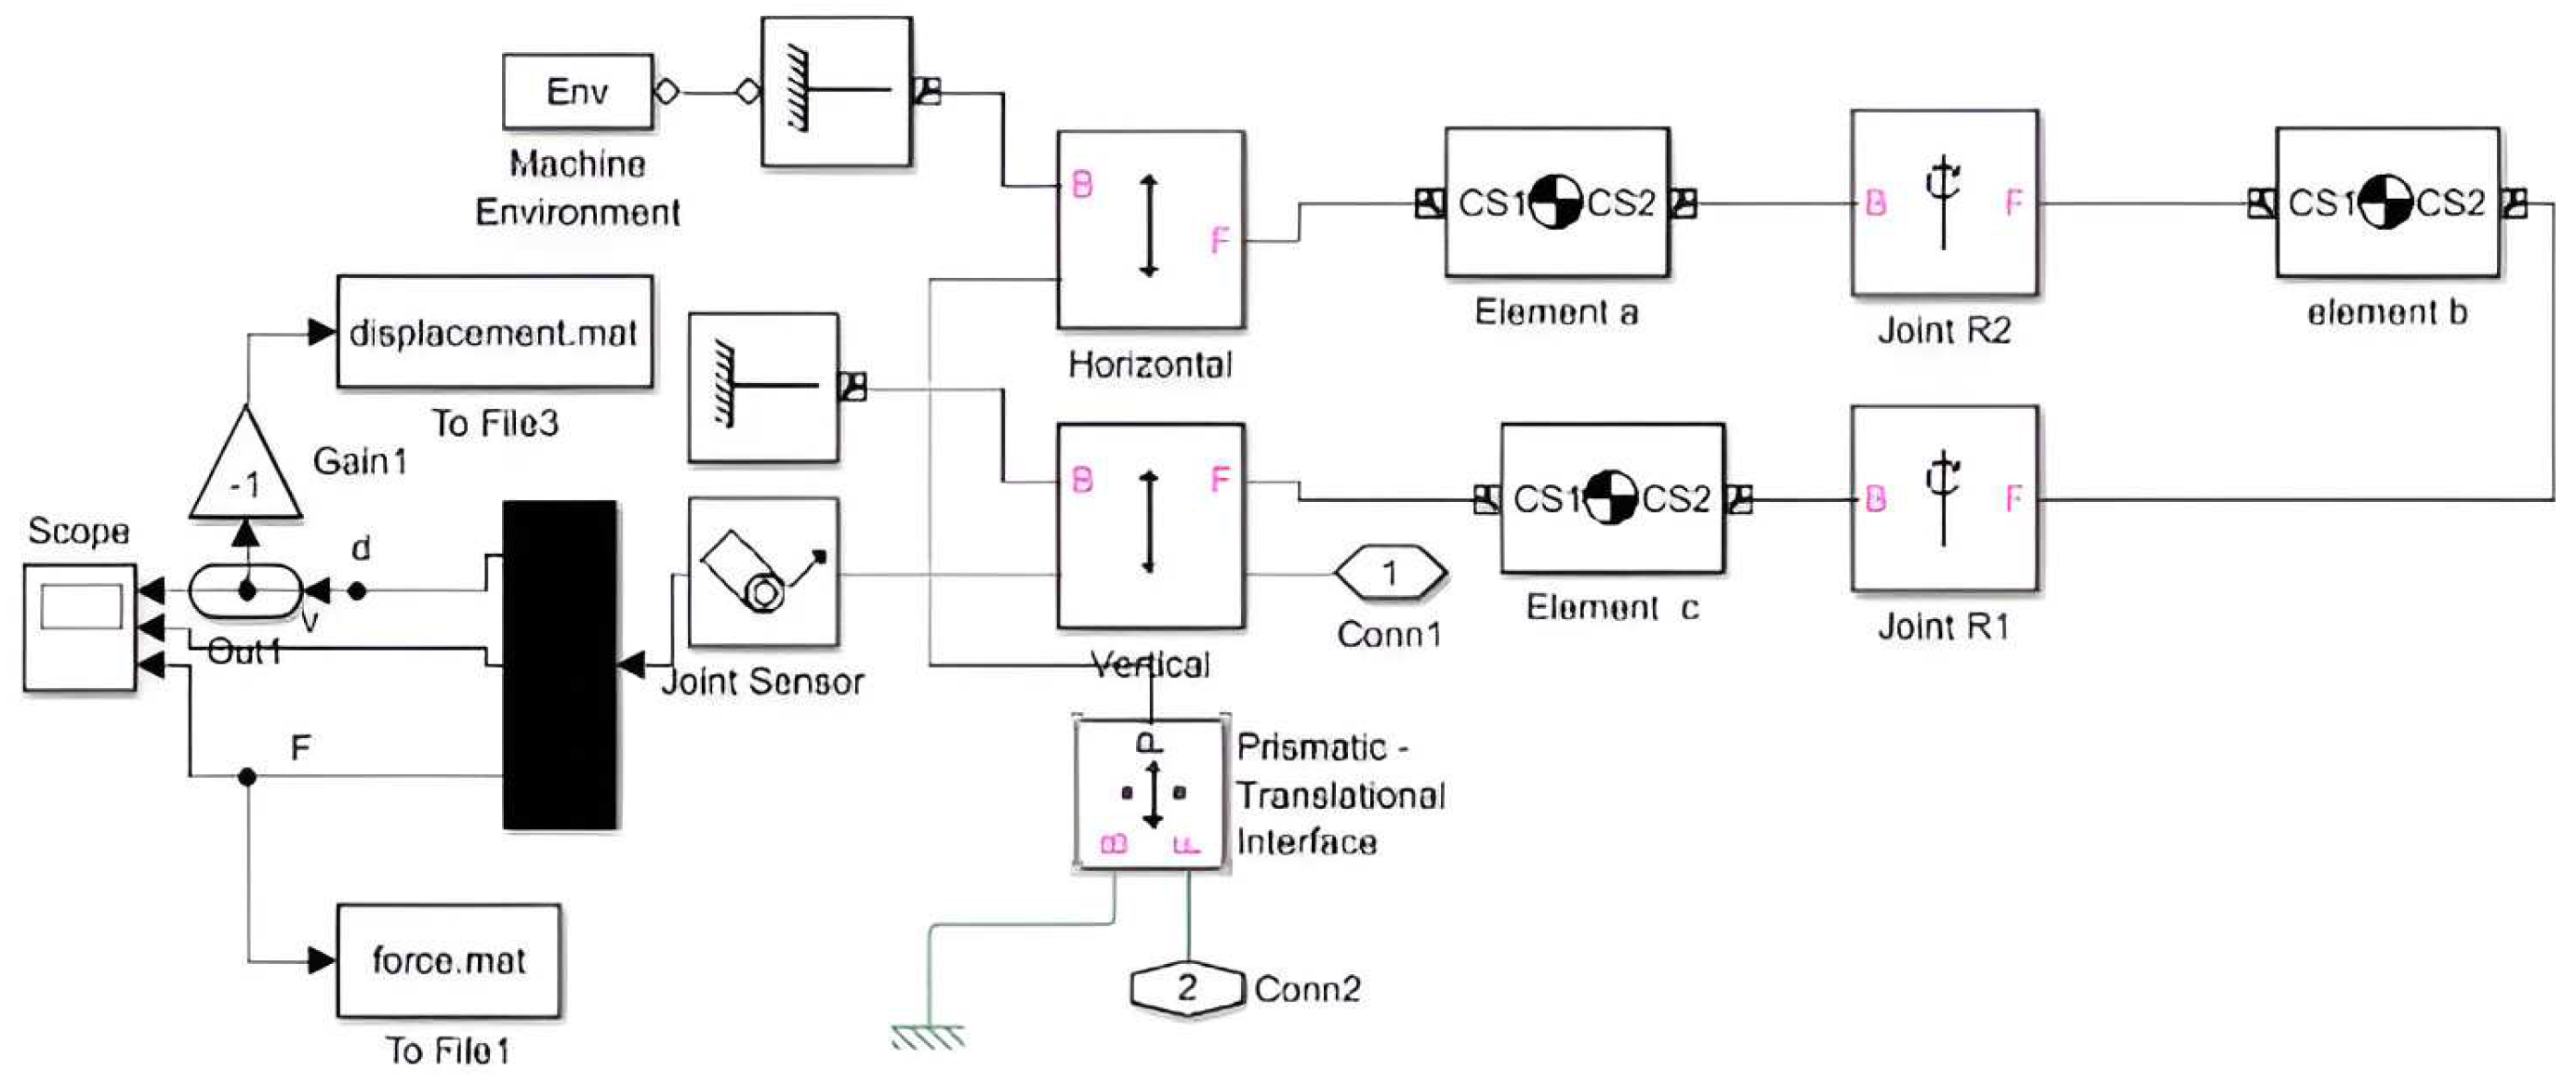
Simulations were done for the same Festo muscle MAS-10-N-100-AA-MCFK (with a length of 247 [mm]). The simulation diagram was done in Matlab (combining toolboxes: Simscape, Simulink, SimMechanics) (
Figure 15).
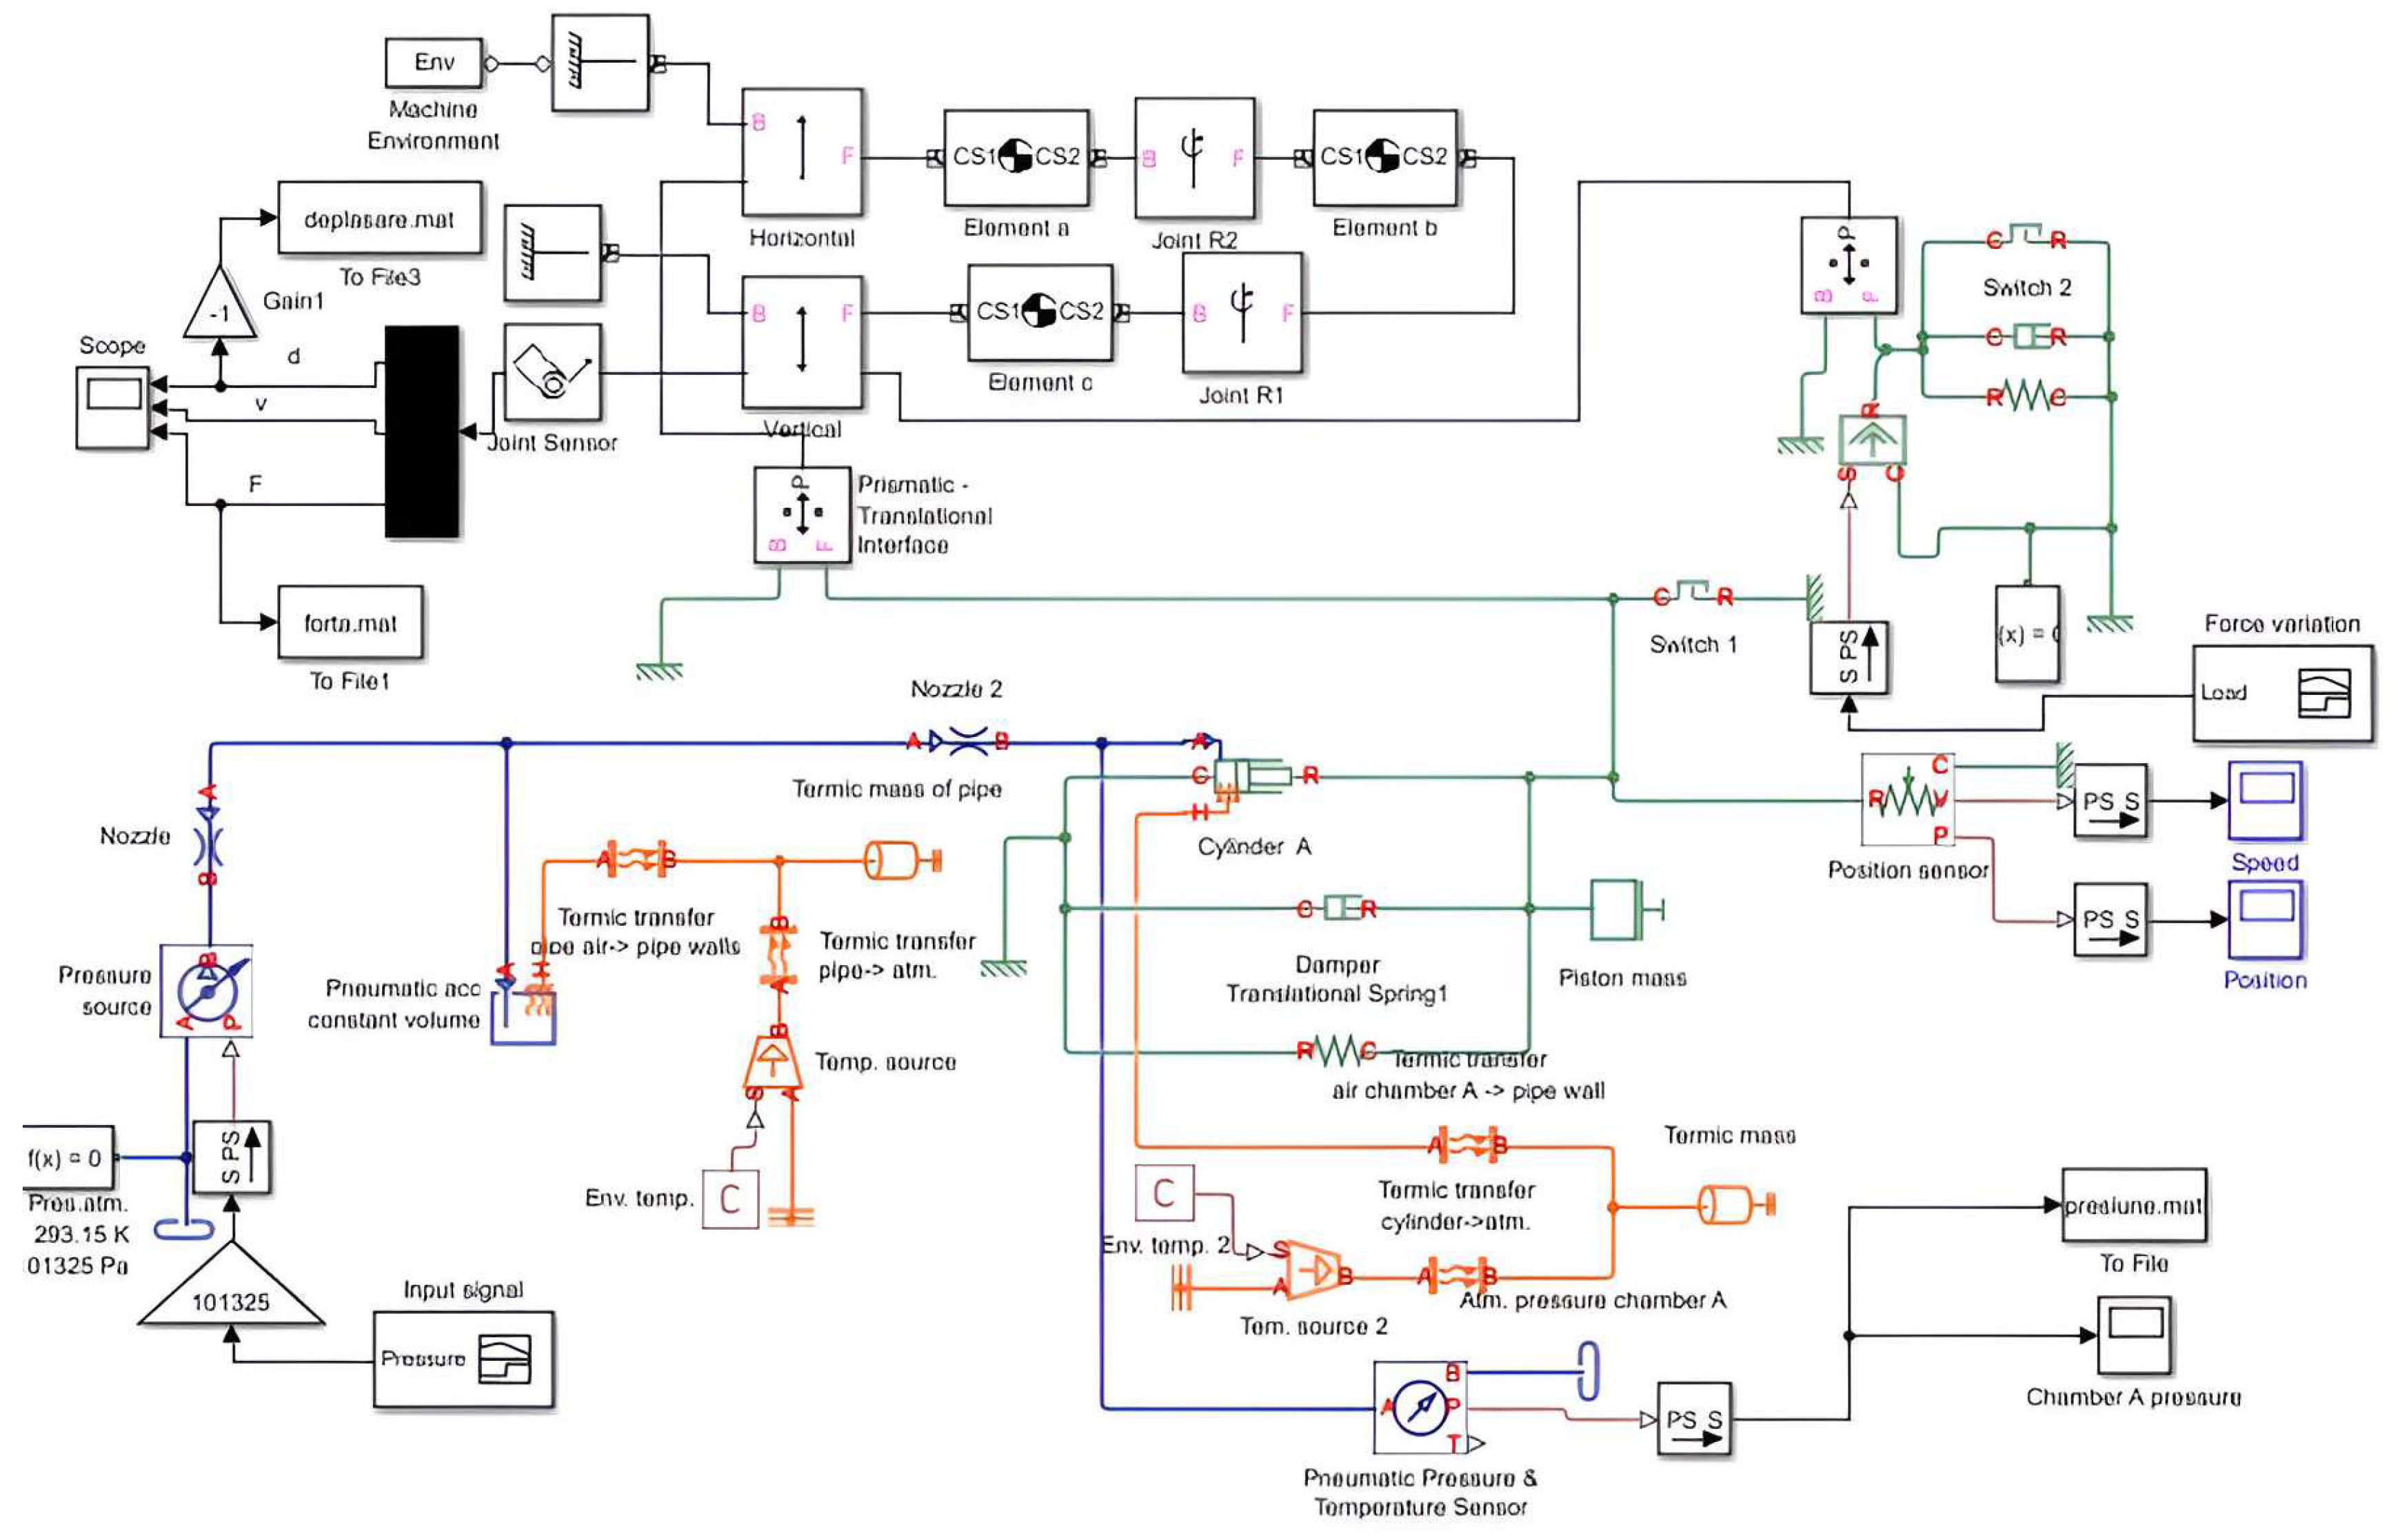
The PAM model was included in a pneumatic driving circuit, developed also in Matlab (as a simulation diagram developed in Simscape, Simulink and SimMechanics), circuit design as a simple pneumatic driving circuit (pipes, switches, actuator, pressure sensors) –
Figure 16.
Characteristics of simulations are:
- gravity is considered along Oy axis;
- elements (bar type) have a mass of 1 [g];
- damping system: elastic coefficient is k = 183 [Nm]; damping coefficient cv = 10 [N/(m/s)]; stroke limit between [-40, 40] [mm].
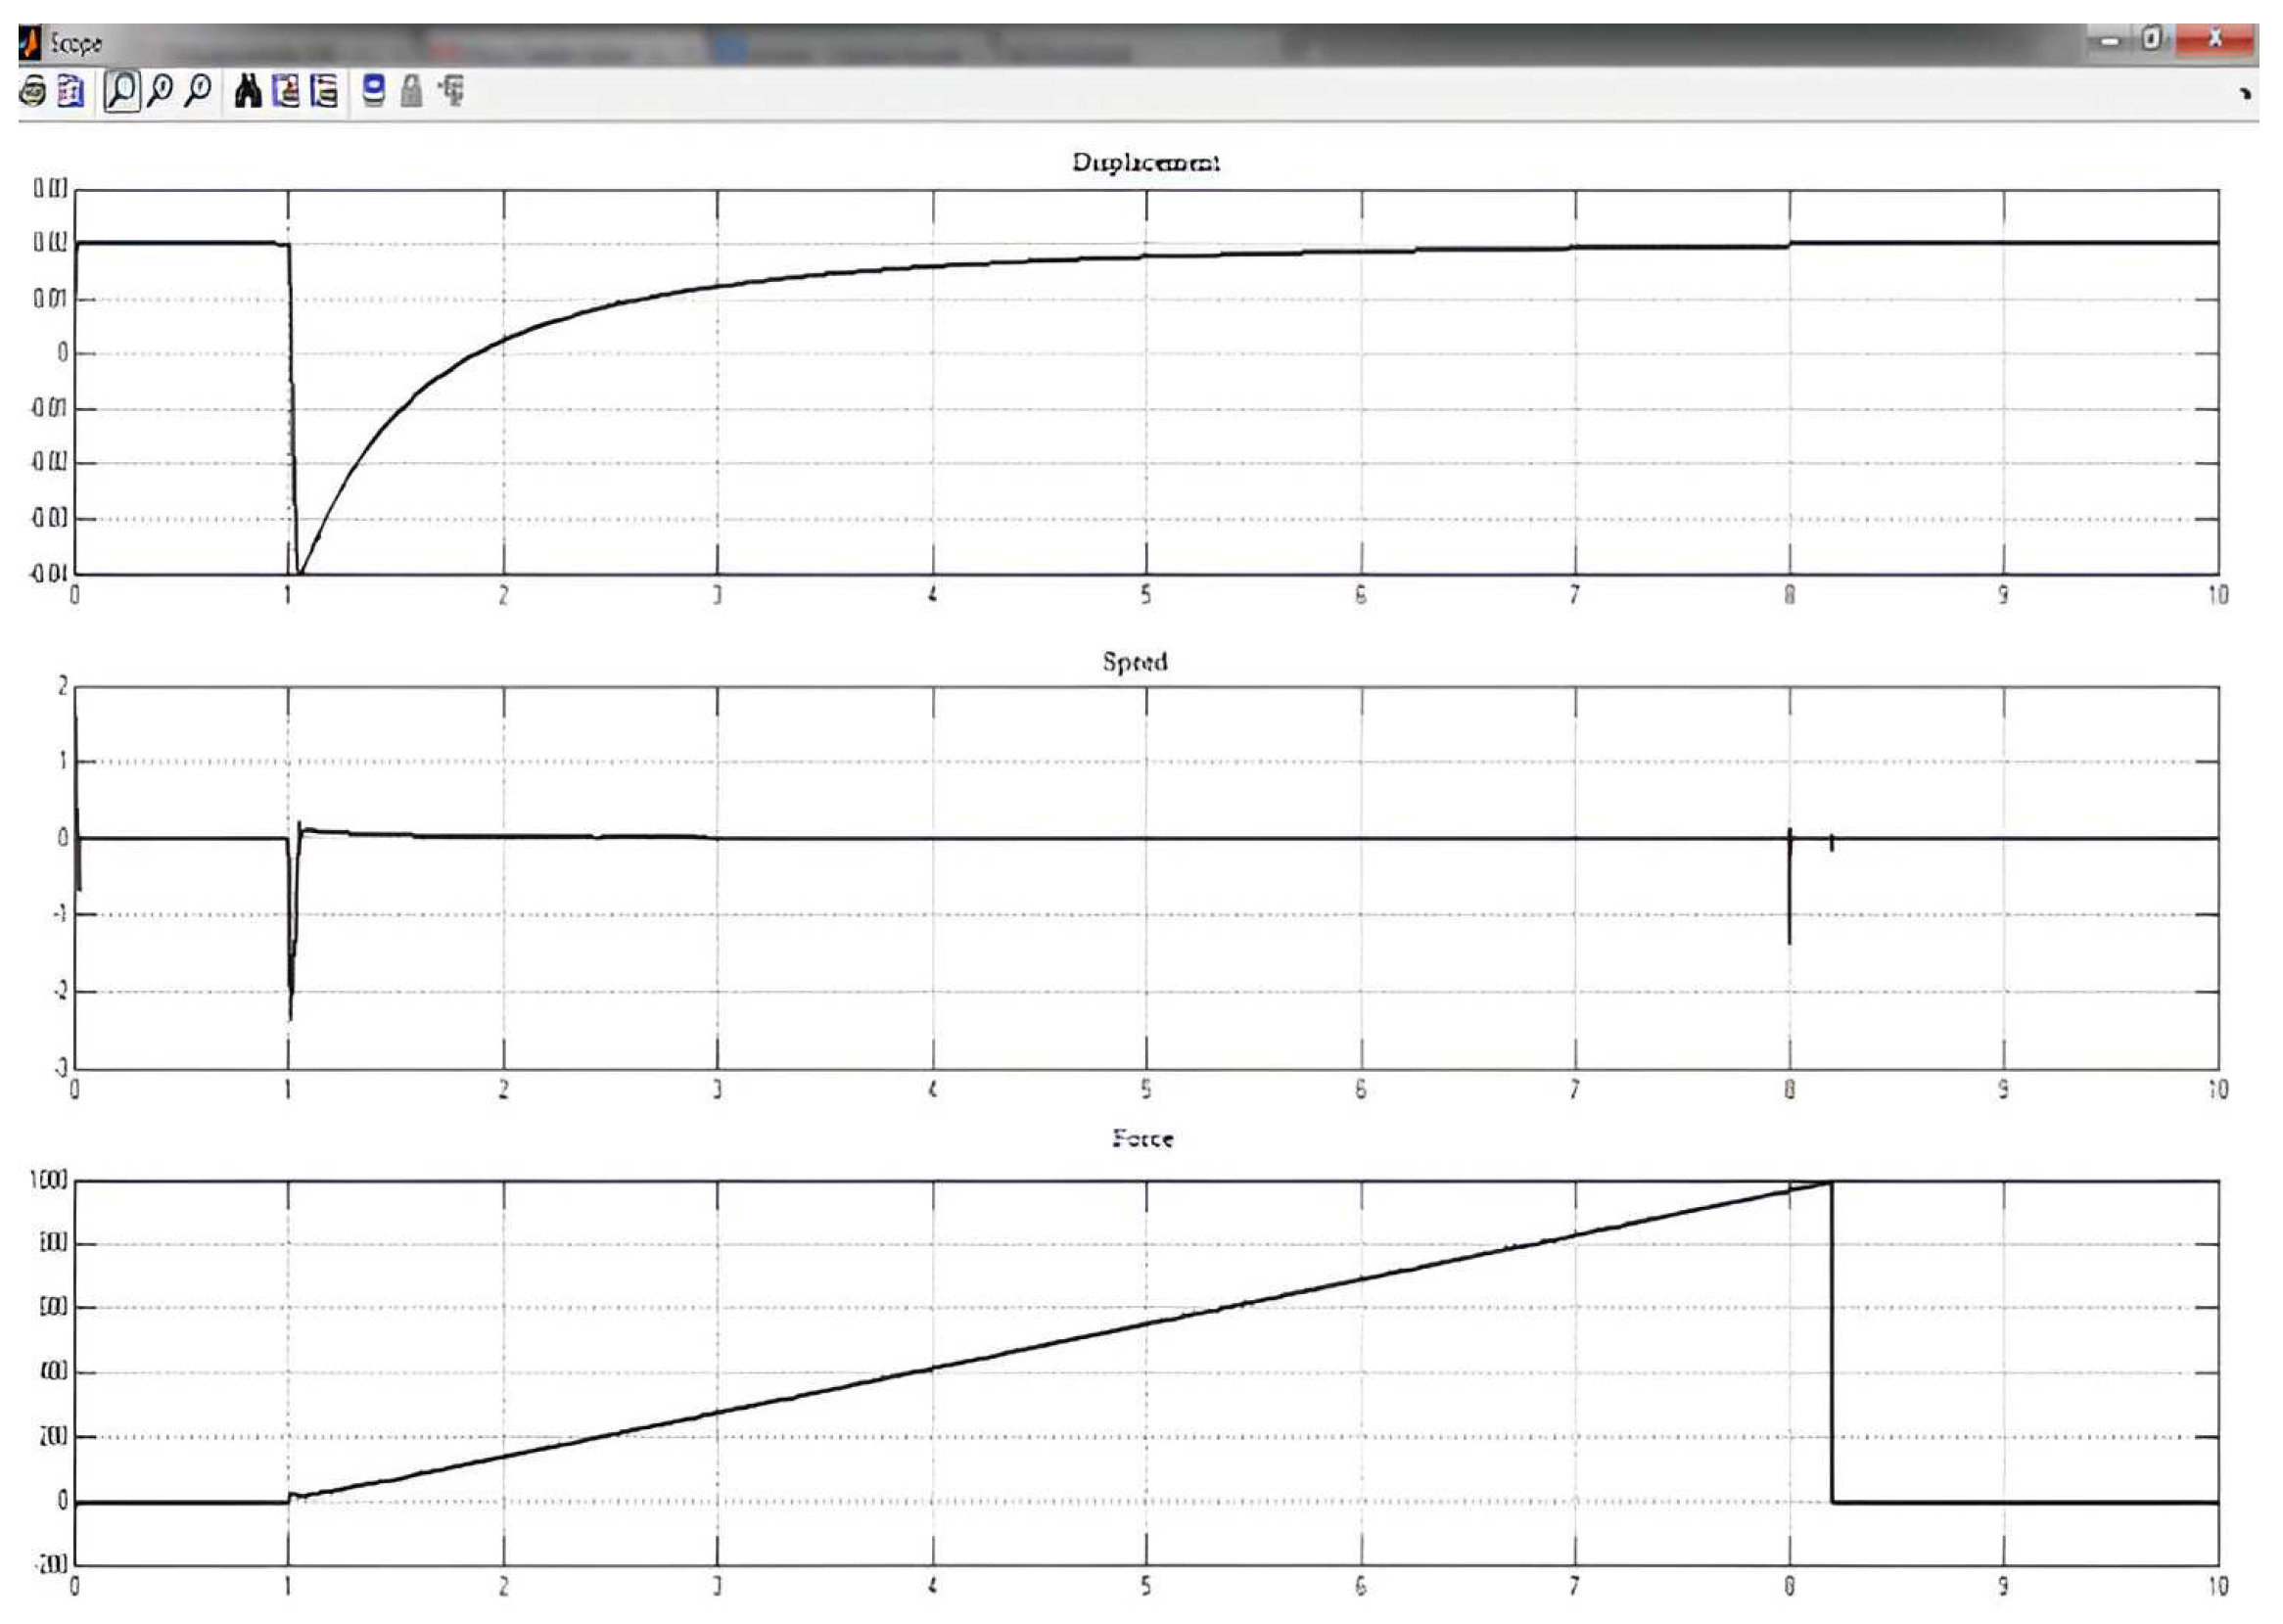
Input data are: input pressure (6 [bar]) and maximum load to the pneumatic motor (1000 [N] – ramp signal from 0 to 1000, with increasing time of 7 seconds).
The aim of the simulations was the output displacement and force.
Thus, as can be seen in
Figure 17, the displacement varies between [-0.04, 0.02] [m] which is equivalent to a total stroke of 60 [mm]. In the datasheet of Festo PAM [
6] it is given that the maximum contraction of this muscle is 25% of the nominal length. Thus, in the case of the simulated muscle, the nominal length is 247 [mm] of witch 25% is 61.5 [mm]. Thus, from displacement the model created in Matlab is a precise one.
According to the same datasheet, the nominal force in load varies between 0 and 630[N]. Analyzing the simulation result the force has a linear increase, proportional to the load input signal. The increasing time from the force diagram is determined by the fact that the maximum load of the input signal is higher than the maximum load from data sheet.
Based on the model from
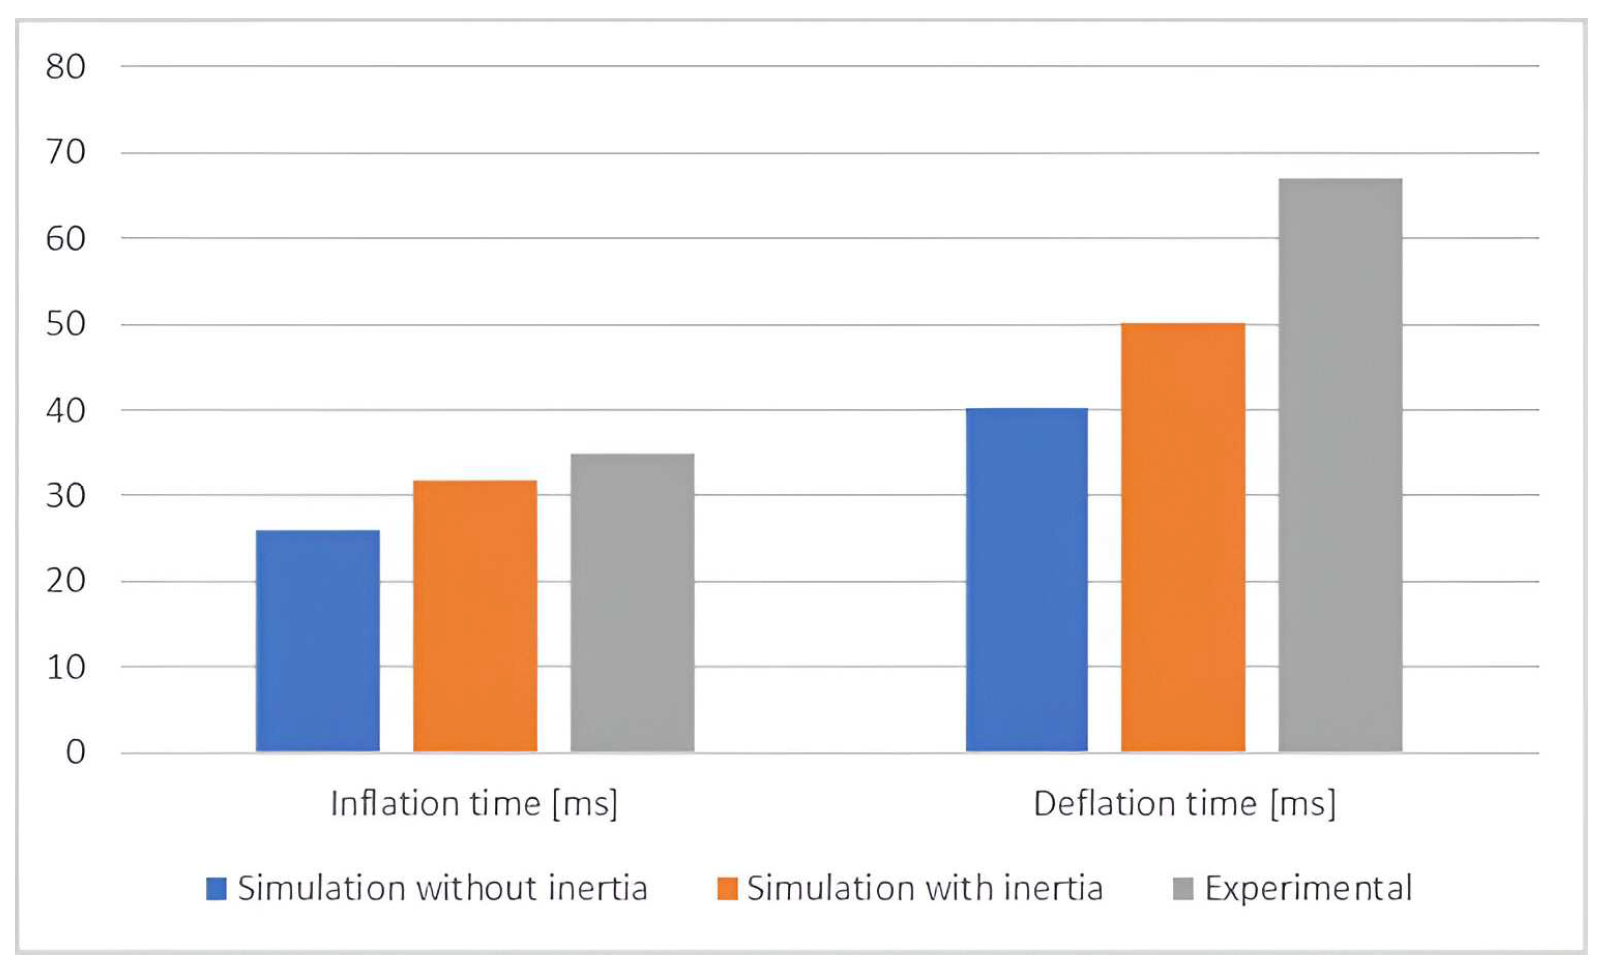
Figure 16 was simulated the displacement of the PAM. For this simulation were determined the dynamic parameters: positioning times, as a direct relation to inflation-deflation sequences. Thus, increasing-decreasing time is determined as the time between 10% and 90% of maximum displacement. Considering this, it was determined a time of 0.0261 [s] during inflation and 0.0402 [s], thus it was excluded the inertia effect. The total inflation-deflation times were: 0.0318 [s] for inflation and 0.05012[s] for deflation.
In
Figure 18 is presented the comparative data gain based on simulation of the mechanical model from
Figure 16, and experimental data measured in laboratory.
Analyzing the results of the simulation and comparing them to experimental data, the mechanical model from
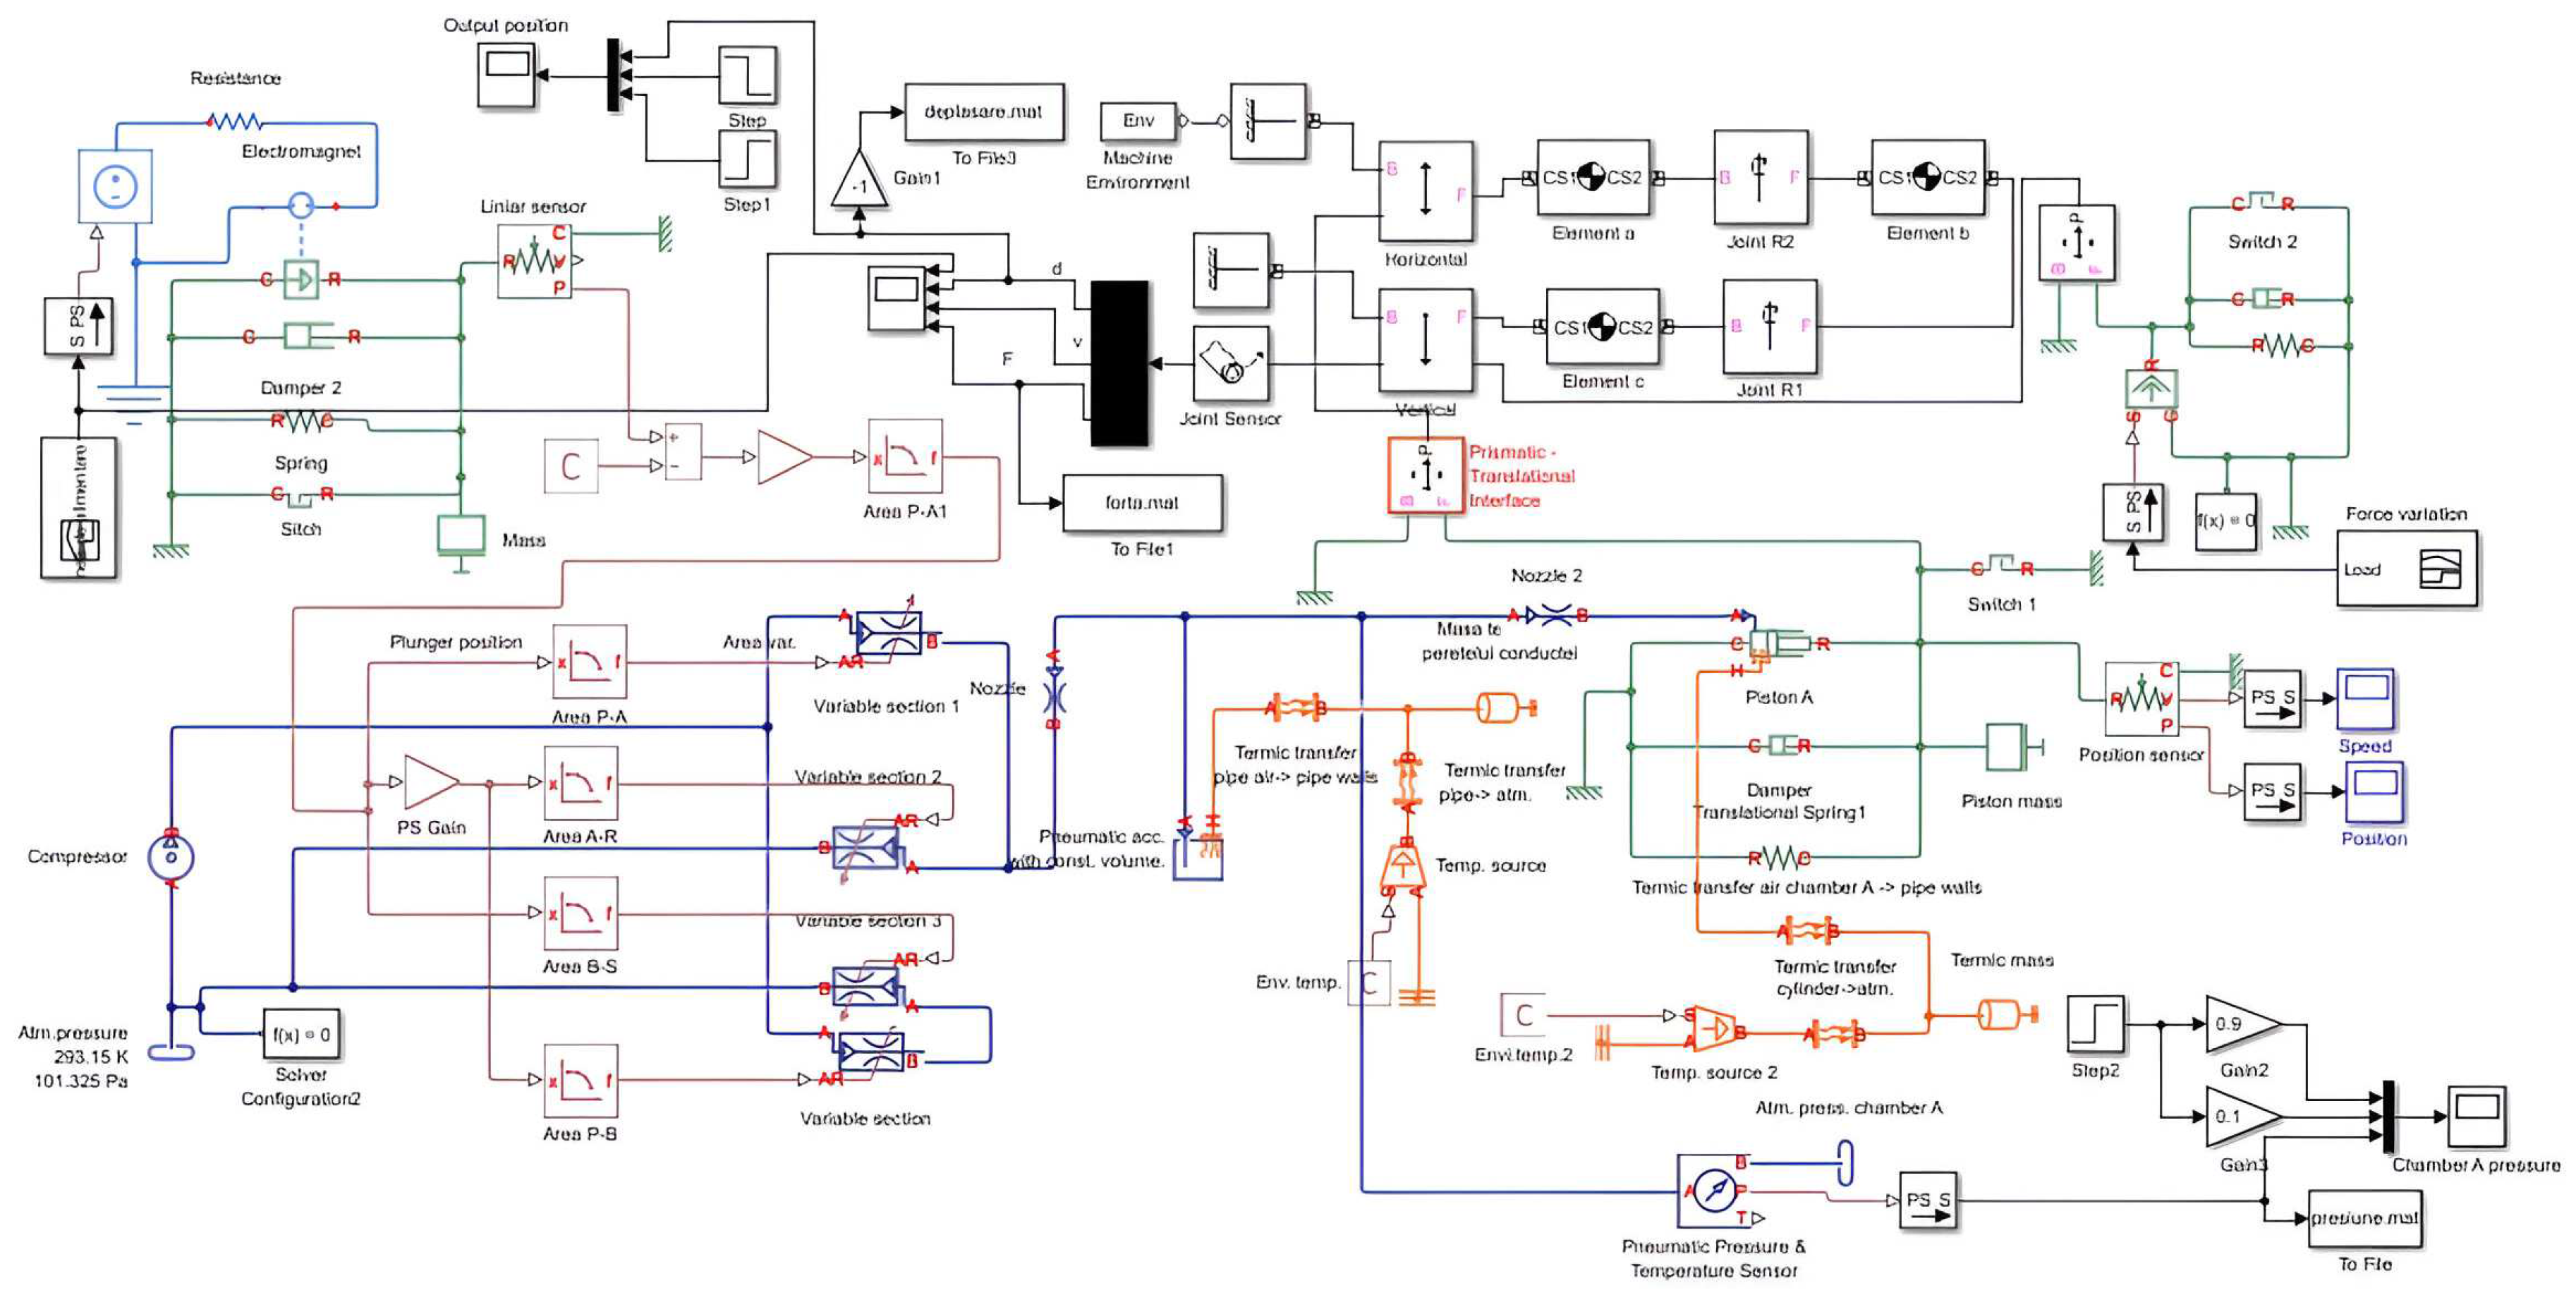
Figure 16 may be validated. Furthermore, was connected this model to a proportional directional control valves MPYE from Festo. Thus, the new system is shown in
Figure 19.
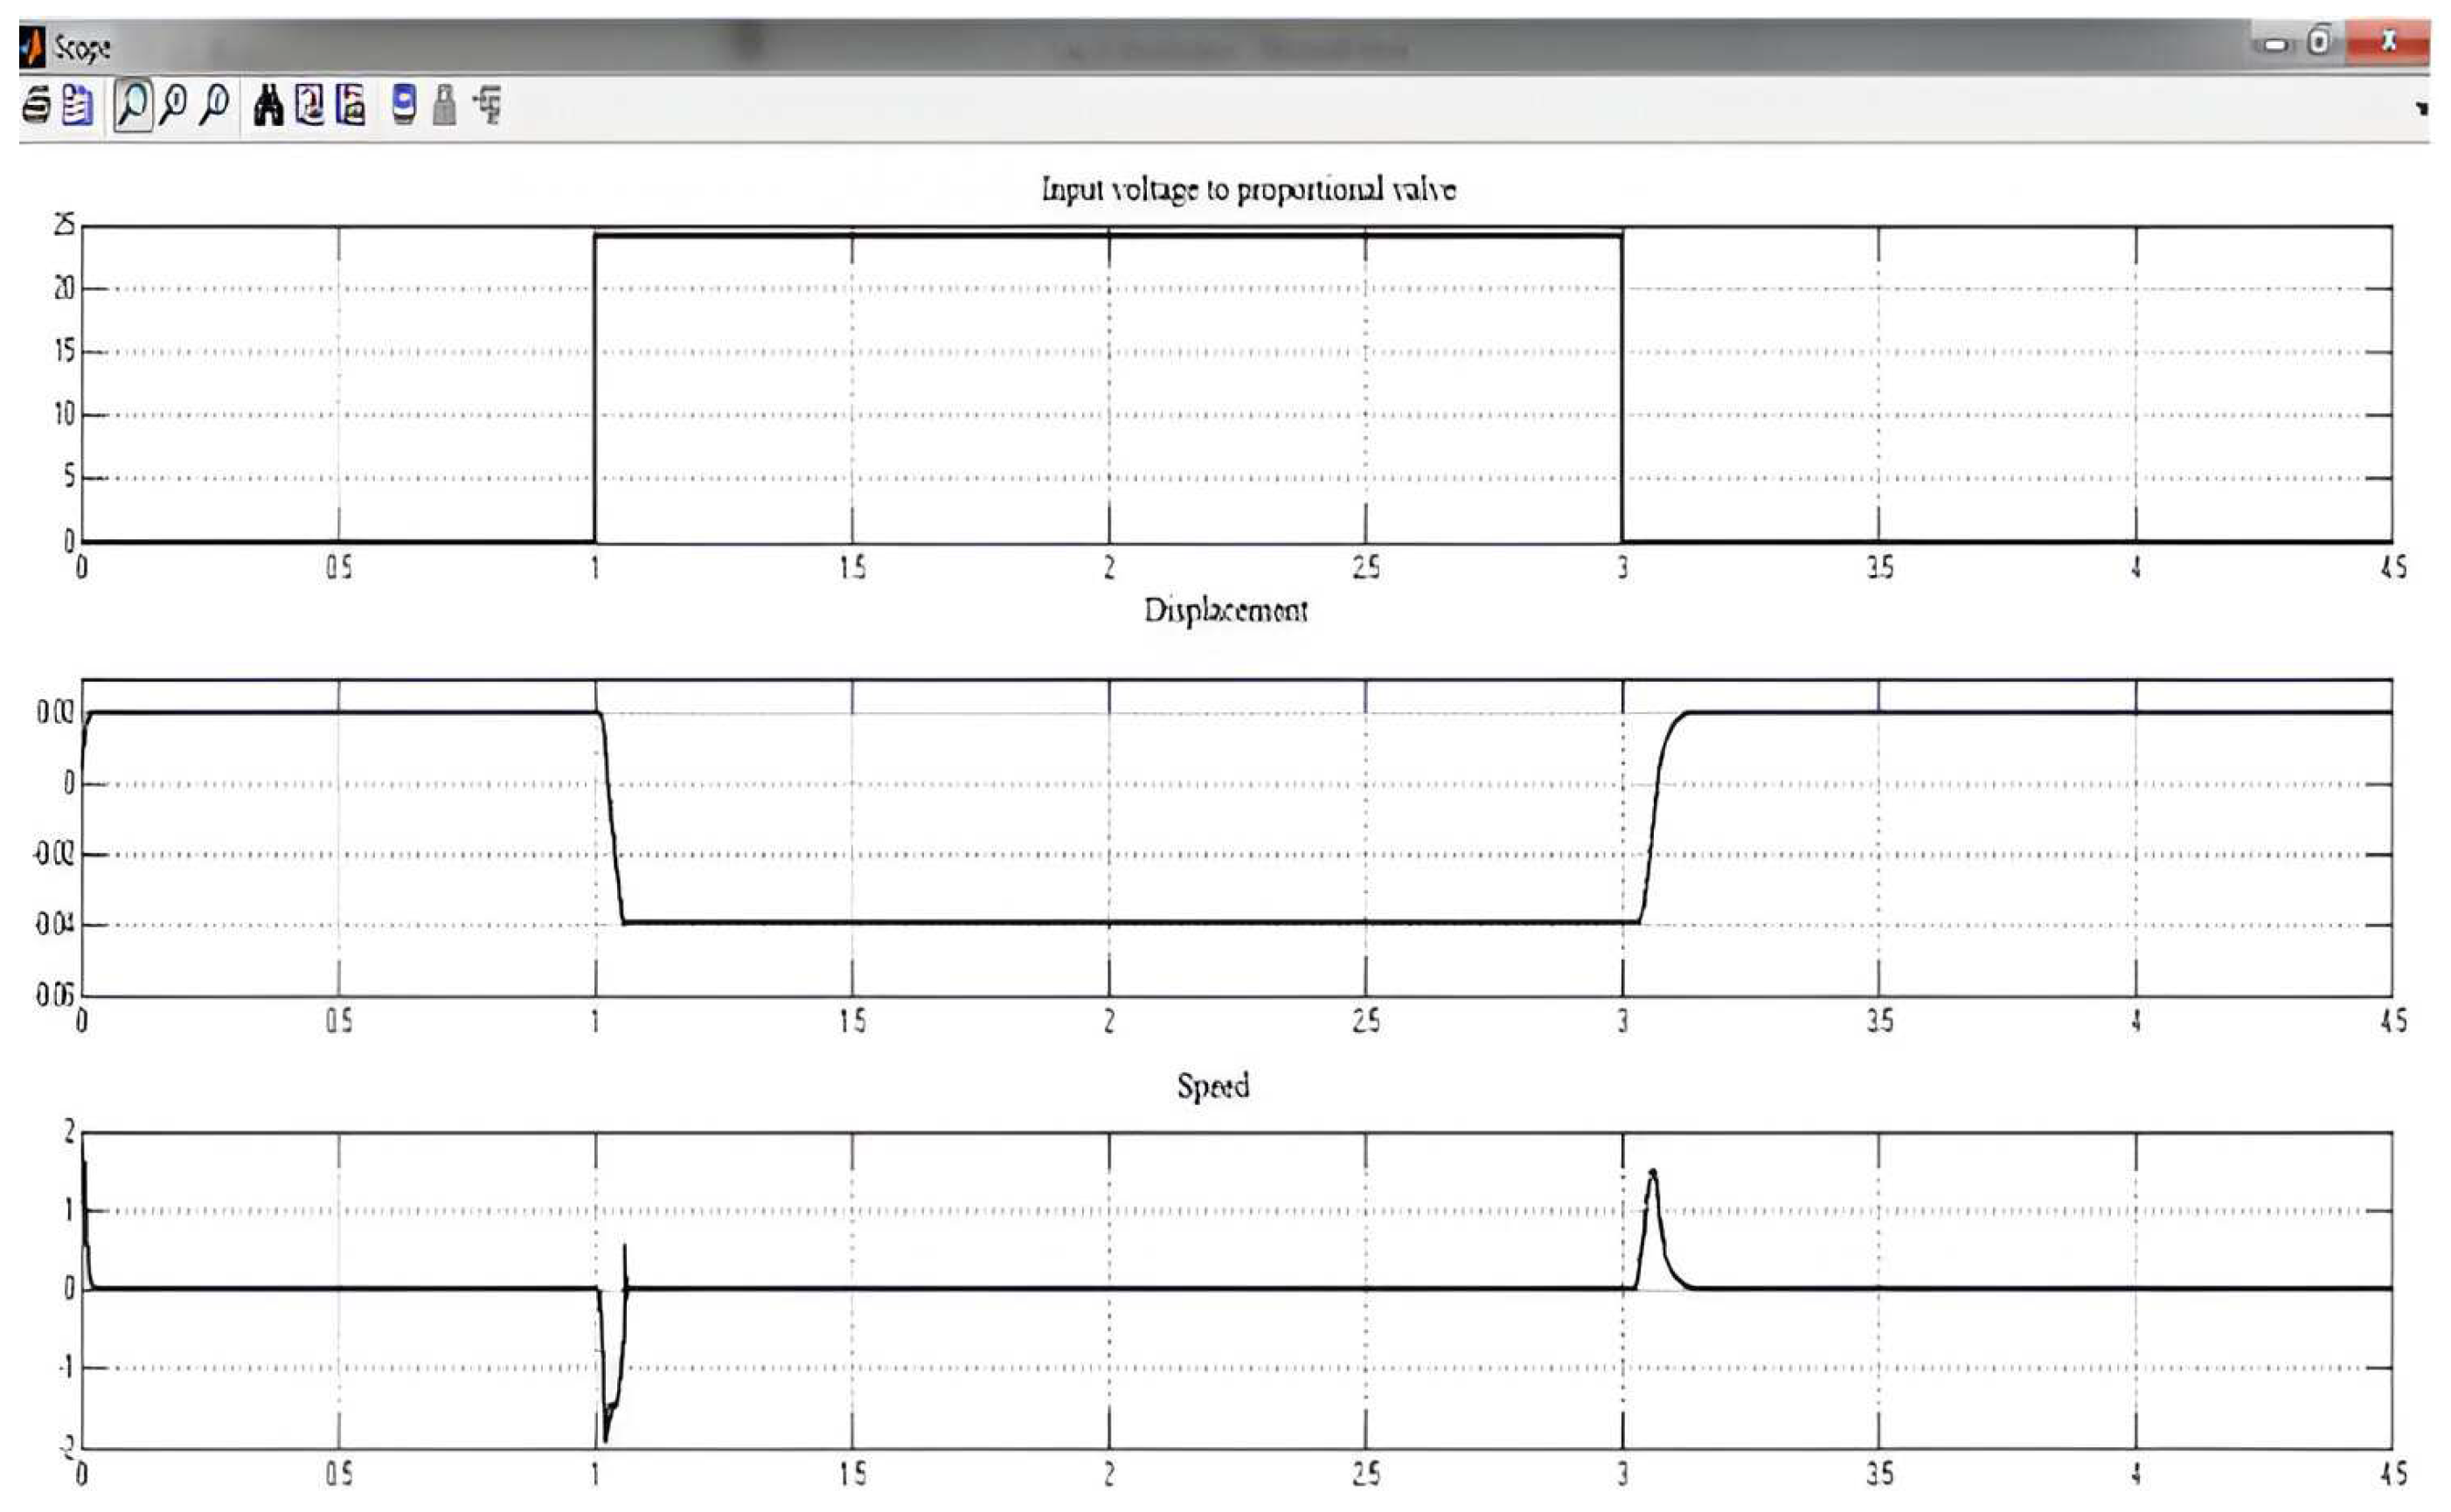
The model of pneumatic proportional valve includes the characteristics mechanics, electrical and pneumatical of such a component, using the values for the parameters from the datasheet. Simulations of displacement and speed of PAM to a pulse input voltage are shown in
Figure 20.
There were determined the inflation-deflation times (measured as increasing and respectively decreasing time): 0.0315 [s] – inflation and 0.0474 [s] – deflation. The difference between response of PAM and that of PAM-proportional valve system is given by the delay of proportional valve which is 0.005 [s] – advancing; 0.0075 [s] – retracting.
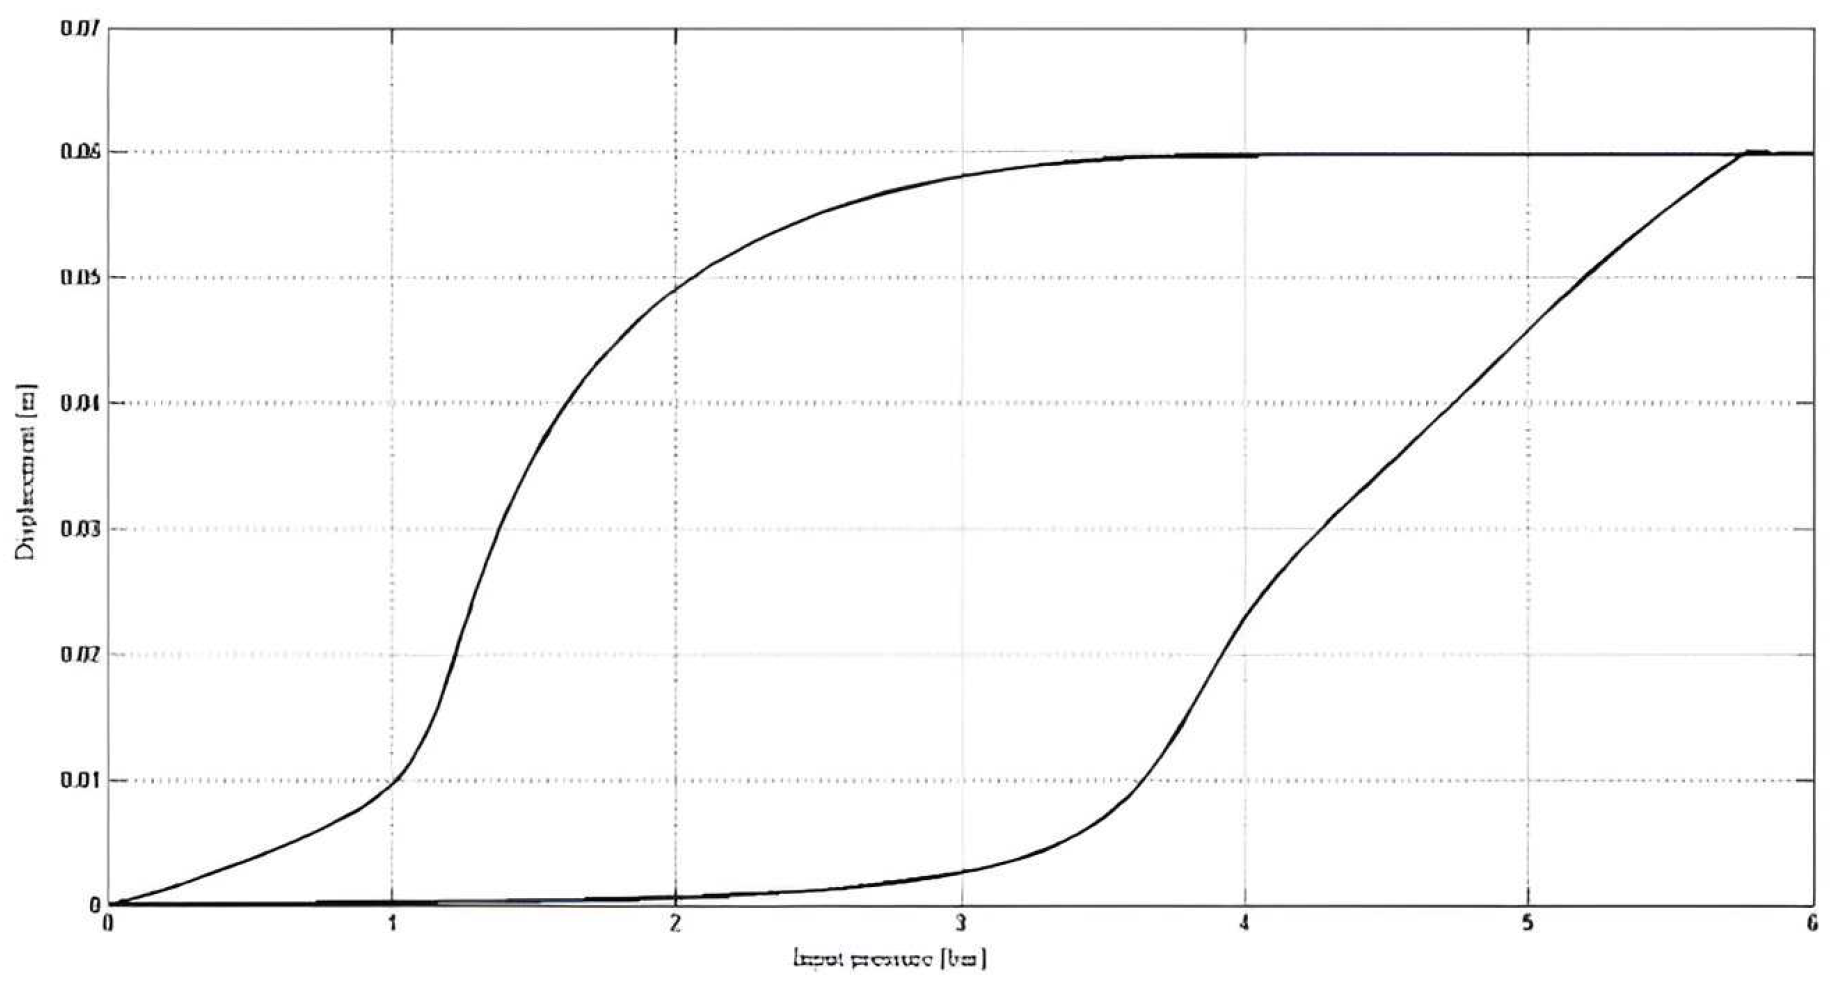
Furthermore is determined the dependence displacement-input pressure, being important to validate the mechanical model simulated in Simscape. Thus, based on this model was obtained the same hysteresis (
Figure 21) as that based on experimental data.
The large area enclosed by the hysteresis curve is determined by a very rapid variation in pressure, which does not allow the PAM to return to the same trajectory as during inflation, due to the inertia of the elastic deformation of the muscle.
5. Dynamic Controlled System
To be able to simulate a system that include the PAM mechanical model it should be modeled all the electro-pneumatic components including a proportional directional valve and controller. The model PAM-proportional directional valve had a behavior similar to real one, gained in the experiment. As controller, it was considered that a PID will be the best solution for this type of actuating. PID was implemented on the feedback loop, the input was the position given by a position transducer, and the output is the pressure control circuit. The proportional pressure controller corresponds to the circuit formed by the proportional-pressure regulator MPPES–3–1/4–6–010 and the set-point element MPZ–1–24DC–SGN–65W, both supplied by FESTO. As inputs were considered three types of signals: triangular, pulse and random. The type of these signals is associated with the most common signal in industry (in logistics application for manipulators pneumatically actuated or for pick-and-place working stations).
Responses to these input signals are presented in
Figure 22 (a – triangular input, b – pulse input and c – random input). It can be seen that, after the implementation of PID controller, the output of the system respects the shape of the reference signal. There is a delay, determined by the force of the load and, in the case of PAM, being an elastic element, sudden transitions from one position to another are achieved by oscillations around the desired final positions.
The results form the above simulations were validated by some simulation using ProPneu [
32]. This software is created using datasheet parameters of the muscles from Festo, and experimental data gained by the company.
Thus, for a 20 [mm] diameter muscle, the maximum stroke of 200 [mm], input pressure of 6 [bar], the input data are shown in
Figure 23.
The software provides output data for both the inflation and deflation movements. Thus it was obtained an upward position time of 0.19 [s] and, respectively, a discharge time of 0.25 [s]. The average speeds, for the two movements, are: 1.05 [m/s], respectively 0.81 [m/s], the maximum speeds being 2.43 [m/s] (reached after 0.173 [s]) and, respectively, for the push-off phase (downward movement of the muscle) 1.96 [m/s] (reached after 2.222 [s]).
The simulation diagrams are presented in
Figure 24.
Analyzing position (
Figure 24a), during ascending movement, the steady-state time is 0.185 [s], for which the maximum stroke of 200 [mm] is reached. The rise time (the time interval in which the signal travels the distance between 10% and 90% of the stabilized value) is 0.074 [s], the muscle has a delay of 0.148 [s] (the time when the signal reaches 50% of the stabilized value). On the downslope, the relaxation time is 0.21 [s]. The speed is less constant in the two zones of growth, respectively relaxation, where the maximum and minimum jumps appear.
Also there were drawn the acceleration and input pressure diagrams.
Figure 24b shows that the supply pressure is delayed both in the up and down areas, deviations that generate the speed and acceleration jumps, respectively the position delay. Thus, the input pressure on the ascending area stabilizes at the final value of 6 [bar] (the value that coincides with the entered value, resulting in zero internal and external losses) after 0.342 [s]. The growth time is 0.201 [s] and the delay is 0.142 [s]. On the down area, the zero value is reached after 0.283 [s] after power is cut off. The maximum throttle jump is 26.08 [m/s
2], reached after 0.106 [s] of the pressure supply, and the minimum is reached after 2.075 [s] of the start of the power supply and has a value of -9.68 [m/s
2]. The minimum constant acceleration zone is generated by the slow speed drop to the minimum value, suddenly climbing to zero.
In the case of a muscle with 10 [mm] diameter muscle, maximum stroke of 200 [mm], input pressure of 6 [bar] there were obtained: positioning time at upward movement of 0.23 [s] and, respectively, a discharge time of 0.24 [s]. The average speeds are close in size for the two phases: 0.88 [m/s] and 0.83 [m/s] respectively, with maximum speeds of 2.16[m/s] (reached after 0.215 [s]) and for the discharge phase (muscle downward movement) 1.96 [m/s] (reached after 2.244 [s]) respectively. From the point of view of the position in the ascending area, the steady state time is 0.23 [s], for which the maximum travel of 200 [mm] is reached. The growth time is 0.103 [s], the muscle having a delay of 0.185 [s]. On the descending area, the relaxation time is 0.24 [s]. The speed is less constant on the two growth areas, respectively relaxation, where the jumps of maximum and minimum occur.
For the same muscle, the input pressure is delayed on both the up and down areas, deviations that actually generate the speed and acceleration jumps, respectively the position delay. Thus, the input pressure on the ascending area stabilizes at the final value of 6 [bar] (value that coincides with the entered value, resulting in zero internal and external losses) after 0.219 [s]. The growth time is 0.135 [s] and the delay is 0.085 [s]. On the down area, the zero value is reached after 0.177 [s] after power is stopped. The maximum throttle jump is 18.36 [m/s2], reached after 0.134 [s] of the pressure supply, and the minimum is reached after 2.059 [s] of the start of the power supply and has a value of -9.86 [m/s2]. The minimum constant acceleration zone is generated by the slow speed drop to the minimum value, suddenly climbing to zero.
6. Conclusion
The mechanical model designed by the authors was simulated in Simscape and the results were very closed to those from experimental data, certifying the validity of this model. The values gained using ProPneu are very closed to those obtained for the mechanical model developed by the authors.
All the above simulations compare to experiments validate the mechanical model (
Figure 15) design by the authors. Thus, in future pneumatic driving systems, that will used PAM, there may be done pre-design by simulating the system.
Author Contributions
Conceptualization, C.C., C.I.C. and I.I.; methodology, C.I.C. and C.G.; software, C.C.; validation, C.I.C., C.G. and I.I.; formal analysis, C.G.; investigation, C.I.C.; resources, C.C. and I.I.; data curation, C.C. and I.I.; writing—original draft preparation, C.C.; writing—review and editing, C.C. and C.I.C.; visualization, C.I.C; supervision, C.C.; project administration, C.C. All authors have read and agreed to the published version of the manuscript.
Funding
This research received no external funding.
Abbreviations
The following abbreviations are used in this manuscript:
| PAM |
pneumatic artificial muscle |
| PID |
proportional integral derivative controller |
| MPYEproportional directional valve |
| MPPES |
proportional-pressure regulator |
References
- Do Rosario Carvalho, A.D.; Karanth, N.; Desai, V. Characterization of pneumatic muscle actuators and their implementation on an elbow exoskeleton with a novel hinge design, Sensors and Actuators Reports, 2022, Volume 4, pp. 1-15. [CrossRef]
- Gaylord, R.H. Fluid actuated motor system and stroking device, US Patent 2844126, July, 1955, https://patents.google.com/patent/US2844126A/en.
- Xu, Y.; Fang, Q.; Li, H. Kinematic and quasi-static analysis model of a novel variable stiffness pneumatic artificial muscle, Sensors and Actuators A: Physical, 2021, Volume 329, pp. 1-17. [CrossRef]
- Soleymani, R.; Khajehsaeid, H. A mechanical model for McKibben pneumatic artificial muscles based on limiting chain extensibility and 3D application of the network alteration theories, Solids and Structures, 2020, Volume 202, pp. 620-630. [CrossRef]
- Verrelst, B.; Van Ham, R.; Vanderborght, B.; Lefeber, D.; Daerden, F.; Van Damme, M. Second generation pleated pneumatic artificial muscle and its robotic applications, Advanced Robotics, 2012, Volume 20, pp. 783-805. [CrossRef]
- Fluidic Muscle DMSP/MAS, Available online: https://www.festo.com/rep/en_corp/assets/pdf/info_501_en.pdf (accessed on 06.04.2023).
- Jouppila, V.; Gadsden, S.A.; Ellman, A. Experimental Comparisons of Sliding Mode Controlled Pneumatic Muscle and Cylinder Actuators, Dynamic Systems, Measurement, and Control, 2014, Volume 136, p. 044503. [CrossRef]
- Cullell, A.; Moreno, J.C.; Rocon, E.; Forner-Cordero, A.; Pons, J.L. Biologically based design of an actuator system for a knee–ankle–foot orthosis, Mechanism and Machine Theory, 2009, Volume 44, pp. 860-872. [CrossRef]
- Merola, A.; Colacino, D.; Cosentino, C.; Amato, F. Model-based tracking control design, implementation of embedded digital controller and testing of a biomechatronic device for robotic rehabilitation, Mechatronics, 2018, Volume 52, pp. 70–77. [CrossRef]
- Lovasz, E.; Margineanu, D.; Ciupe, V.; Maniu, I.; Gruescu, C.; Zăbavă, E.; Stan, S. Design and control solutions for haptic elbow ex-oskeleton module used in space telerobotics, Mechanism and Machine Theory, 2017, Volume 107, pp. 384–398. [CrossRef]
- Li, J.F.; Cao, Q.; Zhang, C.Z.; Tao, C.J.; Ji, R. Position solution of a novel four-DOFs self-aligning exoskeleton mechanism for upper limb rehabilitation, Mechanism and Machine Theory, 2019, Volume 141, pp. 14–39. [CrossRef]
- Sarosi, J.; Biro, I.; Nemeth, J.; Cveticanin, L. Dynamic modeling of a pneumatic muscle actuator with two-direction motion, Mechanism and Machine Theory, 2015, Volume 85, pp. 25–34. [CrossRef]
- Maciejewski, I.; Krzyzynski, T.; Meyer, H. Modeling and vibration control of an active horizontal seat suspension with pneumat-ic muscles, Vibration and Control, 2018, Volume 24, pp. 5938–5950. [CrossRef]
- Peng, Y.; Liu, Y.G.; Yang, Y.; Liu, N. Development of continuum manipulator actuated by thin McKibben pneumatic artificial muscle, Mechatronics, 2019, Volume 60, pp. 56–65. [CrossRef]
- Oliver-Salazar, M.A.; Szwedowicz-Wasik, D.; Blanco-Ortega, A.; Aguilar-Acevedo, F.; Ruiz-González, R. Characterization of pneumatic muscles and their use for the position control of a mechatronic finger, Mechatronics, 2017, Volume 42, pp. 25–40. [CrossRef]
- Meng, W.; Xie, S.Q.; Liu, Q.; Lu, C.Z.; Ai, Q.S. Robust iterative feedback tuning control of a compliant rehabilitation robot for repetitive ankle training, IEEE ASME Transactions on Mechatronics, 2017, Volume 22, pp. 173–184. [CrossRef]
- Tondu, B. Modelling of the McKibben artificial muscle: a review, Intelligent Material Systems and Structures, 2012, Volume 23, pp. 225–253. [CrossRef]
- Xu, J.H.; Xiao, M.B.; Ding, Y. Modeling and compensation of hysteresis for pneumatic artificial muscles based on Gaussian mixture models, Science China Technological Sciences, 2019, Volume 62, pp. 1094–1102. [CrossRef]
- Hassani, V.; Tjahjowidodo, T.; Do, T.N. A survey on hysteresis modeling, identification and control, Mechanical Systems and Signal Processing, 2014, Volume 49, pp. 209–233. [CrossRef]
- Ruderman, M. Presliding hysteresis damping of LuGre and Maxwell-slip friction models, Mechatronics, 2015, Volume 30, pp. 225–230. [CrossRef]
- Oh, J.H.; Bernstein, D.S. Semilinear Duhem model for rate-independent and rate-dependent hysteresis, IEEE Transactions on. Automatic Control, 2005, Volume 50, pp. 631–645. [CrossRef]
- Fayçal, I. A survey of the hysteretic Duhem model, Computational Methods in Engineering, 2017, Volume 25, pp. 965–1002. [CrossRef]
- Wickramatunge, K.C.; Leephakpreeda, T. Study on mechanical behaviors of pneumatic artificial muscle, Engineering Science, 2010, Volume 48, pp. 188–198. [CrossRef]
- Song, C.; Xie, S.; Zhou, Z.; Hu, Y. Modeling of pneumatic artificial muscle using a hybrid artificial neural network approach, Mechatronics, 2015, Volume 31, pp. 124–131. [CrossRef]
- Reynolds, D.B.; Repperger, D.W.; Phillips, C.A.; Bandry, G. Modeling the dynamic characteristics of pneumatic muscle, Biomedical Engineering, 2003, Volume 31, pp. 310–317. [CrossRef]
- Zhang, W.; Accorsi, M.L.; Leonard, J.W. Analysis of geometrically nonlinear anisotropic membranes: application to pneumatic muscle actuators, Finite Elements in Analysis and Design, 2005, Volume 41, pp. 944–962. [CrossRef]
- Klute, G.K.; Hannaford, B. Accounting for elastic energy storage in McKibben artificial muscle actuators, Dynamic Systems, Measurement and Control, 2000, Volume 122, pp. 386–388. [CrossRef]
- Cao, Jh.; Xie, S.Q.; Das, R. MIMO sliding mode controller for gait exsoskeleton driven by pneumatic muscles, IEEE Trans Control System and Technology, 2018, Volume 26, pp. 274–281. [CrossRef]
- Liu, Q.; Zuo, J.; Zhu, C.; Xie, S.Q. Design and control of soft rehabilitation robots actuated by pneumatic muscles: State of the art, Future Generation Computer Systems, 2020, Volume 113, pp. 620–634. [CrossRef]
- Colbrunn, R.W.; Nelson, G.M.; Quinn, R.D. Design and control of a robotic leg with braided pneumatic actuators, Proceedings 2001 IEEE/RSJ International Conference on Intelligent Robots and Systems. Expanding the Societal Role of Robotics in the Next Millennium (Cat. No.01CH37180), Oct. 2001. [CrossRef]
- Deaconescu, A.; Deaconescu, T. Contribution to the behavioural study of pneumatically actuated artificial muscles, 6th International Conference of DAAAM Baltic Industrial Engineering, Tallinn, Estonia 2008, Vol. 1 pp. 215-220, ISBN 978-9985-59-783-5, http://innomet.ttu.ee/daaam08/Online/Production%20Engineering/Paper1_Deaconescu%20Andrea.pdf.
- ProPneu Software – Festo, Available online: https://festo-propneu.updatestar.com/ (accessed on 10.04.2023).
Figure 1.
McKibben PAM operating principle [
3]
Figure 1.
McKibben PAM operating principle [
3]
Figure 2.
Deformation of PAMs [
3]
Figure 2.
Deformation of PAMs [
3]
Figure 3.
Geometry of PAMs [
3]
Figure 3.
Geometry of PAMs [
3]
Figure 5.
Stiffness, k, as function of muscle length at different pressures
Figure 5.
Stiffness, k, as function of muscle length at different pressures
Figure 6.
Force, F, as function of muscle length at different pressures
Figure 6.
Force, F, as function of muscle length at different pressures
Figure 7.
Force, F, as function of muscle length (between 10 and 50 [mm]) at different pressures
Figure 7.
Force, F, as function of muscle length (between 10 and 50 [mm]) at different pressures
Figure 8.
Experimental stand: (a) experimental stand; (b) experimental circuit
Figure 8.
Experimental stand: (a) experimental stand; (b) experimental circuit
Figure 9.
Force output vs net angle at different pressures
Figure 9.
Force output vs net angle at different pressures
Figure 10.
Force-pressure characteristics for a PAM: (a) 10 [mm] diameter and 98 [mm] length; (b) 20 [mm] diameter and 750 [mm] length
Figure 10.
Force-pressure characteristics for a PAM: (a) 10 [mm] diameter and 98 [mm] length; (b) 20 [mm] diameter and 750 [mm] length
Figure 11.
Outer diameter-pressure variations.
Figure 11.
Outer diameter-pressure variations.
Figure 12.
Length - pressure for a PAM with: (a) 10 [mm] diameter; (b) 20 [mm] diameter.
Figure 12.
Length - pressure for a PAM with: (a) 10 [mm] diameter; (b) 20 [mm] diameter.
Figure 13.
Variation of PAM diameter relative to pressure for a 98 [mm] length muscle
Figure 13.
Variation of PAM diameter relative to pressure for a 98 [mm] length muscle
Figure 14.
Kinematic structure of a PAM
Figure 14.
Kinematic structure of a PAM
Figure 15.
Model of PAM in Matlab
Figure 15.
Model of PAM in Matlab
Figure 16.
Model of PAM driving circuit in Matlab
Figure 16.
Model of PAM driving circuit in Matlab
Figure 17.
Simulation of PAM mechanical model
Figure 17.
Simulation of PAM mechanical model
Figure 18.
Inflation-deflation times
Figure 18.
Inflation-deflation times
Figure 19.
PAM – proportional directional valve model
Figure 19.
PAM – proportional directional valve model
Figure 20.
Simulation of PAM-proportional valve
Figure 20.
Simulation of PAM-proportional valve
Figure 21.
Hysteresis of displacement-pressure simulation
Figure 21.
Hysteresis of displacement-pressure simulation
Figure 22.
PAM responses to: (a) triangular input; (b) pulse input; (c) random input
Figure 22.
PAM responses to: (a) triangular input; (b) pulse input; (c) random input
Figure 23.
Functional diagram and simulation parameters for the pneumatic muscle (20 [mm] diameter) in ProPneu
Figure 23.
Functional diagram and simulation parameters for the pneumatic muscle (20 [mm] diameter) in ProPneu
Figure 24.
Simulation diagrams of PAM (20 [mm] diameter) – ProPneu: (a) position and speed; (b) input pressure, discharge pressure and muscle acceleration
Figure 24.
Simulation diagrams of PAM (20 [mm] diameter) – ProPneu: (a) position and speed; (b) input pressure, discharge pressure and muscle acceleration
|
Disclaimer/Publisher’s Note: The statements, opinions and data contained in all publications are solely those of the individual author(s) and contributor(s) and not of MDPI and/or the editor(s). MDPI and/or the editor(s) disclaim responsibility for any injury to people or property resulting from any ideas, methods, instructions or products referred to in the content. |
© 2023 by the authors. Licensee MDPI, Basel, Switzerland. This article is an open access article distributed under the terms and conditions of the Creative Commons Attribution (CC BY) license (http://creativecommons.org/licenses/by/4.0/).
