Submitted:
14 November 2023
Posted:
15 November 2023
You are already at the latest version
Abstract
Keywords:
1. Introduction
2. Experimental Procedure
3. Results
3.1. Microstructure and Phases Analysis
3.2. Hardness and Wear Tests
3.3. Corrosion Behavior
4. Conclusions
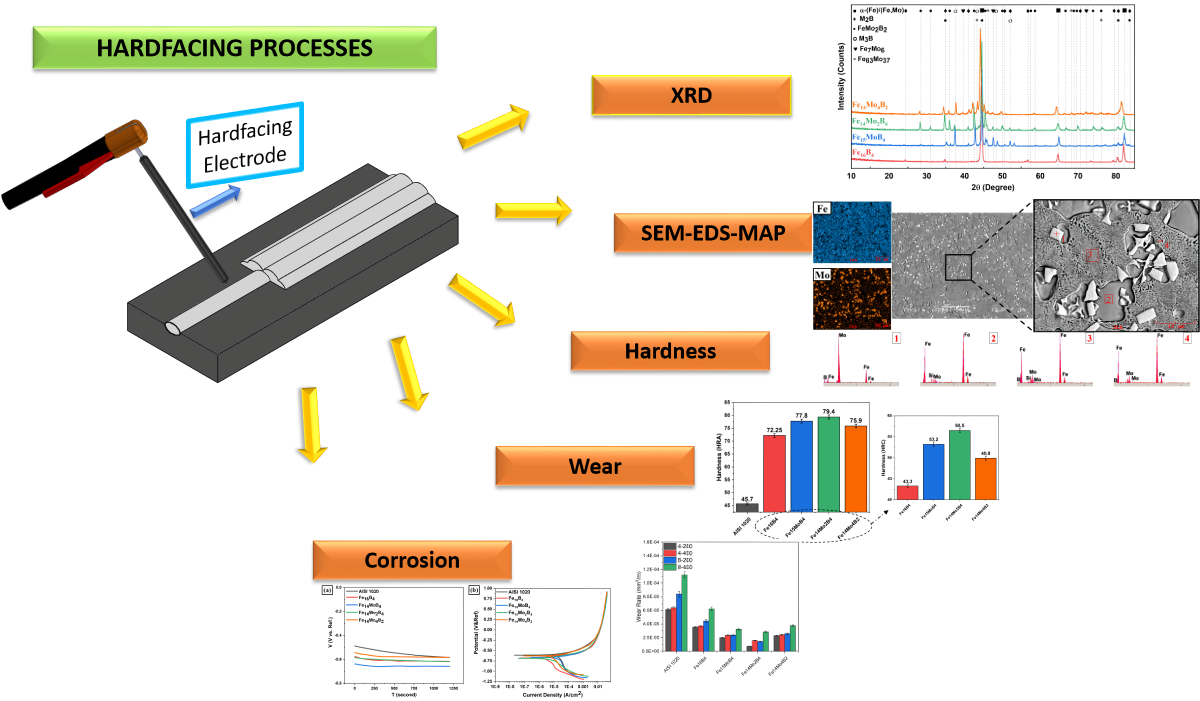
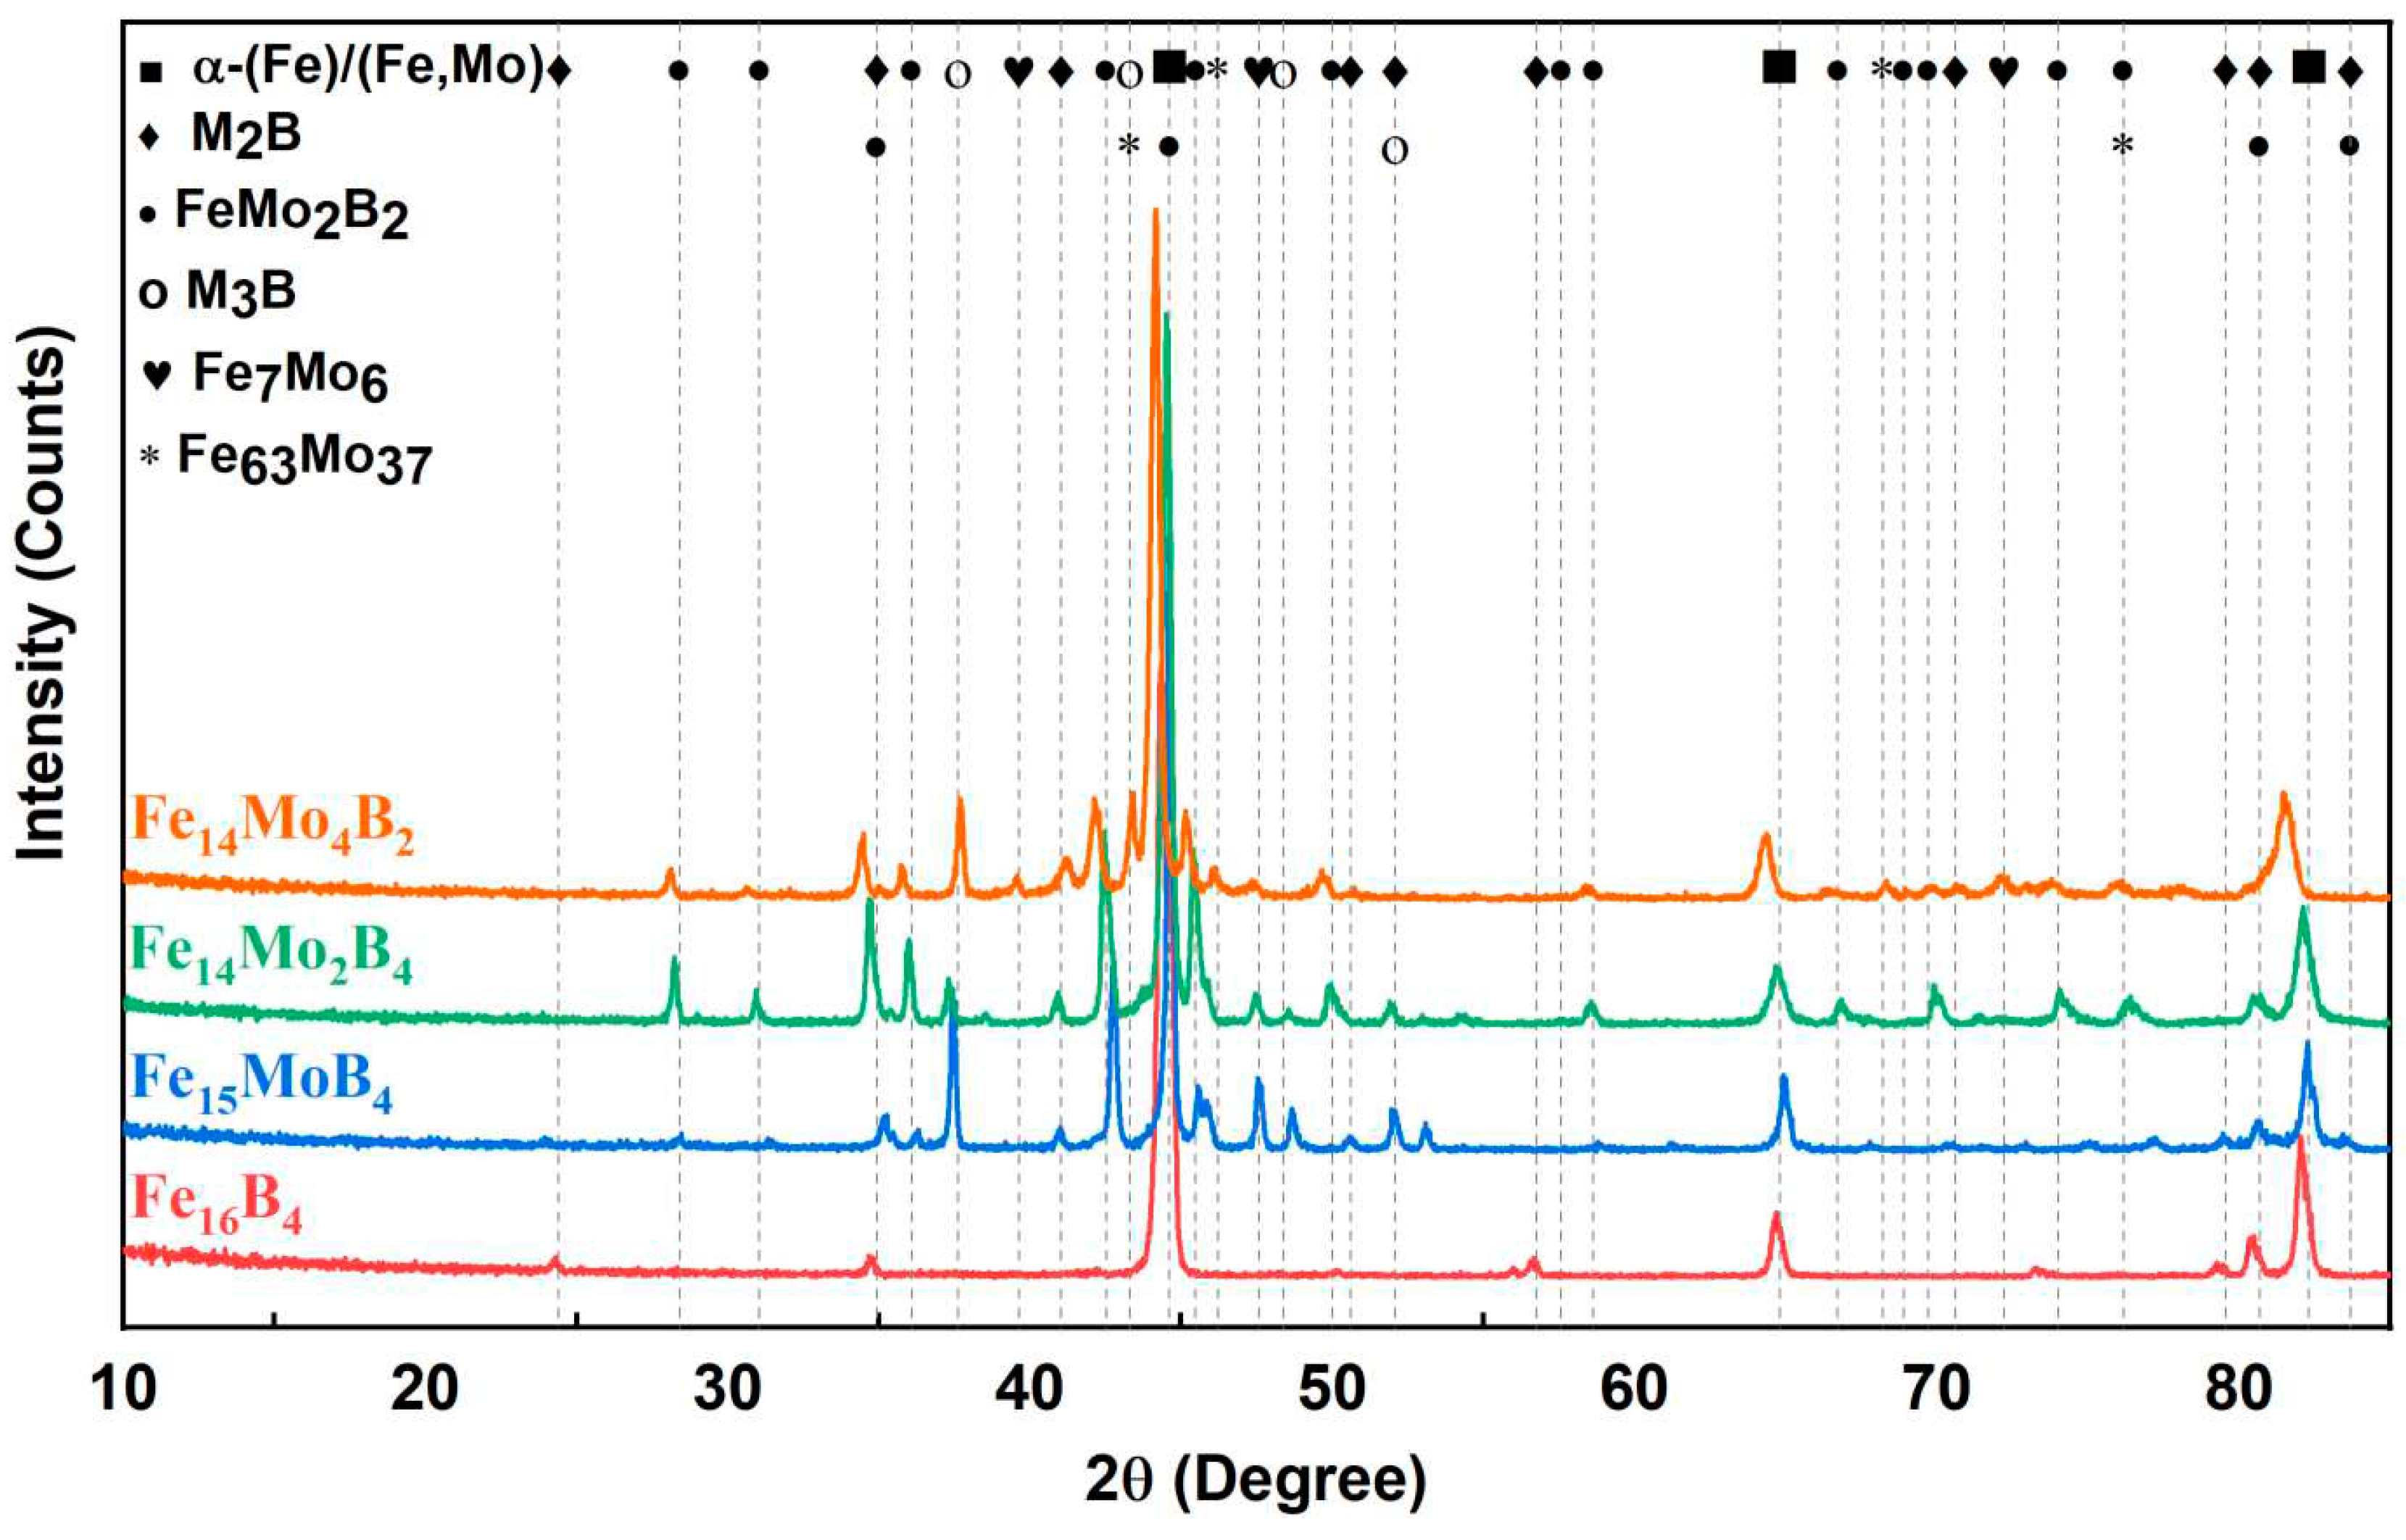
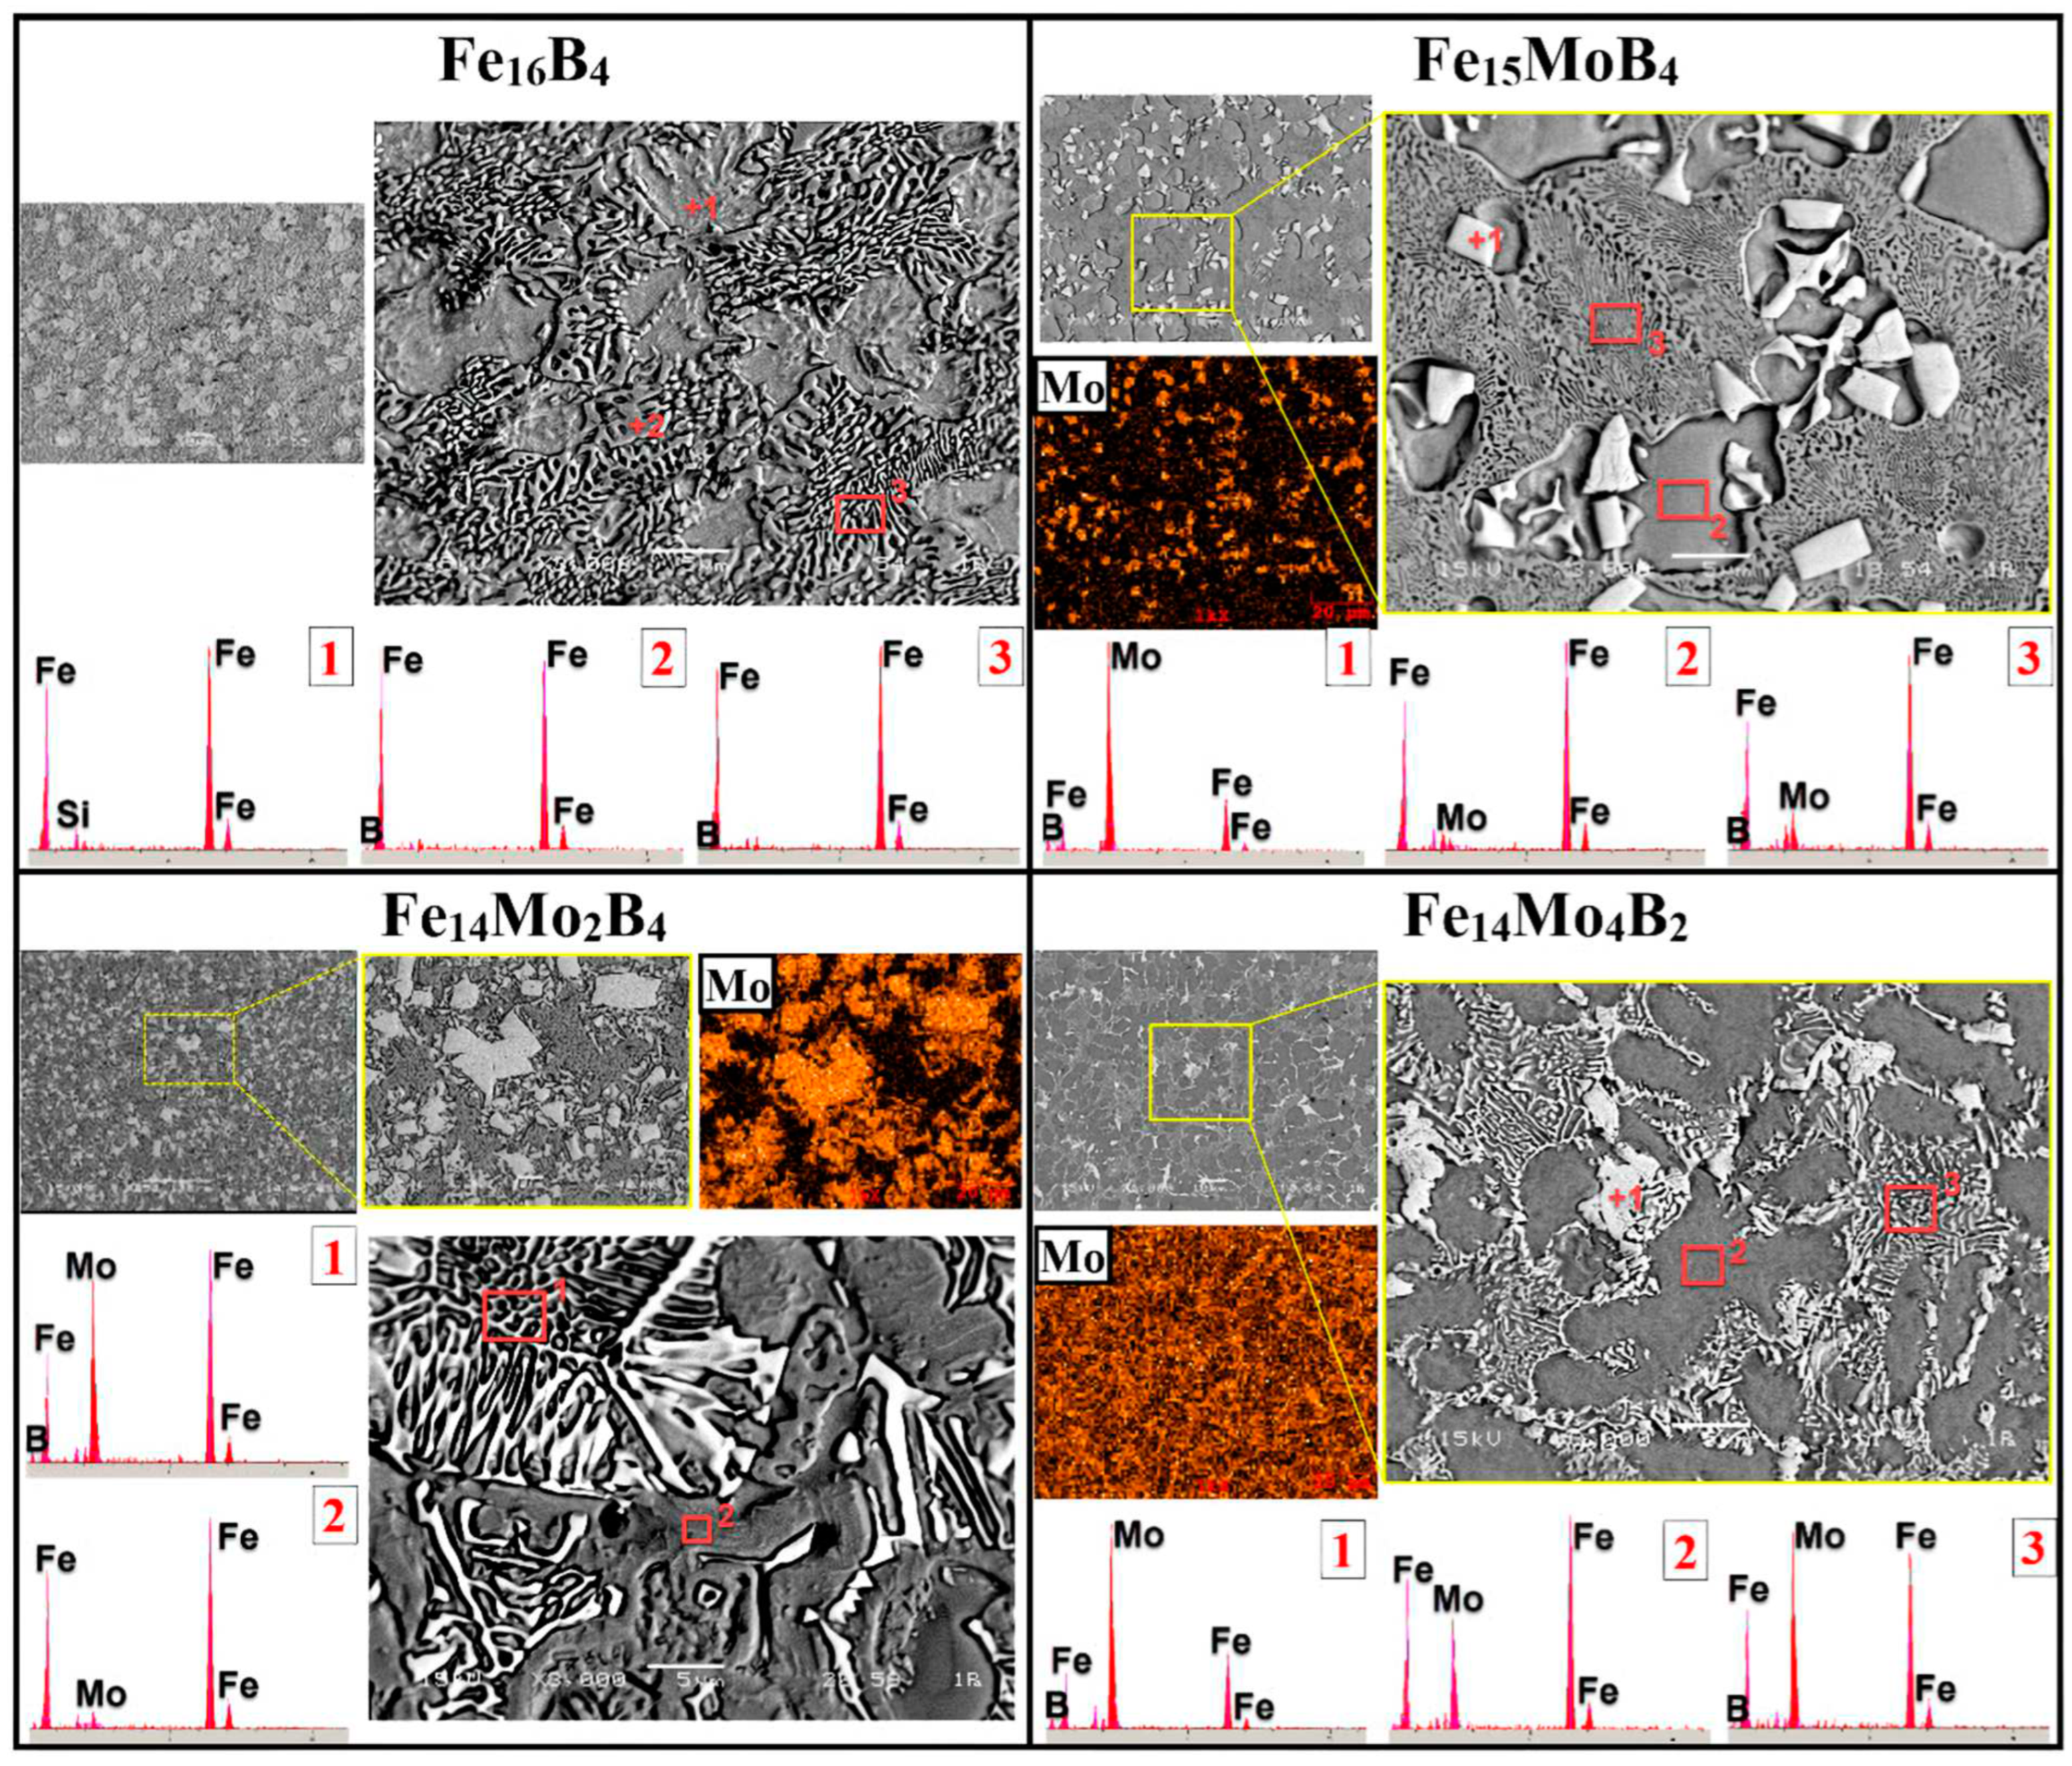
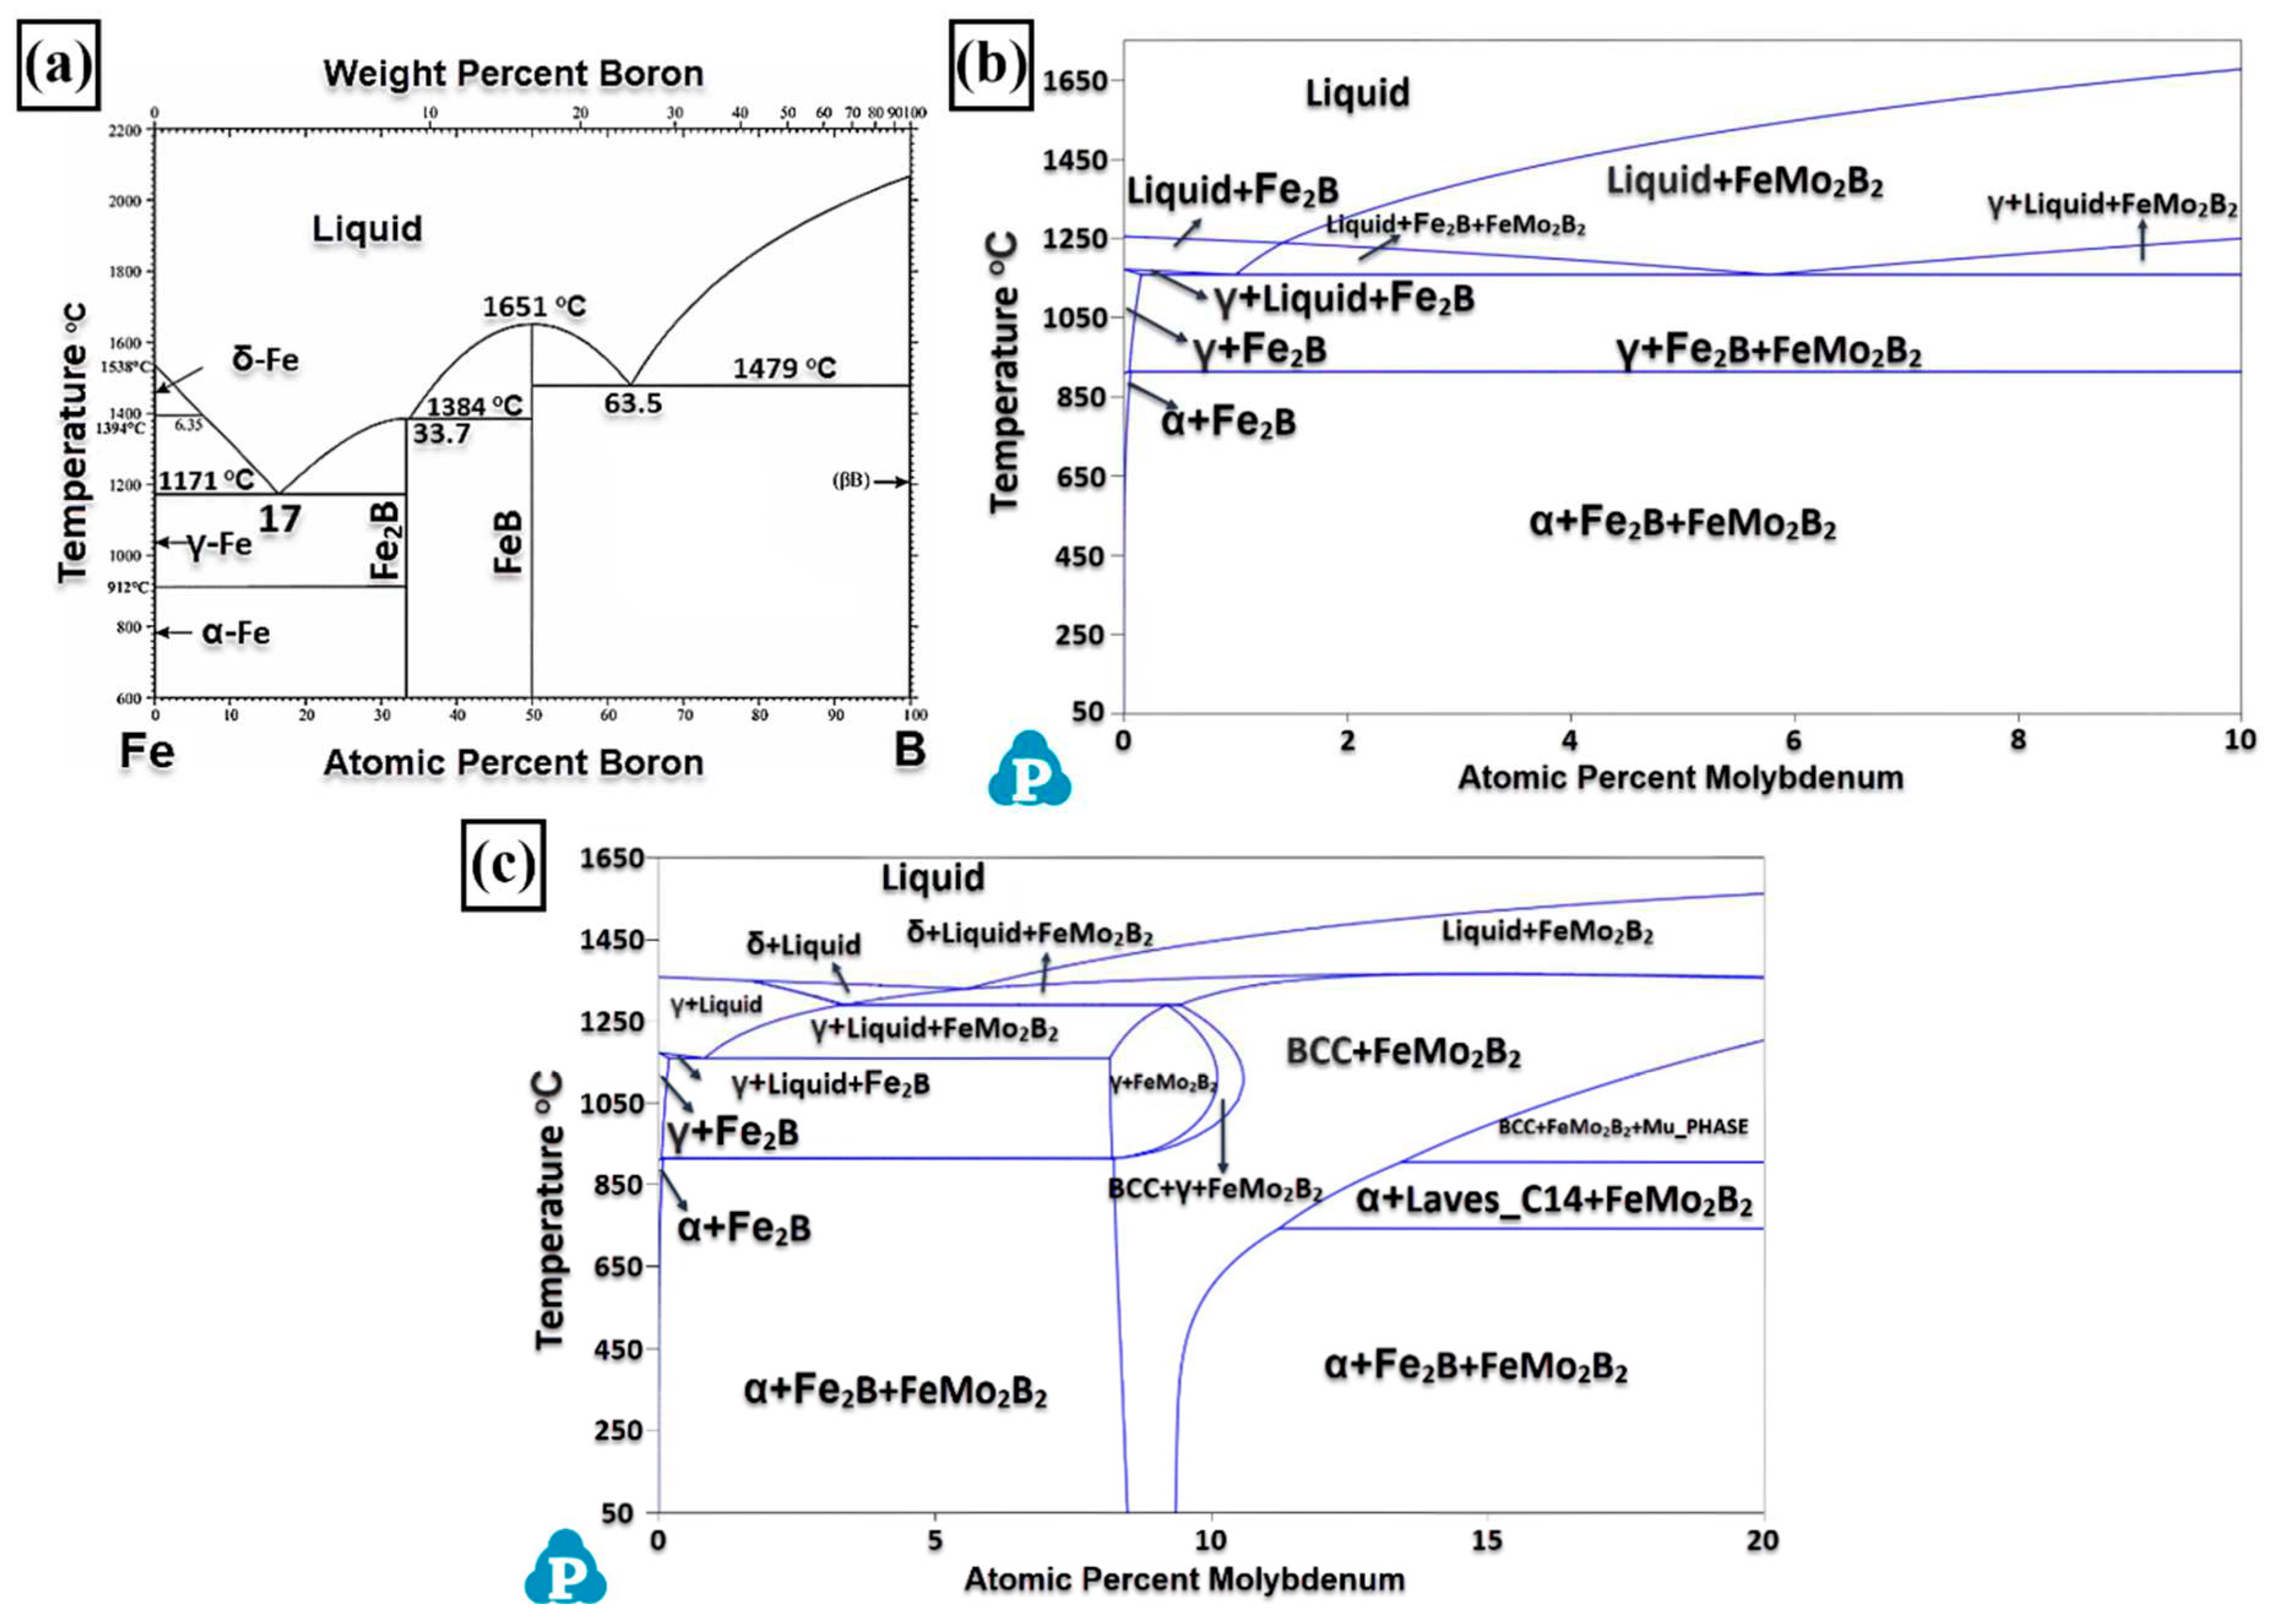
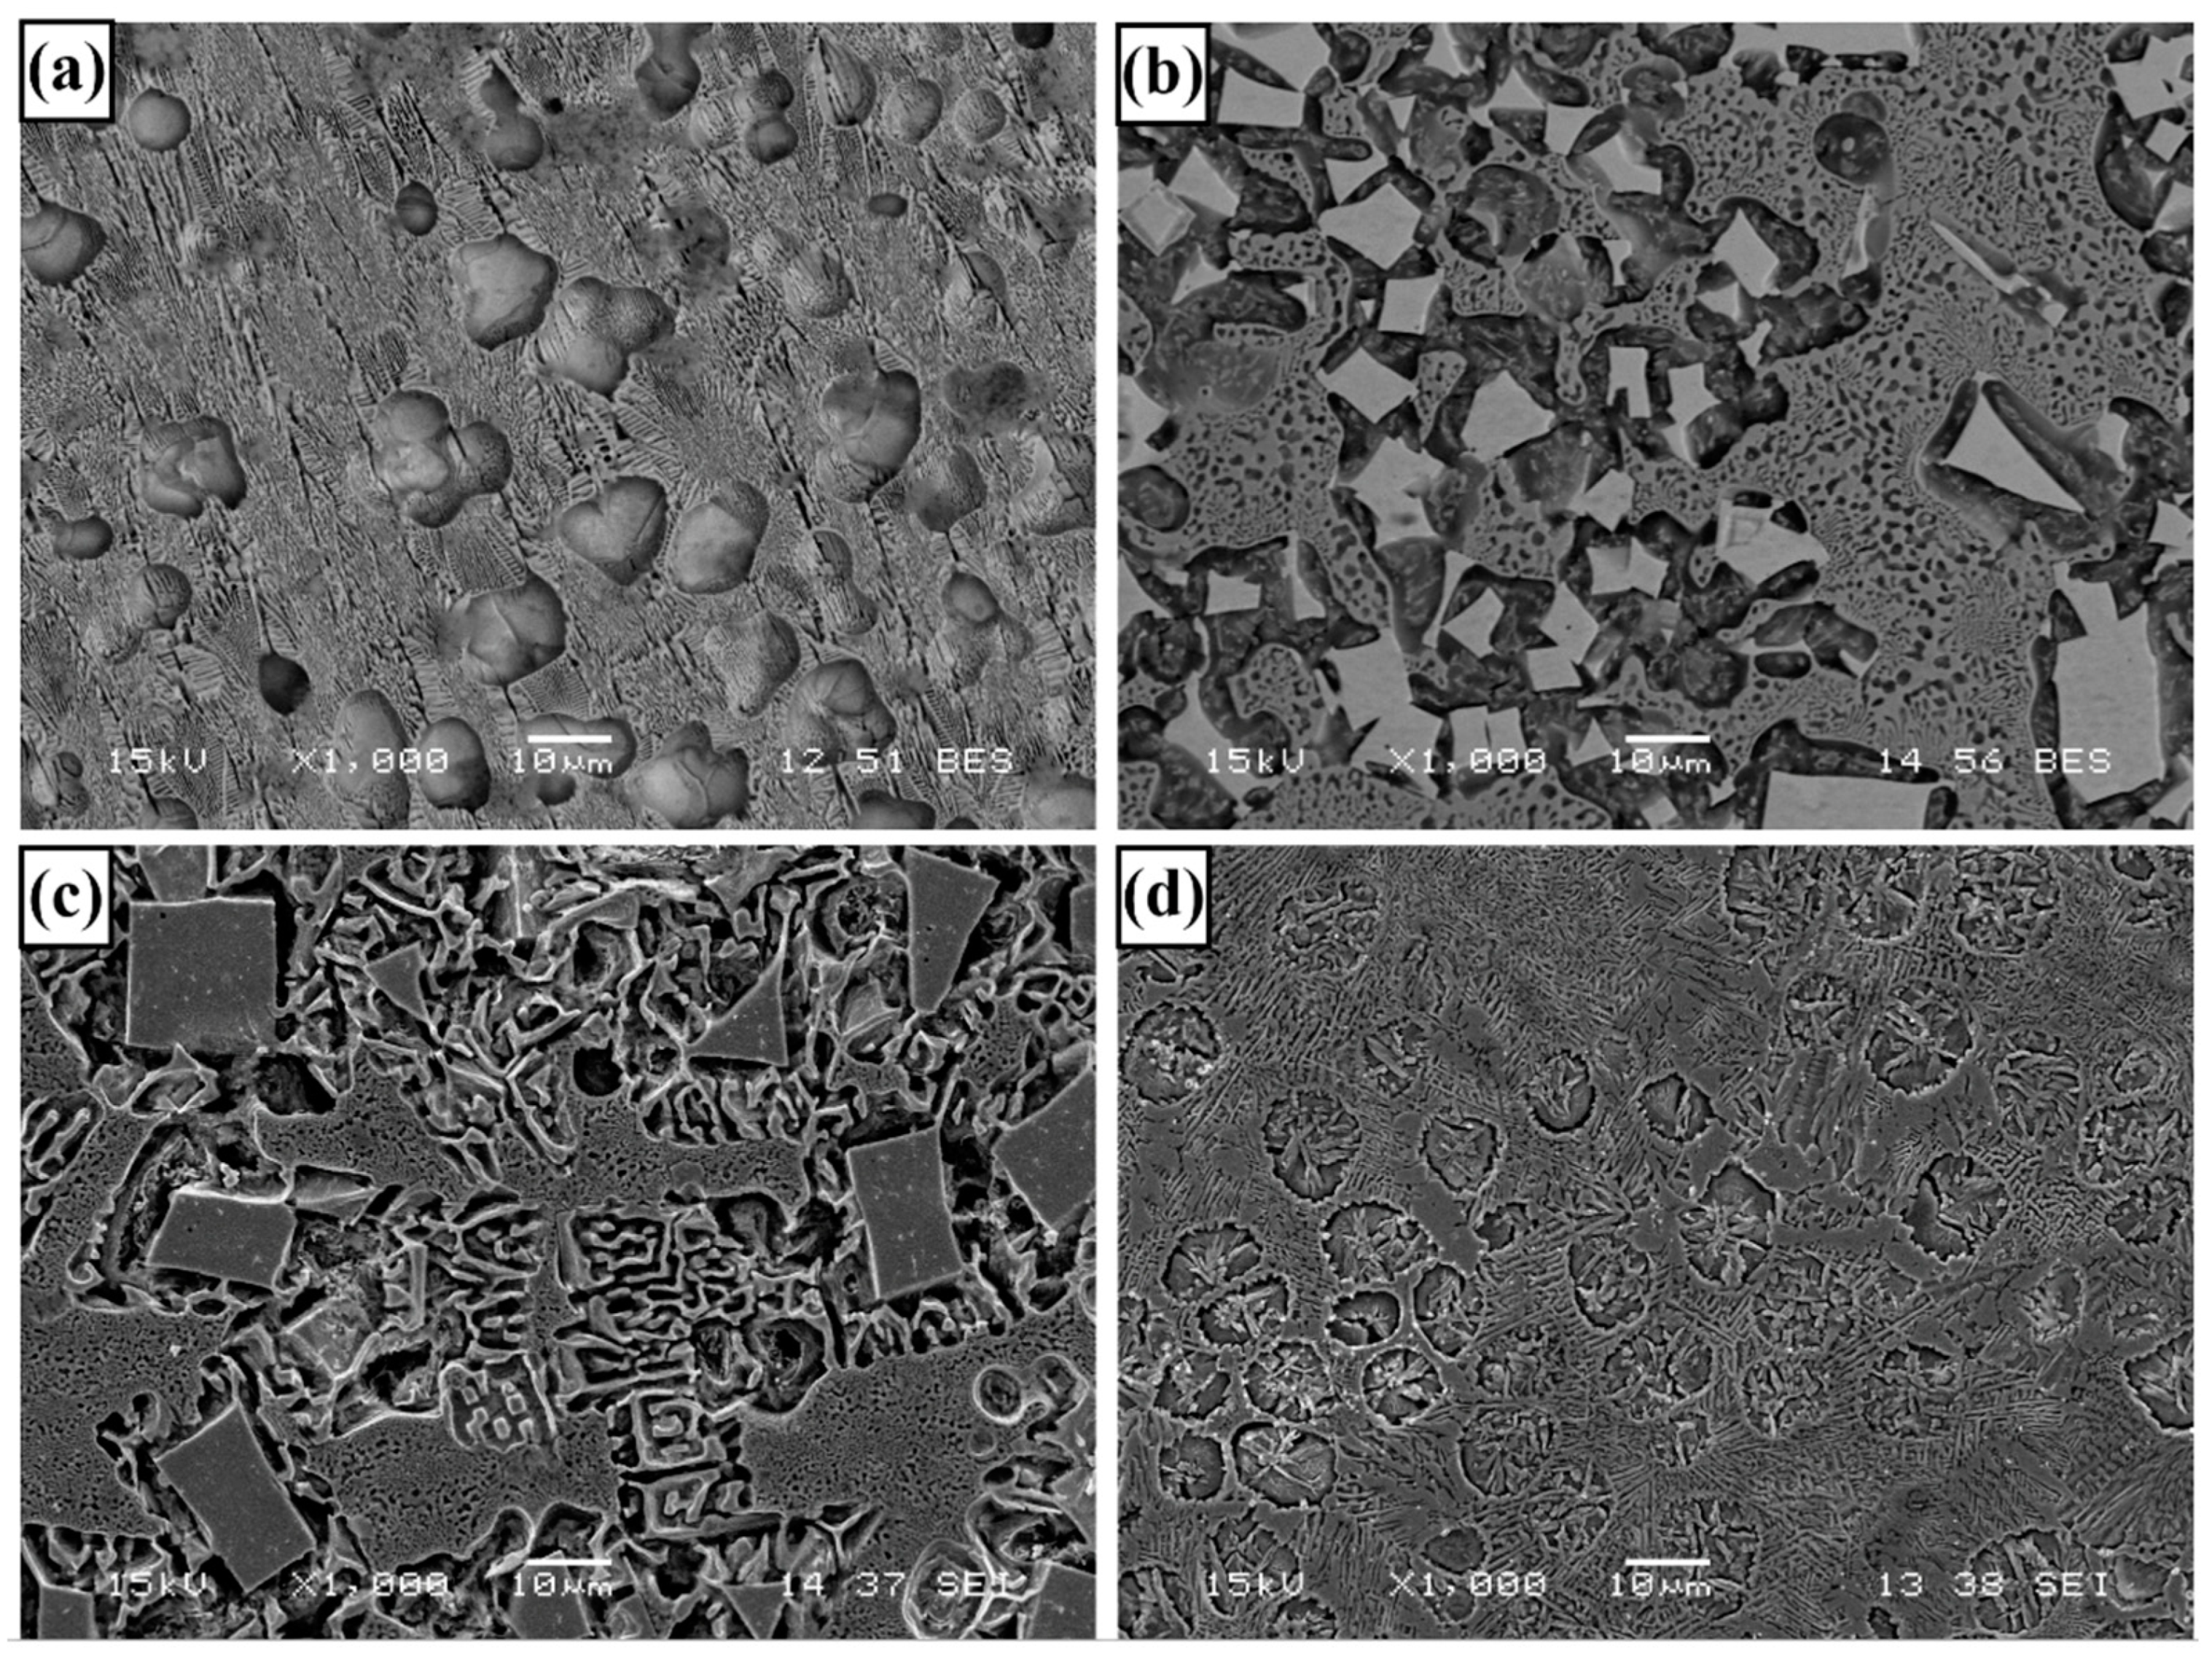
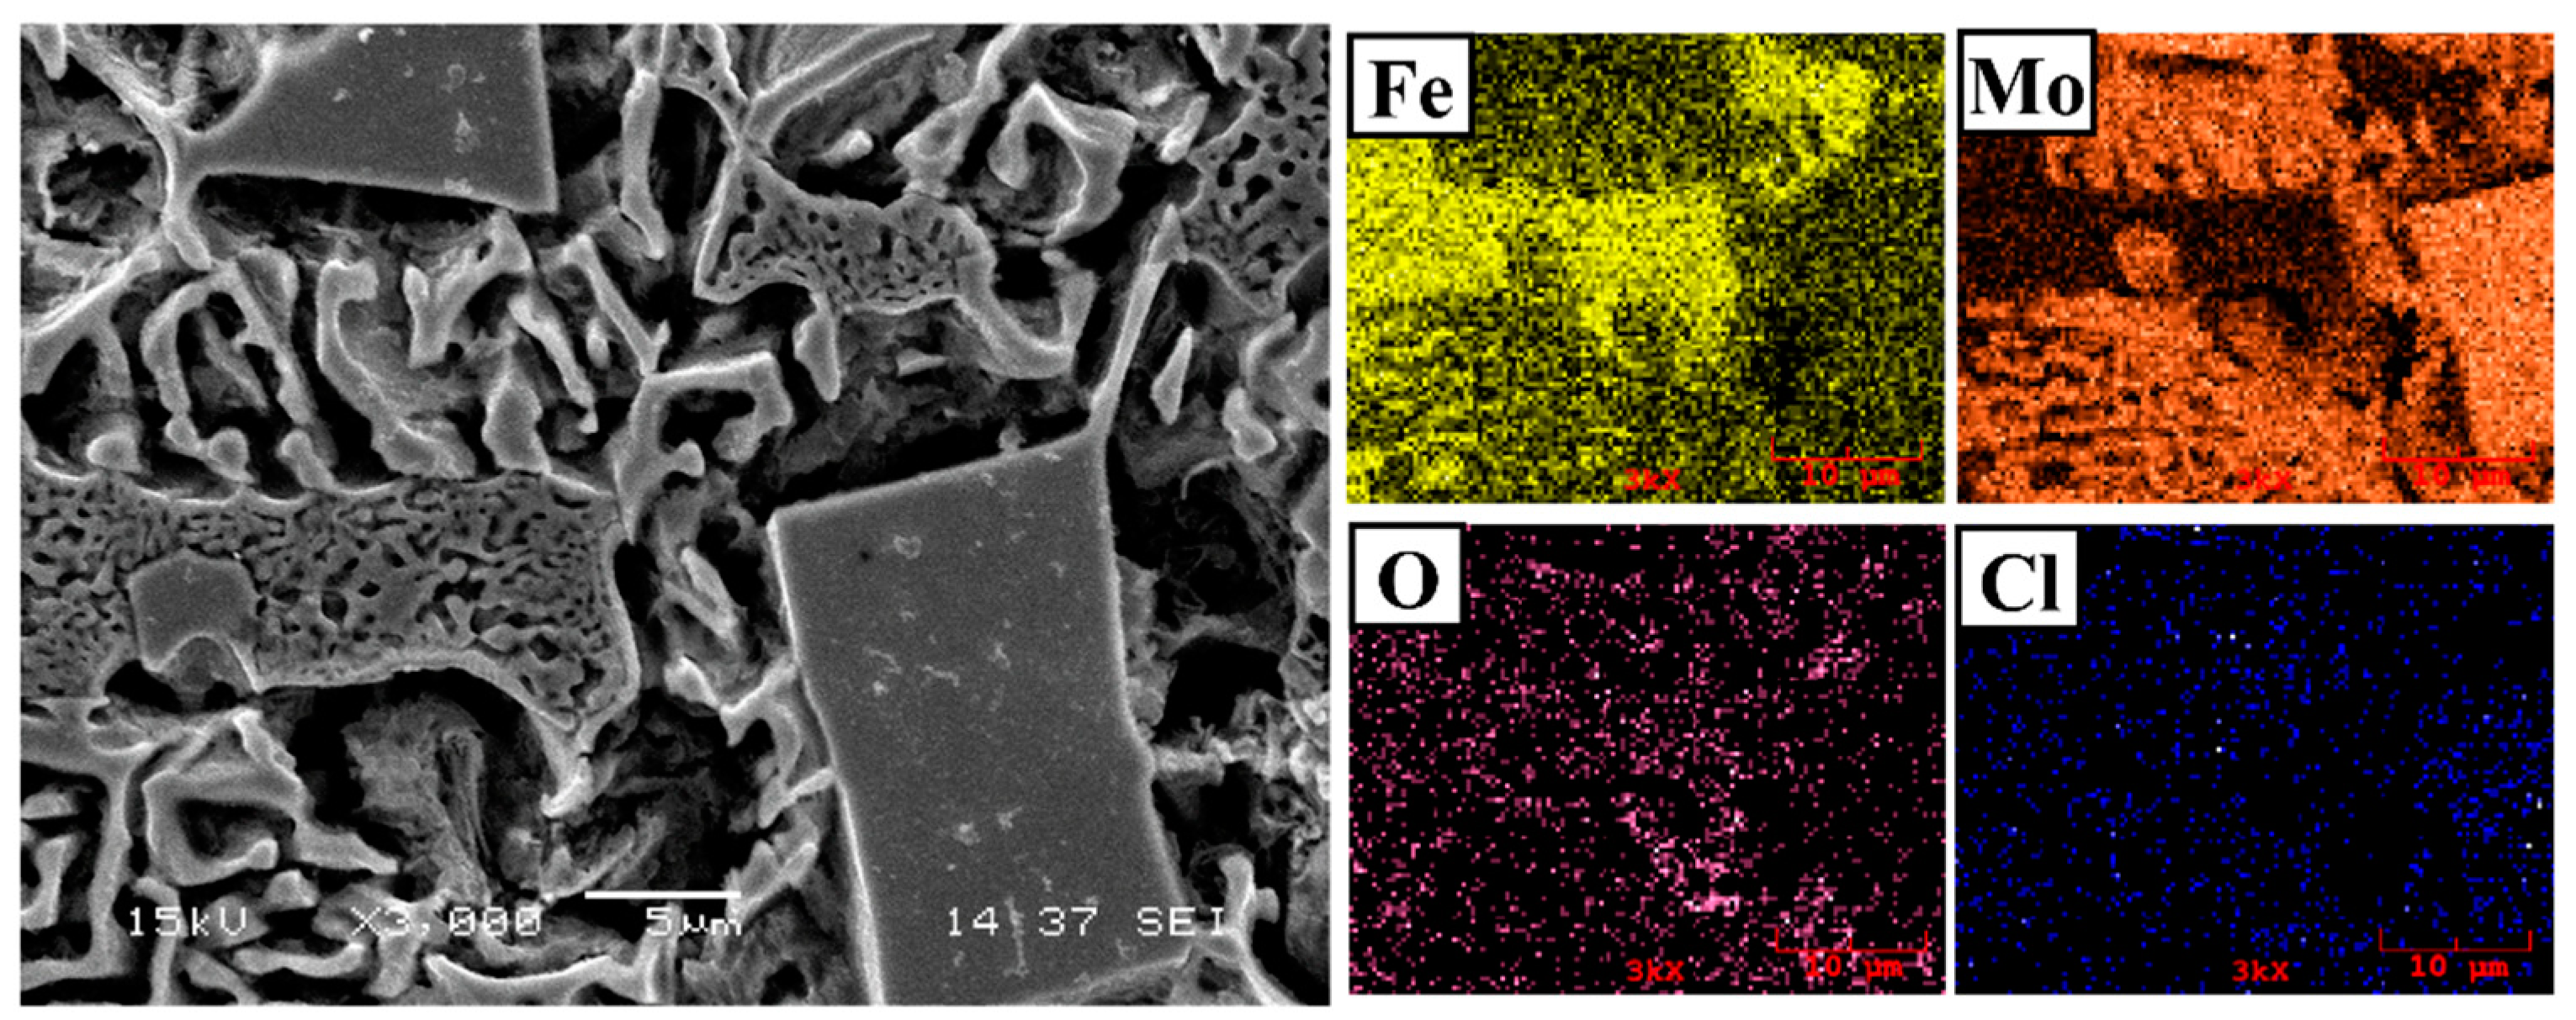
- It has been determined that changes made in the electrode cover composition change the phases in the microstructure and that even trace changes have a significant morphological effect on some phases. In the study, α-Fe, FeMo2B2, Fe2B, and R-Fe63Mo37 phases were detected as major phases, and Fe3B and Fe7Mo6 phases were detected as minor phases. It has also been determined that molybdenum can dissolve in the α-Fe and Fe2B phase and can affect the morphological and mechanical properties of both these phases and the eutectic structures formed by these phases.
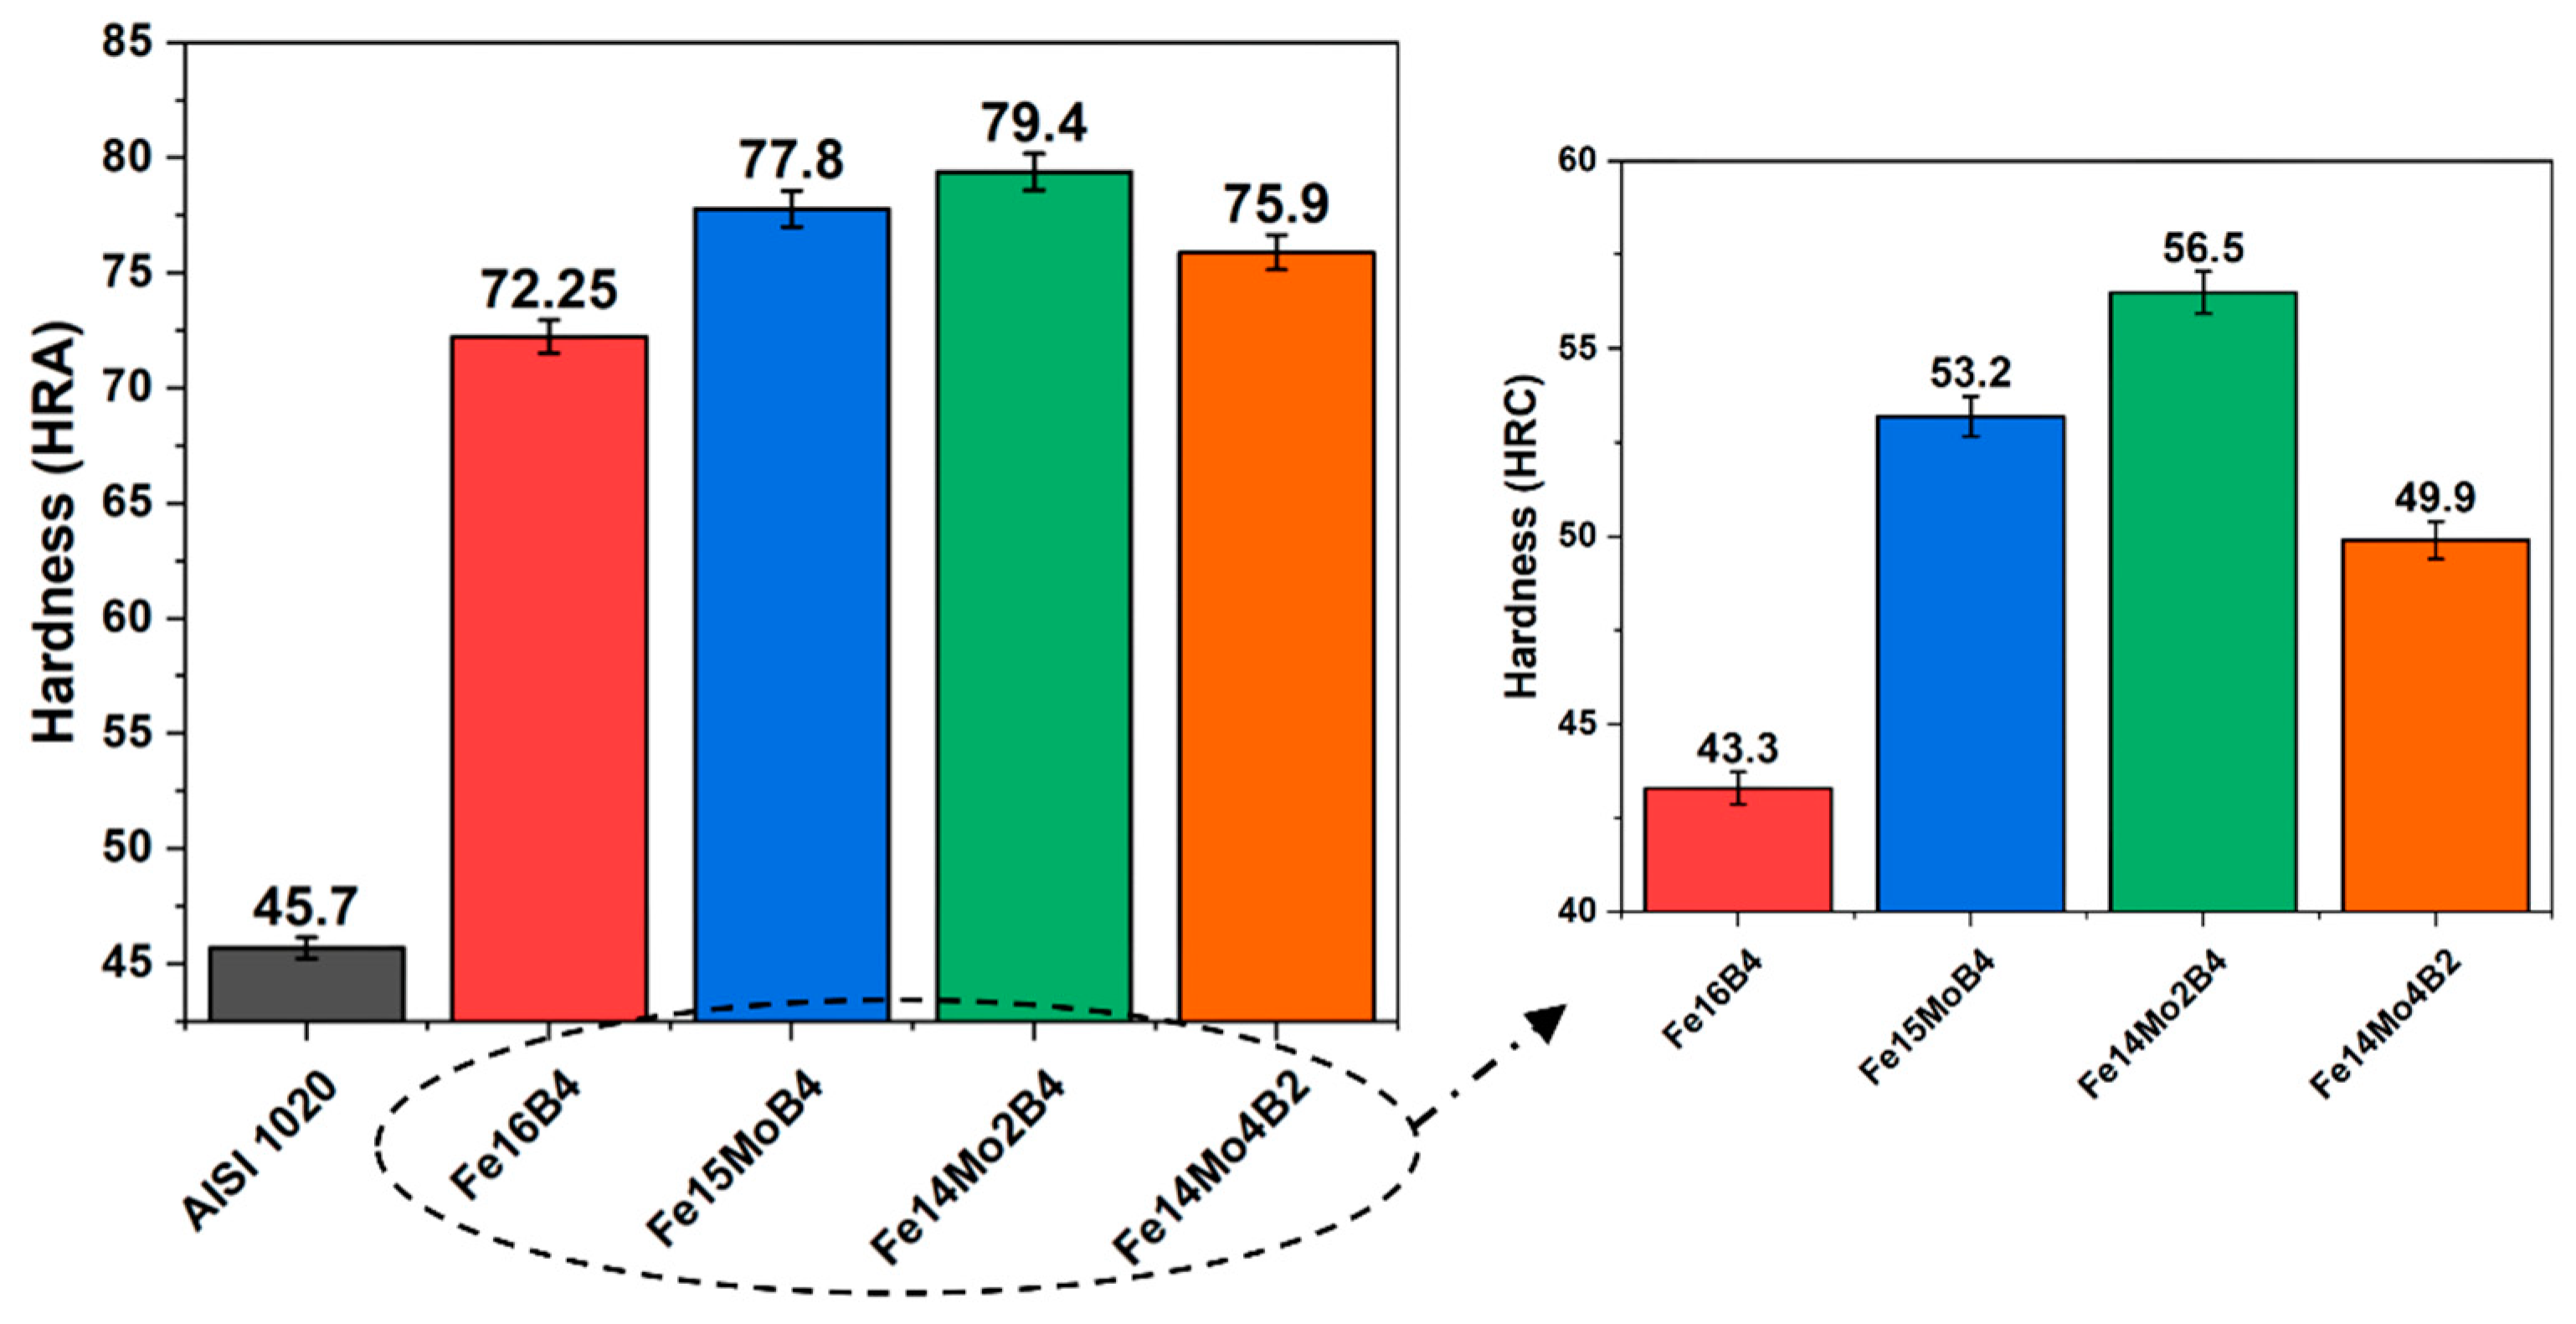
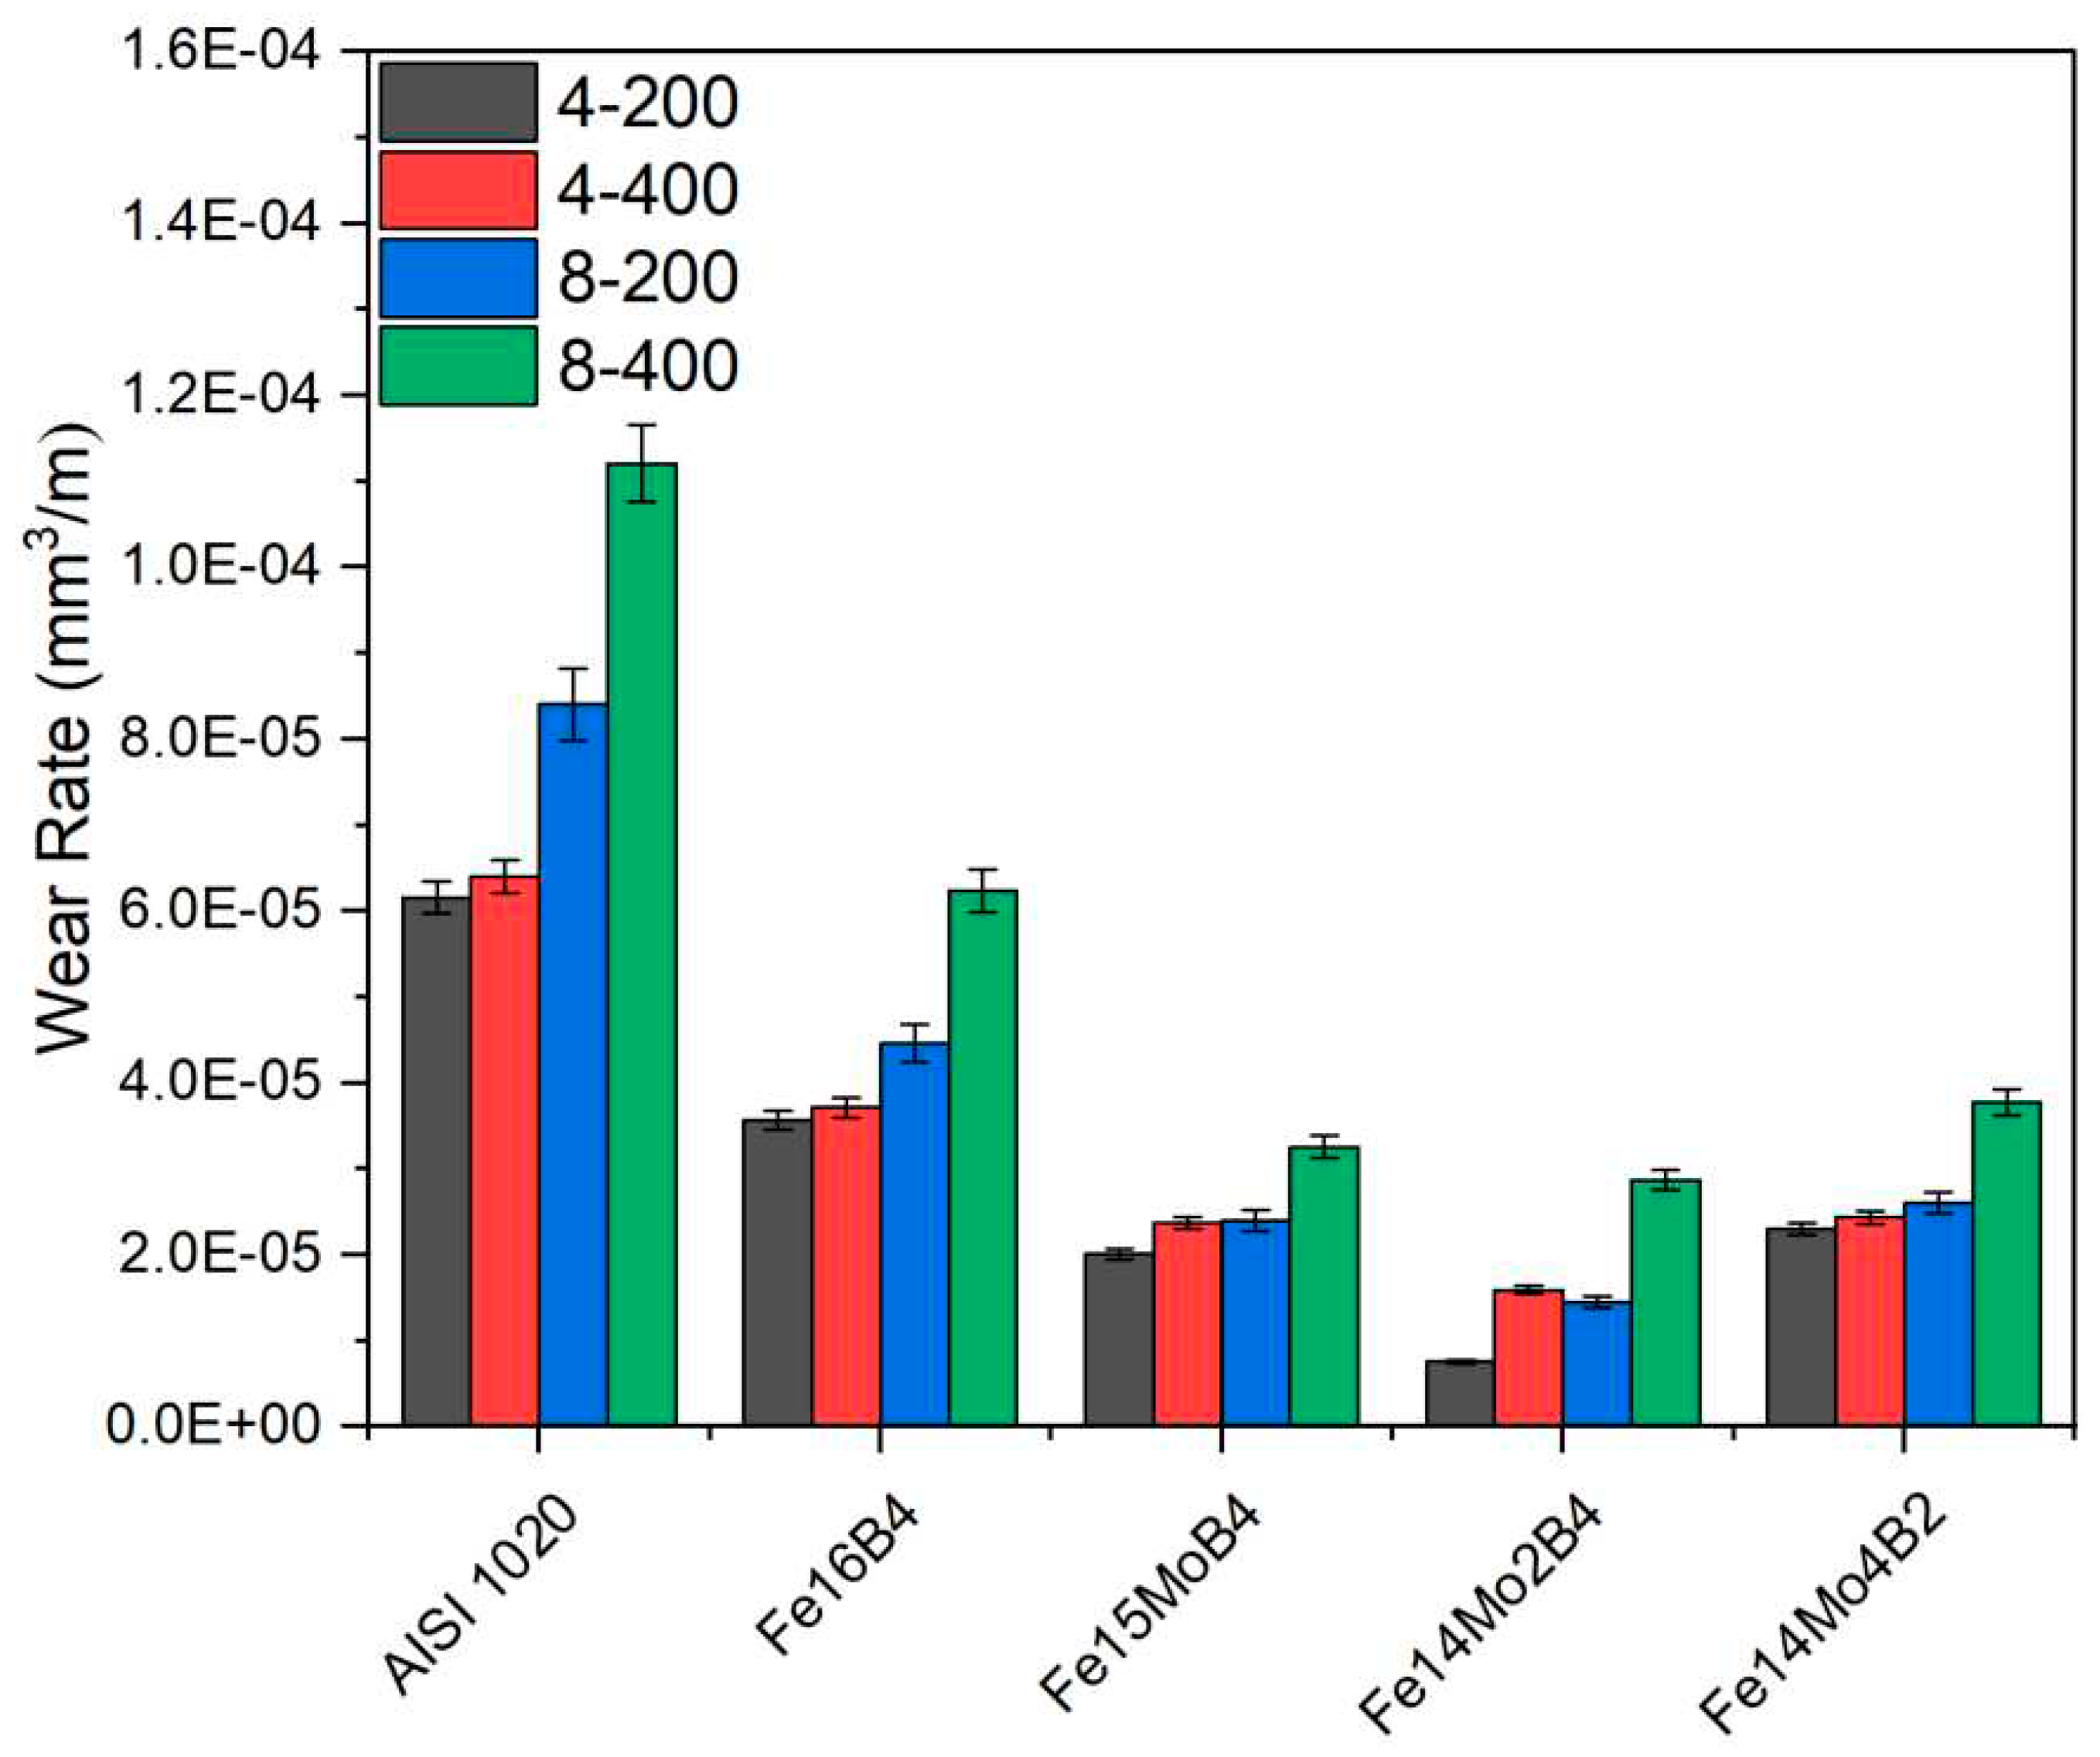
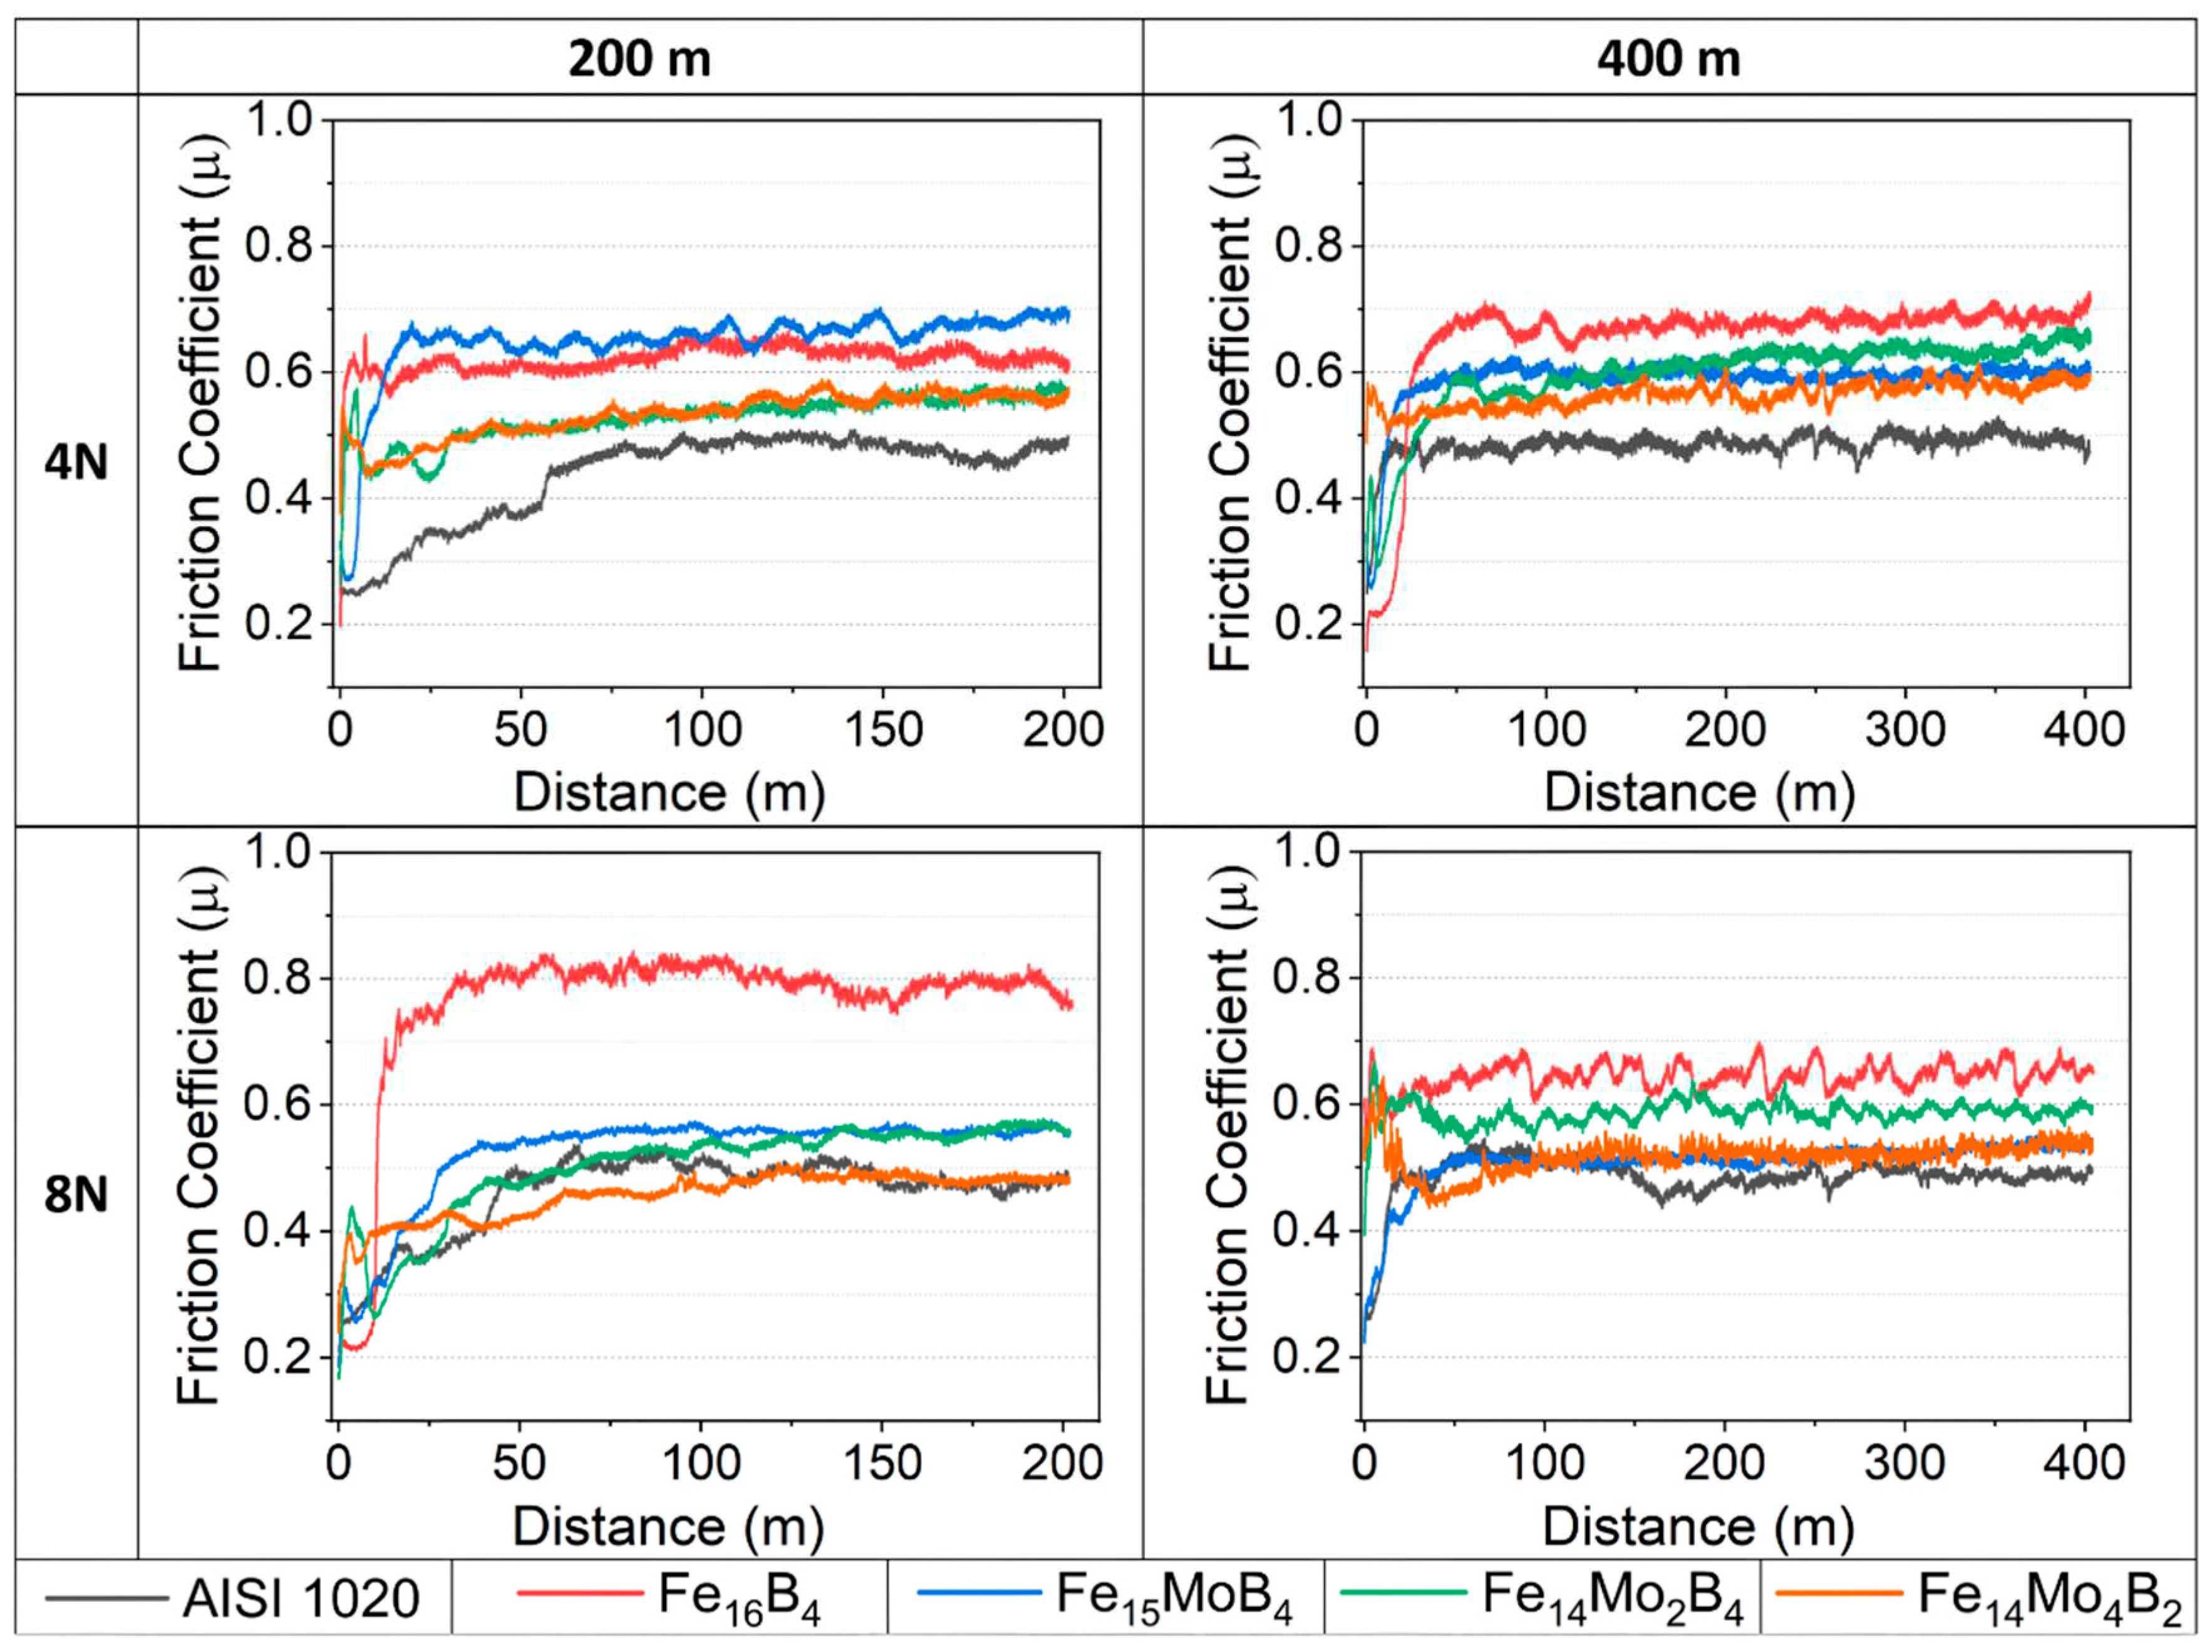
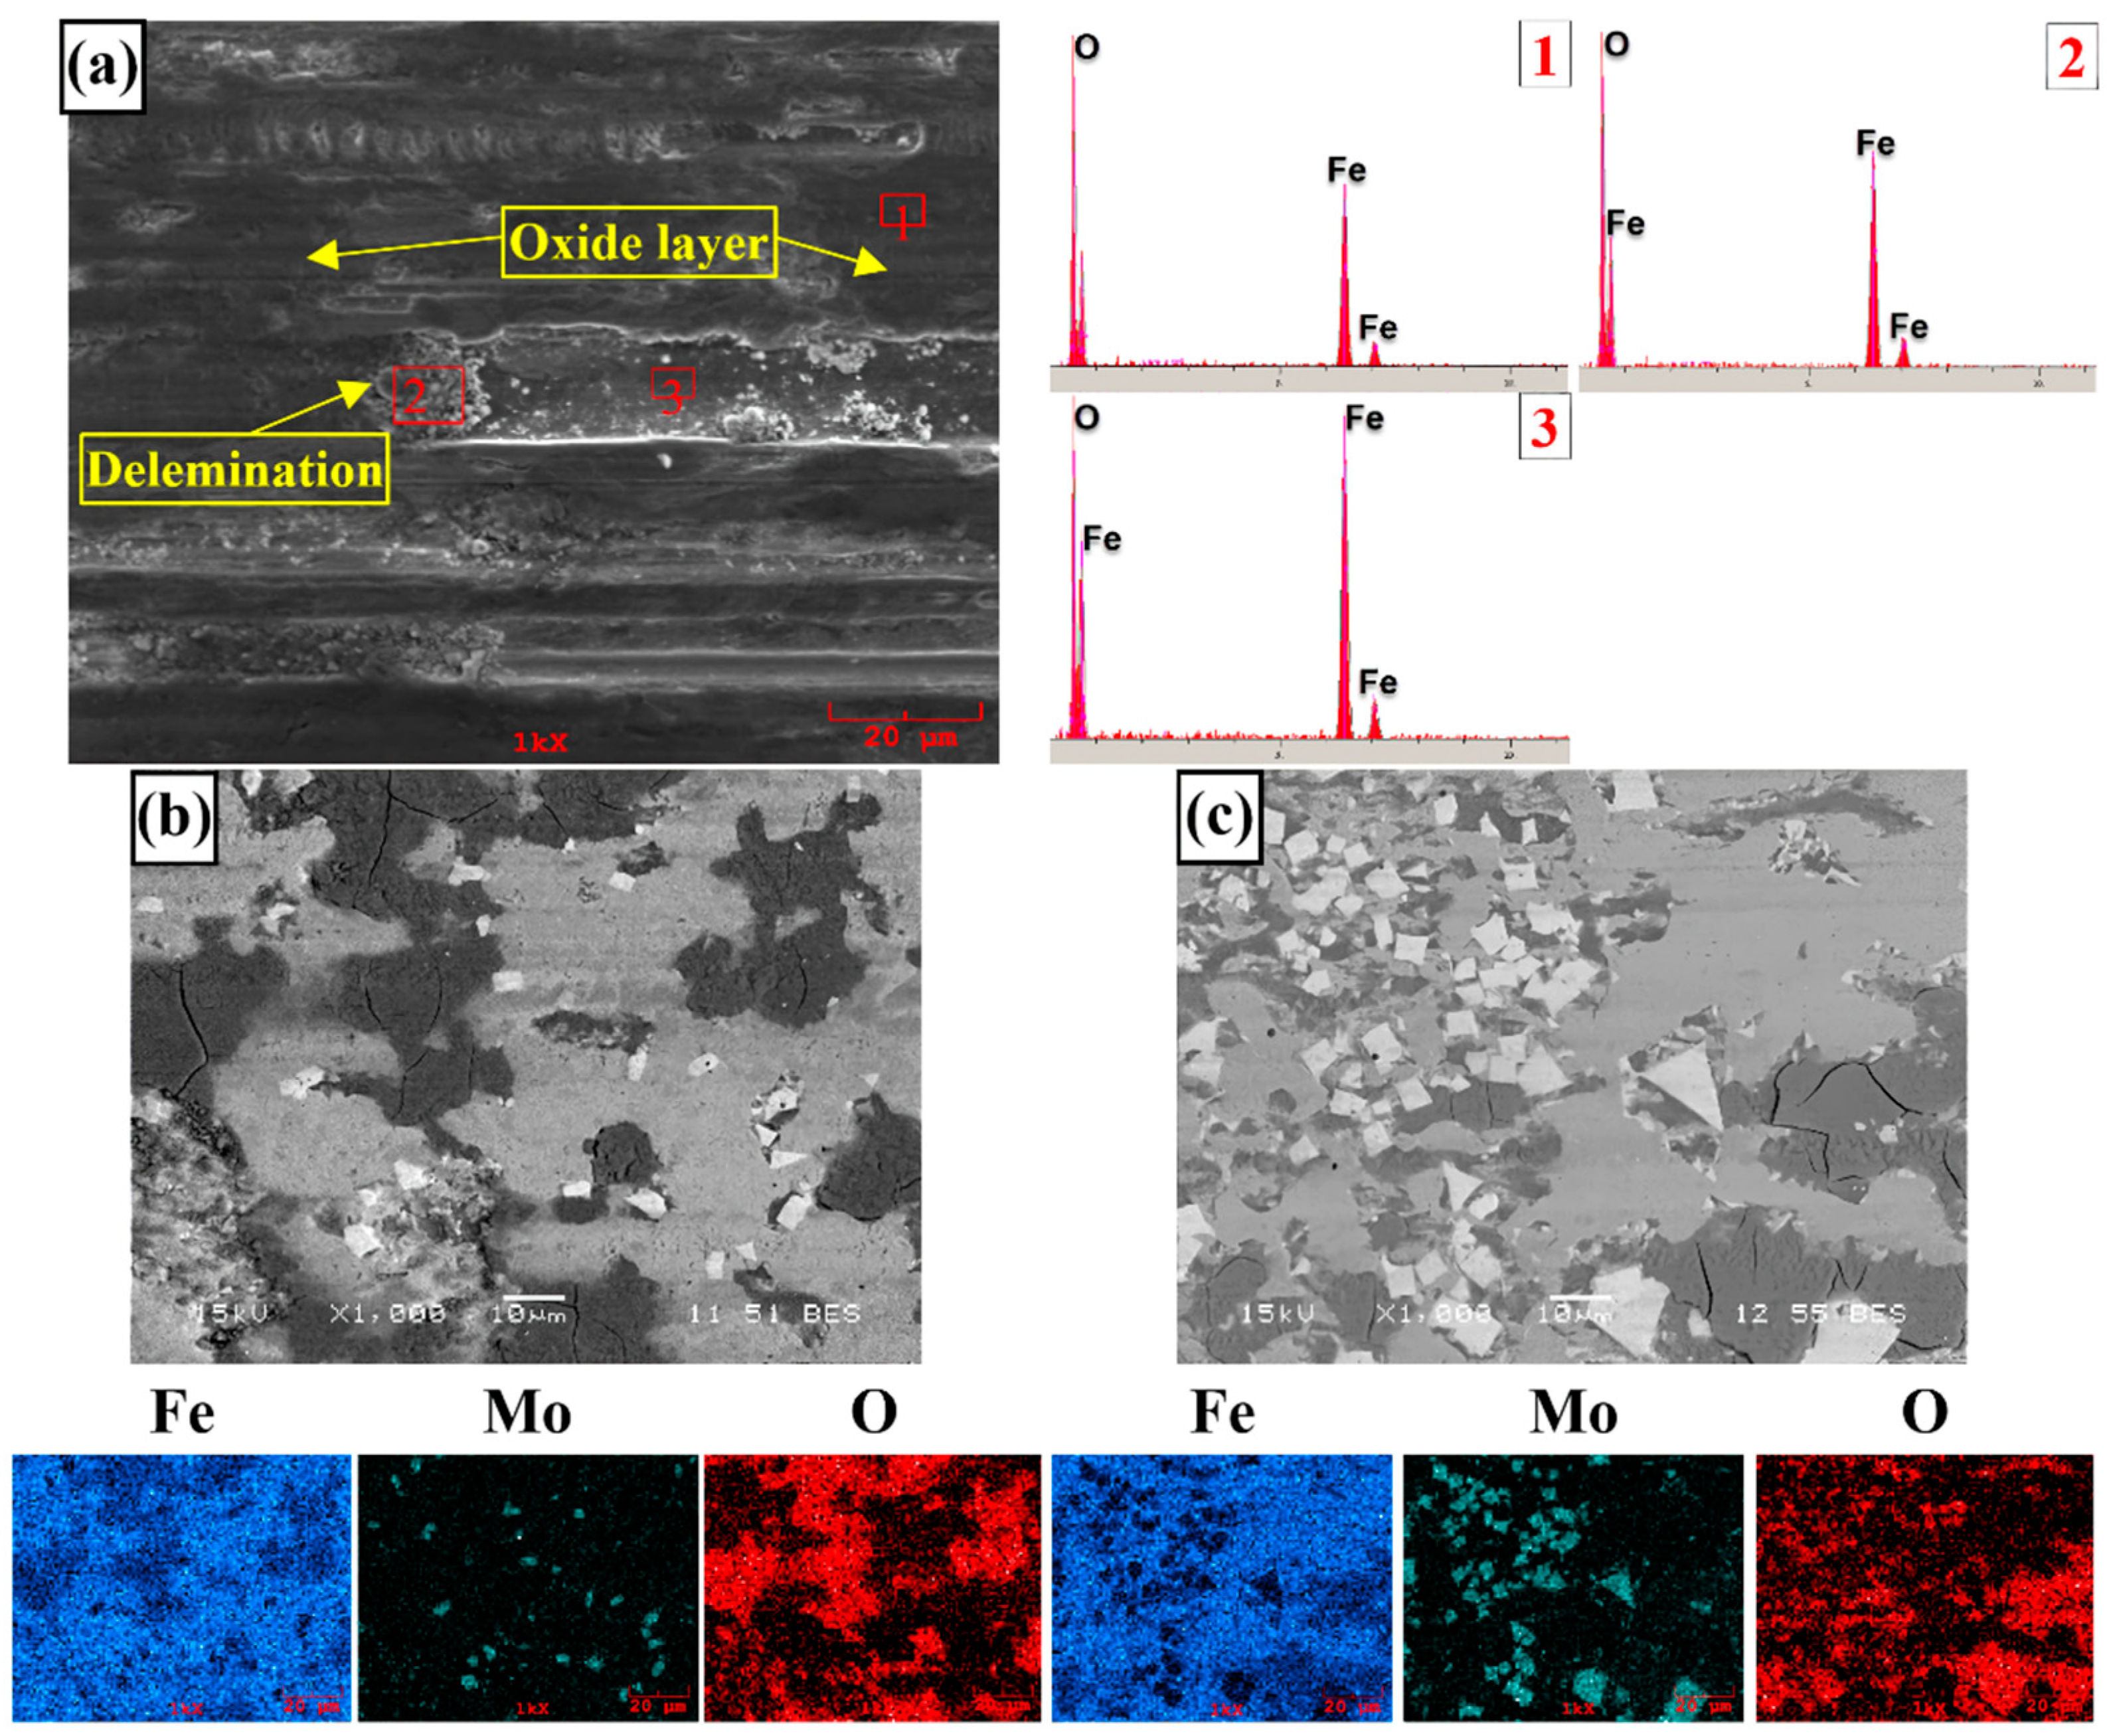
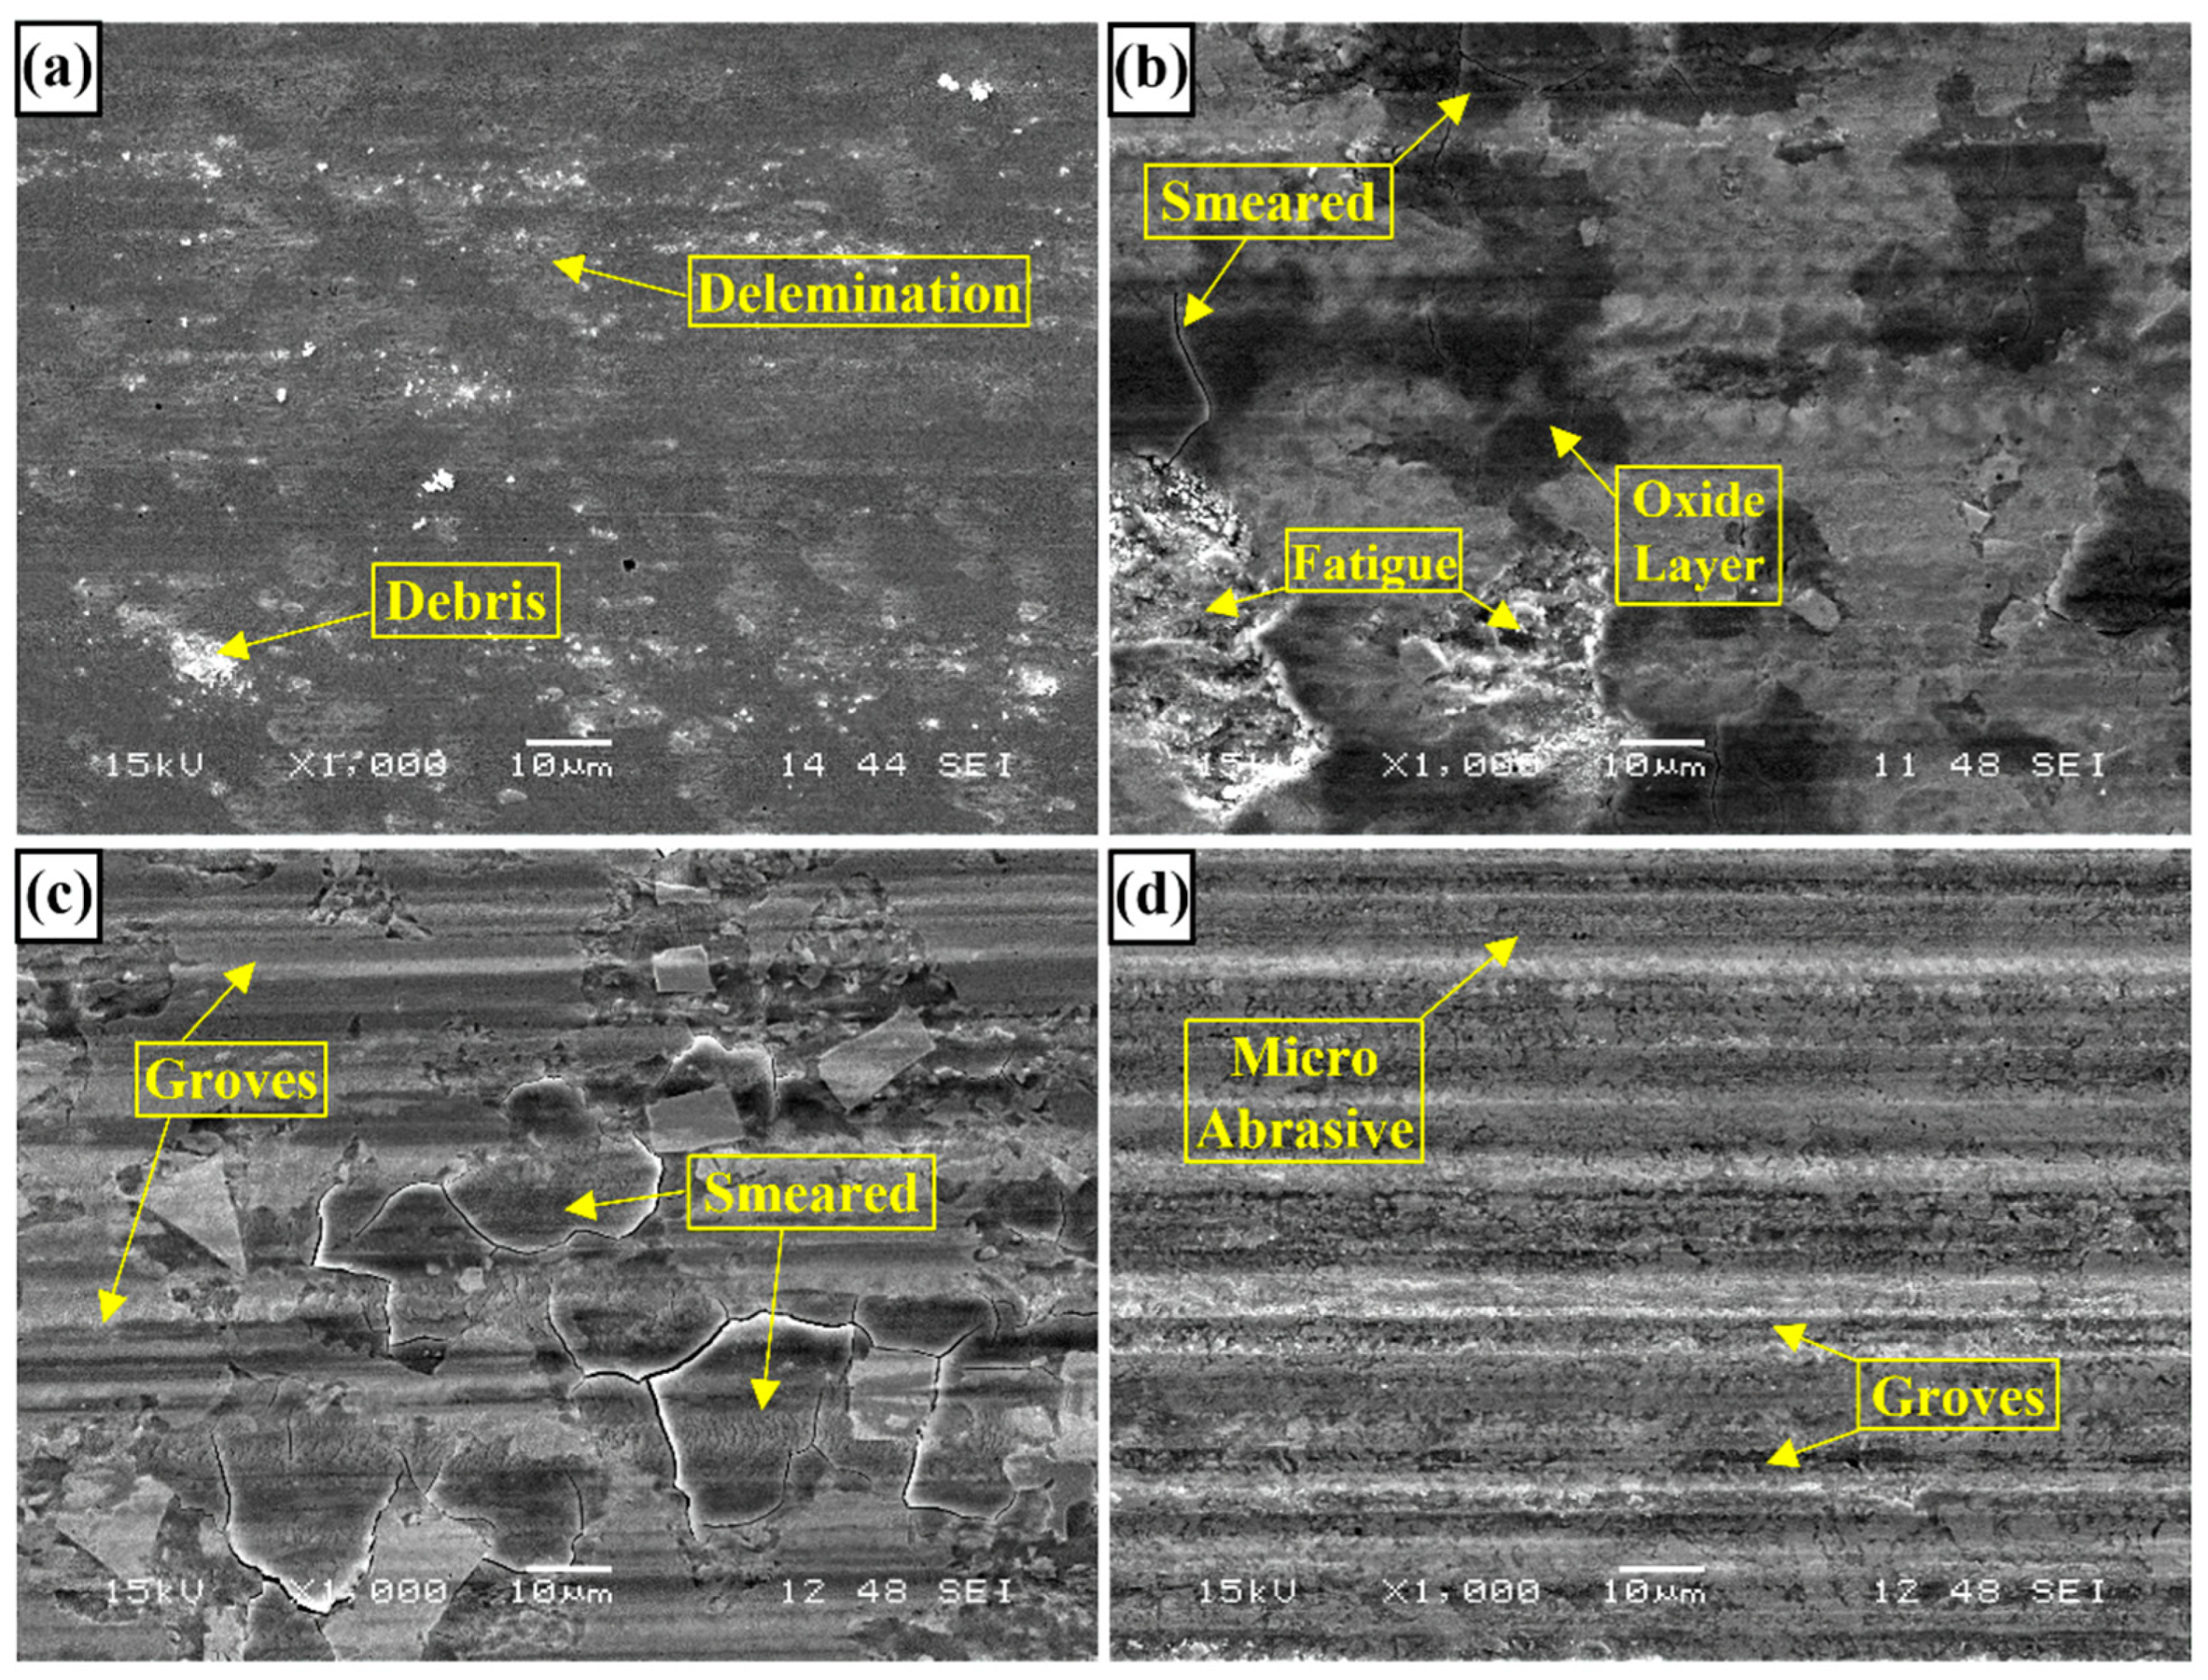
- Neither molybdenum nor boron could provide the effect of both on the hardness and wear resistance of the coating. In addition, this effect reaches its maximum level for mixtures made in certain proportions. For this reason, optimizing the compositions in hardfacing coating works was critical. In the study, the highest macro hardness value was obtained in the Fe14Mo2B4 based coating as 56.4 HRC. It was observed that the hardness of this coating was ~73 % higher than the substrate material and ~30.5 % higher than the Fe16B4 based coating. According to microhardness measurements, although the hardness of the phases in the microstructure varies over a wide range, the highest phase hardness was measured as 3228 HV in the FeMo2B2 phase. In the study, the highest wear resistance was obtained in the Fe14Mo2B4 based coating. According to the wear rate values, up to ~8.1 times higher wear resistance was obtained in the Fe14Mo2B4 based coating compared to the AISI 1020 substrate material and up to ~4.7 times higher than the Fe16B4 based coating.
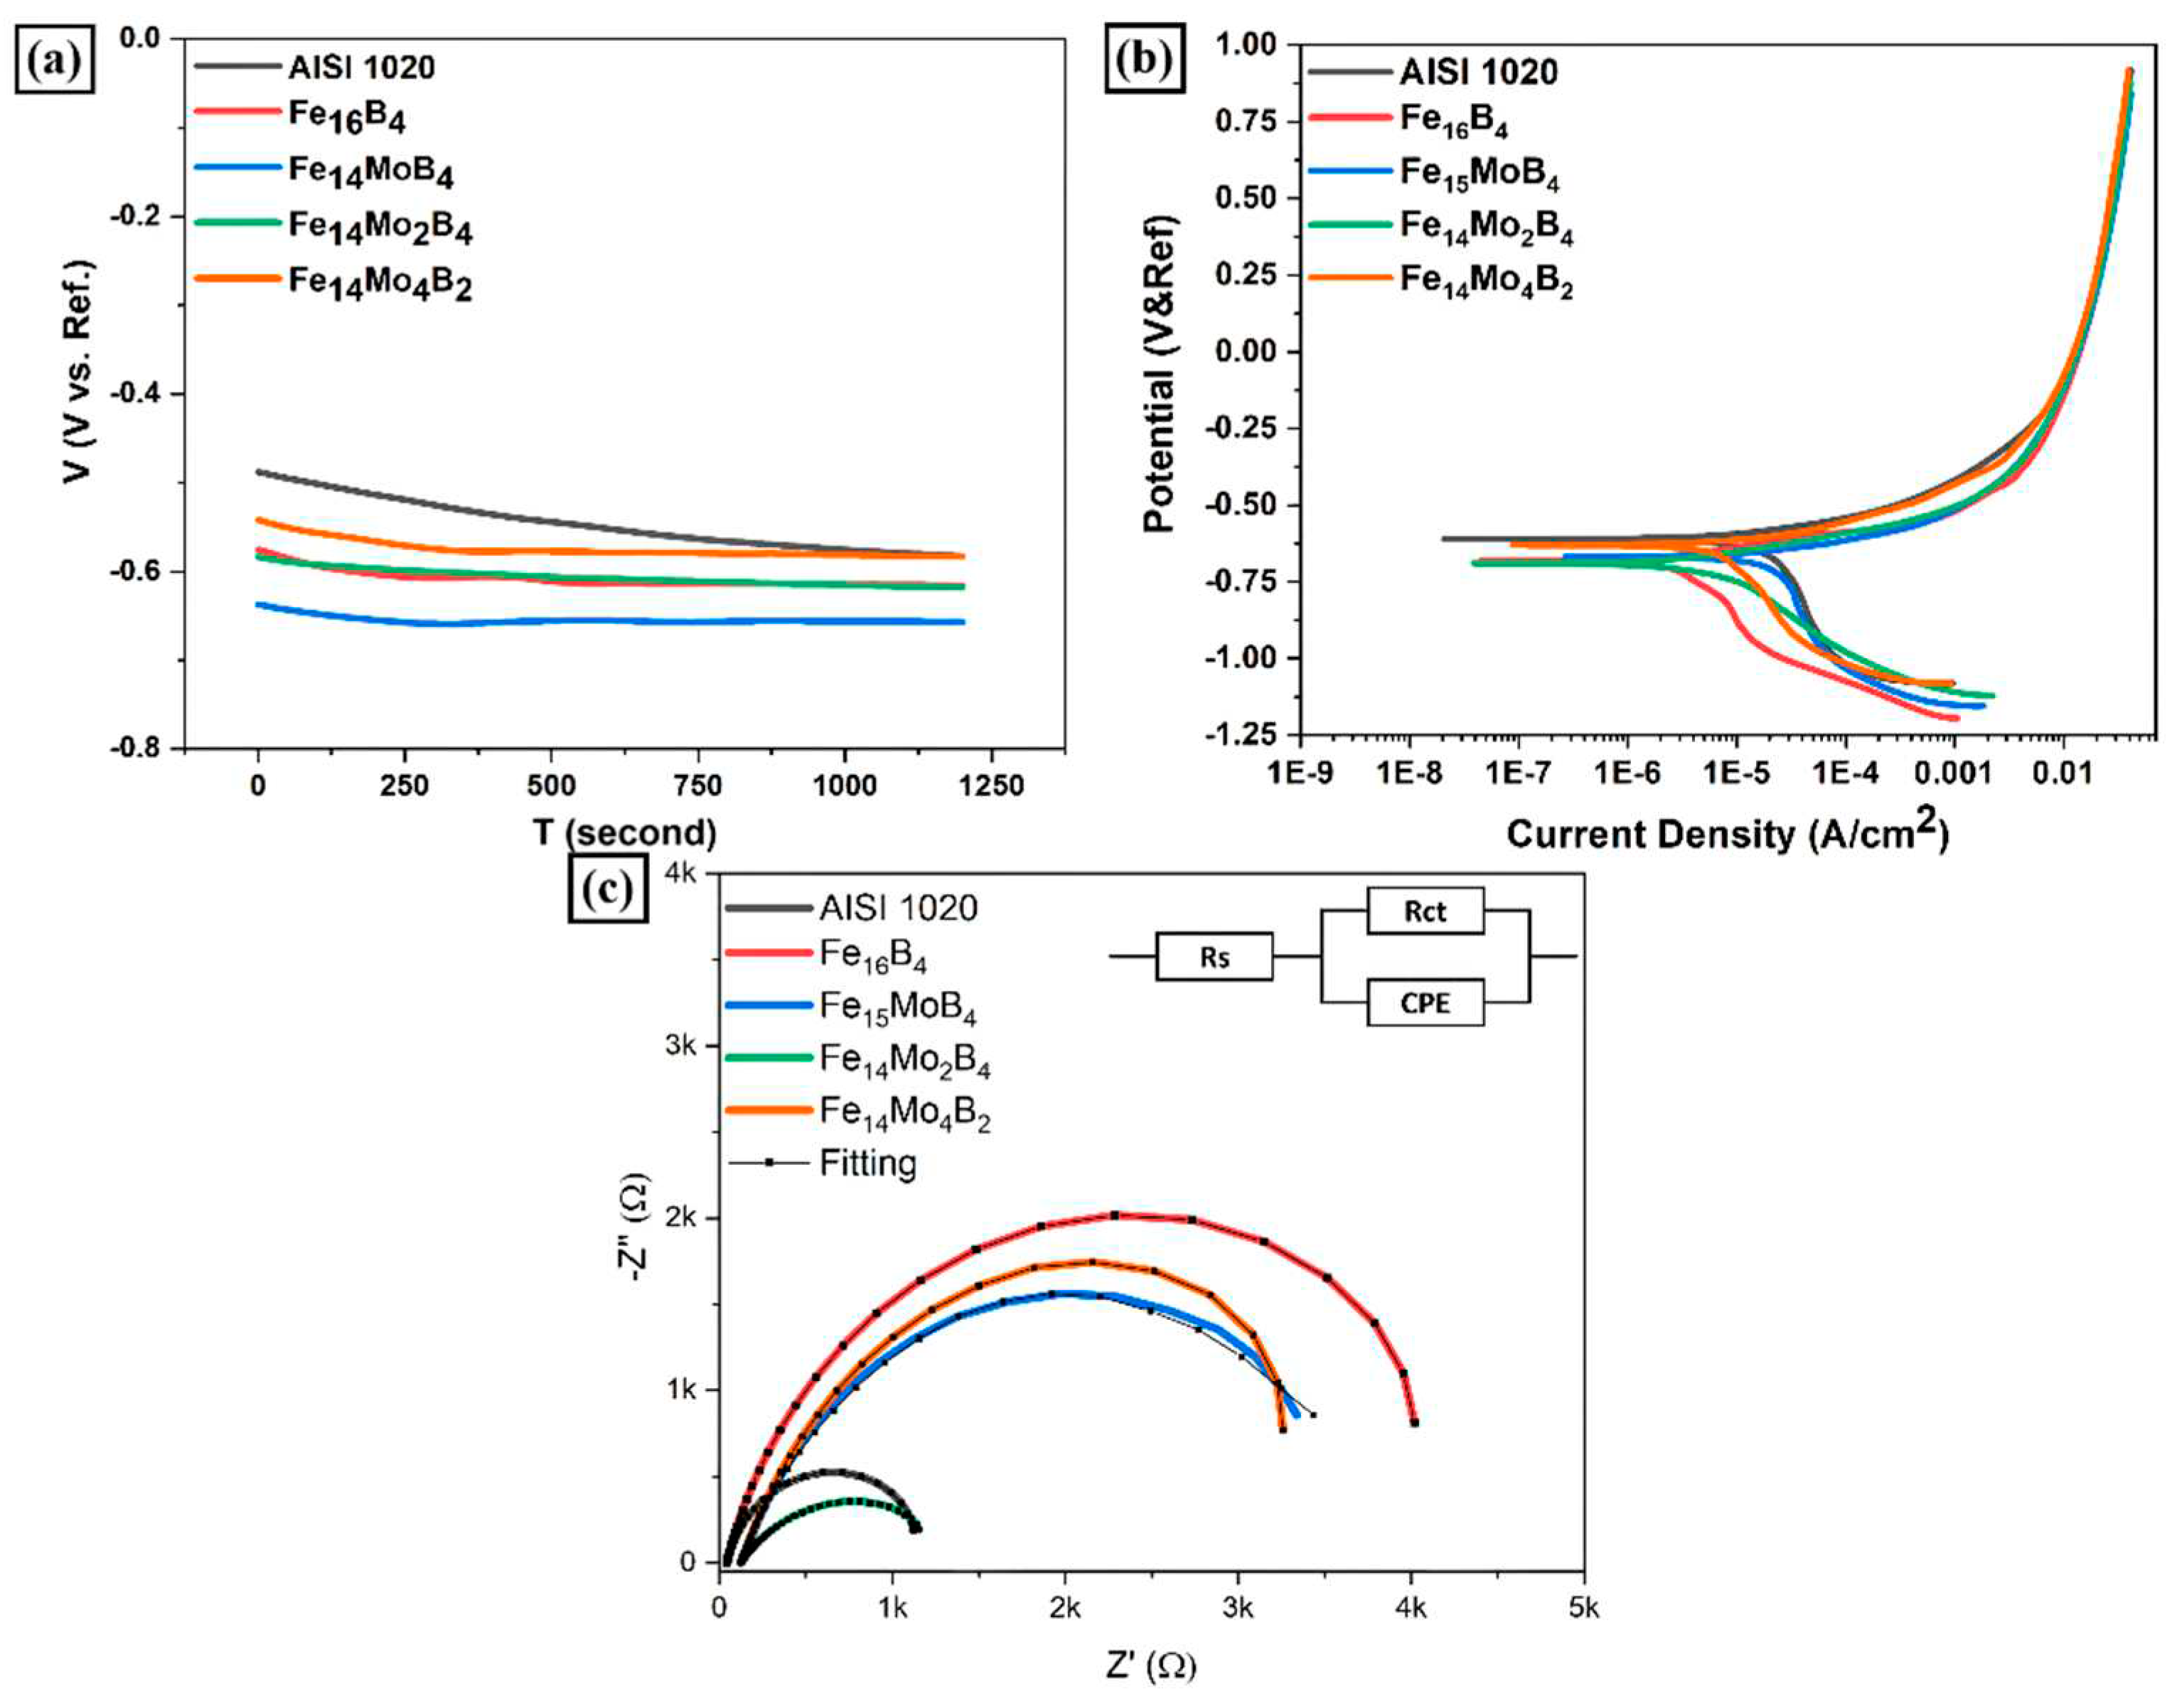
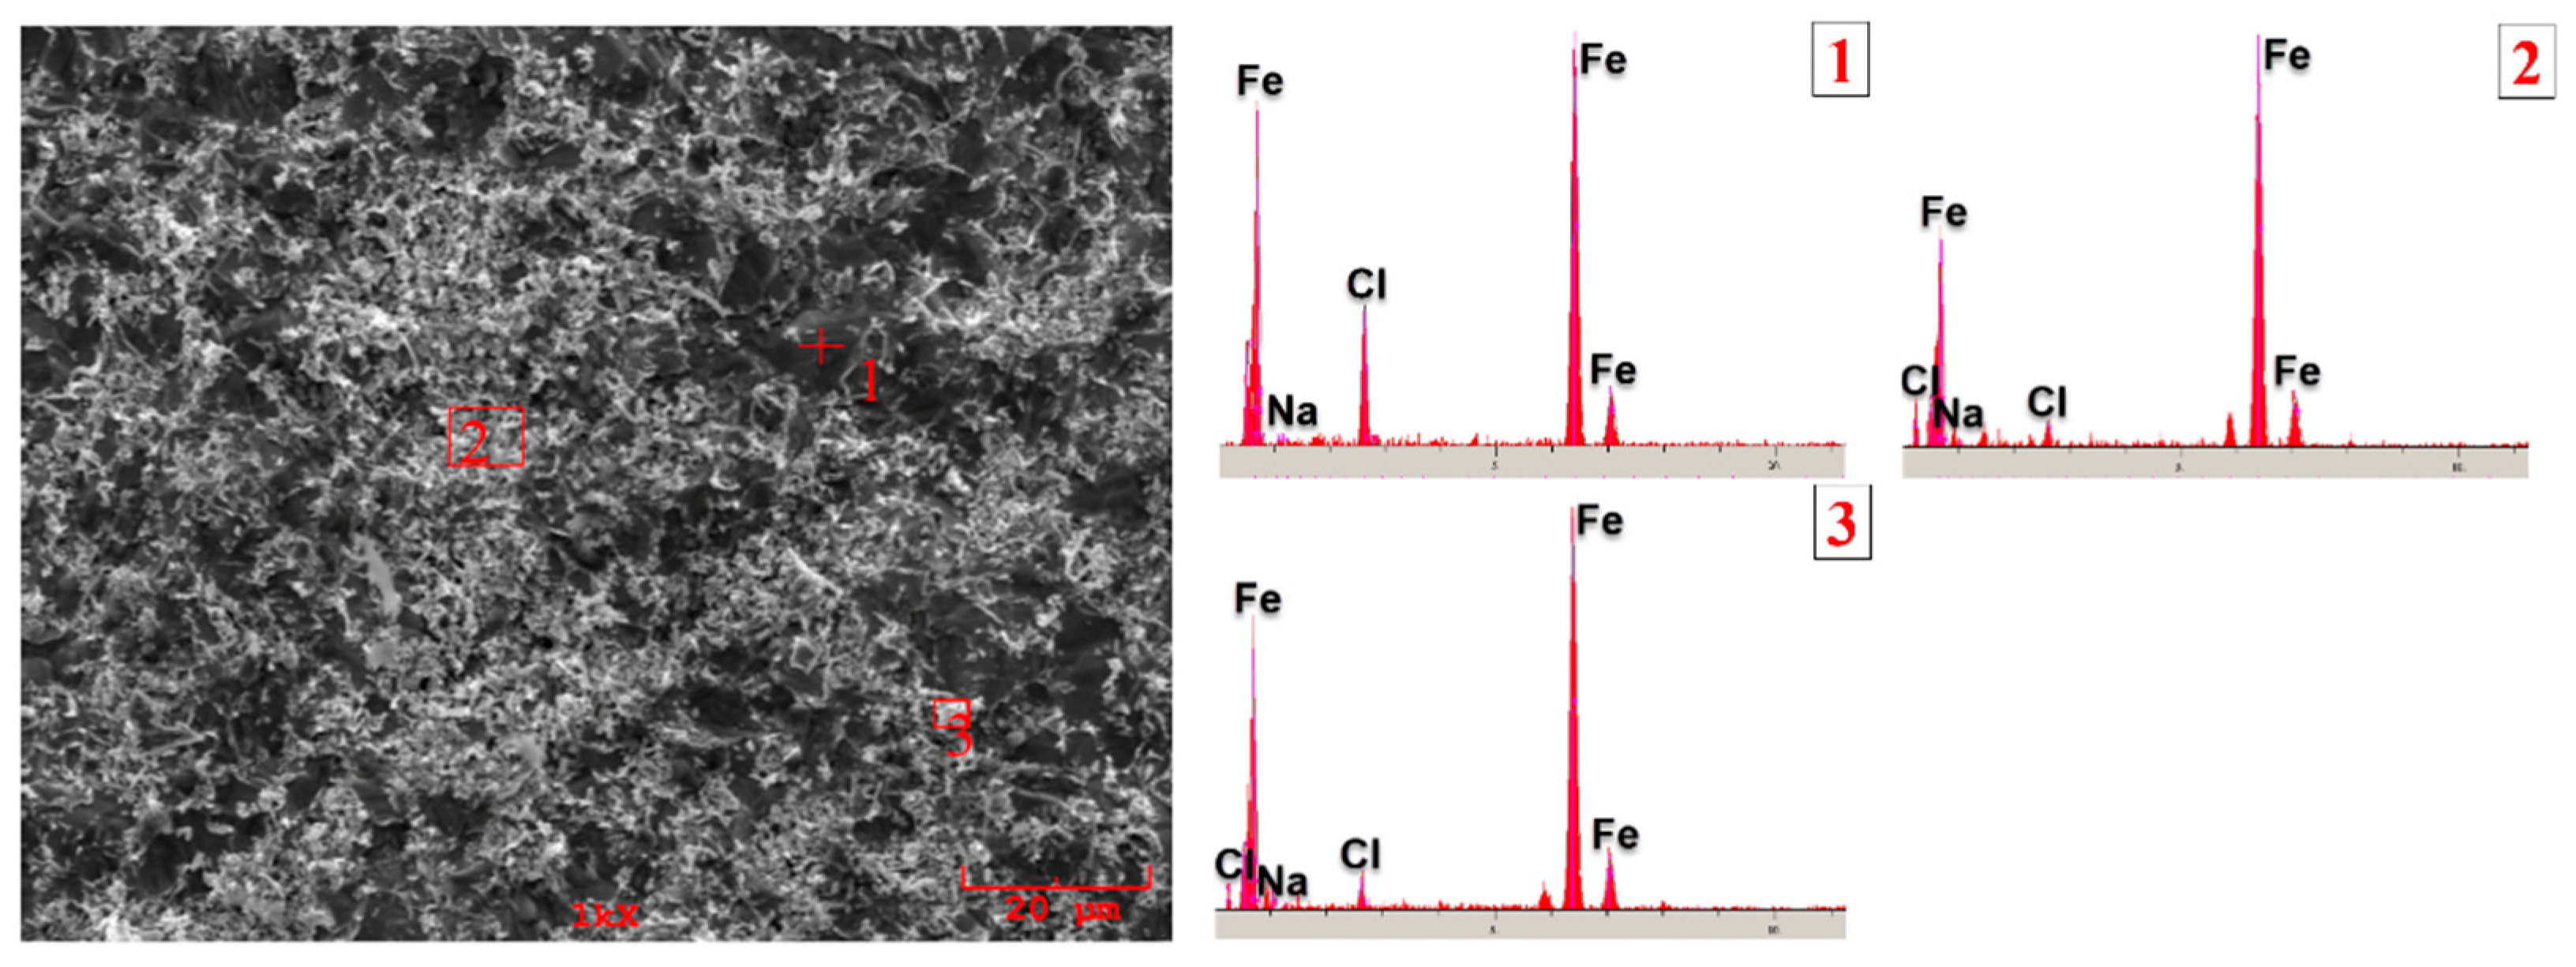
- According to the corrosion test results, it was observed that there was no significant difference between the corrosion potentials of the substrate material and coated samples. However, a significant difference was detected between the corrosion current density values. The current density of all samples with hardfacing coating is lower than the base material, meaning their corrosion resistance was better. In the study, the lowest current density value was measured as 2.078 µA/cm2 in the Fe16B4-based coating and it was found to be ~13.6 times more resistant to corrosion than the substrate material. Although the corrosion resistance of Fe16B4-based coating, that is, molybdenum-free, was high, it has been determined that the corrosion resistance increases with increasing molybdenum amount in molybdenum-containing hardfacing coatings.
Funding
Data Availability Statement
Acknowledgments
Orcid iDs:
References
- Zhang, K.; Zheng, Z.; Zhang, L.; Liu, Y.; Chen, S. Method for Dynamic Prediction of Oxygen Demand in Steelmaking Process Based on BOF Technology. Processes 2023, 11. [Google Scholar] [CrossRef]
- Steel pipe coatings market to hit $14. 0 billion by 2033. Focus Powder Coatings 2023, 2023, 6. [Google Scholar] [CrossRef]
- Pelser, W.A.; Marais, J.H.; van Laar, J.H.; Mathews, E.H. Development and Application of an Integrated Approach to Reduce Costs in Steel Production Planning. Process Integr Optim Sustain 2022, 6, 819–836. [Google Scholar] [CrossRef]
- Schubert, E.; Klassen, M.; Zerner, I.; Walz, C.; Sepold, G. Light-weight structures produced by laser beam joining for future applications in automobile and aerospace industry. J Mater Process Technol 2001, 115, 2–8. [Google Scholar] [CrossRef]
- Dong, Q.; Chen, X.; Gao, Y.; Hu, J.; Chen, X.; Xu, G. Steel BT - Civil Engineering Materials for Transportation Infrastructure; Dong, Q., Chen, X., Gao, Y., Hu, J., Chen, X., Xu, G., Eds.; Springer Nature: Singapore, 2023; pp. 267–296. [Google Scholar] [CrossRef]
- Ren, X.; Fu, H.; Xing, J.; Yi, Y. Research on high-temperature dry sliding friction wear behavior of CaTi modified high boron high speed steel. Tribol Int 2019, 132, 165–176. [Google Scholar] [CrossRef]
- Qi, Y.; Luo, H.; Zheng, S.; Chen, C.; Lv, Z.; Xiong, M. Effect of Temperature on the Corrosion Behavior of Carbon Steel in Hydrogen Sulphide Environments. Int J Electrochem Sci 2014, 9, 2101–2112. [Google Scholar] [CrossRef]
- Liu, D.S.; Liu, R.P.; Wei, Y.H.; Pan, P. Properties of cobalt based hardfacing deposits with various carbon contents. Surf Eng 2013, 29, 627–632. [Google Scholar] [CrossRef]
- Hutchings, I.; Shipway, P. 7 - Surface engineering. In: Hutchings I, Shipway PBT-T (Second E, editors., Butterworth-Heinemann; 2017, pp. 237–238. [CrossRef]
- Vasilescu, M.; Dobrescu, M. Hardfacing Corrosion and Wear Resistant Alloys. Mater. Res. Appl., vol. 1114, Trans Tech Publications Ltd; 2015, pp. 196–205. [CrossRef]
- Kocaman, E.; Kılınç, B.; Şen, Ş.; Şen, U. Development of Surface Properties with In Situ TiB2 Intermetallic-Assisted Coating by Fe(18-X)Ti2BX (x = 3,4,5)-Based Electrodes. Arab J Sci Eng 2021. [Google Scholar] [CrossRef]
- Trembach, B. Comparative studies of the three-body abrasion wear resistance of hardfacing Fe-Cr-C-B-Ti alloy. IOP Conf Ser Mater Sci Eng 2023, 1277, 012016. [Google Scholar] [CrossRef]
- Ardigo-Besnard, M.R.; Tellier, A.; Besnard, A.; Chateau-Cornu, J.-P. Effect of the microstructure on the tribological properties of HIPed and PTA-welded Fe-based hardfacing alloy. Surf Coatings Technol 2021, 425, 127691. [Google Scholar] [CrossRef]
- Kılınç, B.; Kocaman, E.; Şen, Ş.; Şen, U. Effect of vanadium content on the microstructure and wear behavior of Fe(13-x)VxB7 (x = 0–5) based hard surface alloy layers. Mater Charact 2021, 179, 111324. [Google Scholar] [CrossRef]
- Chen, C.; Wang, J.; Ge, Y.; Zhuang, M.; Ma, Z. Microstructure and Wear Resistance of High-Chromium Cast Iron with Multicomponent Carbide Coating via Laser Cladding. Coatings 2023, 13. [Google Scholar] [CrossRef]
- Durmuş, H.; ÇÖMEZN; Gül, C. ; Yuddaşkal, M.; Uzun, R.O. Ferromolibden ve ferrobor takviyeli lazer kaplamaların aşınma karakteristiği ve mikroyapısı. DÜMF Mühendislik Derg 2019, 10, 1009–1017. [Google Scholar] [CrossRef]
- Deng, X.; Zhang, G.; Wang, T.; Ren, S.; Bai, Z.; Cao, Q. Investigations on microstructure and wear resistance of Fe-Mo alloy coating fabricated by plasma transferred arc cladding. Surf Coatings Technol 2018, 350, 480–487. [Google Scholar] [CrossRef]
- Dilawary, S.A.A.; Motallebzadeh, A.; Paksoy, H.A.; Akhter, R.; Atar, E.; Cimenoglu, H. LSM of Stellite 12 + 10wt % Mo hardfacing alloy for enhancement in wear resistance, Mons: XXXI International Conference on Surface Modification Technologies (SMT31); 2016.
- Li, Q.; Wang, Q.; Zhang, L.; Chen, D.X.; Jin, H.; Li, J.D.; et al. Microstructure, wear and electrochemical behaviors of laser cladding Fe-based coatings with various molybdenum contents. Mater Res Express 2022, 9. [Google Scholar] [CrossRef]
- Jiang R Sen, Wang YT, Hu L, Xu G, Liu Z De. Effect of Mo Content on the Corrosion Resistance of Fe-Based Amorphous Composite Coating. Mater Sci Forum 2016, 849, 636–641. [CrossRef]
- Hazza, M.I.; El-Dahshan, M.E. The effect of molybdenum on the corrosion behaviour of some steel alloys. Desalination 1994, 95, 199–209. [Google Scholar] [CrossRef]
- BROCKELM The Effect of Molybdenum on the Corrosion Behavior of Iron-Chromium Alloys. Corrosion 2013, 29, 393–396. [CrossRef]
- Kocaman, E.; Kılınç, B.; Şen, Ş.; Şen, U. In-situ TiB2 and Fe2Ti intermetallic assisted hard coatings by Fe-Ti-B based hardfacing electrodes. J Alloys Compd 2022, 900. [Google Scholar] [CrossRef]
- Kocaman, E.; Kılınç, B.; Şen, Ş.; Şen, U. Effect of chromium content on Fe(18-x)CrxB2(X=3,4,5) hardfacing electrode on microstructure, abrasion and corrosion behavior. J Fac Eng Archit Gazi Univ 2020, 36, 177–190. [Google Scholar] [CrossRef]
- Duraisamy, R.; Kumar, S.M.; Kannan, A.R.; Shanmugam, N.S.; Sankaranarayanasamy, K.; Ramesh, M.R. Tribological performance of wire arc additive manufactured 347 austenitic stainless steel under unlubricated conditions at elevated temperatures. J Manuf Process 2020, 56, 306–321. [Google Scholar] [CrossRef]
- Sunbul, S.E.; Akyol, S.; Onal, S.; Ozturk, S.; Sozeri, H.; Icin, K. Effect of Co, Cu, and Mo alloying metals on electrochemical and magnetic properties of Fe-B alloy. J Alloys Compd 2023, 947, 169652. [Google Scholar] [CrossRef]
- Ouyang, X.; Chen, G.; Yin, F.; Liu, Y.; Zhao, M. Effect of Molybdenum on the Microstructures of As-Cast Fe-B Alloys and Their Corrosion Resistance in Molten Zinc. Corrosion 2017, 73, 942–952. [Google Scholar] [CrossRef] [PubMed]
- Beardsley, B.M.; Sebright, J.L. Structurally Integrated Coatings for Wear and Corrosion. 2018.
- Wang, H.Q.; Sun, J.S.; Li, C.N.; Geng, S.N.; Sun, H.G.; Wang, G.L. Microstructure and mechanical properties of molybdenum–iron–boron–chromium cladding using argon arc welding. Mater Sci Technol (United Kingdom) 2016, 32, 1694–1701. [Google Scholar] [CrossRef]
- Sarasola, M.; Gómez-Acebo, T.; Castro, F. Microstructural development during liquid phase sintering of Fe and Fe–Mo alloys containing elemental boron additions. Powder Metall 2005, 48, 59–67. [Google Scholar] [CrossRef]
- Guillermet, A.F. The Fe−Mo (Iron−Molybdenum) system. Bull Alloy Phase Diagrams 1982, 3, 359–367. [Google Scholar] [CrossRef]
- Cho, I.-S.; Savelyev, K.D.; Golod, V.M. Development of thermophysical calculator for stainless steel casting alloys by using CALPHAD approach. China Foundry 2017, 14, 353–358. [Google Scholar] [CrossRef]
- Utkin, S.V.; Bondar, A.A.; Kublii, V.Z.; Kapitanchuk, L.M.; Tikhonova, I.B. Solidus Surface of the Mo–Fe–B System. Powder Metall Met Ceram 2020, 59, 89–105. [Google Scholar] [CrossRef]
- Chen, K.; Yang, X.; Li, W.; Xia, G.; Wang, S.; Wang, K. Study on the wear and corrosion resistance of Fe–Mo coatings on 65Mn steel ploughshares by laser cladding. Appl Phys A 2022, 128, 795. [Google Scholar] [CrossRef]
- Huang, Z.; Xing, J.; Guo, C. Improving fracture toughness and hardness of Fe2B in high boron white cast iron by chromium addition. Mater Des 2010, 31, 3084–3089. [Google Scholar] [CrossRef]
- Lentz, J.; Röttger, A.; Theisen, W. Hardness and modulus of Fe2B, Fe3(C,B), and Fe23(C,B)6 borides and carboborides in the Fe-C-B system. Mater Charact 2018, 135, 192–202. [Google Scholar] [CrossRef]
- Zhang, H.; Pan, Y.; Zhang, Y.; Lian, G.; Cao, Q.; Yang, J. Sensitivity Analysis for Process Parameters in Mo2FeB2 Ternary Boride Coating by Laser Cladding. Coatings 2022, 12. [Google Scholar] [CrossRef]
- Azakli, Y.; Cengiz, S.; Tarakci, M.; Gencer, Y. Characterisation of boride layer formed on Fe–Mo binary alloys. Surf Eng 2016, 32, 589–595. [Google Scholar] [CrossRef]
- Hocaoğlu, R. Fe-Mo-Ti-B-C esaslı sert dolgu alaşımlı örtülü elektrotların üretimi ve özelliklerinin incelenmesi = The production and investigation of the properties of Fe-Mo-Ti-B-C based hardfacing alloy covered electrodes. Sakarya University, 2021.
- Márquez-Herrera, A.; Fernandez-Muñoz, J.L.; Zapata-Torres, M.; Melendez-Lira, M.; Cruz-Alcantar, P. Fe2B coating on ASTM A-36 steel surfaces and its evaluation of hardness and corrosion resistance. Surf Coatings Technol 2014, 254, 433–439. [Google Scholar] [CrossRef]
- Archard, J.F. Contact and Rubbing of Flat Surfaces. J Appl Phys 1953, 24. [Google Scholar] [CrossRef]
- Sedlaček, M.; Podgornik, B.; Vižintin, J. Influence of surface preparation on roughness parameters, friction and wear. Wear 2009, 266, 482–487. [Google Scholar] [CrossRef]
- Buckley DHBT-TS, editor. Chapter 8 Lubrication of Solid Surfaces. Surf. Eff. Adhes. Fricti0N, Wear, Lubr., vol. 5, Elsevier; 1981, pp. 511–552. [CrossRef]
- Szeri, A.Z. Tribology. In: Meyers RABT-E of PS and T (Third E, editor., New York: Academic Press; 2003, pp. 127–152. [CrossRef]
- Kalel, S.M.; Patil, S.R. Ceramic Reinforced Metal Matrix Composite ( MMC ) - Processing. Int J Adv Res Sci Eng 2018, 7, 1047–1058. [Google Scholar]
- Lee, H.Y. Effect of Changing Sliding Speed on Wear Behavior of Mild Carbon Steel. Met Mater Int 2020, 26, 1749–1756. [Google Scholar] [CrossRef]
- Menezes, P.L.; Kishore Kailas, S.V.; Lovell, M.R. Role of surface texture, roughness, and hardness on friction during unidirectional sliding. Tribol Lett 2011, 41, 1–15. [Google Scholar] [CrossRef]
- Sen, U. Wear properties of niobium carbide coatings performed by pack method on AISI 1040 steel. Thin Solid Films 2005, 483, 152–157. [Google Scholar] [CrossRef]
- Sen, U. Friction and wear properties of thermo-reactive diffusion coatings against titanium nitride coated steels. Mater Des 2005, 26, 167–174. [Google Scholar] [CrossRef]
- Sen, S.; Sen, U. Sliding wear behavior of niobium carbide coated AISI 1040 steel. Wear 2008, 264, 219–225. [Google Scholar] [CrossRef]
- Zhao, H.; Xie, L.; Xin, C.; Li, N.; Zhao, B.; Li, L. Effect of molybdenum content on corrosion resistance and corrosion behavior of Ti-Mo titanium alloy in hydrochloric acid. Mater Today Commun 2023, 34, 105032. [Google Scholar] [CrossRef]
- Guo, R.Q.; Zhang, C.; Chen, Q.; Yang, Y.; Li, N.; Liu, L. Study of structure and corrosion resistance of Fe-based amorphous coatings prepared by HVAF and HVOF. Corros Sci 2011, 53, 2351–2356. [Google Scholar] [CrossRef]
- Zhang, J.; Liu, J.; Liao, H.; Zeng, M.; Ma, S. A review on relationship between morphology of boride of Fe-B alloys and the wear/corrosion resistant properties and mechanisms. J Mater Res Technol 2019, 8, 6308–6320. [Google Scholar] [CrossRef]
- Ma, S.; Xing, J.; Fu, H.; Yi, D.; Li, Y.; Zhang, J.; et al. Microstructure and interface characteristics of Fe–B alloy in liquid 0.25wt.% Al–Zn at various bath temperatures. Mater Chem Phys 2012, 132, 977–986. [Google Scholar] [CrossRef]
- Ma, S.; Xing, J.; Fu, H.; Yi, D.; Zhang, J.; Li, Y.; et al. Interfacial morphology and corrosion resistance of Fe–B cast steel containing chromium and nickel in liquid zinc. Corros Sci 2011, 53, 2826–2834. [Google Scholar] [CrossRef]
- Ma, S.; Xing, J.; Fu, H.; Yi, D.; Zhi, X.; Li, Y. Effects of boron concentration on the corrosion resistance of Fe–B alloys immersed in 460°C molten zinc bath. Surf Coatings Technol 2010, 204, 2208–2214. [Google Scholar] [CrossRef]
- Abakay, E.; Şen, U. Effect of Morphological and Microstructural Variations on the Properties of Electroless Nickel Boron Coatings. Trans Indian Inst Met 2023, 76, 657–664. [Google Scholar] [CrossRef]
- Gu, Z.; Mao, P.; Gou, Y.; Chao, Y.; Xi, S. Microstructure and properties of MgMoNbFeTi2Yx high entropy alloy coatings by laser cladding. Surf Coatings Technol 2020, 402, 126303. [Google Scholar] [CrossRef]
- QINL; LIANJ; JIANGQ Effect of grain size on corrosion behavior of electrodeposited bulk nanocrystalline Ni. Trans Nonferrous Met Soc China 2010, 20, 82–89. [CrossRef]
- Lu, B.; Luo, J.; Chiovelli, S. Corrosion and wear resistance of chrome white irons---A correlation to their composition and microstructure. Metall Mater Trans A 2006, 37, 3029–3038. [Google Scholar] [CrossRef]
- Kocaman, E.; Kılınç, B.; Durmaz, M.; Şen, Ş.; Şen, U. The influence of chromium content on wear and corrosion behavior of surface alloyed steel with Fe(16−x)Crx(B,C)4 electrode. Eng Sci Technol an Int J 2020. [Google Scholar] [CrossRef]
- Liu, C.; Liu, Z.; Gao, Y.; Wang, X.; Zheng, C. Effect of Cr Content on Corrosion Resistance of Ni-xCr-Mo Laser-Cladding Coatings under H2S-Induced High-Temperature Corrosion Atmosphere. Materials 2022, 15. [Google Scholar] [CrossRef] [PubMed]

| C | Cr | Mo | B | Mn | Si | P | S | Fe | |
|---|---|---|---|---|---|---|---|---|---|
| H08A | <0,1 | 0,064 | - | - | 0,35-0.40 | 0,10 | <0,02 | <0,02 | Bal. |
| AISI 1020 | 0.22 | 0.025 | 0.02 | - | 0.52 | 0.17 | 0.023 | 0.019 | Bal. |
| Ferro-Mo | - | - | 60 | - | - | 1.5 | 0.050 | 0.10 | 38.35 |
| Ferro -B | 0,312 | - | 18,58 | 0,39 | 0,029 | 0,003 | 80,602 |
| Compound | B | Mo | Fe |
|---|---|---|---|
| Fe16B4 | 20 | - | Bal. |
| Fe15MoB4 | 20 | 5 | Bal. |
| Fe14Mo2B4 | 20 | 10 | Bal. |
| Fe14Mo4B2 | 10 | 20 | Bal. |
| Sample | Matrix (HV0.01) |
Eutectic (α-Fe-M2B) (HV0.01) | Eutectic (α-Fe-FeMo2B2) (HV0.01) | FeMo2B2 (HV0.01) |
R-(Fe63Mo37) (HV0.01) |
|---|---|---|---|---|---|
| AISI 1020 | 143-147 | - | - | - | - |
| Fe16B4 | 173-180 | 478-542 | - | - | - |
| Fe15MoB4 | 424-542 | 996-1200 | - | 1953-2973 | - |
| Fe14Mo2B4 | 459-573 | 1053-1242 | 642-956 | 1970-3228 | - |
| Fe14Mo4B2 | 368-379 | - | 520-754 | - | 718-840 |
| Sample | Ecor mV | Icor µA/cm2 | Cr (mpy) |
|---|---|---|---|
| AISI 1020 | -609.315 | 28.331 | 16.291 |
| Fe16B4 | -683.455 | 2.078 | 1.544 |
| Fe15MoB4 | -669.678 | 15.287 | 11.245 |
| FeMo2B4 | -688.666 | 6.601 | 4.808 |
| FeMo4B2 | -632.627 | 5.650 | 3.603 |
| Sample | Rs (Ω) | CPE-1 (µF.cm-2) | Rct-1 (kΩ) |
|---|---|---|---|
| AISI 1020 | 42.78 | 2.2e-4 | 1.29 |
| Fe16B4 | 40.41 | 2.29e-4 | 4.87 |
| Fe15MoB4 | 126.3 | 1.08e-4 | 4.25 |
| Fe14Mo2B4 | 134.4 | 2.43e-4 | 1.4 |
| Fe14Mo4B2 | 129 | 1.11e-4 | 4.38 |
Disclaimer/Publisher’s Note: The statements, opinions and data contained in all publications are solely those of the individual author(s) and contributor(s) and not of MDPI and/or the editor(s). MDPI and/or the editor(s) disclaim responsibility for any injury to people or property resulting from any ideas, methods, instructions or products referred to in the content. |
© 2023 by the authors. Licensee MDPI, Basel, Switzerland. This article is an open access article distributed under the terms and conditions of the Creative Commons Attribution (CC BY) license (http://creativecommons.org/licenses/by/4.0/).


