1. Introduction
SCBs are one of the debris commonly found on land, for example, the European Union classifies them as one of the top 10 debris generated on beaches [
1]. According to the World Health Organization, it is estimated that there are 1.3 billion consumers in the world, with which 4.5 billion SCBs are generated annually in the world, this is equivalent to a daily consumption of 20.3 billion [
2].
In Colombia, according to the National Administrative Department of Statistics (DANE) about 16 million Colombians have been consumers at least once in their lives. For example, for the year 2016 it was estimated that 94.9 million CBs were generated in Bogotá alone, which is equivalent to 16 tons found in public spaces (bars, discos, among other leisure areas) [
3,
4,
5]. In this context, one of the main drawbacks of this type of waste is its slow decomposition rate, which is associated with the microbial decomposition of one of its main components: plasticized cellulose acetate and an outer paper cover [
1,
3,
6]. However, the disposal of this type of waste continues to be a problem worldwide, since it enters sewage systems, surface water (rivers and lakes), surface runoff, garbage, among others.
For this reason, it has been found that SCBs transfer to water sources and generate a negative impact on ecosystems, for example, one SCB can contaminate 50 L of fresh water and 10 L of salt water [
6]. The compounds present in SCBs are toxic to microorganisms, insects, fish and mammals, among the compounds found, more than 7,000 toxic chemical compounds are identified [
7,
8], which are up to 50 carcinogens such as nicotine, carbon monoxide, hydrogen cyanide, nitrogen oxide, polycyclic aromatic hydrocarbons (PAHs), ammonium, formaldehyde, chemical compounds of benzene, toluene, ethylbenzene and xylene, phenol, pyridine, heavy metals and ketones [
9,
10,
11].
In order to reduce the impact of this type of waste, it has been studied how to include it in different industrial processes in order to give them added value, for example, fired clay bricks [
8], mixture with asphalt [
12], cellulose pulp production [
13], corrosion inhibitor, preparation of porous materials [
14,
15], among other applications. Among the applications that can be highlighted is the obtaining of carbonaceous materials, since SCBs are mainly made up of cellulose, which allows them to be used as raw material in obtaining Activated Carbon (AC). AC is an adsorbent material that has high adsorption capacities for different organic pollutants (Phenol, q
max = 268.9 mg/g) [
16], radionuclides (Uranium VI, q
max = 106 mg/g) [
17] and inorganic (heavy metals Pb
2+, q
max = 249.3 mg/g) [
18].
Due to the high demand for CA, not only for its new applications, but also for its main application in the removal of contaminants, its adsorbent potential for heavy metals is highlighted [
19]. Although it is known, the adverse effects of heavy metals in the environment and their increase in concentration [
20,
21], mainly due to activities related to metallurgy, operations dyeing, pigment production among others [
22]. Among the characteristics of heavy metals is that they are not biodegradable and tend to accumulate in organisms [
23], thus allowing their distribution in the air, soil and water [
24,
25].
Among the heavy metals, Cr classifies among the 16 heavy metals with the highest toxicity [
26], according to the World Health Organization (WHO), the maximum allowable amount of Cr (VI) in drinking water is 0.05 mg/L [
27], this being the most toxic species of Cr, since it causes cancer in the digestive tract and lungs [
28,
29].
With the mentioned before, this research work aims to understand the activation process for obtaining CA from SCB, and its application in the removal of Cr (VI). In this way, it is intended to use a waste such as SCB and give it added value to obtain porous materials that can be used as adsorbents in decontaminating water with high Cr (VI) content.
2. Materials and Methods
2.1. Collection and Preparation of Smoked Cigarette and Not Smoked Cigarette Butts
The smoked cigarette butts (SCB) were collected in different commercial and social areas of the city of Bogotá in August 2021. The SCBs were crushed using a cutting mill (Solab, SL-31, Piracicaba, Brazil) and sieved such to obtain particles <250 μm in size (60 mesh). Likewise, the not smoked cigarette butts (CB) were obtained from cigarettes that did not go through the smoking process, in this case each one of the butts were manually removed from each cigarette and the same homogenization and size reduction process was carried out of particle used for SCBs.
2.2. Thermogravimetric Analysis
A study of the thermal stability of the cigarette filters (CB) and SCB was carried out, prior to the carbonization process, for this a Hitachi STA 7200 RV Thermogravimetric equipment was used, the established operating conditions were: N2 at a flow of 100 mL/min, a temperature range (T) of 25 to 650 °C and heating rates (β) of 5, 10, 15 °C/min. According to the results obtained, a carbonization process was carried out in a Thermolyne 21100 horizontal oven at a temperature of 350 °C, a heating rate of 5 °C/min and a residence time of 120 minutes.
2.3. Pyrolysis Kinetic Study
The pyrolysis kinetics of a residue is evaluated through a process of converting solids into volatiles, which occurs through a sequence of chemical reactions. The complex structure of the residue is broken into different small structures by the increase in temperature; consequently, the process results in a weight loss of the solid structure [
30].
The TGA results were analyzed using isoconversional kinetic models, Kissinger-Akahira-Sunose (KAS), Flynn-Wall-Ozawa (FWO) and Starink (STK), for which variables such as Alpha (α) are used, which is the conversion of the mass, Beta (𝛽) corresponds to the heating rate, 𝐸𝑎 indicates the activation energy, R belongs to the ideal gas constant 8.314 kJ/(mol*K), G Gibbs free energy, T is temperature in K and A is the frequency factor or pre-exponential factor obtained by the Kissinger method (See Equation (1)), which does not present an analytical solution, and the KAS, OFW and STK models are obtained with algebraic approximations:
For the Kissinger-Akahira-Sunose (KAS) method, the activation energy is estimated with Equation (2):
Where the slope β/T
2 is evaluated as a function (∝) which represents the conversion of the mass with respect to temperature fluxes (β), for each conversion value the corresponding curves are made by means of Equation (3):
The Ozawa-Flynn-Wall (OFW) method is represented by the following Equation (4):
The activation energy can be determined with the help of the graph between ln(β) and 1/T in each conversion and is therefore calculated from the slope (See Equation 5):
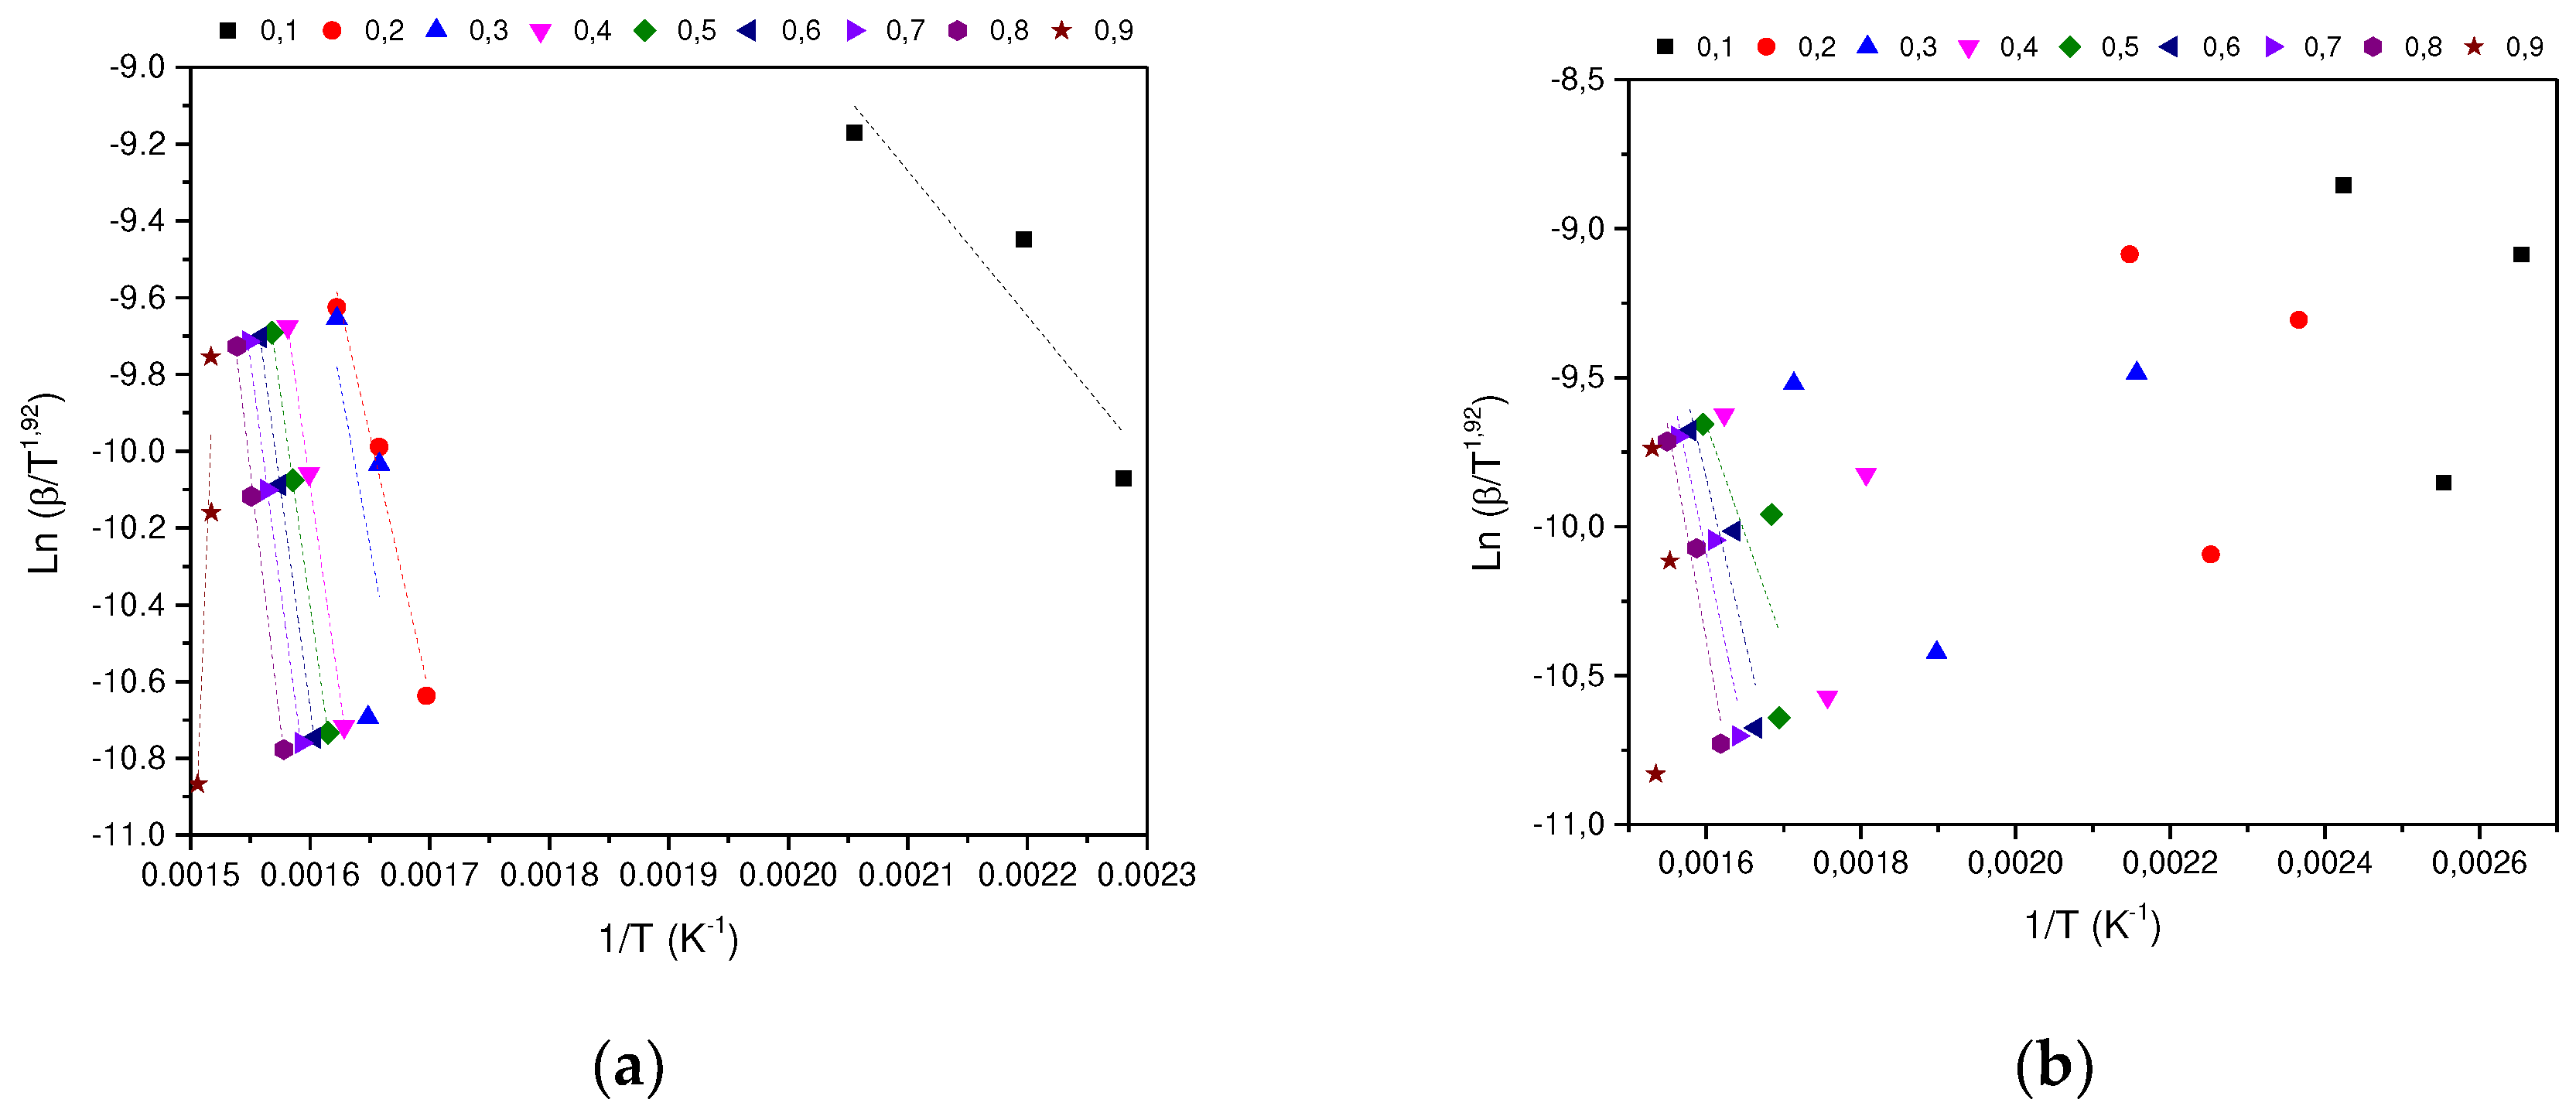
The Starink method (STK) [Ecu. 6] presents a higher degree of precision, with respect to the OFW [Ecu. 4] and KAS [Eq. 2]. This is denoted by the accuracy in which it was carried out with algebraic methods to increase the precision of the equation, presenting similarities of a linear equation with the KAS model. The STK model is represented by the Equation (6):
To find the activation energy, ln(β/T1.92 ) vs 1/T is plotted to obtain a set of straight lines in different conversions, in this way the slope -1.0008(Ea/R) is calculated.
The Kissinger method is represented by the Equation (7):
The Kissinger method is mainly used to estimate the frequency factor, using the activation energies obtained in each conversion using one of the different methods (See Equation 8):
where β is the heating rate and Tm is the maximum temperature at a heating rate. The value estimated by equation (8) will be essential to calculate the equations of the thermodynamic parameters.
2.3.1. Estimation of Kinetic Parameters
With the activation energy values, you can calculate the different thermodynamic parameters, such as: Pre-Exponential Factor (A) in the Arrhenius equation, enthalpy (∆H), entropy (∆S) and Free energy (∆ G) through Equations (9)–(11):
Kb represents Boltzmann's constant ((1.38*10-23 J/K) and h represents Planck's constant (6.626*10-34 J/s). For the calculation of these thermodynamic parameters, the activation energy is calculated by the KAS, FWO and STK methods.
2.4. Preparation of Activated Carbon (CA)
The mass of the respective carbonizations was determined with the objective of analyzing the conversion of the raw material, later a carbonized impregnation process was carried out: KOH in a 1:5 ratio [
31], the samples were left in contact with the solution for 24 h, then it was filtered and activated. The activation process was carried out in a Thermolyne 21100 horizontal oven, under the following conditions: heating speed of 5°C/min, maximum temperature of 800°C, nitrogen flow of 100 mL/min, and a residence time of 120 minutes. Once the CA was obtained, it was washed with deionized water at a T > 60 °C until neutral pH. Finally, the sample was dried in a muffle at 100 °C for 24 hours.
2.5. Determination of Textural Parameters
For the textural characterization of CA from SCB and commercial CA, N2 isotherms were performed at -192 °C. The samples were degassed at a temperature of 250 °C. Subsequently, the textural characteristics were determined: the BET surface area, micropore volume (Dubinin-Astakhov Method), Mesopore volume (Vol. Meso = Total Vol. - Vol. DA) and Total Volume (Volume adsorbed to 0.95 of P/P0).
2.6. Hexavalent Chromium Adsorption onto Activated Carbon
A stock solution (500 mg/L) of Cr(VI) was prepared by dissolving K
2Cr
2O
7 in distilled water. The test solution of Cr(VI) used in each study was prepared by diluting the stock solution in the range of 5-300 ppm. Adsorption experiments were carried out by adding 50 mg activated carbon obtained from SCB samples into Erlenmeyer flasks containing 20 mL of Cr(VI) solution and a set temperature of 25°C. The mixture was stirred using a magnetic stirrer at a constant stirring speed (150 rpm) for 24 hours and filtered. Finally, for the quantification of the Cr (VI) content in each test, the pH was adjusted with solutions of 0.1 N HCl or 0.1 N NaOH up to a value of 1 and then 200 μL of 1,5-diphenylcarbazide were added, and the absorbance of each of the samples was read at 540 nm. The values of Cr (VI) removed in each of the samples were calculated using a calibration curve of 20 mL of K
2Cr
2O
7 as standard (0.1, 0.25, 0.5, 0.75 and 1 ppm, R
2=0.99) and 200 μL of 1, 5-diphenylcarbazide at pH 1 [
32].
3. Results
3.1. Thermal Decomposition Analysis of Cigarette Butts
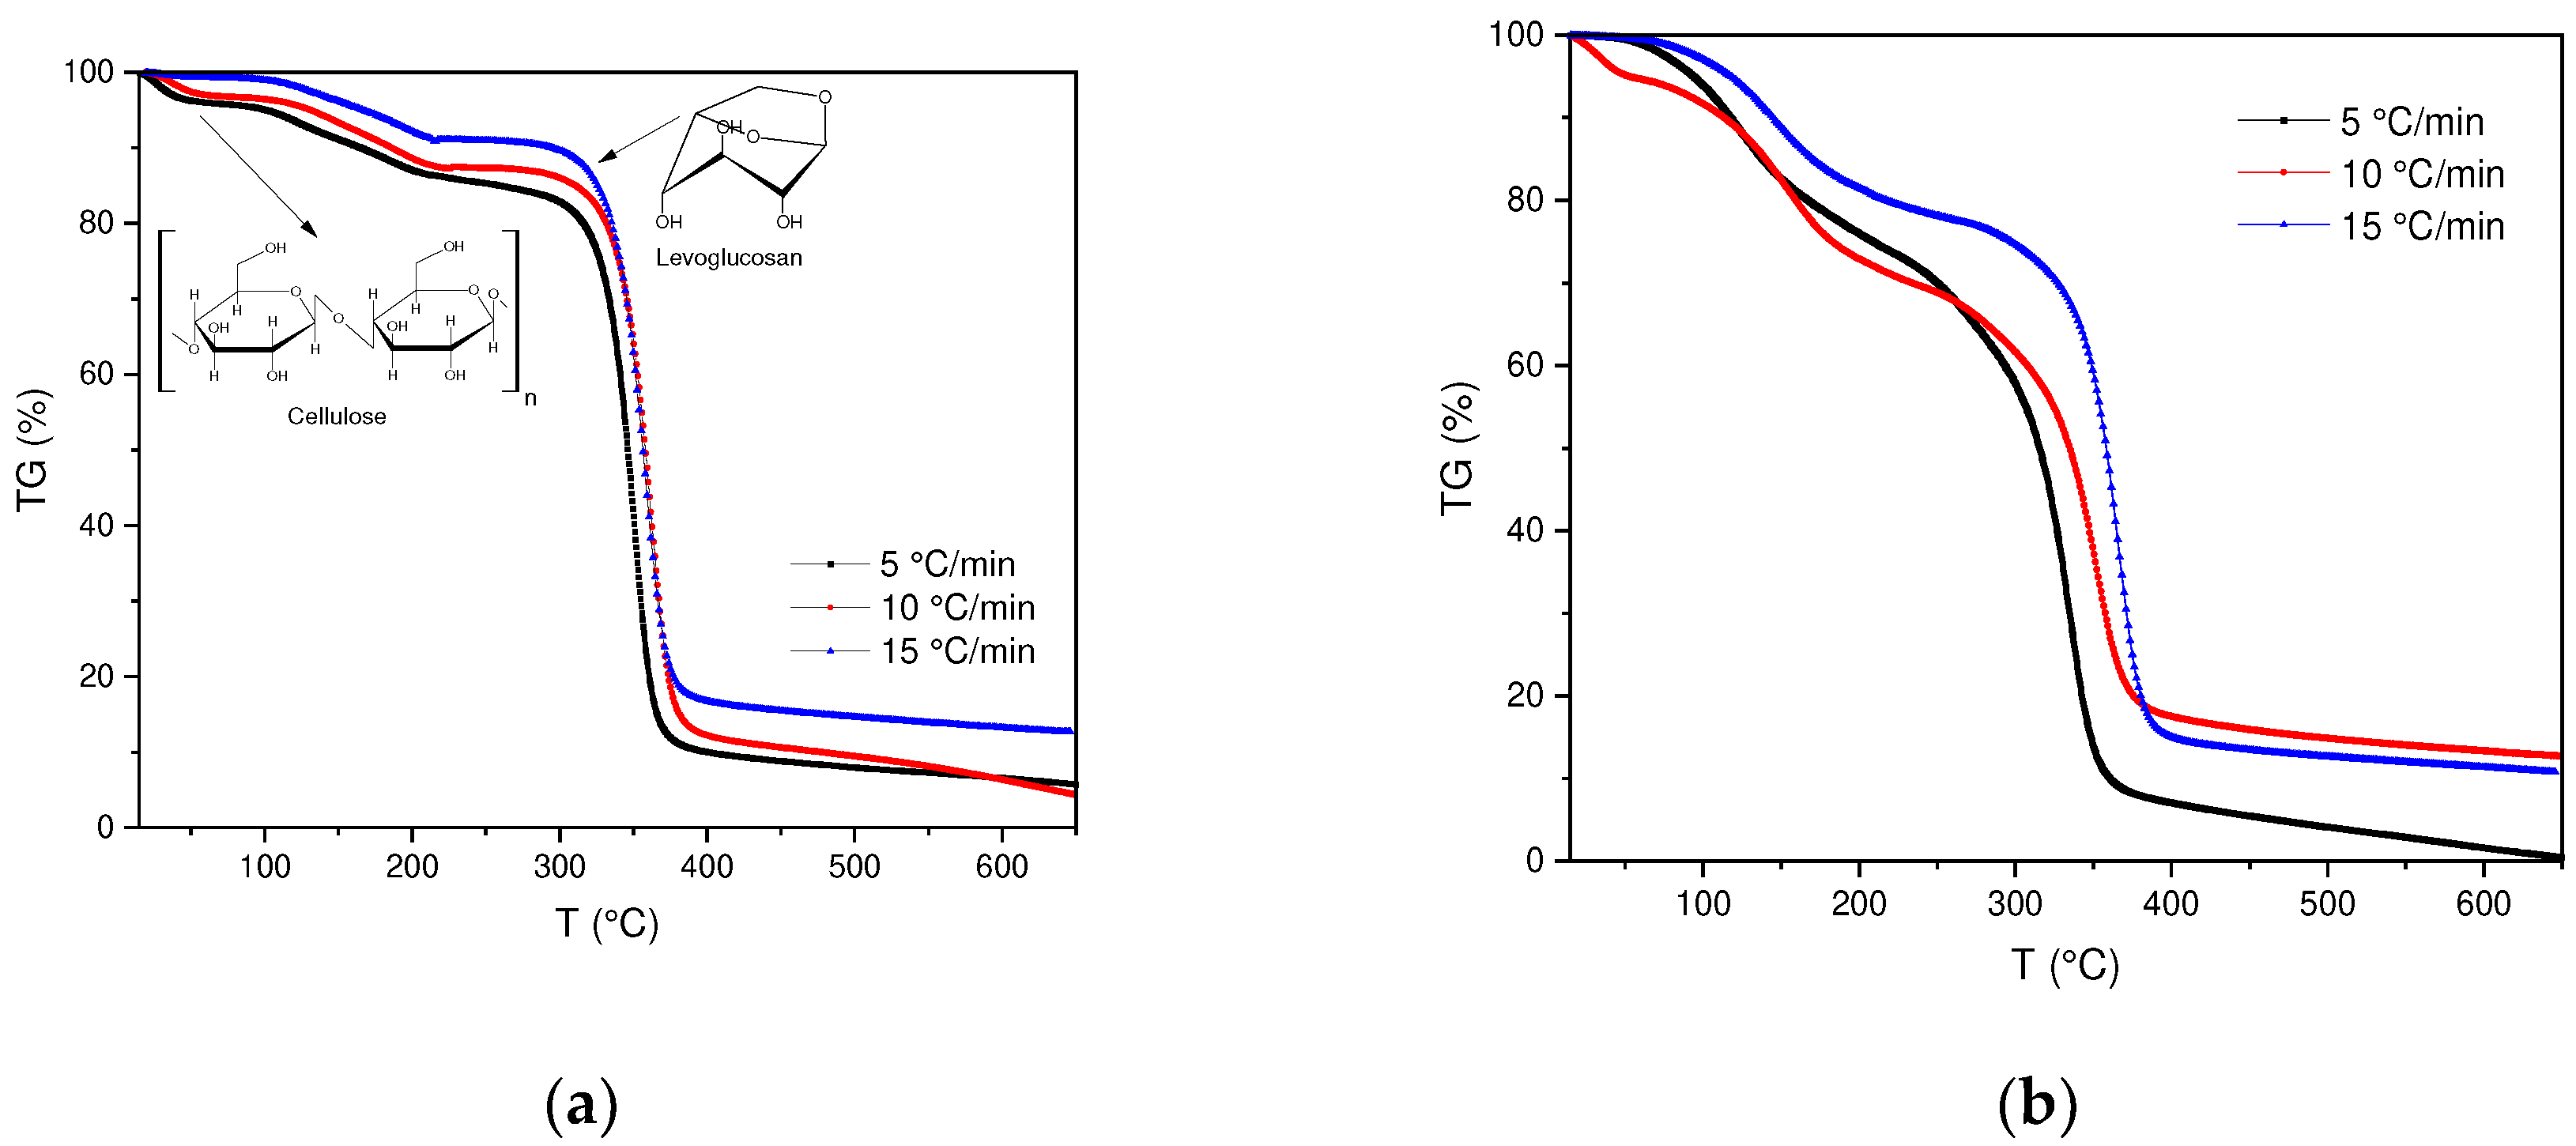
Thermal decomposition of SCBs as well as cigarette filters was determined by thermogravimetric analysis (TGA) under non-isothermal conditions (
Figure 1a,b). In the TGA curves obtained, significant changes in the behavior of the samples can be evidenced, in this case in the SCB samples, a change in the trend is observed between the temperature interval of 100-500 °C.
The thermal decomposition process of FC is similar to other biomass samples with a high percentage of cellulose such as: palm date [
33], sugar cane bagasse [
34], pine wood [
35] among others. In this way, the results obtained suggest that cigarette filters are mainly composed of cellulose acetate [
36], their thermal degradation occurs in a temperature range between 300-400 °C. During this process, a product called "Active Cellulose" is formed, which is produced from the depolymerization of cellulose in levoglucosan, to finally produce volatile species (g) and char (s). Likewise, it is observed that at temperatures below 200 °C a cellulose dehydration process is carried out, in which water molecules between cellulose chains are eliminated.
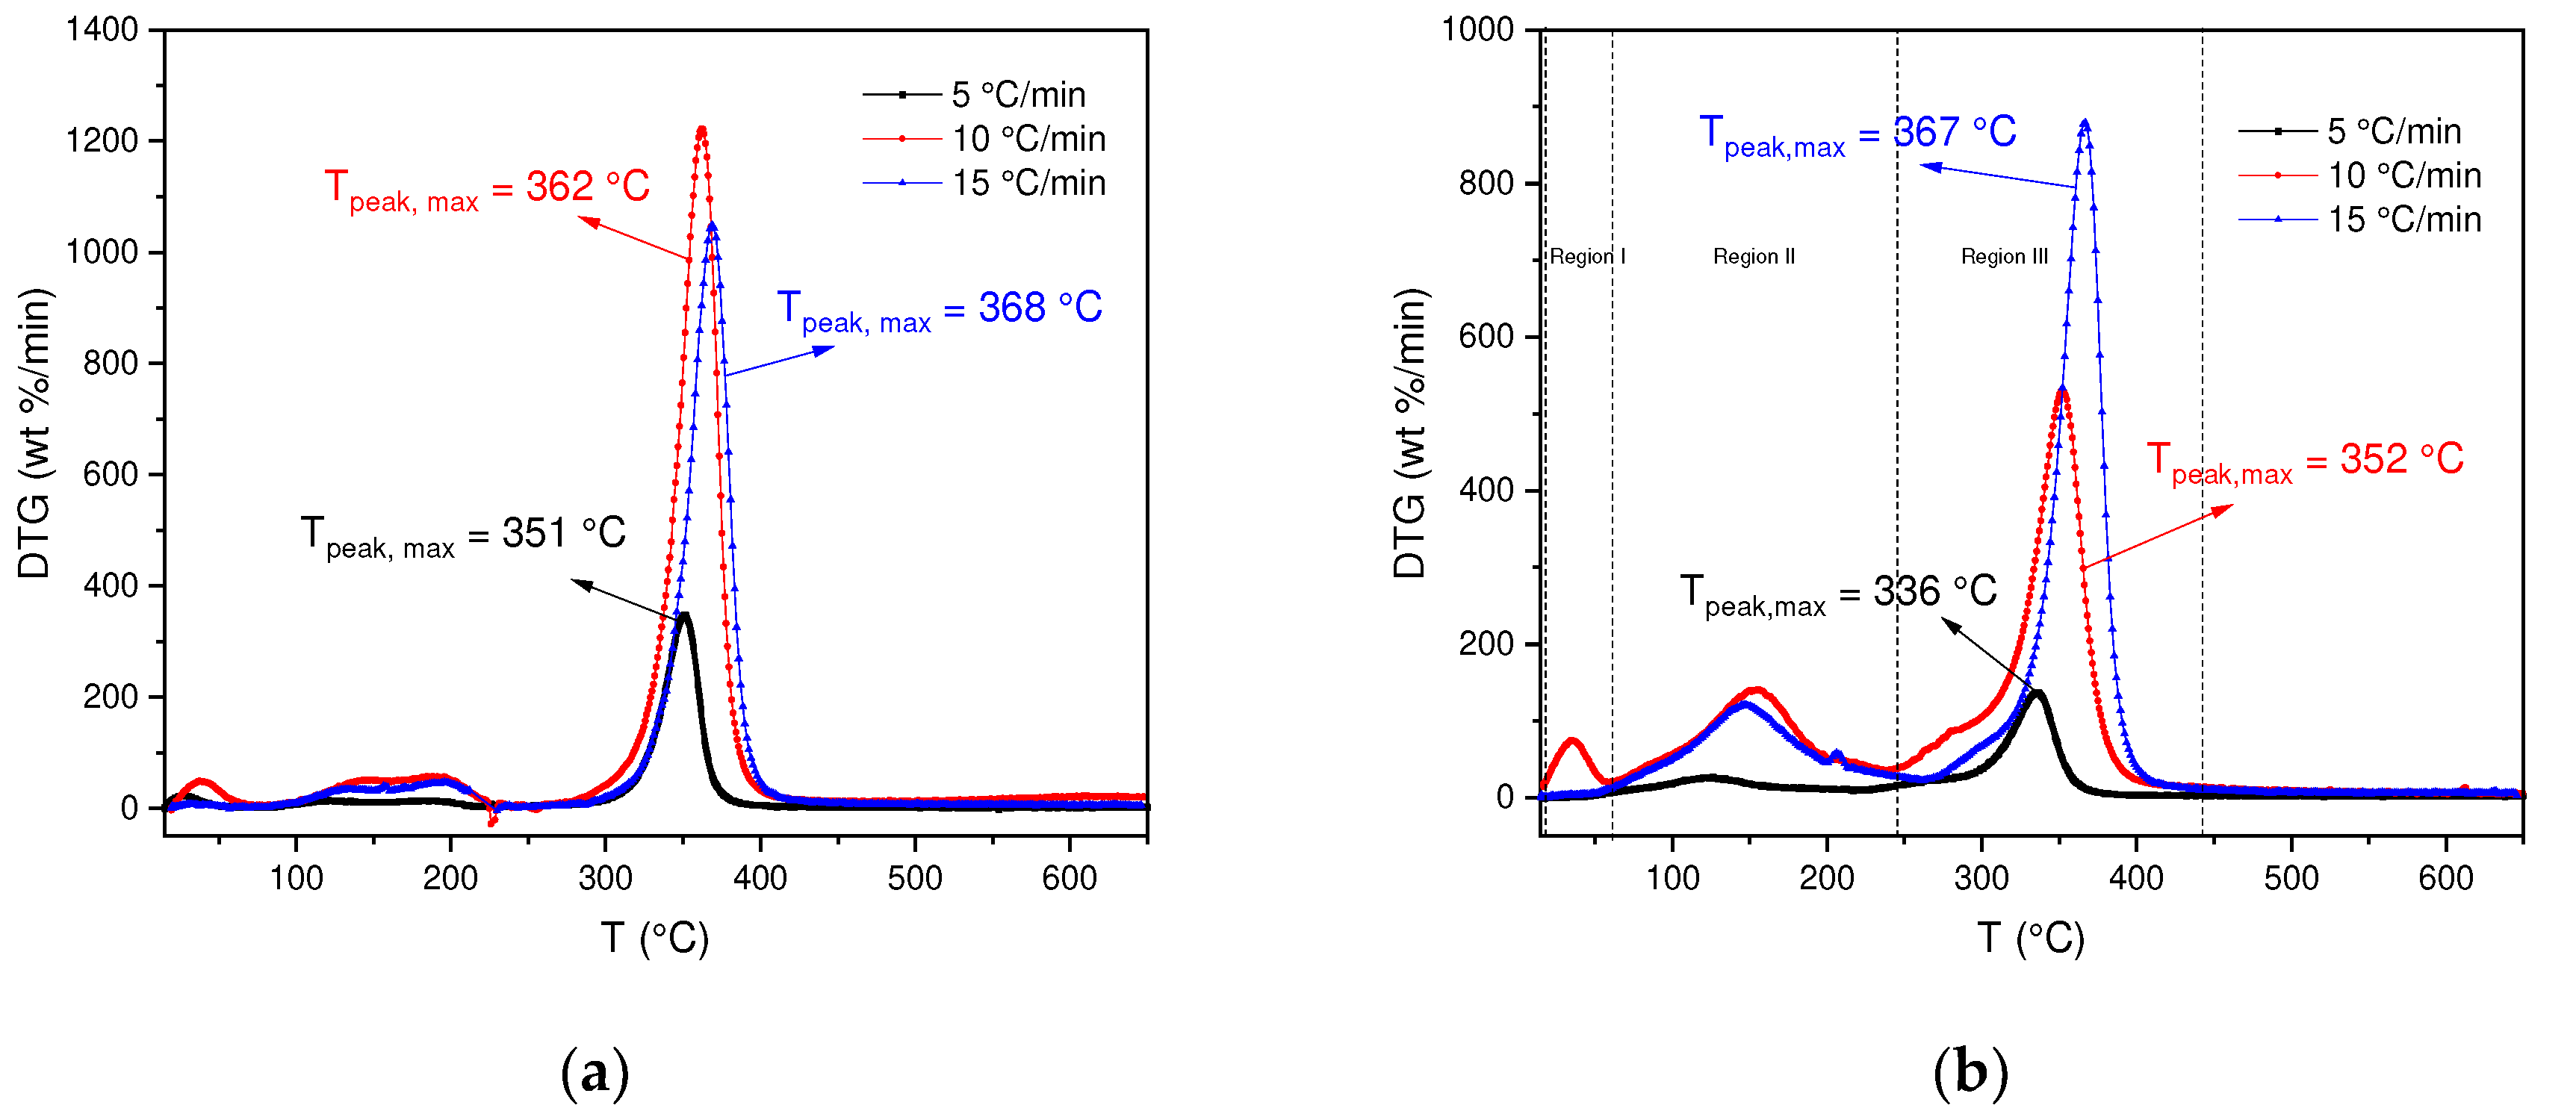
On the other hand, a maximum peak obtained in the DTG of the BC is observed, which corresponds to 340°C, where the maximum conversion rate occurs. Although, it is observed that the BC are stable up to a T of 300 °C, after this temperature the degradation process of the main component, cellulose, takes place. In this context, the loss related to humidity represents between 1-4%, the degradation of cellulose implies a greater contribution in the loss of mass with a range between 75-76%. The yield obtained at a temperature of 600 °C corresponds to an approximate weight loss of 90.41% (See annex,
Table 1).
The previous results allow us to compare the BC with the results obtained for the SCBs, although both present the same composition (cellulose acetate), their difference lies in the fact that the SCBs have different organic compounds, which is why differences in the speeds, obtained in the DTG, are observed, because when the tobacco is combusted, the products that are generated are retained in the cigarette filter.
In order to analyze the changes in this behavior, the DTG curves for each BC and SCB sample were determined. In
Figure 2a, for the decomposition of BC it can be observed that the thermal decomposition process occurs in a temperature range of 245-440 °C with a percentage loss in region III of 75-76 %, due to the degradation of cellulose. However, in the DTG it can be analyzed that there are differences in the degradation processes, due to the effect of the heating rate. In this case, it is obtained that for heating rates of 10 and 15 °C/min the highest percentages of mass loss are found, likewise where the greatest reactivity of the BC occurs. However, the results show that for a speed of 5 °C/min the reactivity is lower due to the low activation energy supplied.
On the other hand, SCBs present a different behavior compared to BC, which is shown in
Figure 2b. In this case, for the three heating speeds a different behavior is observed in the DTG curve, some additional processes are carried out, for example, for speeds of 10 and 15 °C/min three regions are observed, the first one between 25-60 °C where the evaporation of absorbed substances occurs (volatile compounds: 1,3-butadiene, formaldehyde, isoprene among others) [
37], the second region occurs in a temperature range of 60-250 °C where the vaporization of organic compounds with higher evaporation temperatures continues (benzene, benzo[a]pyrene, Acrylonitrile among others) [
37]. Finally, the third region between a range of 250-400 °C where the degradation of cellulose acetate (main component) occurs, thus obtaining a solid residue (carbonized) [
38].
If the DTG of the BCs are compared with the SCBs, it is observed that in the SCBs there are variations in the peaks, which is associated with the presence of chemical compounds that are retained in the cigarette butt and that originate when cigarettes are smoked. In contrast to the BC where there are no compounds associated with the combustion of tobacco and its composition is mainly cellulose acetate.
3.2. Effect of Heating Rate
In
Figure 2a,b the effect of heating rate on the thermal decomposition of BC and SCB is observed. It can be seen that the shape of the DTG curves for the three heating rates have the same shape in each sample. However, as mentioned in
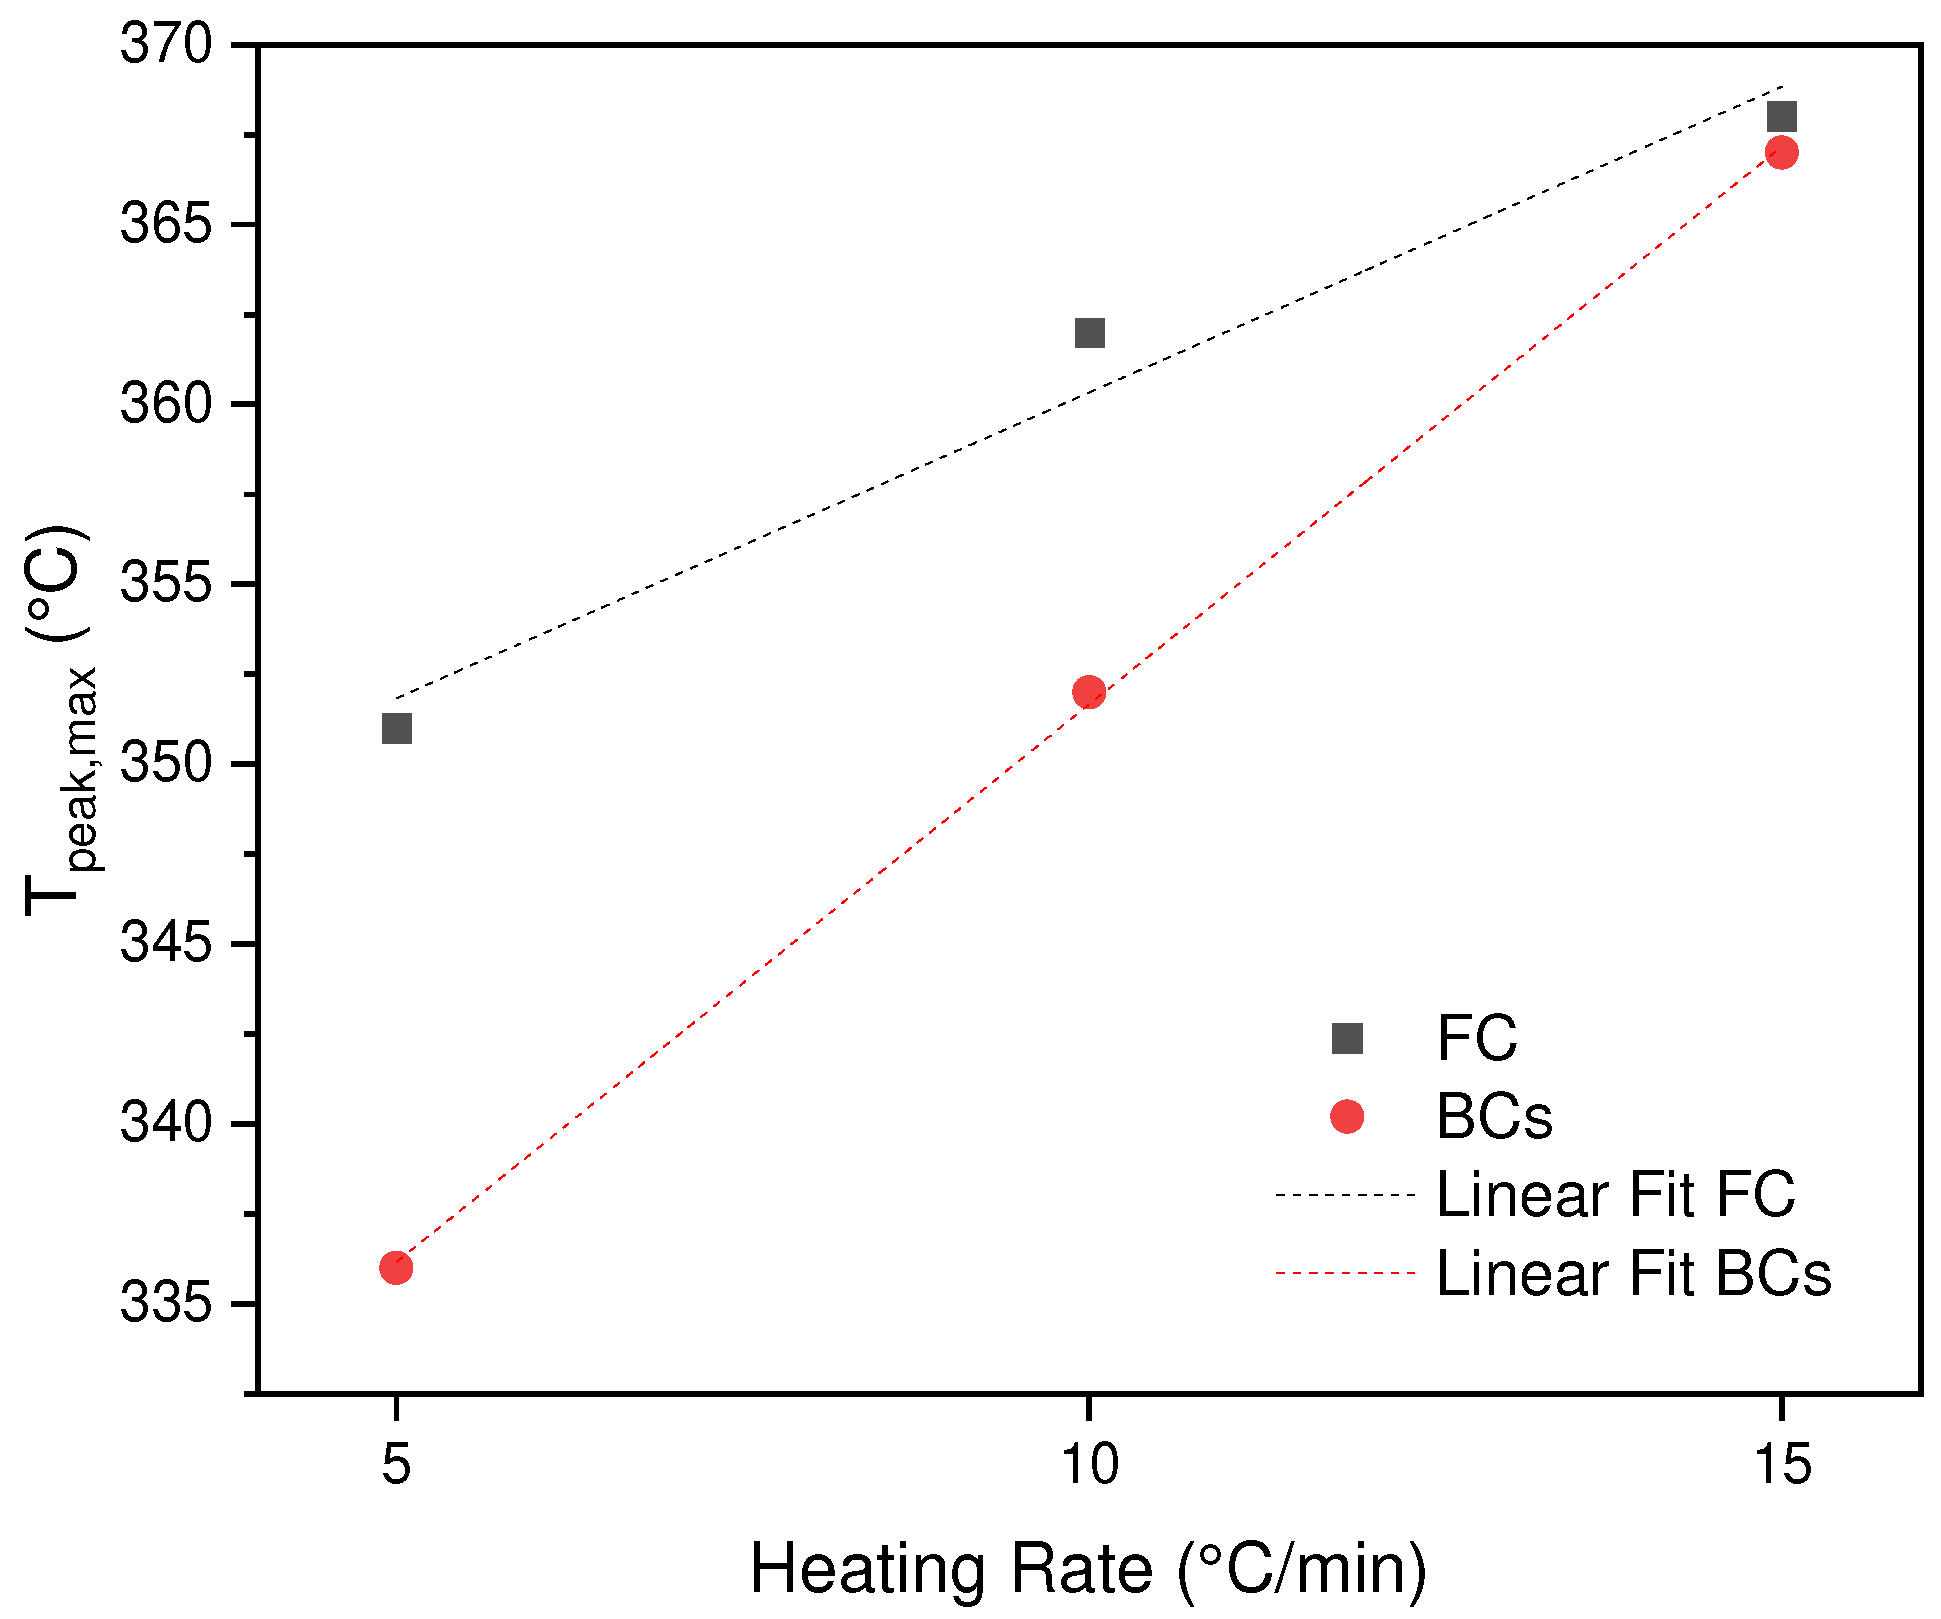
Section 3.1, the difference is focused on the process that occurs for the SCB sample where there is presence of chemical substances derived from the smoking process, prior to pyrolysis. However, it is found that a shift of the peak for the case of BC of 351, 362, 368 °C as the rate of heating increases (cellulose acetate degradation), which is similar for the sample of SCB 336, 352 and 367°C. This means, the heat transfer between environment-system is not equivalent, therefore, the degradation rate decreases and a displacement of the curves is generated when the heating rate increases. Additionally, if the two samples are compared, a decrease in the maximum temperatures in the SCBs is found, due to an effect generated by the different compounds absorbed in the combustion process, these molecules allow a greater heat transfer, decreasing the T
max, except for the heating rate of 15 °C/min which is equivalent for the two samples BC and SCB, the latter shows that the thermal transport generated by the molecules is inhibited by rapid vaporization processes, which leads to the decomposition of the acetate of cellulose at a similar T for the two samples (See
Figure 3).
3.3. Kinetic Analysis
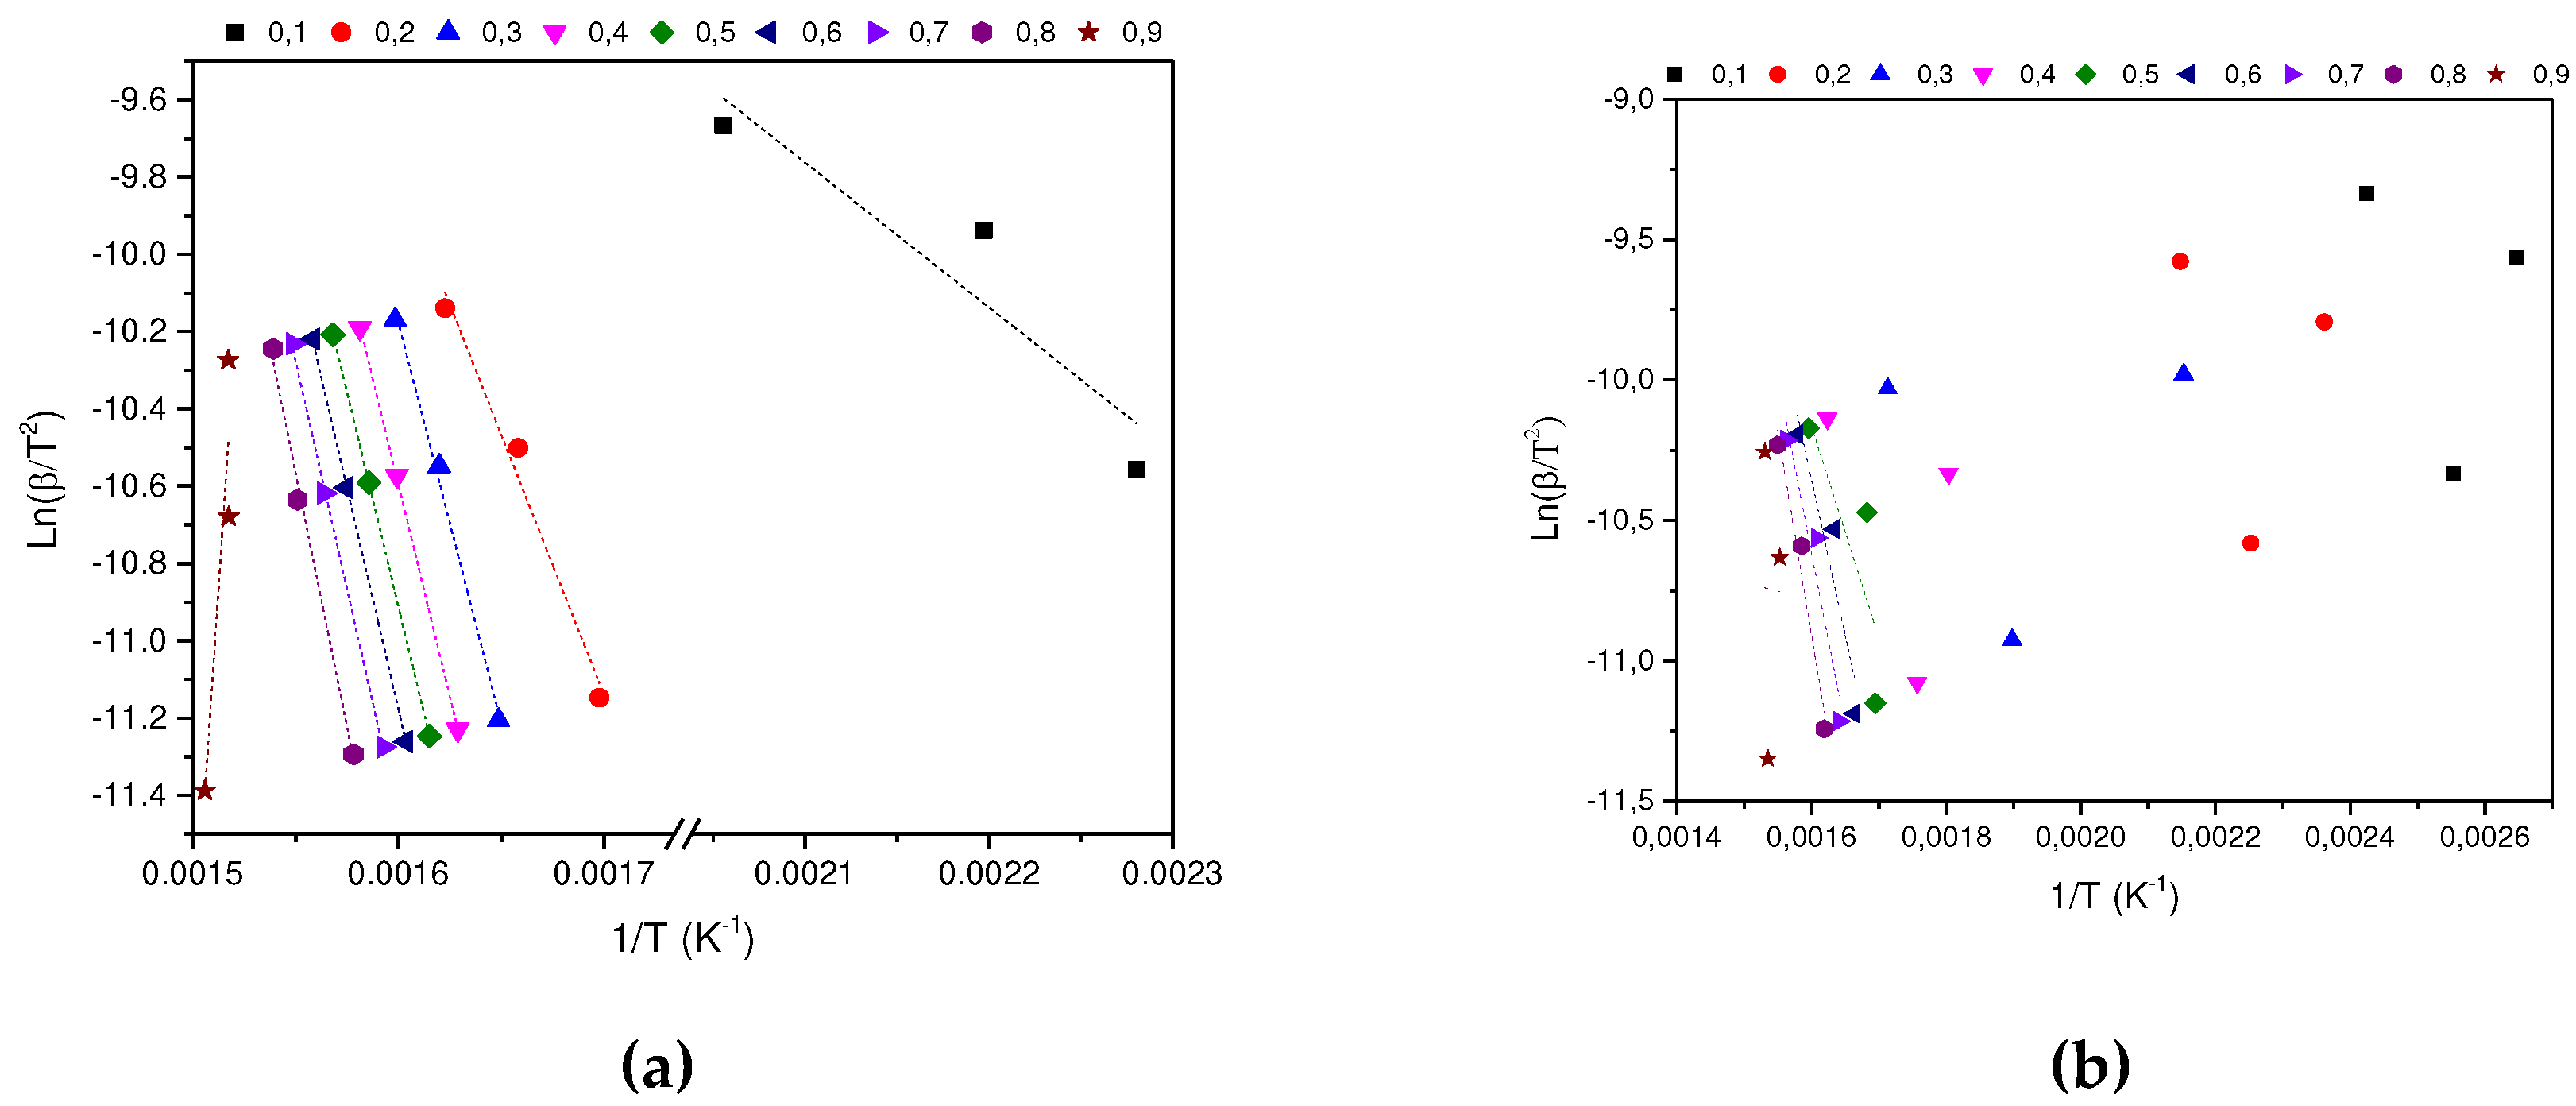
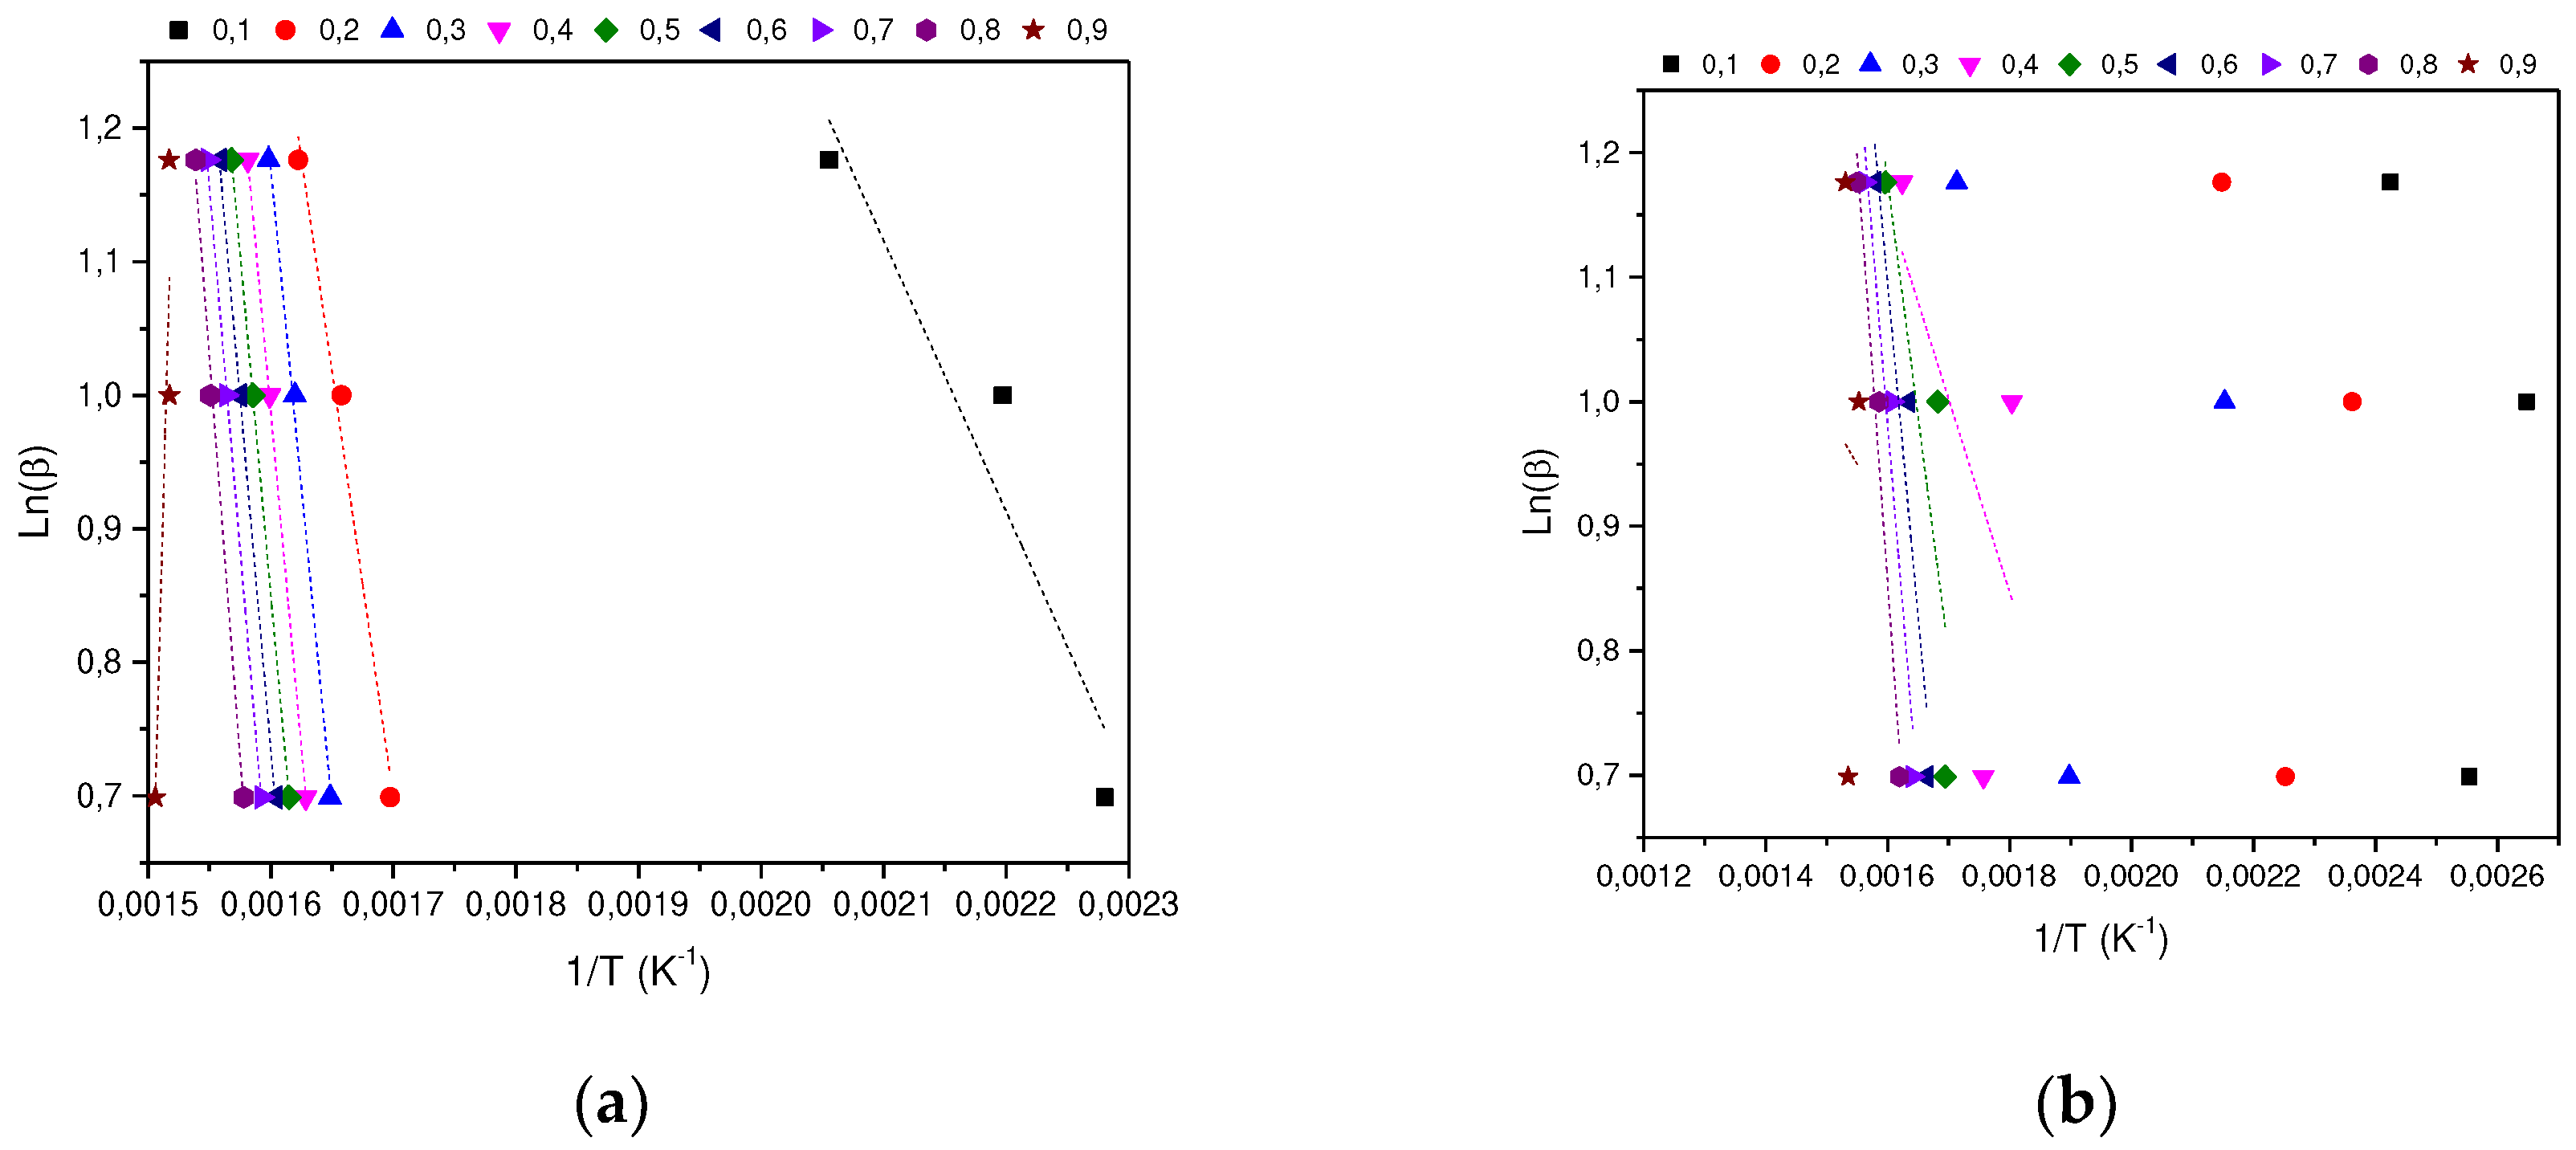
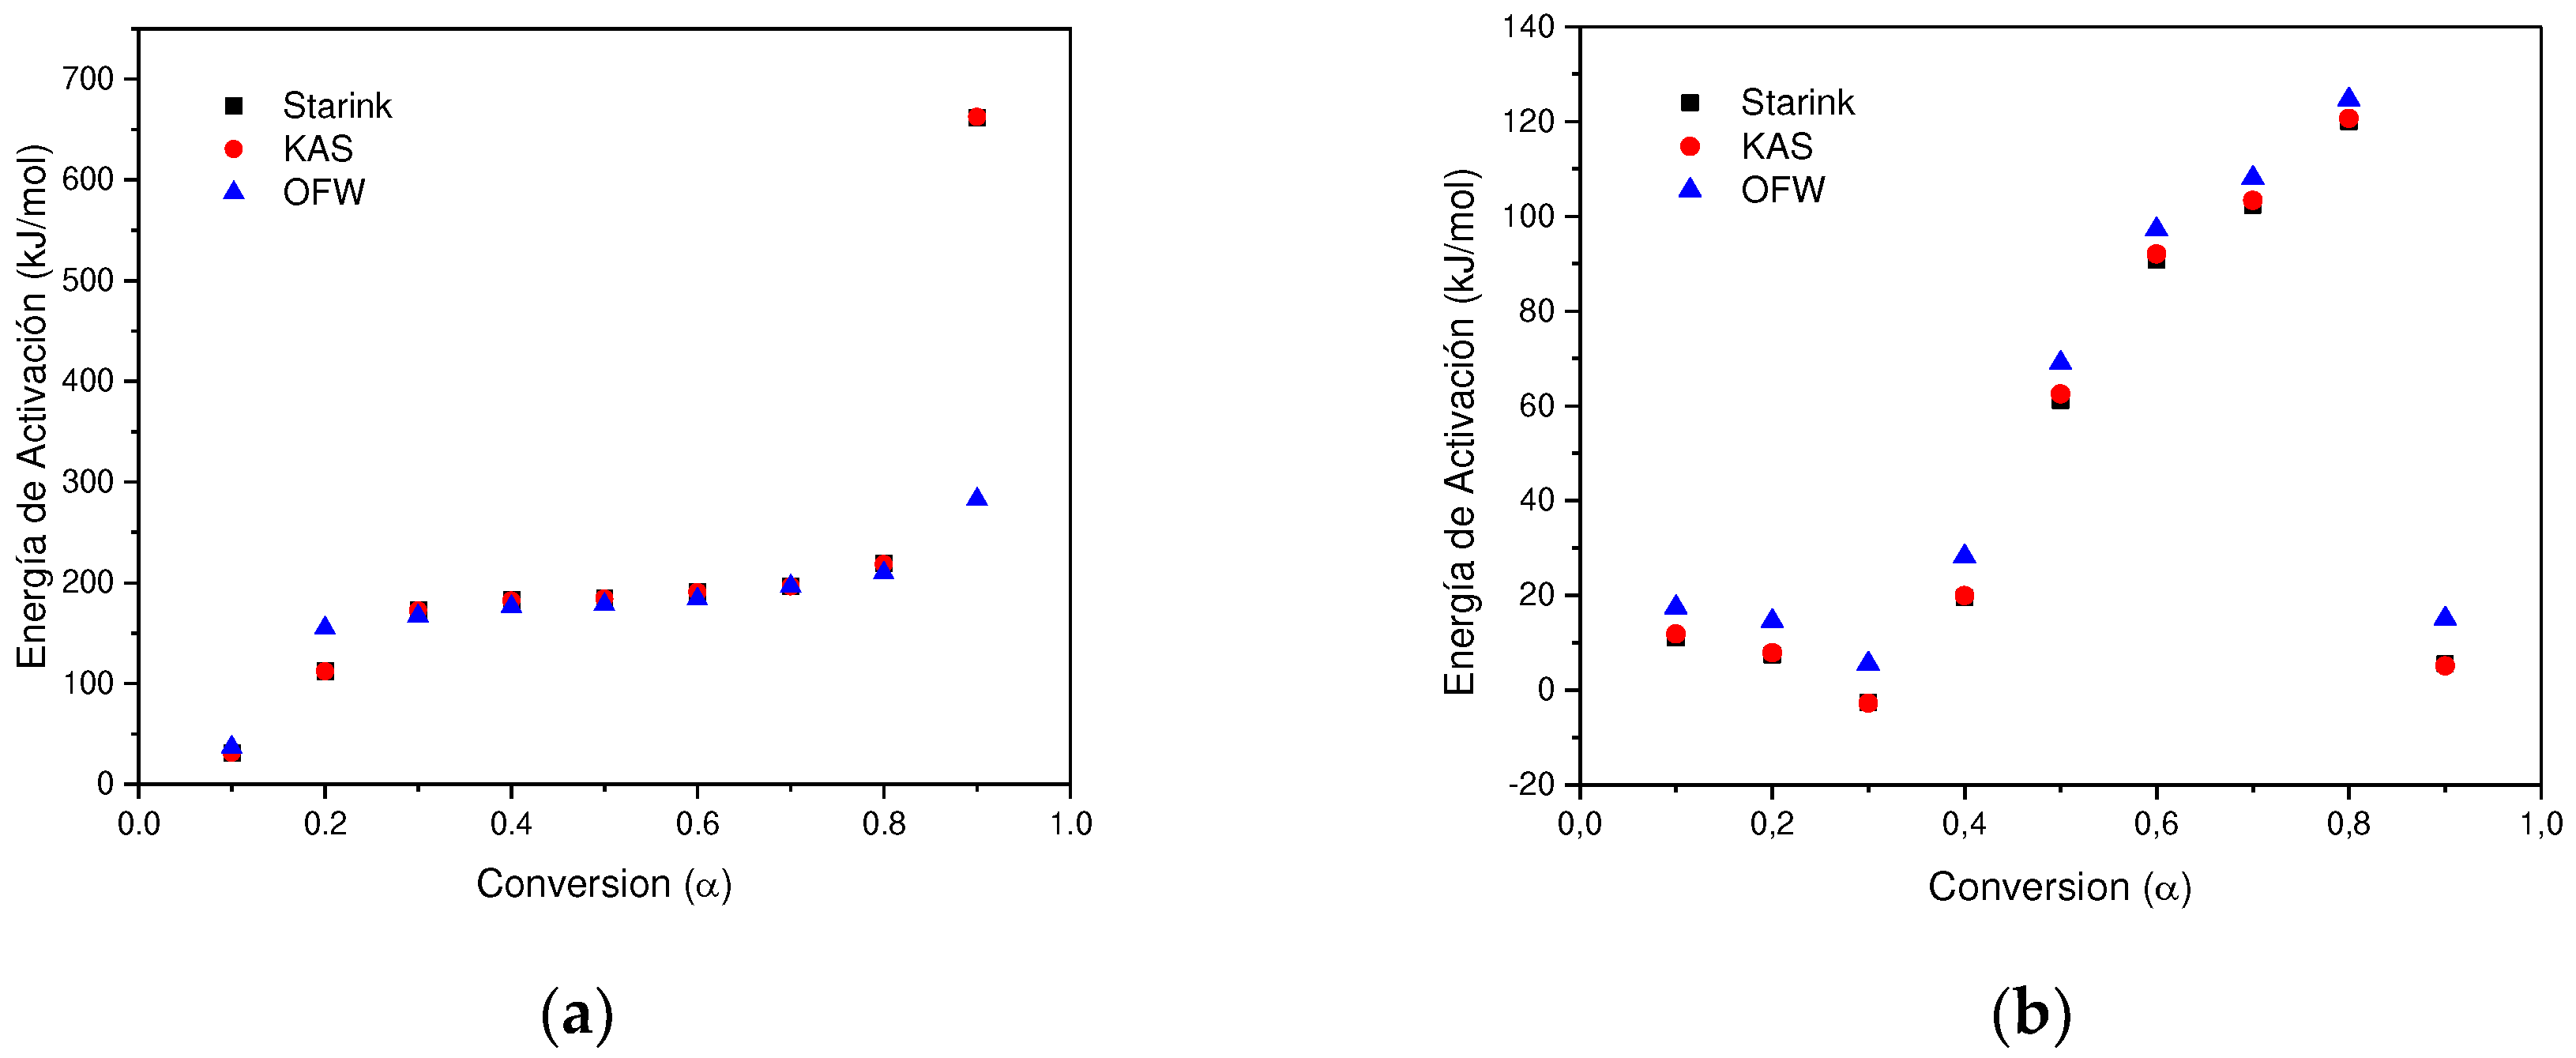
In determining the thermal degradation mechanism for BC and SCB samples, the Kissinger-Akahira-Sunone (KAS), Flynn-Wall-Osawa (OFW) and Starink (STK) linear kinetic isoconversion models were used. In this case, for the determination of Ea, Equations 4 and 5 were used, where the Ea corresponding to each conversion in the range between 10-90 % was determined. Thus, average activation energies were obtained for BC and SCB according to each model: FC 216.77 (KAS), 176.31 (OFW) and 217.08 kJ/mol (STK), while for SCB average Ea 46.73 were obtained. (KAS), 53.32 (OFW) and 46.10 kJ/mol (STK) (See
Figure 4,
Figure 5 and
Figure 6).
According to the results obtained, it is observed that for the BC the Ea is close for the KAS and STK models, in contrast to the value obtained for the OFW model, which allows finding a deviation of 23.45; while for the SCB the values obtained from Ea present a deviation of 4.00 for the three models.
Figure 6a shows that for the BC the three adjusted models present a similar behavior, where an increase in Ea is observed with the increase in conversion by 0.1-0.8, values corresponding to the temperature range between 165-360 °C, this increase is related to the energy necessary for the thermal decomposition of cellulose acetate 216.77 kJ/mol, which is in agreement with values reported by (135-223 kJ/mol) [
39].
In contrast, a different behavior is observed with the SCB sample, where a decrease in the activation energy is carried out in the conversion interval of 0.1-0.3, while in the interval of 0.4-0.8 Ea increases. Finally, at a conversion of 0.9, Ea decreases by half of the value obtained at a conversion of 0.1 for the KAS and STK models, while in the OFW model the decrease in the value of Ea for a conversion of 0.9 is similar to the obtained at a conversion of 0.1. In this way, the average value of Ea corresponds to 48.72 kJ/mol, which is in agreement with what was found by other authors 36.56-38.47 kJ/mol [
30]. In this way, it can be seen that the changes in the SCB in comparison to the BC are due to the decomposition of the different organic compounds that are generated by the combustion of tobacco, nicotine, tars and among others (See
Figure 7).
According to the linear models used in this research, it was obtained the correlation coefficients between 0.8644 - 0.9999 for the FC samples. In this case it reports a maximum mean absolute percentage error of 6.7% (OFW for α = 0.9), which means that there is at least 93.3% accuracy in this model, while for others is even greater. RMSD is obtained between 0.02 – 0.2, this being the minimum and maximum deviation for the Ea calculated in each model, showing the smallest data spread for the OFW model. Due to the size of the samples, it was identified that the KAS model has the best compensation between the complexity of the model and its goodness of fit under the corrected Akaike criterion (AICc between 60-87). As for the CBs for specific conversions, for example, KAS α = 0.2 appear low coefficients (R2=0.0037), associated with the multiple processes that occur due to the absorption of different organic compounds in the BCs. In this case it is reported as maximum mean absolute percentage error of 20.8% (OFW for α = 0.9), which means that there is at least 79.2% accuracy in this model, while for the In the KAS and STK models, the maximum mean absolute percentage error does not exceed 4.5%. Using the AICc criterion, the KAS model as the one that shows the best compensation between the complexity of the model and its goodness of fit (AICc between 46-77).
3.4. Thermodynamic Analysis
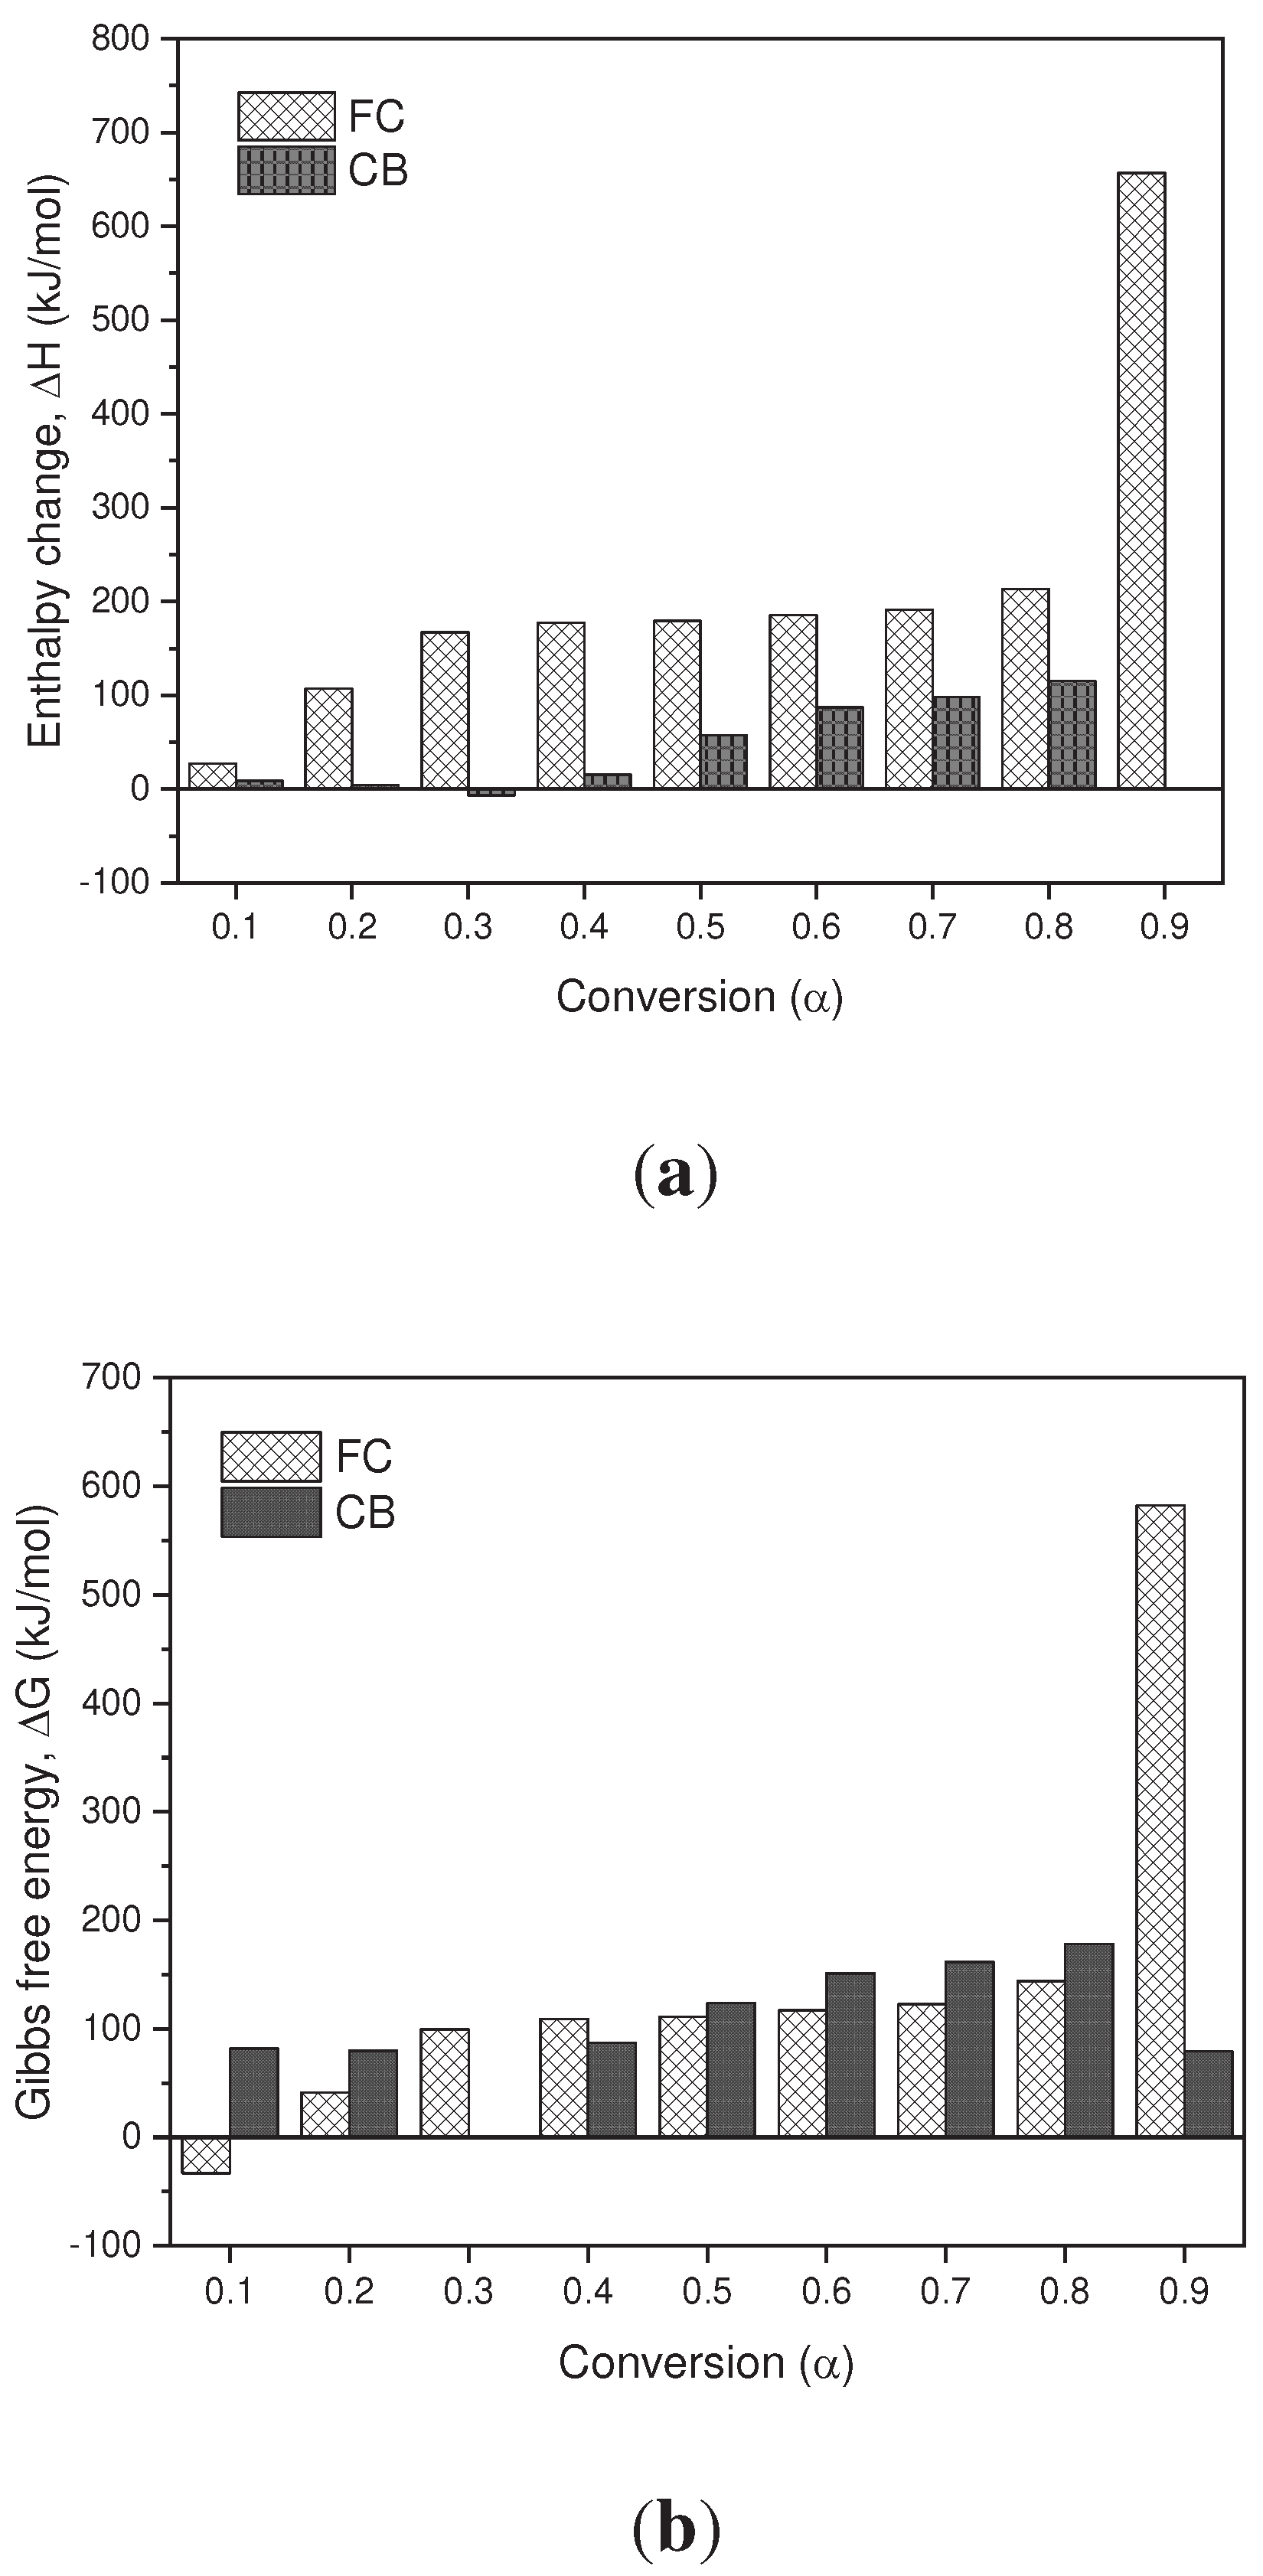
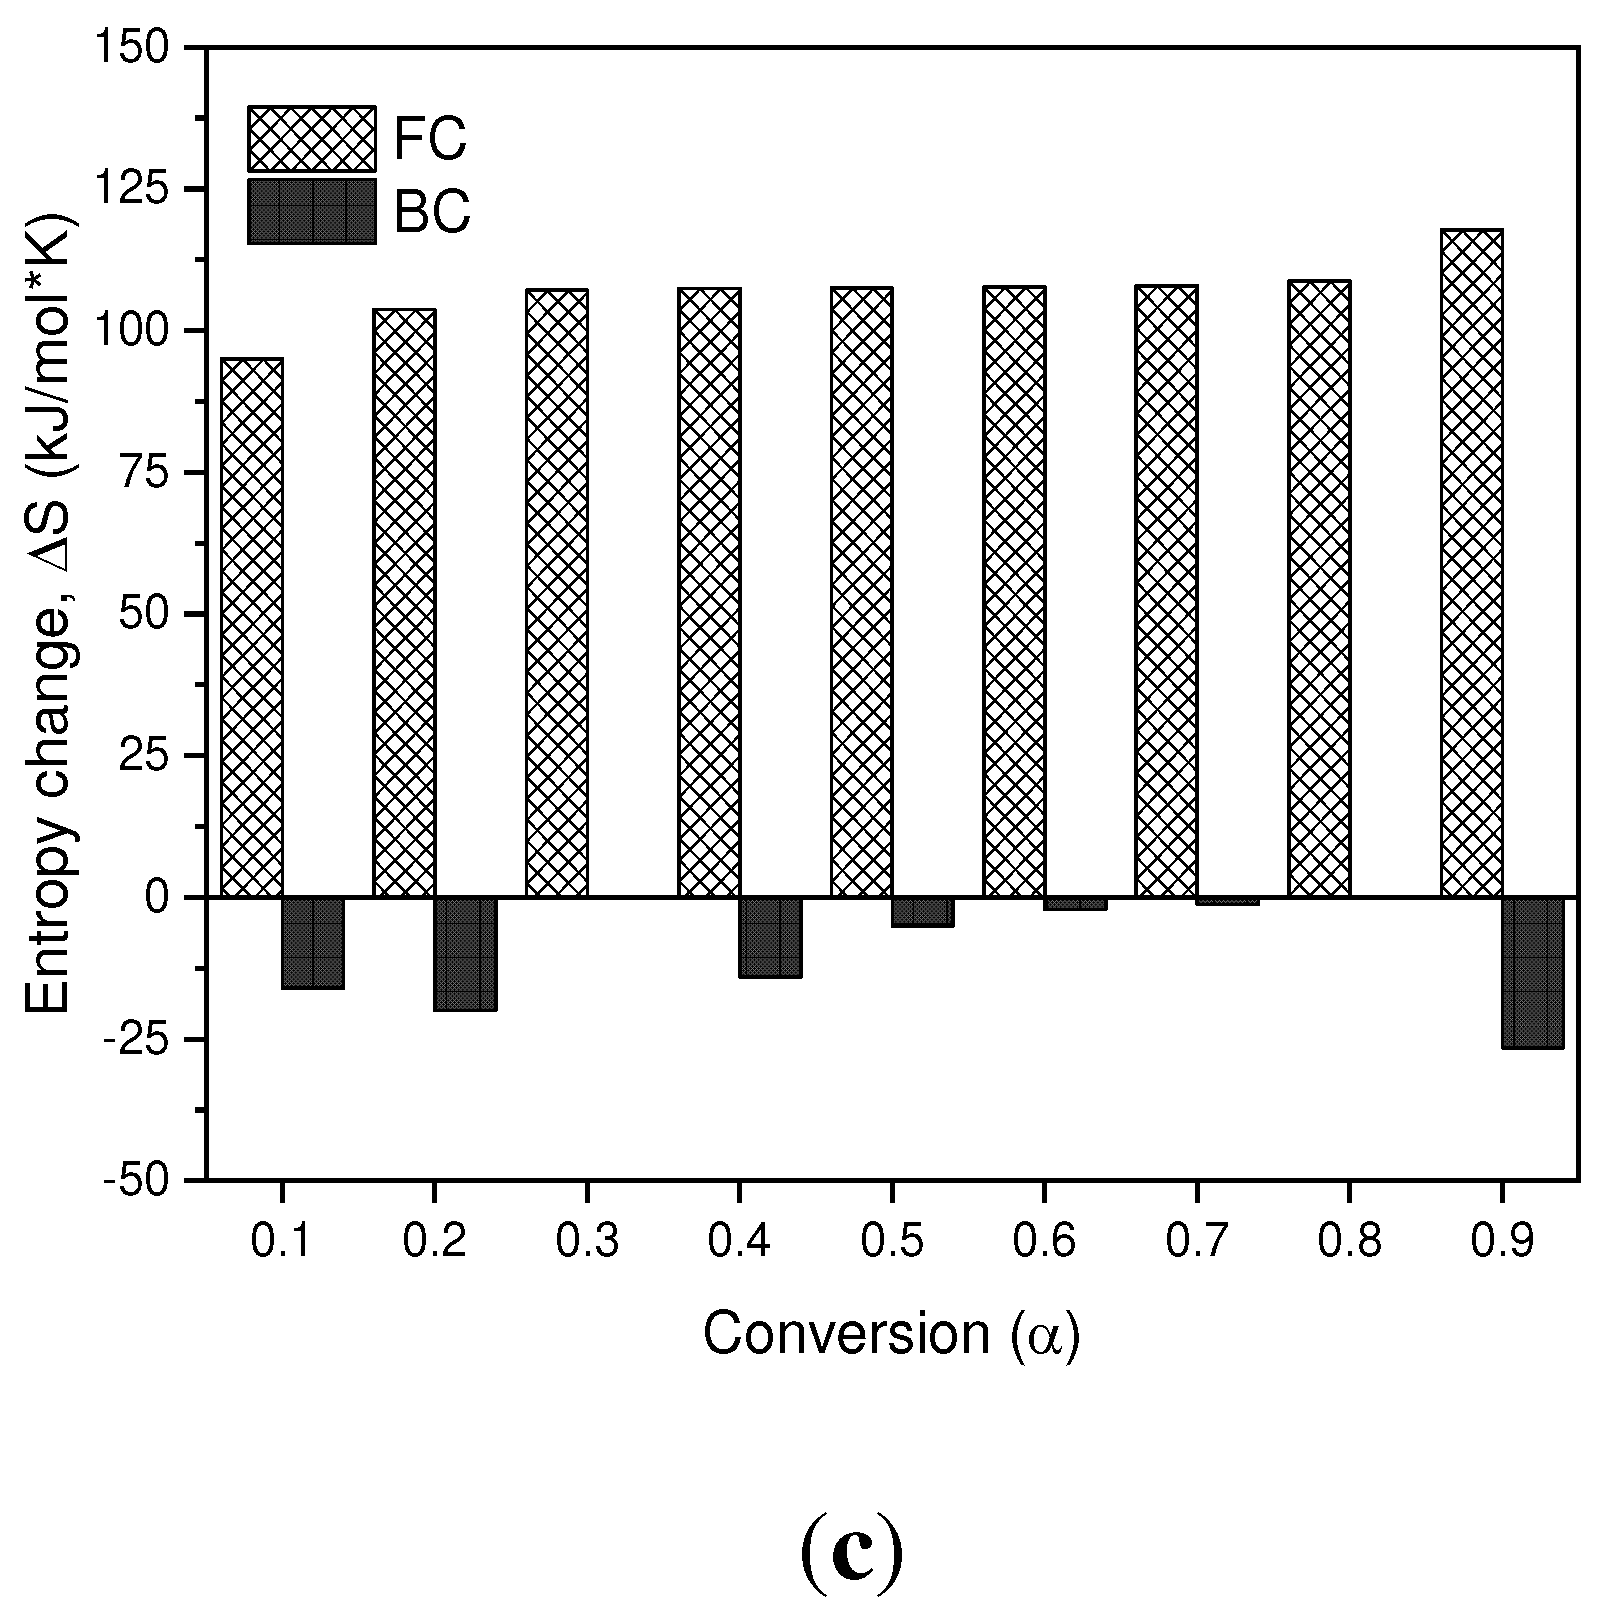
Thermodynamic parameters (TD) such as pre-exponential factor (K), enthalpy change (∆𝐻), Gibbs free energy (∆G) and entropy change (∆S) of the pyrolysis of BC and SCB were determined. according to the KAS model presented in
Figure 8a
–c. In terms of the values obtained for the enthalpy in the BC, it is observed that for conversion values of 0.1-0.9 they are positive values, which are related to the endothermic nature of the pyrolysis process. However, in the SCB the enthalpies are reduced in comparison with the BC by approximately 20%, due to the fact that the compounds absorbed during the tobacco combustion process require less energy to carry out phase changes and/or formation of products. In the case of a conversion of 0.3, a negative value is observed, which is related to exothermic processes, where the decomposition of low molecular weight compounds takes place.
In terms of the Gibbs free energy, the values obtained for the BC and SCB are positive values, which indicates that the reactions that are carried out are not spontaneous, since they require energy for the pyrolysis processes to take place. On average, the FC present a ∆𝐺 value of 143.85 kJ/mol, while the SCB present an average value of 117.59 kJ/mol, and are similar to those reported by [
30] where they found values for the changes of the Gibbs free energy (ΔG) between 122.63-175.43 kJ/mol in the pyrolysis of smoked cigarette butts.
Finally, the entropy values found for the BC are positive values for the entire conversion range, and cellulose acetate pyrolysis products can be associated as major components of the BC. On the other hand, for SCB negative values are obtained throughout the range of conversions, which is associated with the ordering of the char produced. Under these conversion ranges, it can be inferred that a thermal equilibrium is reached and a thermally stable char is produced, even when multiple reactions are carried out, such as devolatilization and decomposition results that can be found in processes of biomass pyrolysis [
40,
41,
42,
43].
3.5. Textural Analysis
According to the results obtained from the thermogravimetric analysis, a relationship was found with the results obtained in the horizontal furnace in terms of the yield of obtaining the char, with a yield of 29.64%. On the other hand, in terms of the activation process, a yield of 53.55% was obtained, results comparable to those obtained in other investigations [
31].
Taking into account the characteristics of the solid obtained from SCB (CA), the textural parameters were determined by nitrogen isotherms at -196 °C (See
Figure 9) of the CA obtained from SCB. However, in order to make a comparison of the textural characteristics, a commercial CA of vegetable origin from coconut shell was evaluated, which has been used in different adsorption processes from the aqueous phase [
41].
The isotherms obtained for the two CAs show to be Type I (b) according to the IUPAC classification [
42], which is related to porous materials that have a pore size distribution in the range of narrow micropores and mesopores (2.5 nm). Thus, BET surface area, micropore volume by Dubinin-Astakhov and total volume were determined at a P/P
0 of 0.95, the results obtained are shown in
Table 1.
The CA obtained from SCB have a surface area of 434 m2/g, while the Commercial CA has a larger area (783 m2/g), the results are related to the volumes of micropores obtained, where the larger the area the larger micropore volume obtained, in the case of SCB (434 m2/g, Vo = 0.33 cm3/g) and commercial CA (783 m2/g, Vo = 0.33 cm3/g). Likewise, considering the value of the C parameter of the BET equation, it shows a strong interaction between adsorbate and adsorbent.
On the contrary, the CA isotherm obtained from CBs shows a slope in the P/P
0 range of 0.1-0.8, which is related to a slight development of mesoporosity due to the effect of the activating agent KOH [
43], that is to say, for the CA obtained in this work, a higher percentage of mesoporosity (32%) was found in comparison to the commercial CA (3%), this behavior is in accordance with the activation mechanism with KOH in which at higher activation energy conditions, greater porosity is developed, in response to the gas production processes that occur from the material during its preparation [
44,
45,
46].
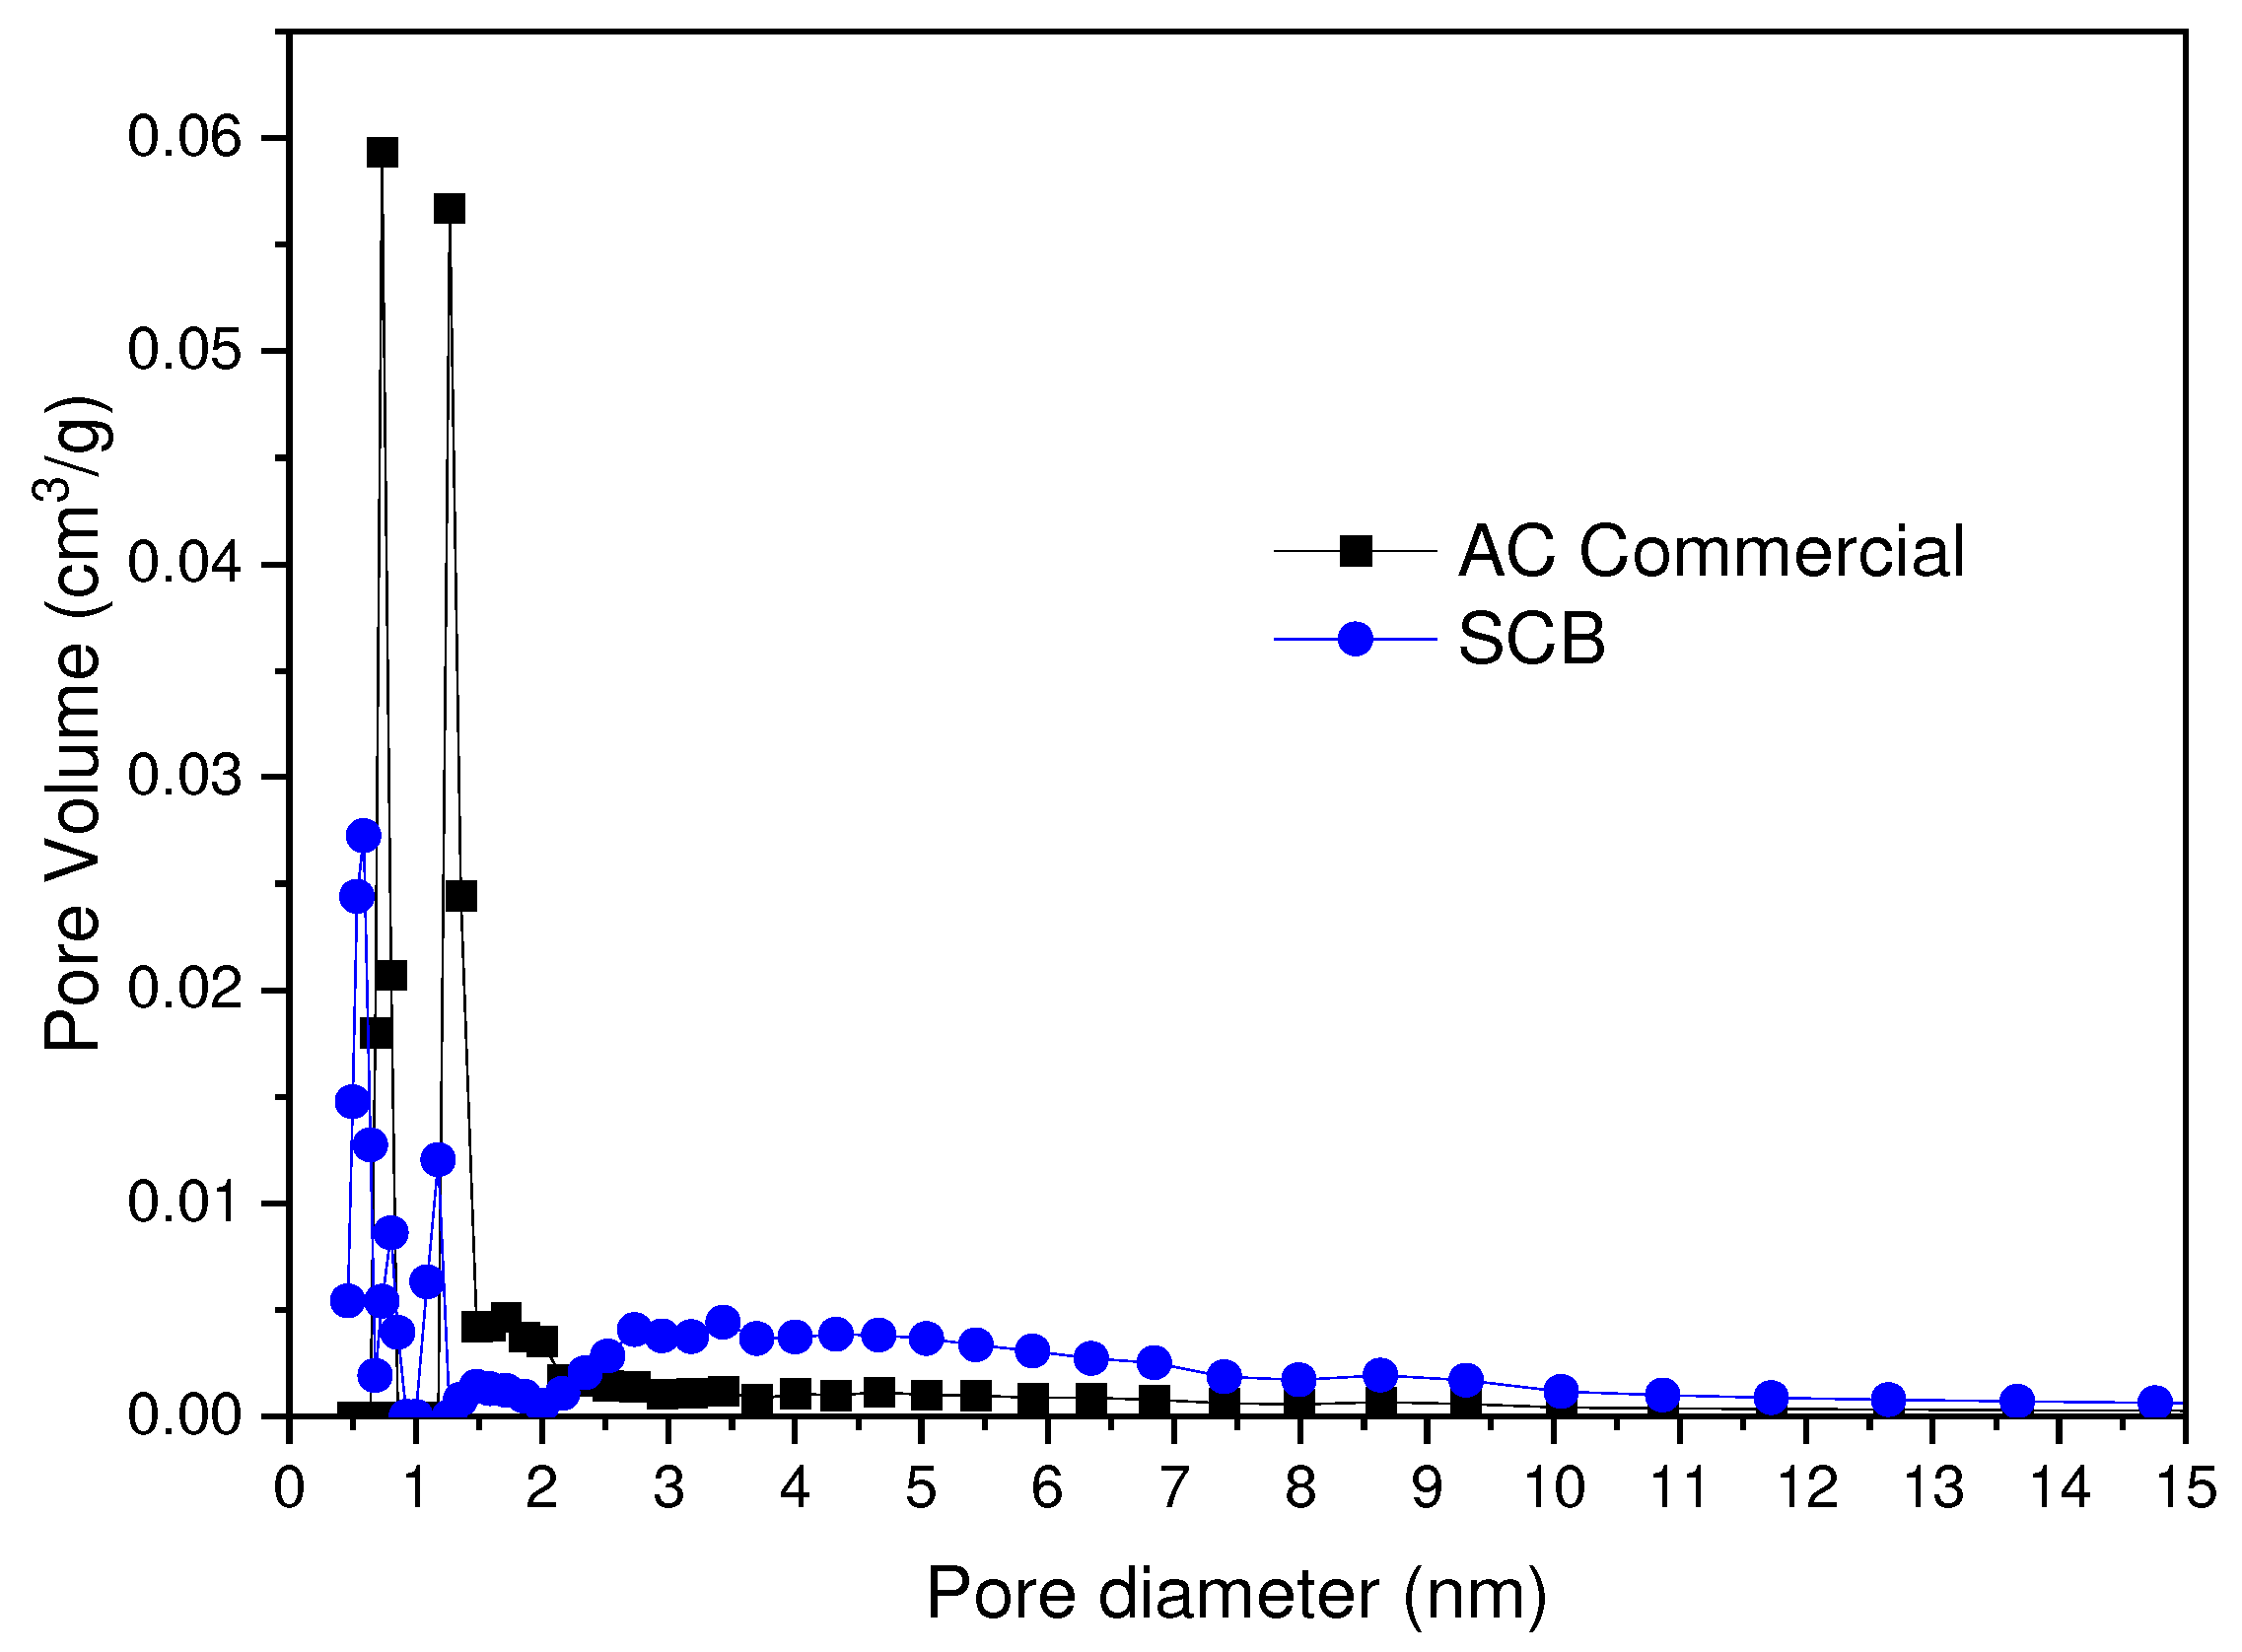
In
Figure 10 the pore size distribution obtained by the application of the DFT analysis is observed. In this case, it can be observed that the distribution in microporosity for the AC Commercial sample presents maximums for 0.7 and 1.2 nm, while for the AC SCB 0.6, 0.8, 1.7 nm. On the other hand, in terms of mesoporosity, a greater homogeneity is found for the AC Commercial sample 2-6 nm, while the AC SCB sample presents a broader distribution in a range of 2-8 nm.
3.6. Chromium(VI) Adsorption from Aqueous Solution
3.6.1. Cr(VI) Adsorption Kinetics
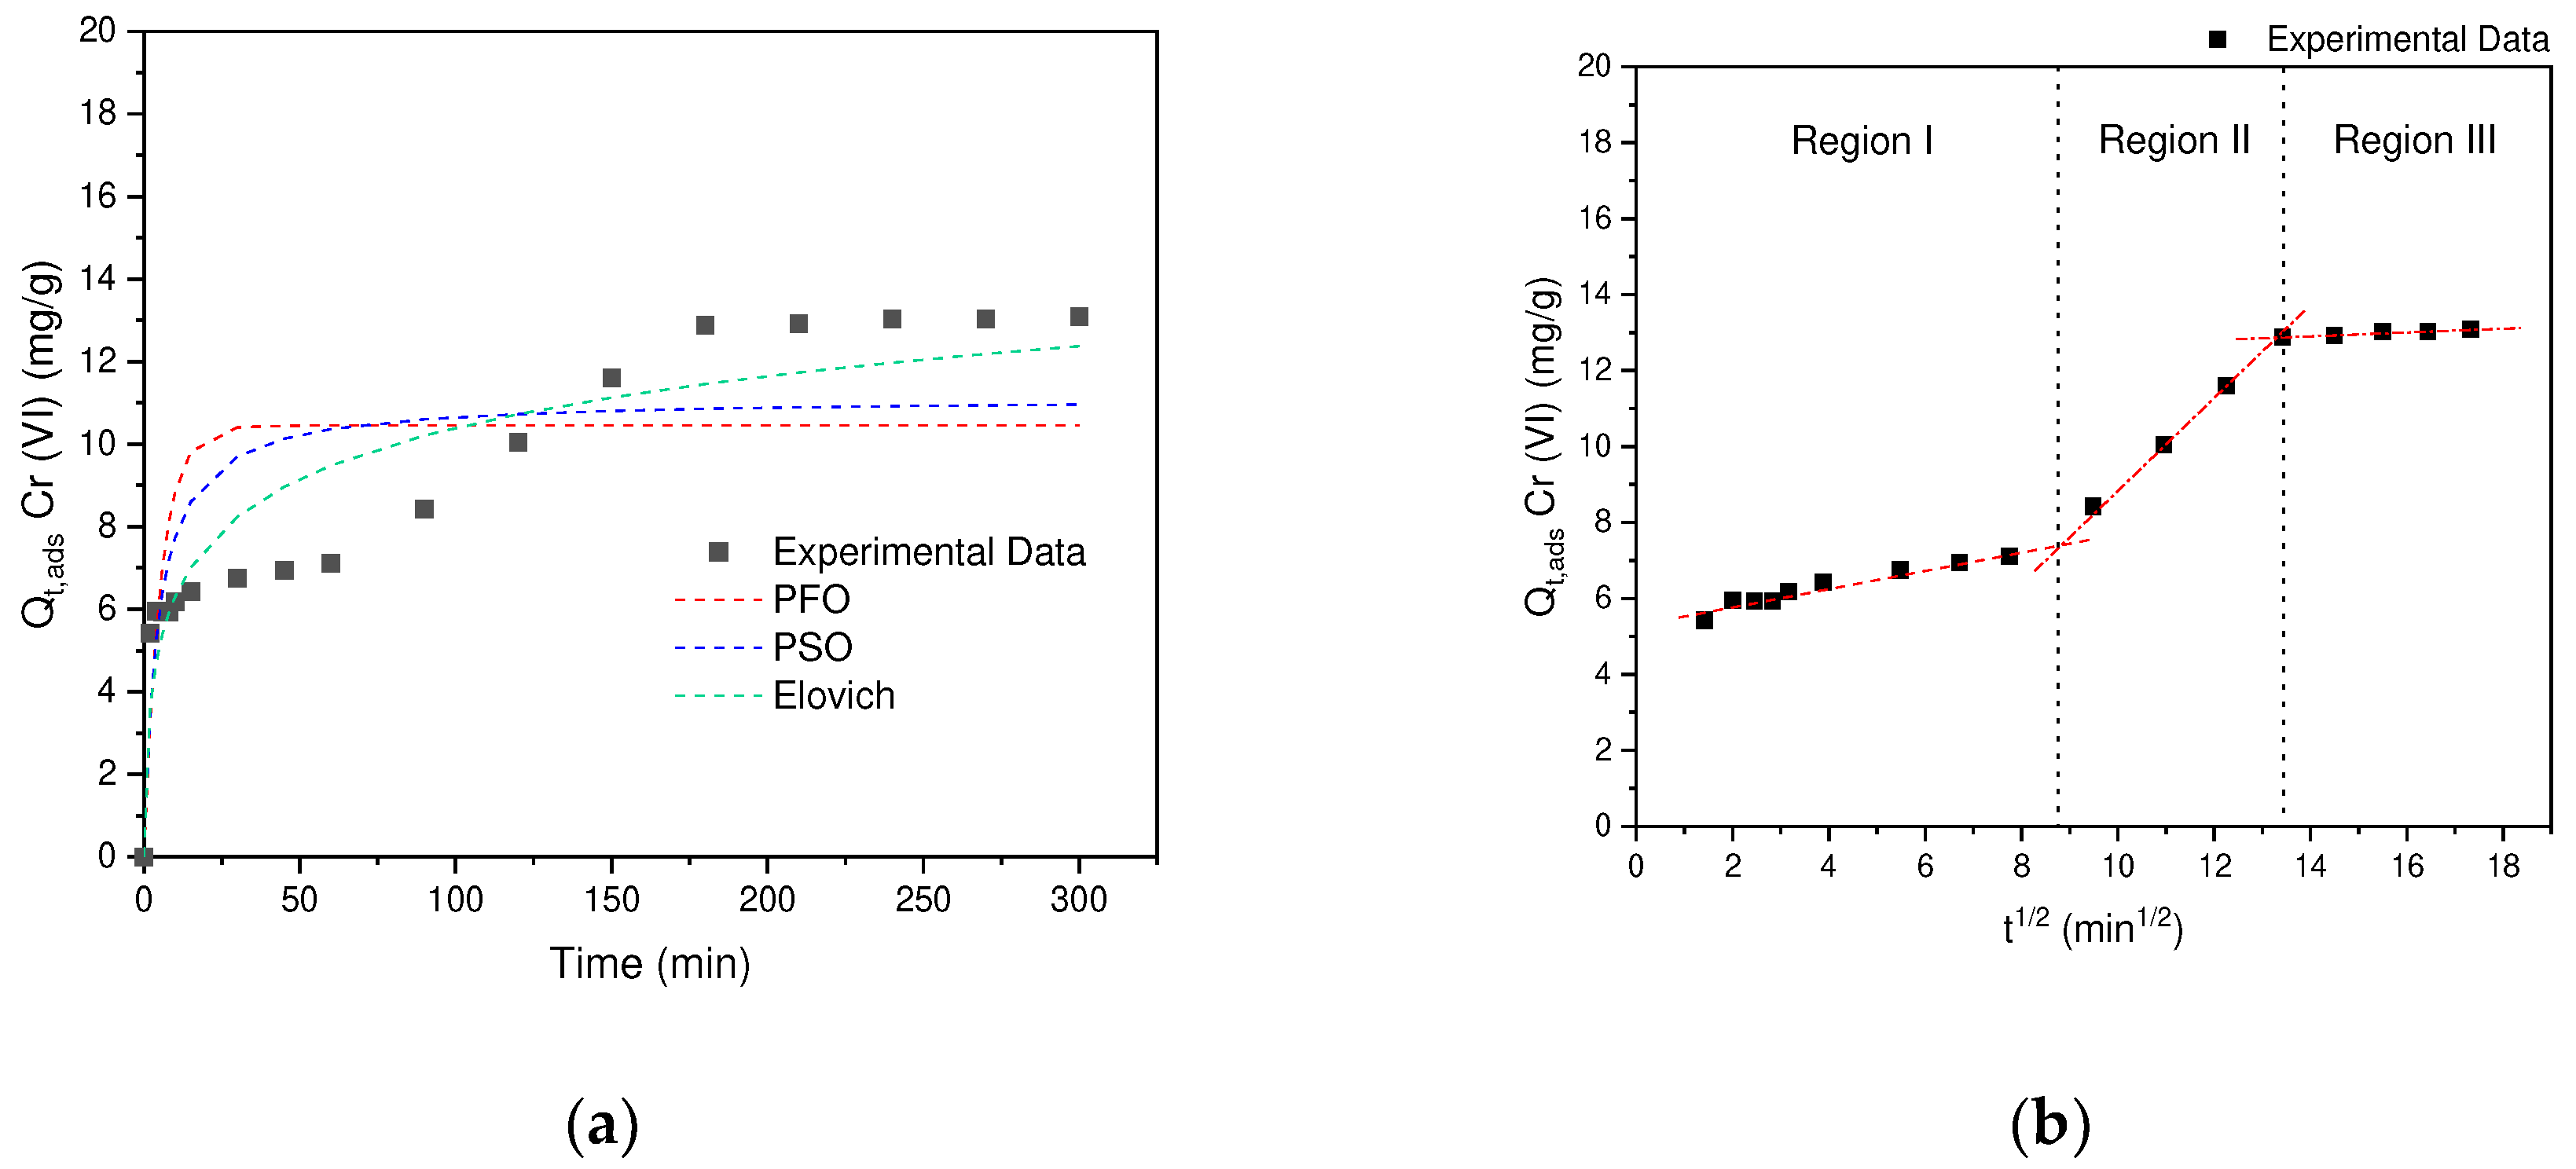
The kinetics of Cr (VI) adsorption was determined in order to analyze the efficiency of the AC obtained from SCB, for this different non-linear kinetic models were adjusted such as: pseudo first order (PFO), pseudo second order (PSO) and Elovich See
Figure 11a. According to the assumptions of each model, the PFO model assumes that the adsorption is controlled by the diffusion of the adsorbate that forms a monolayer through the boundary diffusion [
45]. In the case of PSO, the assumption is related to an adsorption that presents chemical interactions (transfer or sharing of electrons) between the adsorbate and adsorbent [
46]. Finally, the Elovich model assumes that the adsorbent sites are heterogeneous, so that different activation energies are obtained [
47].
According to the results obtained, it can be seen in
Table 2 that the models that describe the behavior of the kinetic data correspond to: PFO(R
2=0.5621) <PSO (R
2=0.7013) <Elovich (R
2=0.8832). From the results obtained in
Figure 11a, it can be distinguished that several processes are carried out. During the first 60 minutes the behavior is associated with mass transfer phenomenum from the solution, where external diffusion occurs, once these interactions are completed, a second stage begins in an interval between 60-170 min, where the adsorbate is transferred to the AC porosity (Internal Diffusion). Finally, in the last segment >120 min, equilibrium is reached, where the last interactions between the internal surface and the adsorbate occur. This behavior obtained in this investigation is similar to that reported in the removal of hexavalent chromium by polyethyleneimine impregnated activated carbon [
48].
According to the results obtained by the Elovich model, the experimental kinetic data fit the intra-particle diffusion model. According to
Figure 11b, the existence of three regions can be confirmed, for which the speed corresponding to each region was determined, finding that region II is the one that presents the greatest contribution 1.14, followed by region I 0.24 and finally region III with 0.05 (
Table 2). That is, the external diffusion of Cr (VI) in the adsorbent is carried out slowly, once the external diffusion is overcome, the speed increases by 4.75 in region II, since the diffusion process begins in the porosity. and, finally, it gives the adsorption in the superficial groups (active sites), this process reaches the equilibrium of adsorption in a period of 200 minutes [
49].
3.6.2. Cr(VI) Adsorption Isotherms
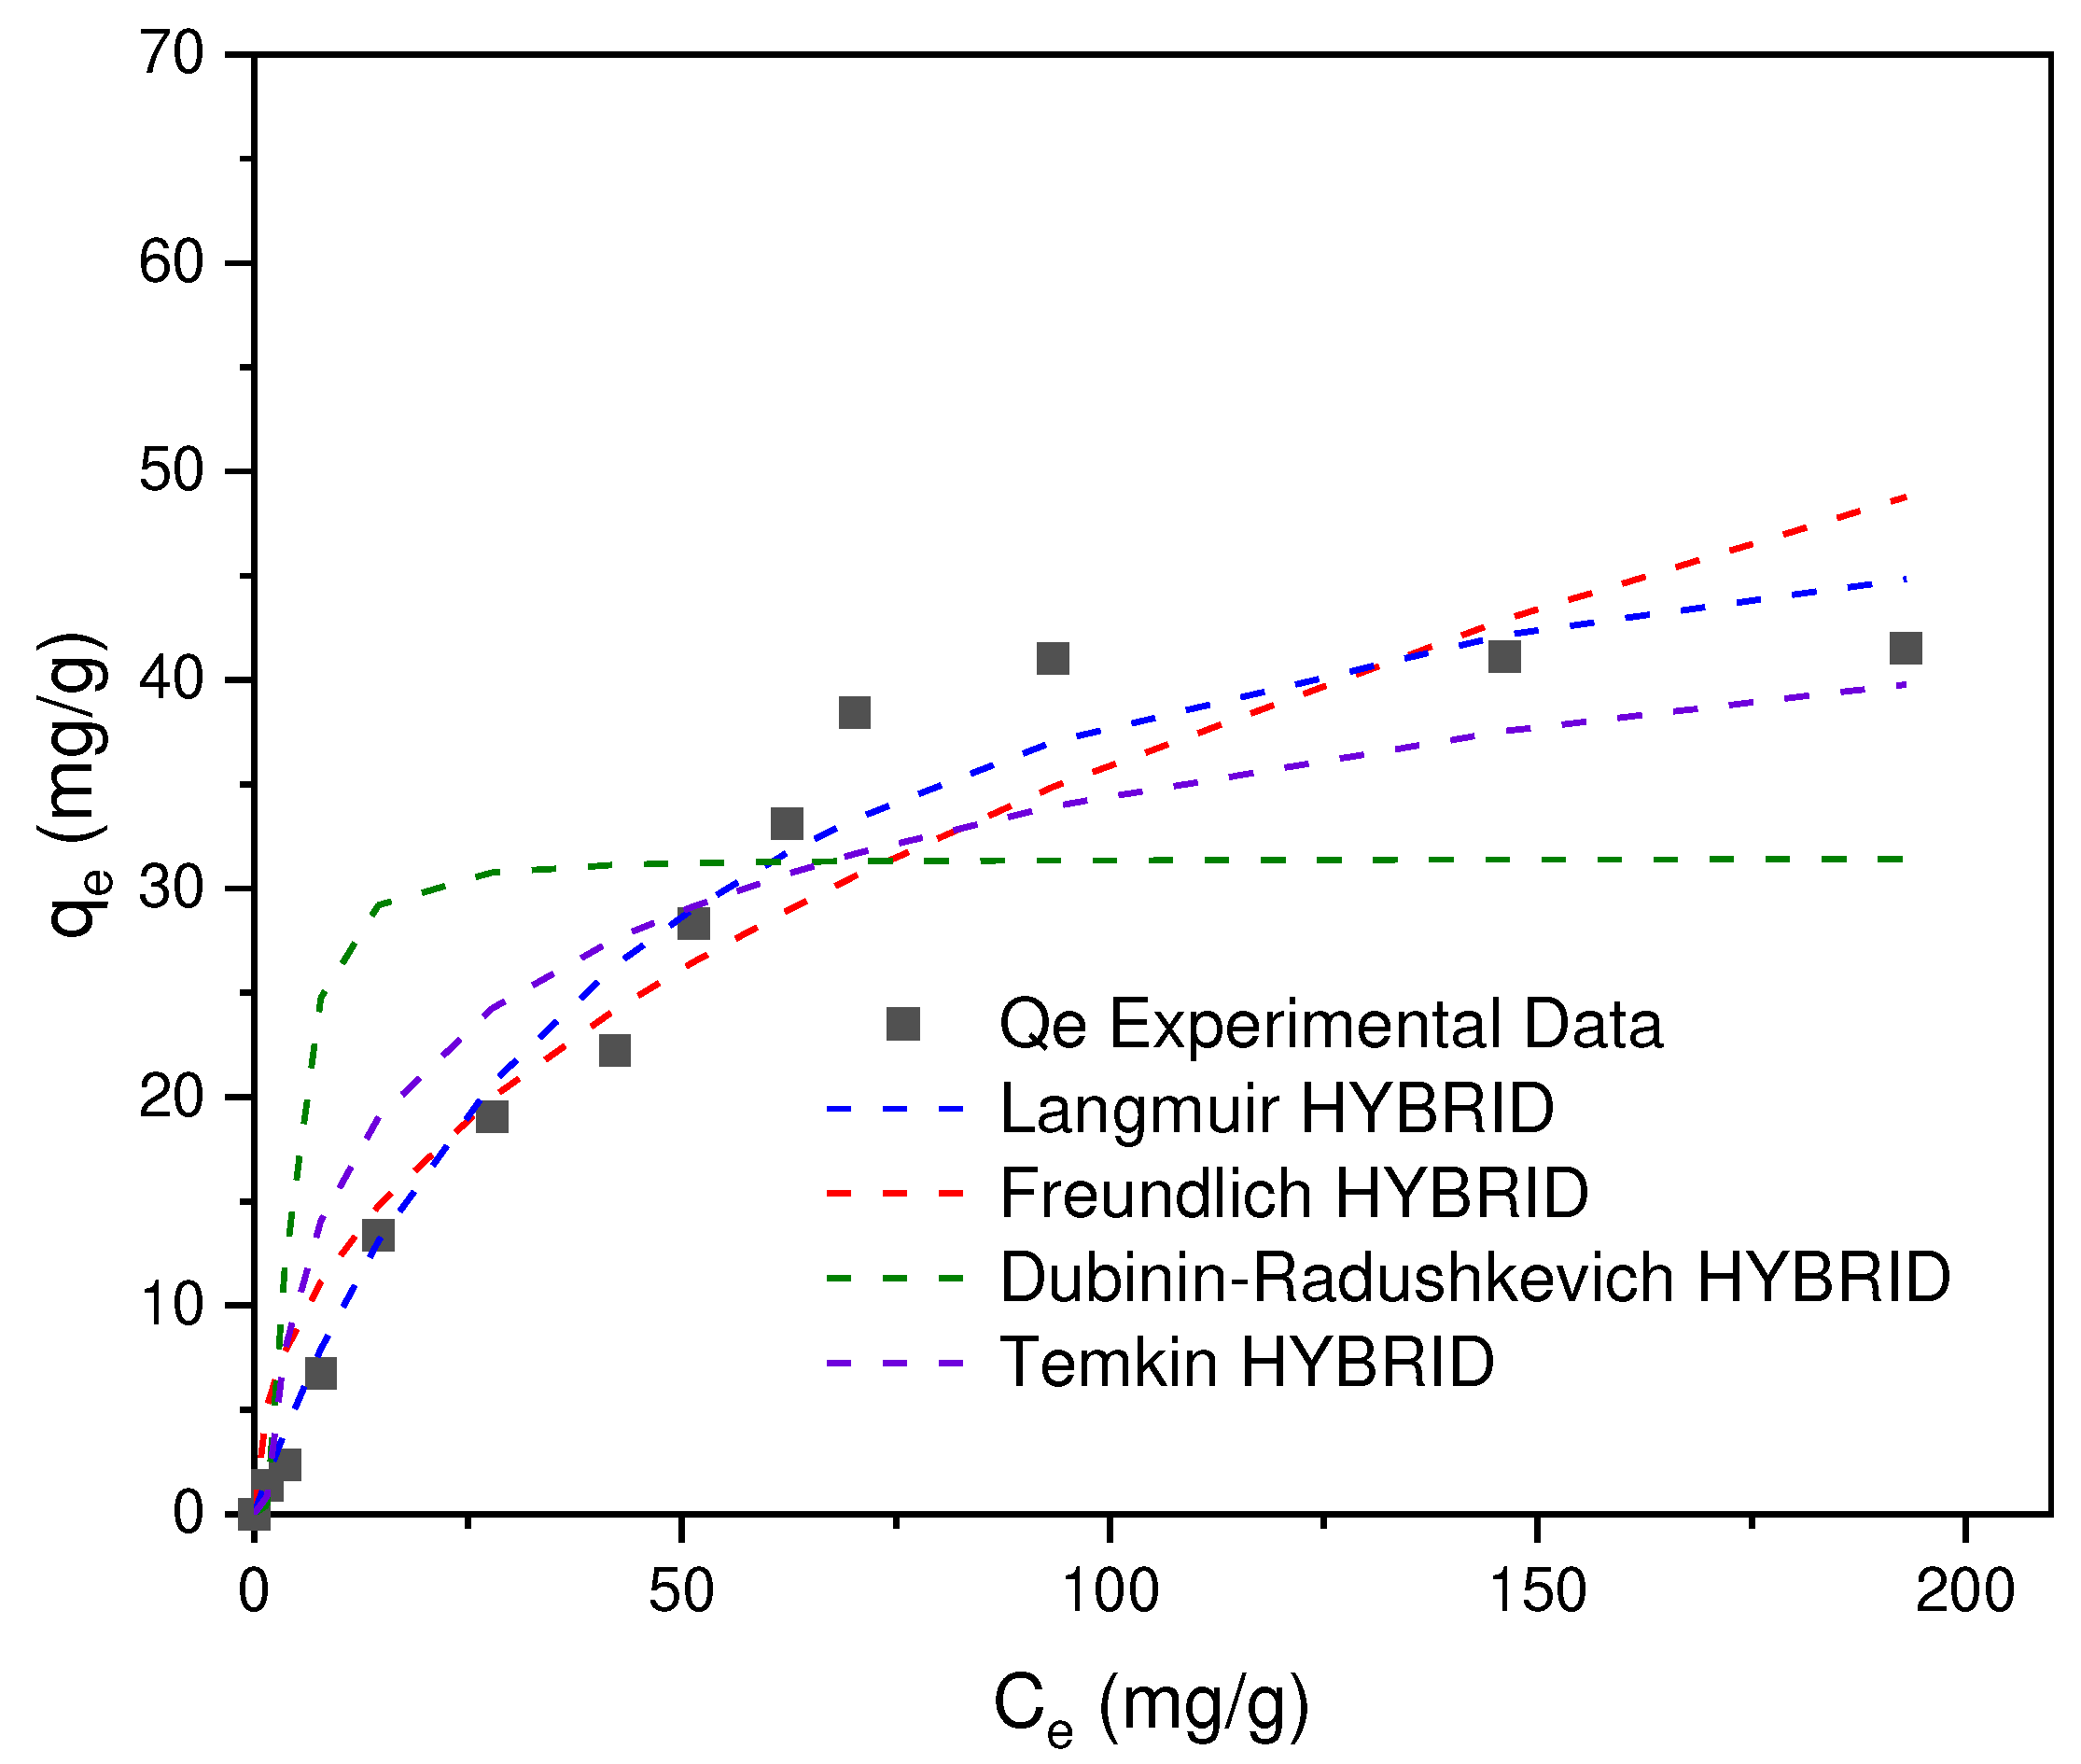
In
Figure 12 the Cr (VI) adsorption isotherms are presented, which were adjusted to the Langmuir, Freundlich, Dubinin-Raduskevich and Temkin models. The theoretical and experimental data obtained were adjusted to different error functions (SSE, MPSD, EABS, ARE, R
2 and HYBRID), the results shown correspond to the best error adjustment consistent with the HYBRID model, where the minimum error was obtained [
50]. In this way, it was determined that the best fit to the experimental data corresponds to the Langmuir model with R
2 = 0.9719 (See
Table 3), in which it is assumed (I) that the adsorption process occurs due to the formation of a homogeneous monolayer, (II) there is no interaction between adjacent adsorbed ions and (III) the adsorption sites are limited.
Taking into account the constant KL, the separation factor, RL, was determined in order to determine the characteristics of the adsorption process where yes, RL>1 (unfavorable adsorption), RL=1 (linear isotherm), 1> RL>0 (favorable adsorption), RL=0 (irreversible adsorption), the values obtained from RL for the concentrations of 5, 50, 100, 150, 300 ppm correspond to 0.9, 0.5, 0.3, 0.2 and 0.1 (nondimensional) respectively, which allows to infer that the Cr (VI) adsorption process is favorable in the CA prepared from SCB.
A comparison is made between the different adsorbates that have been of interest in the last 5 years using SCB as a precursor to obtain CA. It is important to highlight that the material obtained has a wide versatility in removing different contaminants. both organic and inorganic, their adsorption capacity will depend on the CA preparation process, which results in different textural characteristics and surface chemistry that leads to different adsorption mechanisms, which may be selective according to the application (See
Table 4).
Finally, a comparison is made between different carbonaceous materials that have been used in the removal of Cr (VI) during the last years (5), finding that the adsorption capacities of this adsorptive depend on the precursor used and the method of preparation of the CA. It can be seen that the results shown in
Table 5 use residues that are commonly found in their region, which allows for high availability of the precursor. However, SCBs are a common residue which continues to be an environmental problem, this is how added value is given to this residue, allowing it to be used in the removal of Cr (VI), which is used in alloys, pigments and preservatives for wood.
4. Conclusions
In this work, AC were obtained from SCB through a pyrolysis process and subsequent activation with KOH, thus obtaining a specific surface area of 434 m2/g, which allows this material to be used as an adsorbent for different adsorbates, in this particular case, its adsorption capacity was used to remove Cr (VI), obtaining a Qmax (Langmuir) capacity of 55.8 mg/g.
On the other hand, the kinetics of adsorption determined that the adsorption mechanism occurs in three steps, which involves external diffusion, internal diffusion and ends with the interactions of the adsorptive (Cr (VI)) with the active sites of the CA. In parallel, the result can be corroborated with the adjustment of the adsorption isotherm, in which the model that was adjusted with R2=0.9719 was the Langmuir model, allowing to correlate the assumptions with the results obtained.
Additionally, the textural parameters presented by the CA sample allow us to argue the importance not only of microporosity, but also the influence of mesoporosity on internal diffusion processes.
Finally, understanding the thermodynamics of the pyrolysis process means understanding how the char is formed, the comparison made in this study allows to highlight the importance of the products that are absorbed in the SCB, since they contribute to the formation of the adsorbent material, being endothermic processes, non-spontaneous, and that it presents multiple mechanisms in the kinetics of pyrolysis. In this way, the AC obtained from SCB is a material that allows solving two problem situations: (1) use of waste from the city of Bogotá, to which an added value is given (adsorbent) and (2) removal of a contaminant such as Cr (VI) which is commonly used in areas surrounding the city in tanning processes, impacting the environment.
Author Contributions
C.H.: Methodology, Conceptualization, Data curation, Investigation. S. S.: Methodology, Conceptualization, Data curation, Investigation. D.G.: Writing-review & editing, supervision. D.C.: Conceptualization, Writing-review & editing. L.T.: Conceptualization, Writing-review & editing, data curation. J.C.: Writing-review & editing, resources, formal analysis, methodology. Y.M.: Writing – original draft, Conceptualization, Investigation, Methodology, Data curation, supervision, Formal analysis. All authors have read and agreed to the published version of the manuscript.
Acknowledgments
Professor Juan Carlos Moreno-Piraján also thanks for the grant to the Facultad de Ciencias of Universidad de los Andes, number INV-2023-162-2735. Physchemath Research Group also thanks for the grant to the Universidad de America, number IHU-004-2021 and IHU-007-2022.
Conflicts of Interest
The authors declare no conflict of interest.
References
- Bonanomi, G.; Maisto, G.; De Marco, A.; Cesarano, G.; Zotti, M.; Mazzei, P.; Libralato, G.; Staropoli, A.; Siciliano, A.; De Filippis, F.; et al. The Fate of Cigarette Butts in Different Environments: Decay Rate, Chemical Changes and Ecotoxicity Revealed by a 5-Years Decomposition Experiment. Environ. Pollut. 2020, 261, 114108. [Google Scholar] [CrossRef] [PubMed]
- BBC News Mundo. Tabaquismo: por qué el número de fumadores en el mundo ha llegado a un nuevo récord (y qué pasa en América Latina). Available online: https://www.bbc.com/mundo/noticias-57290659 (accessed on 29 julio 2023).
- Semana. Buscan poner en cintura las colillas de cigarrillo en Colombia. Available online: https://www.semana.com/impacto/articulo/buscan-poner-en-cintura-las-colillas-de-cigarrillo-en-colombia/53139/ (accessed on 29 julio 2023).
- Manrique Pinzón, J.S.; Eslava Moyano, I.D.; Pascual Chaparro, J. Uso integral de colillas de cigarrillo con fines ambientales y comerciales. Proyecto piloto en la facultad del medio ambiente de la Universidad Distrital Francisco José de Caldas. Boletín Semillas Ambientales. 2017, 11, 72–79. [Google Scholar]
- Van Gucht, D.; Van den Bergh, O.; Beckers, T.; Vansteenwegen, D. Smoking Behavior in Context: Where and When Do People Smoke? J. Behav. Ther. Exp. Psychiatry. 2010, 41, 172–177. [Google Scholar] [CrossRef] [PubMed]
- Dobaradaran, S.; Soleimani, F.; Akhbarizadeh, R.; Schmidt, T.C.; Marzban, M.; BasirianJahromi, R. Environmental Fate of Cigarette Butts and Their Toxicity in Aquatic Organisms: A Comprehensive Systematic Review. Environ. Res. 2021, 195, 110881. [Google Scholar] [CrossRef] [PubMed]
- Kurmus, H.; Mohajerani, A. The Toxicity and Valorization Options of Cigarette Butts. Waste Manag. 2020, 104, 104–118. [Google Scholar] [CrossRef]
- Mohajerani, A.; Kadir, A.A.; Larobina, L. A Practical Proposal for Solving the World’s Cigarette Butt Problem: Recycling in Fired Clay Bricks. Waste Manag. 2016, 52, 228–244. [Google Scholar] [CrossRef]
- de Granda-Orive, J.I.; Girón-Matute, W.; López-Yepes, L. Cigarette Butts: The Collateral Effects of Cigarettes on Humans, Animals and the Environment. Arch. Bronconeumol. 2016, 52, 285. [Google Scholar] [CrossRef]
- Dobaradaran, S.; Schmidt, T.C.; Lorenzo-Parodi, N.; Kaziur-Cegla, W.; Jochmann, M.A.; Nabipour, I.; Lutze, H.V.; Telgheder, U. Polycyclic Aromatic Hydrocarbons (PAHs) Leachates from Cigarette Butts into Water. Environ. Pollut. 2020, 259, 113916. [Google Scholar] [CrossRef] [PubMed]
- Green, D.S.; Tongue, A.D.W.; Boots, B. The Ecological Impacts of Discarded Cigarette Butts. Trends Ecol. Evol. 2022, 37, 183–192. [Google Scholar] [CrossRef]
- Mohajerani, A.; Tanriverdi, Y.; Nguyen, B.T.; Wong, K.K.; Dissanayake, H.N.; Johnson, L.; Whitfield, D.; Thomson, G.; Alqattan, E.; Rezaei, A. Physico-Mechanical Properties of Asphalt Concrete Incorporated with Encapsulated Cigarette Butts. Constr. Build. Mater. 2017, 153, 69–80. [Google Scholar] [CrossRef]
- d’Heni Teixeira, M.B.; Duarte, M.A.B.; Raposo Garcez, L.; Camargo Rubim, J.; Hofmann Gatti, T.; Suarez, P.A.Z. Process Development for Cigarette Butts Recycling into Cellulose Pulp. Waste Manag. 2017, 60, 140–150. [Google Scholar] [CrossRef] [PubMed]
- Lucatero, L.M.B.; Ortega, D.T.; Pandiyan, T.; Singh, N.; Singh, H.; Sarao, T.P.S. Corrosion Inhibition Studies of Cigarette Waste on the Iron Surface in Acid Medium: Electrochemical and Surface Morphology Analysis. Anti-Corros. Methods Mater. 2016, 63, 245–255. [Google Scholar] [CrossRef]
- Yu, C.; Hou, H.; Liu, X.; Han, L.; Yao, Y.; Dai, Z.; Li, D. The recovery of the waste cigarette butts for N-doped carbon anode in lithium ion battery. Front. Mater. 2018, 5. [Google Scholar] [CrossRef]
- Medellín-Castillo, N.A.; Ocampo-Pérez, R.; Forgionny, A.; Labrada-Delgado, G.J.; Zárate-Guzmán, A.I.; Cruz-Briano, S.A.; Flores-Ramírez, R. Insights into Equilibrium and Adsorption Rate of Phenol on Activated Carbon Pellets Derived from Cigarette Butts. Processes (Basel). 2021, 9, 934. [Google Scholar] [CrossRef]
- Pu, D.; Kou, Y.; Zhang, L.; Liu, B.; Zhu, W.; Zhu, L.; Duan, T. Waste Cigarette Filters: Activated Carbon as a Novel Sorbent for Uranium Removal. J. Radioanal. Nucl. Chem. 2019, 320, 725–731. [Google Scholar] [CrossRef]
- Zhang, X.; Yu, M.; Li, Y.; Cheng, F.; Liu, Y.; Gao, M.; Liu, G.; Hu, L.; Liang, Y. Effectiveness of Discarded Cigarette Butts Derived Carbonaceous Adsorbent for Heavy Metals Removal from Water. Microchem. J. 2021, 168, 106474. [Google Scholar] [CrossRef]
- Pallarés, J.; González-Cencerrado, A.; Arauzo, I. Production and Characterization of Activated Carbon from Barley Straw by Physical Activation with Carbon Dioxide and Steam. Biomass Bioenergy. 2018, 115, 64–73. [Google Scholar] [CrossRef]
- Balali-Mood, M.; Naseri, K.; Tahergorabi, Z.; Khazdair, M.R.; Sadeghi, M. Toxic mechanisms of five heavy metals: Mercury, lead, chromium, cadmium, and arsenic. Front. Pharmacol. 2021, 12. [Google Scholar] [CrossRef] [PubMed]
- Wu, X.; Cobbina, S.J.; Mao, G.; Xu, H.; Zhang, Z.; Yang, L. A Review of Toxicity and Mechanisms of Individual and Mixtures of Heavy Metals in the Environment. Environ. Sci. Pollut. Res. Int. 2016, 23, 8244–8259. [Google Scholar] [CrossRef] [PubMed]
- Keyvani, F.; Rahpeima, S.; Javanbakht, V. Synthesis of EDTA-Modified Magnetic Activated Carbon Nanocomposite for Removal of Permanganate from Aqueous Solutions. Solid State Sci. 2018, 83, 31–42. [Google Scholar] [CrossRef]
- Hu, Y.; Chen, X.; Liu, Z.; Wang, G.; Liao, S. Activated Carbon Doped with Biogenic Manganese Oxides for the Removal of Indigo Carmine. J. Environ. Manage. 2016, 166, 512–518. [Google Scholar] [CrossRef] [PubMed]
- Alengebawy, A.; Abdelkhalek, S.T.; Qureshi, S.R.; Wang, M.-Q. Heavy Metals and Pesticides Toxicity in Agricultural Soil and Plants: Ecological Risks and Human Health Implications. Toxics. 2021, 9, 42. [Google Scholar] [CrossRef] [PubMed]
- Green, A.J.; Planchart, A. The Neurological Toxicity of Heavy Metals: A Fish Perspective. Comp. Biochem. Physiol. C. Toxicol. Pharmacol. 2018, 208, 12–19. [Google Scholar] [CrossRef] [PubMed]
- Louarrat, M. Removal of Chromium Cr(vi) of Tanning Effluent with Activated Carbon from Tannery Solid Wastes. Am. J. Phys. Chem. 2017, 6, 103. [Google Scholar] [CrossRef]
- Yang, J.; Yu, M.; Chen, W. Adsorption of Hexavalent Chromium from Aqueous Solution by Activated Carbon Prepared from Longan Seed: Kinetics, Equilibrium and Thermodynamics. J. Ind. Eng. Chem. 2015, 21, 414–422. [Google Scholar] [CrossRef]
- Panigrahi, T.; Santhoskumar, A.U. Adsorption Process for Reducing Heavy Metals in Textile Industrial Effluent with Low Cost Adsorbents. Prog. Chem. Biochem. Res. 2020, 3, 135–139. [Google Scholar] [CrossRef]
- Yuan, W.; Yang, N.; Li, X. Advances in Understanding How Heavy Metal Pollution Triggers Gastric Cancer. Biomed Res. Int. 2016, 1–10. [Google Scholar] [CrossRef]
- Alves, J.L.F.; da Silva, J.C.G.; Mumbach, G.D.; da Silva Filho, V.F.; Di Domenico, M.; de Sena, R.F.; Bolzan, A.; Machado, R.A.F.; Marangoni, C. Thermo-Kinetic Investigation of the Multi-Step Pyrolysis of Smoked Cigarette Butts towards Its Energy Recovery Potential. Biomass Convers. Biorefin. 2022, 12, 741–755. [Google Scholar] [CrossRef]
- Zhang, X.; Xu, J.; Lv, Z.; Wang, Q.; Ge, H.; Wang, X.; Hong, B. Preparation and Utilization of Cigarette Filters Based Activated Carbon for Removal CIP and SDS from Aqueous Solutions. Chem. Phys. Lett. 2020, 747, 137343. [Google Scholar] [CrossRef]
- Enniya, I.; Rghioui, L.; Jourani, A. Adsorption of Hexavalent Chromium in Aqueous Solution on Activated Carbon Prepared from Apple Peels. Sustain. Chem. Pharm. 2018, 7, 9–16. [Google Scholar] [CrossRef]
- Galiwango, E.; Abdel Rahman, N.S.; Al-Marzouqi, A.H.; Abu-Omar, M.M.; Khaleel, A.A. Isolation and Characterization of Cellulose and α-Cellulose from Date Palm Biomass Waste. Heliyon. 2019, 5, e02937. [Google Scholar] [CrossRef] [PubMed]
- Jaffar, M.M.; Nahil, M.A.; Williams, P.T. Pyrolysis-Catalytic Hydrogenation of Cellulose-Hemicellulose-Lignin and Biomass Agricultural Wastes for Synthetic Natural Gas Production. J. Anal. Appl. Pyrolysis 2020, 145, 104753. [Google Scholar] [CrossRef]
- Barzegar, R.; Yozgatligil, A.; Olgun, H.; Atimtay, A.T. TGA and Kinetic Study of Different Torrefaction Conditions of Wood Biomass under Air and Oxy-Fuel Combustion Atmospheres. J. Energy Inst. 2020, 93, 889–898. [Google Scholar] [CrossRef]
- Tannous, J.; Salem, T.; Omikrine Metalssi, O.; Marceau, S.; Fen-Chong, T. Study of the Effects of Incorporating Depolluted Cellulose Acetate in Mortars, with and without Superplasticizer, in View of Recycling Cigarette Butt Waste. Constr. Build. Mater. 2022, 346, 128492. [Google Scholar] [CrossRef]
- Haussmann, H.-J. Use of Hazard Indices for a Theoretical Evaluation of Cigarette Smoke Composition. Chem. Res. Toxicol. 2012, 25, 794–810. [Google Scholar] [CrossRef] [PubMed]
- Calabuig, E.; Juárez-Serrano, N.; Marcilla, A. TG-FTIR Study of Evolved Gas in the Decomposition of Different Types of Tobacco. Effect of the Addition of SBA-15. Thermochim. Acta. 2019, 671, 209–219. [Google Scholar] [CrossRef]
- Liang, Y.; Ries, M.E.; Hine, P.J. Pyrolysis Activation Energy of Cellulosic Fibres Investigated by a Method Derived from the First Order Global Model. Carbohydr. Polym. 2023, 305, 120518. [Google Scholar] [CrossRef]
- Mehmood, M.A.; Ahmad, M.S.; Liu, Q.; Liu, C.-G.; Tahir, M.H.; Aloqbi, A.A.; Tarbiah, N.I.; Alsufiani, H.M.; Gull, M. Helianthus Tuberosus as a Promising Feedstock for Bioenergy and Chemicals Appraised through Pyrolysis, Kinetics, and TG-FTIR-MS Based Study. Energy Convers. Manag. 2019, 194, 37–45. [Google Scholar] [CrossRef]
- Bernal, V.; Erto, A.; Giraldo, L.; Moreno-Piraján, J. Effect of Solution pH on the Adsorption of Paracetamol on Chemically Modified Activated Carbons. Molecules 2017, 22, 1032. [Google Scholar] [CrossRef]
- Thommes, M.; Kaneko, K.; Neimark, A.V.; Olivier, J.P.; Rodriguez-Reinoso, F.; Rouquerol, J.; Sing, K.S.W. Physisorption of Gases, with Special Reference to the Evaluation of Surface Area and Pore Size Distribution (IUPAC Technical Report). Pure Appl. Chem. 2015, 87, 1051–1069. [Google Scholar] [CrossRef]
- Muniandy, L.; Adam, F.; Mohamed, A.R.; Ng, E.-P. The Synthesis and Characterization of High Purity Mixed Microporous/Mesoporous Activated Carbon from Rice Husk Using Chemical Activation with NaOH and KOH. Microporous Mesoporous Mater. 2014, 197, 316–323. [Google Scholar] [CrossRef]
- Lillo-Ródenas, M.A.; Cazorla-Amorós, D.; Linares-Solano, A. Understanding Chemical Reactions between Carbons and NaOH and KOH. Carbon N. Y. 2003, 41, 267–275. [Google Scholar] [CrossRef]
- Mahmoud, M.E.; Osman, M.M.; Abdel-Aal, H.; Nabil, G.M. Microwave-Assisted Adsorption of Cr(VI), Cd(II) and Pb(II) in Presence of Magnetic Graphene Oxide-Covalently Functionalized-Tryptophan Nanocomposite. J. Alloys Compd. 2020, 823, 153855. [Google Scholar] [CrossRef]
- Mashhadimoslem, H.; Jafari, M.; Khosrowshahi, M.S.; Ghaemi, A.; Elkamel, A. Effective Modified MWCNT Super Adsorbent for Oxygen and Nitrogen Adsorption. Diam. Relat. Mater. 2023, 136, 109959. [Google Scholar] [CrossRef]
- Wang, H.; Wang, W.; Zhou, S.; Gao, X. Adsorption Mechanism of Cr(VI) on Woody-Activated Carbons. Heliyon. 2023, 9, e13267. [Google Scholar] [CrossRef] [PubMed]
- Masinga, T.; Moyo, M.; Pakade, V.E. Removal of Hexavalent Chromium by Polyethyleneimine Impregnated Activated Carbon: Intra-Particle Diffusion, Kinetics and Isotherms. J. Mater. Res. Technol. 2022, 18, 1333–1344. [Google Scholar] [CrossRef]
- Wang, J.; Guo, X. Adsorption Kinetic Models: Physical Meanings, Applications, and Solving Methods. J. Hazard. Mater. 2020, 390, 122156. [Google Scholar] [CrossRef] [PubMed]
- Saruchi; Kumar, V. Adsorption Kinetics and Isotherms for the Removal of Rhodamine B Dye and Pb+2 Ions from Aqueous Solutions by a Hybrid Ion-Exchanger. Arab. J. Chem. 2019, 12, 316–329. [Google Scholar] [CrossRef]
- Li, L.; Jia, C.; Zhu, X.; Zhang, S. Utilization of Cigarette Butt Waste as Functional Carbon Precursor for Supercapacitors and Adsorbents. J. Clean. Prod. 2020, 256, 120326. [Google Scholar] [CrossRef]
- Xue, Z.; Wen, J.; Yang, C.; Yuan, L.; Yin, X.; Li, Y. Efficient Removal of Chloramphenicol by K2CO3 Activated Porous Carbon Derived from Cigarette Butts. Biomass Convers. Biorefin. 2022. [CrossRef]
- Wang, Z.; Liu, L.; Lan, Y.; Li, W. Sn0-Modified Carbon Derived from Cigarette Butts as a Recycled Material for Enhanced Removal of Antibiotic Phenacetin. J. Environ. Chem. Eng. 2022, 10, 107164. [Google Scholar] [CrossRef]
- Alhokbany, N.S.; Naushad, M.; Kumar, V.; Al hatim, S.; Alshehri, S.M.; Ahamad, T. Self-Nitrogen Doped Carbons Aerogel Derived from Waste Cigarette Butts (Cellulose Acetate) for the Adsorption of BPA: Kinetics and Adsorption Mechanisms. J. King Saud Univ. Sci. 2020, 32, 3351–3358. [Google Scholar] [CrossRef]
- Gao, T.; Zhao, C.; Wang, S.; Li, X.; Ding, Q. Polyethyleneimine/Activated Carbon Paper-Based Material for Low-Concentration Hexavalent Chromium Removal. Cellulose. 2022, 29, 7301–7315. [Google Scholar] [CrossRef]
- Tu, B.; Wen, R.; Wang, K.; Cheng, Y.; Deng, Y.; Cao, W.; Zhang, K.; Tao, H. Efficient Removal of Aqueous Hexavalent Chromium by Activated Carbon Derived from Bermuda Grass. J. Colloid Interface Sci. 2020, 560, 649–658. [Google Scholar] [CrossRef]
- Fisher, K.S.; Vreugdenhil, A.J. Adsorption of Chromium (VI) Using an Activated Carbon Derived from Petroleum Coke Feedstock. Int. J. Mol. Sci. 2022, 23, 16172. [Google Scholar] [CrossRef] [PubMed]
- Guo, X.; Hu, W.; Gu, Z.; Li, J.; Xie, Z.; Fang, C.; Tao, H. Enhanced Removal of Aqueous Chromium (VI) by KOH-Activated Soybean Straw-Based Carbon. Water Air Soil Pollut. 2021, 232. [Google Scholar] [CrossRef]
- Loulidi, I.; Jabri, M.; Amar, A.; Kali, A.; A. Alrashdi, A.; Hadey, C.; Ouchabi, M.; Abdullah, P.S.; Lgaz, H.; Cho, Y.; et al. Comparative Study on Adsorption of Crystal Violet and Chromium (VI) by Activated Carbon Derived from Spent Coffee Grounds. Appl. Sci. (Basel). 2023, 13, 985. [Google Scholar] [CrossRef]
Figure 1.
(a) Thermogravimetric curves for BC pyrolysis at 5, 10 and 15 °C/min. (b) Thermogravimetric curves for SCB pyrolysis at 5, 10 and 15 °C/min.
Figure 1.
(a) Thermogravimetric curves for BC pyrolysis at 5, 10 and 15 °C/min. (b) Thermogravimetric curves for SCB pyrolysis at 5, 10 and 15 °C/min.
Figure 2.
(a) DTG curves for BC pyrolysis at 5, 10 and 15 °C/min. (b) DTG curves for SCB pyrolysis at 5, 10 and 15 °C/min.
Figure 2.
(a) DTG curves for BC pyrolysis at 5, 10 and 15 °C/min. (b) DTG curves for SCB pyrolysis at 5, 10 and 15 °C/min.
Figure 3.
Effect of heating speed on Tpeak, max of BC and SCB.
Figure 3.
Effect of heating speed on Tpeak, max of BC and SCB.
Figure 4.
(a) KAS model for the determination of BC Activation Energy. (b) KAS model for SCB Activation Energy determination.
Figure 4.
(a) KAS model for the determination of BC Activation Energy. (b) KAS model for SCB Activation Energy determination.
Figure 5.
(a) OFW model for the determination of BC Activation Energy. (b) OFW Model for SCB Activation Energy Determination.
Figure 5.
(a) OFW model for the determination of BC Activation Energy. (b) OFW Model for SCB Activation Energy Determination.
Figure 6.
(a) STK model for the determination of BC Activation Energy. (b) STK model for the determination of SCB Activation Energy.
Figure 6.
(a) STK model for the determination of BC Activation Energy. (b) STK model for the determination of SCB Activation Energy.
Figure 7.
(a) Change in Activation energy with respect to conversion without using STK, KAS and OFW BC methods. (b) Change in Activation energy with respect to the conversion of SCB methods STK, KAS and OFW.
Figure 7.
(a) Change in Activation energy with respect to conversion without using STK, KAS and OFW BC methods. (b) Change in Activation energy with respect to the conversion of SCB methods STK, KAS and OFW.
Figure 8.
(a) Change in Enthalpy as a Function of Conversion. (b) Change in Free Energy as a Function of Conversion. (c) Change in Entropy as a Function of Conversion.
Figure 8.
(a) Change in Enthalpy as a Function of Conversion. (b) Change in Free Energy as a Function of Conversion. (c) Change in Entropy as a Function of Conversion.
Figure 9.
Nitrogen isotherms at -196 °C for commercial CA and CA obtained from SCB.
Figure 9.
Nitrogen isotherms at -196 °C for commercial CA and CA obtained from SCB.
Figure 10.
Pore Size Distribution for the Commercial CA and SCB samples.
Figure 10.
Pore Size Distribution for the Commercial CA and SCB samples.
Figure 11.
(a) Cr(VI) adsorption kinetics on AC obtained from SCB. (b) Morris and Weber intraparticle diffusion model.
Figure 11.
(a) Cr(VI) adsorption kinetics on AC obtained from SCB. (b) Morris and Weber intraparticle diffusion model.
Figure 12.
Cr(VI) adsorption isotherms on AC obtained from SCB.
Figure 12.
Cr(VI) adsorption isotherms on AC obtained from SCB.
Table 1.
Commercial CA and SCB CA Textural Parameters.
Table 1.
Commercial CA and SCB CA Textural Parameters.
| Textural Parameters |
Commercial CA |
CA of SCB |
| BET Superficial area (m2/g) |
783 |
434 |
| C |
6350 |
7707 |
| Micropore volume. (cm3/g) |
0.33 |
0.17 |
| Mesopore volume (cm3/g) |
0.01 |
0.08 |
| Total Pore Volume (cm3/g) |
0.34 |
0.25 |
Table 2.
Kinetic parameters of Cr (VI) adsorption on AC obtained from SCB.
Table 2.
Kinetic parameters of Cr (VI) adsorption on AC obtained from SCB.
| Model |
Non-Linear Model |
|
Cr (VI) |
| Pseudo First Order (PFO) |
|
q1 (mg•g-1) |
10.45 |
| K1 (min-1) |
0.187 |
| R12
|
0.5621 |
| Pseudo Second Order (PSO) |
|
q2 (mg•g-1) |
11.12 |
| K2 (g•mg-1•min-1) |
0.02 |
| R22
|
0.7013 |
| Elovich |
|
α (mg•g-1) |
5.76 |
| β (g•mg-1•min-1) |
0.55 |
| RE2
|
0.8832 |
| Weber and Morris |
|
Region I |
Kin,1 (mg•g-1•min-1/2) |
0.24 |
| C (mg•g-1) |
5.33 |
| R2
|
0.9362 |
| Region II |
Kin,2 (mg•g-1•min-1/2) |
1.14 |
| C (mg•g-1) |
- |
| R2
|
0.9996 |
| Region III |
Kin,3 (mg•g-1•min-1/2) |
0.05 |
| C (mg•g-1) |
12.17 |
| R2
|
0.9219 |
Table 3.
Parameters obtained from the adjustments of Cr(VI) adsorption models on AC obtained from SCB.
Table 3.
Parameters obtained from the adjustments of Cr(VI) adsorption models on AC obtained from SCB.
| Model |
Parameters |
Cr (VI) |
| Langmuir |
qmax (mg•g-1) |
55.8 |
| KL (L/mg) |
0.02 |
| R2
|
0.9719 |
| Freundlich |
n |
0.46 |
| KF (L/mg) |
4.30 |
| R2
|
0.8876 |
| Dubinin-Radushkevich |
β (mol2•kJ-2) |
3.7•10-5
|
| EL (kJ/mol) |
34.29 |
| R2
|
0.7388 |
| Temkin |
KT (L/mol) |
0.74 |
| b (J/mol) |
301.7 |
| R2
|
0.9336 |
Table 4.
Comparative table for adsorption of organic and inorganic pollutants on CA obtained from BCs.
Table 4.
Comparative table for adsorption of organic and inorganic pollutants on CA obtained from BCs.
| Adsorbate |
Method |
Qmax Langmuir (mg/g) |
| Pb2+, Cr3+, Ni2+, Cd2+ |
Carbonization Hydrothermal, Activation with KOH |
109.8-209.6 Pb2+ [18] |
| Roxarsone |
Carbonization Hydrothermal, Pyrolysis |
697 [51] |
| Chloramphenicol |
Carbonization Hydrothermal, Activation with K2CO3
|
450 [52] |
| Phenol |
Pyrolysis, Activation with CO2
|
272 [16] |
| Phenacetin |
(Tin chloride pentahydrate+KOH), Pyrolysis |
156.4 [53] |
| Bisphenol A |
Carbonization Hydrothermal, Pyrolysis |
364.2 [54] |
| Cr6+ |
Pyrolysis, Activation with KOH |
55.8 (In this research) |
Table 5.
Comparative table of Cr (VI) adsorption on different CA obtained by different precursors.
Table 5.
Comparative table of Cr (VI) adsorption on different CA obtained by different precursors.
| Precursor |
Qmax Langmuir (mg/g), Cr6+
|
| Polyethyleneimine (PEI)/Activated carbon from softwood pulp |
1.58 mg/g [55] |
| Bermuda Grass |
403.23 mg/g [56] |
| Petroleoum coke Feedstock |
22.4 mg/g [57] |
| Soybean Straw |
294.12 mg/g [58] |
| Tires Waste |
142.85 [58] |
| Spent Coffee grounds |
187.6 [59] |
| Somoken Butts Cigarettes |
55.8 (In this research) |
|
Disclaimer/Publisher’s Note: The statements, opinions and data contained in all publications are solely those of the individual author(s) and contributor(s) and not of MDPI and/or the editor(s). MDPI and/or the editor(s) disclaim responsibility for any injury to people or property resulting from any ideas, methods, instructions or products referred to in the content. |
© 2023 by the authors. Licensee MDPI, Basel, Switzerland. This article is an open access article distributed under the terms and conditions of the Creative Commons Attribution (CC BY) license (http://creativecommons.org/licenses/by/4.0/).
