Preprint
Article

Exploring Seaweed and Glycine Betaine Biostimulants for Enhanced Phenolic Content, Antioxidant Properties and Gene Expression of Vitis vinifera cv. ‘Touriga Franca’ berries

Altmetrics

Downloads

168

Views

78

Comments

0

A peer-reviewed article of this preprint also exists.

Submitted:

15 November 2023

Posted:

16 November 2023

You are already at the latest version

Alerts
Abstract
Climate change will pose a challenge for the winemaking sector worldwide, bringing progressively drier and warmer conditions and increasing the frequency and intensity of weather extremes. The short-term adaptation strategy of applying biostimulants through foliar application serves as a crucial measure in mitigating the detrimental effects of environmental stresses on grapevine yield and berry quality. The aim of this study was to evaluate the effect of foliar application of a seaweed based biostimulant (A. nodosum – ANE) and glycine betaine (GB) on berry quality, bioactive compounds, antioxidant activity, and elucidated their action on the secondary metabolism. A trial was installed in a commercial vineyard (cv. ‘Touriga Franca’) in the Cima Corgo (Upper Corgo) sub-region of the Douro Demarcated Region. A total of four foliar sprayings were performed during the growing season: at flowering, pea size, bunch closer, and veraison. There was a positive effect of GB in the berry quality traits. Both ANE and GB increased the synthesis of anthocyanins and other phenolics in berries and influenced the expression of genes related to the synthesis and transport of anthocyanins (CHS, F3H, UFGT, MATE1 and GST). So, they have the potential to act as elicitors of secondary metabolism, leading to improved grape quality, but also sets the foundation for sustainable agricultural practices in the long run.
Keywords: 
Subject: Biology and Life Sciences  -   Biochemistry and Molecular Biology

1. Introduction

Vitiviniculture is one of the most important socioeconomic sectors in Portugal. From a global perspective, in the year of 2022 Portugal was the 10th largest wine producer and the 8th wine exporter [1]. Portugal has a total of 14 wine regions (12 in Continental Portugal and two in the Azores and Madeira archipelagos) [2]. The Douro Demarcated Region (DDR), located in the northeast of Portugal, was recognized as the first demarcated wine region of the world. The DDR is the largest and the most heterogeneous mountainous wine region in the world, with a peculiar terroir, presenting a Mediterranean-like climatic conditions, with warm dry summers and mild wet autumns [3]. Portugal has many native cultivars, being ‘Touriga Franca’ the most utilized for wine production. In the DDR, this cultivar is used to produce top-quality Port wines due to its rich phenolic composition (anthocyanins and flavanols) [4,5]. The ongoing climate change will be a challenged for the winemaking sector worldwide, but particularly in the warmest and driest regions of Southern Europe. In Portuguese vineyards, climate change will inflict progressively drier and warmer conditions, and increased frequency and intensity of weather extremes [6]. The used of foliar protection formulations have been considered a short-term adaptation measure to cope with climate change while improving fruit quality. Spraying with biostimulants such as Ascophyllum nodosum-based seaweed extracts is increasing as it improves in grapevine the quality of berries by regulating physiological, biochemical, and molecular processes [7,8,9,10,11,12] as well as with glycine betaine, that is naturally synthetized and can act as an osmoprotectant, can protect the photosynthetic machinery (photosystem II), and thylakoid membranes, alleviating cellular oxidative damage and stabilizing protein structures in several plants [13,14,15]. It is known that several biostimulants contain bioactive molecules called elicitors [12], which are all the signal molecules that are perceived and induce a defensive reaction in the plant, improving their ability to face adverse environmental conditions, acting on primary or secondary metabolism [16,17]. In this way, to understand how these biostimulants improve the quality of berries as a whole and, consequently, wine, it is important to study chemical and physical parameters of the berry. Contents in bioactive compounds and antioxidant activities are relevant features of berry quality. Moreover, understanding the effect of biostimulants spraying on the biosynthesis of secondary metabolites, particularly anthocyanins, is extremely important in a red cultivar such as ‘Touriga Franca’. Although the mechanisms of action and the effects of biostimulation on secondary metabolism are not totally clear [18], several studies have been conducted, namely with kaolin foliar application, Conde et al. [5] and Dinis et al. [19] have shown upregulation of genes of the phenylpropanoid and flavonoid pathways; Aziz et al. [20] reported that Laminarin elicits defense responses in grapevine cv. ‘Gamay’; Ferrandino and Lovisolo [21] and Koyama et al. [22] verified that abscisic acid mediates responses to abiotic stress in grapevine due to secondary metabolites accumulation and increase the gene expression; Singh et al. [23] studied the effect of chitosan in cv. ‘Tinto Cão’ and verified an increase in anthocyanins and phenolics concentration and also the upregulation in several target genes encoding key enzymes involved in secondary metabolic pathways.
Comparative transcriptomic analysis of key genes related to biosynthesis and transport of anthocyanins, such as phenylalanine ammonia lyase (PAL), chalcone synthase (CHS), flavanone 3-hydroxylase (F3H), anthocyanidin reductase (ANR), UDP-glucose: flavonoid 3-O-glucosyltransferase (UFGT), anthocyanin transporter (ABCC1), tonoplast transporter (MATE1), and glutathione S-transferase (GST) [5,21,23,24], enables also to assess the impact of treatments on berry quality.
The aim of this study was to evaluate the effect of foliar application of a seaweed based biostimulant (A. nodosum) and glycine betaine on berry quality, bioactive compounds, antioxidant activity and elucidated their action on the secondary metabolism of grapevine, namely in the synthesis of phenolics, flavonoids, and anthocyanins, complemented with expression studies of target genes encoding key enzymes of secondary metabolite synthesis, namely anthocyanins, and transport.

2. Results

2.1. Berry Quality

All the biometric parameters analyzed (weight, height, width, and thickness) were influenced by the foliar treatment, the phenological stage and the interaction between treatment and phenological stage (0.05 < p < 0.001) (Figure 1A, 1B, 1C, and 1D). The values of biometric parameters tended to be lower in the treated grapevines than in the control (C). At veraison, among the treated plants, those sprayed with glycine betaine (GB 0.1% and 0.2%) exhibited statistically significant and higher fruit weight, width, and thickness values compared to those treated with ANE 0.05% (A. nodosum extract). At harvest significantly higher values for all the biometric parameters were also detected in grapevines treated with GB 0.2%, together with ANE 0.1% and C, comparatively to ANE 0.05% and GB 0.1%.
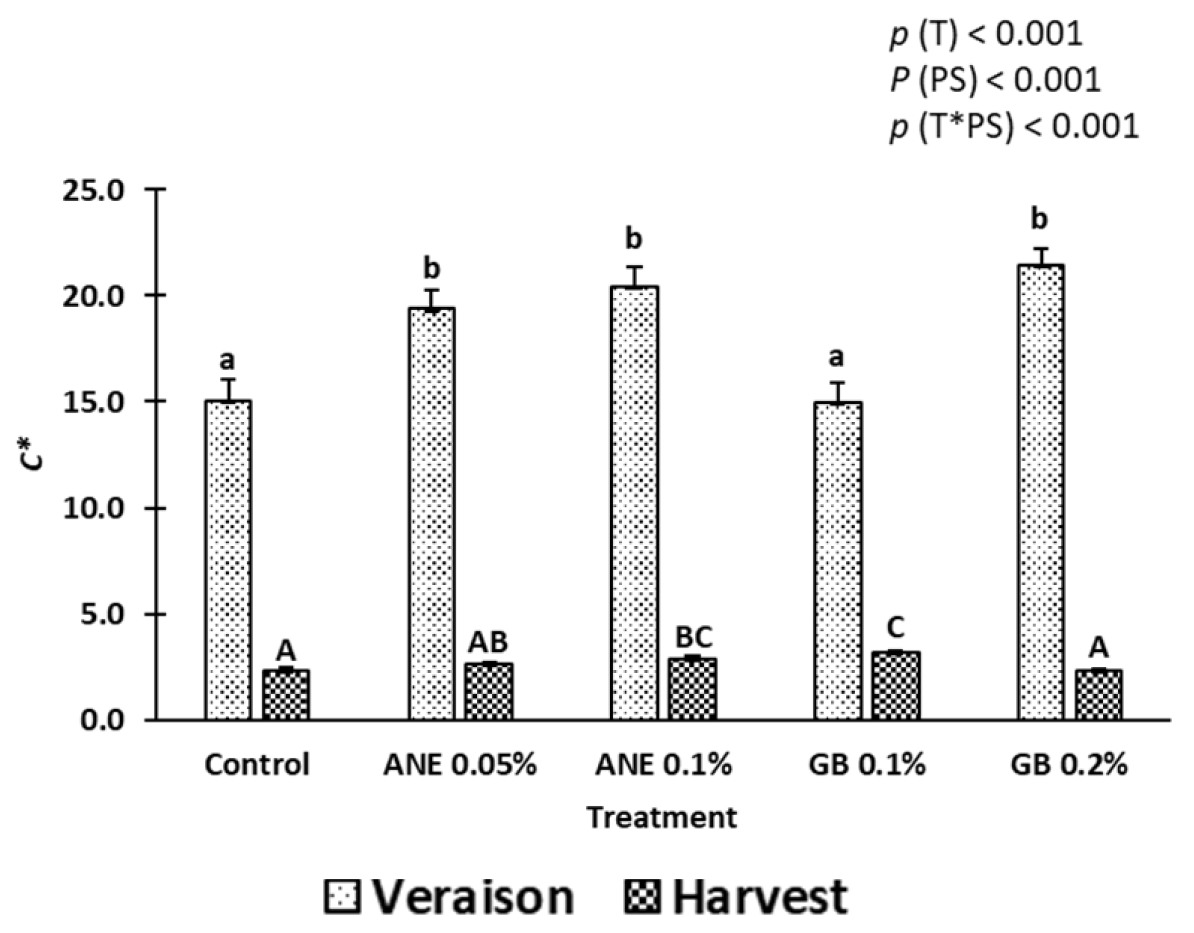
Chroma (C*) was influenced by treatment (p < 0.001), phenological stage (p < 0.001), and the interaction between treatment and phenological stage (p < 0.001) (Figure 2). At veraison, the berries treatment with ANE (0.05% and 0.1%) and GB 0.2% revealed a significantly higher C* compared to control and GB 0.1%.
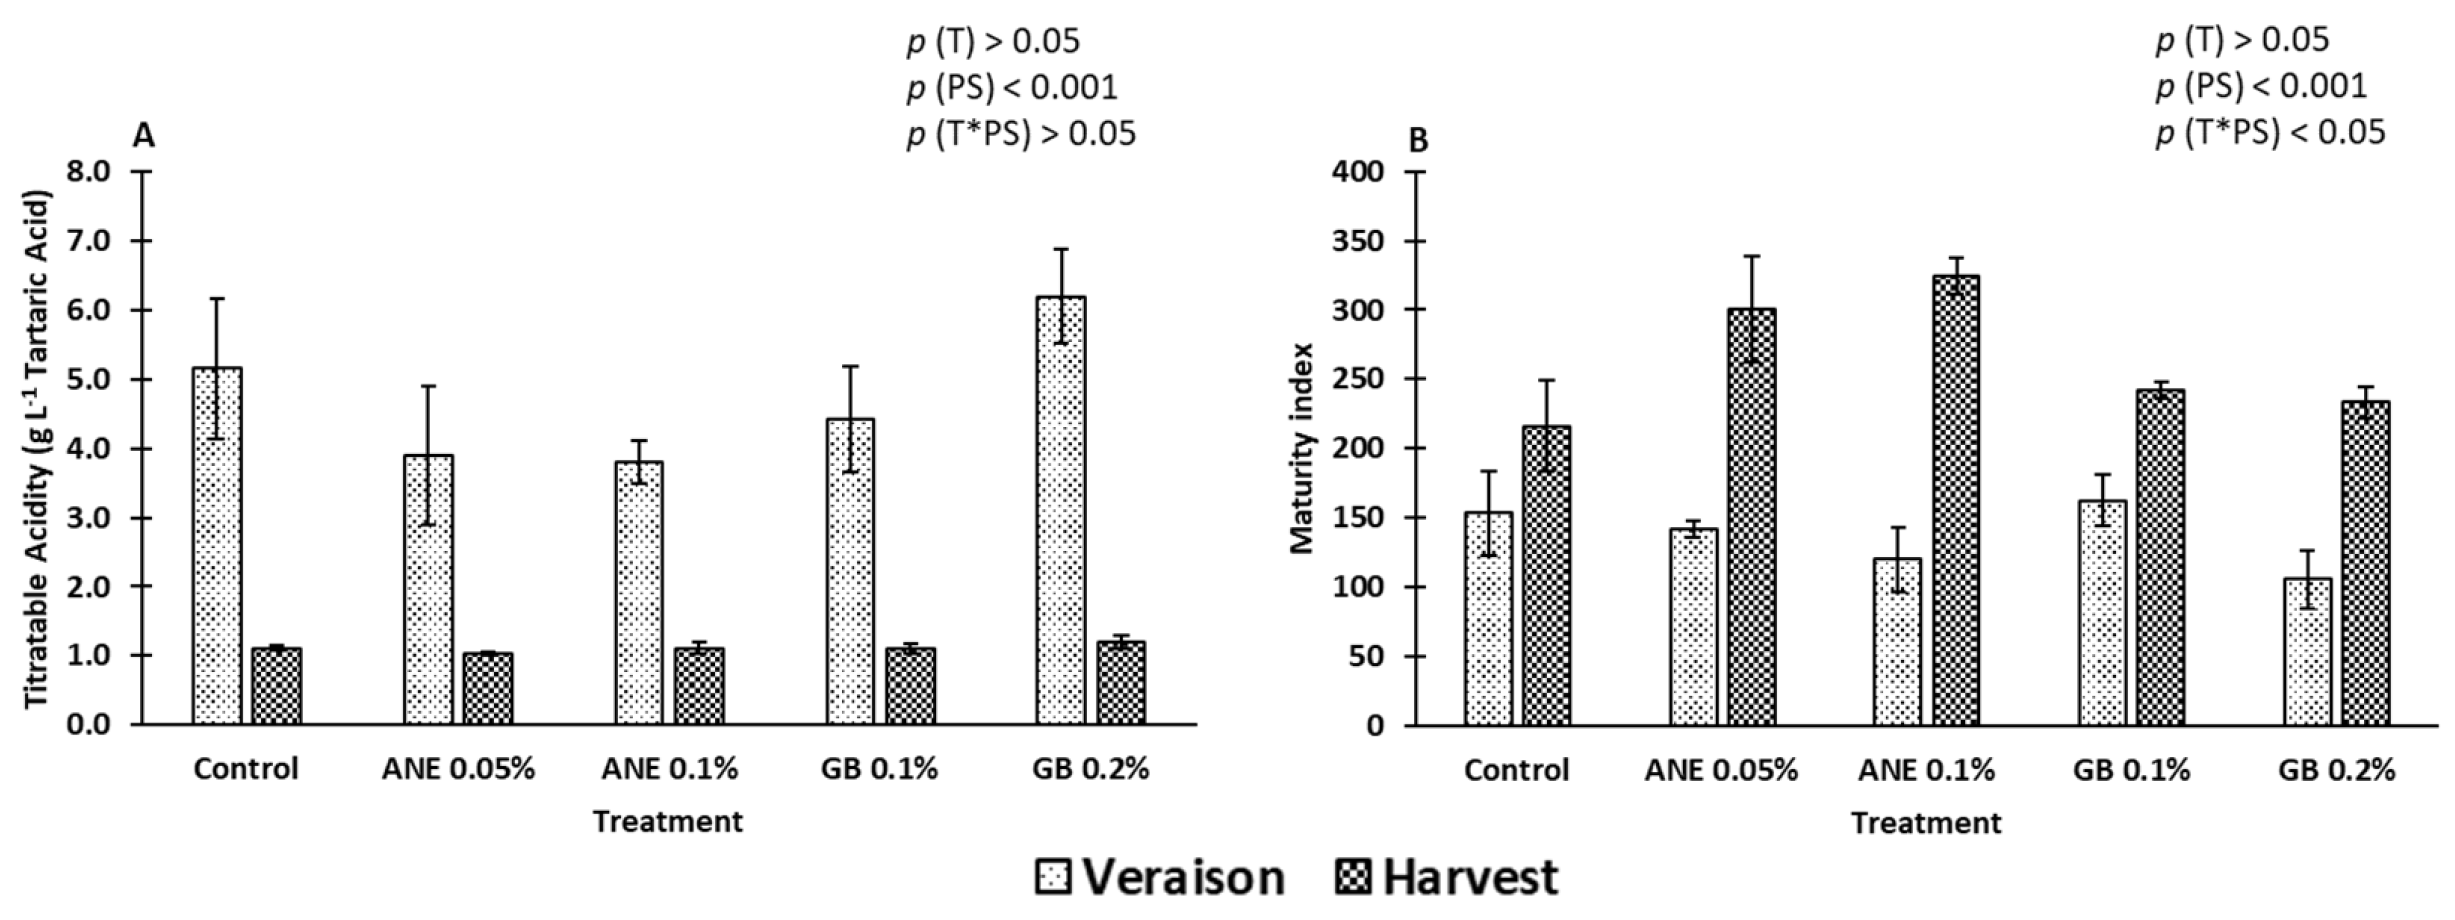
Titratable acidity (TA) was only influenced by the phenological stage (p < 0.001) (Figure 3A).
In this study MI (Maturity Index) was affected by the phenological stage (p < 0.001) and by the interaction between treatment and phenological stage (p < 0.05) (Figure 3B). At statistical level no significant differences were found between treatments.

2.2. Bioactive Compounds

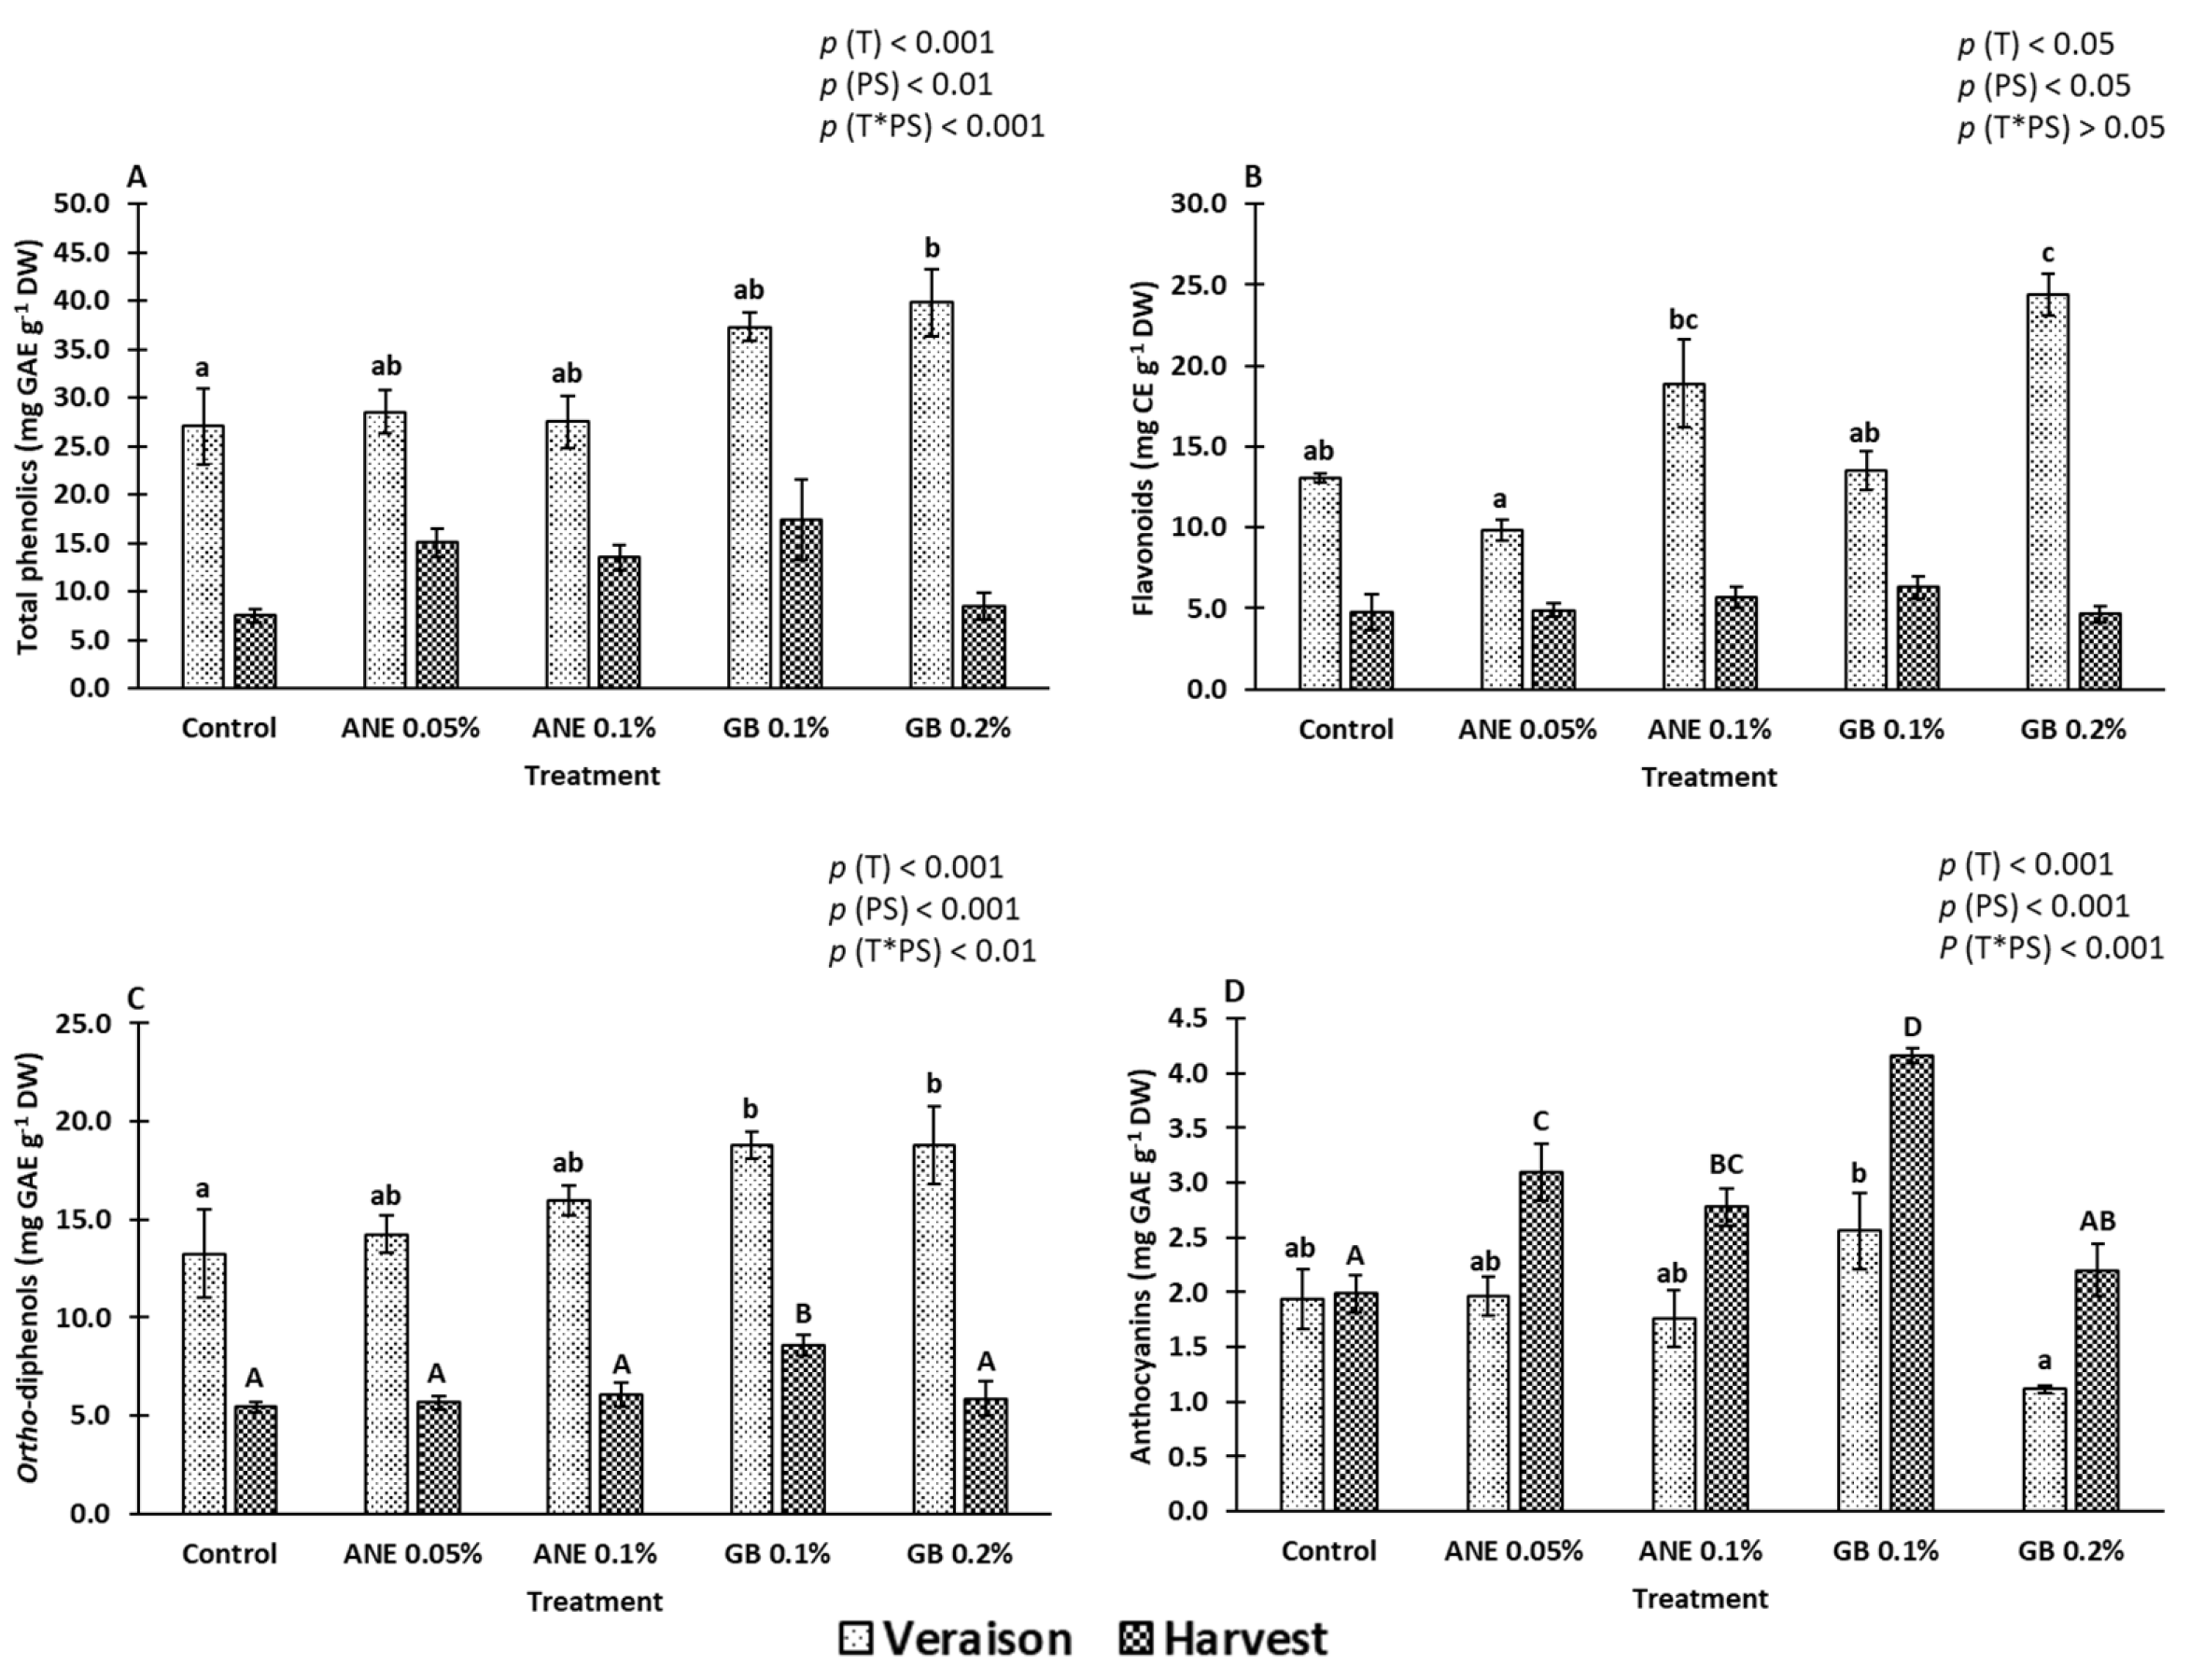
Overall, the treatments with GB enhanced the analyzed bioactive compounds (total phenolics, flavonoids, ortho-diphenols, and total anthocyanins) compared to the control (Figure 4).
Total phenolics, flavonoids, ortho-diphenols, and total anthocyanins contents (Figure 4) were influenced by treatment (p < 0.001) and phenological stage (p < 0.01). Additionally, total phenolics, ortho-diphenols, and total anthocyanins contents were affected by the interaction between treatment and phenological stage (p < 0.001).
At veraison, GB 0.2% increased the concentrations of total phenolics, flavonoids, and ortho-diphenols by approximately 32%, 47%, and 29%, respectively, compared to the control (Figure 4A, 4B and 4C). At harvest, significant differences were observed in comparison to the control for ortho-diphenols and anthocyanin content, even in plants treated with GB (0.1%) (values 37% and 52% higher, respectively).

2.3. Antioxidant Potential

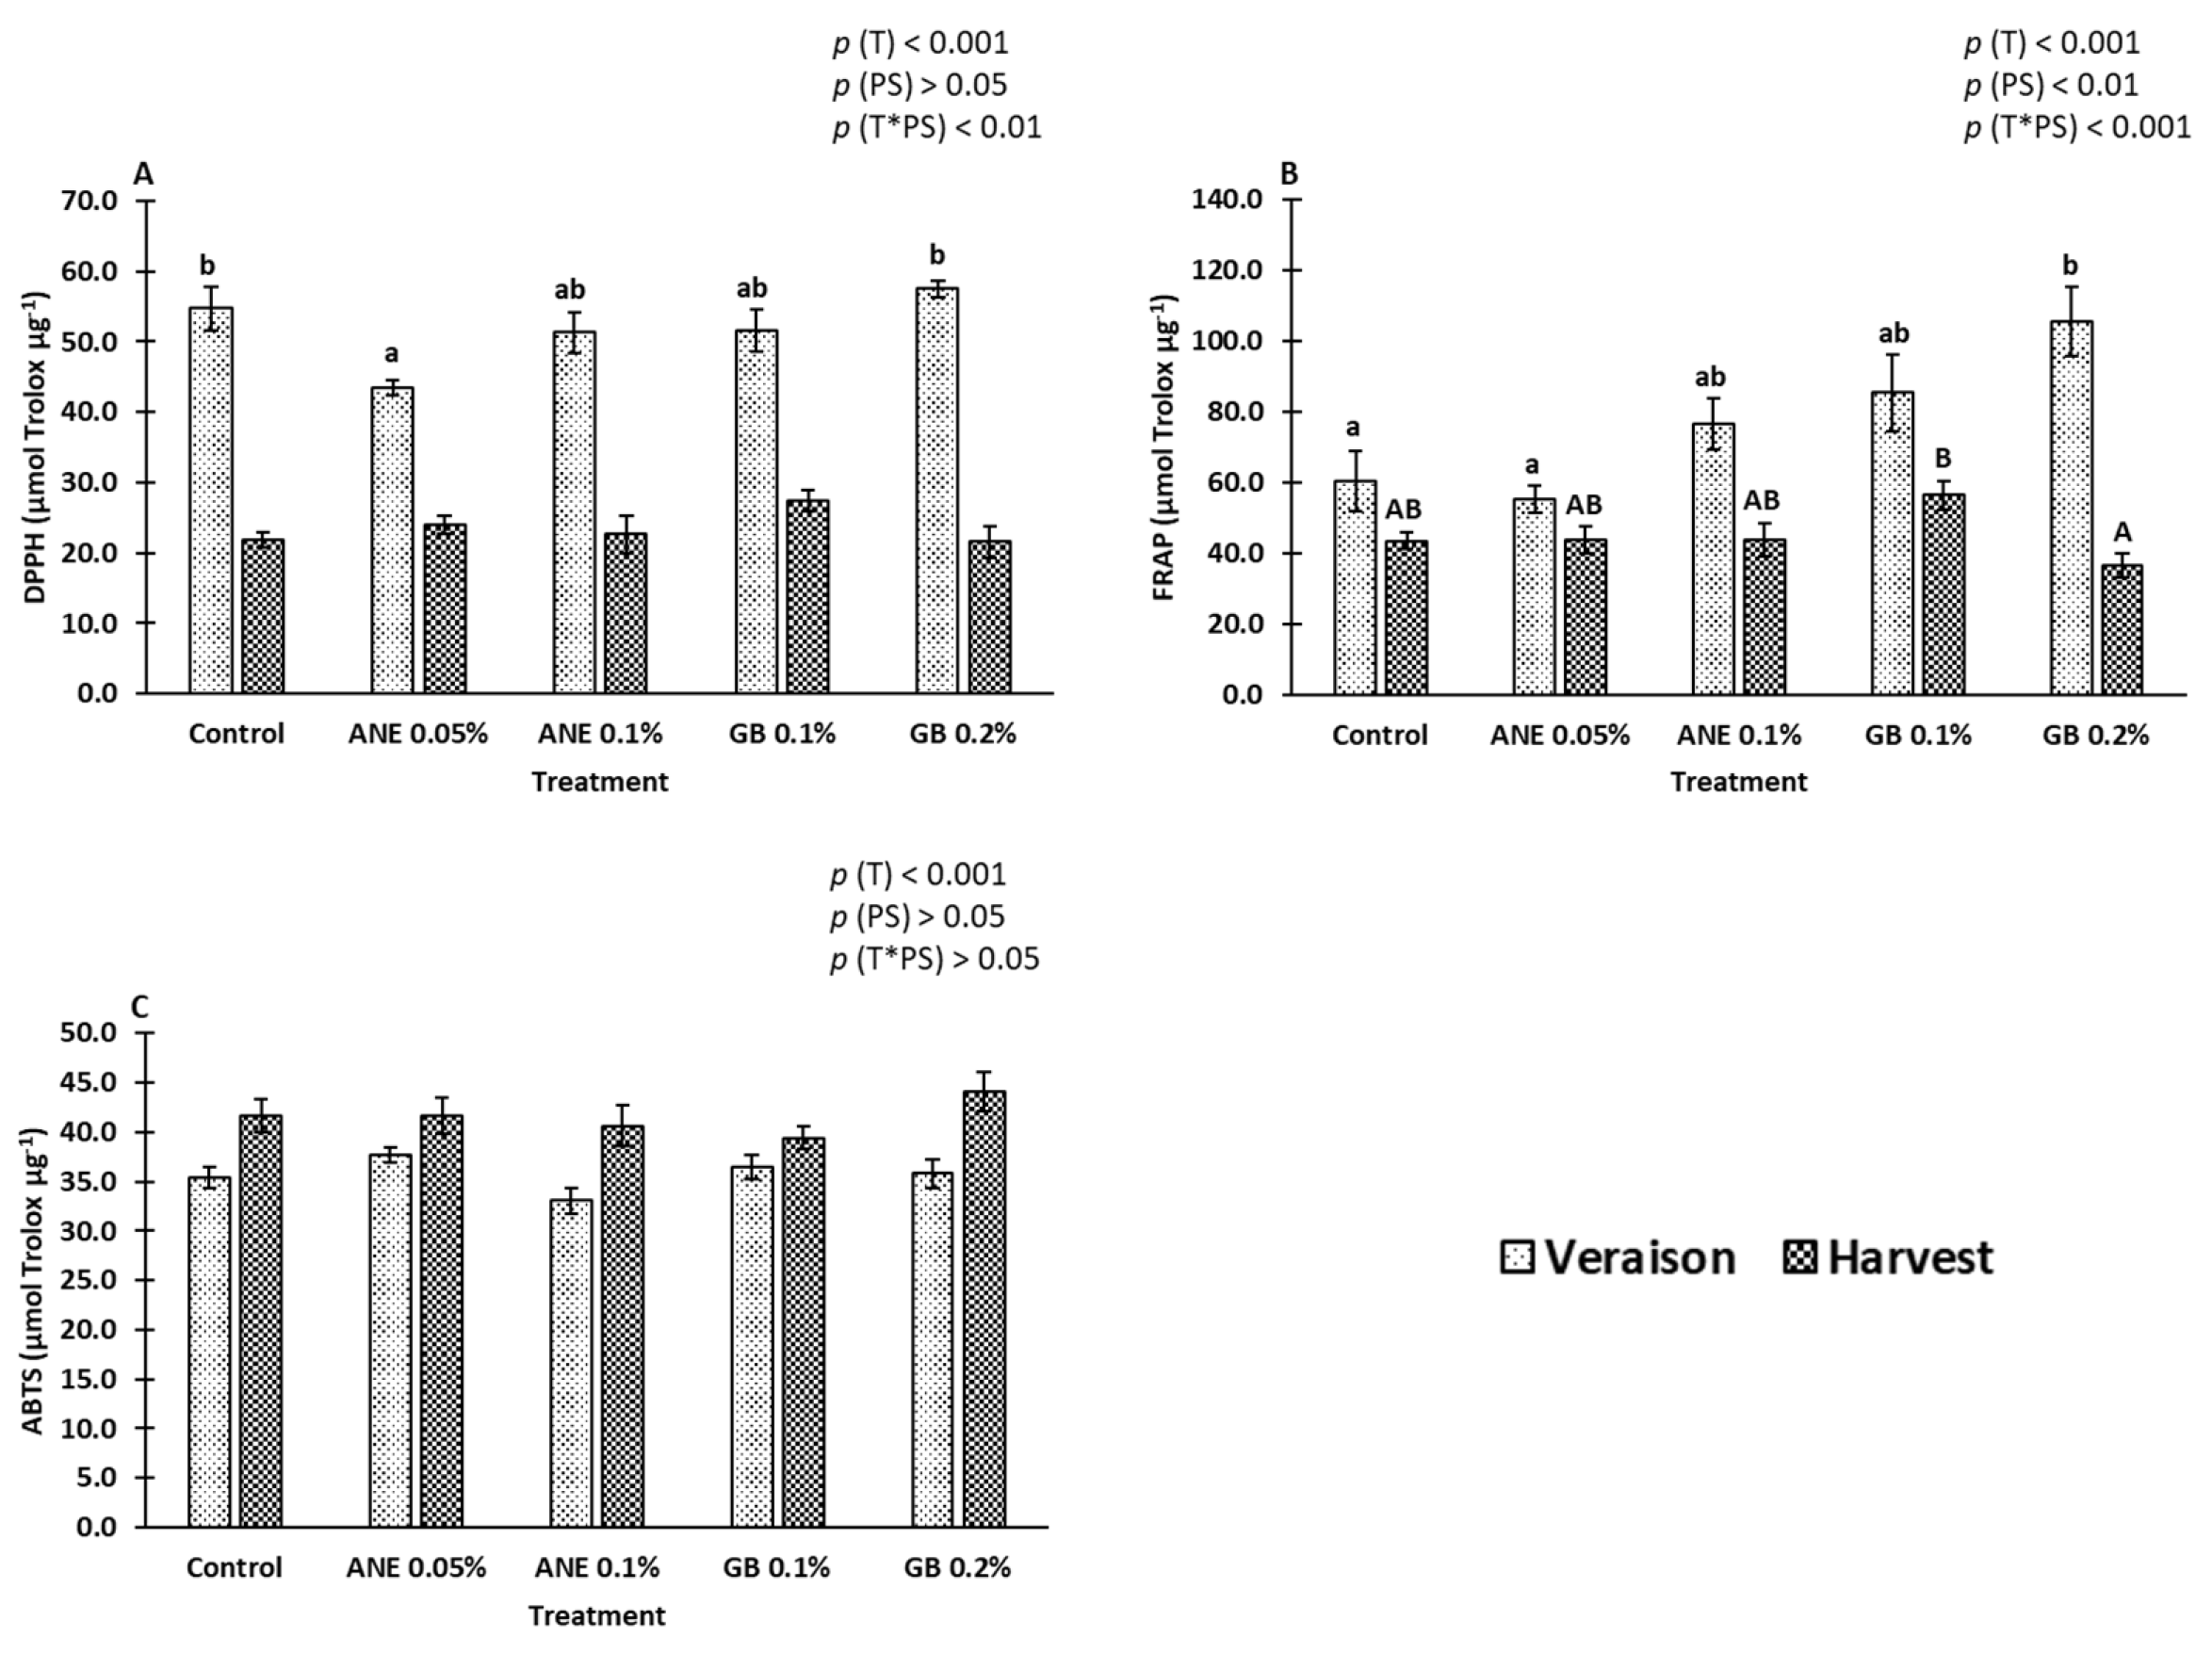
To assess the impact of foliar treatments on the antioxidant activity (AA) of berries, three different methods were used, DPPH, FRAP, and ABTS•+ (Figure 5).
All the antioxidant activity results were affected by the treatment (p < 0.001) (Figure 5). Furthermore, the FRAP results were also influenced by the phenological stage (p < 0.01) (Figure 5B) and DPPH and FRAP by the interaction treatment x phenological stage (Figure 5A and 5C, respectively).
At veraison, the FRAP results indicated that GB 0.2% exhibited the highest increase in AA, approximately 43% higher than the control. For the remaining conditions, there were no significant differences among the various treatments in terms of antioxidant AA results.
The antioxidant activity results exhibited a positive correlation with the bioactive compounds: at veraison, the DPPH values were positively correlated with total phenolics (R2 = 0.480; p < 0.01) and ortho-diphenols (R2 = 0.559; p < 0.01); FRAP values were correlated with total phenolics (R2 = 0.619; p < 0.01), flavonoids (R2 = 0.344; p < 0.05) and ortho-diphenols (R2 = 0.794; p < 0.01); at harvest, positive correlations were also found for DPPH values with ortho-diphenols (R2 = 0.475; p < 0.01) and total anthocyanins (R2 = 0.542; p < 0.01); FRAP values were positive correlated with flavonoids (R2 = 0.359; p < 0.05), ortho-diphenols (R2 = 0.440; p < 0.01) and total anthocyanins (R2 = 0.384; p < 0.01).

2.4. Gene Expression

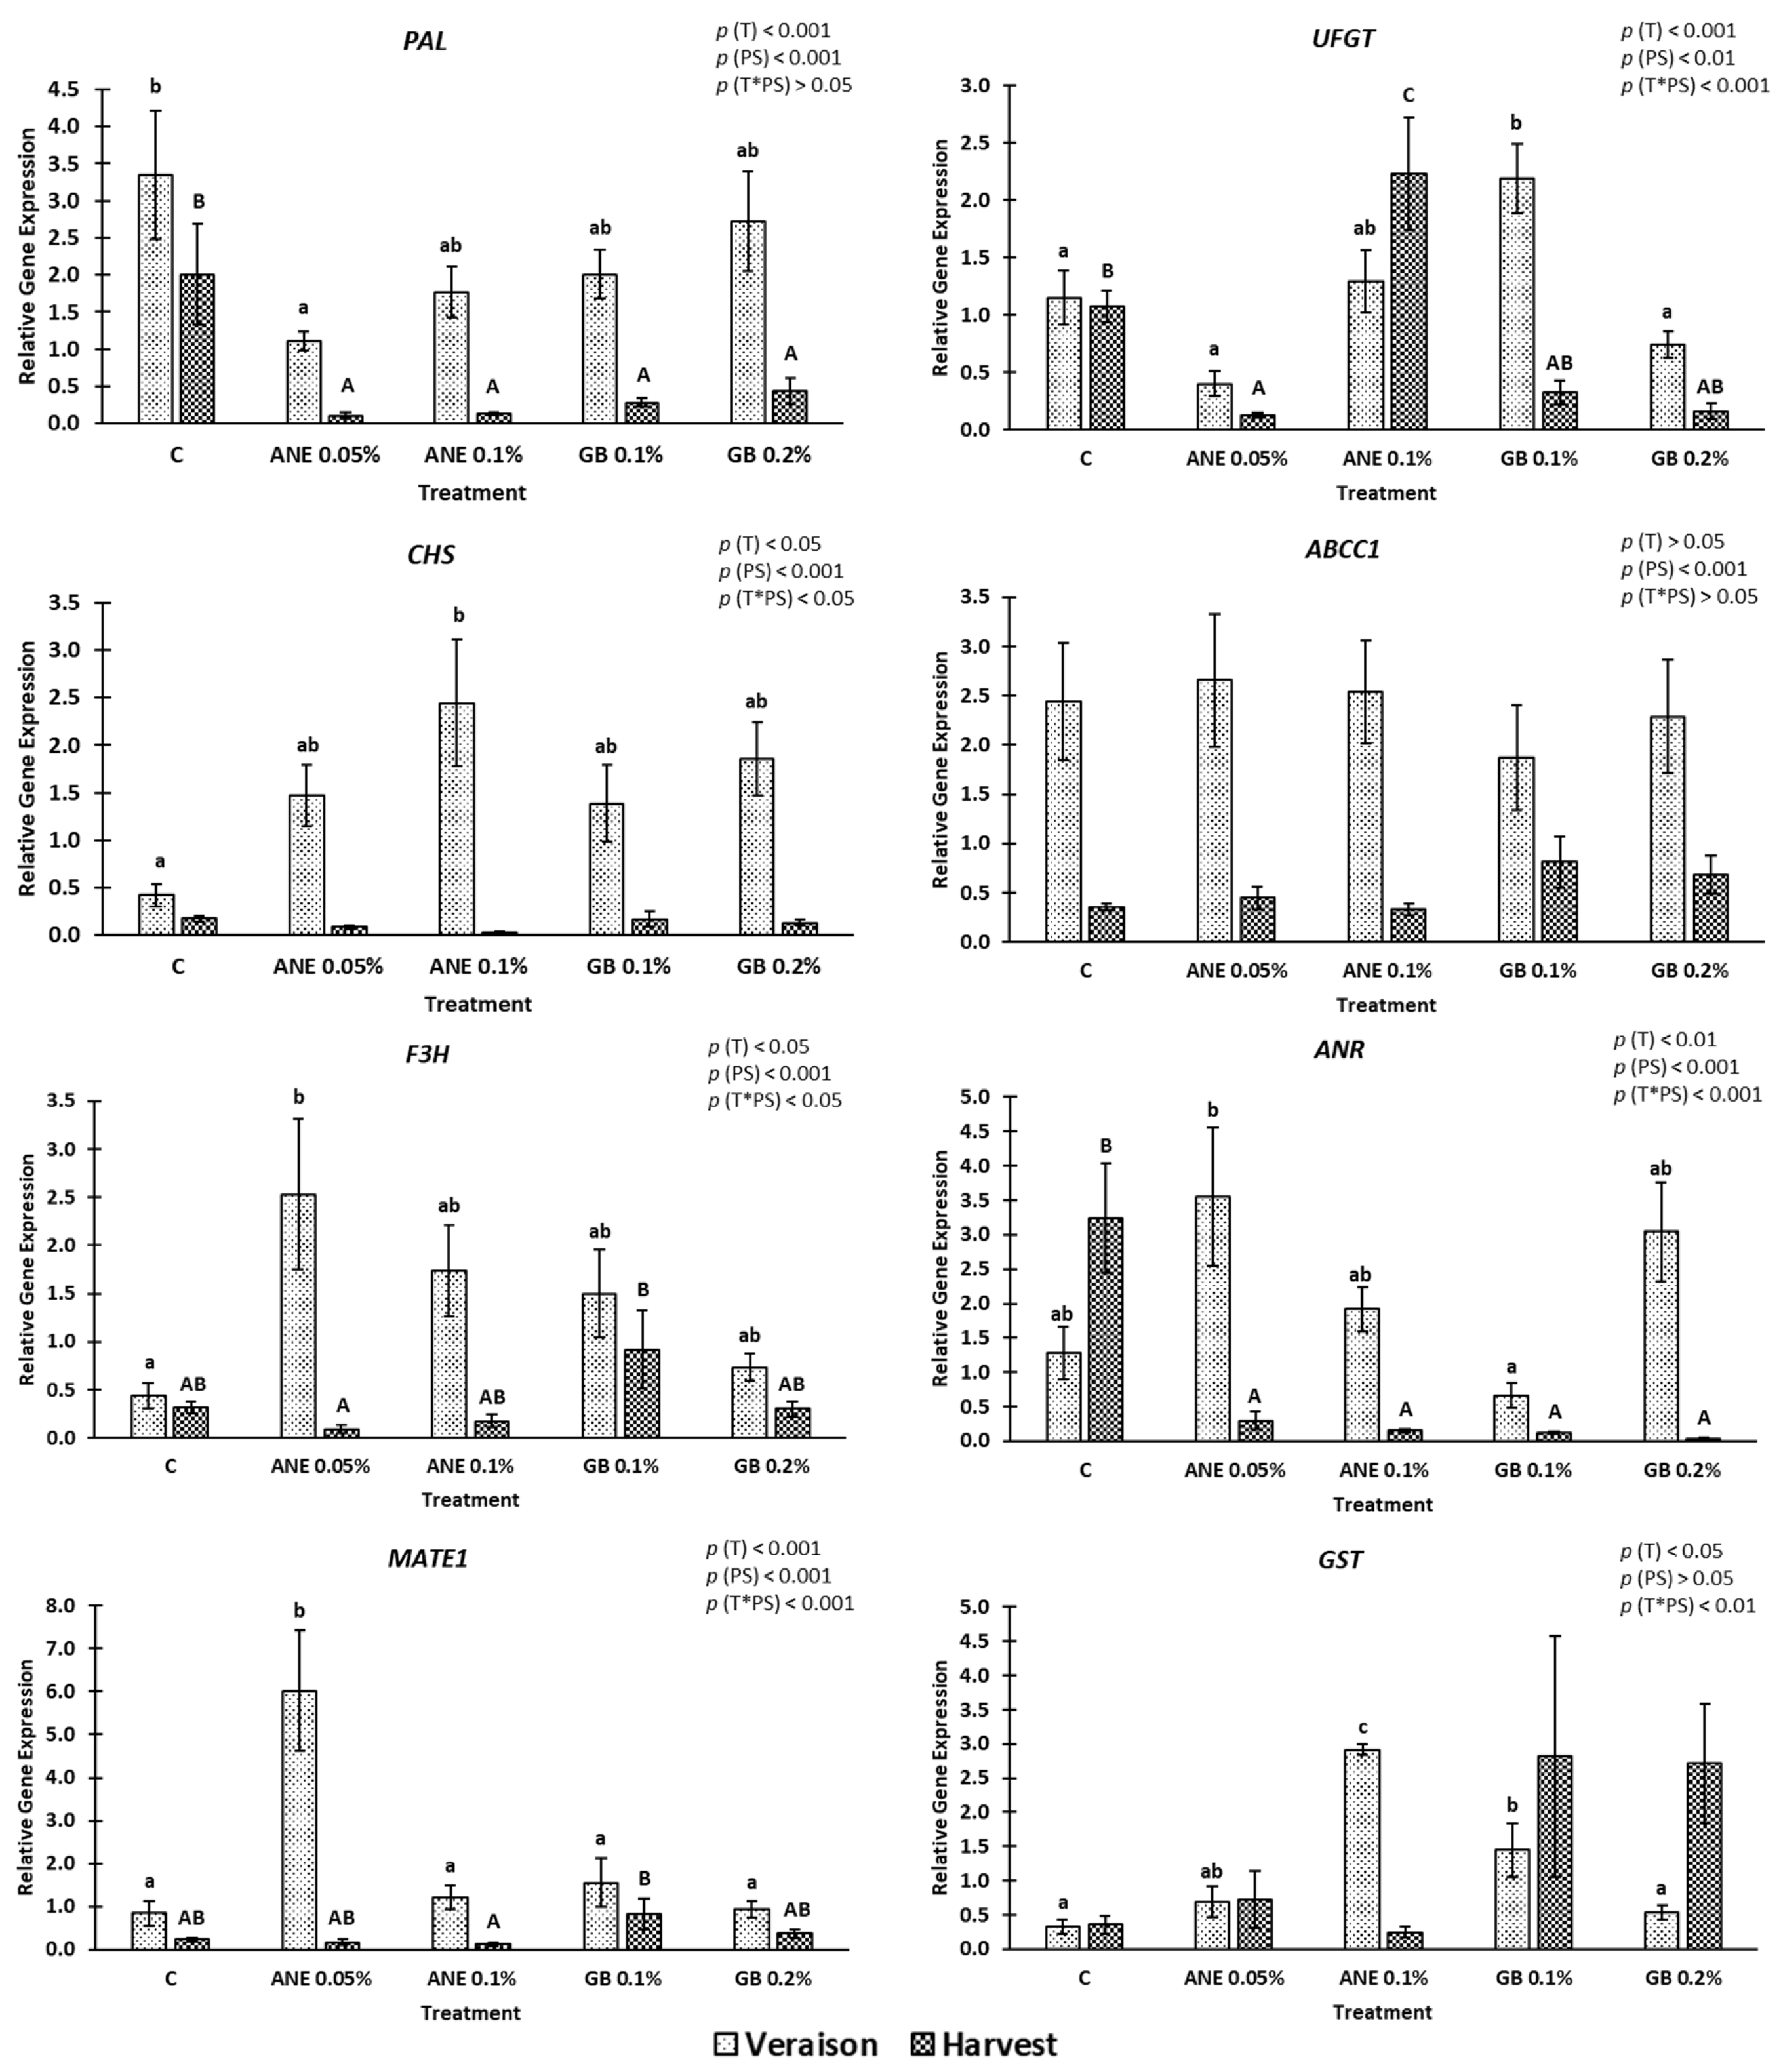
To investigate the impact of the tested biostimulants on the secondary metabolism level, known to enhance the content of bioactive compounds, we analyzed the expression of several target genes encoding key enzymes involved in flavonoid biosynthesis and transport. These genes include PAL, CHS, F3H, ANR, UFGT, ABCC1, MATE1, and GST in berries at veraison and harvest (Figure 6). The relative gene expression was influenced by the treatment (0.05 < p < 0.001) except for the gene ABCC1, by the phenological stage (0.01 < p < 0.001), except for GST and by the interaction between treatment and phenological stage (0.05 < p < 0.001), except for PAL and ABCC1.
Ascophylum nodosum based extract at a concentration of 0.1% led to significant differences in the relative gene expression of CHS and GST compared to the control at veraison. At a concentration of 0.05%, it affected the expression of F3H and MATE1. On the other hand, GB 0.1% promoted the upregulation of UFGT and GST. However, at harvest, UFGT was upregulated in berries treated with ANE 0.1%.

3. Discussion

3.1. Impact of Biostimulants on the Quality Attributes of Berries

Several studies have shown that the foliar application of ANE and GB on grapevine can influence the physical and chemical characteristics of fruits [7,8,9,10,25,26,27,28,29]. In this study, berries of grapevines sprayed with GB (0.2%) were bigger and heavier in relation to the ANE 0.05% berries. Studies using GB also report this trend in grapevine [31] and other species, namely strawberry [25], sunflower achenes [27], sweet cherry [26,30], and olive [29].
Color is an important attribute in the cultivar under study, as this cultivar is widely used in the production of Porto wine. During this study, it was verified that the parameter C* was lower in berries treated with GB 0.1% (at veraison) and GB 0.2% (at harvest). Considering that C* refers to color saturation, higher C* values are indicative of non-colored berries, whereas lower C* values are linked to colored ones [25,32]. These results suggest that GB can enhance the color quality of grapes. Similar results have been observed not only in grapevines [31], but also in other fruit species, including sweet cherry [26] and strawberry [25]. The acidity of berries can be influenced by water availability and high temperatures during berry ripening, which can have implications for wine quality [6,33]. In this study, TA was affected by phenological stage (p < 0.001), decreasing, as expected, from veraison to harvest (Figure 3A). Although higher values of TA were detected at veraison in berries from vines treated with GB 0.2%, no significant differences were found between the treatments at the statistical level. Frioni et al. [8] observed similar results in the 'Sangiovese' grapevine cultivar when applying ANE, with no difference found in TA between treated and untreated grapevines.
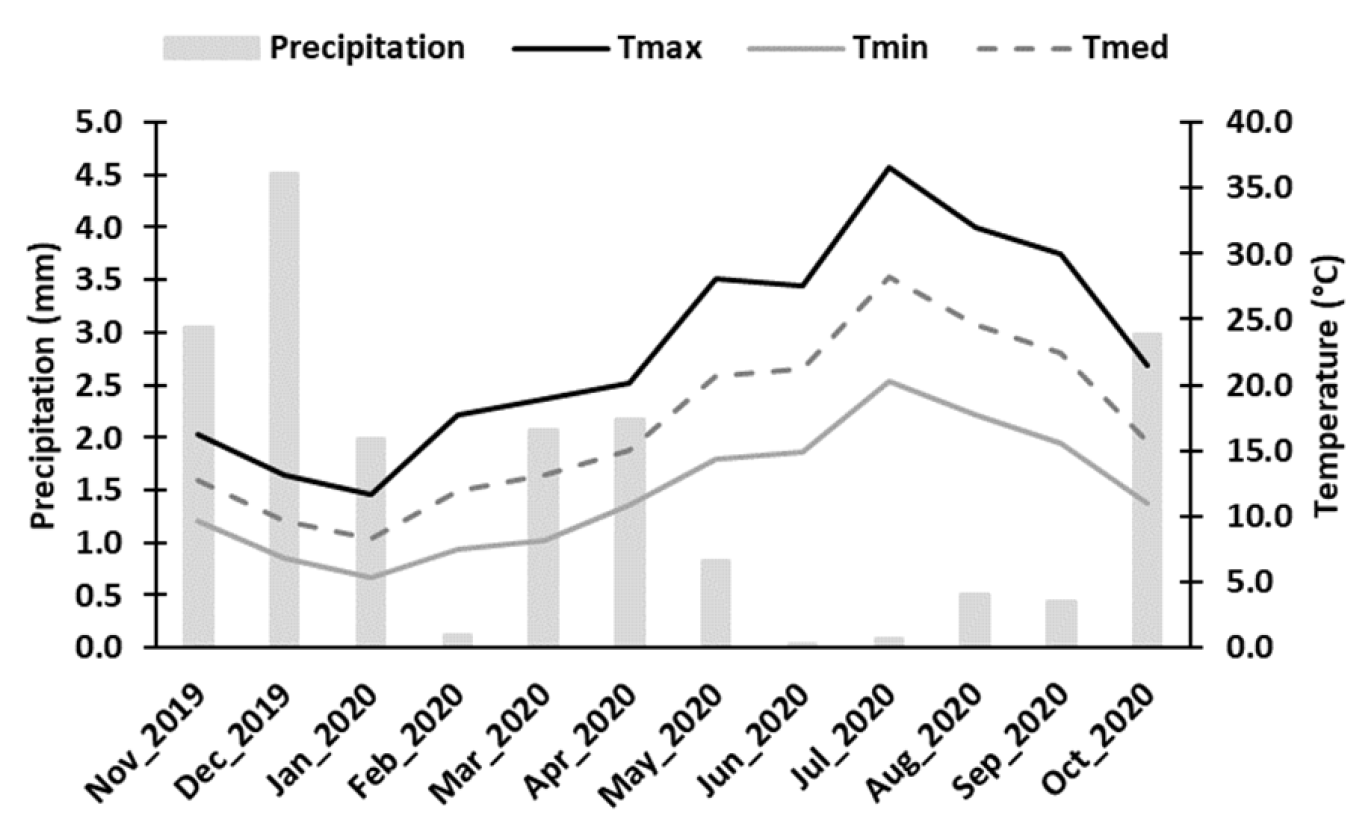
The MI parameter is commonly employed to determine the optimum ripeness of red wine grapes. As expected, the MI values increased from veraison to harvest due to the rise in soluble solids content and the decrease in pH. The treatment did not significantly affect the Maturity Index (Figure 3A). Nevertheless, a delay in the MI at veraison was observed in berries treated with 0.2% GB and 0.1% and 0.05% ANE, compared to the other treatments and the control. In olives, Taskin and Ertan [29] also reported that fruit maturity in the control group was more advanced compared to the treated trees when using GB. As expected, the MI was influenced by the phenological stage (p < 0.001). Weather conditions can influence the MI, as observed in grapevine by Rätsep et al. [34]. In Portugal the year 2020 was notably hot and dry, resulting in an advancement of the veraison and harvest phenological stages. This advance was not only evident compared to 2019 but also in comparison to the six-year average from 2014 to 2019 (Figure 7). Across the three sub-regions of the DDR, the advance for veraison varied from 6 to 8 days compared to the six-year average, while for harvest, it ranged from 9 to 15 days [35].

3.2. Impact of Biostimulants on Bioactive Compounds, Antioxidant Activity, and Gene Expression

It is well established that biostimulants can enhance vigor, plant yield, fruit quality, antioxidant capacity of plant tissues, nutrient uptake, and distribution within the plant, as well as bolster tolerance to biotic and abiotic stress [36,37]. Biostimulants contain elicitors which can induce the activation of enzymes involved in primary or secondary metabolism, leading to, for instance, an increase in the synthesis of phenolic compounds [17,38]. However, the limited information regarding the mode of action of the studied biostimulants, namely ANE and GB, and the mechanisms of grapevine responses to their application calls for further research. In this study, the effects of both extracts on grapevine were evaluated under field conditions. The concentration of bioactive compounds (total phenols, flavonoids and ortho-diphenols) and the AA (DPPH and FRAP) were found to be higher at the veraison stage compared to the harvest (Figure 5). The same trend was observed in the study of the relative gene expression of the genes PAL, CHS, F3H, MATE1, UFGT, ABCC1, and ANR. Veraison represents a critical phenological stage in red grape cultivars, initiating the accumulation of phenolic compounds and anthocyanins responsible for color development [23]. The application of ANE and GB increased the synthesis of anthocyanins and other phenolics in berries, indicating their potential as elicitors of secondary metabolism during the veraison.
The studied genes encode enzymes involved in key metabolic steps of the secondary metabolism (Figure 6). Phenylalanine ammonia lyase (PAL) initiates the phenylpropanoid pathway, crucial for the synthesis of important phenolics and flavonoids, including anthocyanins [5,39]. The biostimulants under study seemed to not affect this gene (Figure 6). Other important genes encode enzymes that serve as intermediates in the production of colorless anthocyanins, such as chalcone synthase (CHS), flavanone3-hydroxylase (F3H), and anthocyanidin reductase (ANR), responsible for the synthesis of proanthocyanidins, also referred to as condensed tannins [5,21,23,24]. The ANE treatment exhibited a more pronounced influence on these genes during veraison (ANE 0.1% - upregulated CHS and GST; ANE 0.05% - upregulated F3H and MATE1) (Figure 6), with a corresponding increase in flavonoids concentration observed with ANE 0.1% compared to the control (Figure 4B). At harvest, it was the GB 0.1% treatment that upregulated F3H (Figure 6), subsequently increasing the anthocyanins content (Figure 4D). These findings suggest that the studied biostimulants, ANE and GB, induce the flavone synthesis at the molecular level in cv. ‘Touriga Franca’. Similar outcomes were observed in grapevines with kaolin application, which upregulated the CHS gene and enhanced flavonoid and anthocyanin synthesis at maturity [5,21], as well as with chitosan, which upregulated the F3H gene [23]. UFGT mediates the limiting step towards anthocyanin biosynthesis and is associated with anthocyanins accumulation [23]. GB 0.1% upregulated UFGT during veraison (Figure 6), coinciding with an increase in anthocyanin content for this treatment (Figure 4D). Singh et al. [23], similarly, found an increase in anthocyanin content and upregulation of UFGT in treated vines of the cv. 'Tinto Cão' following foliar application of chitosan. At harvest, UFGT was upregulated by ANE 0.1% (Figure 6), leading to a higher concentration of anthocyanins in this treatment compared to the control grapevines (Figure 4D). Frioni et al. [8], similarly, observed an increase in total anthocyanins, phenolic concentration, and gene expression (UFGT, LDOX, GST, F3’H, F3’5’H, and DFR) through the foliar application of ANE. Anthocyanins are stored in the vacuole and are transported by anthocyanin transporter (ABCC1), tonoplast transporter (MATE1), and glutathione S-transferase (GST) [5,23]. The gene ABCC1 did not show significative differences (p > 0.05) (Figure 6), a finding consistent with the lack of significant changes observed for this gene in the grapevine cv. ‘Tinto Cão’ following chitosan application [23]. At harvest, GB 0.1% increased the expression of the key transporter gene GST, with this treatment revealing slightly higher concentrations of total phenolics, flavonoids, and ortho-diphenols, as well as significantly higher anthocyanins content (Figure 4). These results suggest a potential positive elicitation effect.
Environmental conditions significantly influence grapevine development and consequently, the quality of the berries [5,9]. Climate change scenarios are expected to accelerate berry ripening processes, potentially leading to imbalanced wines, particularly in red cultivars, with high alcoholic content and low polyphenolic contents [40]. Genes encoding enzymes involved in flavonoid biosynthesis respond differently to heat stress depending on the cultivar and whether these high temperatures occur during the day or at night [5]. Phenolic compounds in red grape play a vital role in the important properties of berries and wines, including flavor, color, and stability against oxidation processes. Anthocyanins and flavonols represent the most abundant polyphenol subclasses identified in grape berries [5,9]. The use of biostimulants, such as the seaweed extracts and glycine betaine employed in this study, can serve as a mitigation strategy for this issue, enhancing berry quality traits, bioactive compounds, and the upregulation of associated genes, thus improving antioxidant activity, as demonstrated in this study.

4. Materials and Methods

4.1. Plant material and sampling

Samples were obtained from Vitis vinifera cv. ‘Touriga Franca’, grafted on R110, in the growing season of 2020. The trial was installed in Cima Corgo (Upper Corgo) sub-region of the Douro Demarcated Region, Pinhão, Portugal (41°11'30.7"N 7°32'10.7"W, 170 m above sea level). Row and vine spacing was 2.50 m and0.80 m, respectively and vines were trained to unilateral Royat Cordon with vertical shoot positioning (VSP) in an East-southeast to West-northwest orientation. The vineyard was in rainfed conditions and grown using standard cultural practices of the region. Monthly temperature and precipitation values were recorded by a weather station located near to the experimental site and are shown in Figure 7.
Three vineyard rows were sprayed with the following treatments: A. nodosum (in the form of the seaweed-based extract SPRINTEX NEW® L, Biolchim, containing high concentration of naphthaleneacetic acid, amino acids and extract of A. nodosum) (ANE) at two concentrations (ANE 0.05% and ANE 0.1%); glycine betaine (Greenstim®, Massó Agro Department, containing (w/w) 12% of total N, 11.5% organic N, 56% organic C, and a relation C/N of 4.9, as a concentrate of glycine betaine extracted from sugar beet) (GB) at two concentrations (GB 0.1% and GB 0.2%) and control (C, water) (5 treatments x 10 plants x 3 replicates). All applications were mixed with a wetting agent (0.1%). SPRINTEX NEW® L and Greenstim® were commercialized according to the national legislation decree-law 103/2015 of June 15th. Currently, only Greenstim® is part of the list of non-harmonized fertilizing materials authorized for organic viticulture with registration valid until 2028 as requested by EU and national regulations (EU 2019/109 of June 5th and Ordinance 185/2022 of July 21st), respectively. Foliar applications were done during the morning covering the whole canopy, with a total of four foliar sprayings: at flowering (BBCH 65), pea size (BBCH 75), bunch closer (BBCH 77) and veraison (BBCH 81) [41]. At veraison and harvest, around 90 berries per treatment (divided in three replicates) were randomly sampled from the middle section of the bunches for quality analysis. For the bioactive compounds, antioxidant activity determinations, and gene expression analysis, three replicates of berries per treatment were sampled and immediately frozen in liquid nitrogen until conservation at -80 °C, and then lyophilized and converted to a fine dried powder (ground with liquid nitrogen) before the laboratorial analysis.

4.2. Quality Assessment of Fruit

To assess the impact of foliar treatments on the quality, 90 fresh berries were sampled at veraison and harvest stages, biometric parameters (berry weight and dimensions), color, total soluble solids, pH, and titratable acidity were determined. For biometric parameters, fruit weight (g) was determined using an electronic balance, and the height, width, and thickness (mm) measured using a digital caliper (0.01 mm sensitivity).
Using a colorimeter (CR-300, Minolta, Japan) the external fruit color was assessed in the same fruits at opposite sides of each fruit. The colorimetric coordinates, L*, a* and b* were used to calculate the chroma (C* = (a*2 + b*2)1/2). The colorimeter was calibrated using a standard white plate. The total soluble solids (TSS in °Brix) of berries juice were determined using a portable refractometer (PAL-1, ATAGO, Tokyo, Japan); the pH using a portable pH meter (Hanna instrument, USA); and the titratable acidity (gL−1 tartaric acid) by manual glass burette using 0.1 M NaOH to an endpoint of pH 8.1 in 10 mL of juice diluted in 10 mL distilled water. Finally, the maturity index (MI) was calculated according to Coombe et al. [42], using the formula: MI = TSS*pH2.

4.3. Determination of bioactive compounds

To assess the impact of foliar treatments on the bioactive compounds of berries, parameters such as, total phenolics, flavonoids, ortho-diphenols, total anthocyanins and antioxidant activity (ABTS•+, DPPH and FRAP) were determined.
To obtain the berries extracts, 40 mg of dry material were mixed with 950 µL of 70% (v/v) methanol in a vortex; then the mixture was submitted during 30 minutes to 70 °C and finally centrifuged at 13000 rpm, at 1 °C for 15 minutes. These extracts were stored at – 20 °C and used for the determination of the total phenolics, flavonoids, ortho-diphenols and in antioxidant activity (AA) assays.

4.3.1. Total phenolics

The total phenolics concentration were determined using the Folin–Ciocalteu colorimetric method at 765 nm according to Singleton and Rossi [43]. For that, 20 μL of extract were mixed with 100 μL of Folin–Ciocalteu reagent (1:10) and 80 μL of Na2CO3 (7.5%) in a 96 wells microplate. The microplate was maintained in the dark for 30 minutes and then the absorbance values were obtained at 765 nm. A gallic acid calibration curve was used, and the results were expressed as mg of gallic acid equivalents per g of dry weight (mg GAE g-1 of DW).

4.3.2. Flavonoids

According to the colorimetric method of Dewanto et al. [44], flavonoids concentration was determined at Abs. 510 nm. In a 96 wells microplate was added 100 μL of ddH2O, 10 μL of NaNO2 (5%) and 25 μL of extract. The plate was placed in the dark at room temperature for 5 minutes; then, 15 µL of AlCl3 (10%) were added to each well and the plate was placed again in the dark for 6 minutes. Finally, 50 μL of NaOH (1M) and 50 μL of ddH2O were added and the absorbance was read. Using a calibration curve prepared with catechin, the results were expressed as mg of catechin equivalents per g of dry weight (mg CE g-1 of DW).

4.3.3. Ortho-diphenols

The ortho-diphenols were quantified according to Gouvinhas et al. [45] and Leal et al. [46] using a colorimetrically method at Abs370 nm. For that, in a 96 wells microplate, 160 μL of extract were mixed with 40 μL of sodium molybdate (5% w/v) and the plate was placed in the dark for 15 minutes. A calibration curve prepared with gallic acid was used and the results were expressed as mg of gallic acid equivalents per g of dry weight (mg GAE g-1 of DW).

4.3.4. Total anthocyanins

The total monomeric anthocyanins (TMA) content was determined according to Lee et al. [47], Meng et al. [48] and Ali Shehat et al. [49]. For the extracts preparation, 5 mL of methanol acidified with 1% HCl were mixed in a vortex with 50 mg of berries. The mixture placed in the dark for 1 hour at 4 °C and after that was centrifuged at 4000 rpm for 15 minutes at 4 °C and the supernatant was collected. In a microplate, a mixture of 50 μL of extract plus 250 μL of 0.025 M KCl (pH = 1.0) or 50 μL of extract plus 250 μL of 0.4 M sodium acetate buffer (pH = 4.5) was pipetted into two different wells. Lastly, absorbances were read at 510 and 700 nm. The concentration of total monomeric anthocyanins was expressed as mg of cyanidin-3-O-glucoside equivalents per g of dry weight (mg CGE g-1 of DW), according to the following formula: TMA = (A*DF*MW)/(ɛ*C). Where, MW is the molecular weight of cyanidin-3-O-glucoside (449 g/mol); DF is the dilution factor; ε is the molar extinction coefficient of cyanidin-3-O-glucoside (29.600); C is the concentration of extracted volume and A = (A510 – A700)pH1.0 – (A510 – A700)pH4.5.

4.4. Antioxidant activity assays

4.4.1. ABTS•+ radical-scavenging activity

The discoloration assay ABTS•+ (2,2’-azino-bis (3-ethylbenzothiazoline-6-sulphonic acid)), was used to determine the radical-scavenging activity of berries extracts according to Re et al. [50] and Stratil et al. [51]. To prepare the ABTS•+ work solution, were used 7 mM ABTS and 140 mM K2S2O8 in double distilled water. The mixture was incubated for 12–16 hours at room temperature, in the dark, and then its absorbance adjusted to 0.7-0.8 with absolute ethanol in a wavelength of 734 nm. Then 15 µL of extract (or 70% methanol to measure the blank) plus 285 µL of the ABTS•+ work solution was mixed and put in the dark for 10 minutes, and finally the absorbance was read at 734 nm. Using a Trolox calibration curve the results were expressed as µmol Trolox µg-1 of DW.

4.4.2. DPPH radical-scavenging activity

The radical-scavenging activity assay was carried out according to Brand-Williams et al. [52], Sánchez-Moreno et al. [53] and Siddhraju and Becker [54]. Combining 285 µL methanolic solution containing DPPH (2,2-diphenyl-1-picrylhydrazyl) radicals (10-5 mol/L) with 15 µL of extract. The mixture was vigorously shaken and left to stand in the dark for 30 minutes. The reduction of the DPPH radical was detected by measuring samples absorbance at 517 nm. The blank was made with 15 µL of 70% methanol and 285 µL of methanolic solution containing DPPH radicals. Using a Trolox calibration curve the results were expressed as µmol Trolox µg-1 of DW.

4.4.3. FRAP assay

A modification of the FRAP (Ferric Reducing Antioxidant Power) assay was a modification of methods of Benzie and Strain [55] and Stratil et al. [51]. The FRAP reagent was prepared using 1 volume of an aqueous 10 mM solution of TPTZ (2,4,6-Tri(2-pyridyl)-s-triazine) in 40 mM HCl mixed with the 1 volume of 20 mM FeCl3.6H2O and 10 volumes of 300 mM acetate buffer, pH 3.6. Then, 25 µL of extract were mixed with 275 µL of FRAP reagent. The mixture was vigorously shaken and left to stand for 5 minutes in the dark and the absorbance at 593 nm was recorded. The blank was made with 25 µL of 70% methanol and 275 µL of FRAP reagent. Using a Trolox calibration curve the results were expressed as µmol Trolox µg-1 of DW.

4.5. Total RNA Extraction, cDNA Synthesis and Quantitative Real-Time PCR

To investigate the impact of the tested biostimulants on the secondary metabolism, the expression of several target genes (Table 1) encoding key enzymes involved in flavonoid biosynthesis and transport was analyzed. For that we performed the extraction of total RNA from 100 mg of berry tissue using Spectrum Plant Total RNA kit (Sigma-Aldrich, Darmstadt, Germany), and following the manufacturer protocol. Quantity and quality of RNA were checked using a Nanodrop 2000 spectrophotometer (Thermo Scientific, Fremont, CA, USA) and 1% agarose gel electrophoresis stained with Midori Green Advance ® (Nippon Genetics, Düren, Germany). Per each sample, total RNA reverse transcription was performed using 500 ng of RNA, SuperScript® IV Reverse Transcriptase (Thermo Fisher Scientific, Waltham, MA USA), and a 1:1 mix of random primers and 50 µM oligo(dT)20 primers (Thermo Fisher Scientific, Waltham, MA USA), according to the manufacturer’s instructions. The differential gene expression of eight (PAL, CHS, F3H, ANR, UFGT, ABCC1, MATE1, and GST) genes involved in the secondary metabolism was carried out by real-time RT-PCR (Table 1). Real-time RT-PCR was carried out on a Quant Studio 3 Real-Time PCR Systems (Thermo Fisher). Each reaction contained 500 nM of each primer, 4 µL of cDNA (1:10 dilution of the synthesis reaction), 10 µl of PowerUpTM SYBRTM Green Master Mix (Thermo Fisher, Waltham, MA USA) and water up to 20 µL. Each reaction was performed in triplicate. Applied thermal cycling conditions were: hold stage at 50 °C for 2 minutes and 95 °C for 10 minutes, followed by 50 cycles: 95 °C for 20 s, 57 °C for 45 s and 72 °C for 30 s. Finally, a melting curve stage at 95 °C for 15 s and 57 °C for 1 minute and 95 °C for 1 s, to detect non-specific amplification in cDNA samples. Gene transcripts were quantified upon normalization to the reference gene ubiquitin (UBI) [56] by comparing the threshold cycle (Ct) of each target gene with UBI Ct. The relative quantification per each gene was calculated according to the 2-ΔΔCt method, where ΔCt is the difference in threshold cycle between the average mean of the target and reference gene (UBI) and ΔΔCt is the difference between the average ΔCt of the target and control samples [57].

4.6. Statistical analysis

Data were analyzed using SPSS Statistics for Windows (IBM SPSS Statistics for Windows, Version 23.0. Armonk, NY: IBM Corp). The results were presented as the mean (n = 90 for quality assessment of fruits or n=3 for the determination of bioactive compounds, AA, and relative gene expression) with the standard error (SE). Statistical differences between treatments in each phenological stage, were evaluated by one-way ANOVA, followed by Tukey’s multiple range test at (p < 0.05). One- and two-way ANOVA establishing phenological stage effects on control and treated grapevines was also performed. Pearson’s correlation analysis was used to determine the relationship between bioactive compound contents and antioxidant activity values.

5. Conclusions

The implications of climate change scenarios will profoundly impact grapevine development and the quality of berries and wine. Phenolic compounds, particularly anthocyanins, play a critical role in red grape cultivars, like cv. 'Touriga Franca,' which are extensively utilized in top wine production in DDR. The application of the tested biostimulants, namely A. nodosum extract and glycine betaine, led to notable enhancements in various biochemical parameters. This enhancement included increased concentrations of total phenols, flavonoids, ortho-diphenols, and anthocyanins, alongside heightened expression levels of key genes involved in the secondary metabolism, such as CHS, F3H, UFGT, MATE1, and GST. The foliar application of both biostimulants significantly improved the performance of V. vinifera by positively affecting physiological parameters and influencing secondary metabolism through elicitation, ultimately resulting in an improved grape quality. Further studies focusing on formulations combining ANE and GB will provide valuable insights into the combined effects of these biostimulants on grape quality.

Author Contributions

Conceptualization: E.M., I.C. (Isabel Cortez), I.C. (Isaura Castro), and B.G.; Investigation: E.M., G.D.L., V.R., M.B., S.P., S.C., H.F., and F.A.; Writing—original draft: E.M.; Writing—review and editing: E.M., G.L., V.R., M.B., S.P., S.C., H.F., I.C. (Isabel Cortez), I.C. (Isaura Castro), and B.G.; Supervision: G.D.L., I.C. (Isabel Cortez), I.C. (Isaura Castro), and B.G. All authors have read and agreed to the published version of the manuscript.

Funding

Please add: This research was funded by the European Regional Development Fund through the INTERREG Atlantic Area Program, under the project NASPA—Natural fungicides against air and soil borne pathogens in the Atlantic Area (EAPA-451/2016).

Institutional Review Board Statement

Not applicable.

Data Availability Statement

Data is contained within the article.

Acknowledgments

The author Eliana Monteiro acknowledges the financial support provided by the Portuguese Foundation for Science and Technology (FCT) (UI/BD/150730/2020) under the Doctoral Program “Agricultural Production Chains—from fork to farm” (PD/00122/2012). The authors acknowledge the support of National Funds by FCT, under the project UIDB/04033/2020. Thanks, are also given to ADVID-Association for the Development of Douro Viticulture for sharing meteorogical data.

Conflicts of Interest

The authors declare no conflicts of interest.

References

  1. OIV. State of the World Vine and Wine Sector 2022. Organization of Vine and Wine: Dijon, France, 2023.
  2. IVV. Regiões; Instituto da Vinha e do Vinho, I.P.: Lisboa 2023. Available online: https://www.ivv.gov.pt/np4/regioes/ (accessed on 9 June 2023).
  3. Fraga H, De Cortázar Atauri IG, Malheiro AC, Moutinho-Pereira J, Santos JA. Viticulture in Portugal: A Review of Recent Trends and Climate Change Projections. OENOOne 2017;51:61–9. [CrossRef]
  4. Mateus N, Machado JM, De Freitas V. Development changes of anthocyanins in Vitis vinifera grapes grown in the Douro Valley and concentration in respective wines. J Sci Food Agric 2002;82:1689–95. [CrossRef]
  5. Conde A, Pimentel D, Neves A, Dinis L-T, Bernardo S, Correia CM, et al. Kaolin foliar application has a stimulatory effect on phenylpropanoid and flavonoid pathways in grape berries. Front Plant Sci 2016;7:1–14. [CrossRef]
  6. Fonseca A, Fraga H, Santos JA. Exposure of Portuguese viticulture to weather extremes under climate change. Clim Serv 2023;30. [CrossRef]
  7. Frioni T, Sabbatini P, Tombesi S, Norrie J, Poni S, Gatti M, et al. Effects of a biostimulant derived from the brown seaweed Ascophyllum nodosum on ripening dynamics and fruit quality of grapevines. Sci Hortic (Amsterdam) 2018;232:97–106. [CrossRef]
  8. Frioni T, Tombesi S, Quaglia M, Calderini O, Moretti C, Poni S, et al. Metabolic and transcriptional changes associated with the use of Ascophyllum nodosum extracts as tools to improve the quality of wine grapes (Vitis vinifera cv. Sangiovese) and their tolerance to biotic stress. J Sci Food Agric 2019;99:6350–63. [CrossRef]
  9. Salvi L, Brunetti C, Cataldo E, Niccolai A, Centritto M, Ferrini F, et al. Effects of Ascophyllum nodosum extract on Vitis vinifera: consequences on plant physiology, grape quality and secondary metabolism. Plant Physiol Biochem 2019;139:21–32. [CrossRef]
  10. Taskos D, Stamatiadis S, Yvin JC, Jamois F. Effects of an Ascophyllum nodosum (L.) Le Jol. extract on grapevine yield and berry composition of a Merlot vineyard. Sci Hortic (Amsterdam) 2019;250:27–32. [CrossRef]
  11. Baltazar M, Correia S, Guinan KJ, Sujeeth N, Bragança R, Gonçalves B. Recent advances in the molecular effects of biostimulants in plants: An overview. Biomolecules 2021;11. [CrossRef]
  12. Monteiro E, Gonçalves B, Cortez I, Castro I. The role of biostimulants as alleviators of biotic and abiotic stresses in grapevine: A review. Plants 2022;11:396. [CrossRef]
  13. Hussain Wani S, Brajendra Singh N, Haribhushan A, Iqbal Mir J. Compatible solute engineering in plants for abiotic stress tolerance - Role of glycine betaine. Curr Genomics 2013;14:157–65. [CrossRef]
  14. Dutta T, Neelapu NRR, Wani SH, Challa S. Compatible solute engineering of crop plants for improved tolerance toward abiotic stresses. In: Biochem. Physiol. Mol. Ave. Combat. Abiotic Stress Toler. Plants, Wani, S.H., Ed.; Elsevier Inc.: Amsterdam, The Netherlands, 2018, p. 221–254. [CrossRef]
  15. Denaxa N-K, Tsafouros A, Ntanos E, Roussos PA. Role of glycine betaine in the protection of plants against environmental stresses. Plant Stress Mitigators 2023:127–58. [CrossRef]
  16. Le Mire G, Nguyen ML, Fassotte B, Du Jardin P, Verheggen F, Delaplace P, et al. Implementing plant biostimulants and biocontrol strategies in the agroecological management of cultivated ecosystems. A review. Biotechnol Agron Soc Environ 2016;20:299–313. [CrossRef]
  17. Gutiérrez-Gamboa G, Romanazzi G, Garde-Cerdán T, Pérez-Álvarez EP. A review of the use of biostimulants in the vineyard for improved grape and wine quality: effects on prevention of grapevine diseases. J Sci Food Agric 2019;99:1001–9. [CrossRef]
  18. Bulgari R, Cocetta G, Trivellini A, Vernieri P, Ferrante A. Biostimulants and Crop Responses: A review. Biol Agric Hortic 2015;31:1–17. [CrossRef]
  19. Dinis LT, Bernardo S, Conde A, Pimentel D, Ferreira H, Félix L, et al. Kaolin exogenous application boosts antioxidant capacity and phenolic content in berries and leaves of grapevine under summer stress. J Plant Physiol 2016;191:45–53. [CrossRef]
  20. Aziz A, Poinssot B, Daire X, Adrian M, Bézier A, Lambert B, et al. Laminarin elicits defense responses in grapevine and induces protection against Botrytis cinerea and Plasmopara viticola. Mol Plant-Microbe Interact 2003;16:1118–28. [CrossRef]
  21. Ferrandino A, Lovisolo C. Abiotic stress effects on grapevine (Vitis vinifera L.): Focus on abscisic acid-mediated consequences on secondary metabolism and berry quality. Environ Exp Bot 2014;103:138–47. [CrossRef]
  22. Koyama R, Roberto SR, de Souza RT, Borges WFS, Anderson M, Waterhouse AL, et al. Exogenous Abscisic Acid Promotes Anthocyanin Biosynthesis and Increased Expression of Flavonoid Synthesis Genes in Vitis vinifera × Vitis labrusca Table Grapes in a Subtropical Region. Front Plant Sci 2018;9:1–12. [CrossRef]
  23. Singh RK, Martins V, Soares B, Castro I, Falco V. Chitosan application in vineyards (Vitis vinifera L. cv. Tinto Cão) induces accumulation of anthocyanins and other phenolics in berries, mediated by modifications in the transcription of secondary metabolism genes. Int J Mol Sci 2020;21:306. [CrossRef]
  24. Robinson SP, Bogs J, McDavid DAJ, Hooper LC, Speirs J, Walker AR. Transgenic grapevines with decreased expression of tannin synthesis genes have altered grape and wine flavonoid composition. Aust J Grape Wine Res 2021;27:106–17. [CrossRef]
  25. Adak N. Effects of glycine betaine concentrations on the agronomic characteristics of strawberry grown under deficit irrigation conditions. Appl Ecol Environ Res 2019;17:3753–67. [CrossRef]
  26. Correia S, Queirós F, Ribeiro C, Vilela A, Aires A, Barros AI, et al. Effects of calcium and growth regulators on sweet cherry (Prunus avium L.) quality and sensory attributes at harvest. Sci Hortic (Amsterdam) 2019;248:231–40. [CrossRef]
  27. Iqbal N, Ashraf MY, Ashraf M. Influence of water stress and exogenous glycine betaine on sunflower achene weight and oil percentage. Int J Environ Sci Technol 2005;2:155–60. [CrossRef]
  28. Metwaly E-SE, Al-Yasi HM, Ali EF, Farouk HA, Farouk S. Deteriorating harmful effects of drought in cucumber by spraying glycine betaine. Agriculture 2022;12:2166. [CrossRef]
  29. Taskin S, Ertan E. Exogenous Applications of kaolin and glycine betaine increased the yield and quality of olive fruit and olive oil. Erwerbs-Obstbau 2022. [CrossRef]
  30. Gonçalves B, Morais M, Sequeira A, Ribeiro C, Guedes F, Silva A, et al. Quality preservation of sweet cherry cv. “Staccato” by using glycine-betaine or Ascophyllum nodosum. Food Chem 2020. [CrossRef]
  31. Monteiro E, Baltazar M, Pereira S, Correia S, Ferreira H, Alves F, et al. Ascophyllum nodosum Extract and Glycine Betaine Preharvest Application in Grapevine: Enhancement of Berry Quality, Phytochemical Content and Antioxidant Properties. Antioxidants 2023;12:1835. [CrossRef]
  32. Campbell J, Sarkhosh A, Habibi F, Gajjar P, Ismail A, Tsolova V, et al. Evaluation of biochemical juice attributes and color-related traits in muscadine grape population. Foods 2021;10:1101. [CrossRef]
  33. Borghezan M. Formation and ripening of grape and effects on the wines: Review. Ciência e Técnica Vitivinícola 2017;32:126–41. [CrossRef]
  34. Rätsep R, Karp K, Vool E. Yield maturity parameters of hybrid grap Evine (Vitis Sp.) cultivar “Zilga.” Res. Rural Dev., vol. 1, 2014, p. 44–50.
  35. ADVID. Boletim Ano Vitícola 2020; ADVID: Vila Real, 2020. Available online: www.advid.pt (accessed on 14 June 2023).
  36. Parađiković N, Teklić T, Zeljković S, Lisjak M, Špoljarević M. Biostimulants research in some horticultural plant species—A review. Food Energy Secur 2019;8:1–17. [CrossRef]
  37. Bulgari R, Franzoni G, Ferrante A. biostimulants application in horticultural crops under abiotic stress conditions. Agronomy 2019;9:306. [CrossRef]
  38. Delaunois B, Farace G, Jeandet P, Clément C, Baillieul F, Dorey S, et al. Elicitors as alternative strategy to pesticides in grapevine? Current knowledge on their mode of action from controlled conditions to vineyard. Environ Sci Pollut Res 2014;21:4837–46. [CrossRef]
  39. Arakawa O. Photoregulation of anthocyanin synthesis in apple fruit under UV-B and red light. Plant Cell Physiol 1988:1385–1389.
  40. Mosedale JR, Abernethy KE, Smart RE, Wilson RJ, Maclean I. Climate change impacts and adaptive strategies: lessons from the grapevine. Glob Chang Biol 2016:3814–3828. [CrossRef]
  41. Lorenz DH, Eichhorn KW, Bleiholder H, Klose R, Meier U, Weber E. Growth stages of the grapevine: phenological growth stages of the grapevine (Vitis vinifera L. ssp. vinifera)—Codes and descriptions according to the extended BBCH scale. Aust J Grape Wine Res 1995;1:100–3. [CrossRef]
  42. Coombe BG, Dundon RJ, Short AWS. Indices of sugar—acidity as ripeness criteria for winegrapes. J Sci Food Agric 1980;31:495–502. [CrossRef]
  43. Singleton V, Rossi J. Colorometry of total phenolics with phosphomolybdic-phosphotungstic acid reagents. Am J Enol Vitic 1965:144–58.
  44. Dewanto V, Wu X, Adom KK, Liu RH. Thermal processing enhances the nutritional value of tomatoes by increasing total antioxidant activity. J Agric Food Chem 2002:3010–4. [CrossRef]
  45. Gouvinhas I, De Almeida JM, Carvalho T, Machado N, Barros A. Discrimination and characterisation of extra virgin olive oils from three cultivars in different maturation stages using Fourier transform infrared spectroscopy in tandem with chemometrics. Food Chem 2015;174:226–32. [CrossRef]
  46. Leal C, Costa CM, Barros A, Gouvinhas I. Assessing the relationship between the phenolic content and elemental composition of grape (Vitis vinifera L.) stems. Waste and Biomass Valorization 2021;12:1313–25. [CrossRef]
  47. Lee J, Durst RW, Wrolstad RE, Eisele T, Giusti MM, Haché J, et al. Determination of total monomeric anthocyanin pigment content of fruit juices, beverages, natural colorants, and wines by the pH differential method: collaborative study. J AOAC Int 2005;88:1269–78. [CrossRef]
  48. Meng J-F, Fang Y-L, Qin M-Y, Zhuang X-F, Zhang Z-W. Varietal differences among the phenolic profiles and antioxidant properties of four cultivars of spine grape (Vitis davidii Foex) in Chongyi County (China). Food Chem 2012;134:2049–56. [CrossRef]
  49. Ali Shehat W, Sohail Akh M, Alam T. Extraction and estimation of anthocyanin content and antioxidant activity of some common fruits. Trends Appl Sci Res 2020;15:179–86. [CrossRef]
  50. Re R, Pellegrini N, Proteggente A, Pannala A, Yang M, Rice-Evans C. Antioxidant activity applying an improved ABTS radical cation decolorization assay. Free Radic Biol Med 1999;26:1231–7. [CrossRef]
  51. Stratil P, Klejdus B, Kubáň V. Determination of total content of phenolic compounds and their antioxidant activity in vegetables evaluation of spectrophotometric methods. J Agric Food Chem 2006;54:607–16. [CrossRef]
  52. Brand-Williams W, Cuvelier ME, Berset C. Use of a free radical method to evaluate antioxidant activity. LWT - Food Sci Technol 1995;28:25–30. [CrossRef]
  53. Sánchez-Moreno C, Larrauri J, Saura-Calixto F. A procedure to measure the antiradical efficiency of polyphenols. J Sci Food Agric 1998:270–6. [CrossRef]
  54. Siddhraju P, Becker K. Antioxidant properties of various solvents extracts of total phenolic constituents from three different agroclimatic origins of drumstick tree (Moringa oleifera Lam) leaves. J Agric Food Chem 2003:2144–55. [CrossRef]
  55. Benzie IFF, Strain JJ. The Ferric reducing ability of plasma (FRAP) as a measure of “antioxidant power”: The FRAP assay. Anal Biochem 1996;239:70–6. [CrossRef]
  56. Fujita A, Soma N, Goto-Yamamoto N, Mizuno A, Kiso K, Hashizume K. Effect of shading on proanthocyanidin biosynthesis in the grape berry. J Japanese Soc Hortic Sci 2007;76:112–9. [CrossRef]
  57. Livak KJ, Schmittgen TD. Analysis of relative gene expression data using real-time quantitative PCR and the 2(-Delta Delta C(T)) Method. Methods. 2001; 25(4):402-8. [CrossRef] [PubMed]
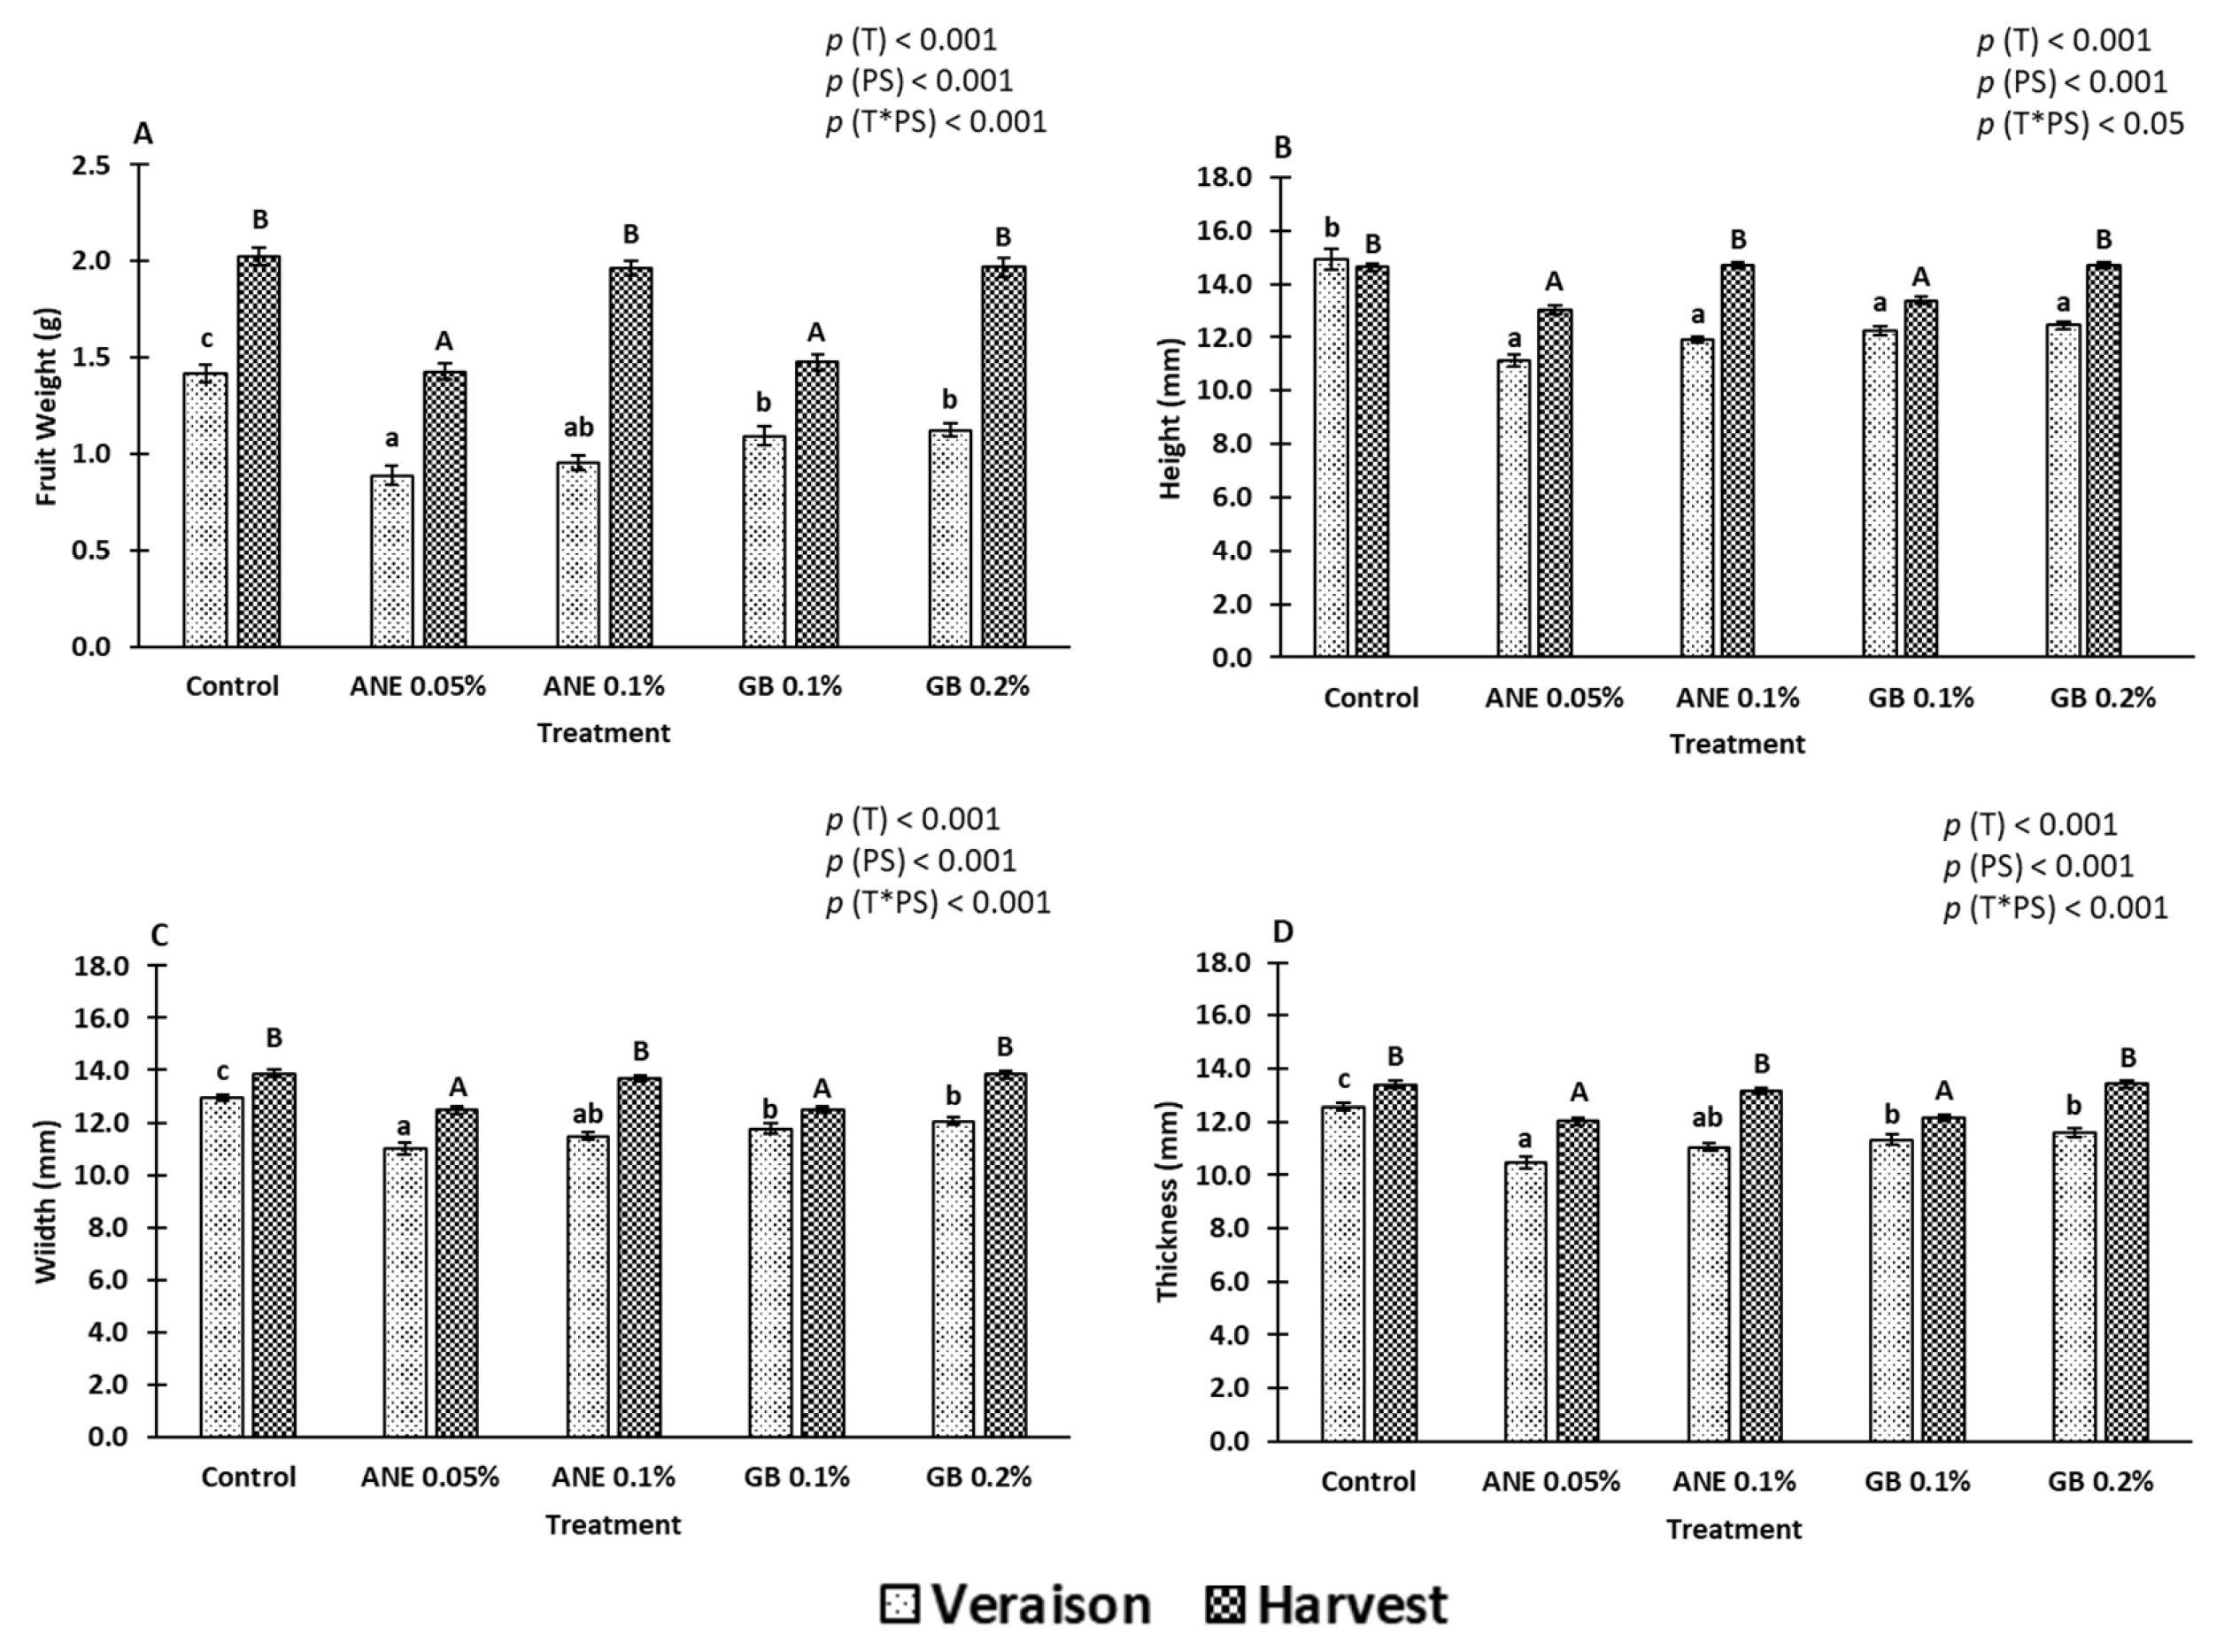
Figure 1. Biometric parameters: weight (1A), height (1B), width (1C), and thickness (1C) of berries of cv. ‘Touriga Franca’, under different treatments at veraison and harvest. Values are means ± SE; different letters mean significant differences (p < 0.05, Tukey’s test) between treatments within each phenological stage (lowercase - veraison, uppercase - harvest). ANE – seaweed extract; GB – glycine betaine; T – Treatment; PS – Phenological Stage.
Preprints 90592 g001
Figure 2. Chroma (C*) of berries of cv. ‘Touriga Franca’ under different treatments at veraison and harvest. Values are means ± SE; different letters mean significant differences, (p < 0.05, Tukey’s test) between treatments within each phenological stage (lowercase - veraison, uppercase - harvest). ANE – seaweed extract; GB – glycine betaine; T – Treatment; PS – Phenological Stage.
Preprints 90592 g002
Figure 3. Titratable acidity (TA) (3A) and Maturity Index (MI) (°Brix*pH2) (3B) of berries of cv. ‘Touriga Franca’, under different treatments at veraison and harvest. Values are means ± SE; no letters indicate non-significant differences (p < 0.05, Tukey’s test) between treatments within each phenological stage. ANE – seaweed extract; GB – glycine betaine; T – Treatment; PS – Phenological Stage.
Preprints 90592 g003
Figure 4. Variation in the content of bioactive compounds: total phenolics (A), flavonoids (B), ortho-diphenols (C), and total anthocyanins (D), in berries of cv. ‘Touriga Franca’ under different treatments at veraison and harvest. Values are means ± SE; different letters mean significant differences, (p < 0.05, Tukey’s test) between treatments within each phenological stage (lowercase - veraison, uppercase - harvest), no letters mean no significant differences. ANE – seaweed extract; GB – glycine betaine; T – Treatment; PS – Phenological Stage.
Preprints 90592 g004
Figure 5. Antioxidant activity (AA): DPPH radical-scavenging activity (A), FRAP assay (B), and ABTS•+ radical-scavenging activity (C) in berries of cv. ‘Touriga Franca’, under different treatments at veraison and harvest. Values are means ± SE; different letters mean significant differences, (p < 0.05, Tukey’s test) between treatments within each phenological stage (lowercase - veraison, uppercase - harvest), no letters mean no significant differences. ANE – seaweed extract; GB – glycine betaine; T – Treatment; PS – Phenological Stage.
Preprints 90592 g005
Figure 6. Relative gene expression in berries of cv. ‘Touriga Franca’, under different treatments at veraison and harvest. Values are means ± SE; different letters mean significant differences, (p < 0.05, Tukey’s test) between treatments within each phenological stage (lowercase - veraison, uppercase - harvest), no letters mean no significant differences. ANE– seaweed extract; GB – glycine betaine; T – Treatment; PS – Phenological Stage; PALPhenylalanine ammonia-lyase; CHS - Chalcone synthase; F3HFlavanone 3-hydroxylase; MATE1 - Tonoplast transporter; UFGTUDP glucose: flavonoid 3-O-glucosyltransferase; ABCC1Anthocyanin transporter; ANRAnthocyanidin reductase; GSTGlutathione S-transferase.
Preprints 90592 g006
Figure 7. Monthly mean climatic conditions occurred during growing season in the vineyard Quinta do Bomfim in the Cima Corgo sub-region. Precipitation (mm); Maximum temperature—Tmax (◦C); Minimum temperature—Tmin (◦C) and Mean temperature—Tmed (◦C).
Preprints 90592 g007
Table 1. Primer sequences, and annealing temperatures for the genes analyzed.
Gene Primer sequence Annealing temperature Reference
PAL Phenylalanine ammonia-lyase F 5’ CCTACTGTTCAGAGCTCCAG 3’
R 5’ GCCACTAGGTATGTGGTAGACA 3’
57 °C [23]
CHS Chalcone synthase F 5’ CACTCTTCGAACTCGTCTCT 3’
R 5’ CCACCAAGCTCTTCTCTATG 3’
57 °C [23]
F3H Flavanone3-hydroxylase F 5’ CAGTGCAAGACTGGCGCGAGATCGTA 3’
R 5’ TAGCCTCAGACAACACCTCCAGCAACT 3’
57 °C [23]
ANR Anthocyanidin reductase F 5’ CTGTCAGGTTCAGTCTCCAT 3’
R 5’ GTTGGGACTTTGTACTGAGG 3’
57 °C [23]
UFGT UDP glucose: flavonoid 3-O-glucosyl transferase F 5’ TGCAGGGCCTAACTCACTCT 3’
R 5’ GCAGTCGCCTTAGGTAGCAC 3’
57 °C [23]
ABCC1 Anthocyanin transporter F 5’ CTCCACTGGTCCTCTGCTTC 3’
R 5’ AGCCTGCTTCGAAAGTACCA 3’
57 °C [23]
MATE1 Tonoplast transporter F 5’ TGCTTTTGTGATTTTGTTAGAGG 3’
R 5’ CCCTTCCCCGATTGAGAGTA 3’
57 °C [23]
GST GlutathioneS-transferase F 5’ AAGGATCCATGGTGATGAAGGTGTATGGC 3’
R 5’ AACTGCAGAAGCCAACCAACCAACAAAC 3’
57 °C [23]
UBI Ubiquitin F 5' TCTGAGGCTTCGTGGTGGTA 3’
R 5' AGGCGTGCATAACATTTGCG 3’
57 °C [57]
Disclaimer/Publisher’s Note: The statements, opinions and data contained in all publications are solely those of the individual author(s) and contributor(s) and not of MDPI and/or the editor(s). MDPI and/or the editor(s) disclaim responsibility for any injury to people or property resulting from any ideas, methods, instructions or products referred to in the content.
Copyright: This open access article is published under a Creative Commons CC BY 4.0 license, which permit the free download, distribution, and reuse, provided that the author and preprint are cited in any reuse.
Prerpints.org logo

Preprints.org is a free preprint server supported by MDPI in Basel, Switzerland.

Subscribe

© 2024 MDPI (Basel, Switzerland) unless otherwise stated