INTRODUCTION
Nanoparticles can be employed in antimicrobial agents, the textile industry, water treatment, sunscreen lotions. The capacity of silver nanoparticles to emit silver ions, which can harm bacterial and fungal cell membranes, proteins, and DNA, is thought to be the basis for their antibacterial activity. Silver nanoparticles' toxicity and safety, however, are still being studied, and it is important to carefully consider how they can affect the environment and human health. Silver atoms (Ag) are created because of the reduction of Ag+ ions, which is followed by their aggregation into oligomeric clusters. Colloidal AgNPs are eventually created because of these clusters. When the colloidal particles are substantially smaller than the wavelength of visible light, the solution exhibits a unique yellow hue with an intense band in the 380–430 nm region and several mild bands at higher wavelength in the UV–visible absorption spectrum (Nazeruddin et al., 2014).
Medicinal herb milk thistle (Silybum marianum L. Gaernt.), often known as untamed artichoke, has been utilized as a treatment for several conditions (Rainone, 2005). The Asteraceae family plant milk thistle blooms from July to August and has reddish-purple flowers. Milk thistle can reach heights of 3 m and a width of 1 m, and thrives in warm, dry soil. However, it often grows to a height of 0.9 to 1.8 meters. Southern Europe, Southern Russia, Asia Minor, and Northern Africa are where milk thistle originated. It has been grown in North and South America as well as South Australia. (Abenavoli et al., 2010). The spiny leaves of the milk thistle are dark and light green, patterned, and up to 75 cm long and 30 cm wide. They are smooth on the upper side with visible trichomes on the lower surface.
The common name Silybum marianum originated from the milky-white veins on the leaves. Silybum marianum has been utilized by herbalists and physicians to treat a variety of gallbladder and liver diseases since the dawn of medicine. Silybum marianum was also found to be effective in Ayurvedic medicine for the cure of liver and gallbladder diseases. (Abenavoli et al., 2010). In the 1970s, the WHO categorized silymarin, an extract of milk thistle fruits, as an approved drug with hepatoprotective characteristics (Wesolowska et al., 2007) also possessing anti-cancer, antidepressant, cardioprotective, hepatoprotective, immunostimulant, and neuroprotective properties (Post-White et al., 2007). This plant is crucial for endocrine function (Velussi et al., 1997). The phytoconstituents flavonoids, saponins, glycoside, alkaloids, terpenes, steroids, anthraquinones, phenols, and tannins are found in Silybum marianum (Shah et al., 2011), amino acids, saponins, sugars (John and Koperuncholan, 2012) flavonoids, alkaloids, sugars, steroids, and tannins (Lahlah et al., 2012).
MATERIALS AND METHODS
Collection of Plant Material
The fresh leaves of Silybum marianum were collected by Immaculata Amarachi Unegbu on 20th January 2023 by 02:20pm at Cyprus International University (CIU), close to the rectorate building, Haspolat, Nicosia Turkish Republic of Northern Cyprus and was authenticated via taxonomic method by a pharmacognosist, Asst. Prof. Dr. Emmanuel Mshelia Halilu. Voucher specimen with number CIU/PHARM/ASTER/001 of the sample was prepared and stored at the Herbarium of the pharmacognosy/pharmaceutical botany department of CIU for future reference.
Plant Extraction
The leaves were thoroughly washed three to four times with water (to clean the surface of dirt), rinsed with distilled water and shade-dried at room temperature (28 ± 2°C) on filter paper for 12 days. The air-dried leaves were reduced to fine powder using the laboratory ball mill. The total quantity of powder sample was measured using a weighing balance. The powder was kept for future use in a sealed bottle.
Phytochemical Screening
Phytochemical analysis of Silybum marianum extracts were carried out using the established procedures to identify the presence of saponins, tannins, flavonoids, alkaloids, terpenoids, steroids, cardiac glycoside, anthraquinones, quinones, coumarins, phlobatannins, anthocyanins and cyanogenetic glycoside (Halilu et al., 2008).
Fractionation of Plant Extract for Thin Layer Chromatography
Methanol: Water solution (120:30 mL ratio) was used to soak 19 g of plant material for 98 hours. The sample was then rinsed with 240:60 mL methanol/water and evaporated using a rotary evaporator under decreased pressure for 30 minutes at a vapor temperature of 33°C and water bath temperature of 50°C. A separating funnel was used to partition 88 mL of the water plant extract, starting with non-polar solvents n-Hexane (350 mL), petroleum ether (200 mL), semi polar, chloroform (150 mL), and ethyl acetate (250 mL), and ending with polar solvents, n-Butanol (100 mL). The desired mixes were created when the solvents were completely evaporated using the rotary evaporator and dried in the oven, this is done to remove the methanol from the extract. Using thin layer chromatography, the fractions were separated.
Preparation of silver nitrate solution
The botanical extract was infused into a solution of silver nitrate with a 5 Mm concentration to create silver nanoparticles. From 0.432 g of silver nitrate, a solution with a 5 Mm concentration of silver nitrate was obtained (AgNO3).
Preparation of Nanoparticle from the Aqeous Extract
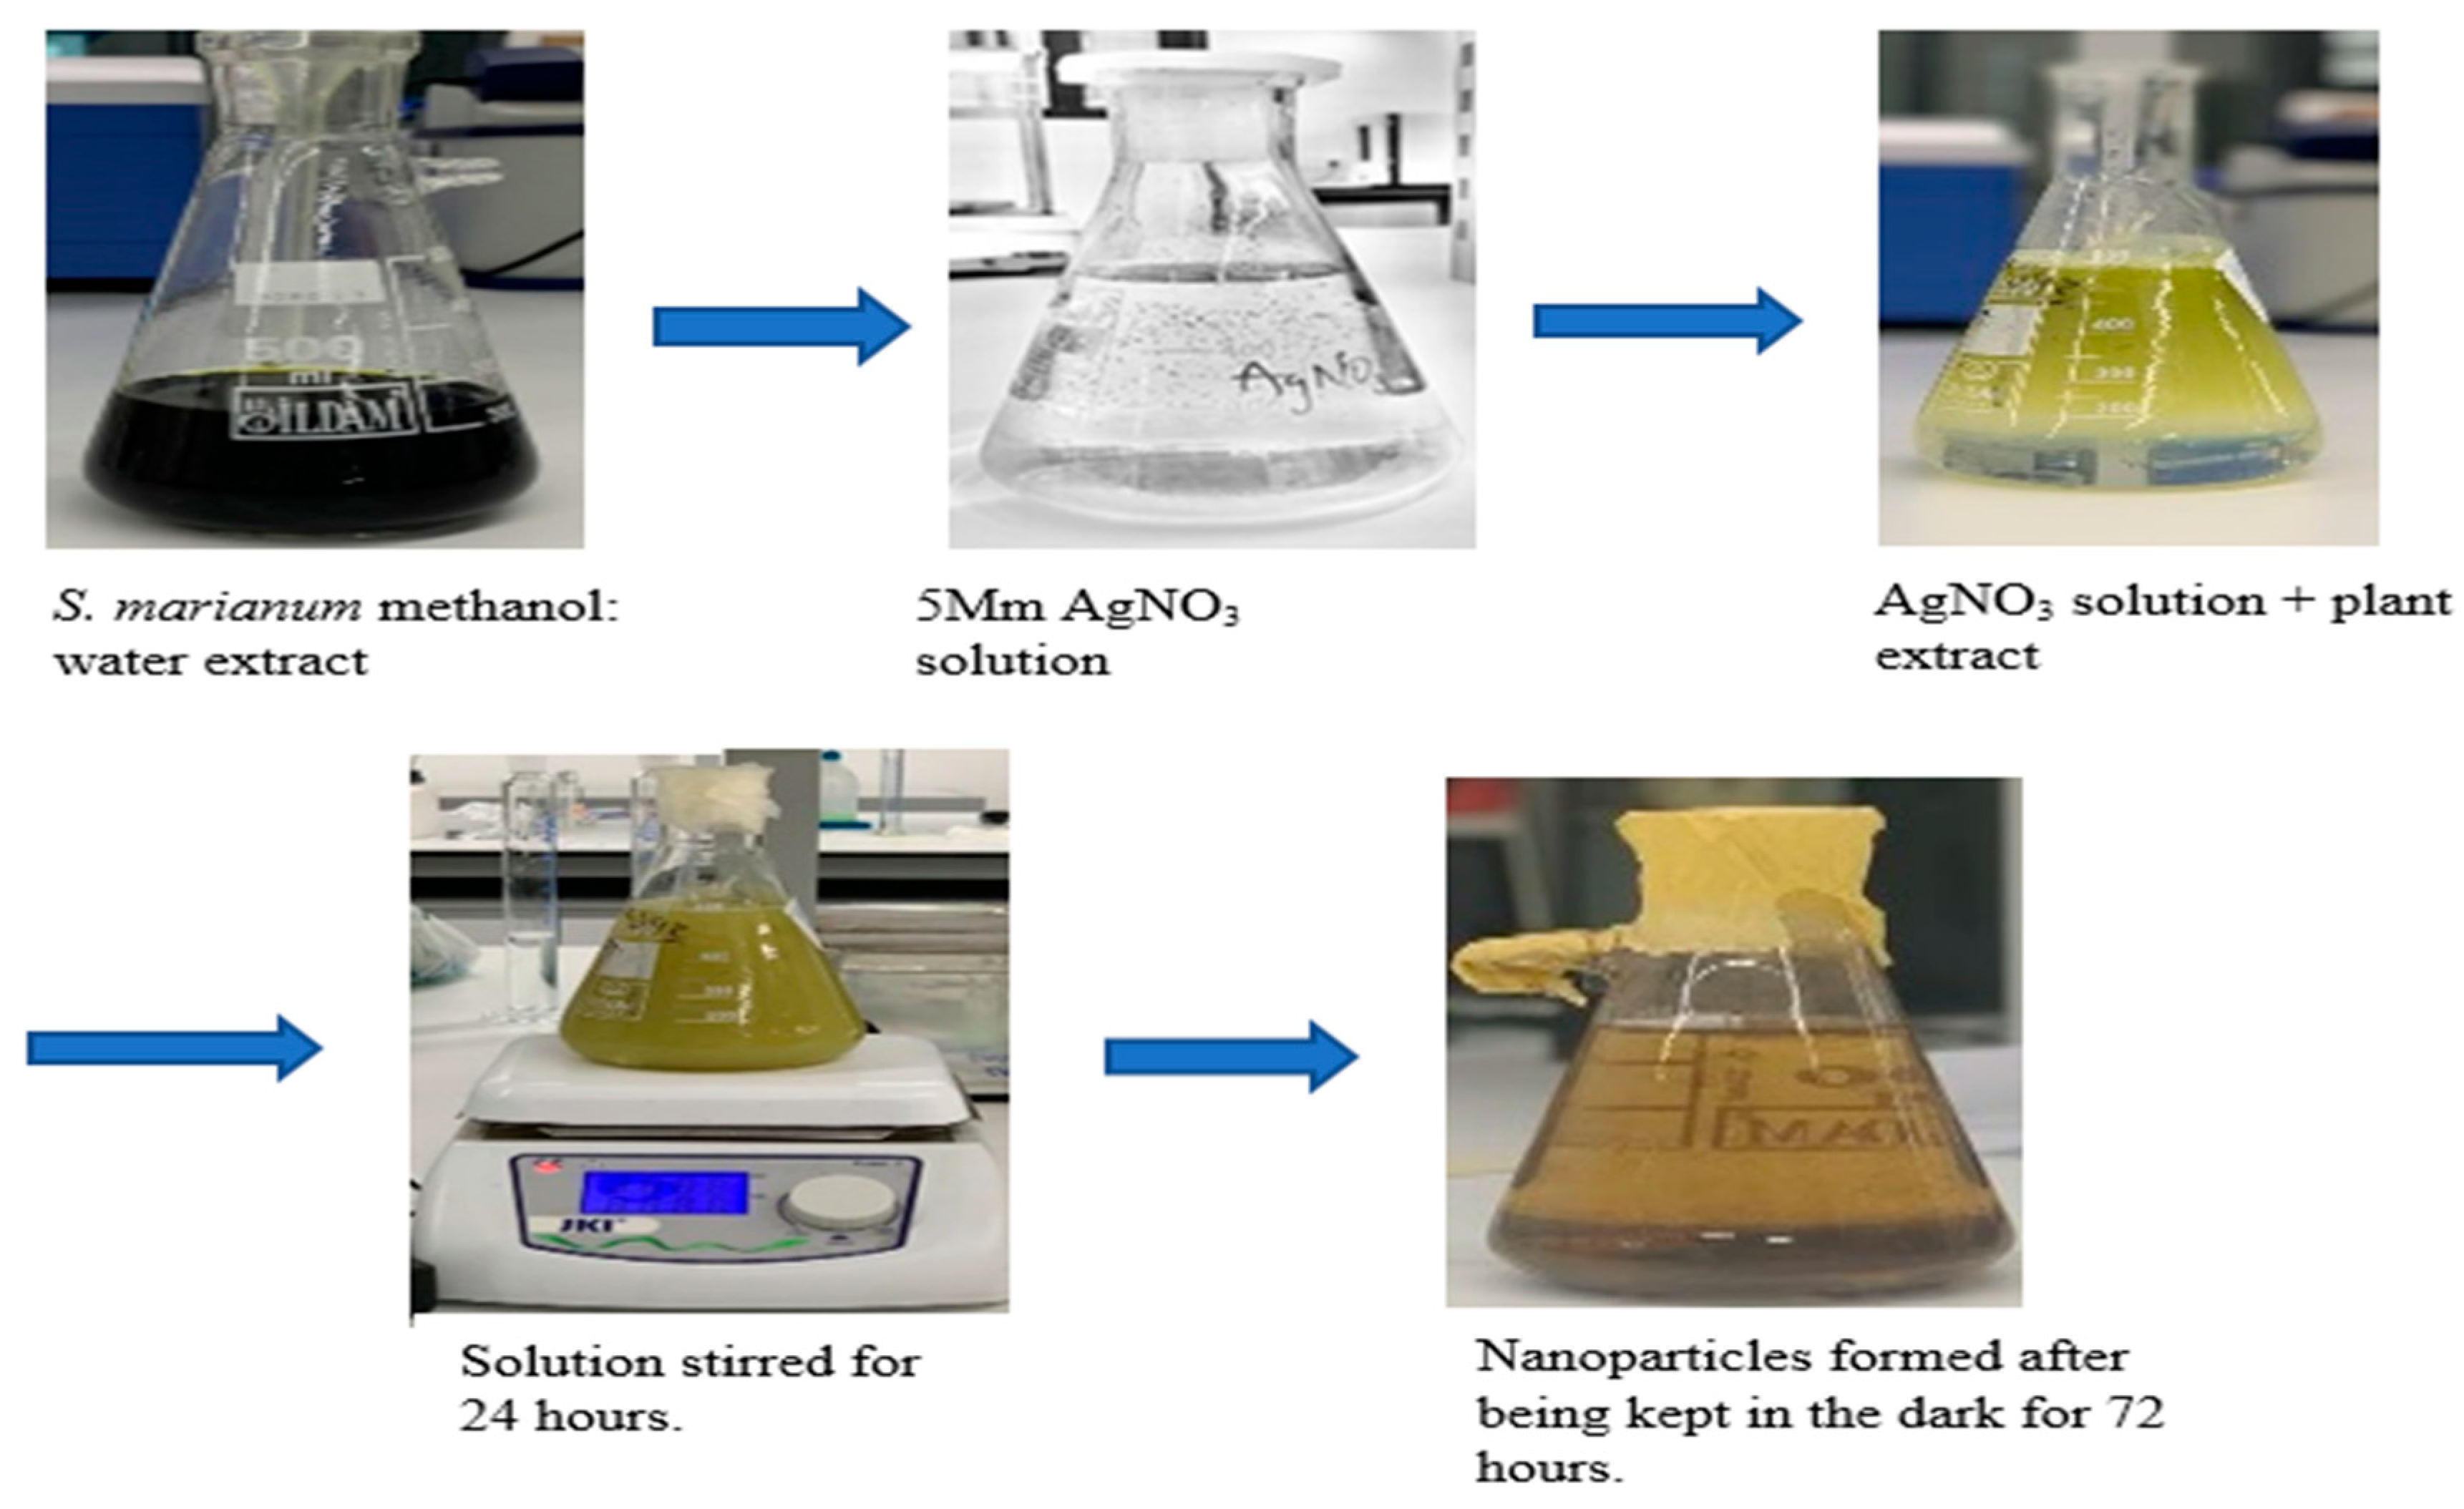
Under ideal circumstances, silver NPs were produced from the plant's leaf sample. AgNO3 and the methanol plant sample had a 9:1 reaction, which meant that 90 mL of the AgNO3 and 10 mL of the previously described methanol: water plant sample were combined. Reaction was stored in a dark place for 72 hours after 24 hours of continuous stirring with a magnetic stirrer. The solution was centrifuged for 30 minutes at a speed of 4500 RPM to remove the pellet from the emulsion. The supernatant was eliminated, and the pellet was placed to a wash glass and left to dry in the oven for 24 hours at 30 °C.
Visual Examination of Silver Nanoparticles
Inferring an interaction of the botanical sample and the AgNO3, which is a decline of the silver ions upon exposure to the plant extract as shown above, the silver nanoparticles are visually observed to exhibit a yellow-dark brown color, compared to their initial coloration of pale-yellow solution. After 72 hours in a dark environment, the solution's brown color confirms the presence of silver nanoparticles (Narchin et al., 2018).
Characterization of Silver Nanoparticles and Plant Extract
UV-Vis of Plant Extract and Silver Nanoparticles
Shimazdu's UV-VIS Spectrophotometer UV-1240 instrument was used to scan the biologically decreased dark green color (Silybum marianum leaf extract) and brown color (Nanoparticles) solution mixture. To examine the quick reduction of AgNPs by the action of plant extracts, the UV-visible examination was conducted in the absorption wavelength of 200-800 nm periodically for one hour. For the purposes of assessing plant extract and nanoparticles, respectively, methanol and distilled water were utilized as the blank (Ghareib et al., 2015).
FTIR Analysis of Silver Nanoparticles and Plant Extract
FTIR test was utilized to determine the makeup of the binding molecules that stabilize the silver nanoparticles created by the plant extract and silver ion reduction (Narchin et al., 2018). Both powdered and liquid silver nanoparticles as well as plant extract solution underwent FTIR analysis. Samples were scanned between 400 and 1000 cm-1. The solid material was ground, then thinned out into a pellet and examined. Different peaks were found when the data were compared to a reference diagram for locating the functional groupings present in each sample.
X-Ray Diffraction (XRD) Analysis
The powdered AgNPs were put in a shaped grating glass slide, leveled out, and squared before being mounted on an XRD machine. The goal of this study was to study the crystalline structure, atomic arrangement, AgNPs flaws, and the size of the crystallites in Silybum marianum leaf derived AgNPs. It recognizes, identifies, and interprets the orientations of polymeric compound's crystalline phases.
Zeta Potential and Average Particle Diameter Analysis
Following a 30 minutes centrifugation at 4100 g, the samples were repeatedly rinsed with distilled H2O before being suspended in the water. The pellet was moved into a spotless evaporating dish and dried in the oven at 30°C for 24 hours in preparation for zeta size and charge characterization. Malvern Zetas sizer Nano ZSP (Malvern Instruments Ltd. Malvern, UK), which was used to detect the zeta potential after the supernatant had gone through two rounds of filtering (Wei et al. 2012). A particle size distribution system handled the charge of the dispersed particles as well as the particle size distribution.
In-Vitro DPPH (2,2-diphenyl-1-picrylhydrazyl) Scavenging Assay
In-vitro DPPH free radical scavenging potential of
Silybum marianum (L.) Gaertn crude methanol extract was determined according to the method described by Sarker et al with slight modifications. 24 mg (0.024 g) of DPPH was dissolved in 100 mL of ethanol to create the solution. The
Silybum marianum AgNPs, n-Hexane fraction, Ethyl acetate fraction, n-Butanol fraction, and synthetic standard antioxidant Ascorbic acid were prepared as stock solutions (10 mg/mL each; 0.1 g / 10 mL) in ethanol. With a fivefold serial dilution of the ethanolic extract, combined with 1.0 mL of DPPH solution, and let to stand for 30 minutes in the dark. The U.V spectrophotometer was used to calculate absorbance at 517 nm (Thermo- electron corporation, USA). Inhibition of the free radical DPPH was computed using the formula below, and the sample concentration that provided 50% inhibition (IC
50) was determined by plotting inhibition percentages versus sample concentrations. Every test was performed as mean ± SD of triplicates (Sarker
et al., 2006).
where Abs
control is the absorbance of the control reaction (containing all reagents except the test compound) and Abs
sample is the absorbance of the test compound.
In-Vitro Hydrogen Peroxide Scavenging Assay
The method described by (Pavithra and Vadivukkarasi, 2015) was used to determine the amount of hydrogen peroxide that Silybum marianum leaf extract could scavenge, with some slight adjustments. In 10x Dulbecco's phosphate buffered saline (DPBS), a solution of hydrogen peroxide (43 Mm) is made (1M pH 7.4). Different concentrations of the plant extract, n-Hexane fraction, ETOAC fraction, n-Butanol fraction and Silybum marianum AgNPs (10 mg/ml) were prepared in 5 mL of DPBS each, the hydrogen peroxide solution (0.6 mL, 43 mM) was added into each test tubes, then left to incubate in a dark room about 10 minutes and the absorbance was taken at a wavelength of 230 nm against a blank solution containing phosphate buffer without hydrogen peroxide. The benchmark was ascorbic acid. The percent inhibition as computed above was used to assess the free radical scavenging activity.
Carotenoid Extraction
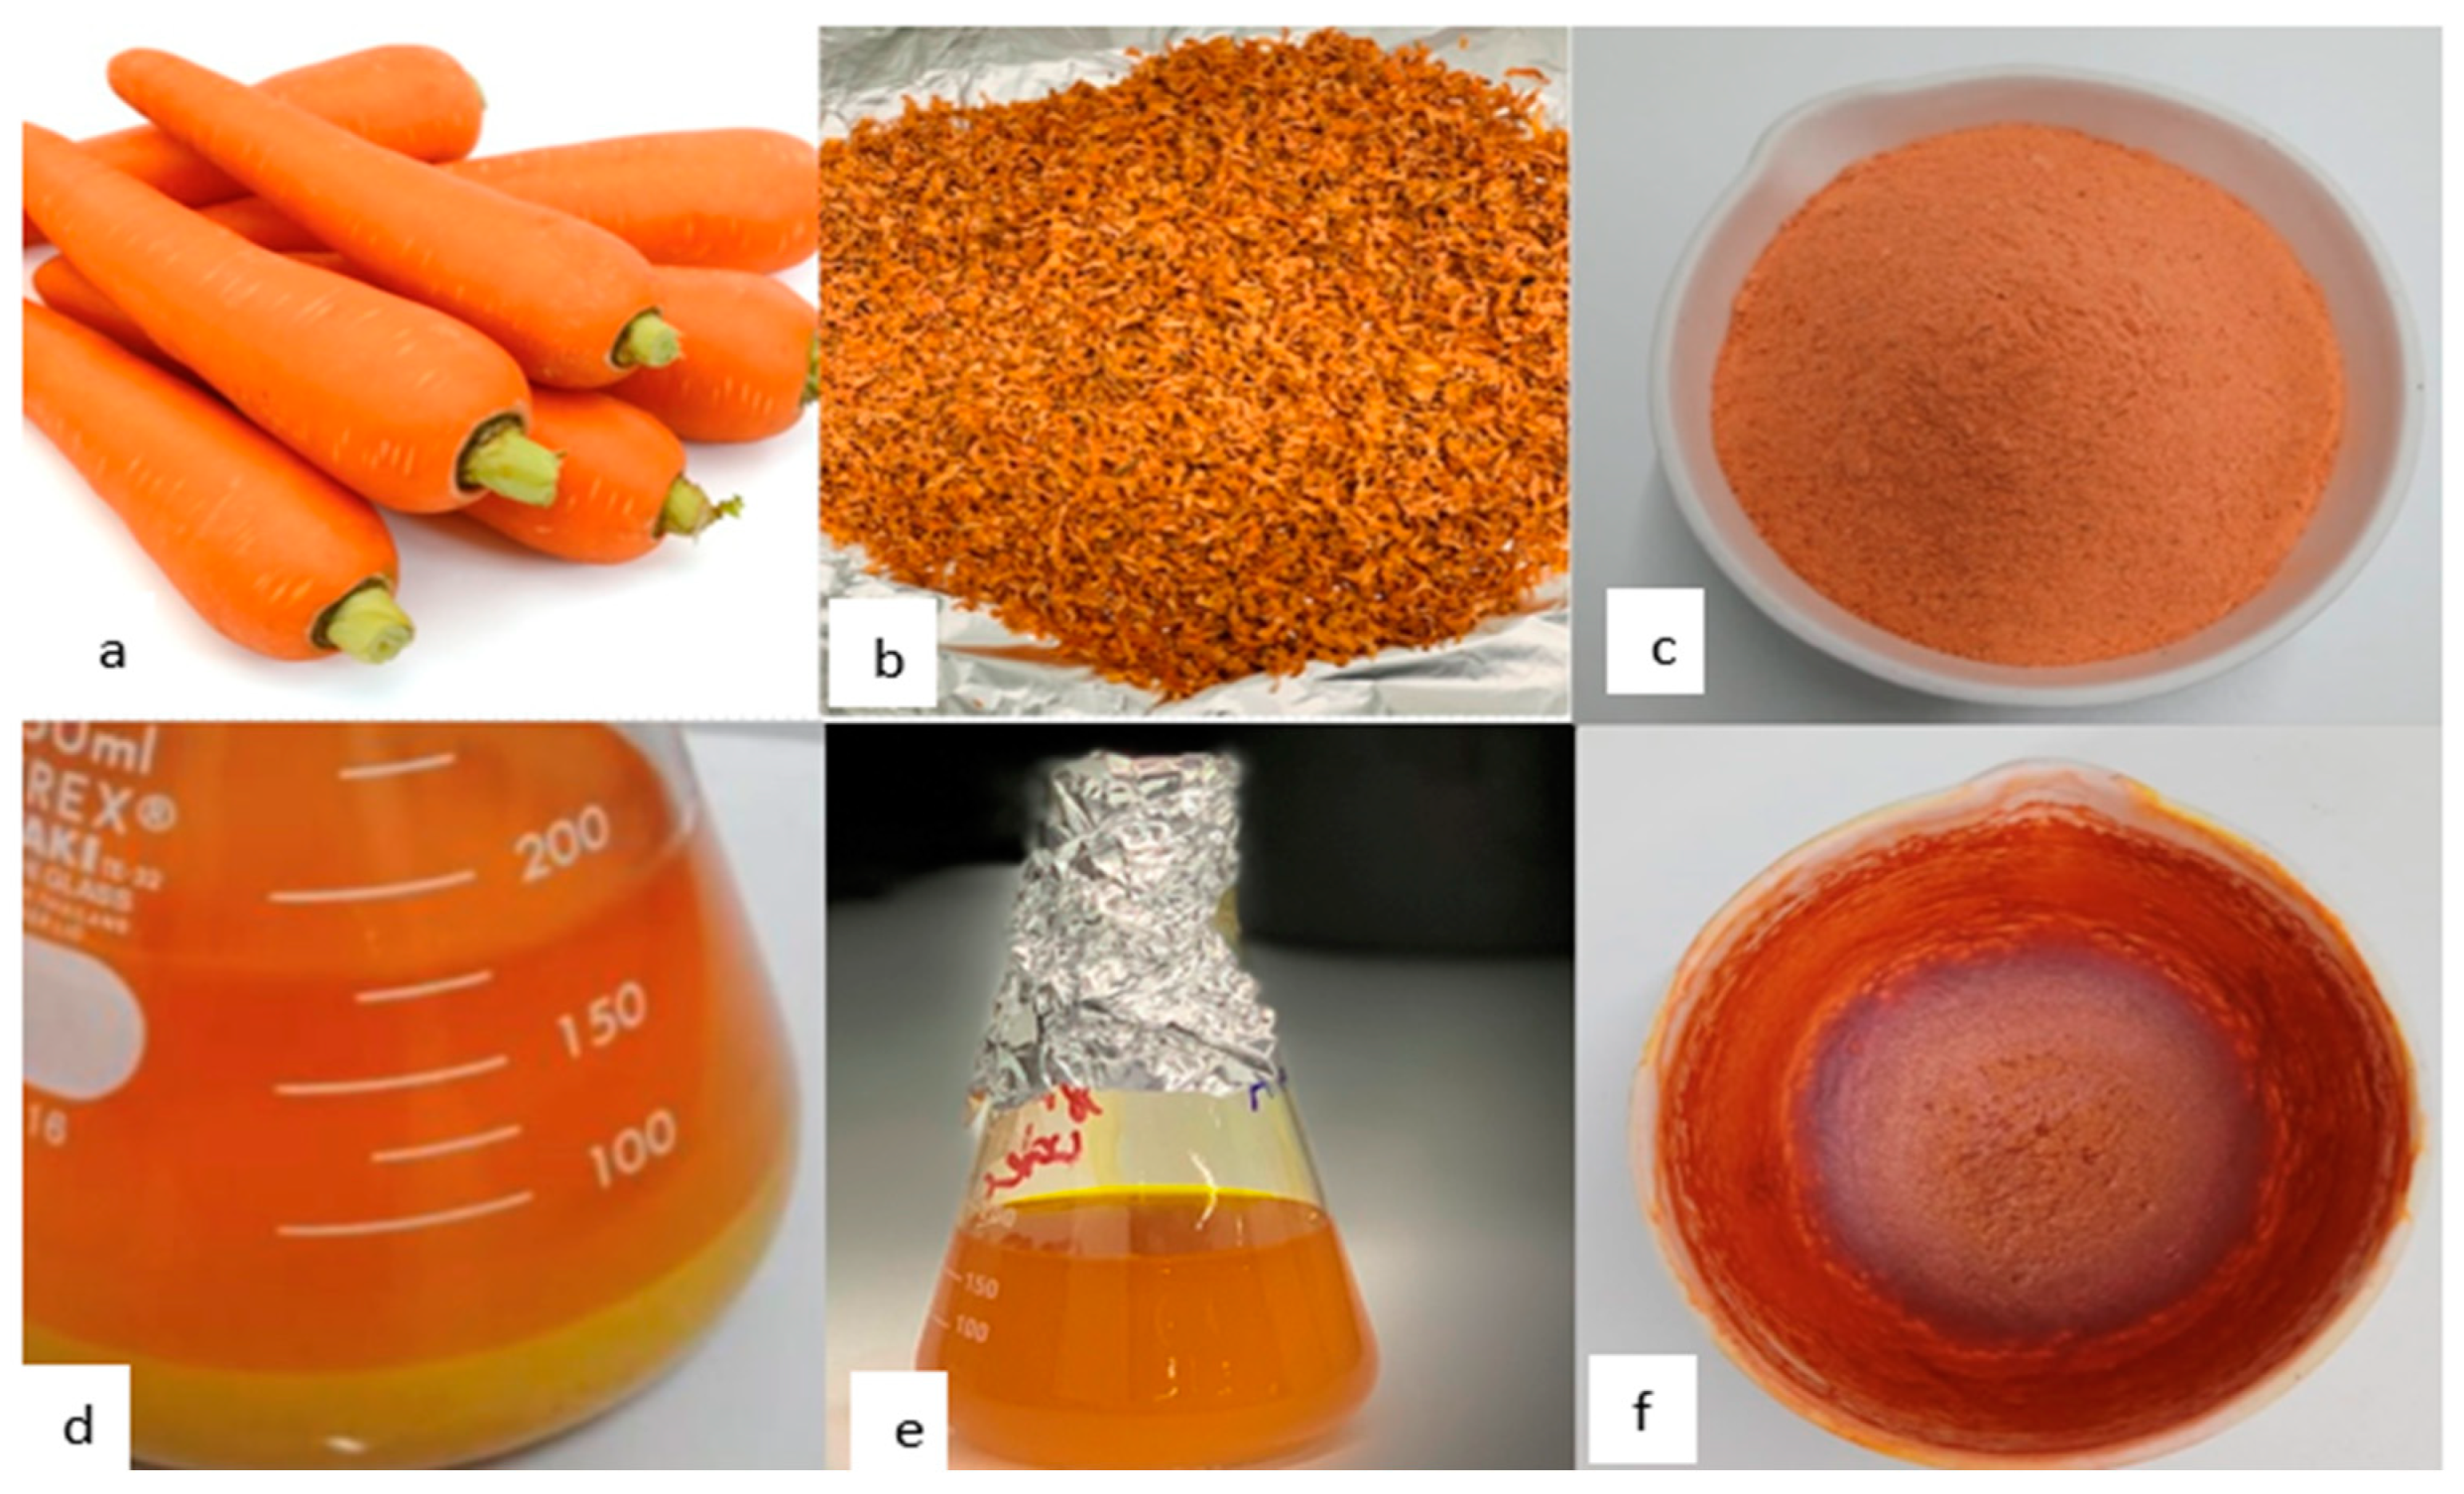
2 kilograms of carrots were washed and then chopped into little pieces. The sample was milled using a miller machine after being entirely decreased in moisture content in an oven at a low temperature (30 °C). The dried sample weighed 94.264 g. 70 g of the powdered dry sample was added to a 1L beaker glass, and 200 mL of petroleum ether was added to the glass until the sample was completely submerged. The mixture was agitated for two hours, then left to macerate for a whole day without any light. Whiteman's filter paper was used to separate the liquid and solid phases of the sample solution, and this process was repeated 7 times using petroleum ether until the solid sample phase of the sample was colorless. To evaporate the solvent (petroleum ether), the liquid phase was collected into a 103.94 g crucible and dried. The final weight of the porcelain was 105.250 g, and the viscous extract that was produced when the solvent was evaporated was thought to be a carotene extract that might be used as a raw material for the manufacture of aromatic compounds (Rini
et al., 2022).
In-Vitro β – Carotene Scavenging Assay
The β-carotene/linoleic acid bleaching assay was performed following the method described by (Shahidi, 2006) with slight modification. A mixture of β-carotene and linoleic acid in was prepared by dissolving 0.5 µl of beta-carotene in 1mL of chloroform and 25 µL linoleic acid in 200 mg tween 20. The chloroform was completely evaporated with the rotary evaporator, and 100 mL of distilled water was added to the residue subsequently, and the mixture was shaken rapidly to create an emulsion. 2.5 mL of the emulsion was transferred into different test tubes containing 350µl of plant extract, n-Hexane fraction, Ethyl acetate fraction, n-Butanol fraction and
Silybum marianum AgNPs at different concentrations. Together with a negative control that contained the same volume of ethanol in place of the samples, all the samples were refluxed for 1 minute and placed in a water bath at 50°C for 2 hours. At the beginning (t = 0), samples' absorbance was measured at 470 nm using a spectrophotometer in comparison to a blank (emulsion without β- carotene), ascorbic acid was used as a positive control. Antioxidant activities (inhibition percentage, 1 %) of the samples were calculated (Amiri, 2012).
where Aβ-carotene after 2 hours assay is the absorbance of β-carotene after 2 hours assay remaining in the samples and A-initial β-carotene is the absorbance of β-carotene at the beginning of the experiments. All tests were carried out in triplicates and inhibition percentages were reported as means ± SD of triplicates.
Antimicrobial Activity
Silybum marianum MeOH: H2O extract, its three fractions; n- hexane, ethyl acetate, n-butanol fractions and AgNO3 were evaluated in antibacterial assays by using the agar disk diffusion method against six bacteria strains. The examined bacterial species were streaked on MHA (Mueller-Hinton agar) plates after being transferred from stock cultures, and the incubation period was 24 hours. The inoculums made up of carefully separated bacterial colonies were used. A bacteriological sterile swab was used to transfer bacteria to autoclaved MHA that had been gently swirled and warmed to about 45°C. After the medium had solidified, it was placed into a sterile petri dish and utilized for a scientific test (Ayana et al., 2022). All test samples of 10 mg/mL–1 concentration was prepared in one concentration (0.1 mg/mL–1) in 10 mL of 10 % DMSO. Three Gram-positive bacteria; Enterococcus faecalis, Listeria monocytogenes and Bacillus cereus and two Gram-negative bacteria; Escherichia coli, Pseudomonas aeruginosa and Salmonella typhi were used. All bacterial species were sourced from the Department of pharmacy, CIU. Using a micropipette, 2 mL of different samples each and the control were infused into the sterilized filter paper disks (6 mm) that had been transferred to the MHA plates to each compartment seeded with bacteria. The plates were incubated at 37 °C for 24 hours to observe the growth of the bacteria and sample inhibition. There were three copies of each test run. Levofloxacin, a common medication, served as a positive control, and the matching solvent served as a negative one (DMSO and H2O). Following incubation, the diameter of the growth-free zones was measured in mm to determine the zones of inhibition. All analyses were performed in triplicate and then twice more in duplicate.
Minimum Inhibition Concentration (MIC)
100 µL of LB broth was placed in each 96 wells. 100 µL of 10 mg/ml of each of the extracts (Silybum marianum, and silver NPs) and the controls (ampicillin, silver nitrate and filtered distilled H2O) was introduced to the first well and five-fold serial dilution was done. This was repeated for all the 96 wells. 2µL of Staphylococcus aureus, Bacillus cereus, Enterococcus faecalis (gram positive) and E. coli, Pseudomonas aeruginosa, Salmonella typhi (gram negative), was placed into the wells respectively for two experiments and incubated for 24 hours at 37˚C. The definition of the MIC values was the sample concentration that completely inhibited bacterial growth.
Statistical Analysis
Results are expressed as mean ±S.E.M. The levels homogeneity among the groups were assessed using One-way Analysis of Variance (ANOVA) followed by Turkey’s test. All analyses were done using Graph Pad Prism Software Version 8.00 and p values (< 0.05) were considered statistically significant.
RESULTS
Mass and Percentage Yield of Plant Extracts
The type of solvents used, and the chemical makeup of the sample determine how the extraction yield varies. The polar solvent fraction n-Butanol produced the highest yield of the extract, which may be related to the solvent's ability to extract molecules with sufficient polarity.
Table 1.
Mass and percentage yield of fractionated plant extracts.
Table 1.
Mass and percentage yield of fractionated plant extracts.
| Extract |
Color |
Mass of extract (g) |
% Yield |
| Silybum marianum |
Dark green |
3.246 |
6.49 |
| n-Hexane |
Green |
0.310 |
1.63 |
| Petroleum ether |
Green |
0.302 |
1.59 |
| Chloroform |
Greenish brown |
0.392 |
2.06 |
| Ethyl acetate |
Brown |
0.415 |
2.18 |
| n-Butanol |
Dark brown |
0.430 |
2.26 |
Phytochemical of Silybum marianum
A phytochemical screening was done to identify the chemical elements in the plant that control its biological activity, antioxidant activity, and bio-reduction of silver for the creation of nanoparticles. When reagents are combined with plant extract, a color shift occurs that indicates the presence of phytochemical components, as seen below in
Table 2.
Synthesis of silver nanoparticles (MAgNPs)
Figure 1 depicts the color alterations that resulted from the interaction between the plant extract and the silver nitrate. The phytochemical screening that was done revealed that the plant extract from the leaf contained tannins, saponins, flavonoids, and alkaloids. The hydroxyl group, which is found in substances like phenols and flavonoids, aids in the conversion of silver ions into nanoparticles.
UV Spectrophotometry
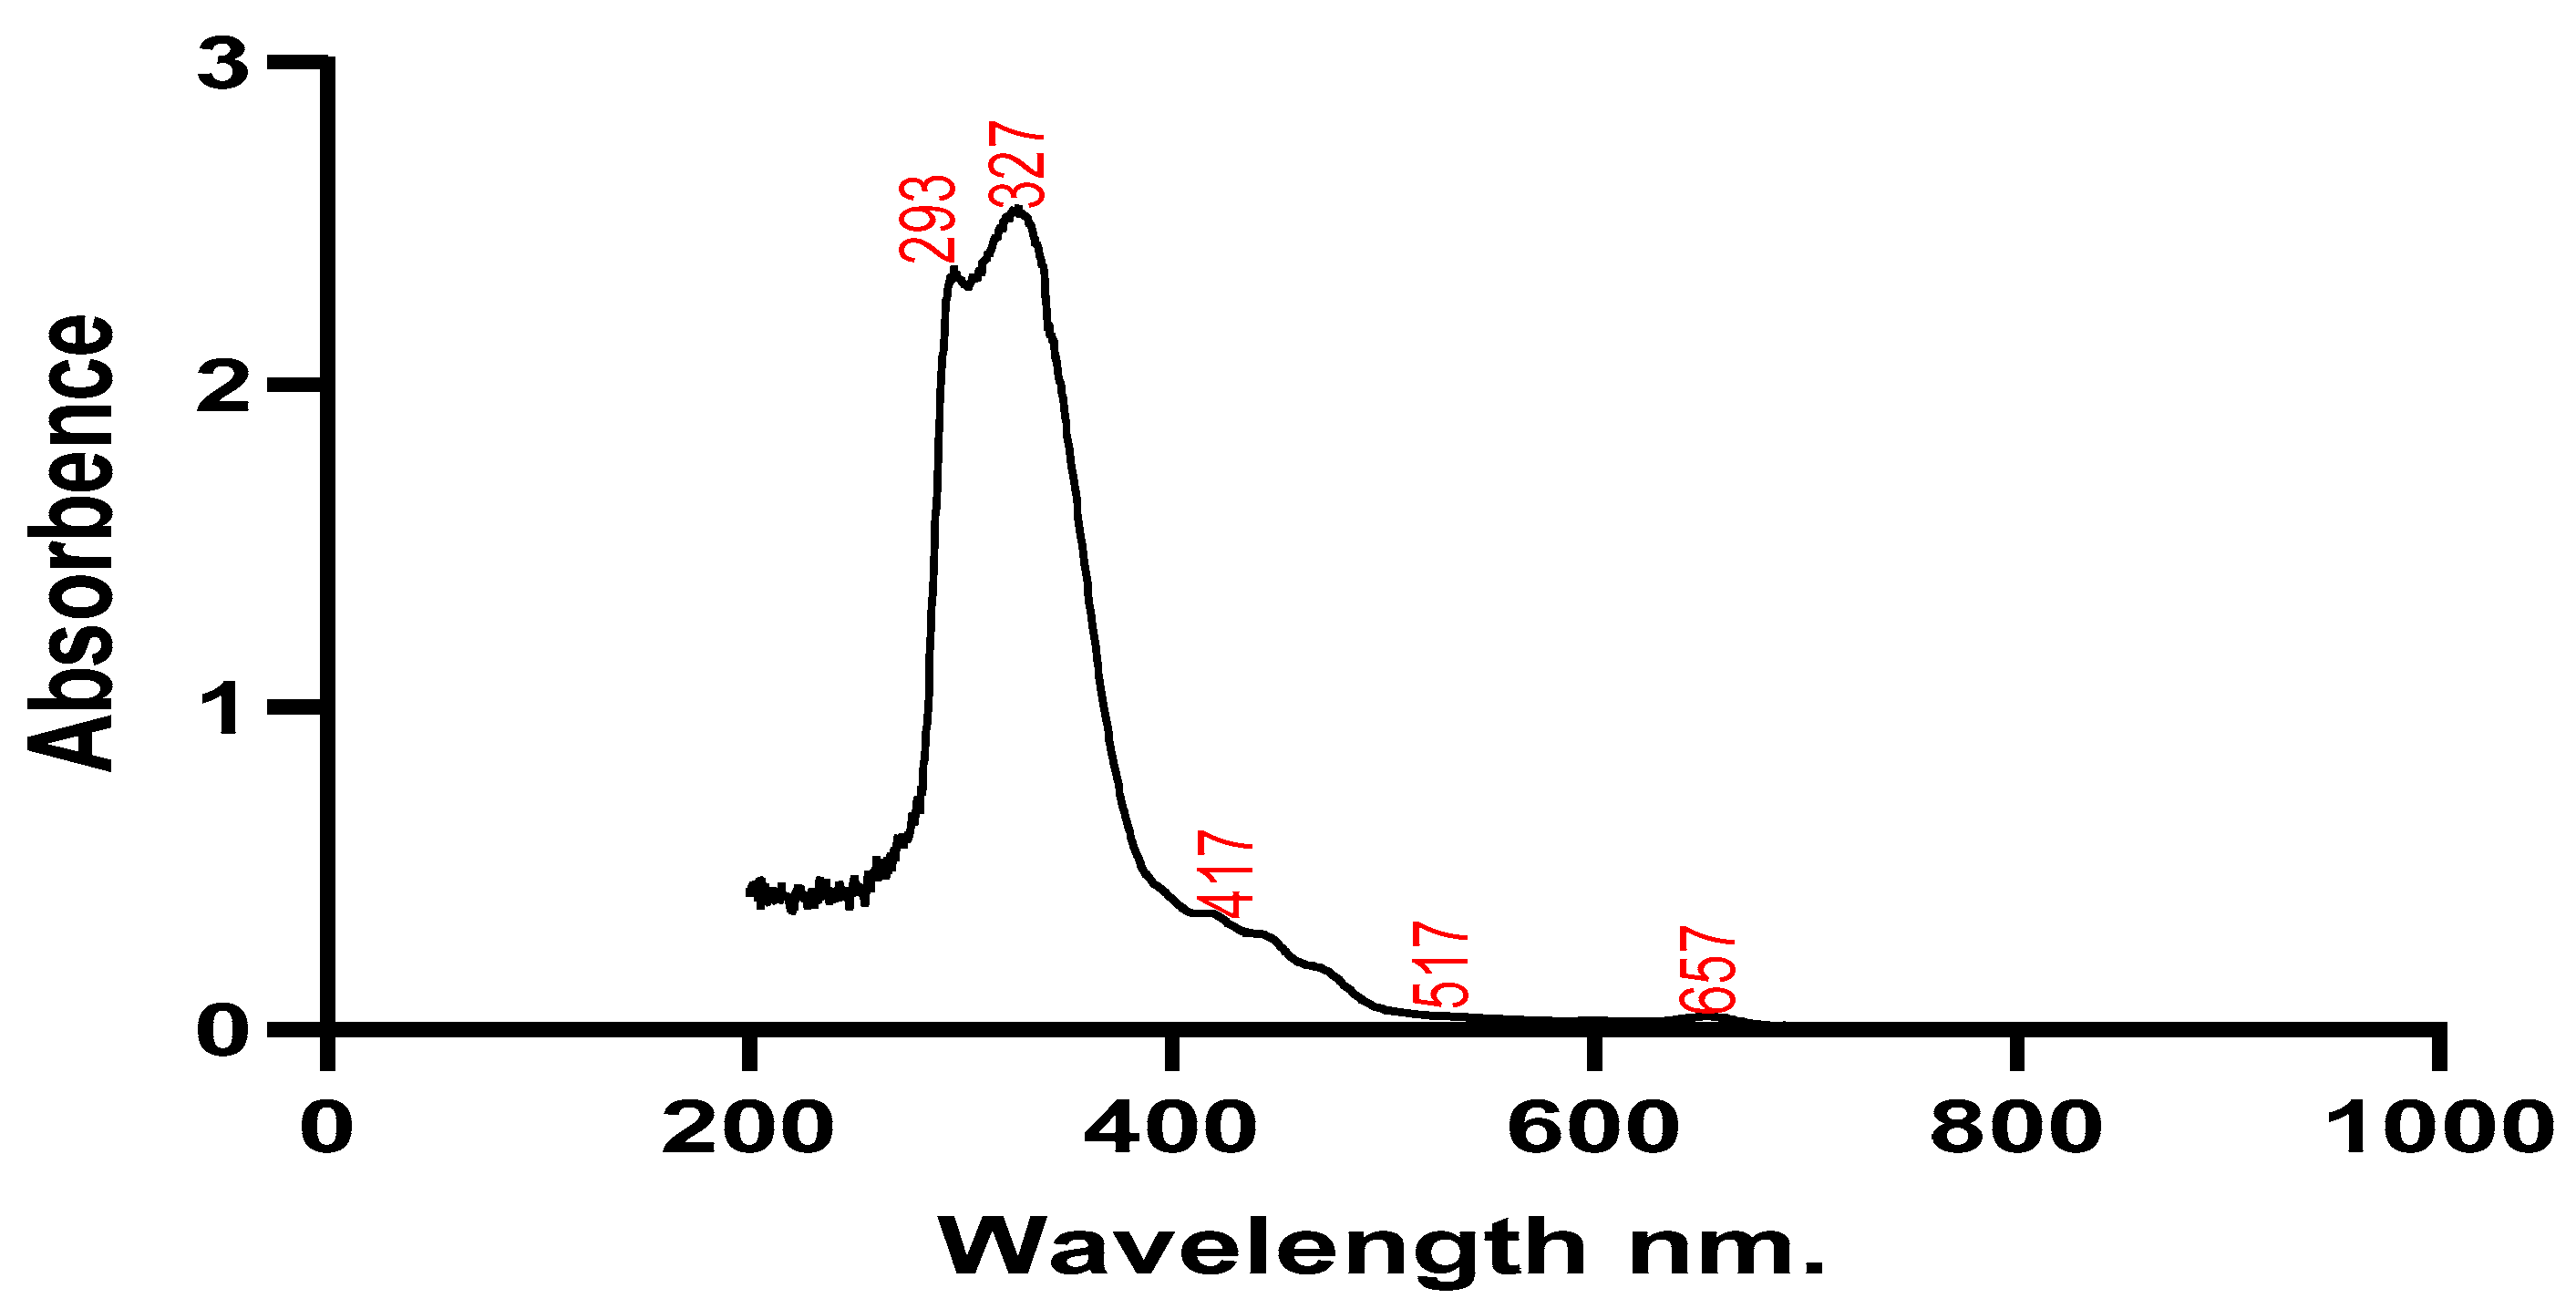
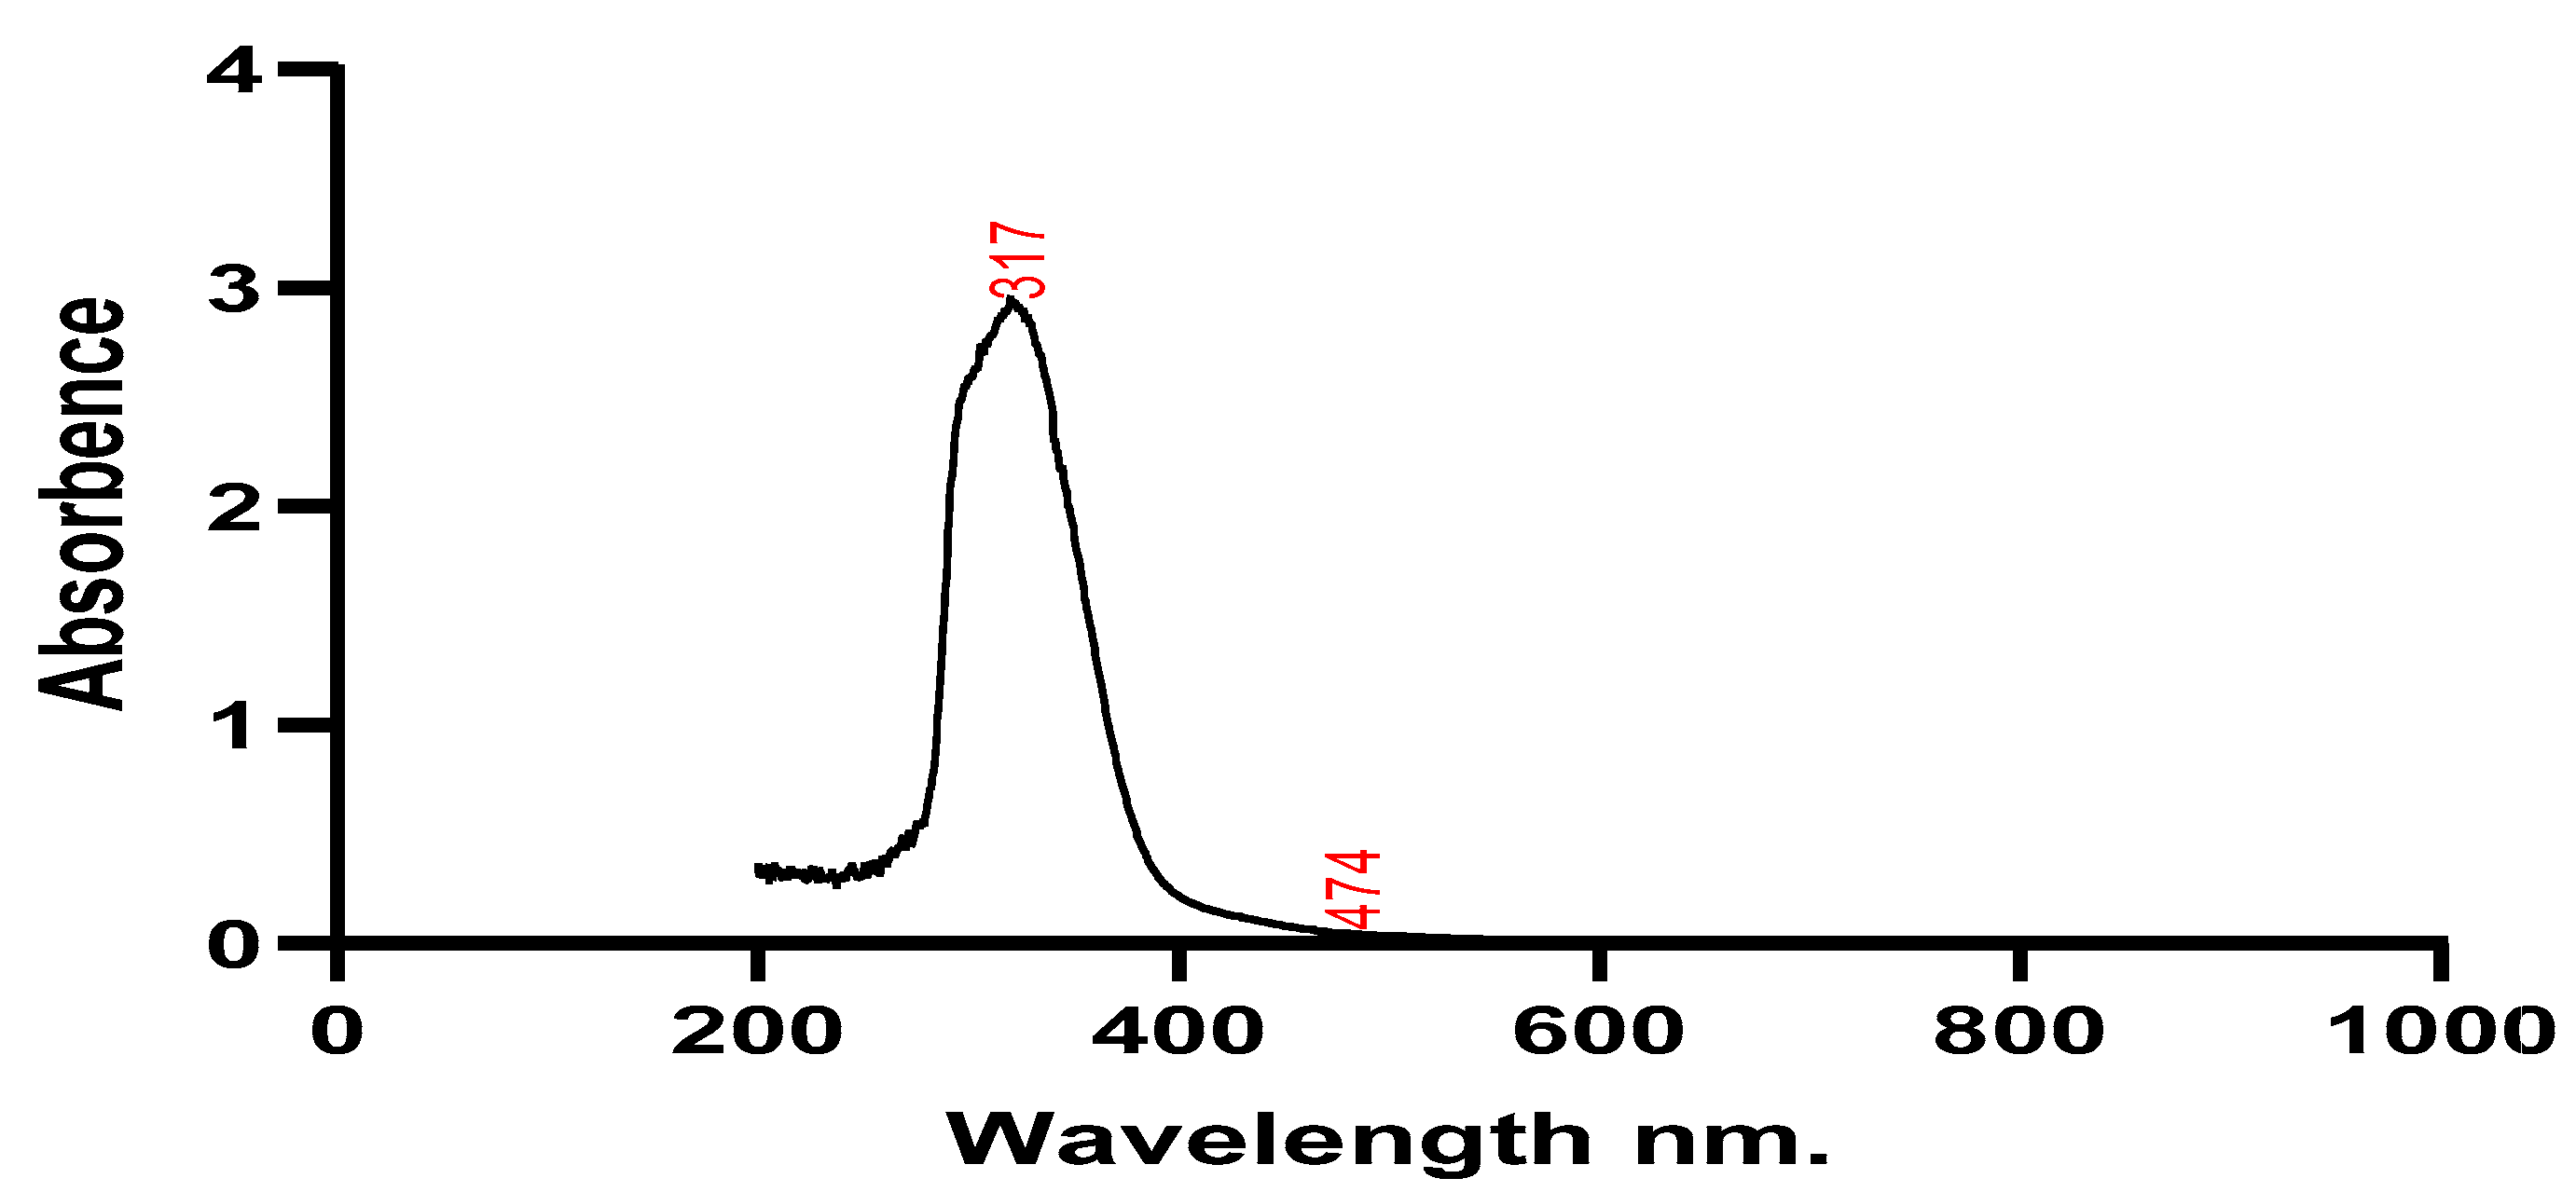
Silver nanoparticles and plant extracts were both subjected to UV spectroscopy testing to determine their stability. Wavelengths around 200 and 800 nm were used to scan the absorbance of the plant extract and the solution containing the silver nanoparticles. The plant sample showed maximum absorption at wavelengths of 293 nm, 327 nm, and 417 nm, while silver nanoparticles had maximum absorption at 317 nm and 474 nm. The produced silver nanoparticles' size, shape, morphology, composition, and dielectric environment are all known to have an impact on the Surface Plasmon Resonance (SPR) bands (Park et al., 2011).
Figure 2.
UV spectrum of Silybum marianum.
Figure 2.
UV spectrum of Silybum marianum.
Figure 3.
UV spectrum of nanoparticles.
Figure 3.
UV spectrum of nanoparticles.
FTIR Analysis
FTIR scan of the
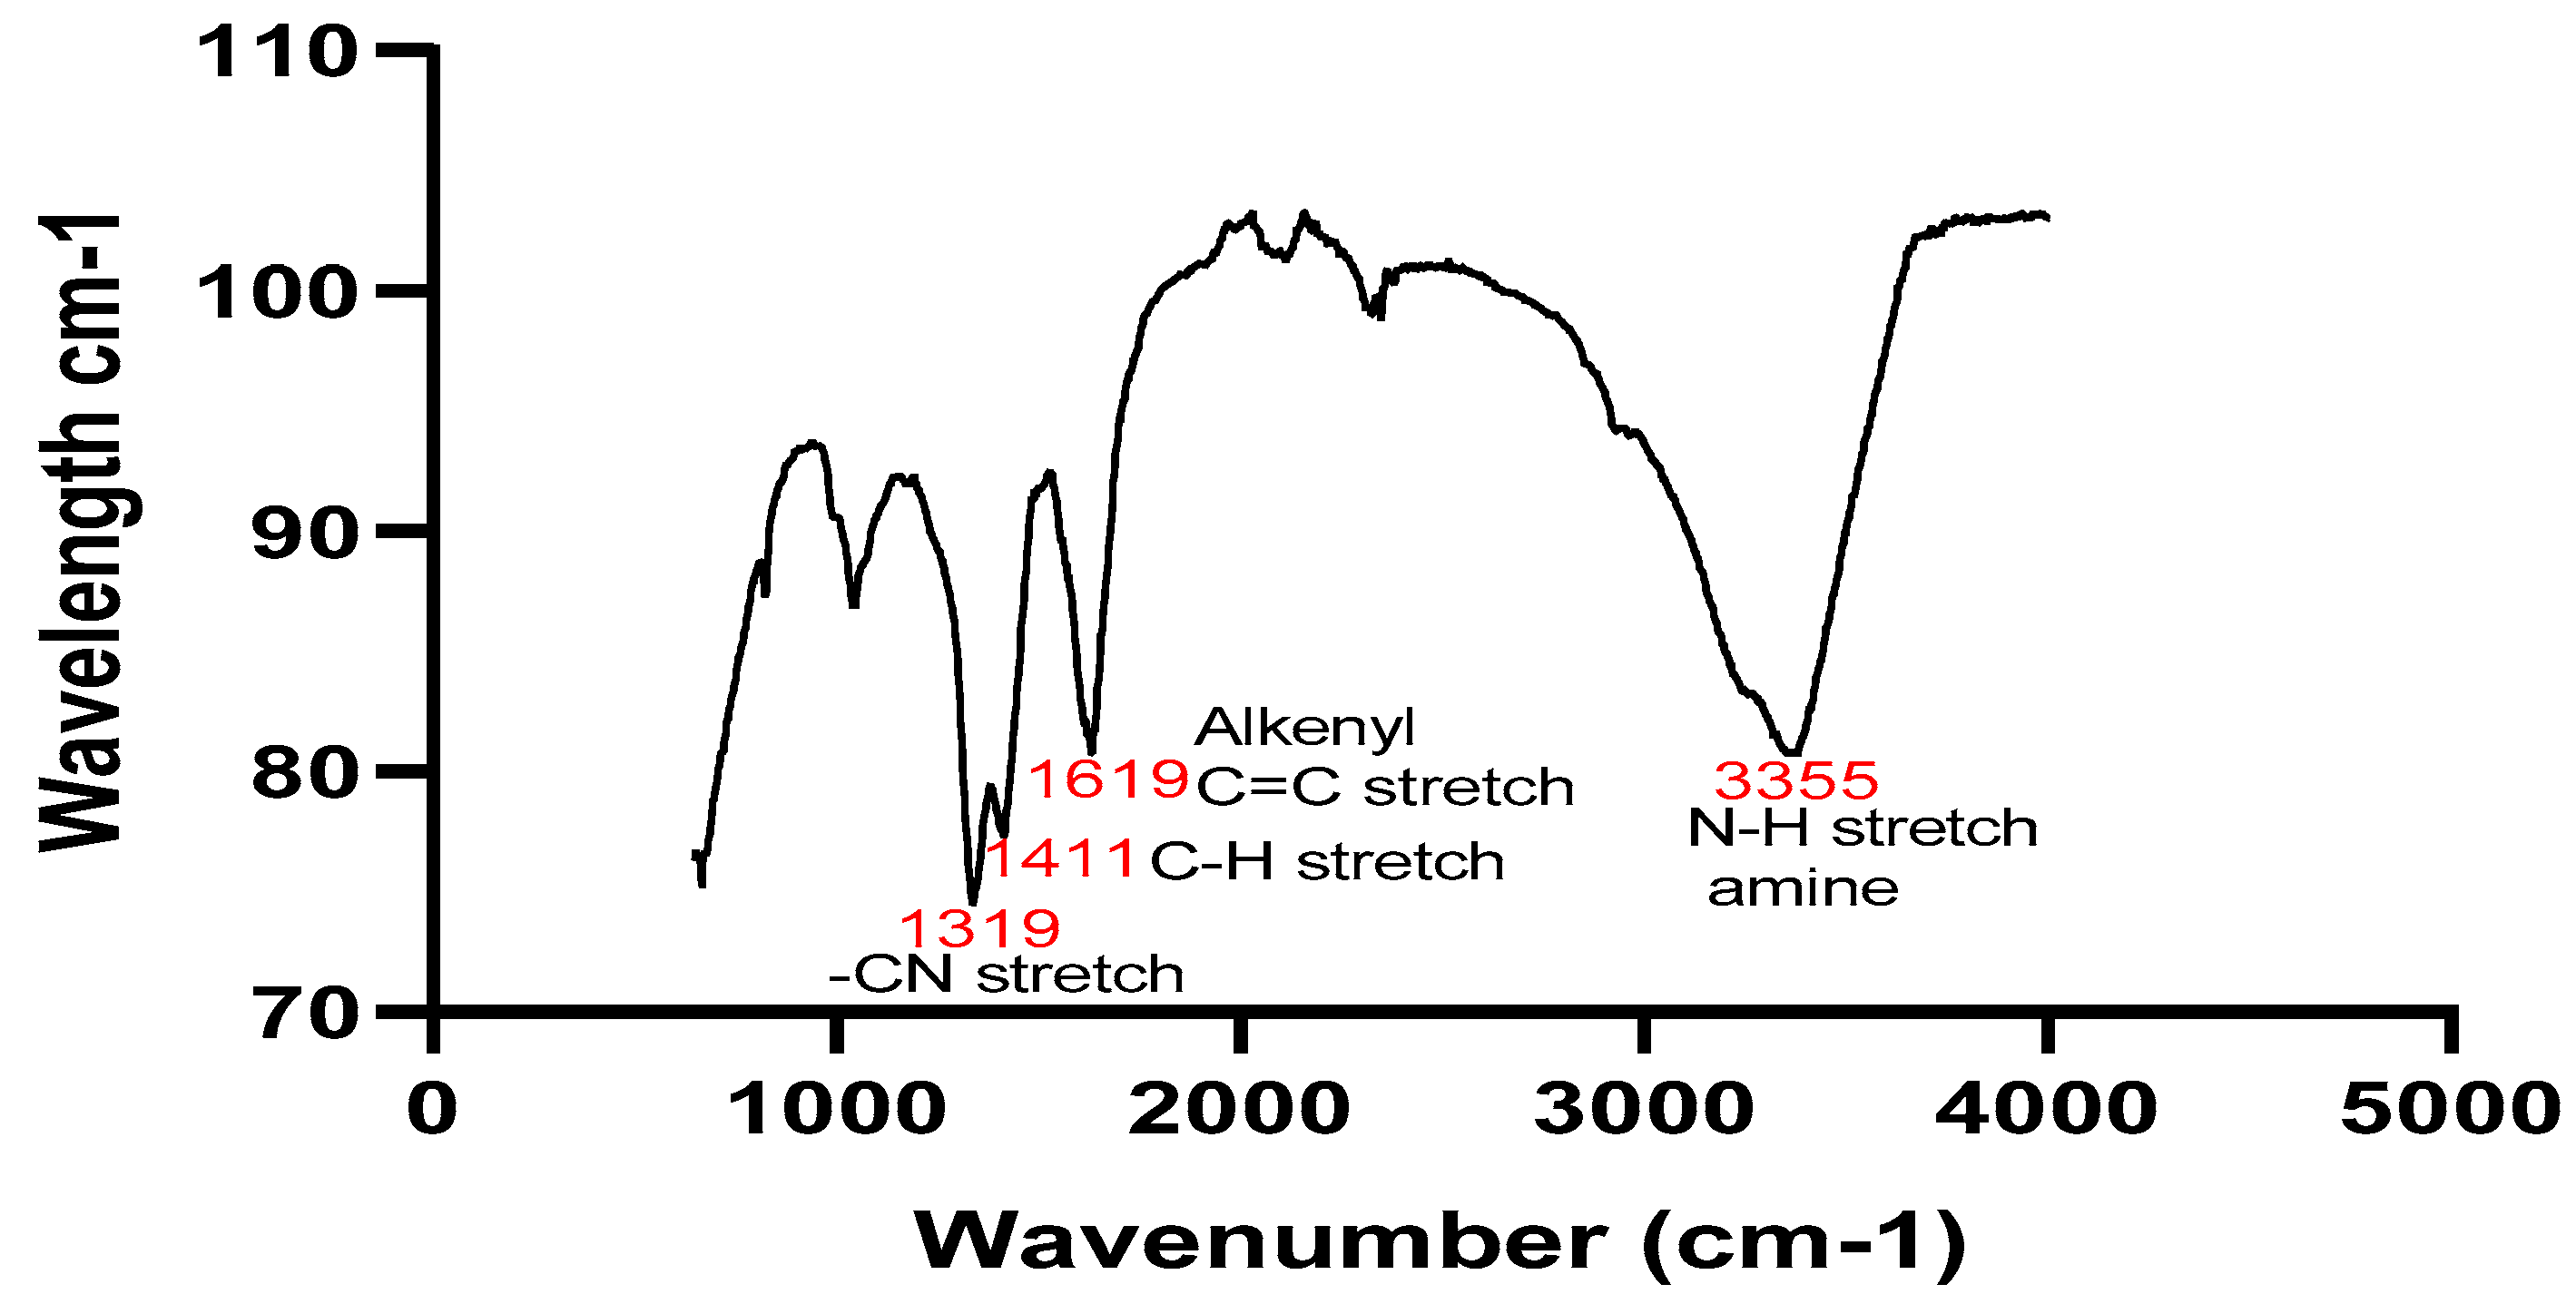
Silybum marianum methanol: water extract and 5 mM silver nanoparticles were done in the range 600 cm-1 to 4000 cm-1, to recognize the surface functional groups on plant extract and nanoparticles, as well as the type of binding molecules that stabilize the AgNPs produced by the biodegradation technique. (Malarvizhi
et al, 2016). The plant sample showed peaks at 3355 cm
-1, 1619 cm
-1, 1411cm
-1 and 1319cm
-1 and the peaks of the silver nanoparticles were 3310 cm
-1, 2905cm
-1, 2163cm
-1, 2002cm
-1, 1677cm
-1, 1041cm
-1, and 866 cm
-1. The various extracts equally indicated the presence of various functional groups as seen in (
Table 3) respectively.
Figure 4.
FTIR spectrum of nanoparticles.
Figure 4.
FTIR spectrum of nanoparticles.
Figure 5.
FTIR spectrum of Silybum marianum.
Figure 5.
FTIR spectrum of Silybum marianum.
XRD Result
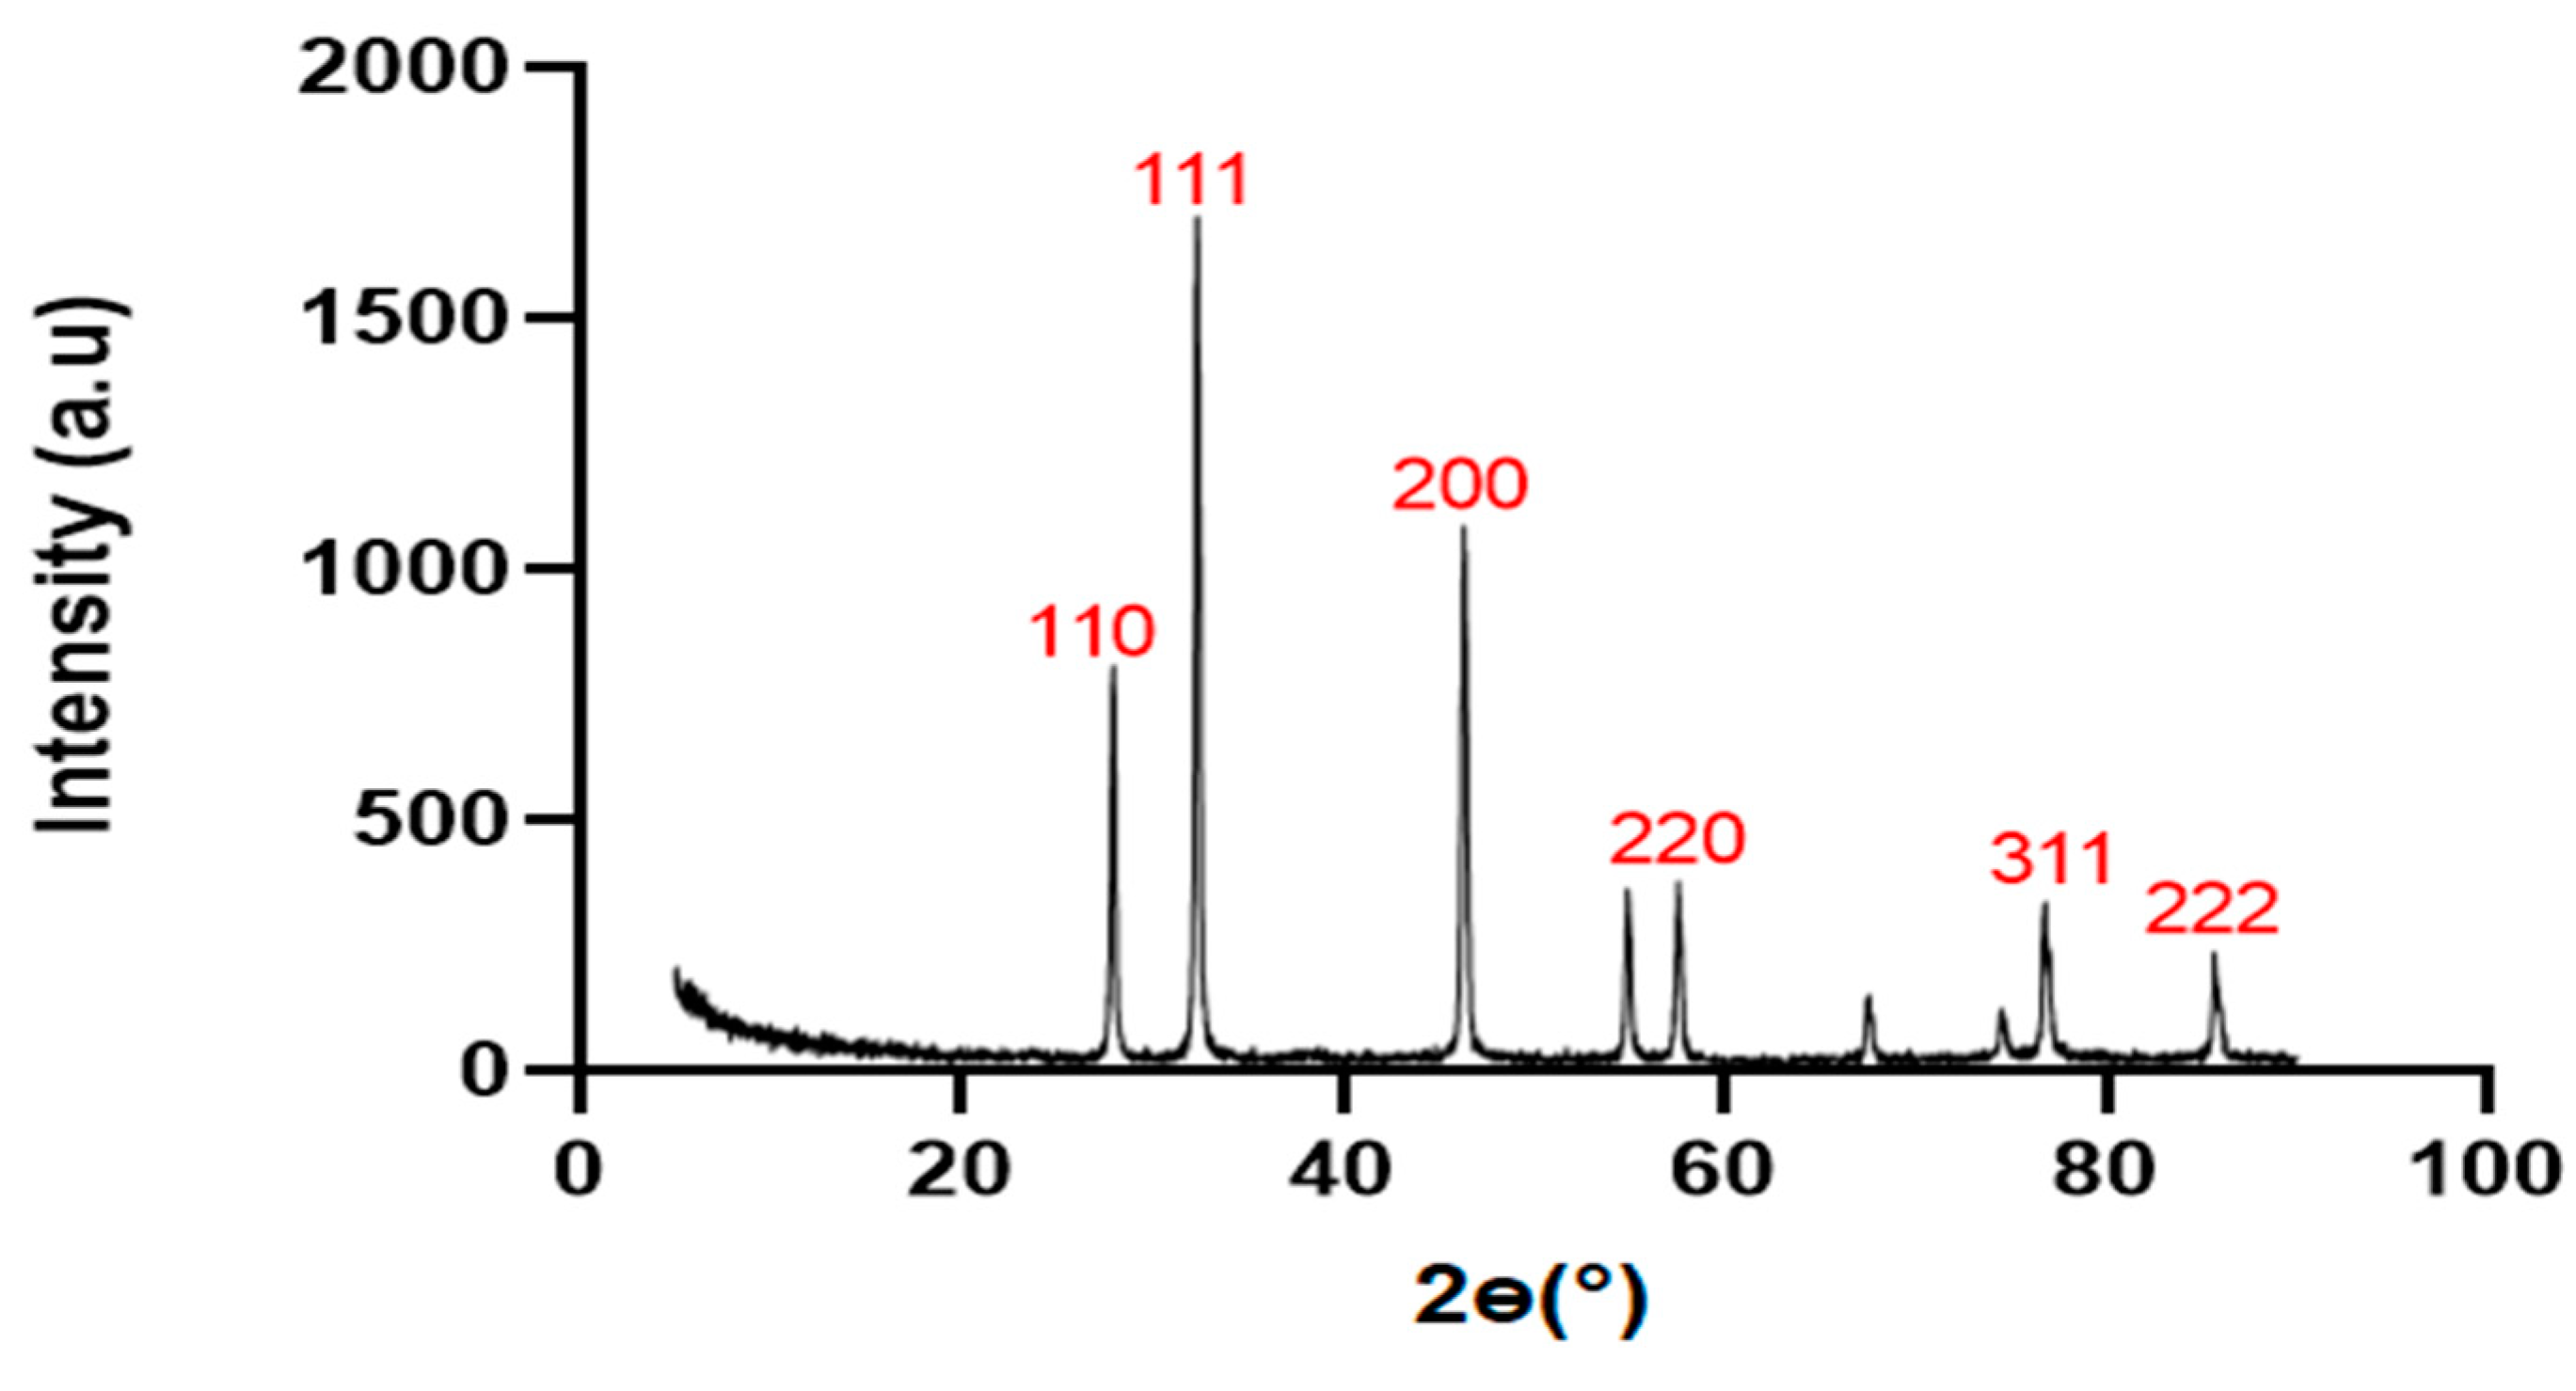
The XRD result revealed the atomic arrangement, crystalline structure, crystalline size of silver nanoparticles produced from
S. marianum crude saponins. The peaks demonstrated in
Figure 6 indicated the presence of four distinct peaks of silver nanoparticles between 25 and 50°. The peak of diffraction observed at 28.5°, 34.2°, 39.5°, 48.5°, 77.3° and 81.5° correlates with the facets 110, 111, 200, 220, 311 and 222 respectively.
Zeta Potential of the Silver Nanoparticles
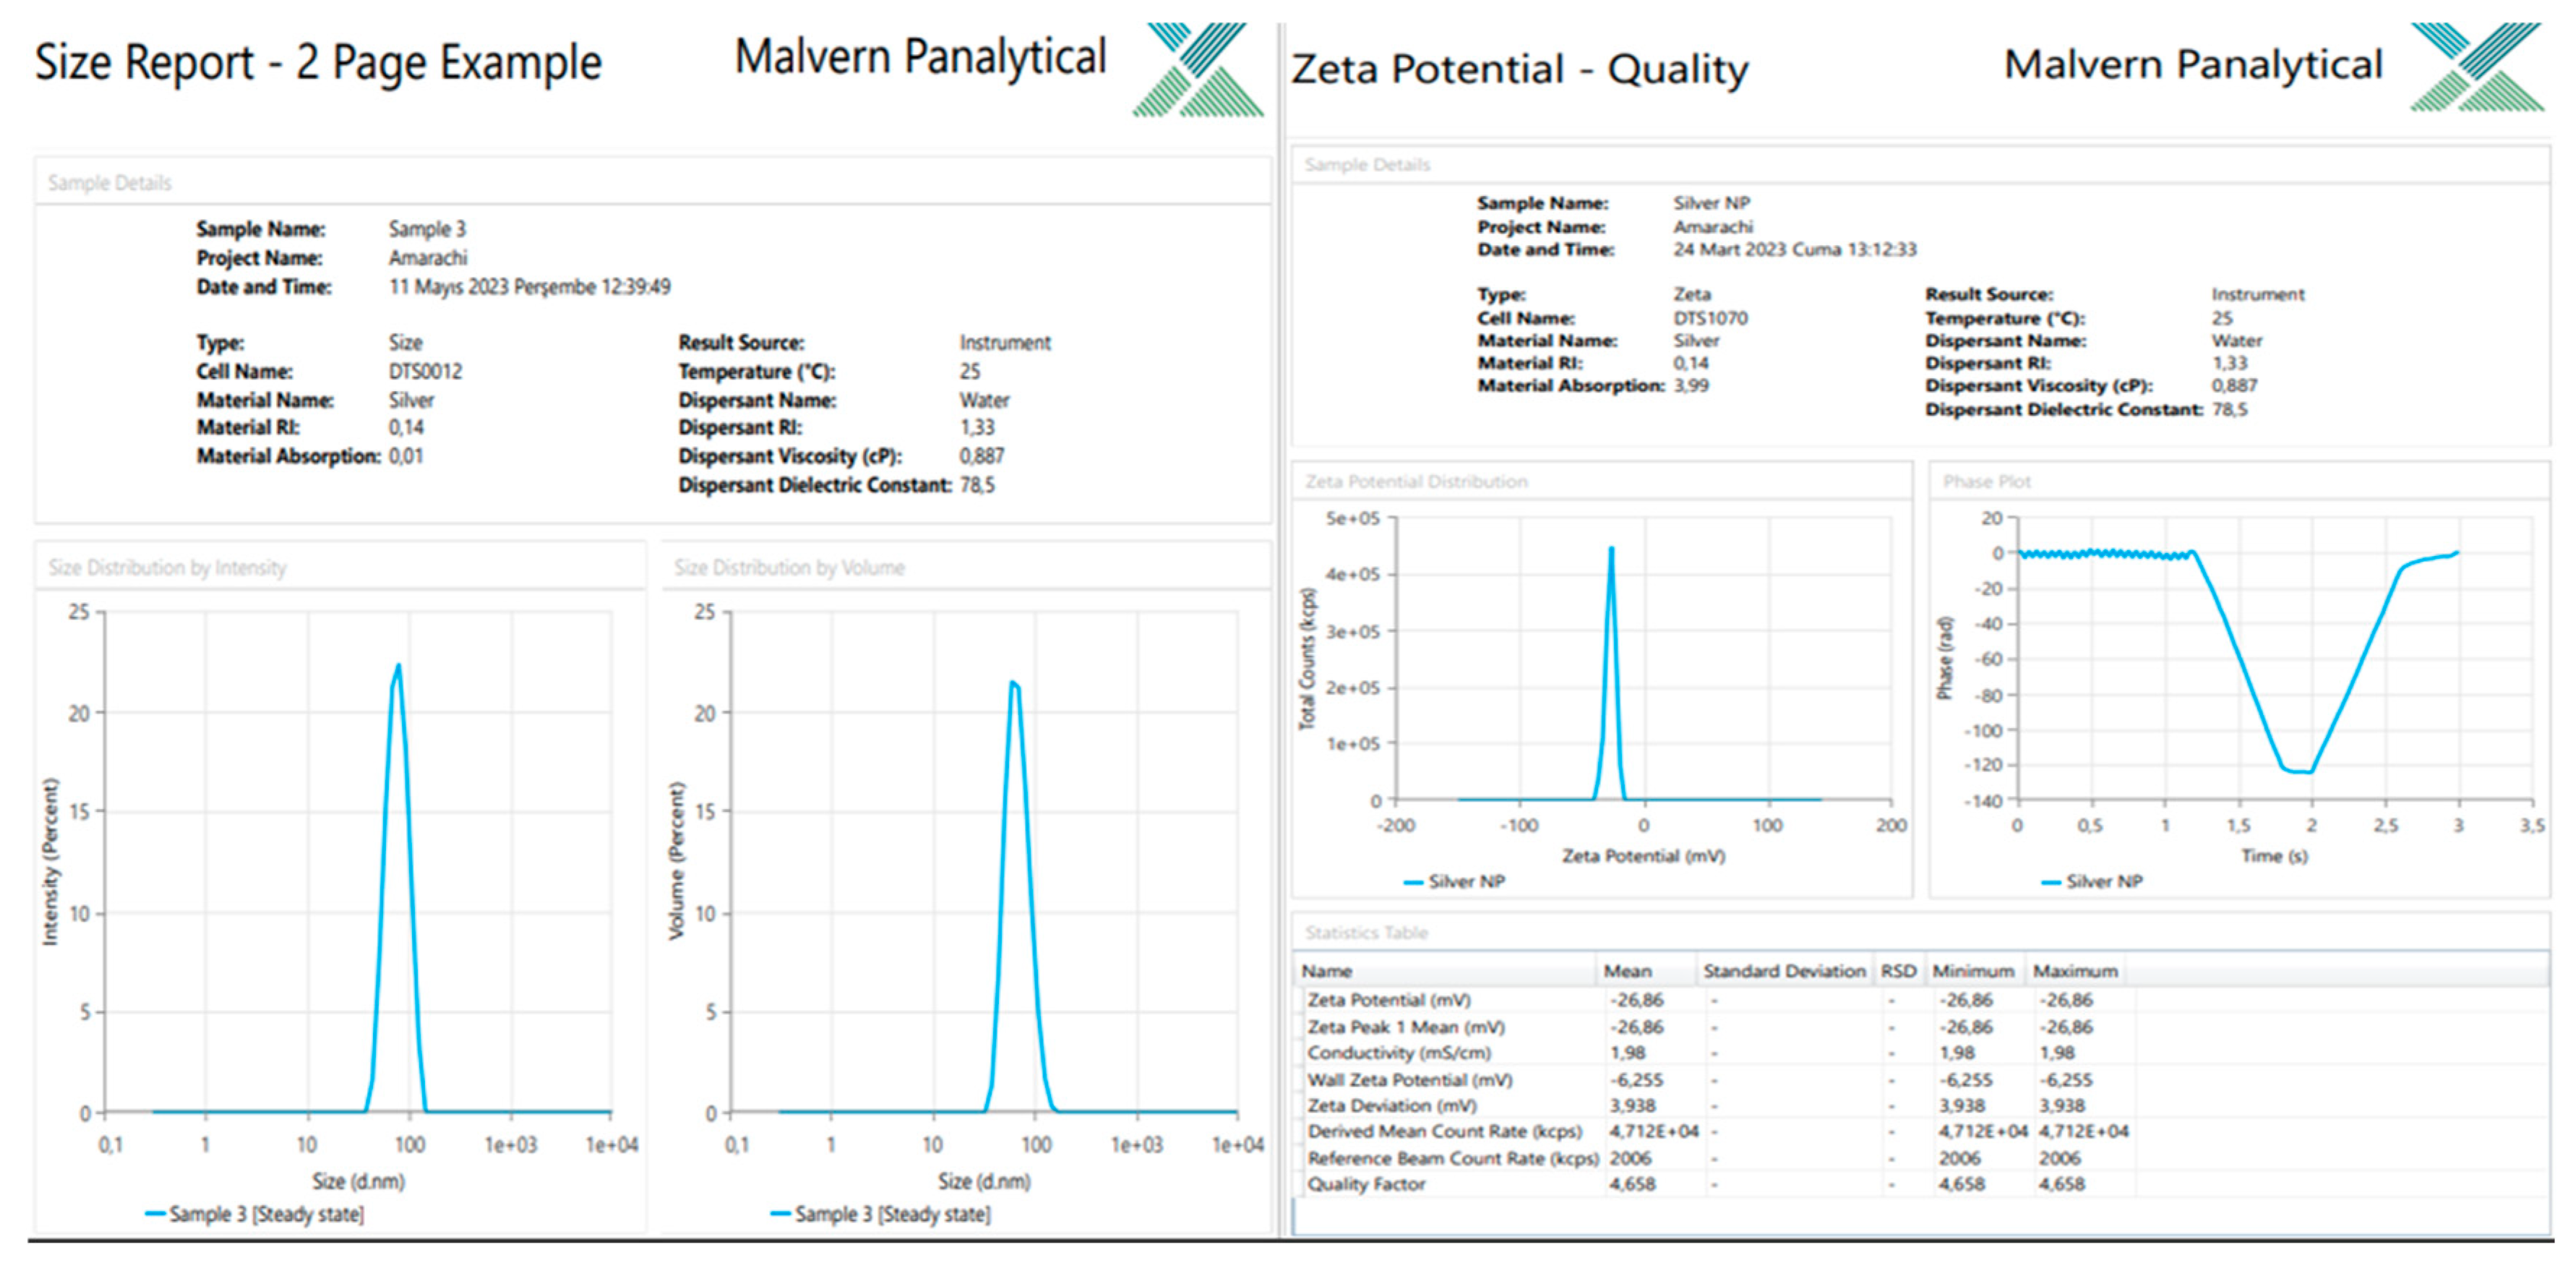
Zeta potentials for the Silybum marianum silver nanoparticles were -26 mV, indicating that the distributed nanoparticles in the suspension had negative charges. The average zeta size was 94.29 nm. The zeta potential shows that they are at the aggregation limit, which may not likely assist drug-induced protein absorption but may enhance electrostatic and steric stabilization.
Figure 7.
Result of the Zeta size and charge of nanoparticles.
Figure 7.
Result of the Zeta size and charge of nanoparticles.
DPPH Assay
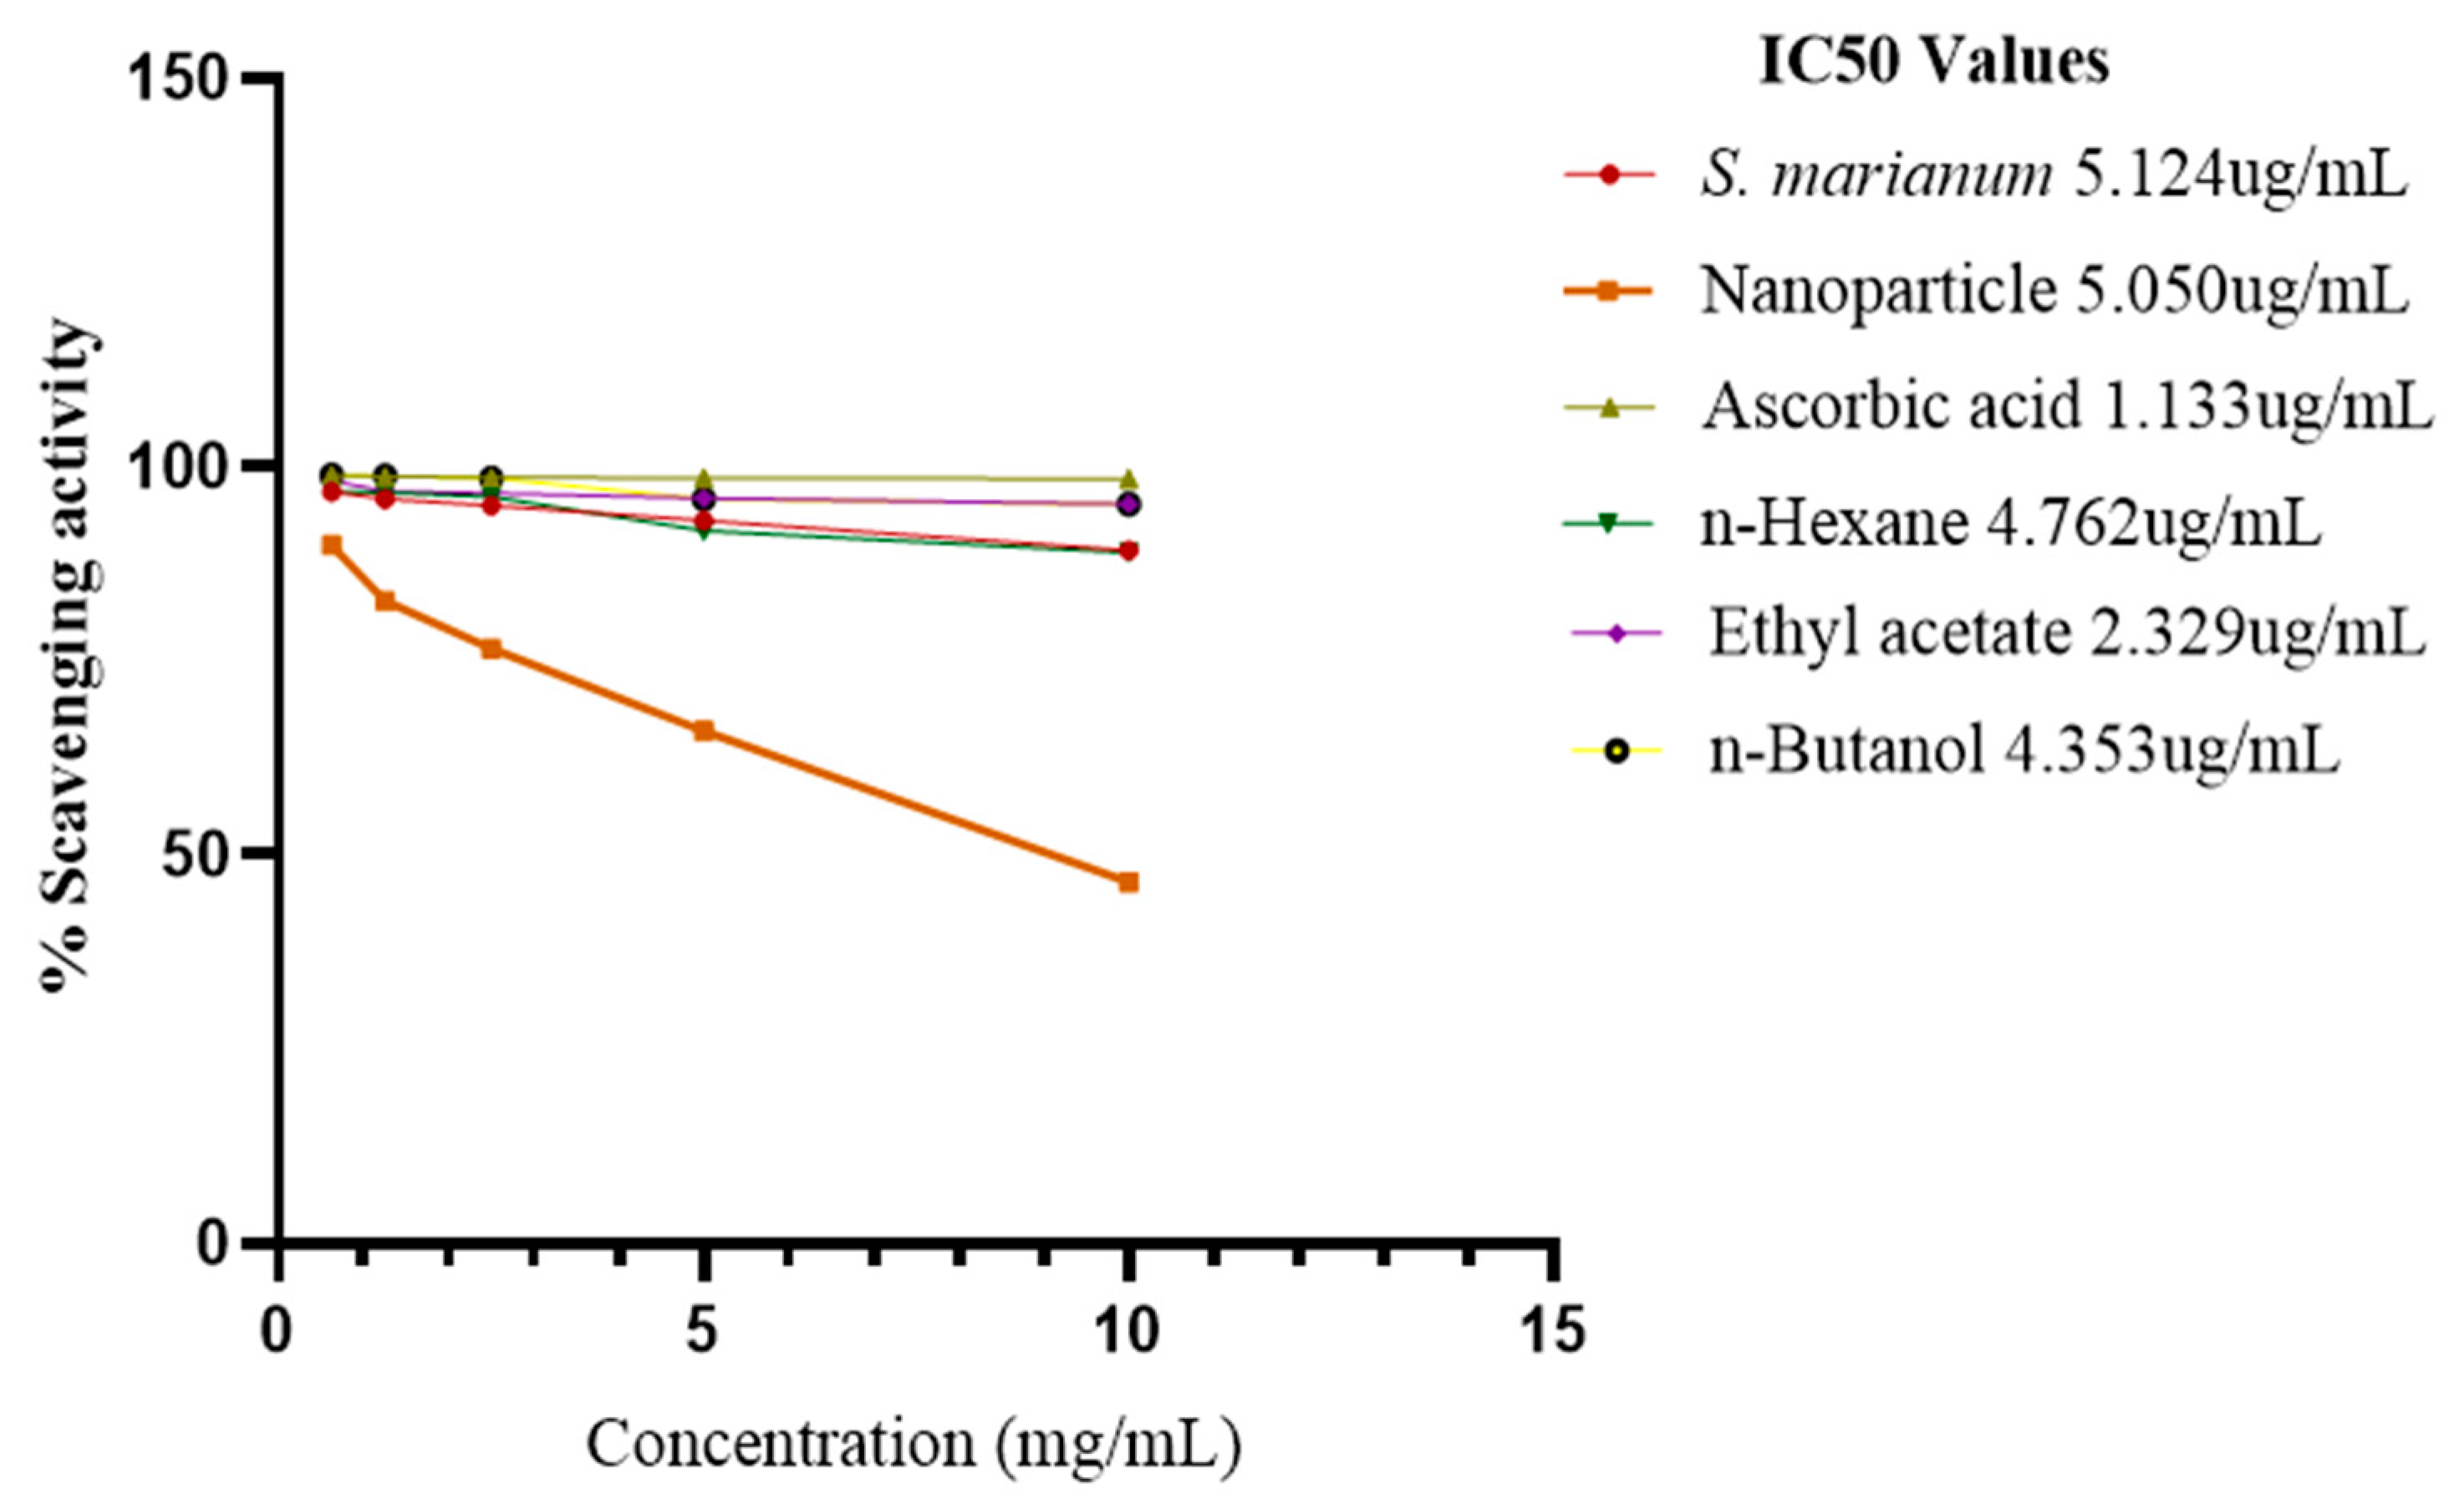
A lower IC
50 value implies better antioxidant activity, semi-polar subfraction of methanol water extract of
S. marianum have the highest antioxidant activity (IC
50 = 2.329 ± 0.1 μg/mL) which is close to the standard ascorbic acid (1.133 ± 0.1 μg/mL). The DPPH radical scavenging activity of the plant extract, the three fractions and ascorbic acid increased in the order of Ascorbic acid as the concentration decreased. Ascorbic acid was > ETOAC semi-polar fraction > n-Butanol polar fraction > n-Hexane fraction > nanoparticles > methanol water plant extract of
S. marianum as shown in and
Figure 8.
H2O2 ASSAY
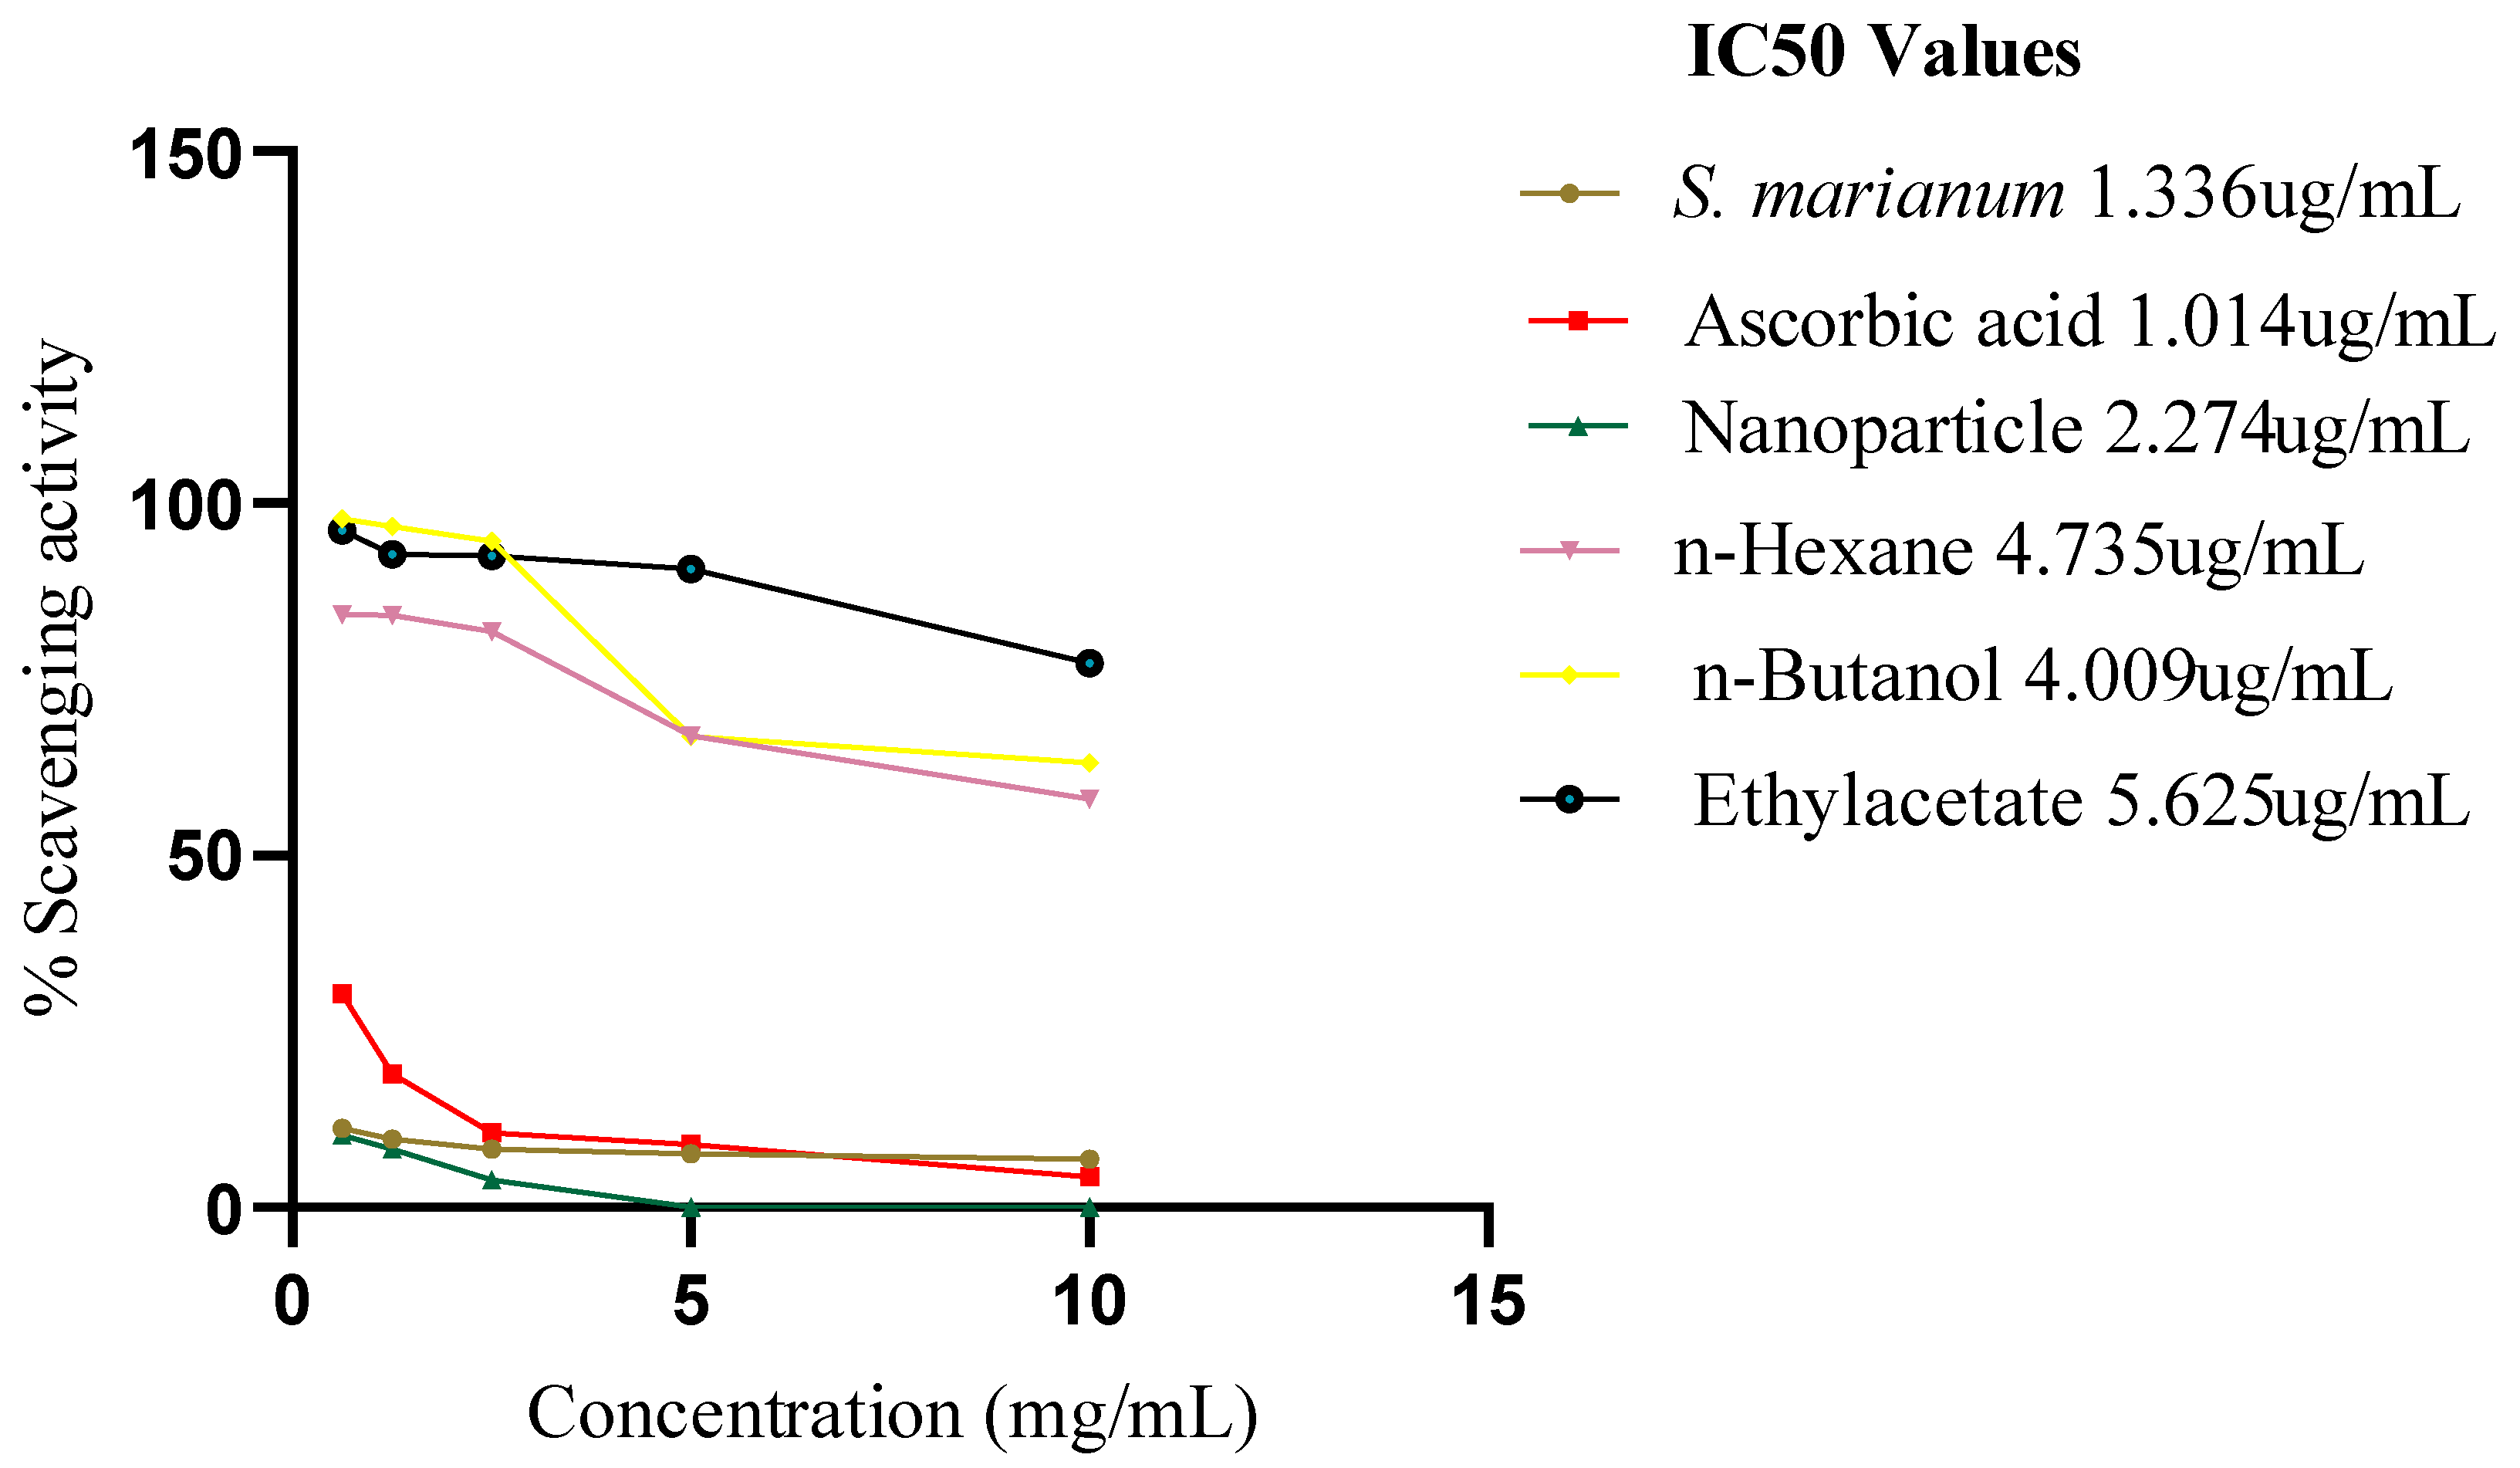
Figure 4.9 provide the outcomes of the H2O2 scavenging activity. H2O2 is extremely significant due to its capacity to cross cellular membranes. Based on the IC50 values of the extract, AgNPs, three fractions and ascorbic acid, activation in the plant sample was higher (1.336 ug/mL ± 0.2) which is closer to the standard ascorbic acid (1.014 ug/mL) than the AgNPs (2.274 ug/mL ± 0.5) and this could be because of the AgNPs resistance to dissolving in H2O. Among the three fractions, n-Butanol depicted the highest scavenging activity of IC50 4.009 ug/mL, n-Hexane IC50 4.735 ug/mL and ETOAC IC50 5.625 ug/mL which had the lowest scavenging activity.
Figure 9.
IC50 graph of H2O2 assay.
Figure 9.
IC50 graph of H2O2 assay.
Carotene Extraction
A specific type of low polarity secondary metabolite that is present in plants is called carotenes. The best method for extracting carotene is thus to use a non-polar solvent (petroleum ether). Water shouldn't be present in the sample at any stage when the extraction is being done because of its polar nature. Water will stop the extraction solvent's diffusion-based extraction of the carotenes. It was necessary to repeat the extraction process at least eight times.
Figure 10 illustrates the steps in the extraction of beta-carotene. Since the orange color indicates a high carotenoid concentration, a rising carotene extraction rate will cause the orange color to fade (Rini
et al., 2022).
β-Carotene Bleaching Test
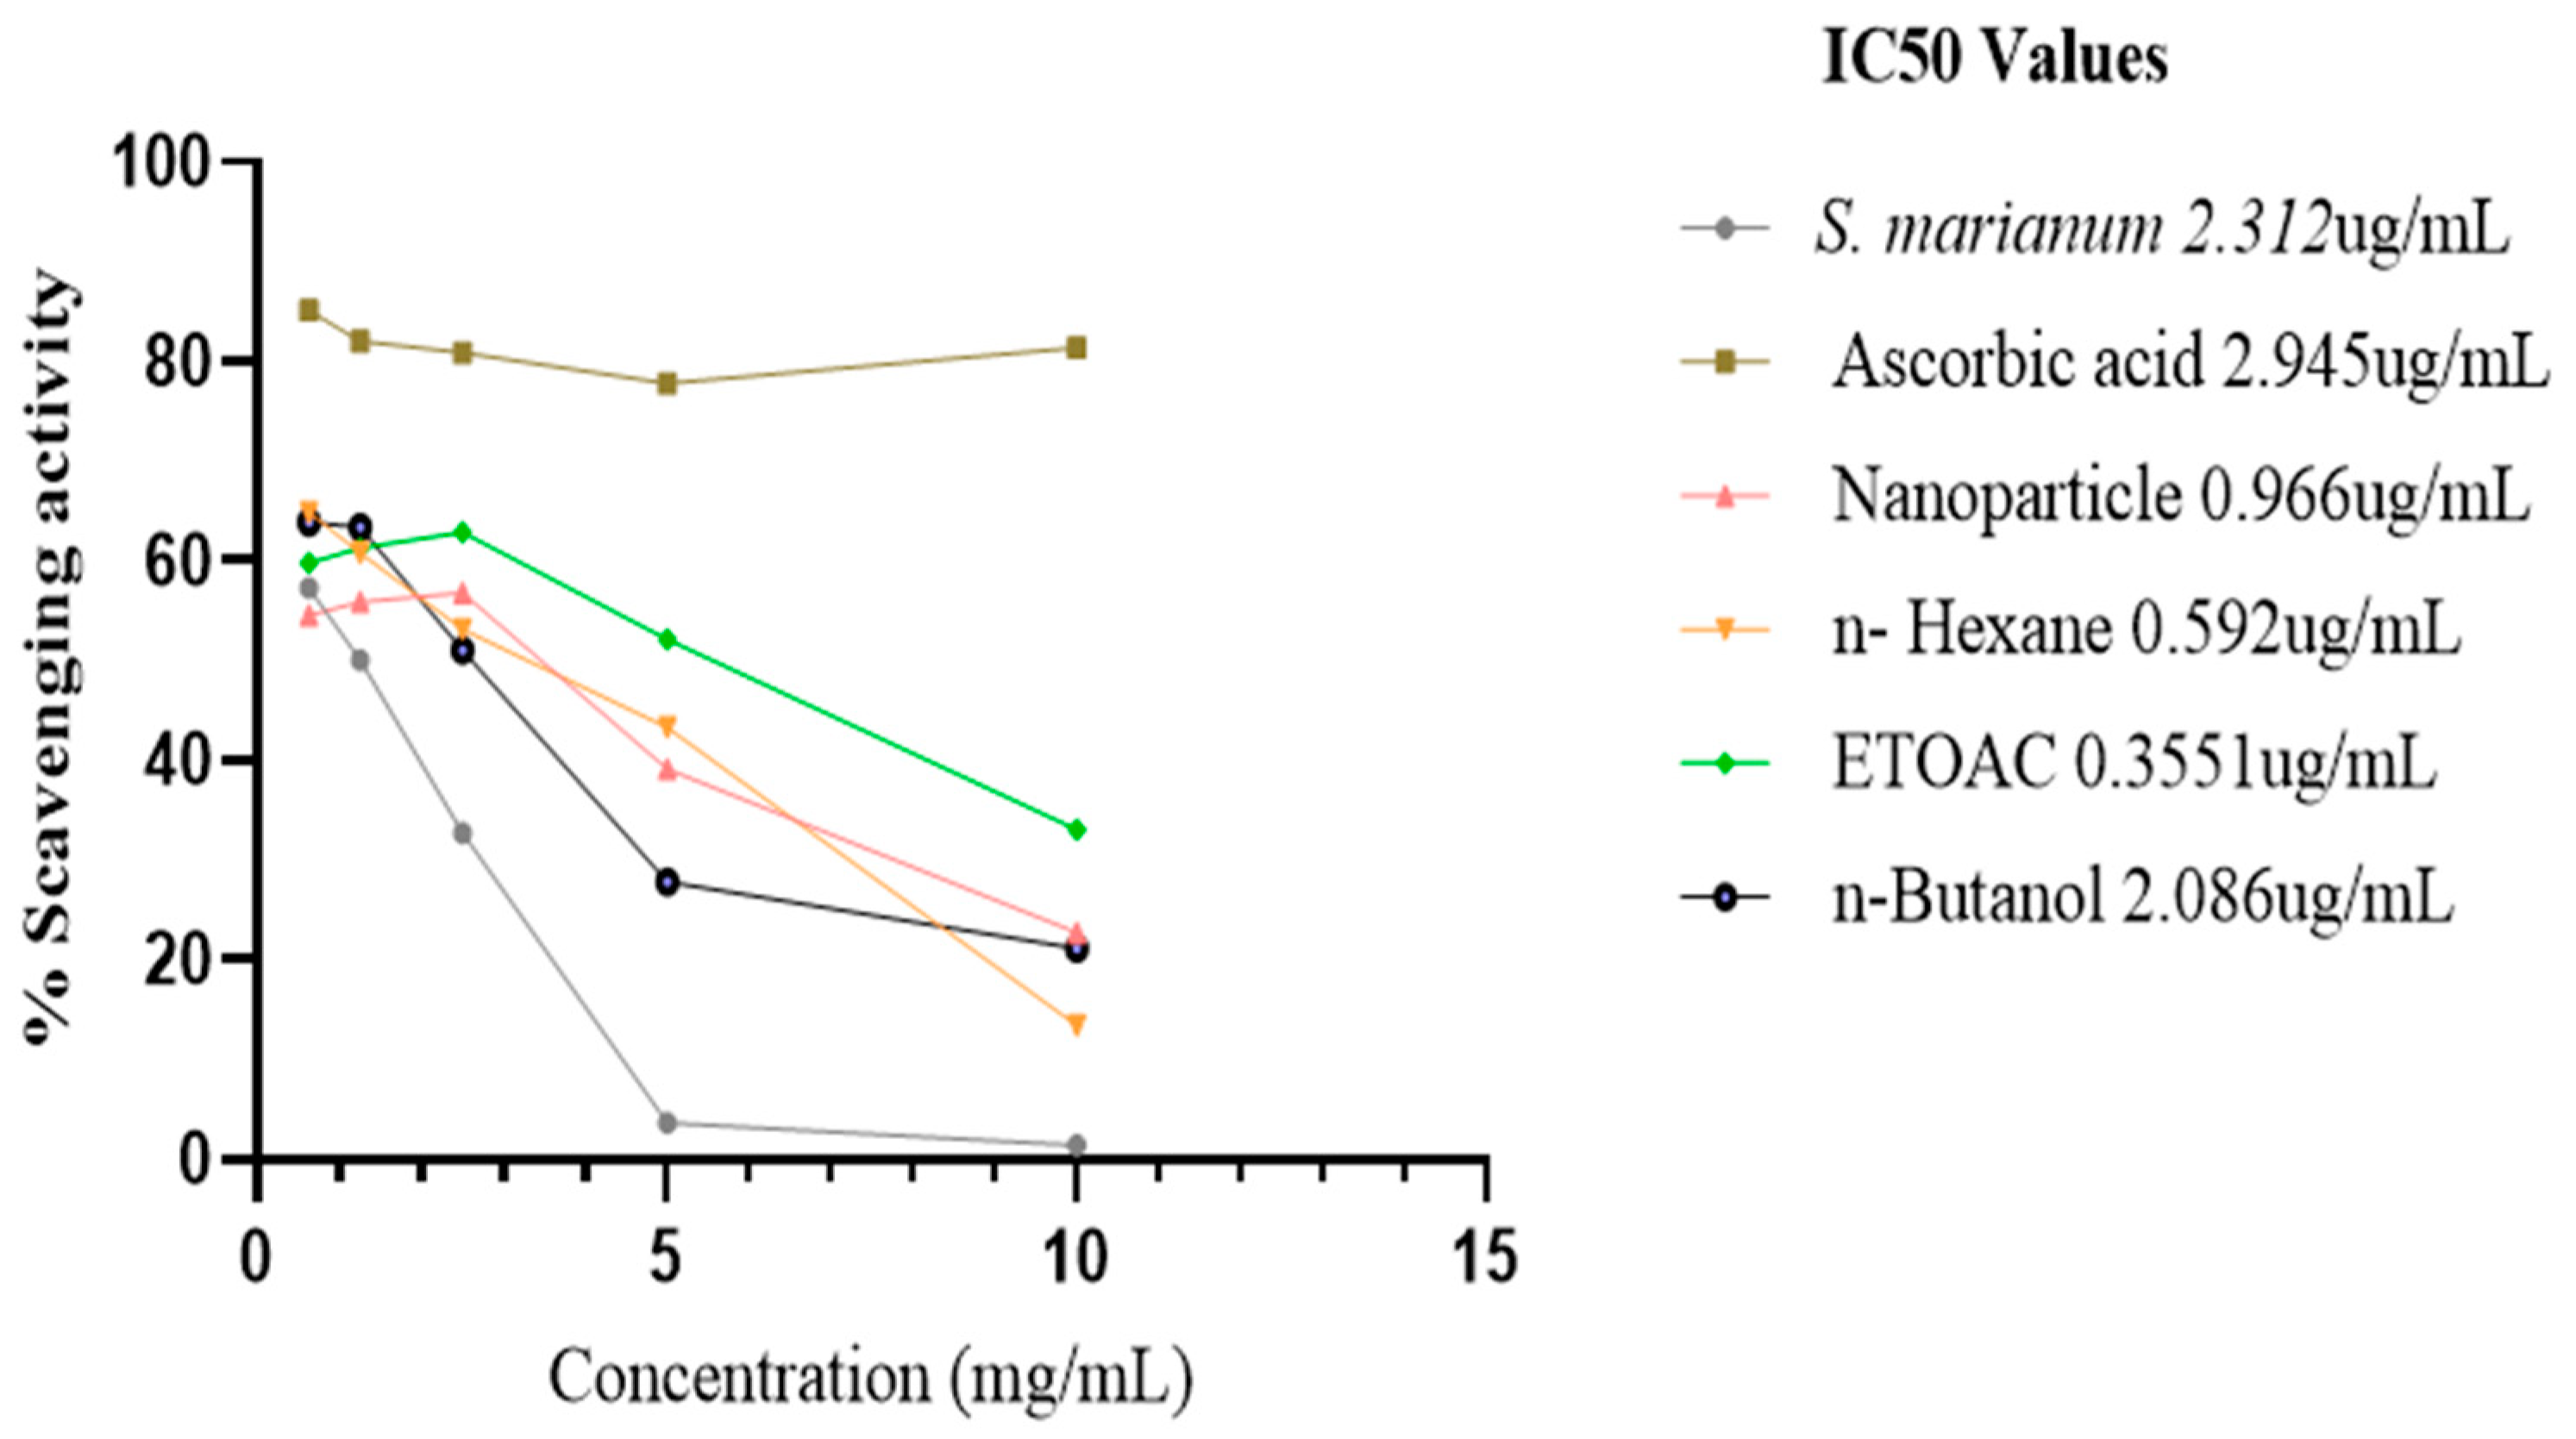
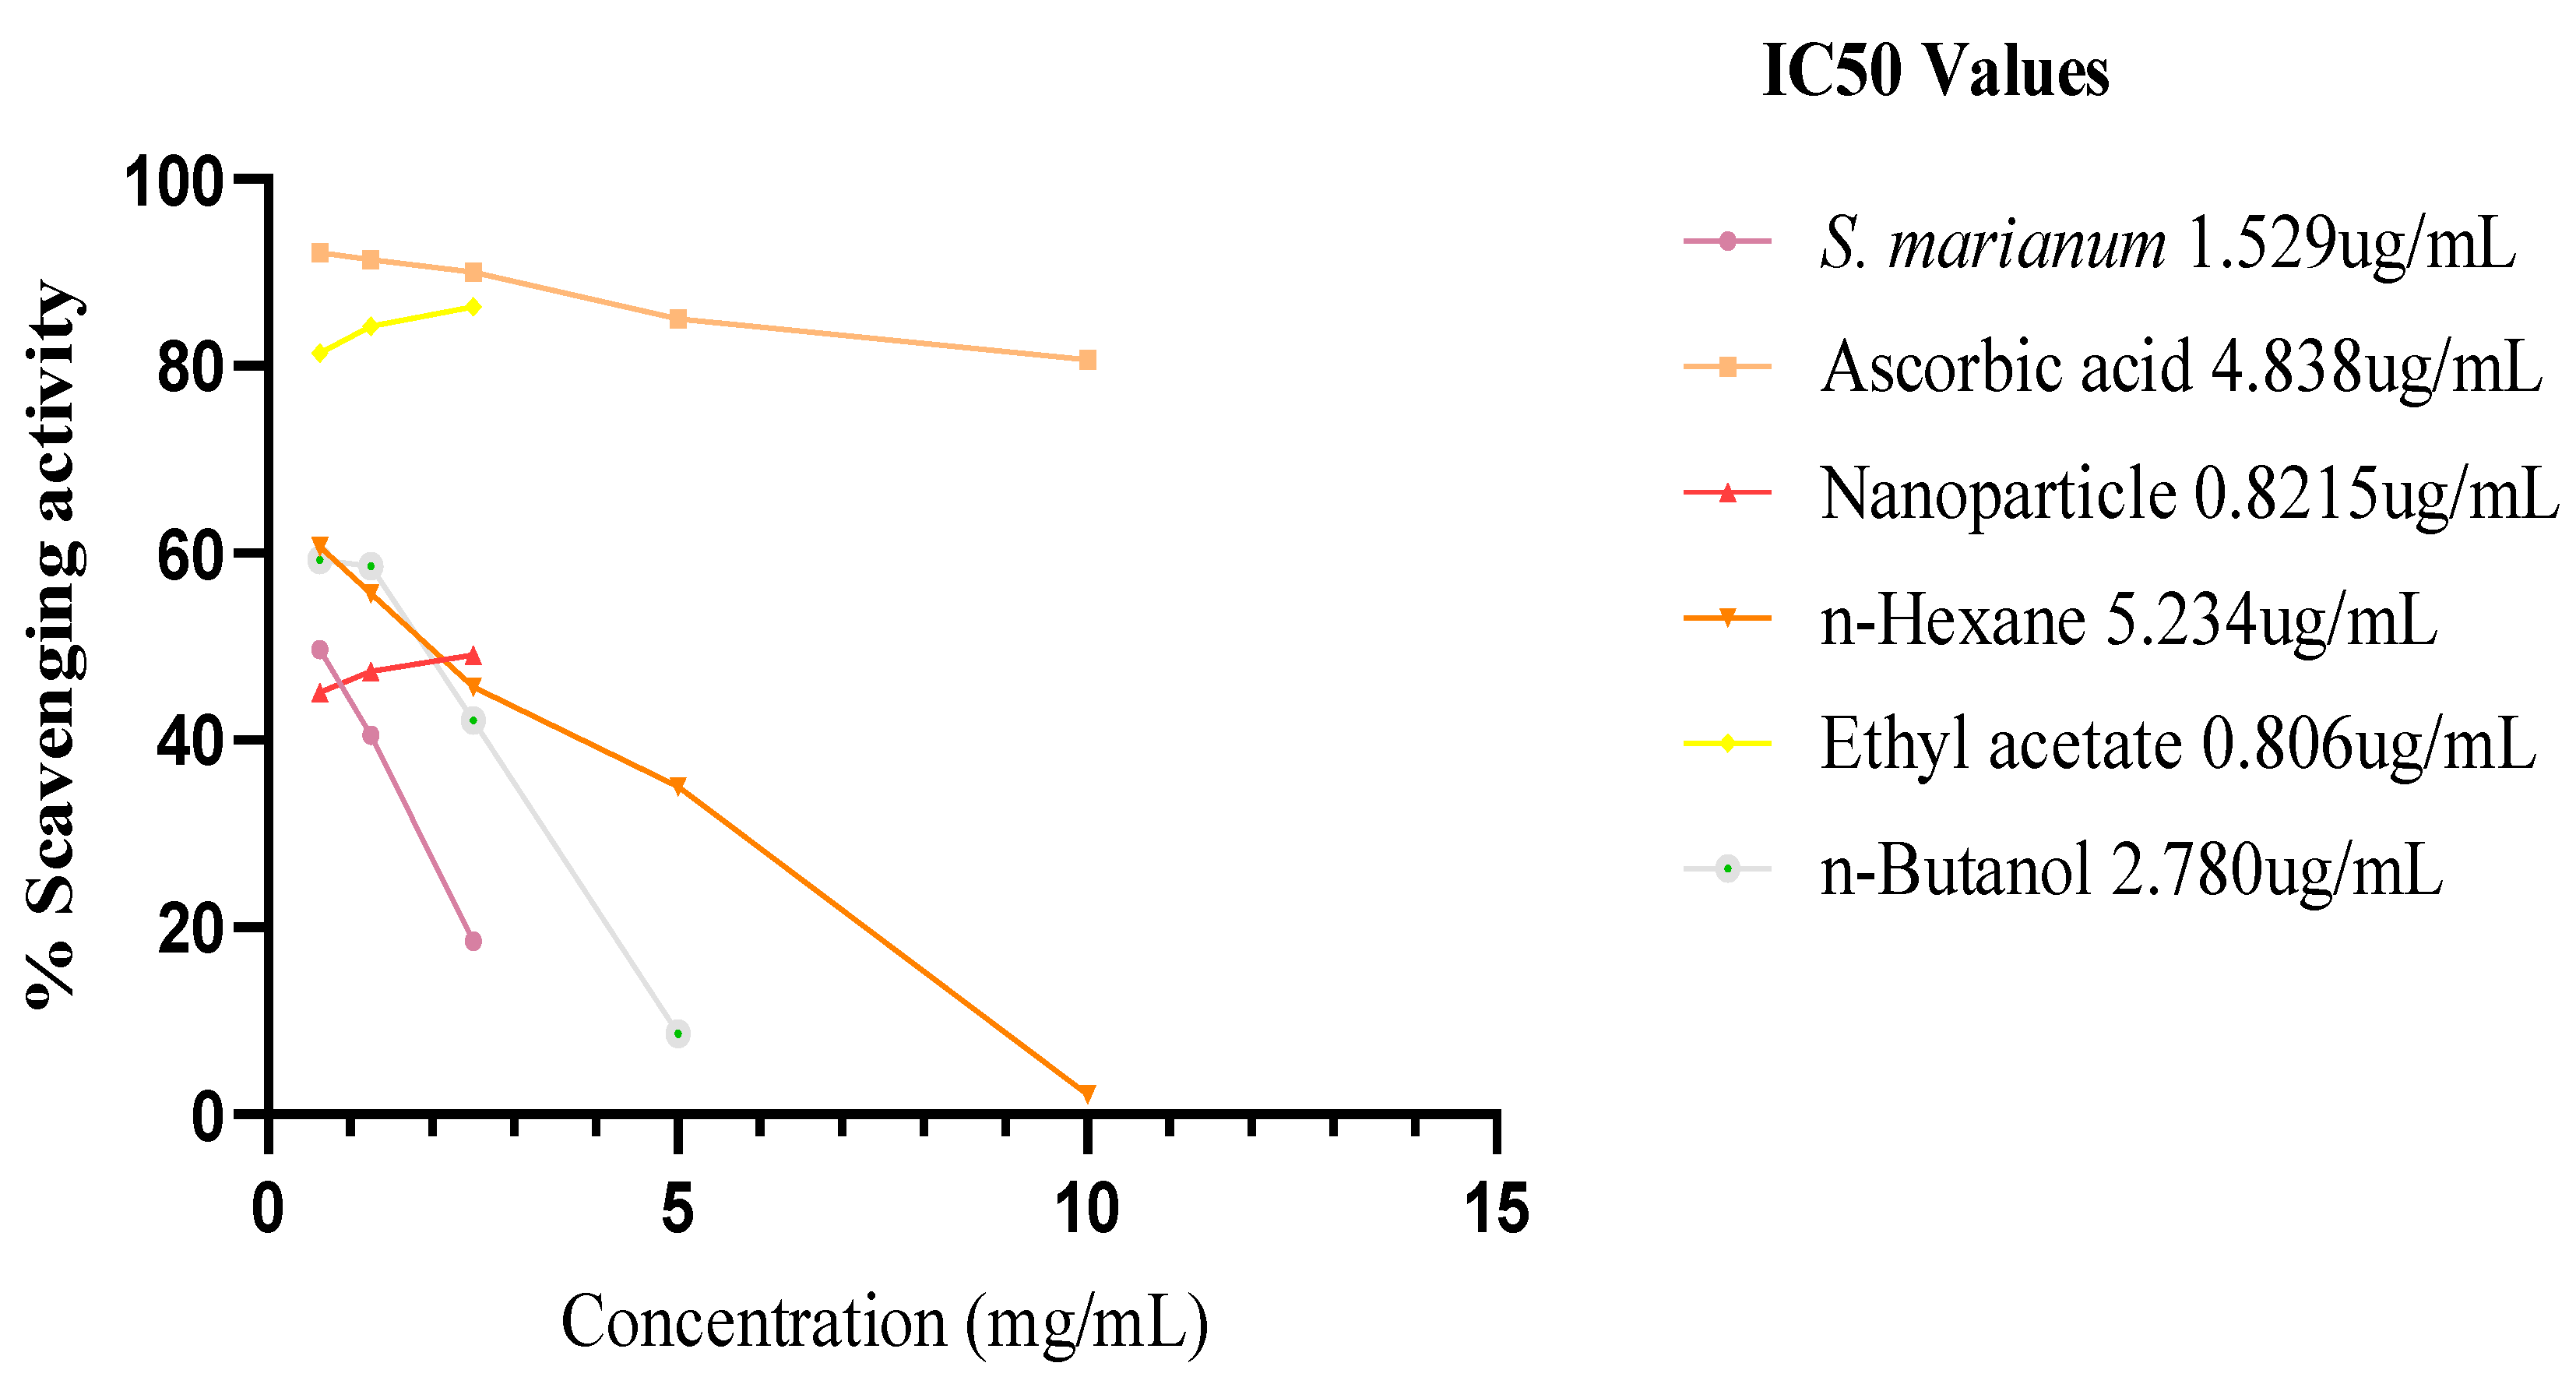
The methanol water extract of S. marianum, nanoparticle and the three fractions of the extract obtained prevented the bleaching β-carotene. At 0 hour (time), the IC50 % inhibitory potency of the plant extract, ascorbic acid, nanoparticle, n-Hexane fraction, ETOAC fraction and n-Butanol fraction are 2.312 ug/mL ± 0.5, 2.945 ug/mL ± 0.5, 0.966 ug/mL ± 0.1, 0.592 ug/mL ± 0.1, 0.3551 ug/mL ± 0.5 and 2.086 ug/mL ± 0.5 respectively. The activity of ETOAC fraction was found to be superior to all samples, followed by n-Hexane fraction, which are higher than the ascorbic acid to the inhibition capacity of positive control ascorbic acid. After incubating in a water bath at 50°C for 2 hrs, only the scavenging activity of the plant extract and nanoparticles increased to a lower 1C50 of 1.529 ug/mL and 0.821 ug/mL respectively, n-Hexane fraction and ascorbic acid inhibition capacity reduced significantly by an increased IC50 of 5.234 ug/mL and 4.838 ug/mL respectively, while ETOAC and n-Butanol fractions showed a minimal decrease in the antioxidant activity with an IC50 of 0.806 ug/mL and 2.780 ug/mL correspondingly.
Figure 11.
IC50 graph of β-carotene at 0-time (hour) assay.
Figure 11.
IC50 graph of β-carotene at 0-time (hour) assay.
Figure 12.
IC50 graph of β-carotene after 2 hours assay.
Figure 12.
IC50 graph of β-carotene after 2 hours assay.
Antibacterial Studies
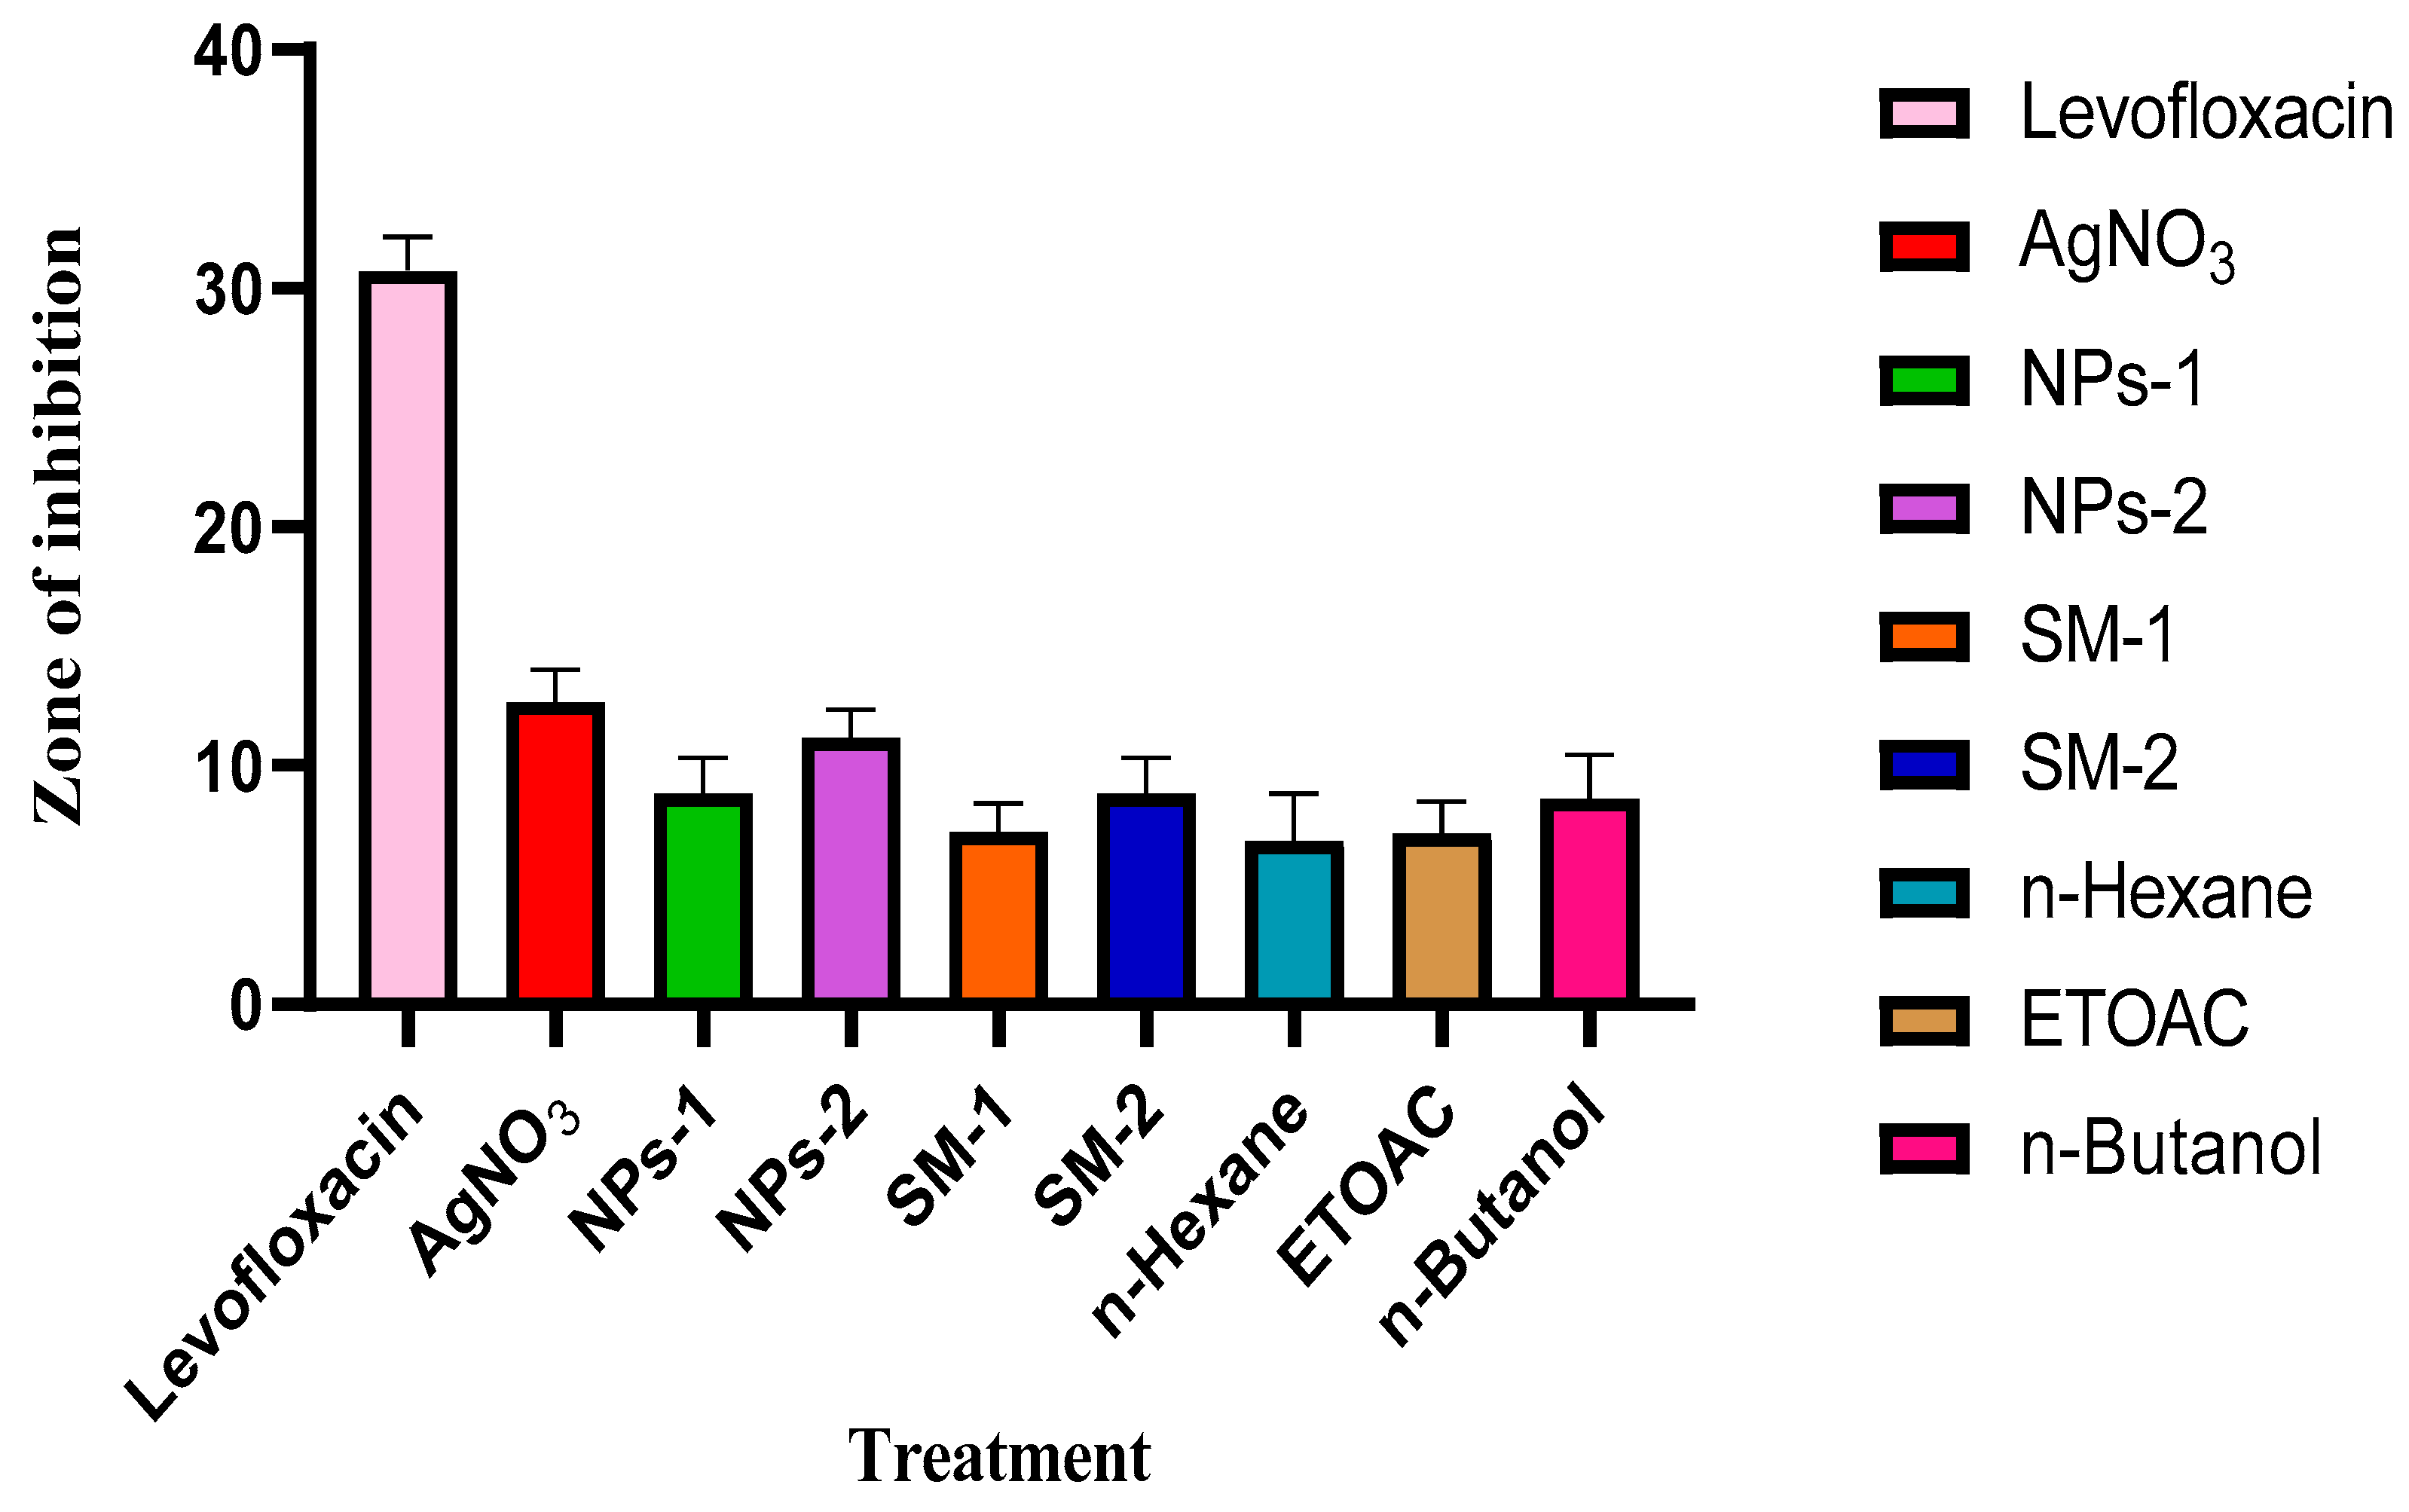
The average inhibition zones for the plant extract concentrations (10 mg/mL and 20 mg/mL) were 7-8 mm and 7-11 mm, respectively, indicating that the inhibition of the plant extract and silver nanoparticles (7-1 mm and 10-13 mm) tends to increase with concentration, whereas the AgNO
3 (5 Mm) showed 15 mm -11 mm. In comparison, the antimicrobial activity of the AgNPs was superior to that of the methanol H
2O sample, which may be related to the nanoparticle's greater surface area (Lakshman
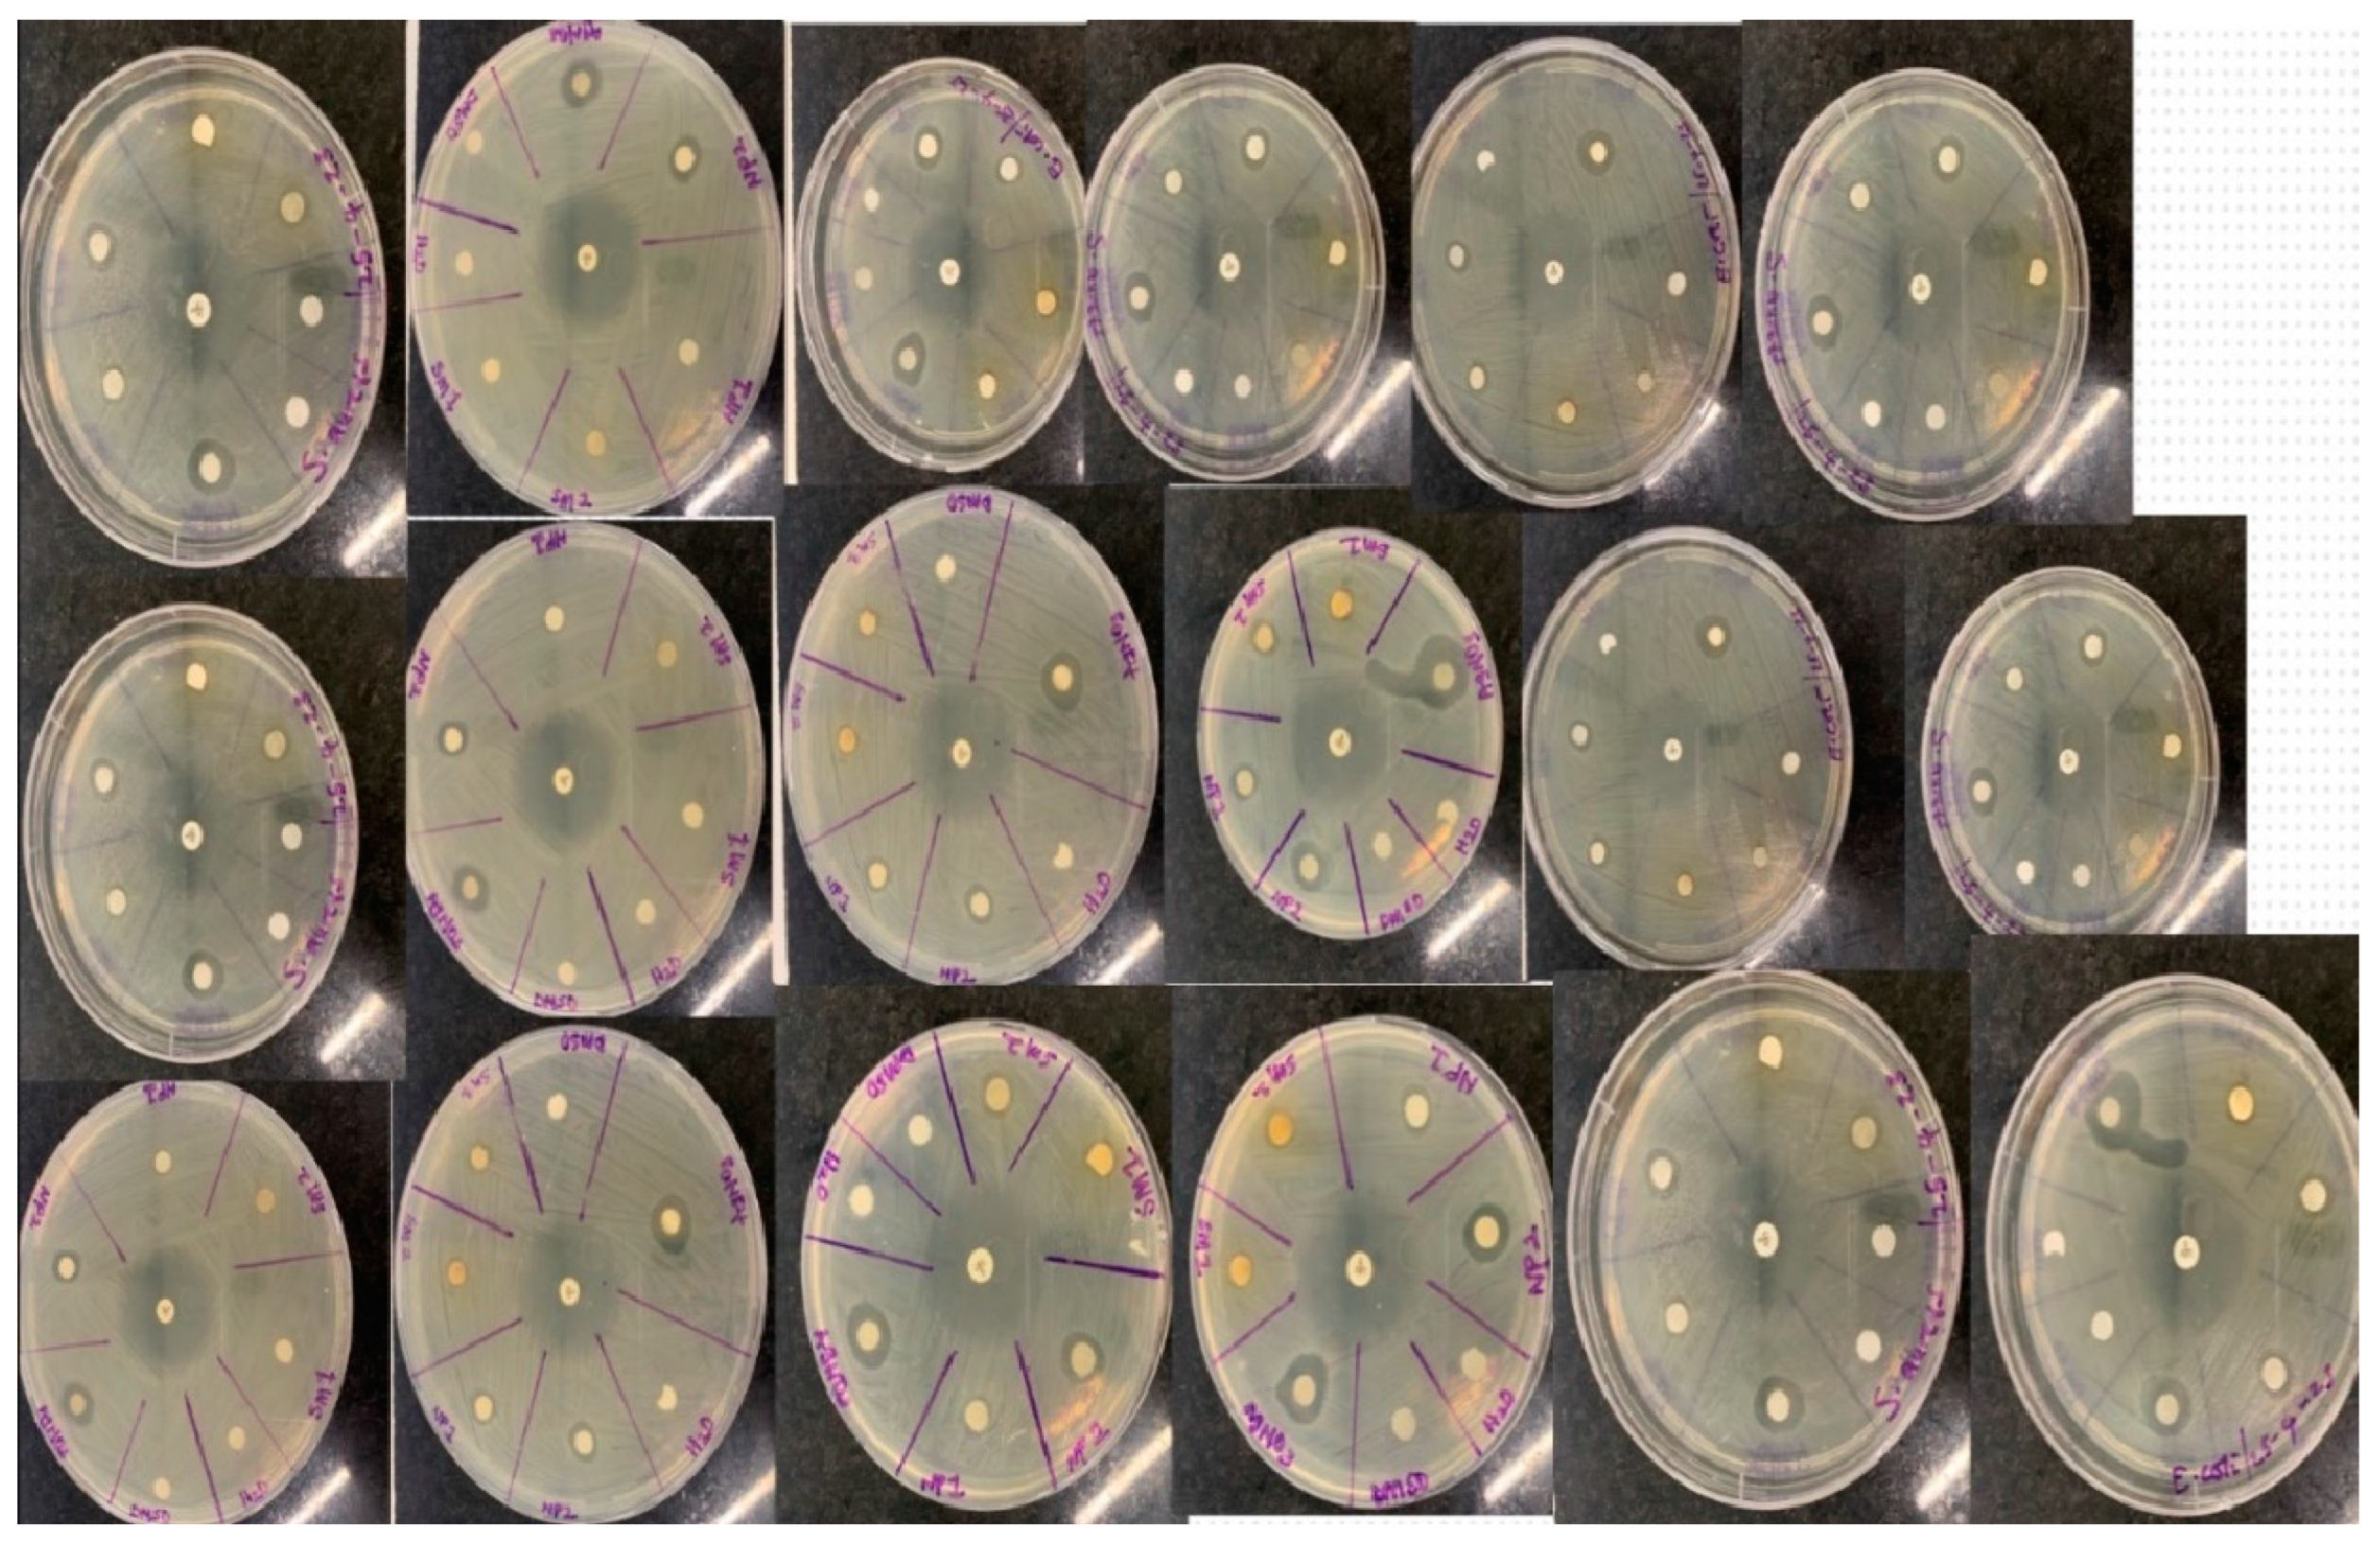
et al., 2021). This might cause the nanoparticles to penetrate through the cell membranes uncontrollably, which would cause cell death (Pratyusha and Debjani, 2015). However, levofloxacin, an antibiotic, performed substantially better than the nanoparticle and the extracts in terms of action. Because the plant extract is very polarizable, the n-Butanol fraction outperformed the other two by having activity ranging from 7 to 11 mm, which is a result of the inhibition of the extract. The mean inhibitory activity of the n-Hexane and ETOAC fractions was 4-9 mm and 7-9 mm, respectively. The suppression of bacterial growth was found to be slightly stronger on the gram-negative bacteria than the gram-positive bacteria when the effects of the samples on bacteria were evaluated. Water and DMSO, used as the negative control, exhibited no action.
Figure 13 illustrates how each bacterial strain reacted to the samples.
Antibiotics (Levofloxacin), AgNO3 (Silver nitrate solution), NPs-a (10 mg/mL of Nanoparticles), NPs-b (20 mg/mL of Nanoparticles), SM-a (10 mg/mL of Silybum marianum leaf extract), SM-b (20 mg/mL of Silybum marianum leaf extract), n-Hexane (non-polar fraction), ETOAC (Ethyl acetate semi-polar fraction), n-Butanol (polar fraction), DMSO (Dimethyl sulfoxide) and water.
Figure 14.
Antibacterial activity of the extracts on bacteria strains.
Figure 14.
Antibacterial activity of the extracts on bacteria strains.
Minimum Inhibitory Concentration
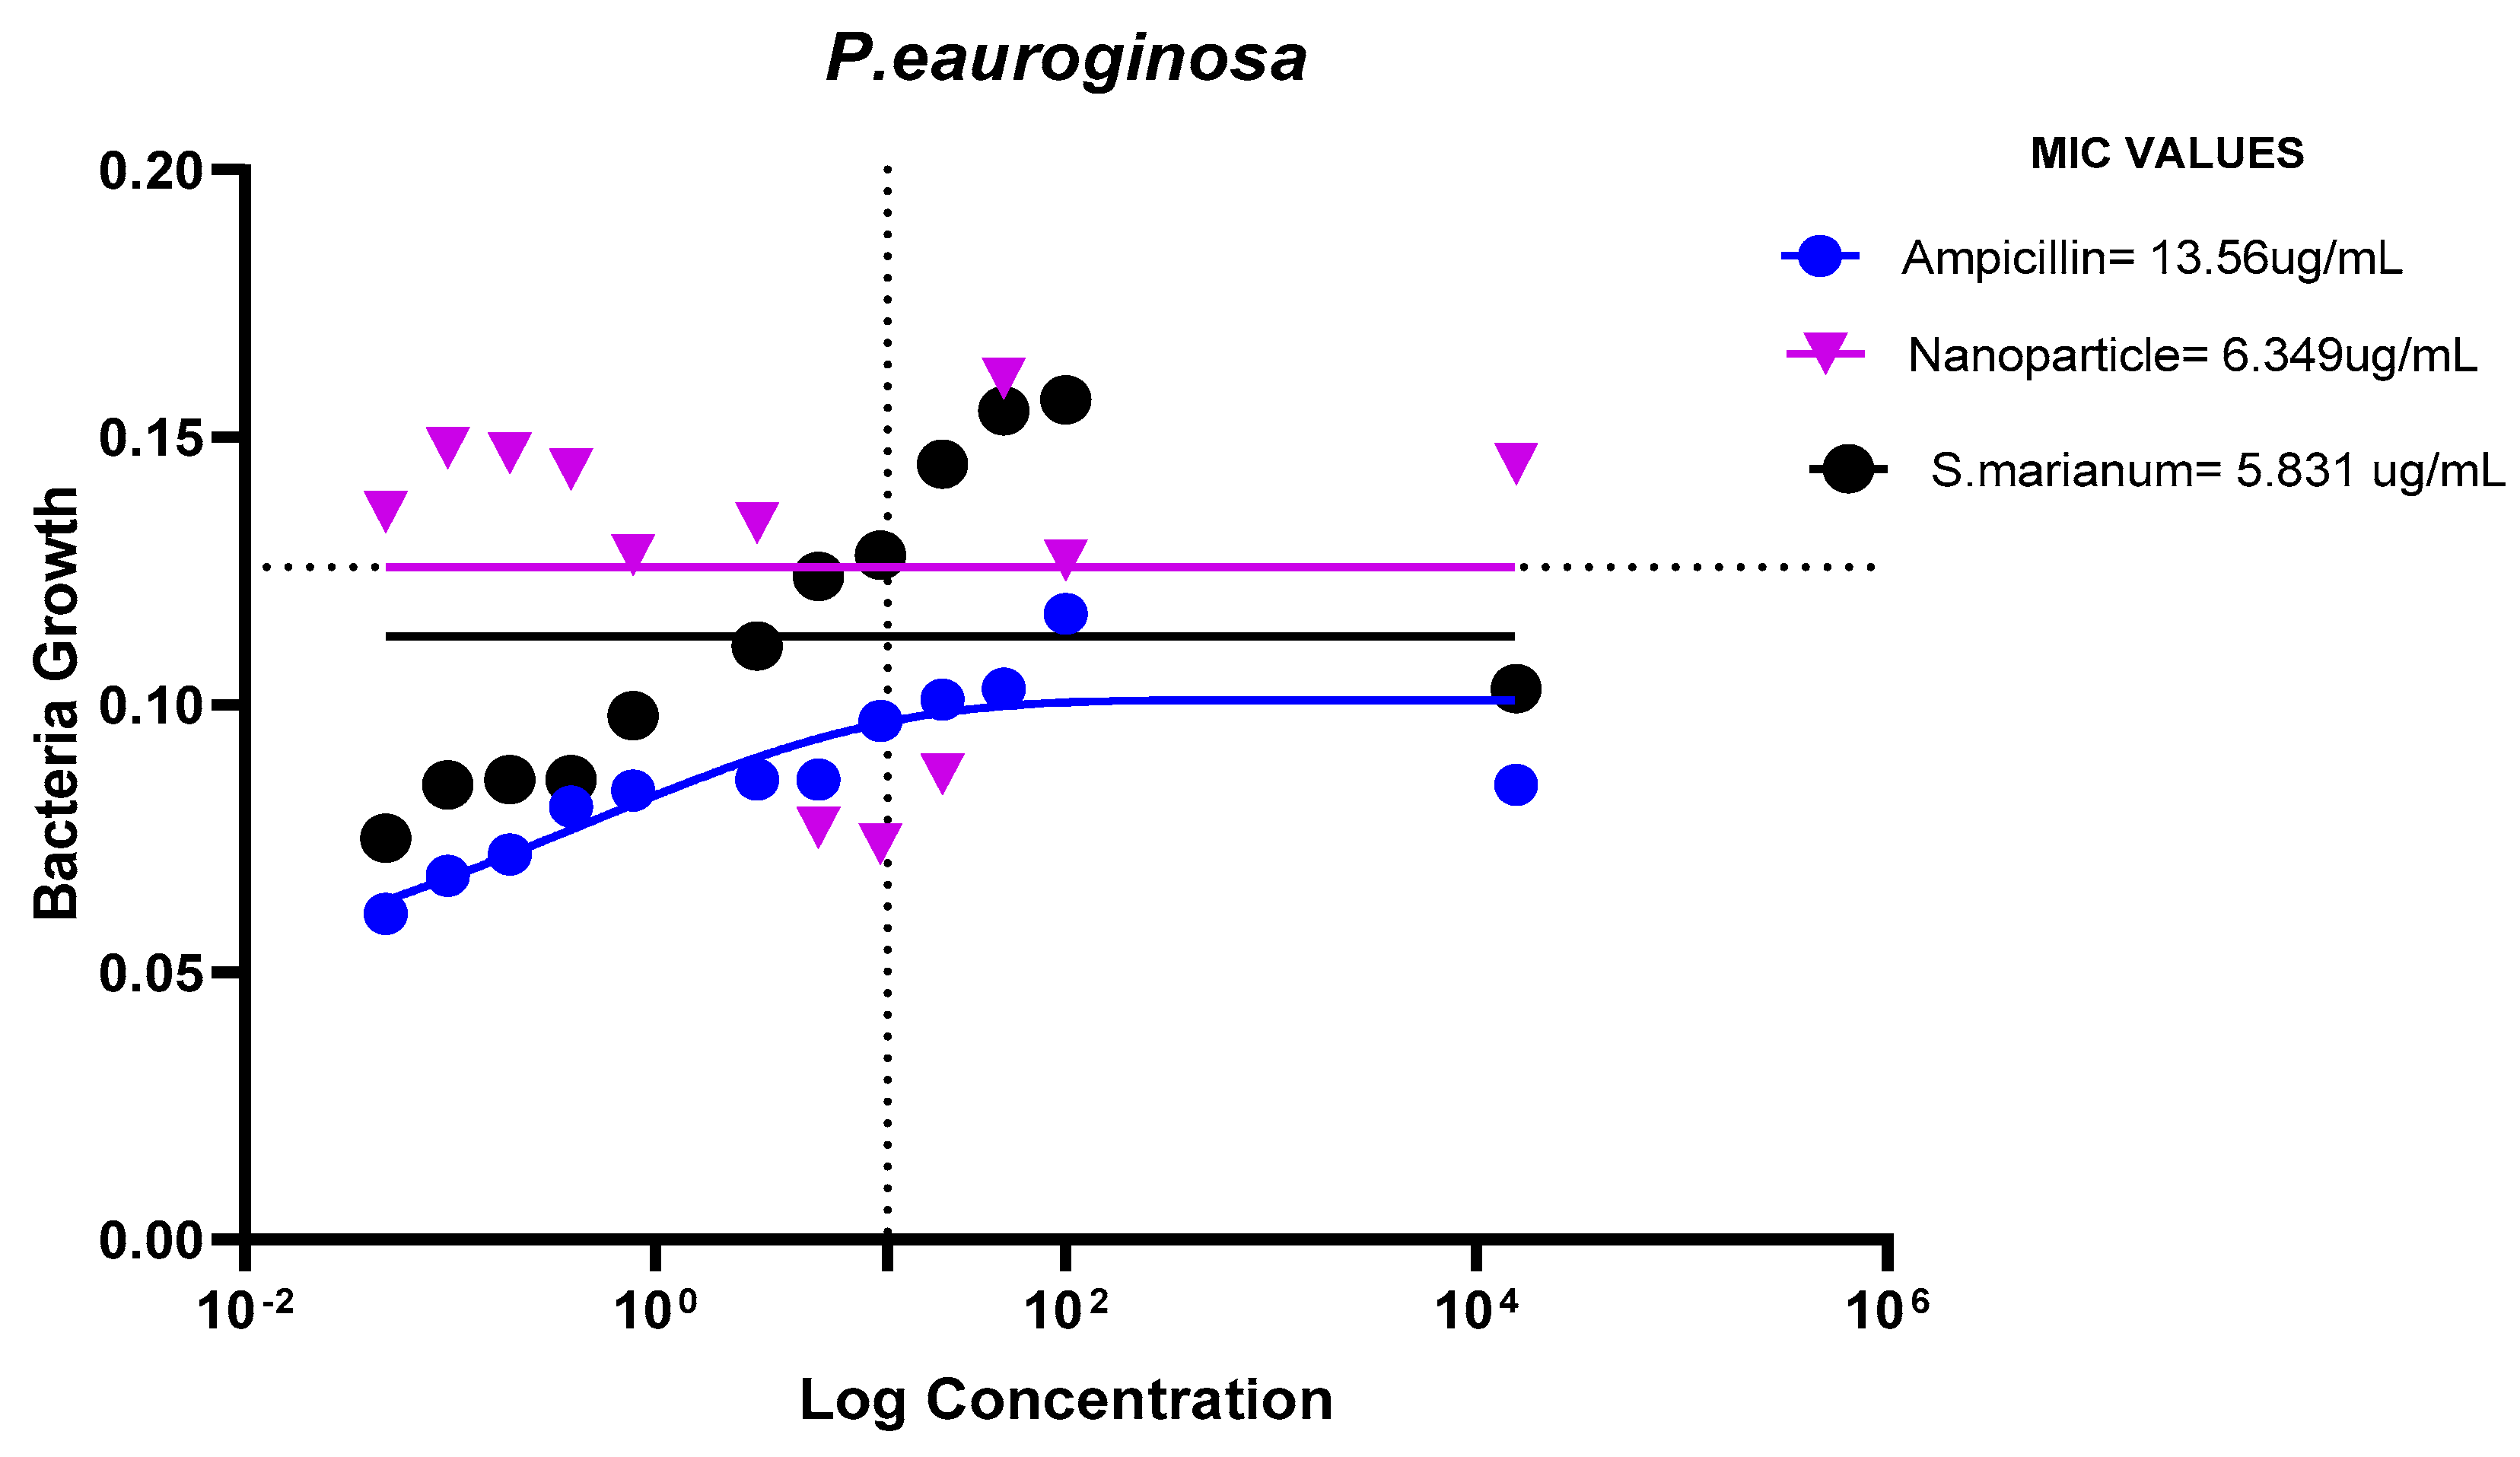
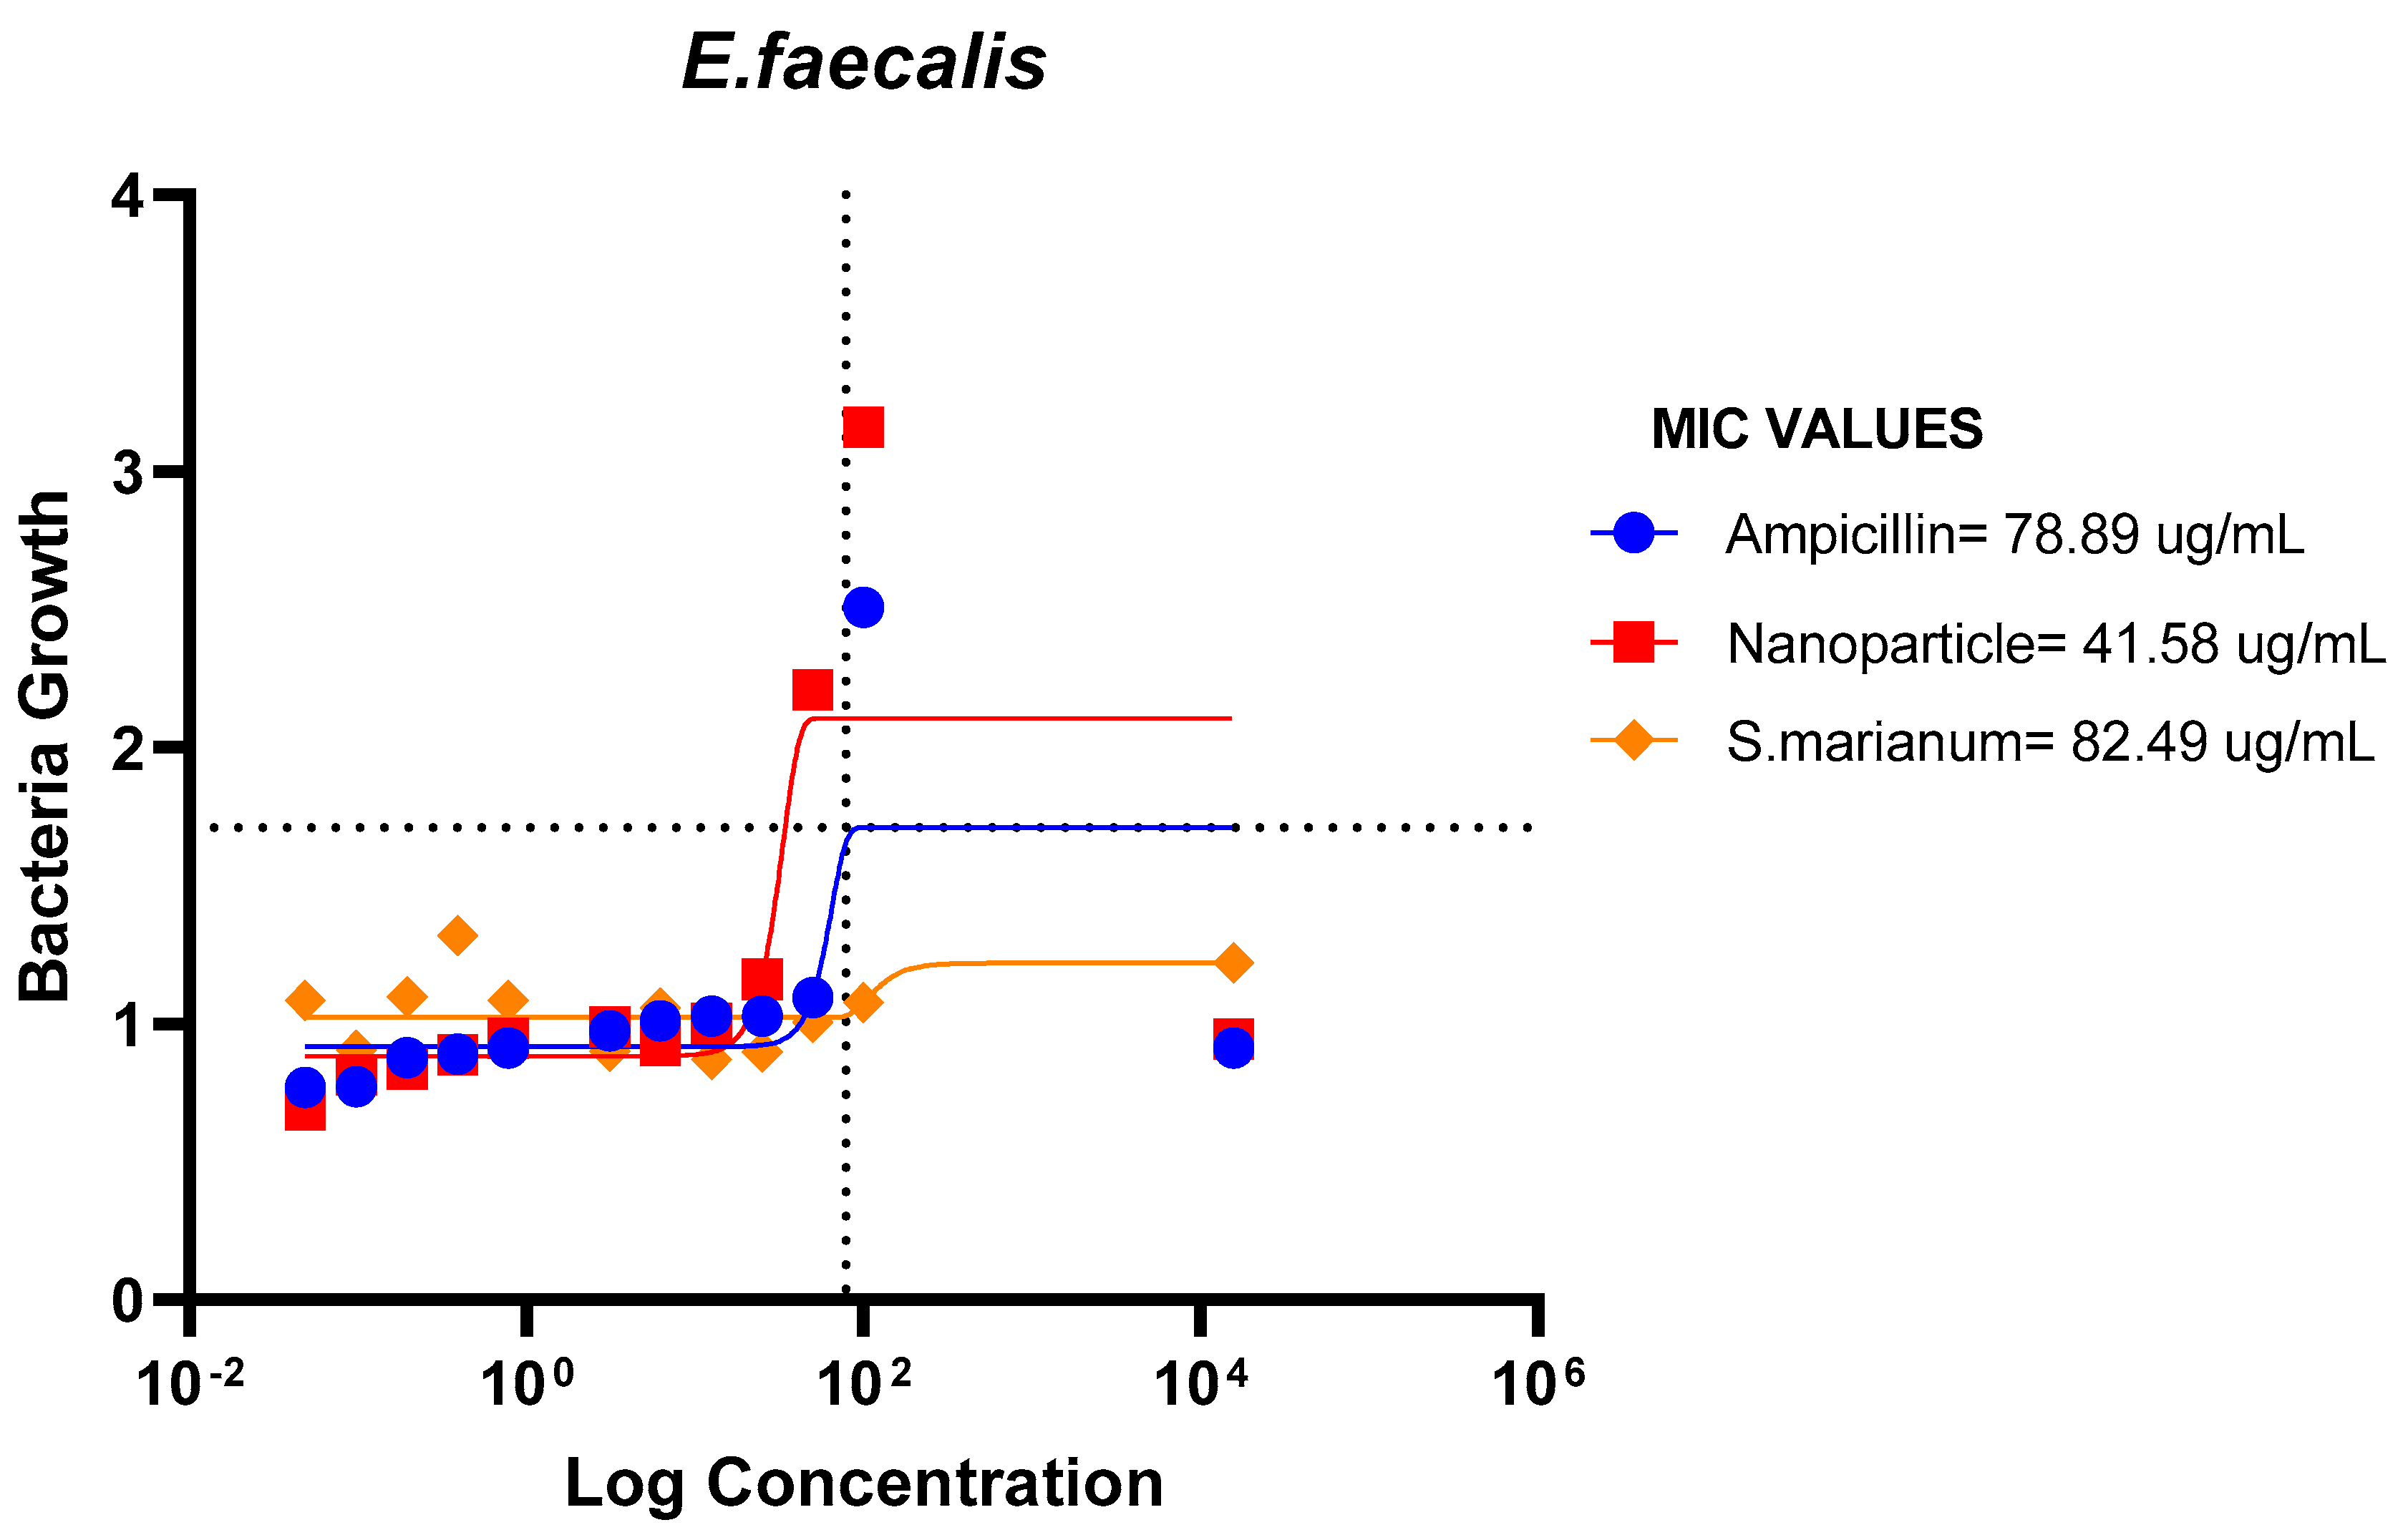
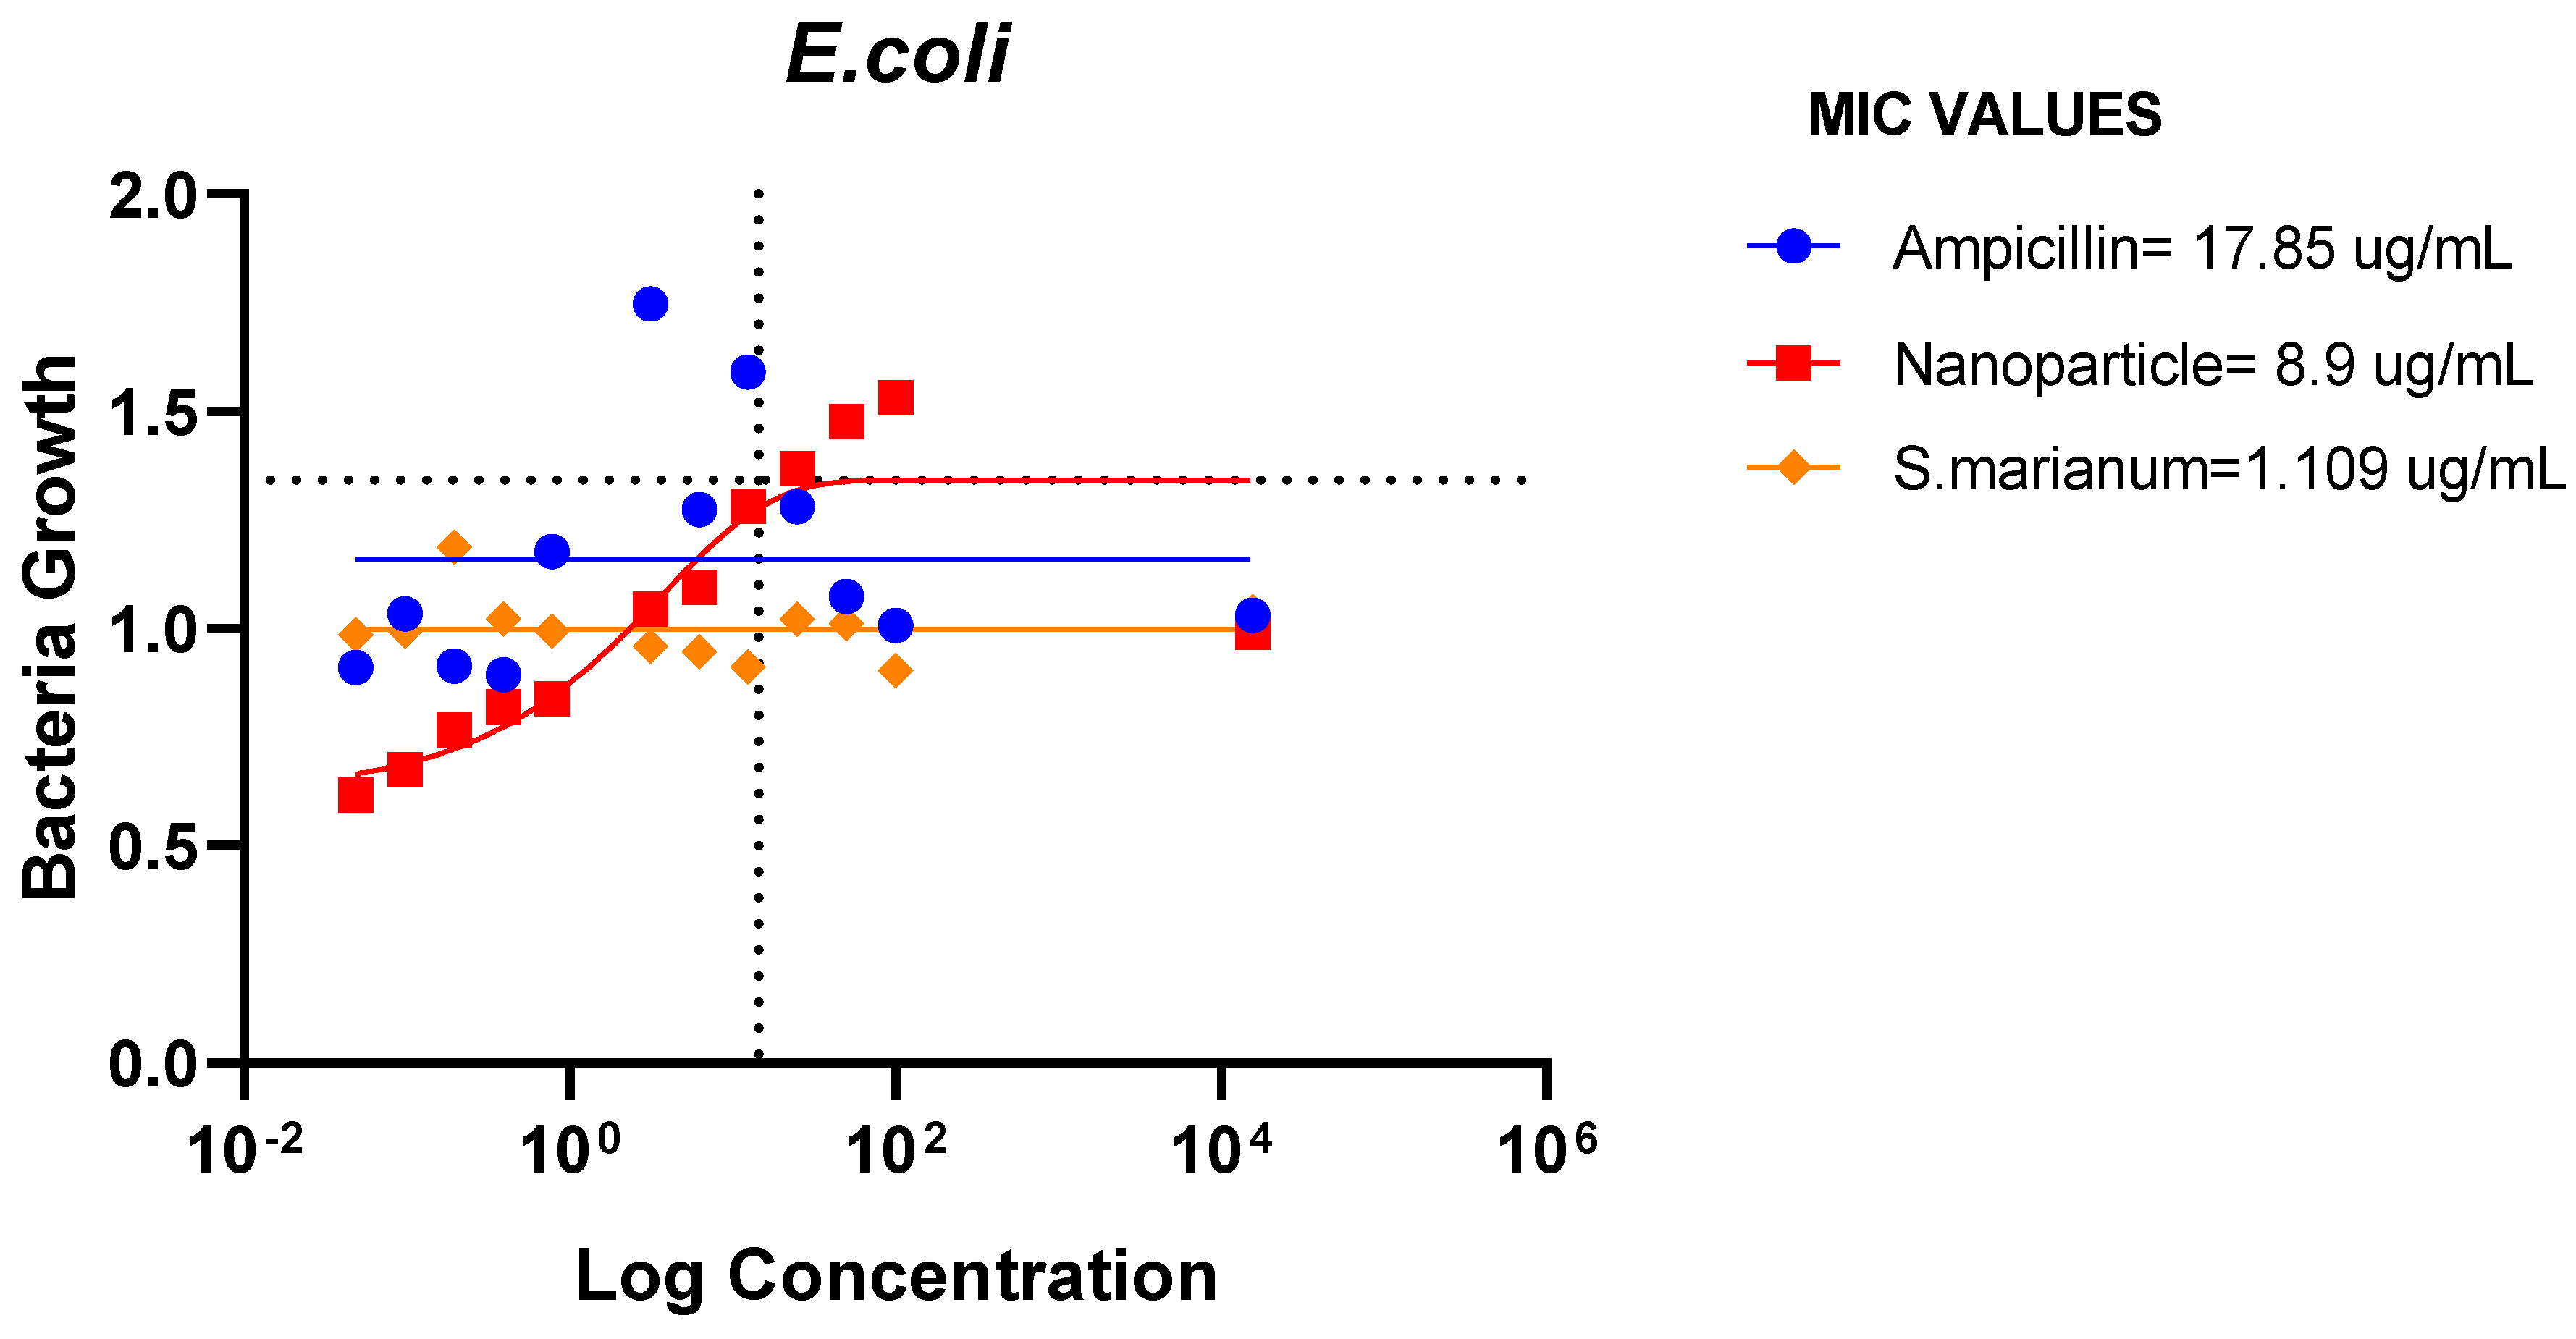
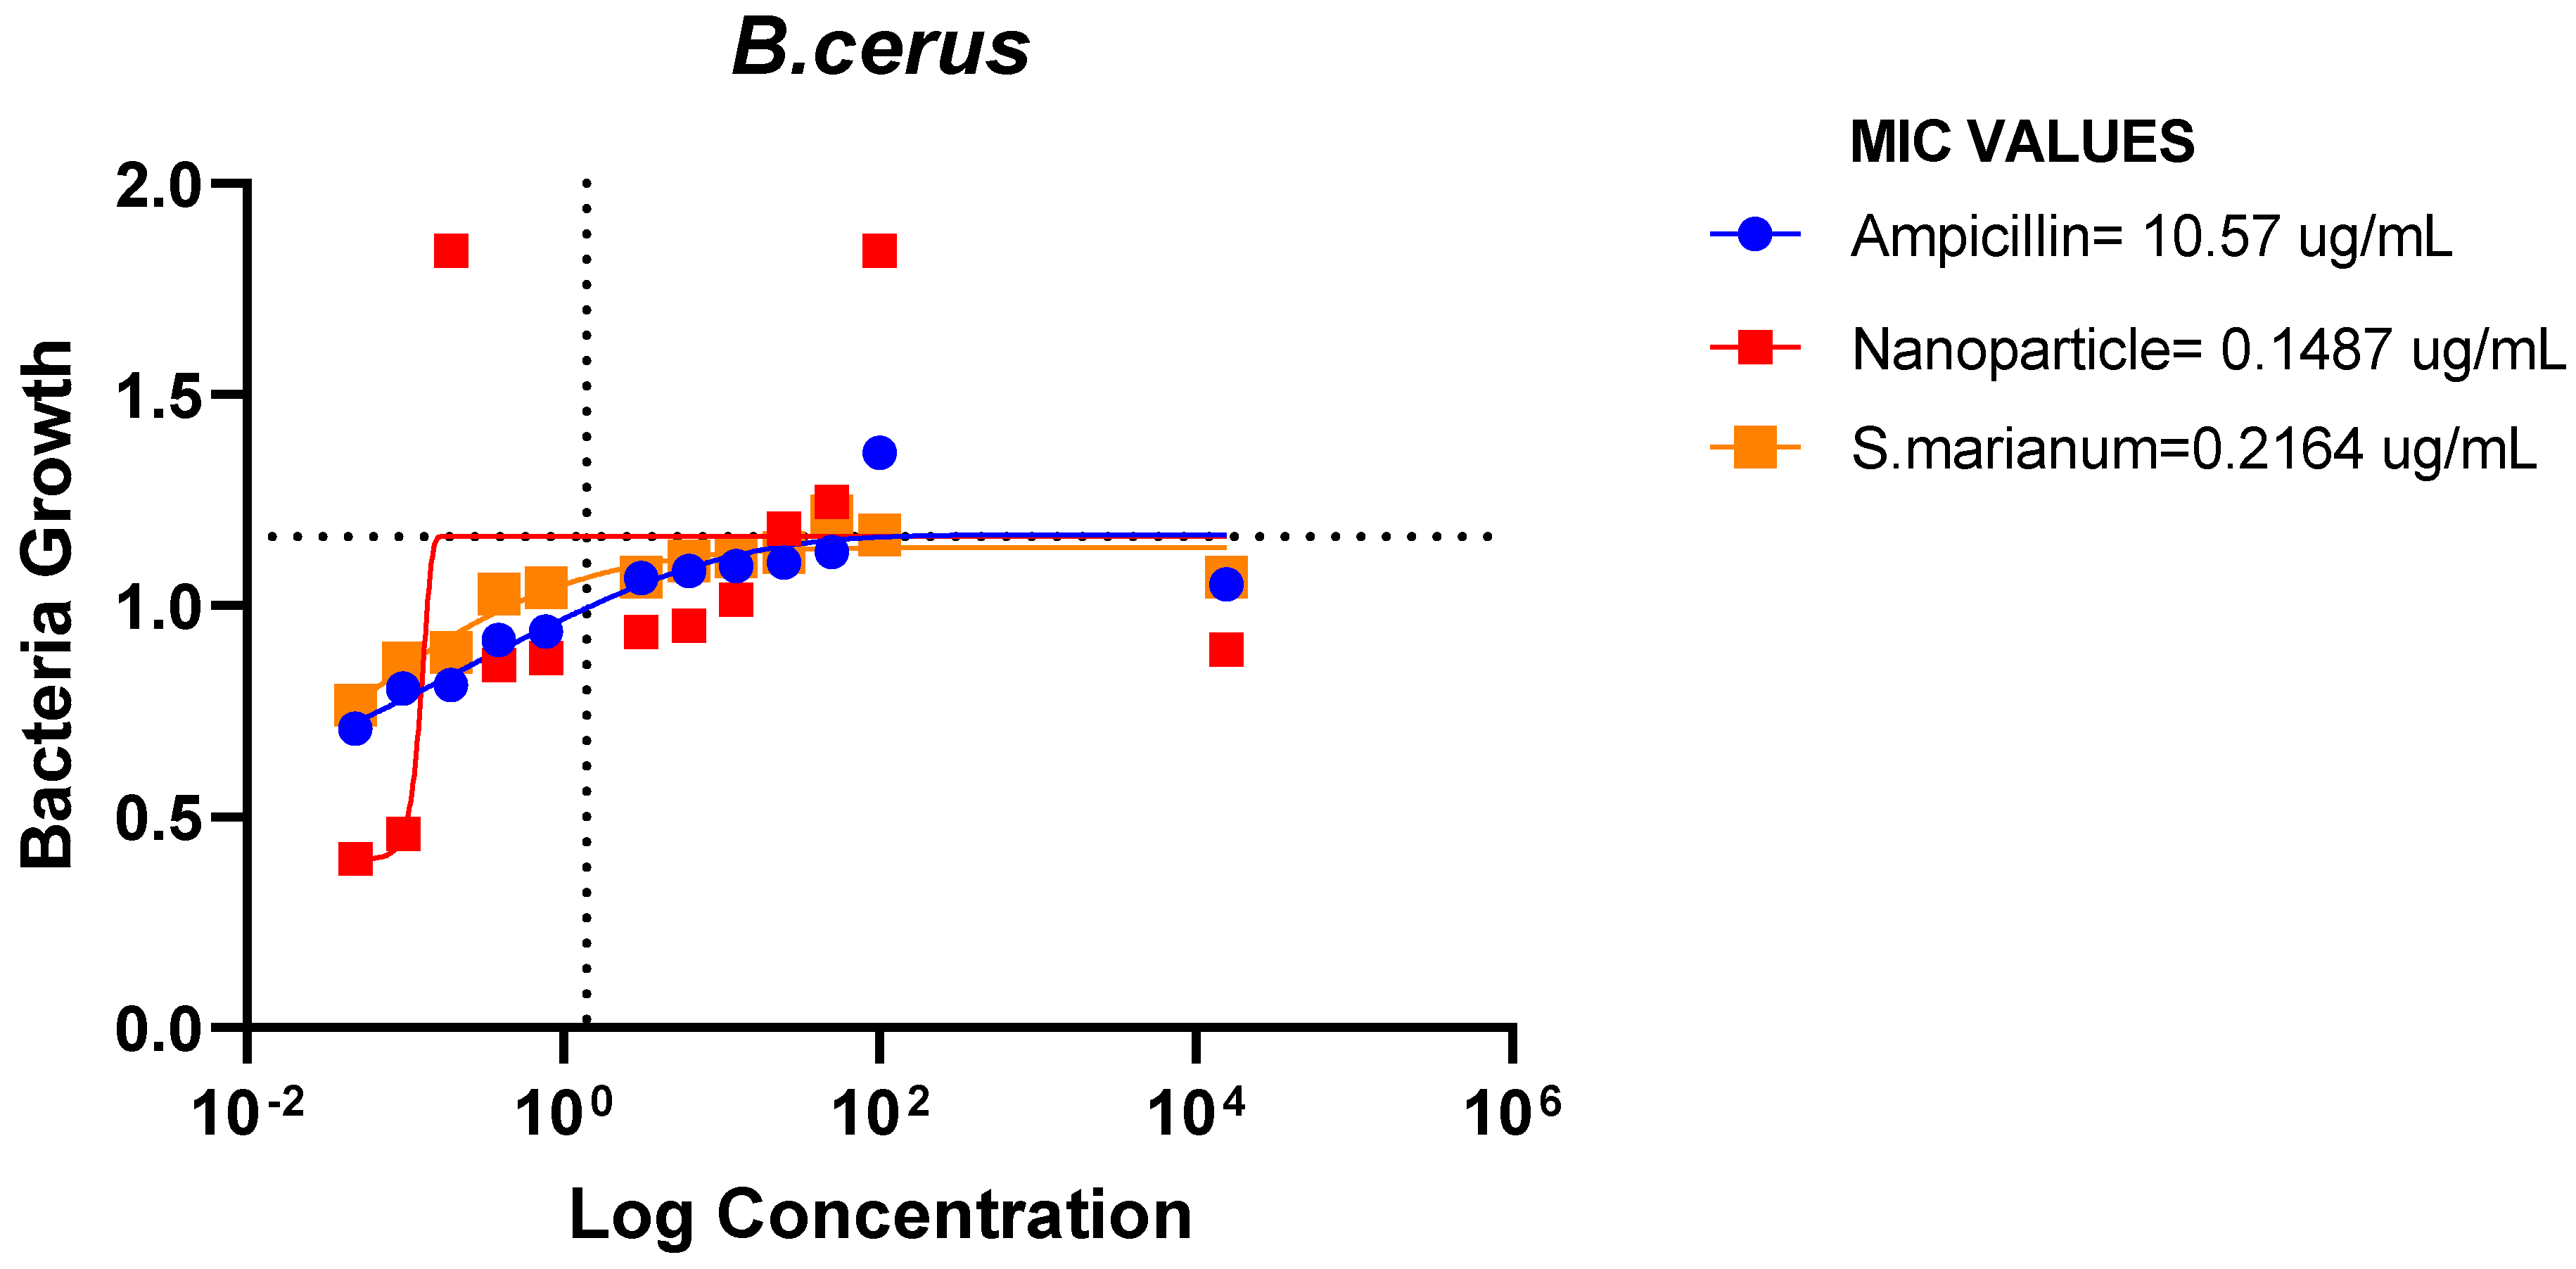
The results demonstrated that E. coli, P. aeruginosa, E. faecalis, and B. cereus were all susceptible to the microbial resistance of the AgNPs and the plant sample, with the nanoparticles showing superior suppression. This indicates that the extract and silver nanoparticles may both have wide or specific antibacterial effects on these bacteria.
Figure 15.
MIC Values of Ampicillin, nanoparticle and Extract on P. eauroginosa.
Figure 15.
MIC Values of Ampicillin, nanoparticle and Extract on P. eauroginosa.
Figure 16.
MIC Values of Ampicillin, nanoparticle and Extract on E.faeces.
Figure 16.
MIC Values of Ampicillin, nanoparticle and Extract on E.faeces.
Figure 17.
MIC Values of Ampicillin, nanoparticle and Extract on E. coli.
Figure 17.
MIC Values of Ampicillin, nanoparticle and Extract on E. coli.
Figure 18.
MIC Values of Ampicillin, nanoparticle and Extract on B.cerus.
Figure 18.
MIC Values of Ampicillin, nanoparticle and Extract on B.cerus.
DISCUSSION
The preliminary phytochemical screening discovered the presence of secondary metabolites like flavonoids, saponins, alkaloids, tannins, terpenoids, steroids, anthraquinones, cardiac glycosides and phlobatannins. The percentage yields of the extracts from non-polar, semi-polar, and polar solvents increased because of the fractionation (
Table 1), which may be explained by the extracting potency of these solvents. Non-polar solvents often extract less phytochemicals than polar solvents (n-Butanol; 2.26 %) generally extract more phytochemicals than non-polar solvents (Halilu
et al., 2013). The type of solvents used, and the chemical makeup of the sample determine how the extraction yield varies.
High concentrations of silver nitrate solution (5 Mm) were used in the production of silver nanoparticles. However, both concentration and incubation time are crucial elements in the synthesis of nanoparticles. It is obvious that the longer the nanoparticle was left to incubate in a dark environment, the more nanoparticles were produced.
Utilizing UV-Vis spectroscopy analysis, which is typically used to characterize samples' colloidal constituents and nanoparticles in water-based substances. The size, orientation, structure, constitution, and electrical nature of produced AgNO3 nanoparticles have an impact on the Surface Plasmon Resonance (SPR) bands (Joy and Johnson, 2015). Two peaks’ wavelengths of 317 nm, 474 nm and 293 nm 327 nm of plant extract and nanoparticles produced respectively.
A 600 cm-1 to 4000 cm-1 FTIR scan of the Silybum marianum methanol: water extract and 5 mM silver nanoparticles was conducted to identify the functional groupings present on the leaf extracts and NPs as well as the makeup of the binding sites that stabilize the NPs created by the bio reduction process (Malarvizhi et al., 2016). The occurrence of flavonoids and phenols is indicated by the aliphatic secondary amine group (N-H) with a wide peak at 3355 in the plant extract. Alkenyl, which may have been metabolized to aldehyde or ketones, is represented by the peak at 1619 (C=H), 1411 and 1319 are C-H stretch vinylidene and C-N stretch primary amine, respectively. Peaks at 3310, 2905, 2163, 2002, 1677, 1041, and 866 signifies the (C-H) group for Alkyne, methyne thiocyanate, carbonyl group, and aliphatic chloro-compounds, respectively, for the NPs. Therefore, the phenols, flavonoids, and certain reducing sugars may have led to the decrease of the silver ions to silver NPs. The elongation of an amino group was shown by the N-H band seen in the plant sample. Additionally, the absorption band at 1677 cm-1 in the solid silver nanoparticles suggested the existence of carboxylates.
When evaluating the ability of plant extracts to scavenge free radicals, the DPPH free radical, which has a stable nitrogen atom at its core, is frequently used. The stable violet DPPH reduces to a yellow-colored diphenyl picrylhydrazine radical, which may be detected spectrophotometrically, when it receives an electron from the antioxidant molecule. Antioxidants and therefore radical scavengers are substances that can cause this process (Dehpour et al., 2009). The IC50 values of S. marianum leaf extracts, NPs, ascorbic acid, n-Hexane, ETOAC, and n-Butanol fractions were determined to be 5.1, 5.0, 1.1, 4.7, 2.3, and 4.3 ug/mL, correspondingly. In the range of 0.625-10 mg/mL concentration, the extracts demonstrated varying degrees of DPPH radical scavenging activity. In comparison to other extracts, the ETOAC fraction displayed the greatest DPPH radical scavenging activity that was closest to the level of ascorbic acid. Ascorbic acid >ETOAC > n-Butanol >n-Hexane > NPs > S. marianum > were the extracts' most effective scavengers of free radicals. Standardization was done using ascorbic acid at the same concentration. A greater concentration of phenolic and flavonoid components in the semi-polar subfraction of methanol extracts may be responsible for its superiority in the activity that scavenges free radicals. (Pavithra et al., 2015). Because of their primary structural components, including double bonds, hydroxyl groups, and catechol, flavonoids exhibit antioxidant properties. Its capacity to bind free radicals by giving electrons or hydrogen ions points to flavonoid's potent antioxidant action (Dehpour et al., 2009).
Due to its capacity to cross cellular membranes, H2O2 is very significant. Although H2O2 is not particularly reactive, it occasionally can be hazardous to cells because it can cause hydroxyl radicals to form in the cells. The phenolics in extracts may be responsible for scavenging H2O2, as they could provide H2O2 electrons and neutralize it by converting it to water (Pavithra and Vadivukkarasi, 2015). According to the findings, all the extracts displayed strong H2O2 scavenging abilities, which may be a result of the antioxidant components. As effective electron donors, the antioxidant components in the extracts may hasten the process of converting H2O2 to H2O. Figure 4.30 details the H2O2 scavenging abilities of several leaf extracts from S. marianum and NPs. A significant inhibition of 8.3 to 11.2 % was demonstrated for the ability of S. marianum plant extract to scavenge the H2O2 radicals. Plant extract, nanoparticles, n-Hexane, ETOAC, and n-Butanol fractions had IC50 values of 1.3, 2.2, 4.7, 5.6, and 4.0 ug/mL, respectively. In comparison to ascorbic acid, which had an IC50 value of 1.0 ug/mL, the plant extract and NPs had high scavenging activity, while the three fractions had minimal scavenging activities. Plant extract > NPs > n-Butanol > n-Hexane > ETOAC were the extracts' most potent scavengers sequentially.
The antioxidant activity of the extracts and the positive control for the β-carotene bleaching test.
S. marianum plant methanol/water extracts stopped β-carotene from being bleached. The semi-polar subfraction (ETOAC) leaves methanol extract was shown to have better percent inhibitory capacity (IC
50 0.3 ug/mL) to all other samples at 0 hours (
Figure 11), and its IC50 value is higher than that of the ascorbic acid (IC
50 2.9 ug/mL). In the -β-carotene/linoleic acid experiment, NPs (IC
50 0.9 ug/mL), n-Butanol polar subfraction (IC
50 2.0 ug/mL), and n-Hexane nonpolar subfraction (IC
50 0.5 ug/mL) all exhibit significant antioxidant activity. After two hours of sample incubation in a water bath at 50°C, only the scavenging activity of the plant extract and nanoparticles increased to a lower 1C
50 of 1.529 ug/mL and 0.821 ug/mL, respectively. The ascorbic acid inhibition capacity and n-Hexane fraction's inhibition capacity significantly decreased by an increased IC
50 of 5.234 ug/mL and 4.838 ug/mL. A number of mechanisms, including reducing capacity, free radical scavenging, preventing chain initiation, preventing continuous hydrogen interpretation, and binding of metal ion catalysts, may contribute to the antioxidant activity in the β-carotene/linoleic acid assay and the pH, temperature, vapor generation, evaporation, denaturing of some sample content, and the test may all be responsible for the decline in activity following incubation (Sokmen
et al 2004).
Bacterial-removal abilities (
Figure 13 and
Figure 14) revealed that the AgNPs (20 mg/mL) slowed the microorganisms' development, with a mean zone of restriction of growth spanning 10-13 mm on the gram-positive bacteria than the gram-negative bacteria, while the silver nanoparticles (10 mg/mL) inhibited the spread of the microorganism with a range of 7-11 mm. This study's findings support (Pratyusha and Debjani, 2015). The idea behind silver nanoparticles' method of action is that they can enter bacterial cell walls, modify the structure of the cell membrane, and then potentially improve cell penetrability. The mean zone of inhibition for the plant extract concentrations of 10 mg/mL and 20 mg/mL was found to be between 7-8 mm and 7-11 mm, respectively. This finding depicts that the inhibition of the plant extract and silver nanoparticles tends to increase with concentration, whereas the AgNO
3 (5 Mm) showed 15-11 mm. Comparatively, the nanoparticle's antibacterial activity was greater than the methanol water extract, which may be related to the nanoparticle's larger surface area (Lakshman
et al., 2021). This might cause the nanoparticles to pass through the cytoplasmic membrane uncontrollably, which would kill the cells (Pratyusha and Debjani, 2015). Levofloxacin (a positive control) had a much greater activity than the nanoparticle and the extract. The plant extract inhibition sequels the n-Butanol fraction, which had the best activity out of the three fractions, with activity ranging from 7 to 11 mm suggesting that the extract was highly soluble in polar solvents, this finding supports (Puri
et al., 2015). The mean inhibitory activities of the ETOAC fraction and the n-Hexane fraction were 7-9 mm and 4-9 mm, respectively. When the samples' effects on bacteria were compared, it was found that the growth of gram-negative bacteria was slightly more inhibited than gram-positive bacteria. The negative controls, DMSO and water, exhibited no action. Figure 4.34 illustrates how each bacterial strain reacted to the samples.
The ampicillin, nanoparticles and extract all showed great effectiveness against B. cereus, P. aeruginosa, E. coli and E. faecalis at 100ug/mL, within the Minimum Inhibitory Concentrations (MIC) range of 0.1487-82.49ug/mL. The plant nanoparticle showed the best efficacy on P. aeruginosa with about 0.1487ug/mL MIC. Low MIC values indicate the extract has good efficacy against the tested bacteria. With increasing nanoparticle concentration, the slope of the bacterial growth curves constantly reduced. This demonstrated that bacterial growth was retarded at low nanoparticle concentrations and entirely blocked at higher concentrations of nanoparticles. These particles appear to be bactericidal at high concentrations yet bacteriostatic at low concentrations. Additionally, it is obvious from the graphs that the initial quantity of cells in the medium affects how quickly bacteria proliferate. Therefore, it is established that these nanoparticles could be employed to stop bacterial growth.
