Submitted:
15 November 2023
Posted:
16 November 2023
You are already at the latest version
Abstract
Keywords:
1. Introduction
2. Experimental Part
2.1. Experimental Materials and Characterization
2.2. Preparation of Grease
2.3. Performance Test
2.3.1. Physical and Chemical Properties of Grease
2.3.2. Tribological Properties
2.4. Analysis of Wore Surfaces
2.5. Corrosion Test
3. Results and Discussion
3.1. Physical and Chemical Properties of Grease
3.2. Soap Fiber Structure of Lithium Lipids
3.3. Tribological properties
3.3.1. Friction Reduction Performance
3.3.2. Anti-Wear Performance
3.4. SEM Analysis of Worn Surfaces
3.5. XPS Analysis of Worn Surfaces
3.6. Results of Corrosion Test


4. Conclusions
Acknowledgments
References
- Lugt, P. A Review on Grease Lubrication in Rolling Bearings. Tribology Transactions 2009, 52, 470–480. [Google Scholar] [CrossRef]
- Gurt, A.; Khonsari, M. The Use of Entropy in Modeling the Mechanical Degradation of Grease. Lubricants 2019, 7. [Google Scholar] [CrossRef]
- Jiang, M.; Guo, X.; Dong, J.; Chen, G. Study on the lithium complex grease. Lubrication Engineering(China) 2000, 25–28. [Google Scholar]
- Lligadas, G.; Ronda, J.C.; Galià, M.; Cádiz, V. Renewable polymeric materials from vegetable oils: a perspective. Materials Today 2013, 16, 337–343. [Google Scholar] [CrossRef]
- Chen, X.; Chen, G. Analysis of lithium molybdenum disulfide base grease and its application in roll bearing. Science & Technology Information (China), 2013. [Google Scholar]
- Cheng, S.; Guo, X.; Jiang, M.; He, Y. Research progress of lithium complex grease. Contemporary Chemical Industry(China) 2018, 47, 152–158. [Google Scholar] [CrossRef]
- Rapoport, L.; Bilik, Y.; Feldman, Y.; Homyonfer, M.; Cohen, S.R.; Tenne, R. Hollow nanoparticles of WS2 as potential solid-state lubricants. Nature 1997, 387. [Google Scholar] [CrossRef]
- Li, J.; Wang, Y.; Liu, D.; He, K.; Lu, L. Research progress on the properties and application of molybdenum disulfide. Powder Metallurgy Technology(China) 2021, 39, 471–478. [Google Scholar] [CrossRef]
- Niste, V.B.; Ratoi, M. Tungsten dichalcogenide lubricant nanoadditives for demanding applications. Materials Today Communications 2016, 8, 1–11. [Google Scholar] [CrossRef]
- Wu, Z. Synthesis of molybdenum (tungsten) disulfide nanostructures and their properties[D]. Central South University, 2012.
- Cheng, Y. Preparation and tribological properities of space lubricating grease containing MoS2 nanoparticles[D]. Hefei University of Technology, 2012.
- Wang, W.; Tian, S.; Sun, H. Influence of base oil and additives on microstructure of grease. Petroleum Products Application Research(China) 2015, 33, 26–34. [Google Scholar] [CrossRef]
- Xie, X. Experimental study on soap fiber structure affection the performance of grease[D]. Harbin Institute ofTechnology, 2008.
- Yuan, s. Study on the surface modification and friction properties of molybdenum disulfide. Modern Salt and Chemical Industry(China) 2019, 46. [Google Scholar] [CrossRef]
- Kosynkin, D.V.; Higginbotham, A.L.; Sinitskii, A.; Lomeda, J.R.; Dimiev, A.; Price, B.K.; Tour, J.M. Longitudinal unzipping of carbon nanotubes to form graphene nanoribbons. Nature 2009, 458, 872–876. [Google Scholar] [CrossRef] [PubMed]
- Liang, Y.; He, X.; Chen, L.; Zhang, Y. Preparation and characterization of TiO2–Graphene@Fe3O4 magnetic composite and its application in the removal of trace amounts of microcystin-LR. RSC Advances 2014, 4, 56883–56891. [Google Scholar] [CrossRef]
- Horikawa, T.; Sakao, N.; Sekida, T.; Hayashi, J.i.; Do, D.D.; Katoh, M. Preparation of nitrogen-doped porous carbon by ammonia gas treatment and the effects of N-doping on water adsorption. Carbon 2012, 50, 1833–1842. [Google Scholar] [CrossRef]
- Xiang, S.; Long, X.; Zhang, Q.; Ma, P.; Yang, X.; Xu, H.; Lu, P.; Su, P.; Yang, W.; He, Y. Enhancing Lubrication Performance of Calcium Sulfonate Complex Grease Dispersed with Two-Dimensional MoS2 Nanosheets. Lubricants 2023, 11, 336. [Google Scholar] [CrossRef]
- Fan, X.; Li, W.; Li, H.; Zhu, M.; Xia, Y.; Wang, J. Probing the effect of thickener on tribological properties of lubricating greases. Tribol. Int. 2018, 118, 128–139. [Google Scholar] [CrossRef]
- Jiang, H.; Hou, X.; Ma, Y.; Su, D.; Qian, Y.; Ahmed Ali, M.K.; Dearn, K.D.J.W. The tribological performance evaluation of steel-steel contact surface lubricated by polyalphaolefins containing surfactant-modified hybrid MoS2/h-BN nano-additives. Wear 2022, 504–505. [Google Scholar] [CrossRef]
- Zhu, Y.; Sun, Q.; Wang, Y.; Tang, J.; Wang, Y.; Wang, H. Molecular dynamic simulation and experimental investigation on the synergistic mechanism and synergistic effect of oleic acid imidazoline and l-cysteine corrosion inhibitors. Corrosion Science 2021, 185, 109414. [Google Scholar] [CrossRef]
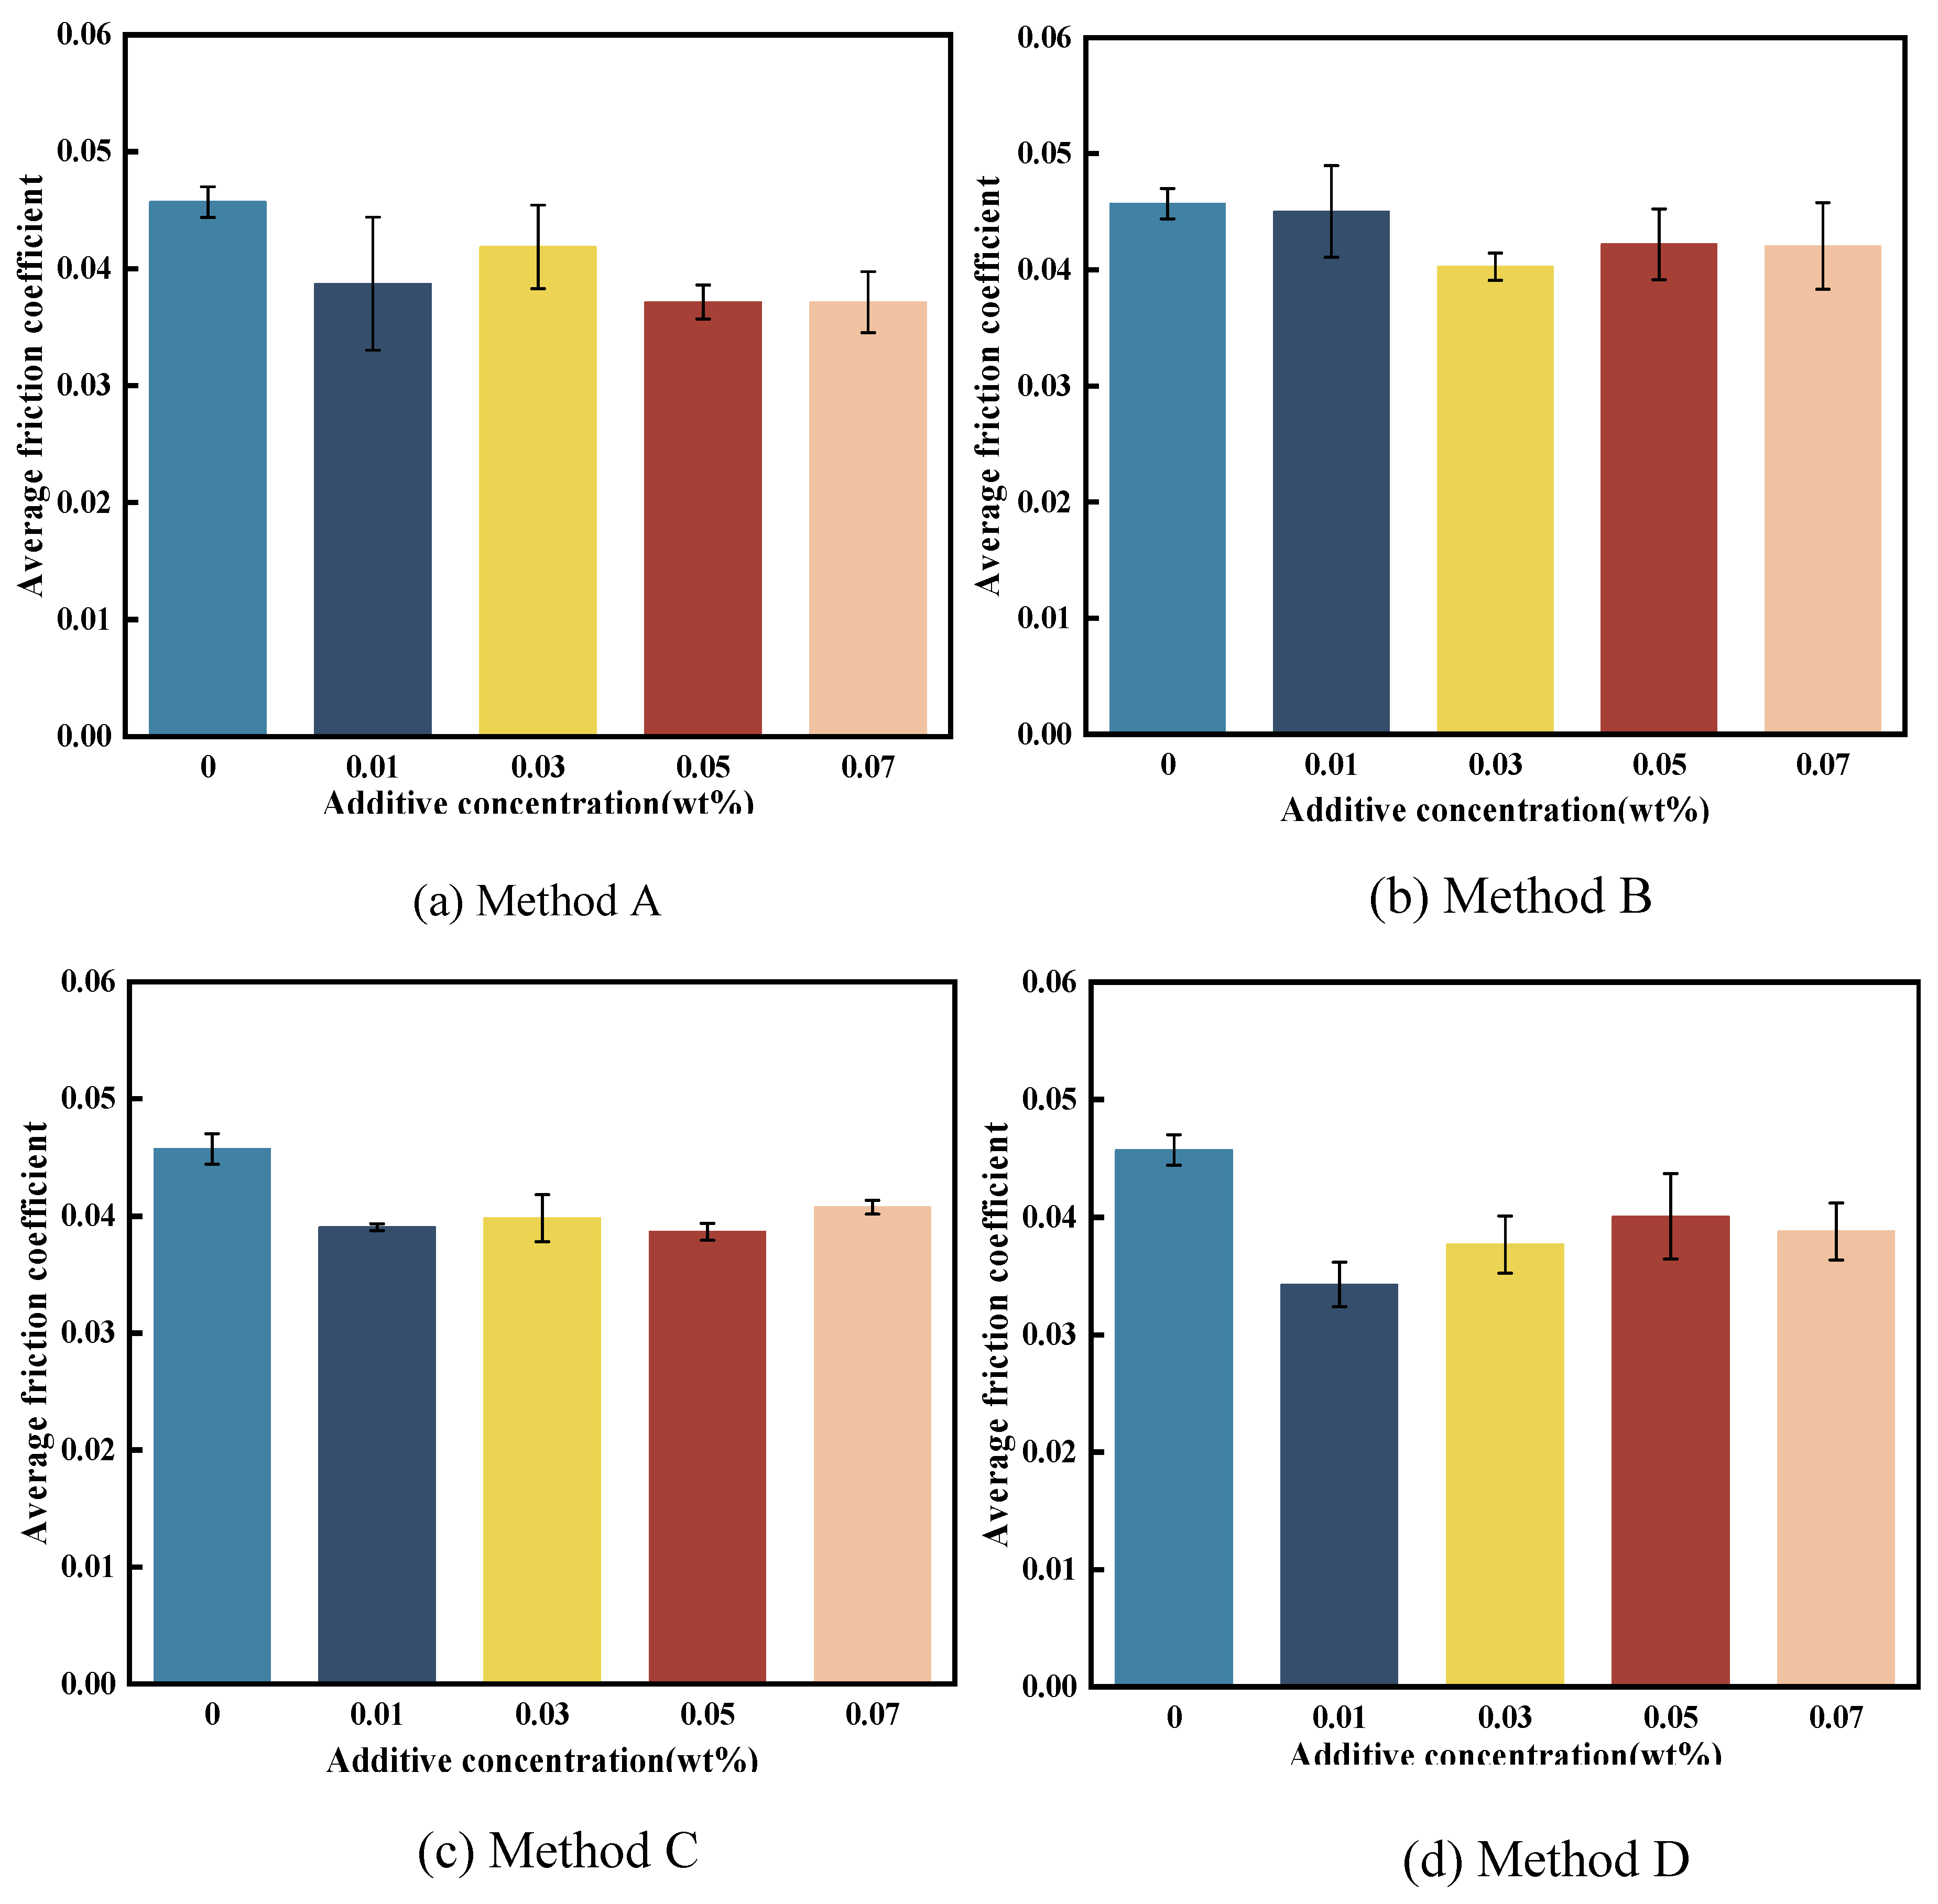
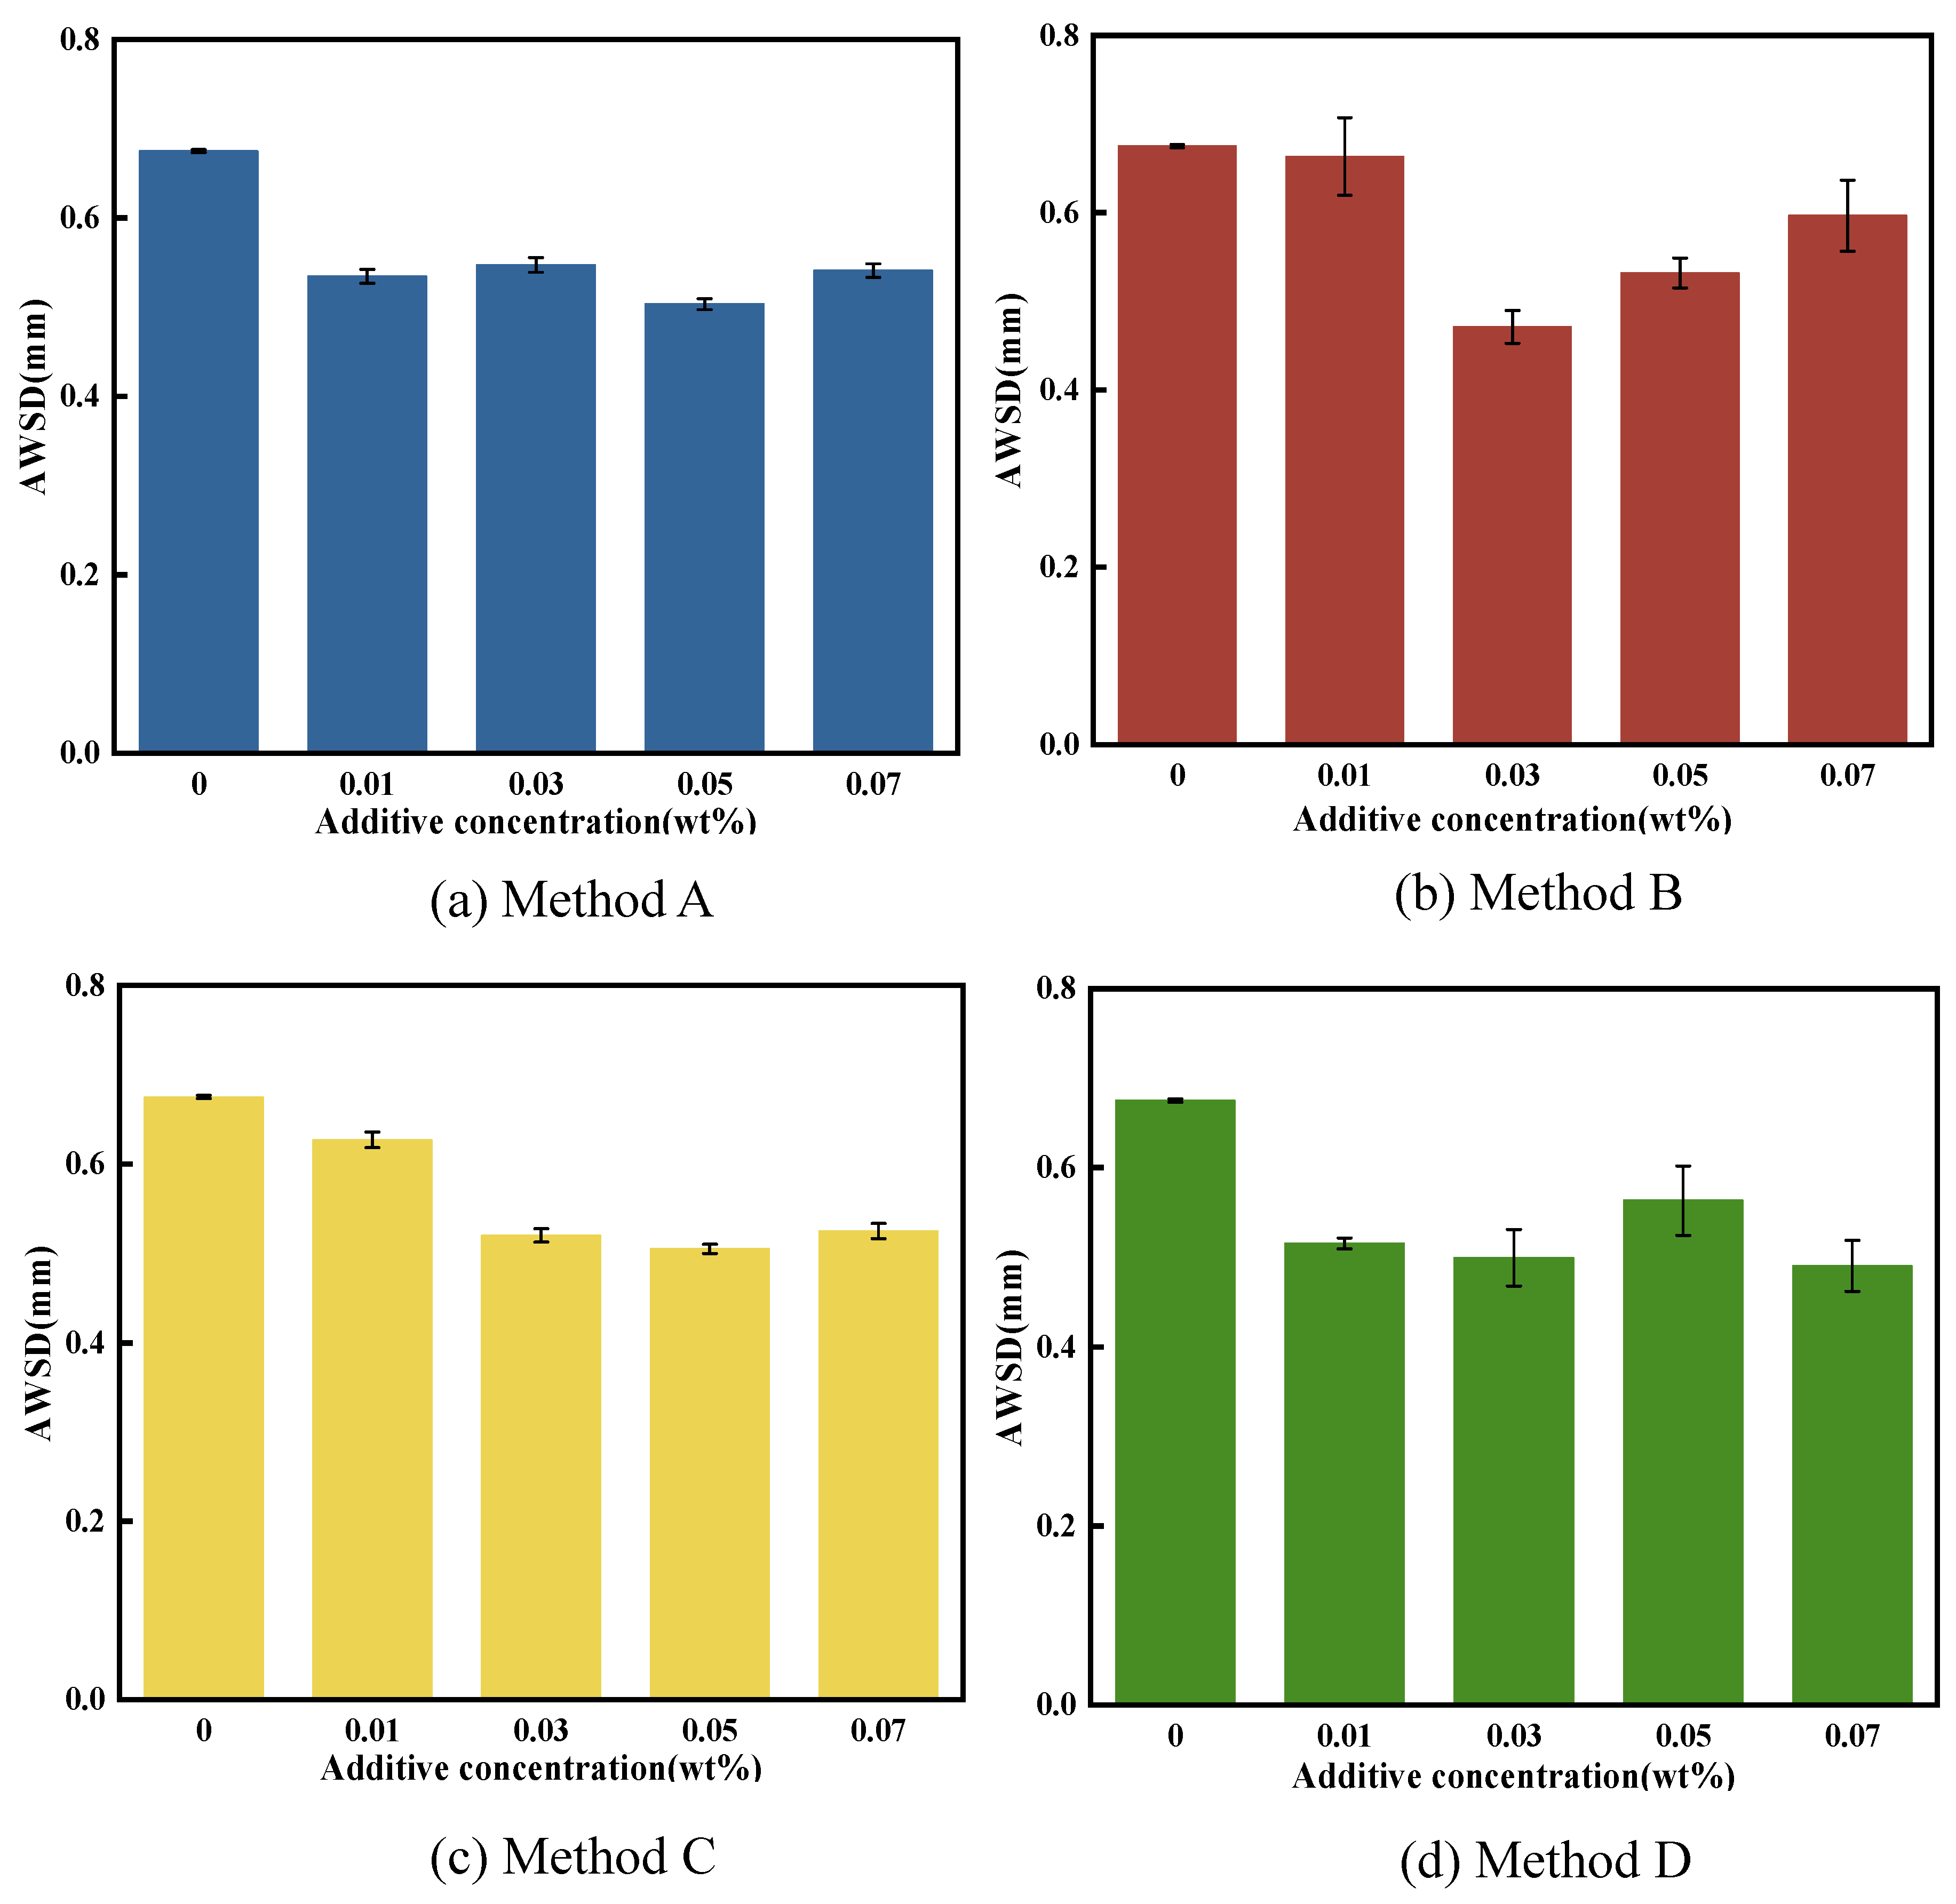
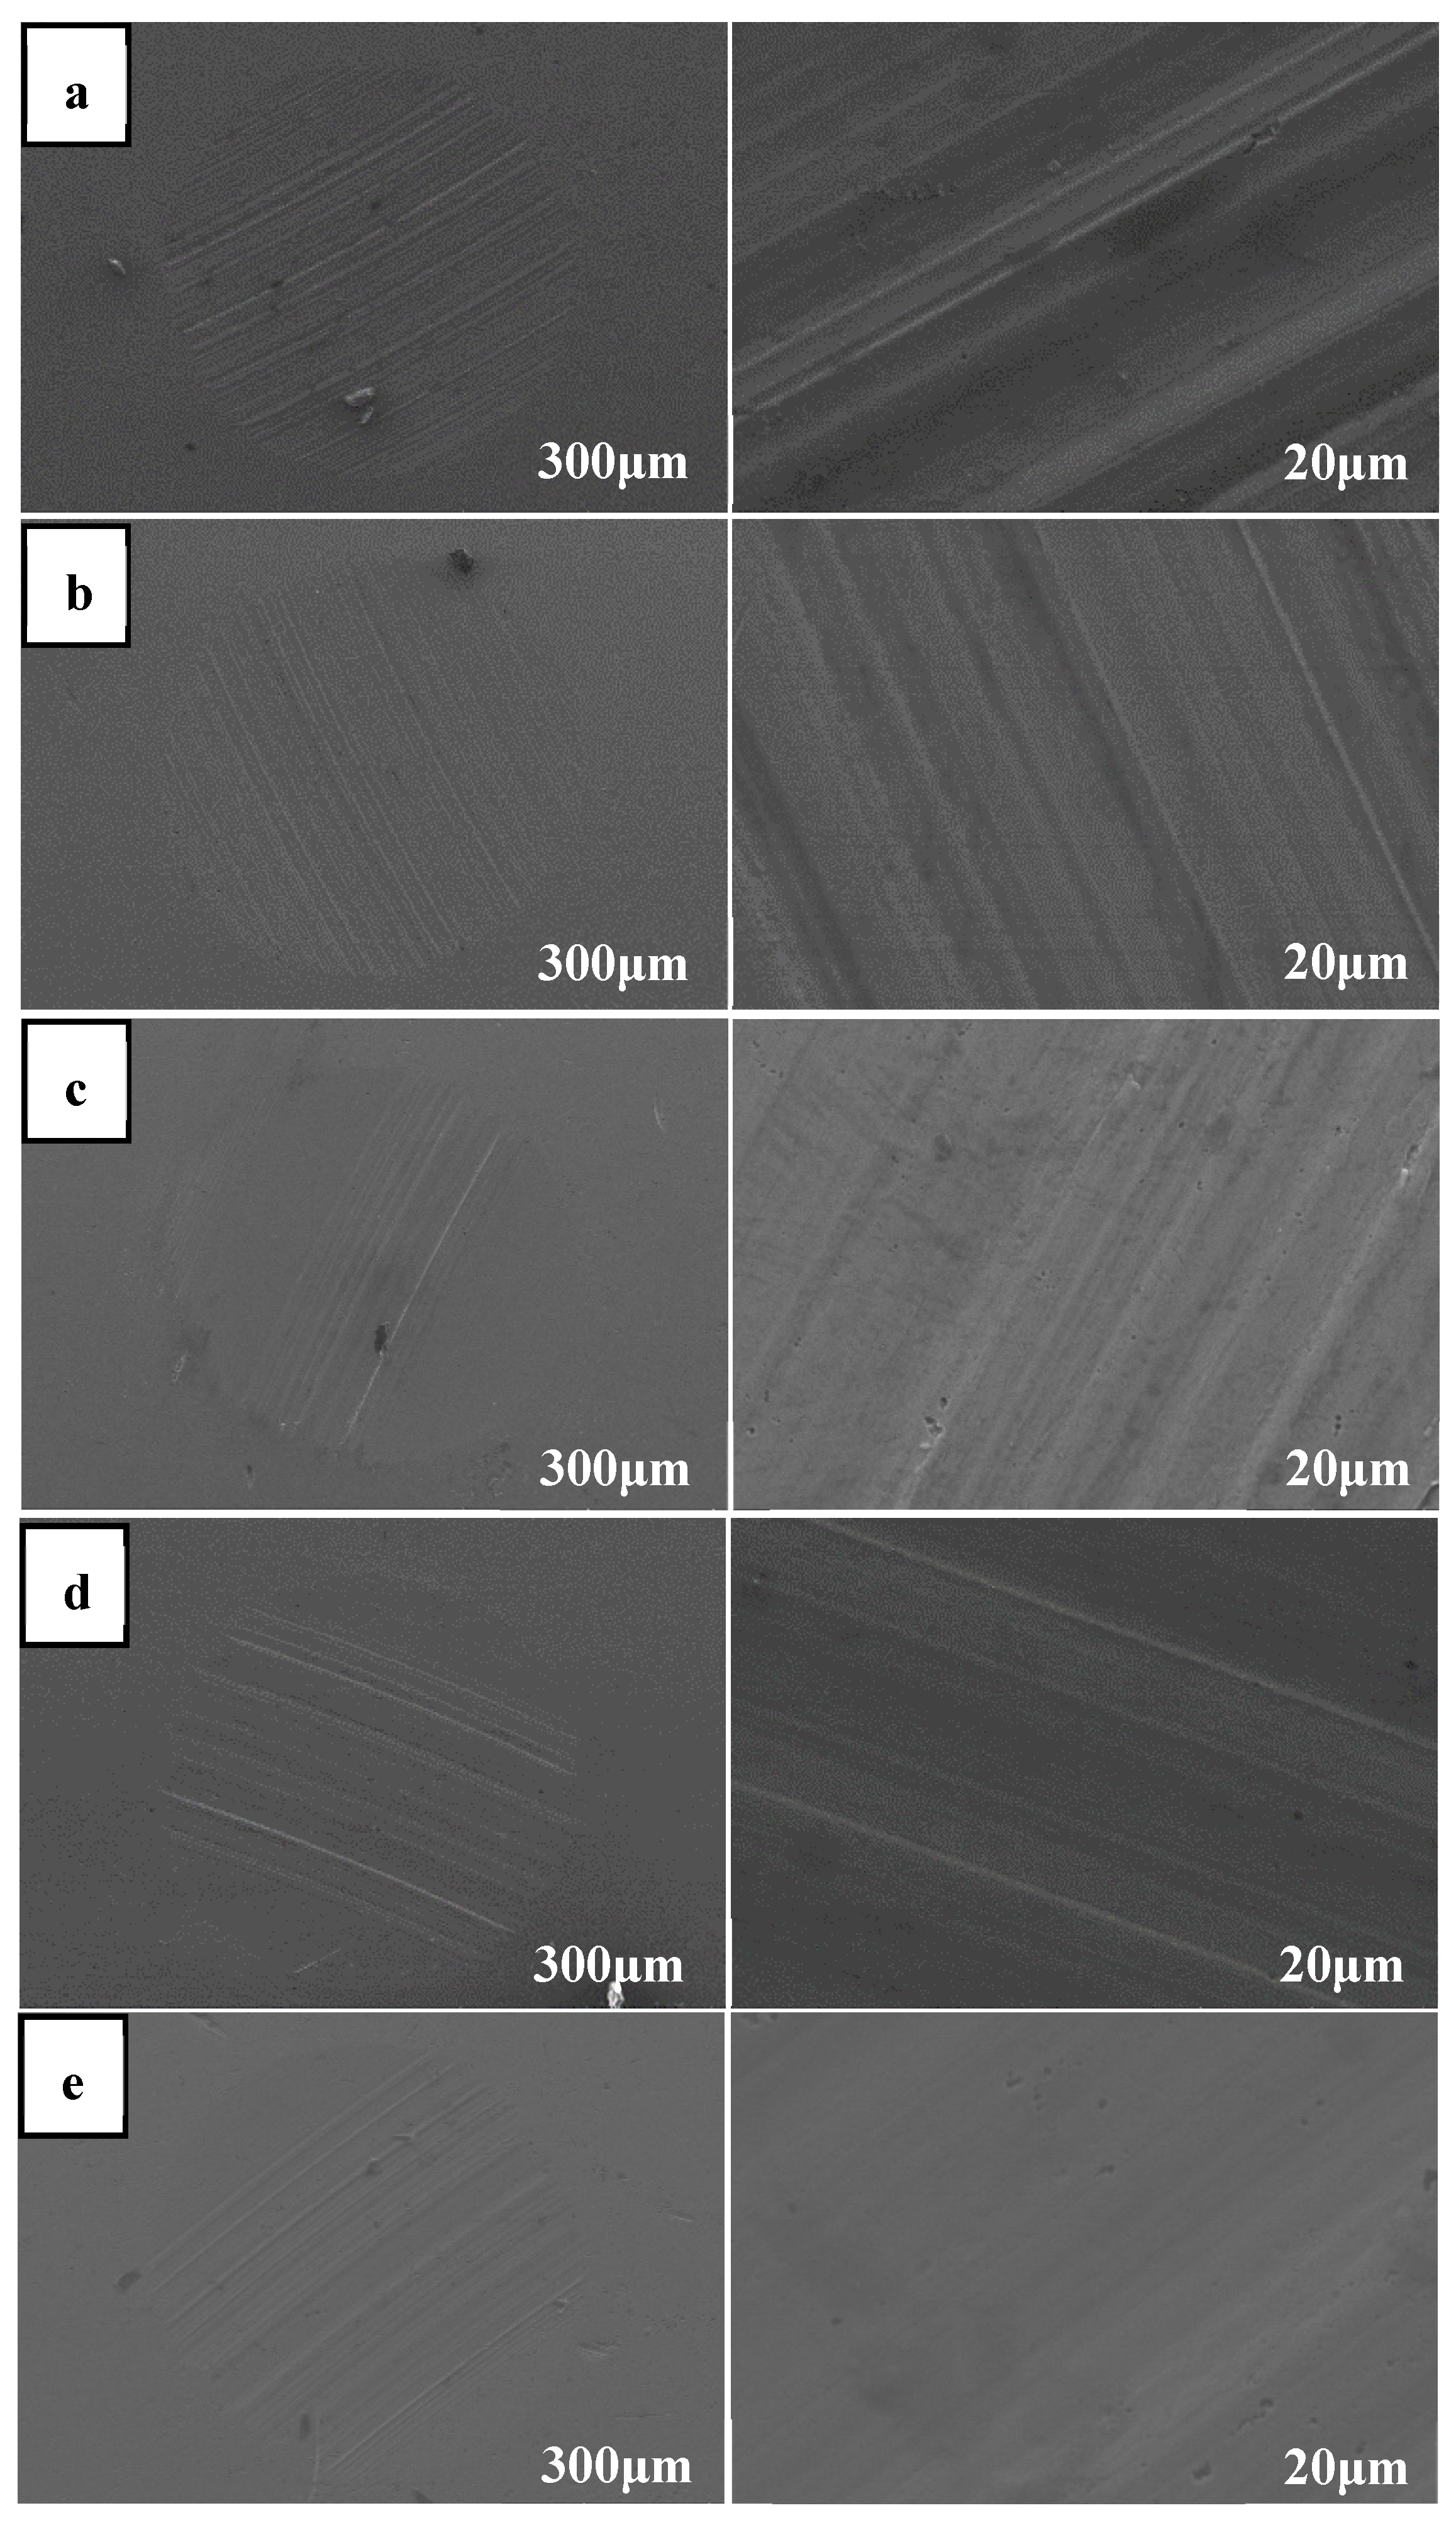
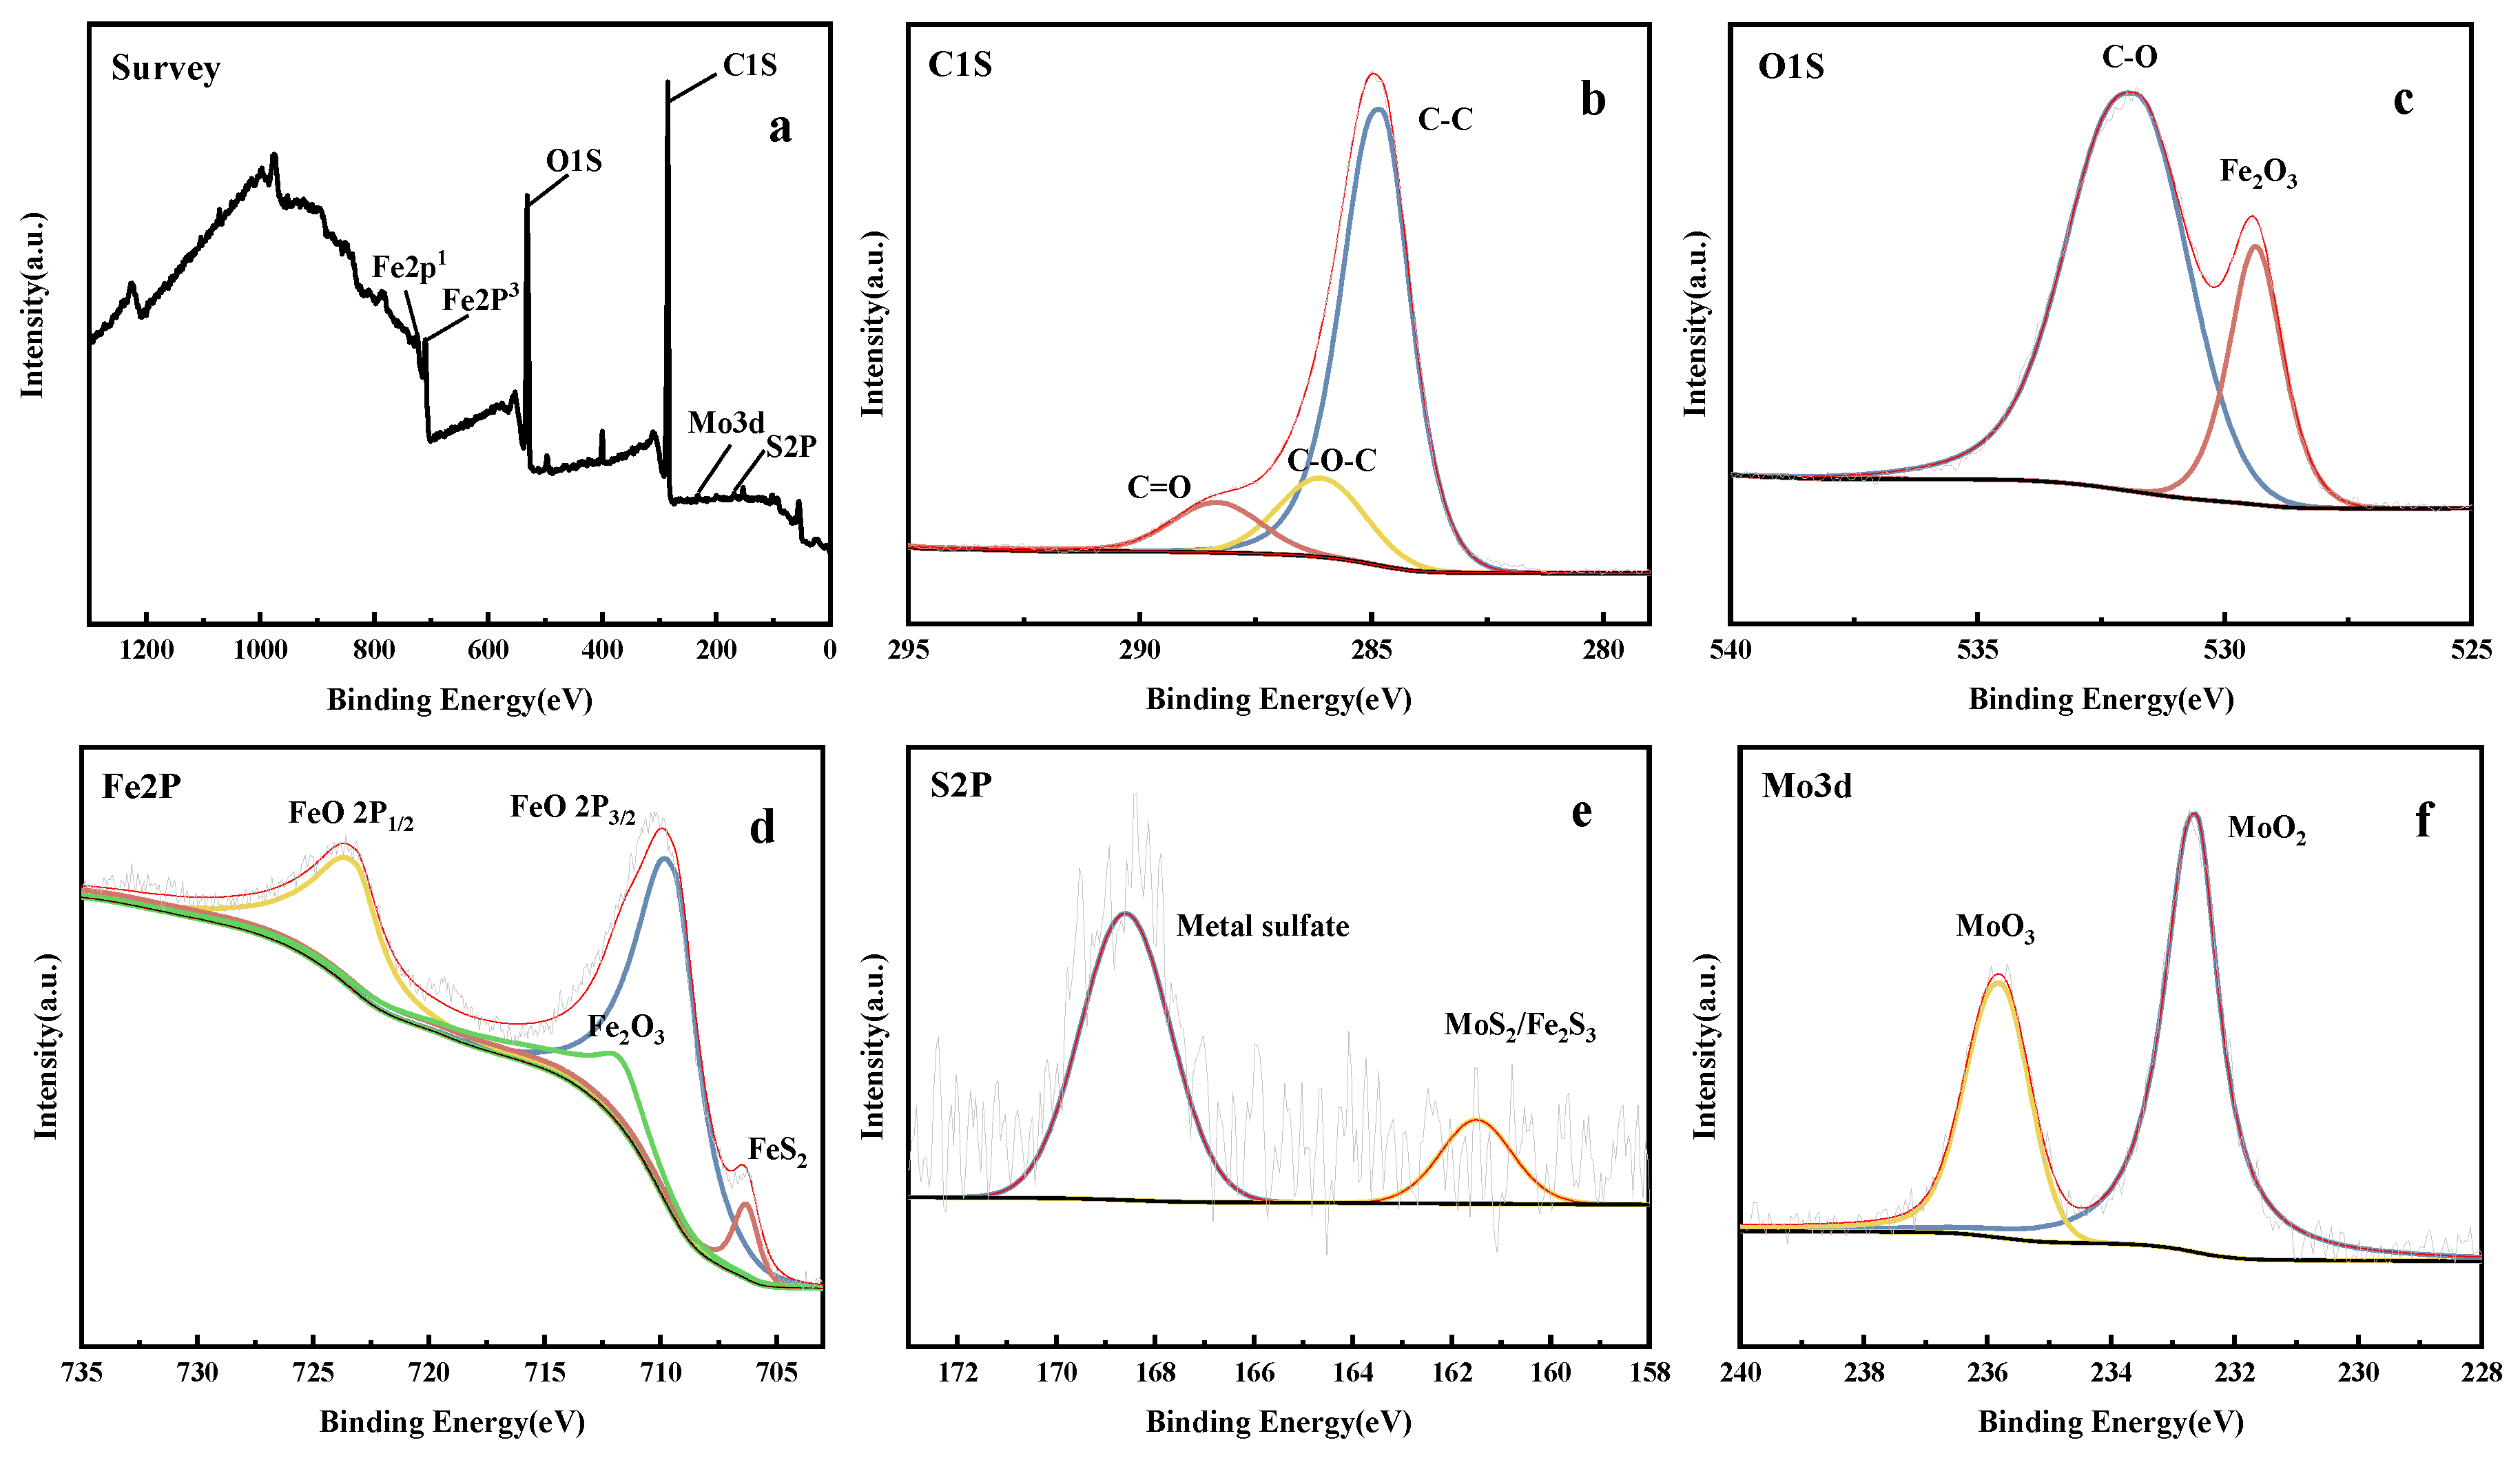
| Addition method | ω (wt%) | |||||
| 0 | 0.01 | 0.03 | 0.05 | 0.07 | ||
| Dropping point (℃) |
Method A | 196.5 | 197 | 197 | 202 | 202 |
| Method B | 202 | 202 | 200 | 199 | ||
| Method C | 197 | 197.5 | 198 | 198 | ||
| Method D | 203 | 199 | 200 | 201 | ||
| Cone penetration (0.1 mm) |
Method A | 180.6 | 186.1 | 202.8 | 198.1 | 181.6 |
| Method B | 202.4 | 201.2 | 180 | 192.2 | ||
| Method C | 175.7 | 202.3 | 186.9 | 180.4 | ||
| Method D | 184.6 | 187.5 | 198.2 | 180.5 | ||
| Addition method | Mass change (△m, g) | ||||
| ω (wt%) | |||||
| 0 | 0.01 | 0.03 | 0.05 | 0.07 | |
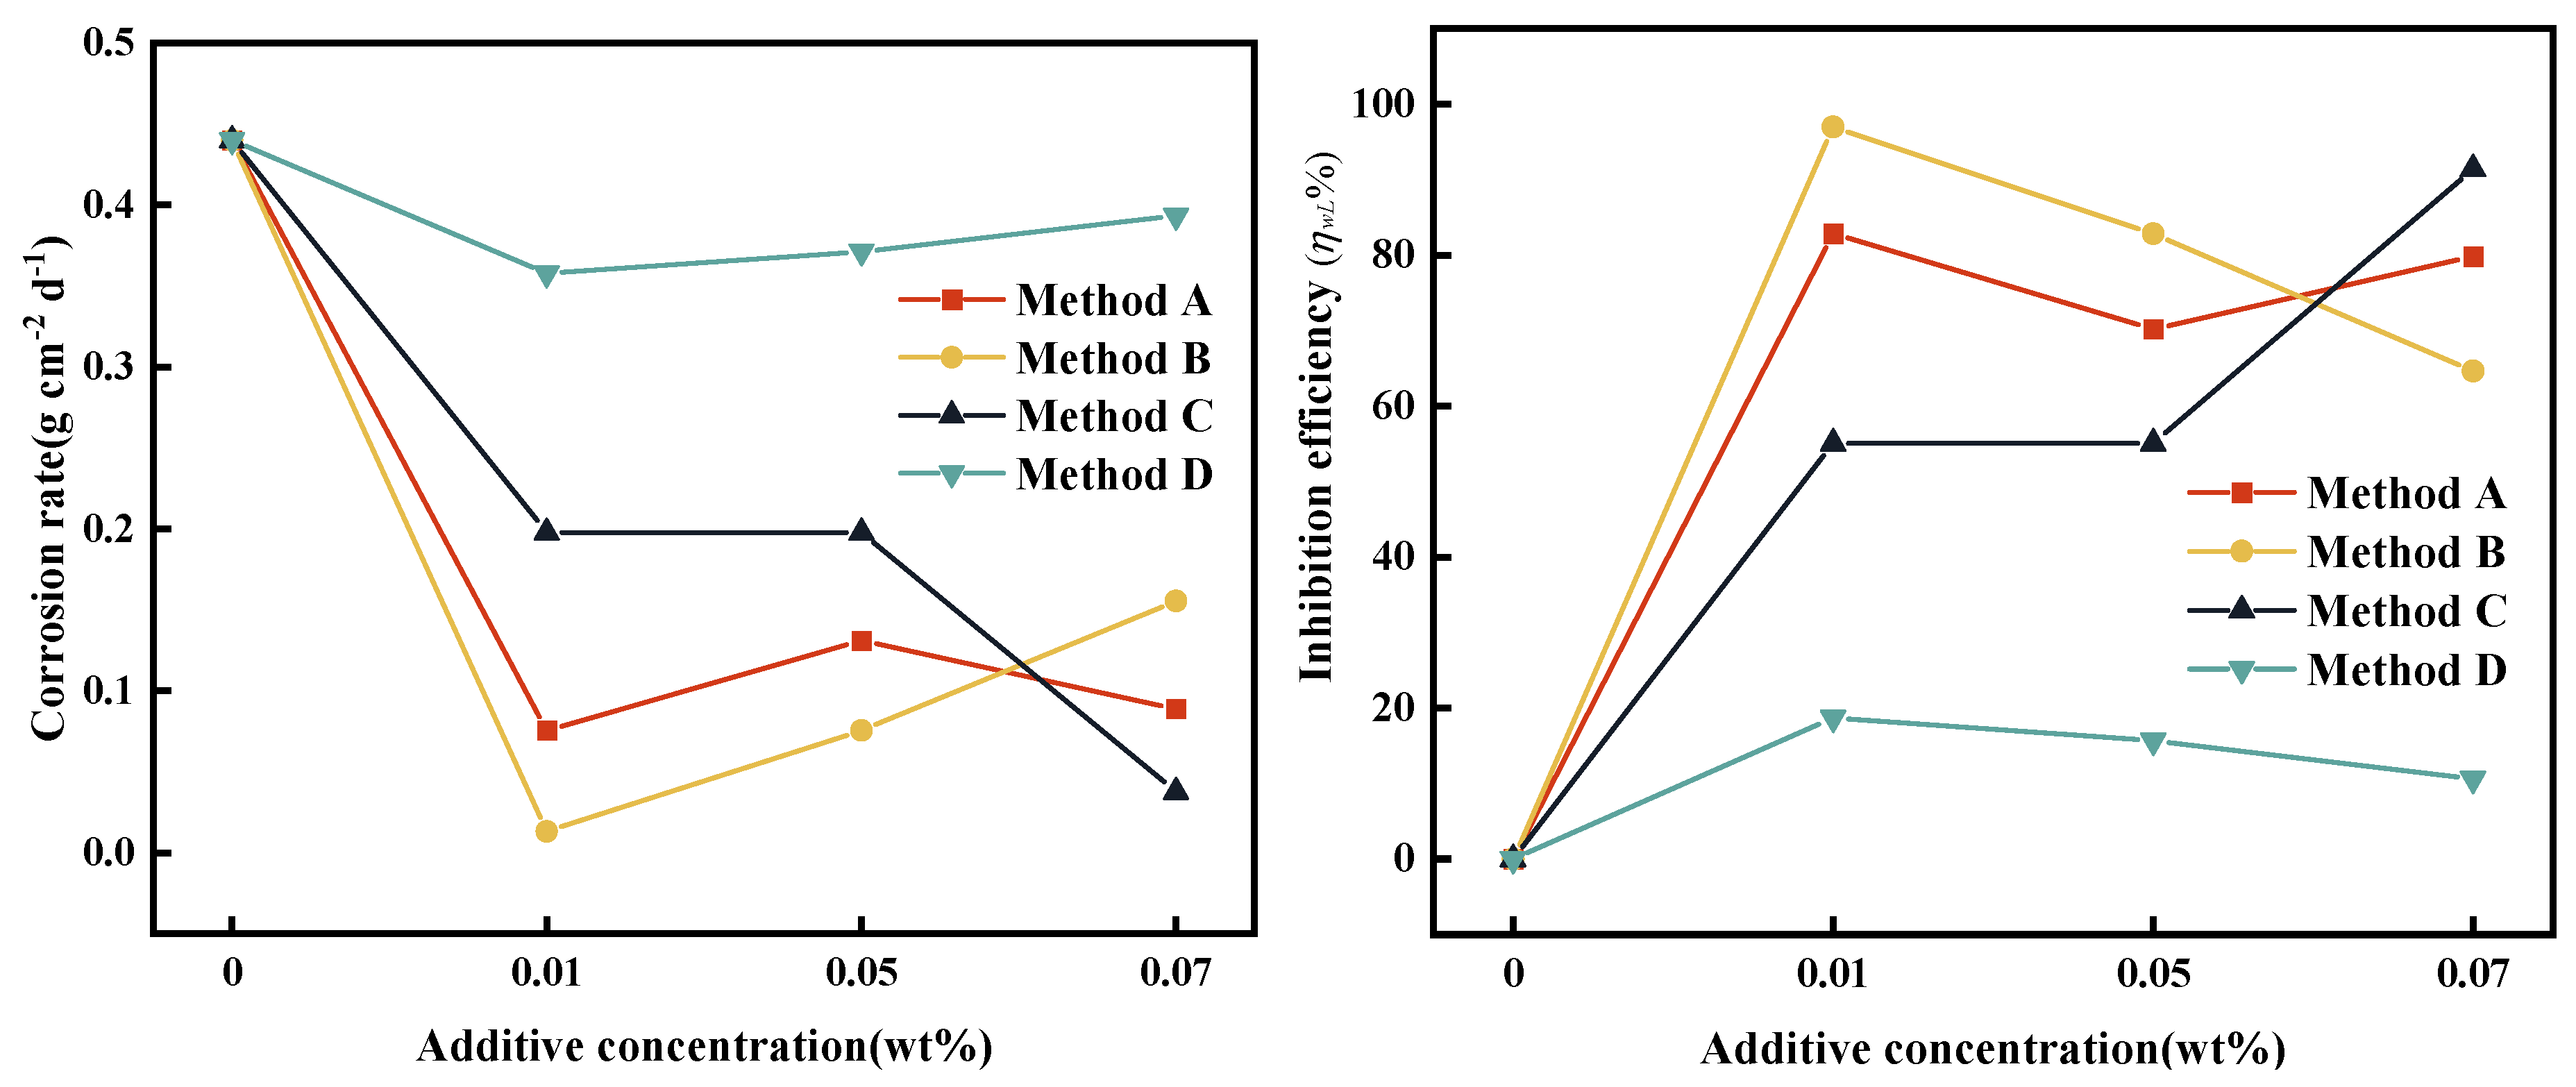
| Method A | 0.0198 | 0.0034 | 0.0109 | 0.0059 | 0.0040 |
| Method B | 0.0198 | 0.0006 | 0.0083 | 0.0034 | 0.0070 |
| Method C | 0.0198 | 0.0089 | 0.0032 | 0.0089 | 0.0017 |
| Method D | 0.0198 | 0.0161 | 0.0158 | 0.0167 | 0.0177 |
Disclaimer/Publisher’s Note: The statements, opinions and data contained in all publications are solely those of the individual author(s) and contributor(s) and not of MDPI and/or the editor(s). MDPI and/or the editor(s) disclaim responsibility for any injury to people or property resulting from any ideas, methods, instructions or products referred to in the content. |
© 2023 by the authors. Licensee MDPI, Basel, Switzerland. This article is an open access article distributed under the terms and conditions of the Creative Commons Attribution (CC BY) license (http://creativecommons.org/licenses/by/4.0/).


