1. Introduction
The rapid advancement of technology in recent years has brought about a significant increase in electronic consumption, leading to a mounting problem of e-waste generation [
1,
2]. The disposal of waste electronic and electrical equipment (WEEE) poses serious environmental concerns due to the hazardous components they contain [
3,
4]. In response to these challenges, the development of a low-carbon e-commerce closed-loop supply chain (LCE-CLSC) for the remanufacturing of WEEEs has emerged as an essential solution [
5].
E-commerce has become an integral part of our daily lives, offering convenience and accessibility to consumers worldwide [
6,
7]. However, the growing demand for electronic devices has also contributed to the staggering amount of e-waste generated. To address this issue, a closed-loop supply chain system has gained prominence, with a focus on recovering, recycling, and remanufacturing WEEEs.
The e-commerce closed-loop supply chain for remanufacturing WEEEs follows a systematic approach. It begins with the collection of discarded WEEEs from various sources, including consumers, E-commerce platforms, remanufacturer, and government [
8]. E-commerce platforms can play a crucial role in facilitating this process by implementing efficient collection mechanisms, such as take-back programs, partnering with recycling organizations, and raising awareness about e-waste recycling.
Once collected, the WEEEs are transported to specialized recycling centers or remanufacturing facilities. These facilities employ advanced technologies and processes to disassemble, repair, and refurbish the components of the electronic products [
9]. The goal is to extend the life cycle of these products and reintroduce them into the market, reducing the need for new manufacturing and conserving valuable resources [
10].
By embracing the principles of remanufacturing, the low-carbon e-commerce closed-loop supply chain minimizes waste and environmental pollution [
11]. It aims to transform WEEEs into functional, high-quality refurbished products that meet consumer demands [
12]. This approach not only reduces the environmental impact associated with e-waste disposal but also contributes to carbon emissions reduction by decreasing the energy and resource consumption attributed to new manufacturing [
13].
The successful implementation of a LCE-CLSC requires the collaboration of various stakeholders. E-commerce companies, electronics remanufacturers, government agencies, and consumers must actively participate in this endeavor. E-commerce platforms can promote the return and recycling of electronic products through high quality service. Remanufacturers can design low carbon products that can ensure a more circular approach. Government support in terms of policies, regulations, and financial incentives can encourage sustainable practices, while consumers can contribute by responsibly disposing of their electronic waste.
For example, The Waste Electrical and Electronic Equipment (WEEE) Directive of the European Union [
14], Regulations on the Administration of the Recycling and Disposal of Waste Electrical Appliances and Electronic Products, and the Law of the People’s Republic of China on the Prevention and Control of Solid Waste Pollution [
8]. Apple has launched the “Apple Reuse and Recycling Program” [
15]. Alibaba has launched the "credit recovery" program that encourages consumers to recycle their used products by providing credits redeemable for new products.
In a word, the development of a LCE-CLSC for the remanufacturing of WEEEs is essential for addressing the environmental challenges posed by e-waste. By integrating recovery, recycling, and remanufacturing processes, this system aims to minimize waste generation, conserve resources, and reduce carbon emissions associated with electronic waste. Collaboration among stakeholders and the adoption of sustainable practices are key to creating a truly sustainable LCE-CLSC system.
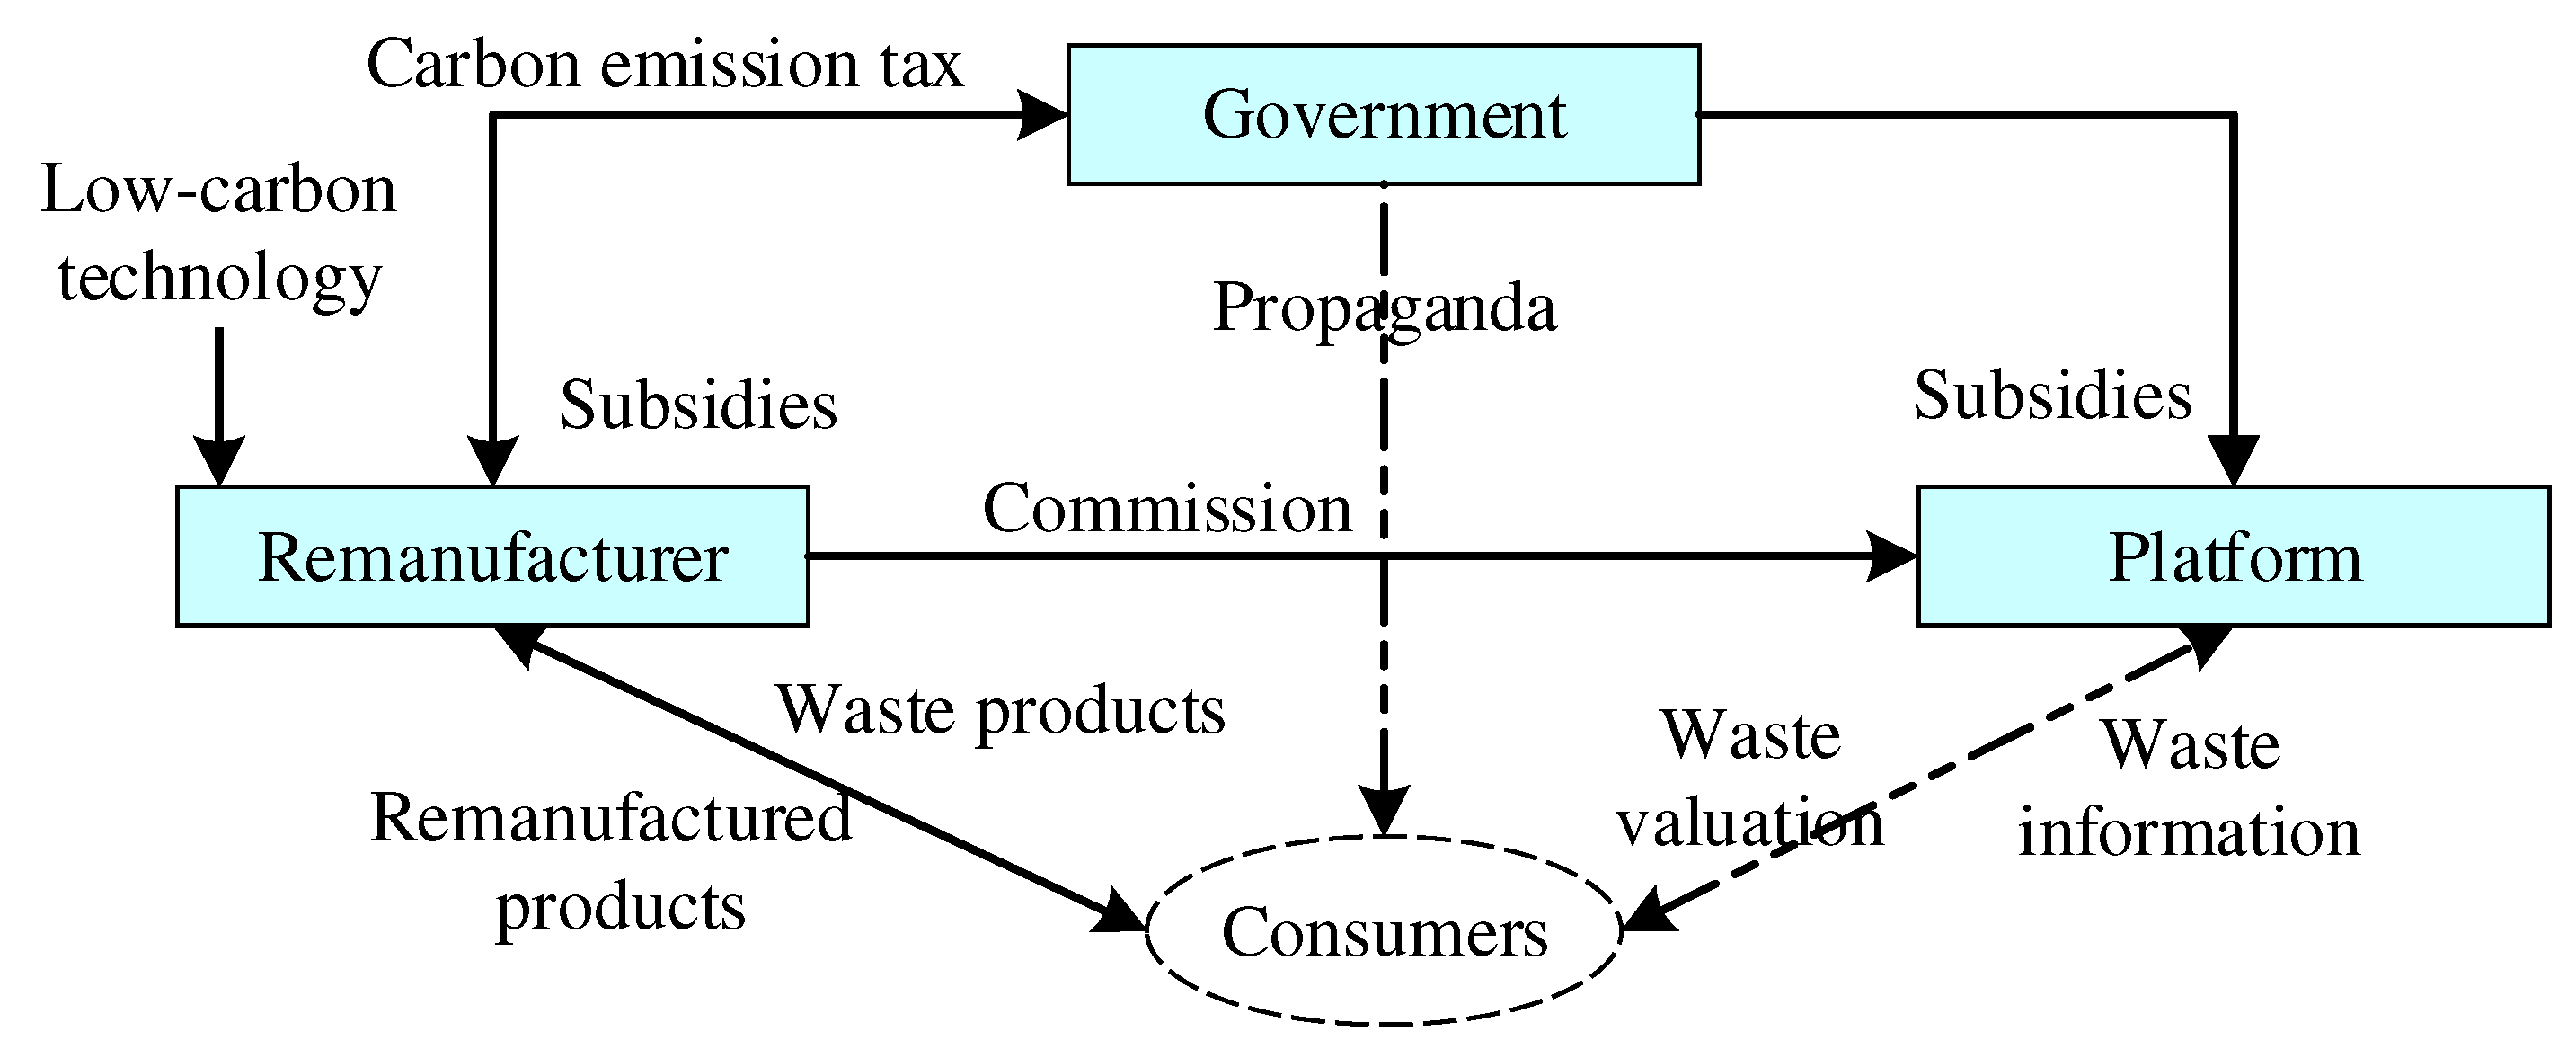
In this paper, we aim to develop a model that captures the dynamic interactions among remanufacturer, platform, and the government in the context of a LCE-CLSC system. The evolutionary game model will consider various factors that can influence the evolution of the system and explore strategies to enhance its stability. We calculate the payoff matrix of remanufacturer, platform and government. Then, by solving and analyzing the model, we obtain replicator dynamic equations of each stakeholder. Furthermore, we get the ESS and its formation conditions by solving the Jacobian matrix. Finally, a numerical study is used to verify the feasibility and rationality of the evolutionary game model. Further, we will also examine how model parameters affect the decision-making process of remanufacturer in terms of low-carbon product choices, the investment behavior of e-commerce platforms in recycling service levels, as well as regulatory actions of government.
The rest is organized as follows.
Section 2 presents the literature review. Model assumptions and construction are detailed in
Section 3. Following the development of the model, the analytical results for ESSs in the evolutionary game model are presented in
Section 4.
Section 5 conduct numerical analysis. Finally,
Section 6 is the conclusion.
4. Model Analysis
4.1. Analysis of Remanufacturer’ Strategy Stability
Let the expected revenue for remanufacturer when he/she chooses between LCP or TP be represented by
E11,
E12, and the average expected revenue as
.
The replicator dynamics equation for the strategy selection of remanufacturer is:
Let the derivative of
x and the designated
G(
y) be:
According to the stability theorem of differential equations, the probability of remanufacturer choosing LCP must satisfy the following condition to be in a stable state: and . Due to , Therefore, is an increasing function with respect to z. Therefore, when , , , the remanufacturer cannot determine a stable strategy. When , , in this case, , x=1 is the Evolutionarily Stable Strategy (ESS) of the remanufacturer. Otherwise, x=0 is the ESS.
Let the stable probability of remanufacturer chooses TP be represented by volume
V1, and the stable probability of choosing LCP be represented by volume
V2. The tangent plane passing through point
.
Wherein , .
Lemma 1: The probability of remanufacturer choosing to produce low-carbon products increases with h, s, T, Q, but decreases with m. When is satisfied, the probability of remanufacturer chooses LCP varies directly with a and r, but inversely with e.
Proof: Because ,
Let’s calculate the first-order partial derivatives of each element with respect to V2.We can obtain , , , , , and when , ,, .
Lemma 1 indicates that when consumers are more sensitive to the platform’s recycling service level and the platform achieves higher levels of recycling with greater quantities collected, the cost required to achieve the desired carbon emission reduction level decreases. As a result, remanufacturer in the system tend to choose LCP more stably. Government-imposed carbon emission taxes on traditional products can further incentivize remanufacturer to choose LCP. However, the effectiveness of government subsidies for remanufacturer’ production of low-carbon products depends on certain conditions. If the ratio between investment costs and unit benefits of low-carbon products is too high, the government’s subsidies may not be effective. This phenomenon is observed in real-life low-carbon supply chain systems, where, in the early stages when low-carbon technologies are not yet mature, even with strong government subsidy policies, production enterprises may not choose to produce low-carbon products. However, as the industry reaches a relatively mature stage and the ratio between investment costs and unit benefits of low-carbon products decreases, the higher returns associated with achieving a unit carbon emission reduction incentive will motivate remanufacturer to stably choose LCP.
Lemma 2: There exists a positive correlation between the probability of remanufacturer adopting the strategy of LCP and the increase in the probability of government adopting the strategy of SR.
Proof: According to the analysis of remanufacturer’s strategy stability, when , , , x=0 is the ESS. Thus, as z gradually increases, the remanufacturer’s stable strategy transitions from x=0 (TP) to x=1 (LCP).
Lemma 2 indicates that an increase in the probability of government adopting the strategy of SR is favorable for remanufacturer to choose LCP as a stable strategy. In the early stages of the system, government regulatory implementation can effectively prompt remanufacturer to adopt low-carbon technologies.
4.2. Analysis of Platform’ Strategy Stability
Let the expected revenue for the platform choosing the strategy of SI or NSI be represented by
E21 and
E22, respectively. And the average expected revenue denotes as
.
The replicator dynamics equation for the strategy selection of platform is:
Let the derivative of
y and the designated
L(
z) be:
According to the stability theorem of differential equations, the probability of platform choosing strategy SI must satisfy the following condition to be in a stable state: and . Due to , Therefore, is an increasing function with respect to z. Therefore, when , , , the platform cannot determine a stable strategy. When , , in this case, , y=1 is the Evolutionarily Stable Strategy (ESS) of the platform. Otherwise, y=0 is the ESS.
Let the stable probability of platform choosing NSI be represented by area
S1, and the stable probability of SI be represented by area
S2. Then,
Lemma 3: When , S2 achieves its maximum value, indicating that the probability of the platform adopting SI strategy is 1. However, when , the probability of the platform adopting SI strategy varies directly with u, h, and b, but varies inversely with n and s.
Proof: Let’s calculate the first-order partial derivatives of each element with respect to S2.We can obtain ,,,,.
Lemma 3 indicates that when in the overall game system, the platform can only adopt the recycling service investment strategy. However, when , if the platform’s commission for recycling is higher, consumers are more sensitive to the level of recycling service, and there is a higher cost elasticity of recycling service investment for the level of recycling service or the government enhances subsidies for recycling service investment, all these factors can promote the platform’s evolution towards the stable strategy of investing in recycling services.
Lemma 4: There exists a positive correlation between the probability of the platform adopting the SI strategy and the increase in the probability of government adopting the strategy of SR.
Proof: According to the analysis of platform’s strategy stability, when , then ,, at this case, y=0 is the ESS. Thus, as z gradually increases, the platform’s stable strategy transitions from y=0 (NSI) to x=1 (SI).
Lemma 4 indicates that in the early stages of evolution, the regulatory role of the government has a significant impact. Therefore, increasing the probability of the government adopting SR strategy is advantageous for platforms to choose waste recycling services as a stable strategy. When platforms choose SI, they can attract consumers to actively participate in the recycling process with better services, thereby increasing the quantity of waste collected by the platform.
4.3. Analysis of Government’ Strategy Stability
Let the expected revenue for the government choosing SR strategy or LR strategy be represented by
E31 and
E32, respectively. And the average expected revenue denotes as
.
The replicator dynamics equation for the strategy selection of government is:
Let the derivative of
z and the designated
H(
x) be:
According to the stability theorem of differential equations, the probability of government choosing SR strategy must satisfy the following condition to be in a stable state: and . Due to , Therefore, H(x) is a decreasing function with respect to x. Therefore, when ,,, the government cannot determine a stable strategy. When ,, in this case, , z=1 is the Evolutionarily Stable Strategy (ESS) of the government. Otherwise, z=0 is the ESS.
Let the stable probability of government adopting SR be represented by volume
V3, and the stable probability of adopting LR be represented by volume
V4. The tangent plane passing through point
. We can obtain,
, wherein , .
Lemma 5: When the system satisfies , the probability of government adopting SR strategies is positively related to h, a, b, and Q, while it is negatively related to T, s, Cg, and Cw.
Proof: Let’s calculate the first-order partial derivatives of each element with respect to V4.We can obtain , , , , , , , .
Lemma 5 suggests that when the condition is met, a higher sensitivity of consumers towards the level of recycling services and a larger subsidy ratio from remanufacturer and platform lead to a greater quantity of waste being recycled. This can result in higher profits through carbon emission taxes, which inclines the government towards a stable choice of SR strategies. Additionally, the more recycling volume that government promotion efforts can bring, the more likely the government is to choose stable implementation of SR strategies. On the other hand, higher regulatory costs, carbon emission taxes, and levels of recycling services tend to make the government choose LR strategies. A higher carbon emission tax would prompt remanufacturer to autonomously choose LCP strategy, while under a higher level of recycling services, the recycling system can operate well even without government involvement.
Lemma 6: There exists the probability of government implementing SS strategies decreases as the probability of remanufacturer adopting LCP strategies and platform choosing SI strategies increases.
Proof: According to the analysis of government’s strategy stability, when , then , , at this case, z=1 is the ESS. Thus, as z gradually decreases, the government’s stable strategy transitions from z=1 (SR) to z=0 (LR).
Lemma 6 suggests that in the early stage of evolution, the regulatory role of the government is more pronounced. The government can influence by increasing subsidies for remanufacturers and platforms, imposing carbon emission taxes on traditional products, promoting the adoption of LCP strategies by remanufacturers, and encouraging platform to choose strategies. This will stimulate consumer participation in waste product recycling and increase the amount of waste product collected in the recycling system.
4.4. Stability Analysis of Equilibria in Three-Player Evolutionary Game Systems
Based on the analysis of pure strategies for remanufacturers, platforms, and the government in sections 4.1-4.3, we will now solve for the mixed strategies of each participant in the system. Let
,
,
, then 13 equilibrium points can be derived,
E1(0,0,0),
E2 (1,0,0),
E3 (0,1,0),
E4 (0,0,1),
E5 (1,1,0),
E6 (1,0,1),
E7 (0,1,1),
E8 (1,1,1),
E9 (
,1,
),
E10(
,0,
),
E11(1,
,
),
E12 (
,
,
),
E13 (0,
,
). To facilitate calculations, let us assume the following in this section:
K=1/2
me2,
L=1/2
ns2. Thus,
In actual situations, when the government does not implement regulation, platforms prioritize their own interests. This means that the increment in revenue for the platform after engaging in recycling service investment will be greater than zero. In other words,
, therefore, The existence of points
E11 (1,
,
) and
E12 (
,
,
) is meaningless. Furthermore, since
, The existence of point
E13 (0,
,
) also is meaningless. The existence of
E9(
,1,
) and
E10 (
,0,
), under certain conditions, it can have significance. The Jacobian matrix of the three-player evolutionary game system is as follows:
Using the first Lyapunov method: If all eigenvalues of the Jacobian matrix have negative real parts, then the equilibrium point is asymptotically stable. If at least one eigenvalue of the Jacobian matrix has a positive real part, then the equilibrium point is unstable. If the Jacobian matrix has eigenvalues with zero real parts and the rest of the eigenvalues have negative real parts, then the equilibrium point is in a critical state, and stability cannot be determined by the sign of the eigenvalues. The stability analysis of each equilibrium point is shown in
Table 4.
Lemma 7: When K-rehs<0, the replicator dynamic system only has one stable point E5 (1,1,0).
Proof: According to
Table 4, this condition satisfies Condition ②, so
E5(1,1,0) is an asymptotically stable point of the system. Conditions ①, ③, and ④ are not satisfied, so equilibrium points
E3(0,1,0) and
E7(0,1,1) are unstable. Equilibrium point
E9 (
x1, 1,
z1) does not exist, and although Condition ⑤ may be satisfied,
E10 (
x1, 0,
z1) is an unstable point.
Lemma 7 indicates that when the profit increase from producing low-carbon products is relatively high and the recycling quantity generated by platform investment in recycling services is high, depending on the initial strategy selection of the three parties, the evolutionary stable strategy combination converges to the stable point (LCP, SI, SR).
Lemma 8: When TQ-Cg-Cw-bL<0 and K>rehs, the replicator dynamic system has a stable point E3 (0,1,0).
Lemma 9: When TQ-Cg-Cw-bL>0 and K>(T+re)(Q+hs)/(1-a), the replicator dynamic system has a stable point E7 (0,1,1).
Proof: According to
Table 4, when
TQ-Cg-Cw-bL<0 and (
T+re)(
Q+hs)-(
1-a)
K<0, conditions ②, ④, and ⑤ are not satisfied. Therefore, equilibrium point
E5(1,1,0) becomes unstable, and equilibrium points
E9(
x1, 1,
z1) and
E10 (
x1, 0,
z1) do not exist. In this case, there are two stable points:
E3(0,1,0) and
E7(0,1,1). When the constraint on
K is further narrowed down to
rehs<
K<(
T+re)(
Q+hs)/(1-
a), condition ③ is no longer satisfied. In this case, the system only has one stable point, which is
E3 (0,1,0).
Lemma 8-9 indicate that in the early stage of product carbon reduction technology development, when the cost for remanufacturers to produce low-carbon products is very high, government regulations may not be effective. Industrial technological development generally goes through three stages: initial, intermediate, and mature. In the initial stage, the research and development costs are usually very high. Despite government subsidies, carbon emission tax exemptions, and other policies, remanufacturers still face difficulty in obtaining profits during this stage. Hence, there can be stable points in the system with the combinations of (TP, SI, SR) and (TP, SI, LR). During this stage, the government can increase subsidy levels, enhance recycling promotion efforts, provide exemptions from low-carbon product carbon emission taxes, and increase traditional product carbon emission taxes. Additionally, the country can allocate more research funding for technological innovation and encourage research institutions to conduct research and development on relevant carbon reduction technologies, allowing carbon reduction technologies to move more swiftly from the initial stage to the mature stage.
5. Result and Discussion
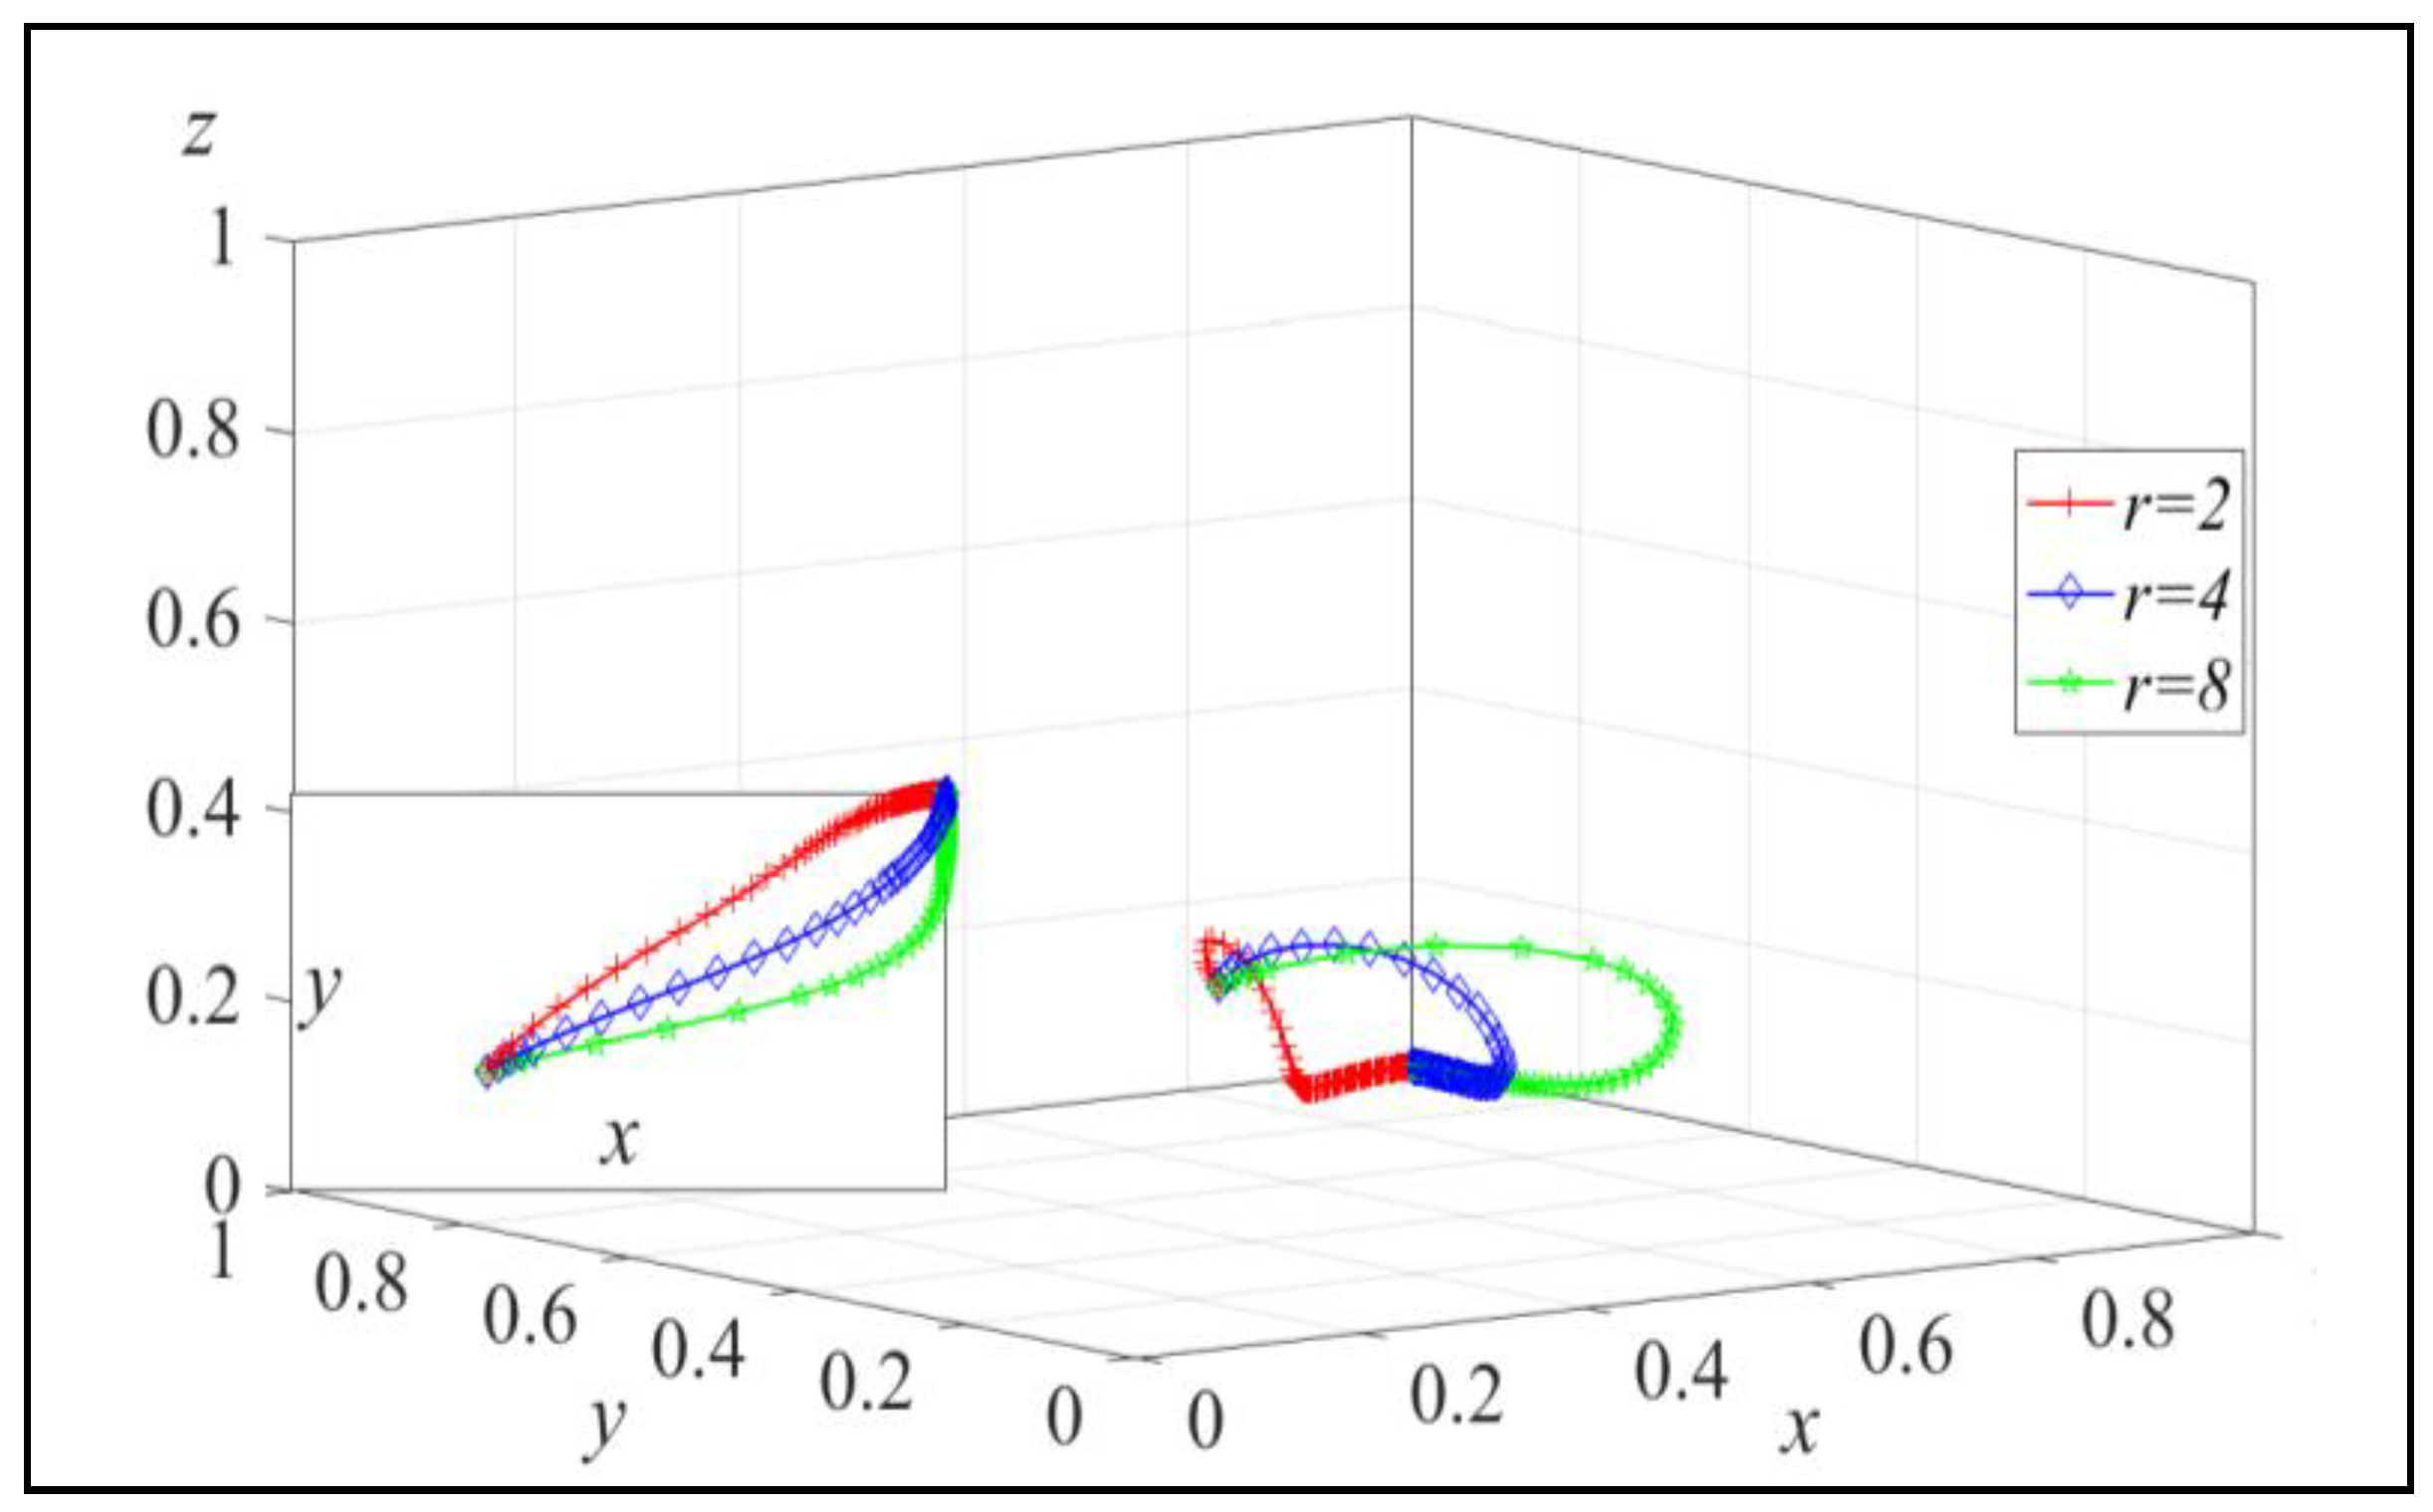
To validate the effectiveness of the above analysis and provide a more intuitive reflection of the impact of various parameters on the stability of the low-carbon e-commerce supply chain recycling evolutionary system, this section will assign numerical values to the model and use Matlab 2021 for simulation. The parameters for the first set are as follows: r=4, u=1, T=2, e=0.5, s=0.5, a=0.5, b=0.5, Cg=5, Cw=5, Q=40, h=100, m=400, n=200, which satisfy the conditions in Lemma 7.
Firstly, let’s assign
r = 2, 4, 8, and the simulation results are shown in
Figure 2.
From
Figure 2, we can see that during the evolution of the system towards the stable point, an increase in the price marginal parameter of carbon emission reduction can accelerate the evolutionary speed of remanufacturers choosing to produce low-carbon products. As
r increases, the probability of remanufacturers adopting the low-carbon product strategy increases, which aligns with the conclusion in Lemma 1.
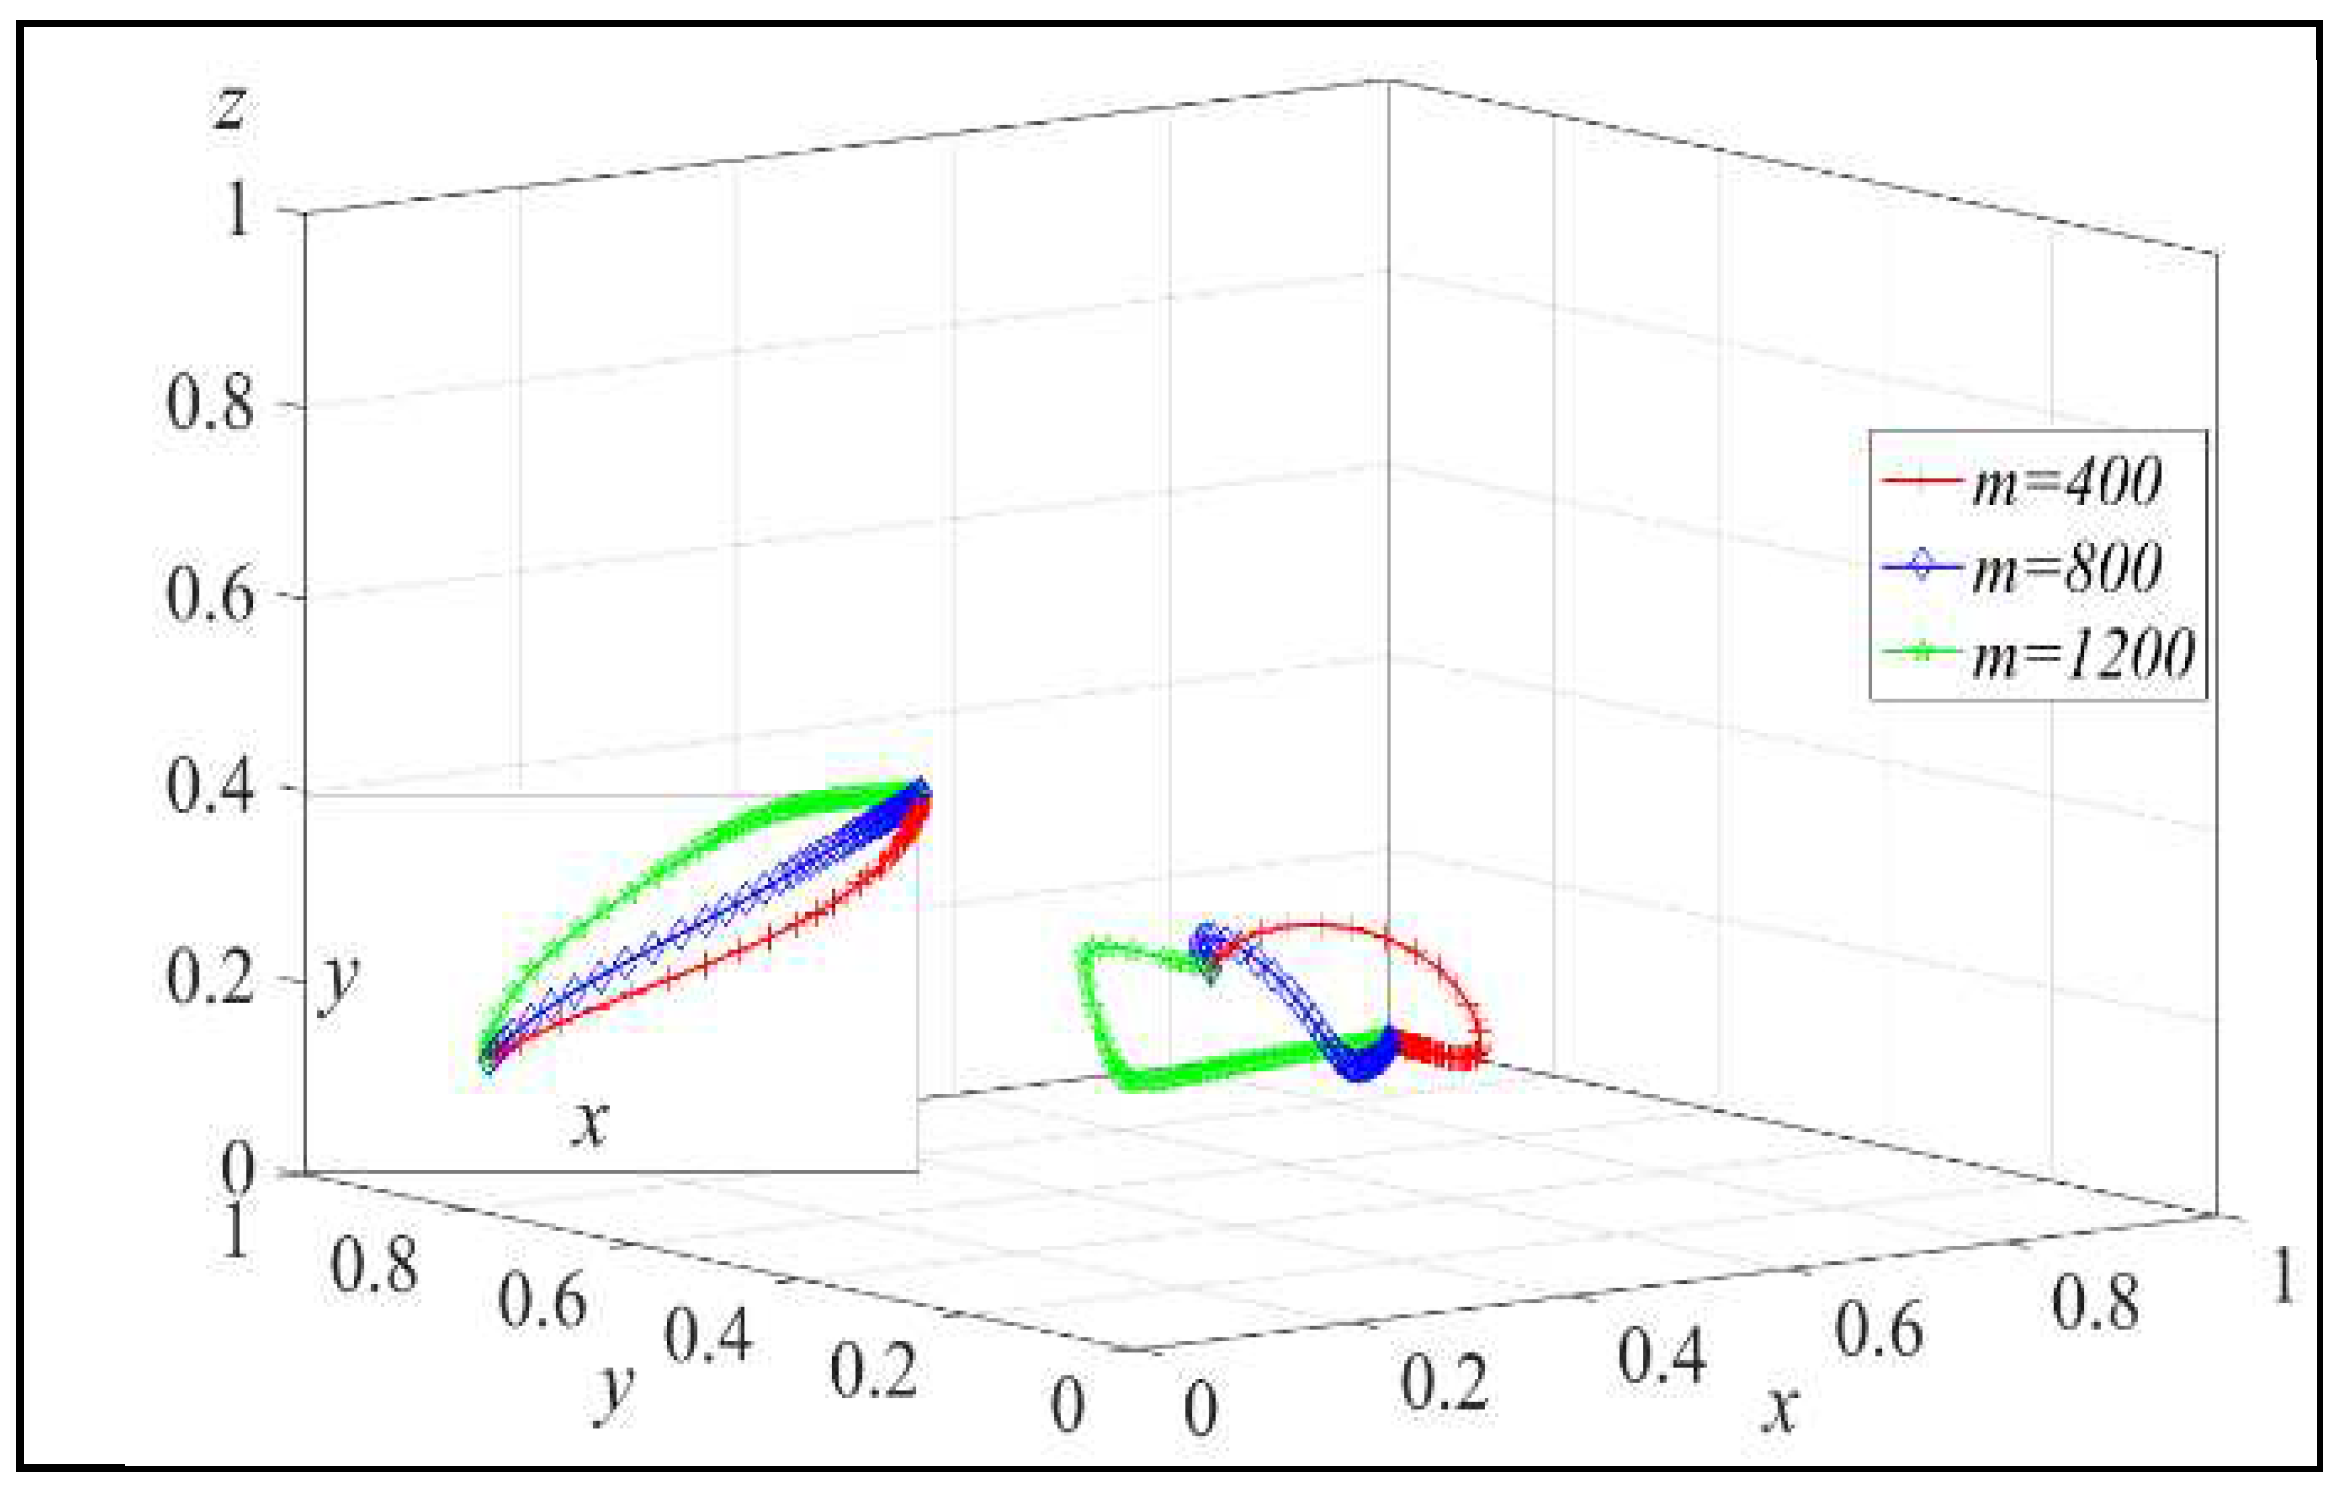
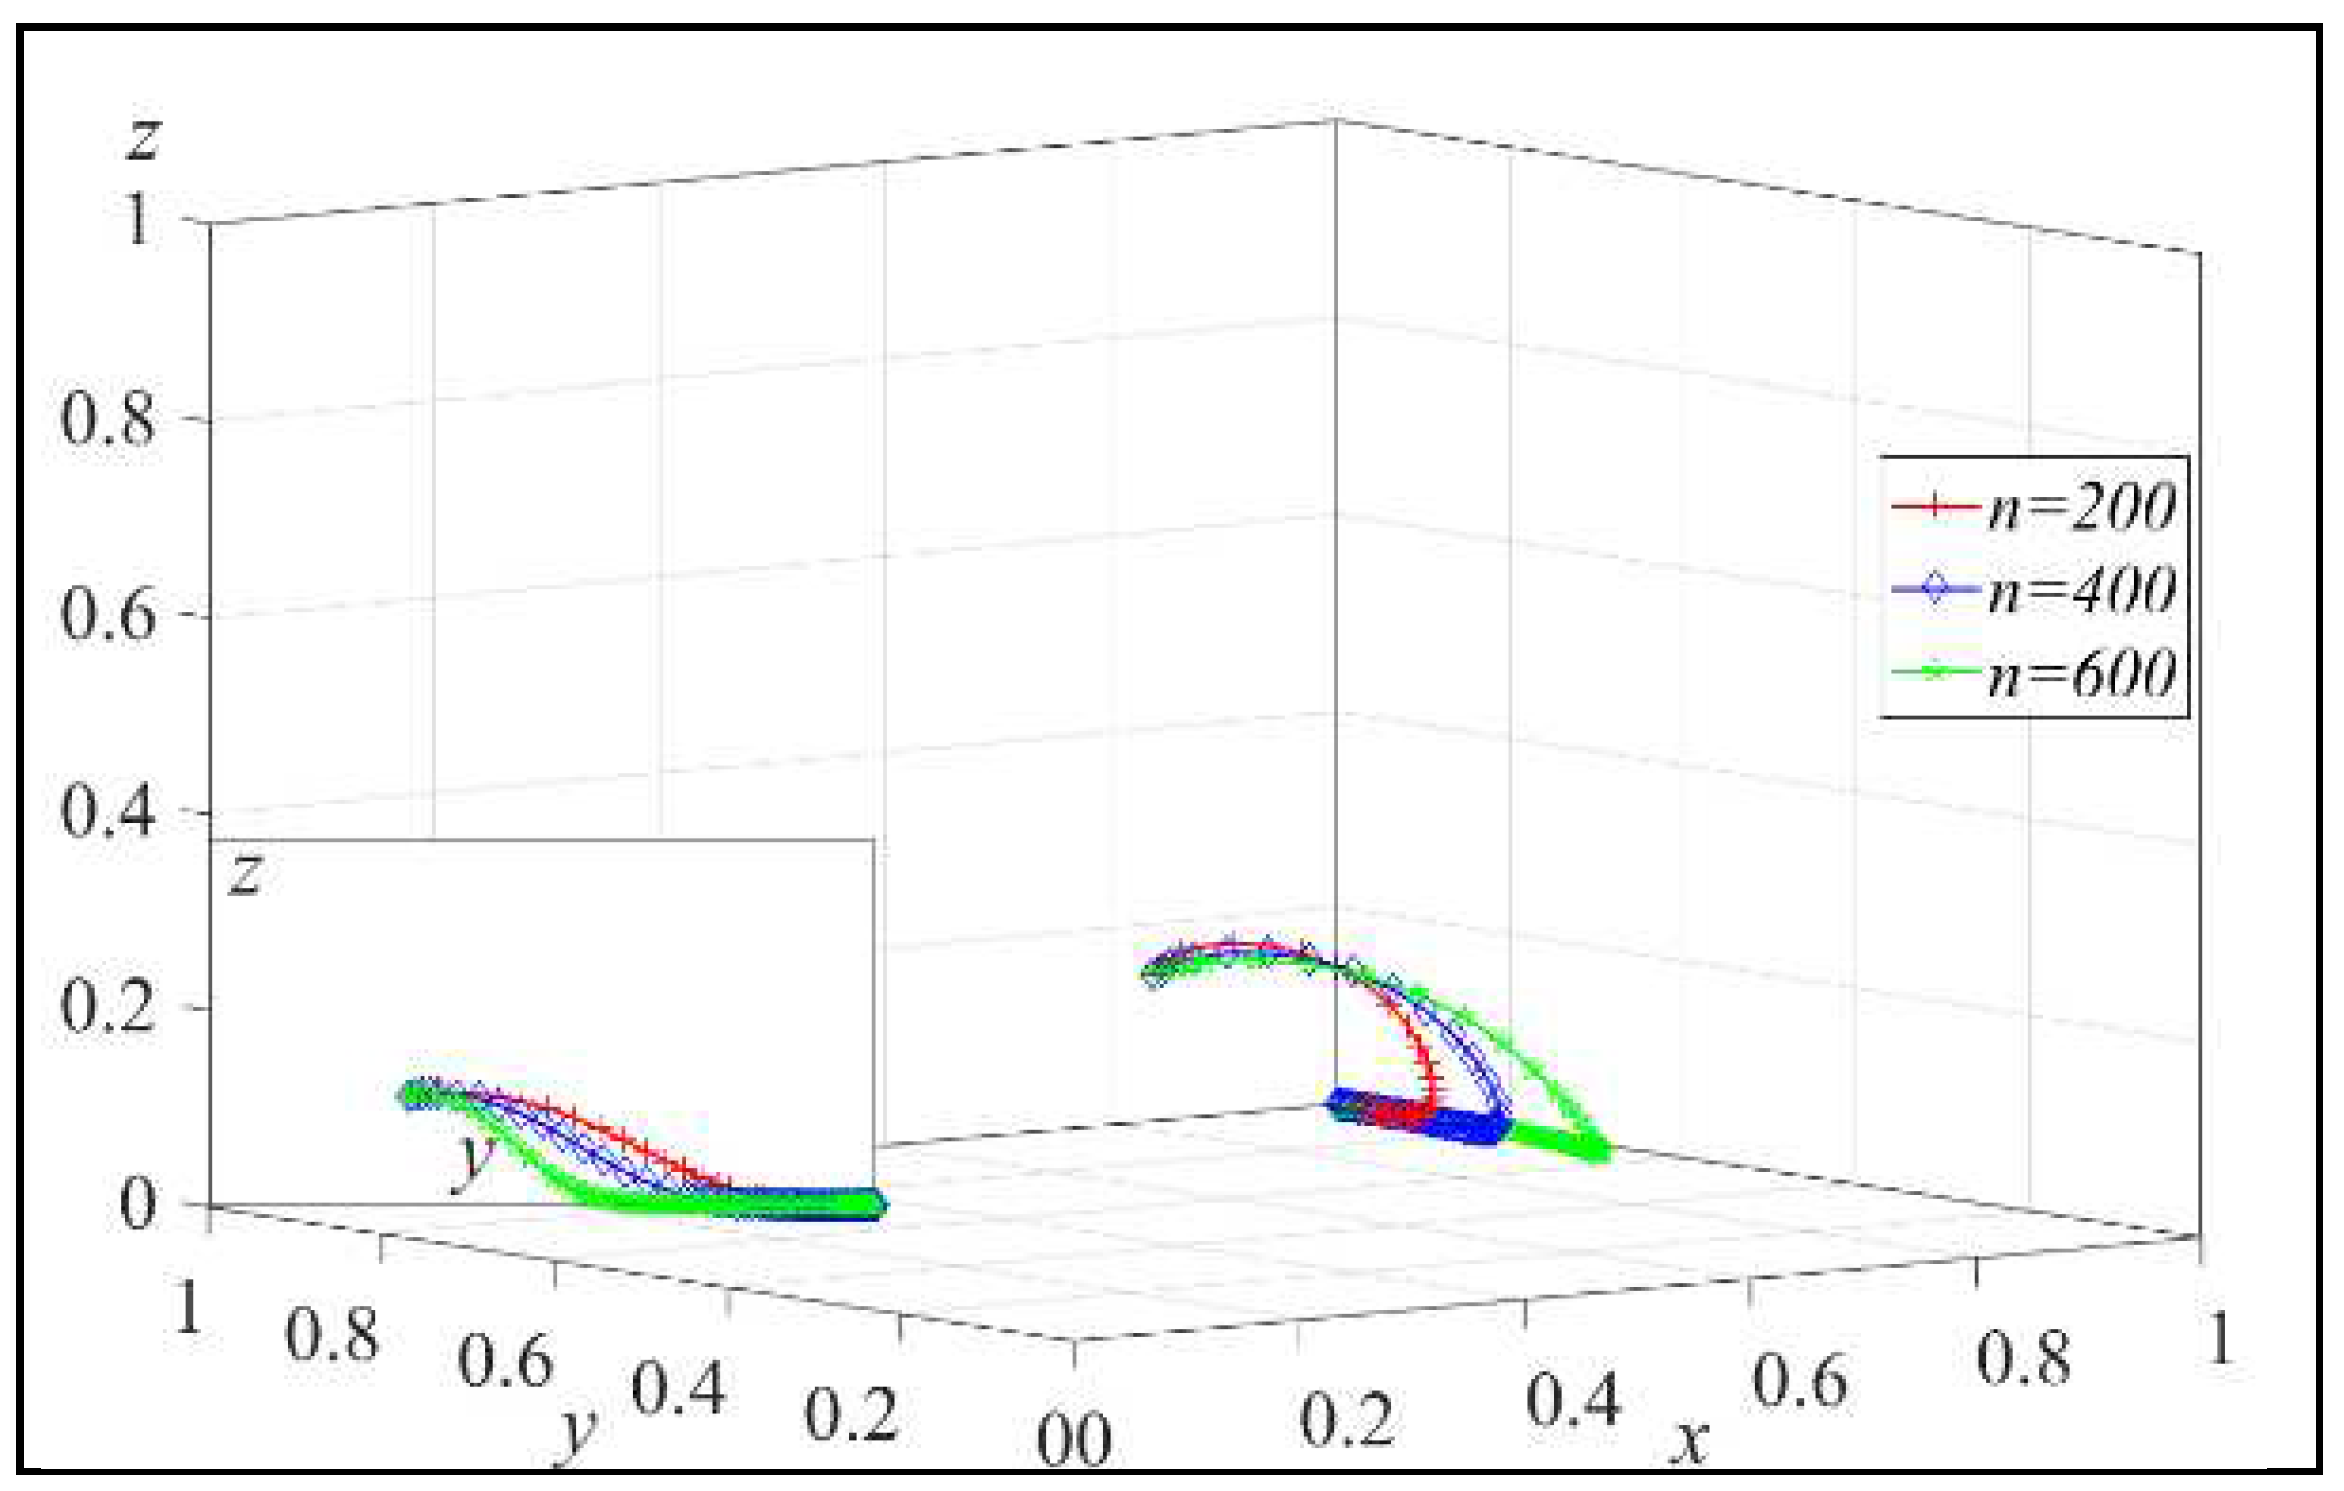
Next, assign m to
m = 400, 800, 1200, and the simulation results are shown in
Figure 3. Similarly, assign n to
n = 200, 400, 600, and the simulation results are shown in
Figure 4.
From
Figure 3, we can observe that in the relatively mature stage of carbon emission reduction technology, reducing the cost sensitivity coefficient of carbon emission reduction can accelerate the evolutionary speed of remanufacturers choosing to produce low-carbon products. As
m decreases, the probability of remanufacturers adopting the low-carbon product strategy increases, which aligns with the conclusion in Lemma 1.
From
Figure 4, it can be observed that reducing the cost sensitivity coefficient of service level can accelerate the evolutionary speed of the platform choosing to invest in recycling services. As
n decreases, the probability of the platform adopting the recycling service investment strategy increases, which aligns with the conclusion in Lemma 3.
Once again, assign
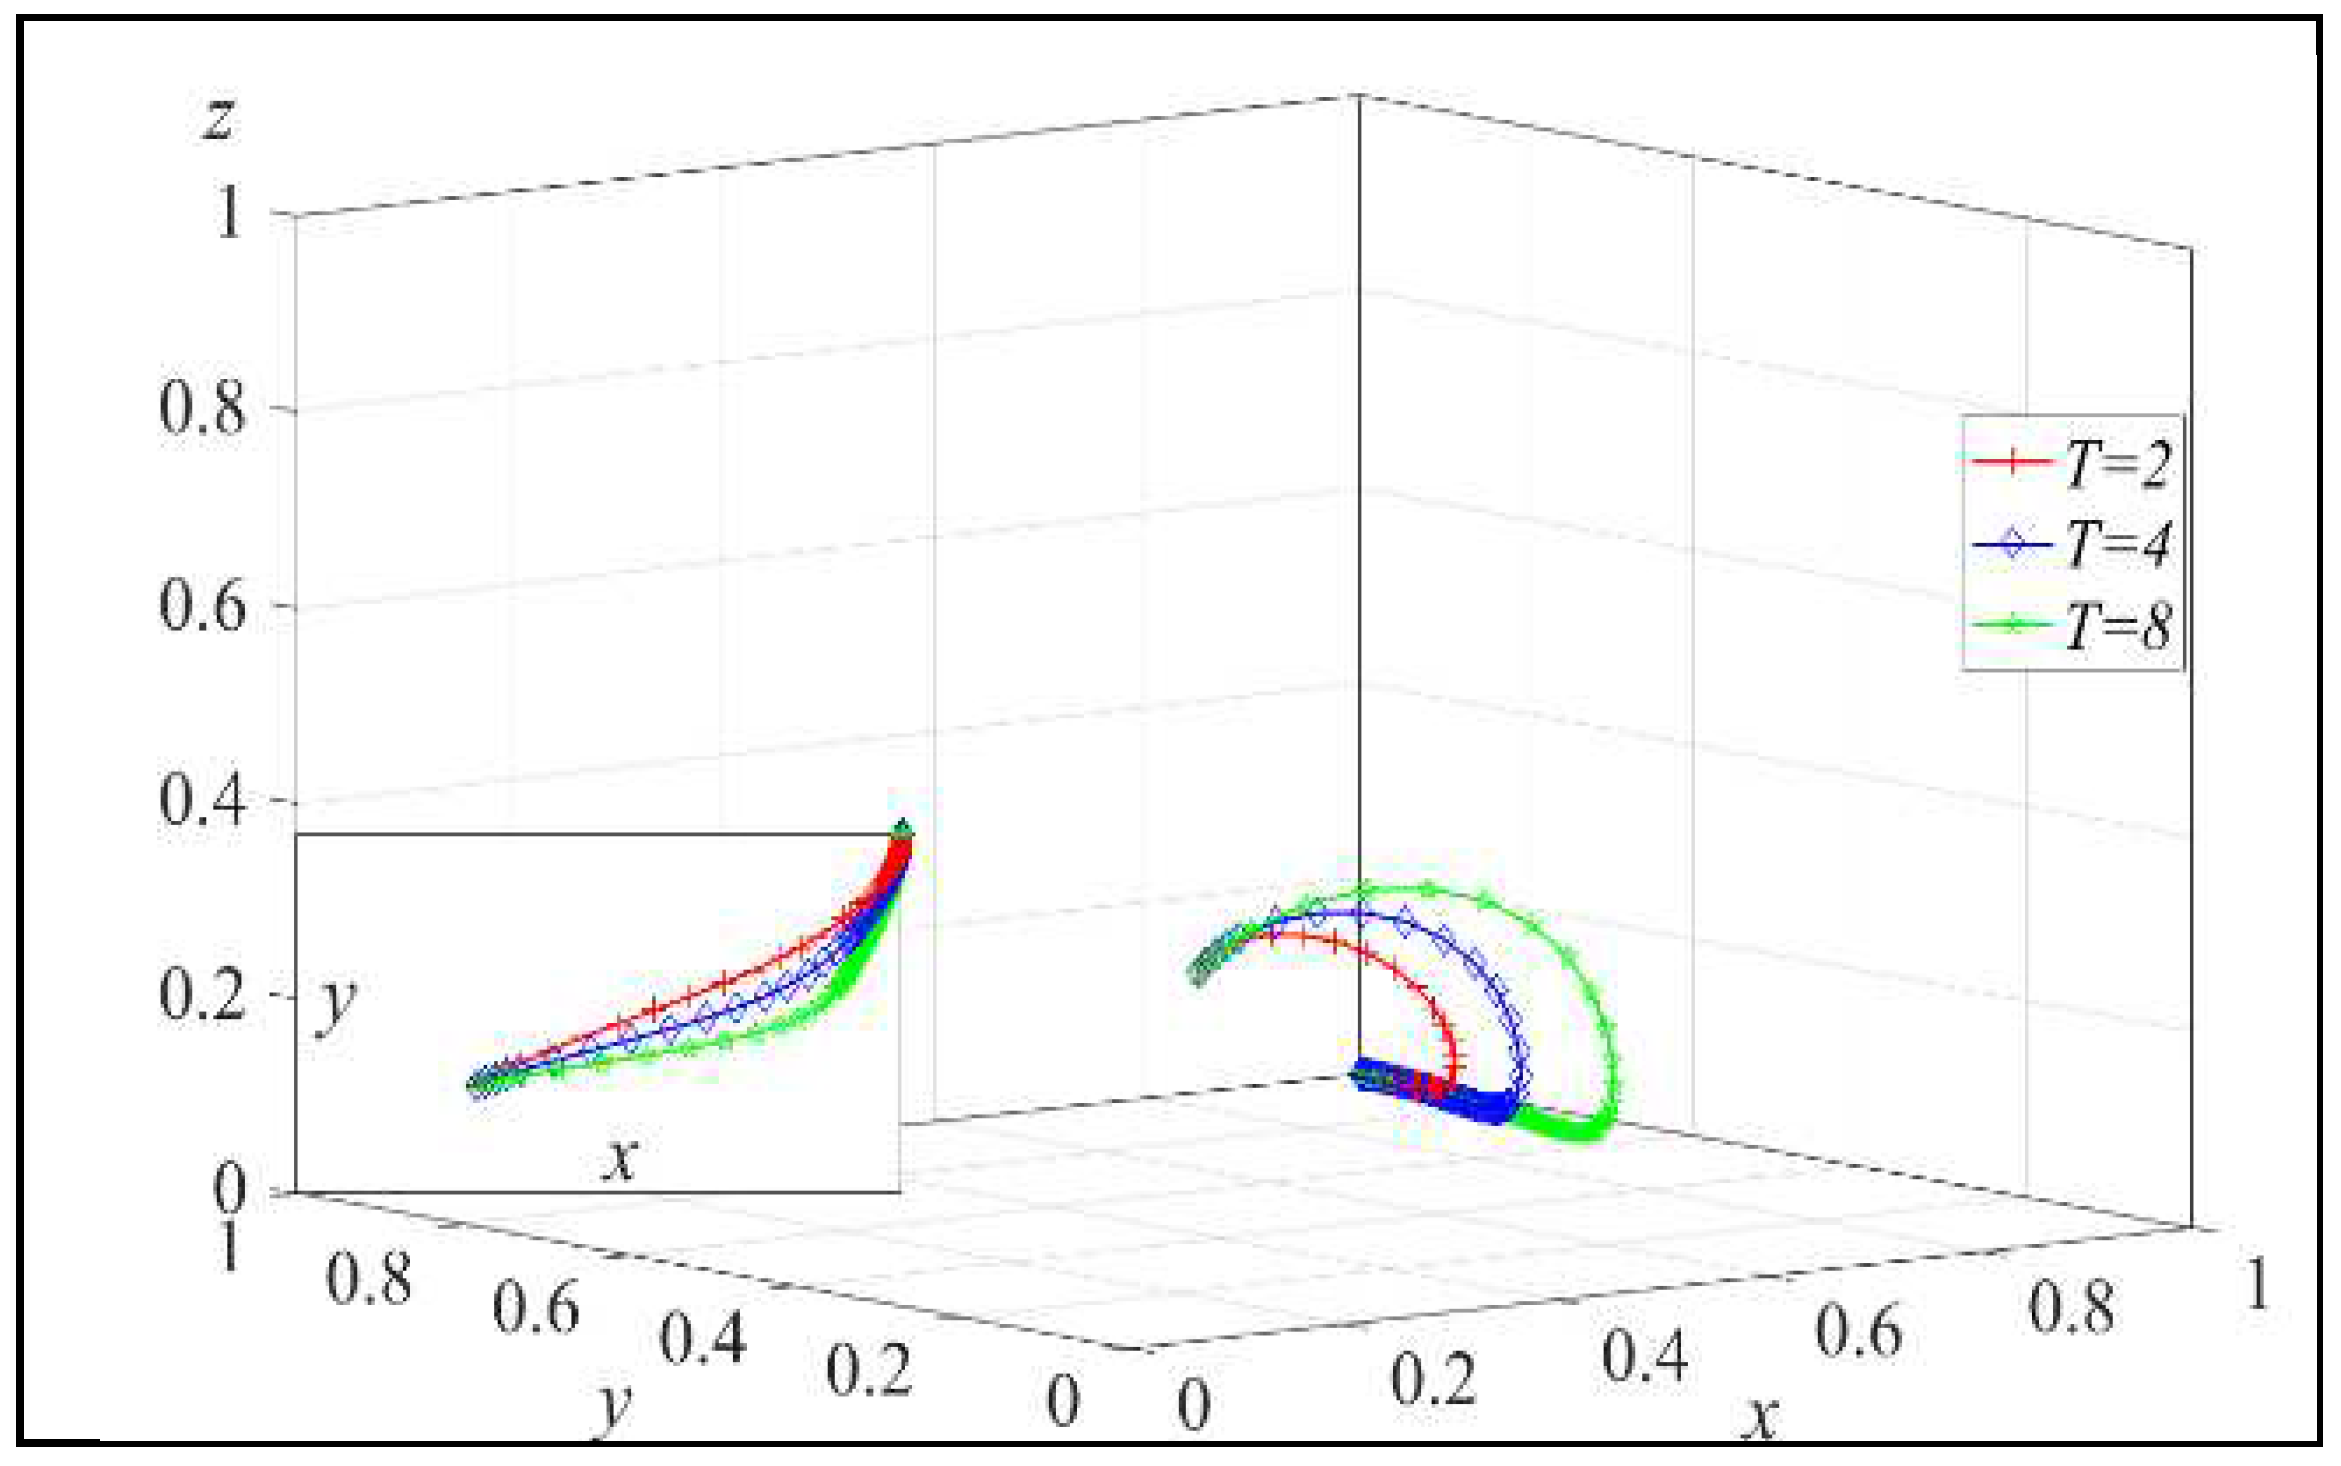
T = 2, 4, 8, and the simulation results are shown in
Figure 5. Similarly, assign
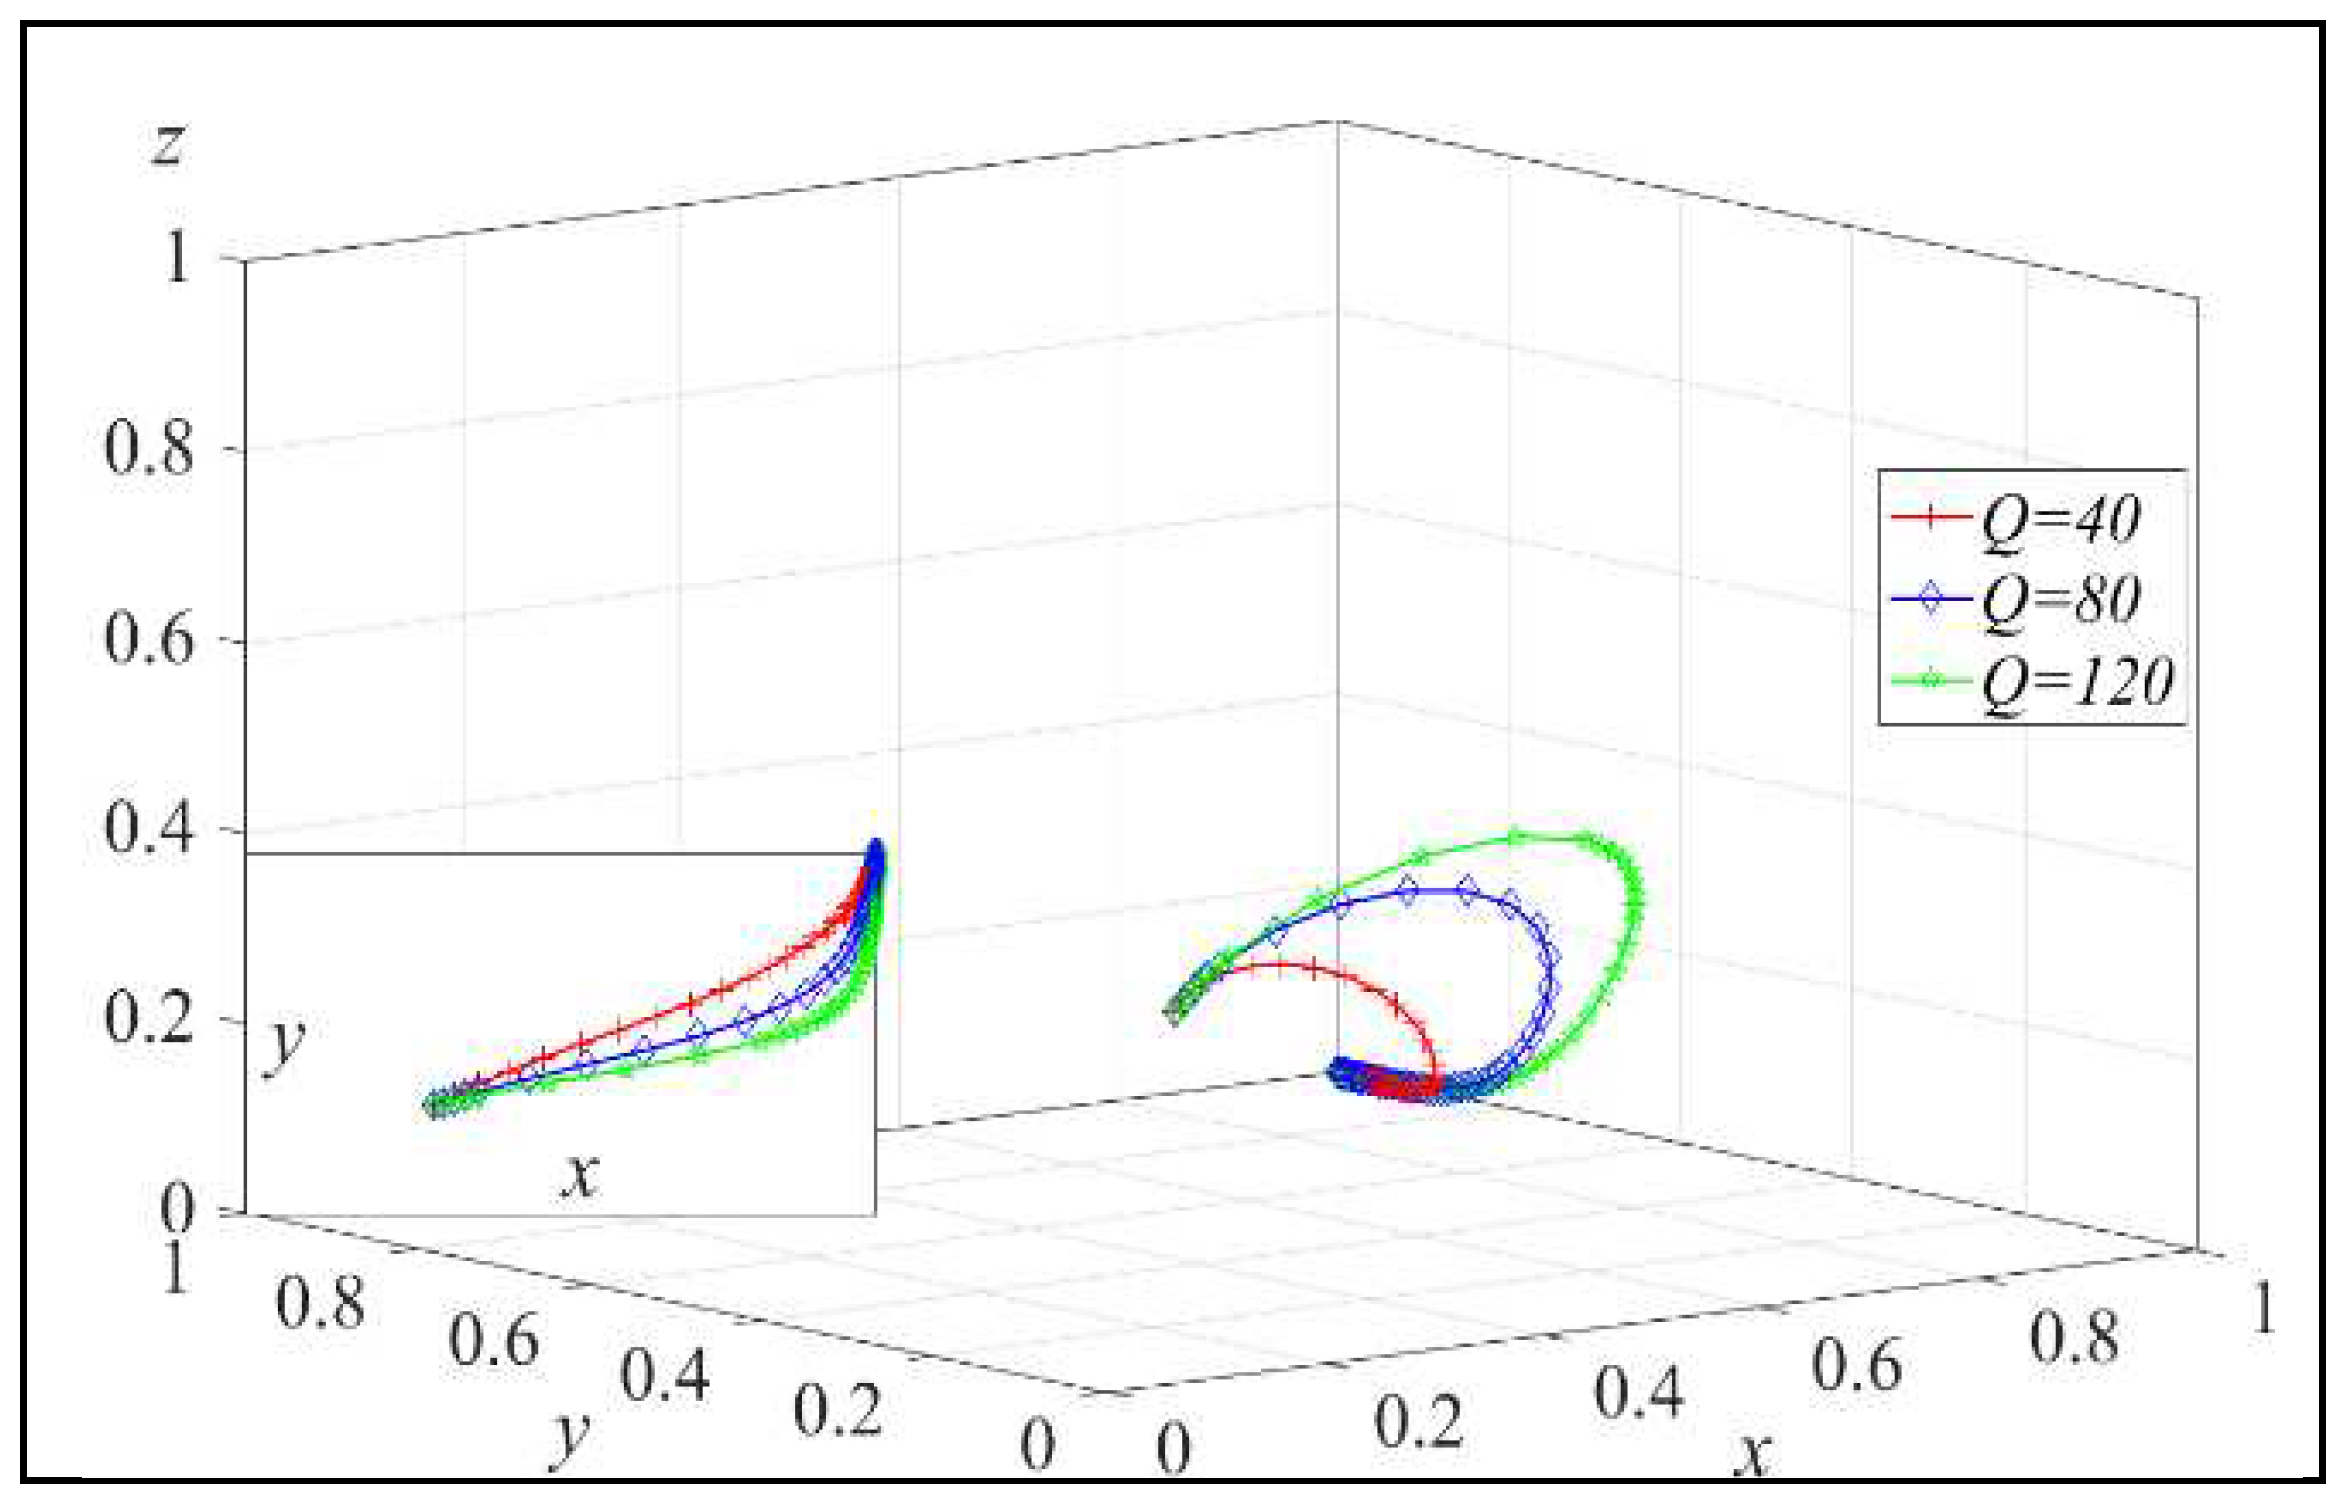
Q = 40, 80, 120, and the simulation results are shown in
Figure 6.
From
Figure 5, we can observe that as T increases, the probability of remanufacturers adopting the low-carbon product strategy rises, which aligns with the conclusion in Lemma 1. Therefore, the government can consider increasing the carbon emission tax on traditional products, reducing the sales profits of traditional products, thereby incentivizing remanufacturers to choose low-carbon product production.
From
Figure 6, we can see that as
Q increases, the probability of remanufacturers choosing the low-carbon product strategy also increases, which aligns with the conclusion in Lemma 1. Therefore, the government can implement measures such as recycling awareness campaigns and educational programs to strengthen consumers’ awareness of recycling. This can increase the amount of waste products (
Q) in the system, subsequently increasing the probability of remanufacturers opting for low-carbon product production strategy.
Next, assign
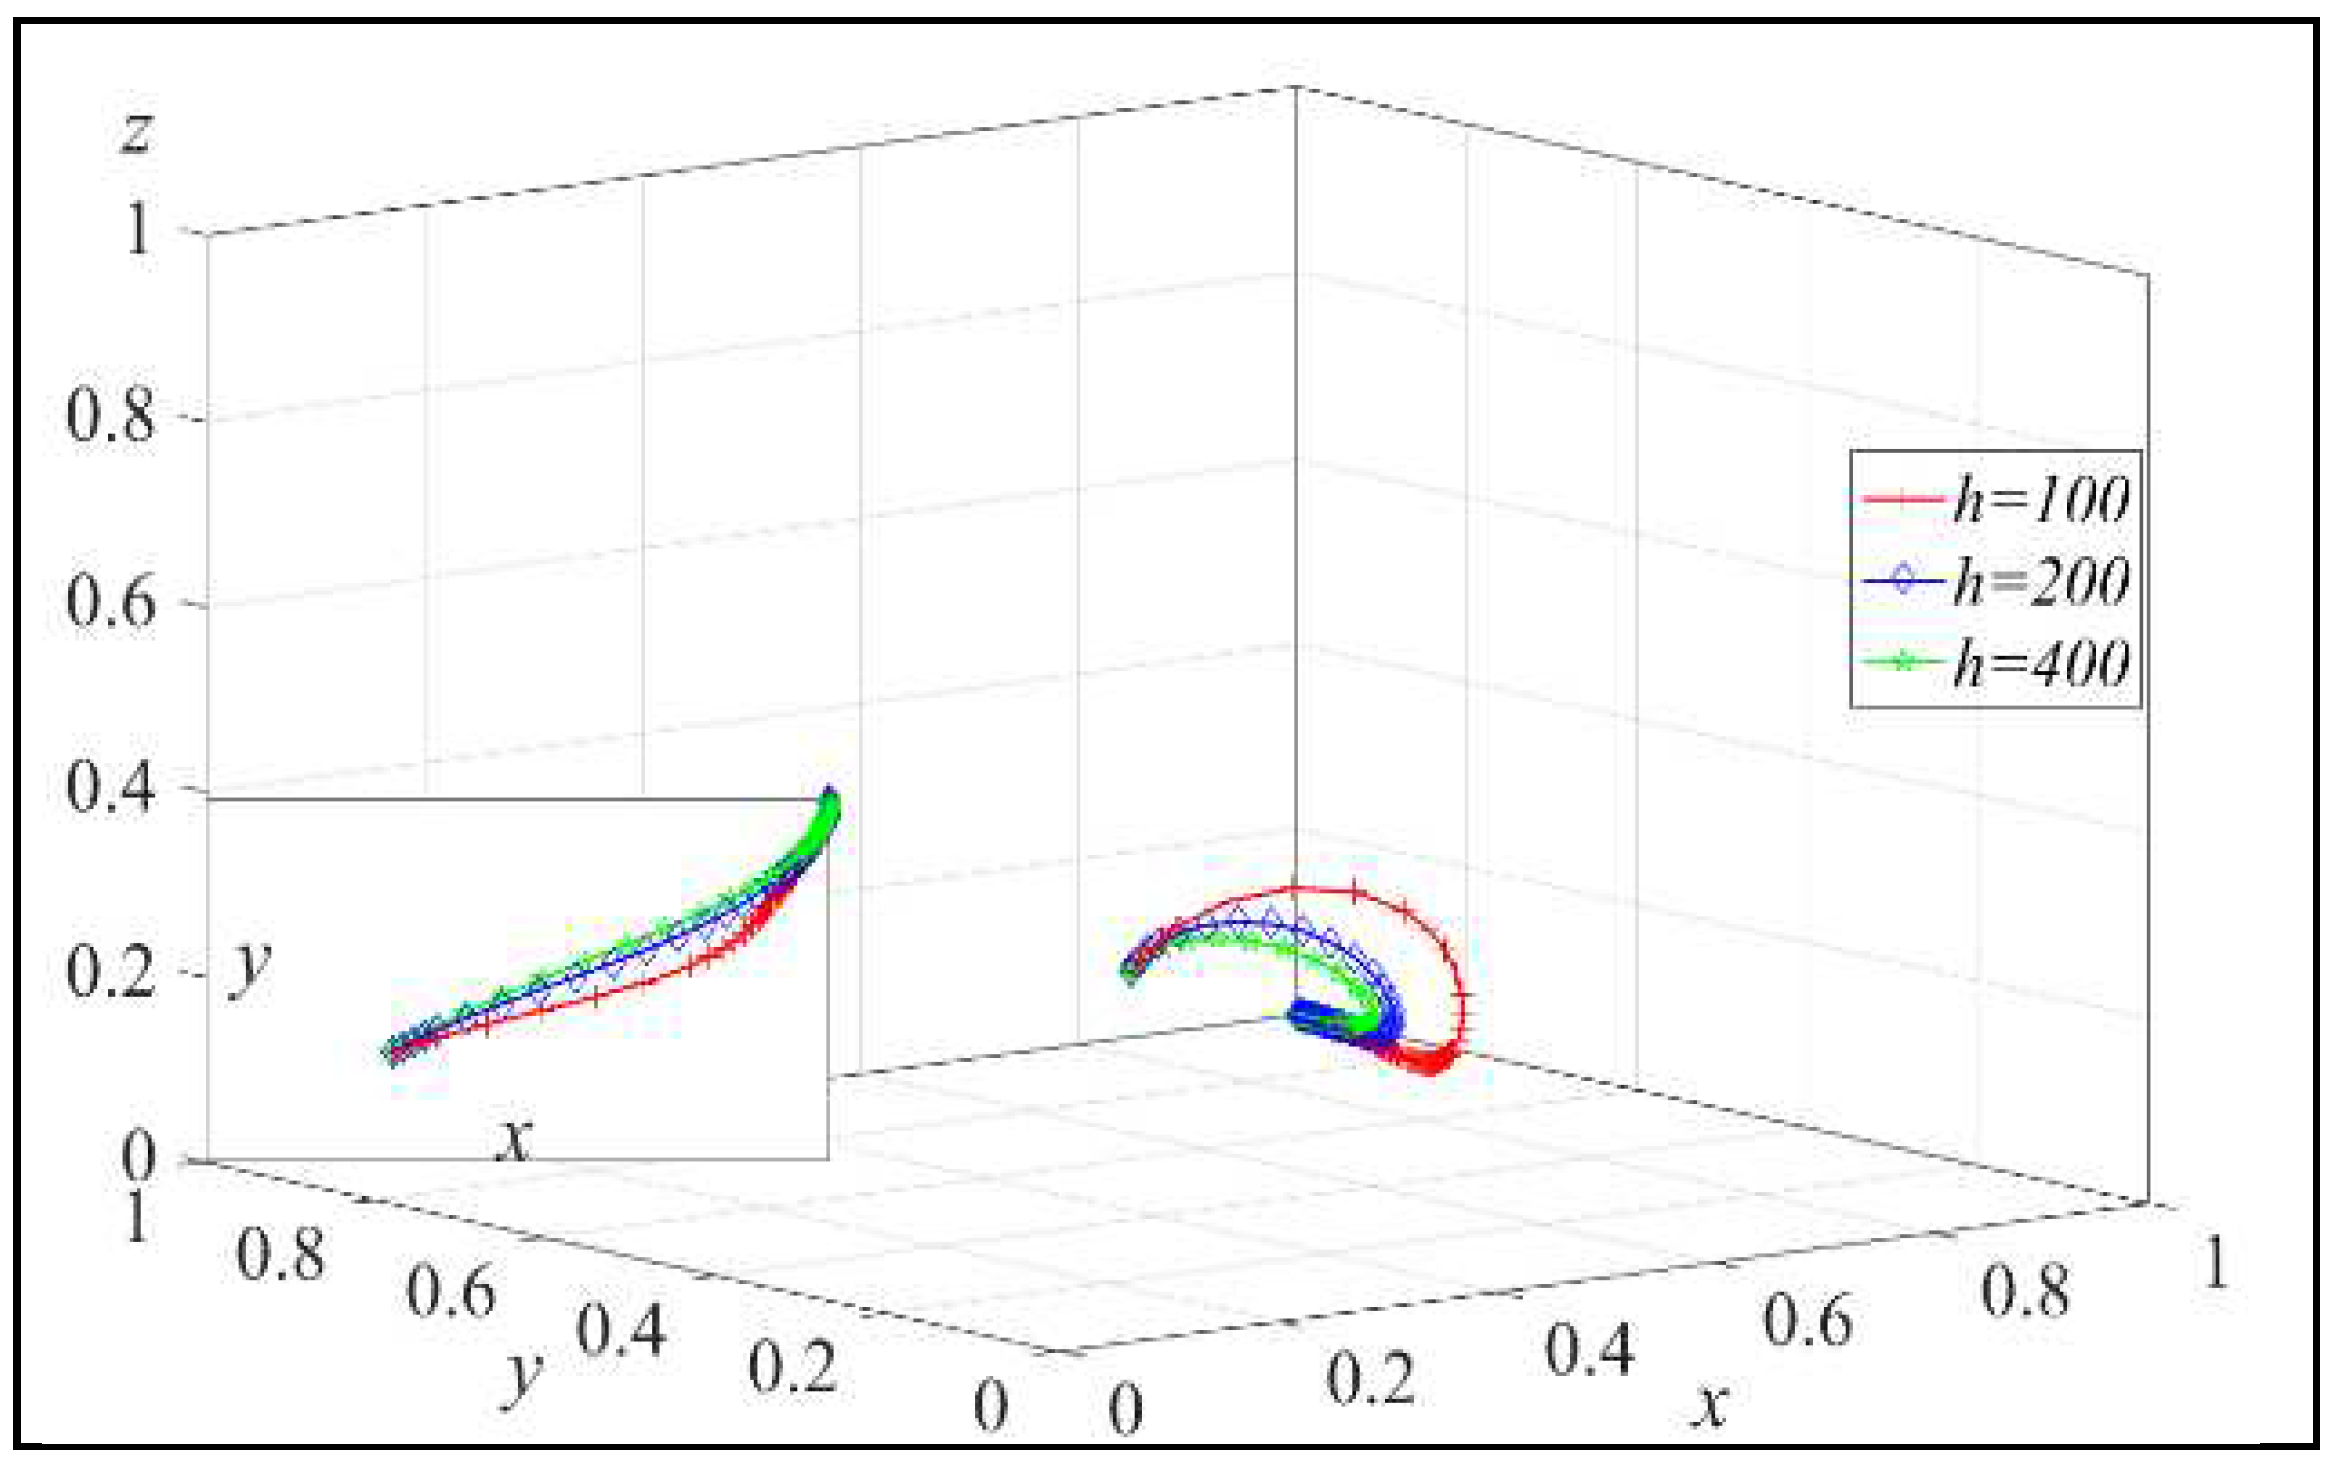
h = 100, 200, 400, and the simulation results are shown in
Figure 7. Similarly, assign s to
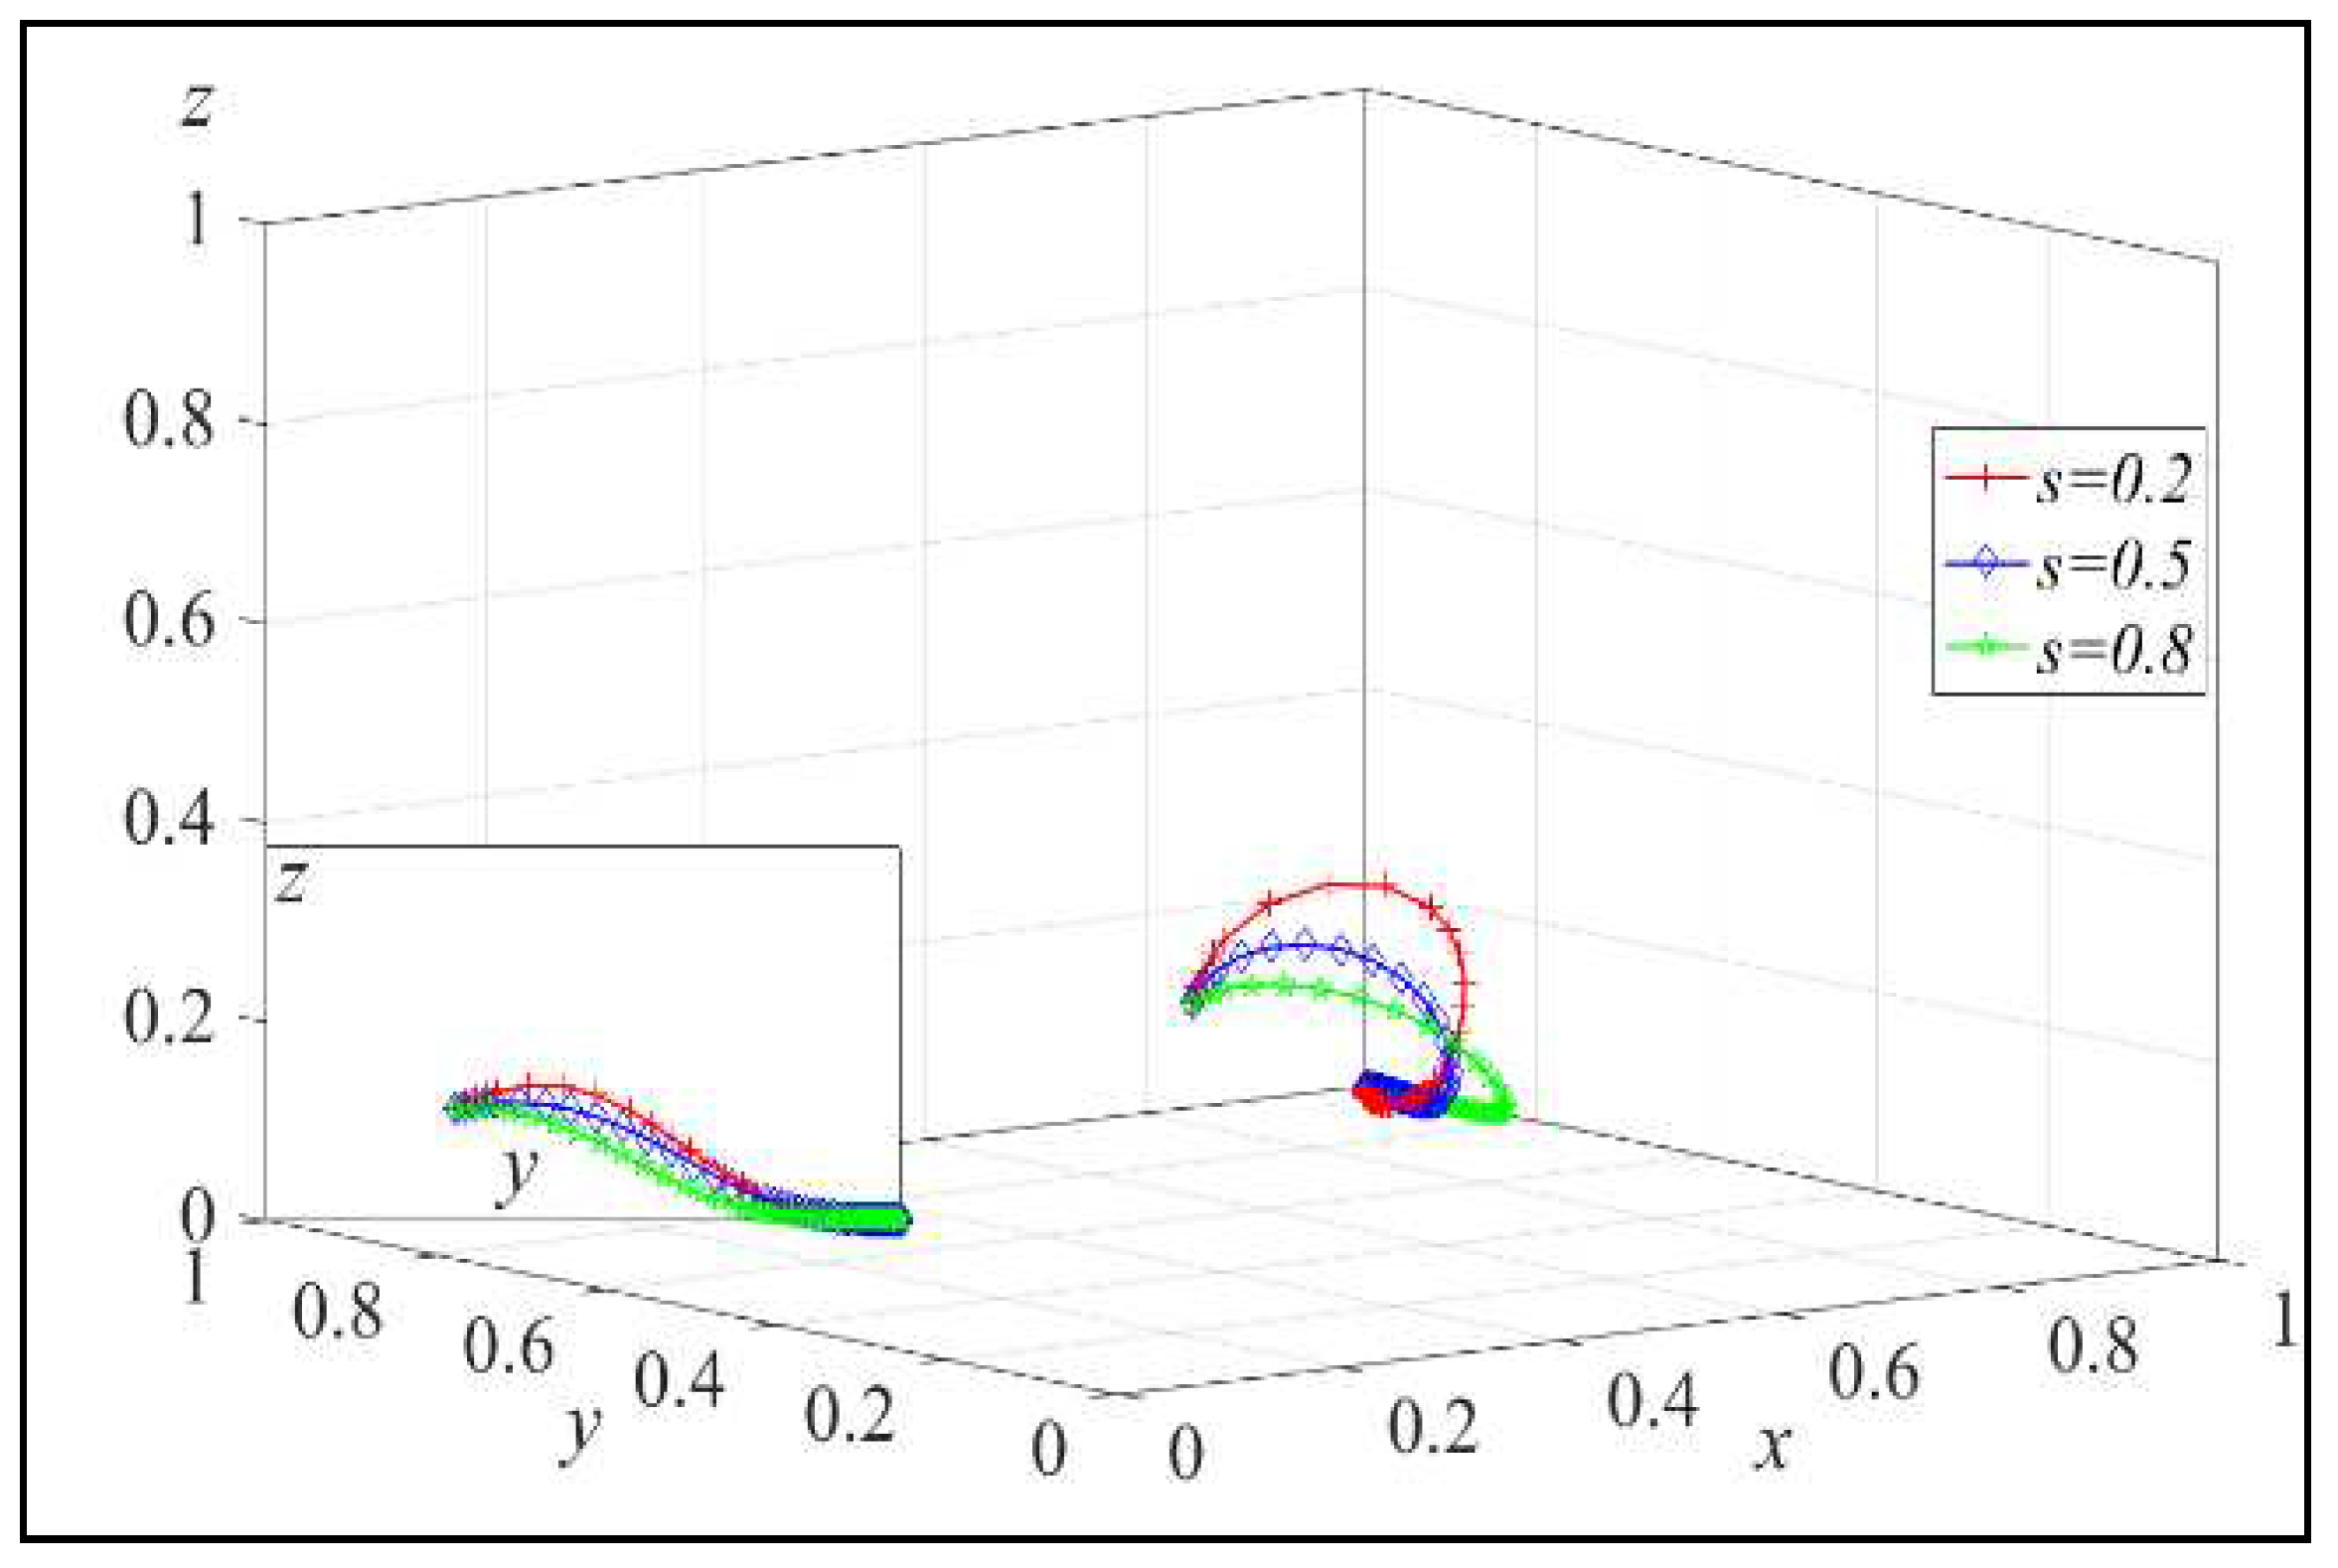
s = 0.2, 0.5, 0.8, and the simulation results are shown in
Figure 8.
From
Figure 7, we can observe that increasing the elasticity coefficient of platform’s recycling quantity with respect to service level (
h) can accelerate the evolutionary speed of the platform choosing to invest in recycling services. As
h increases, the probability of the platform adopting the recycling service investment strategy also increases.
From
Figure 8, we can see that as the platform’s service level becomes higher, the platform’s rate of choosing to invest in recycling services decreases. This is in line with the conclusion in Lemma 3. As s increases, the probability of the platform adopting the recycling service investment strategy decreases.
Overall, the simulation results align with the conclusions in Lemma 3, indicating that an increase in the elasticity coefficient of the platform’s recycling quantity and a higher service level can accelerate or slow down the evolutionary speed of the platform’s investment in recycling services.
Array 1 satisfies the conditions in Lemma 7. Assign values to Array 2 and Array 3 to satisfy the conditions in Lemma 8 and Lemma 9, respectively. Array 2:
r=1,
u=1,
T=0.5,
e=0.5,
s=0.2,
a=0.5,
b=0.5,
Cg=10,
Cw=10,
Q=30,
h=100,
m=600,
n=600. Array 3:
r=1,
u=1,
T=0.5,
e=0.5,
s=0.2,
a=0.5,
b=0.5,
Cg=5,
Cw=5,
Q=30,
h=100,
m=1000,
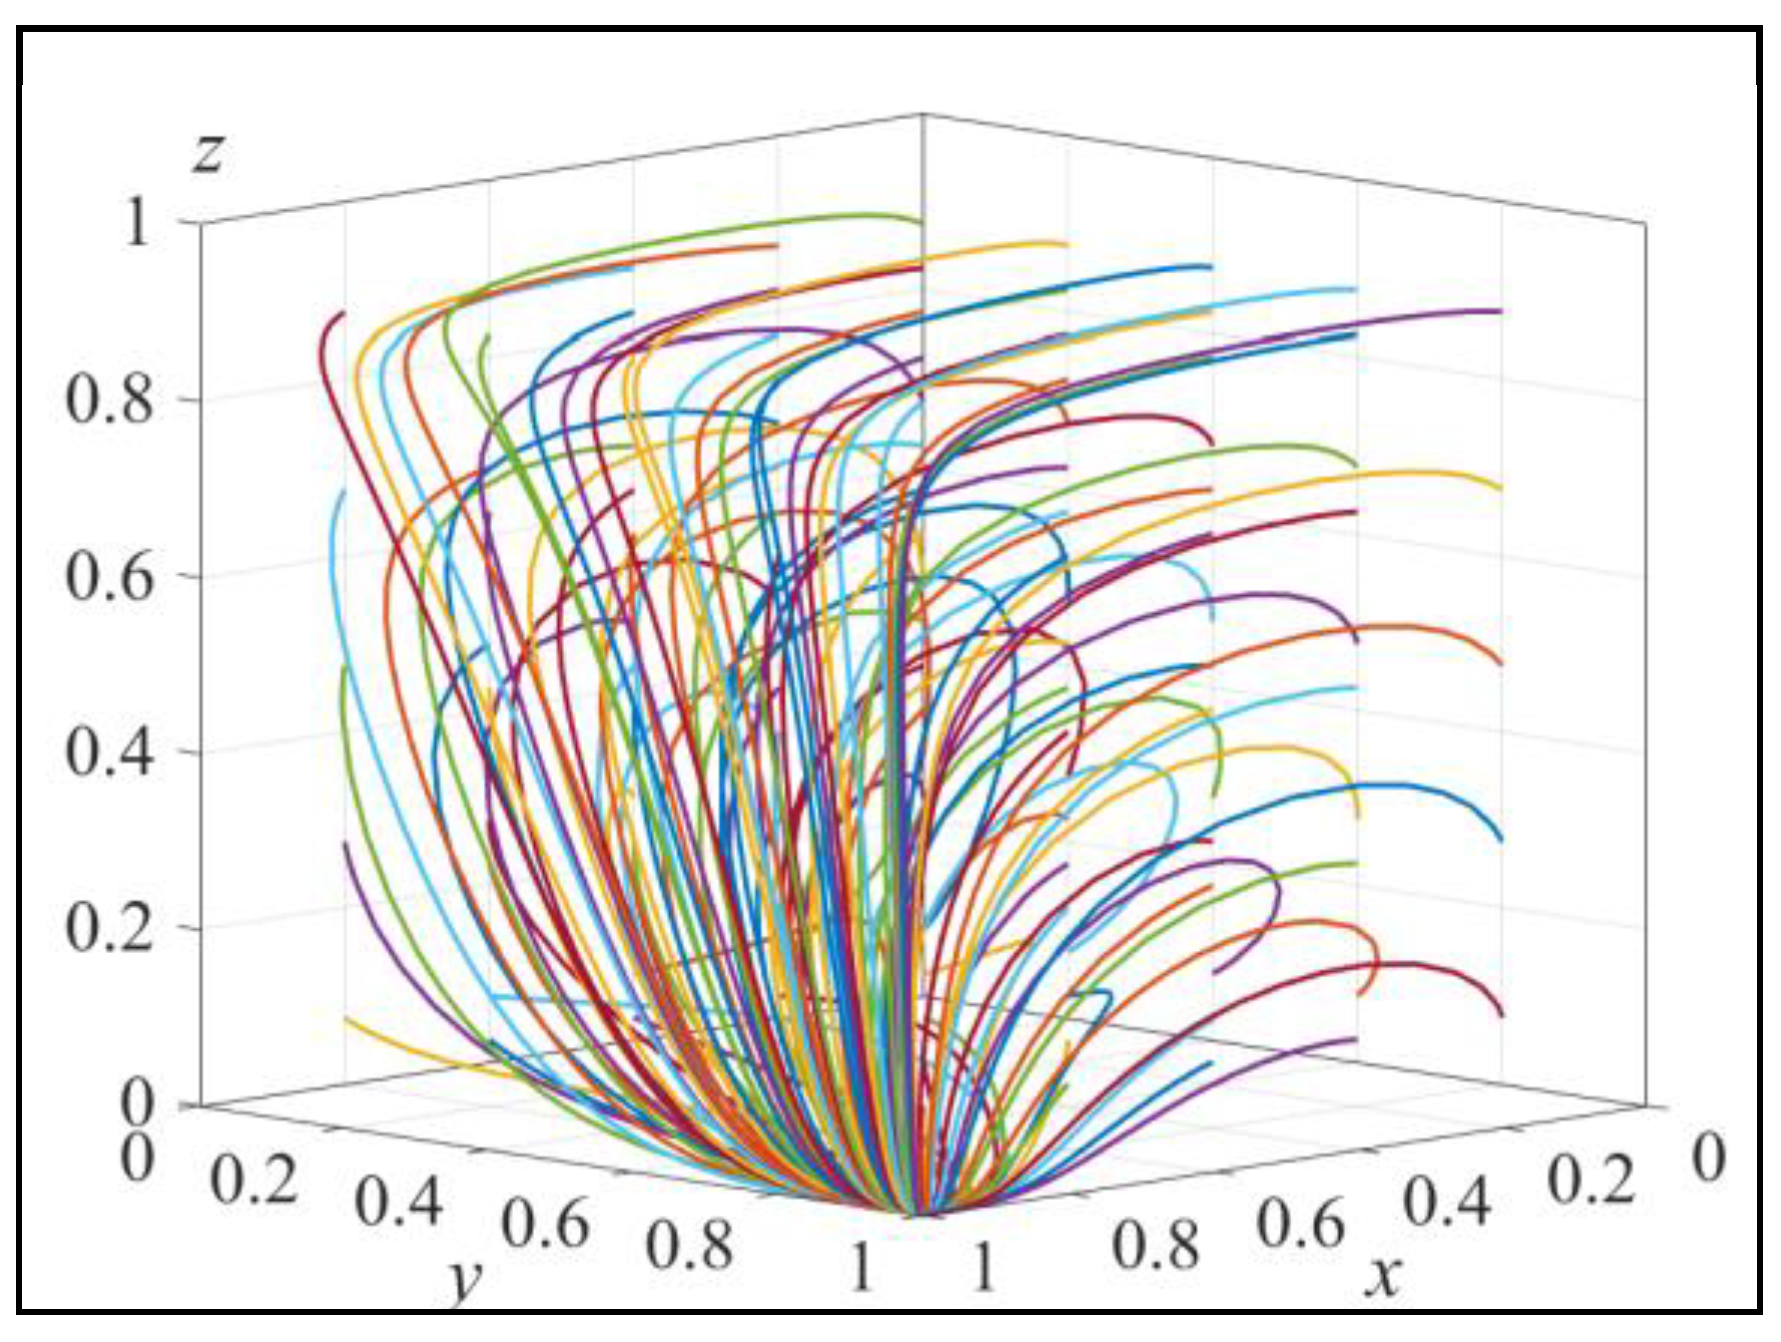
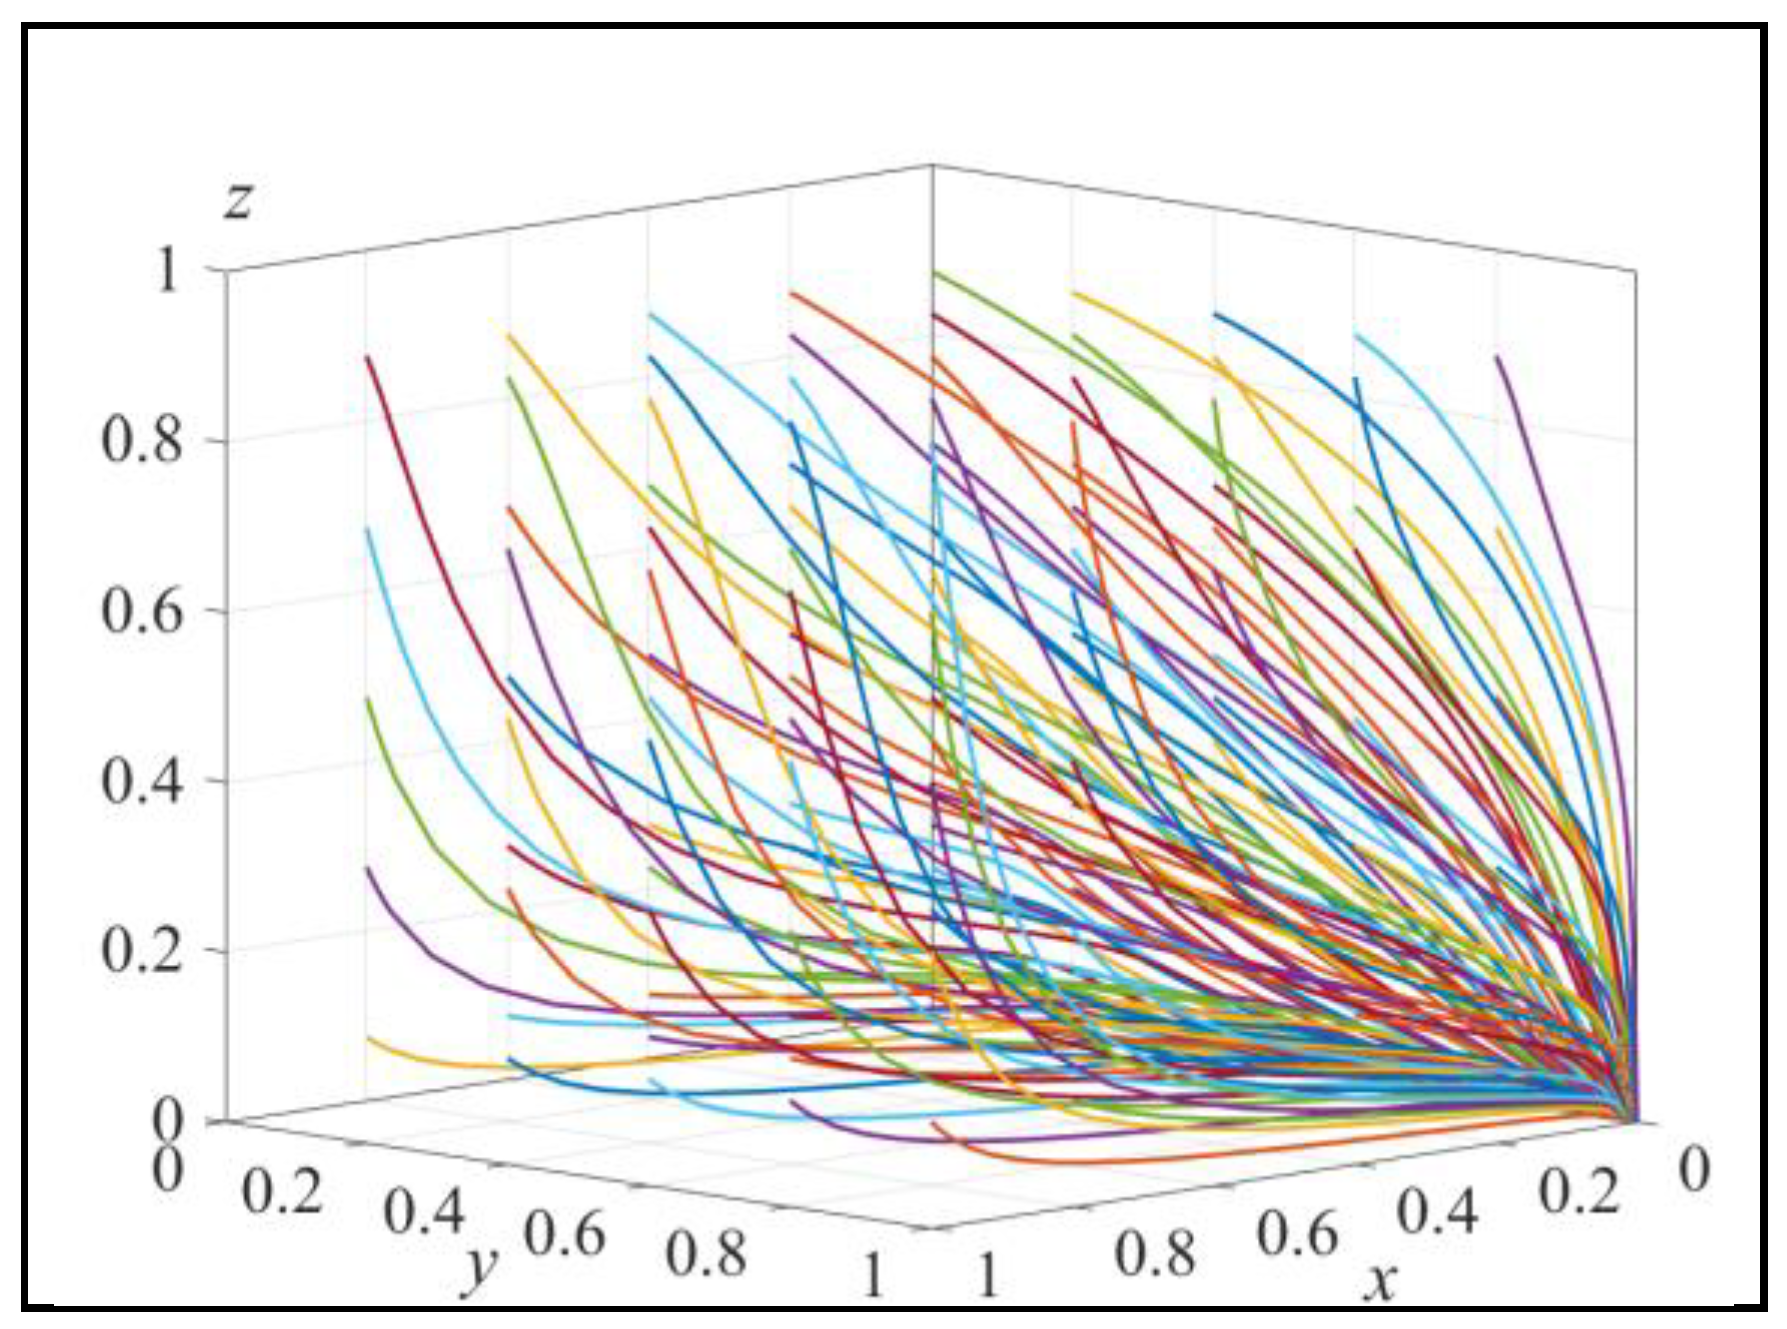
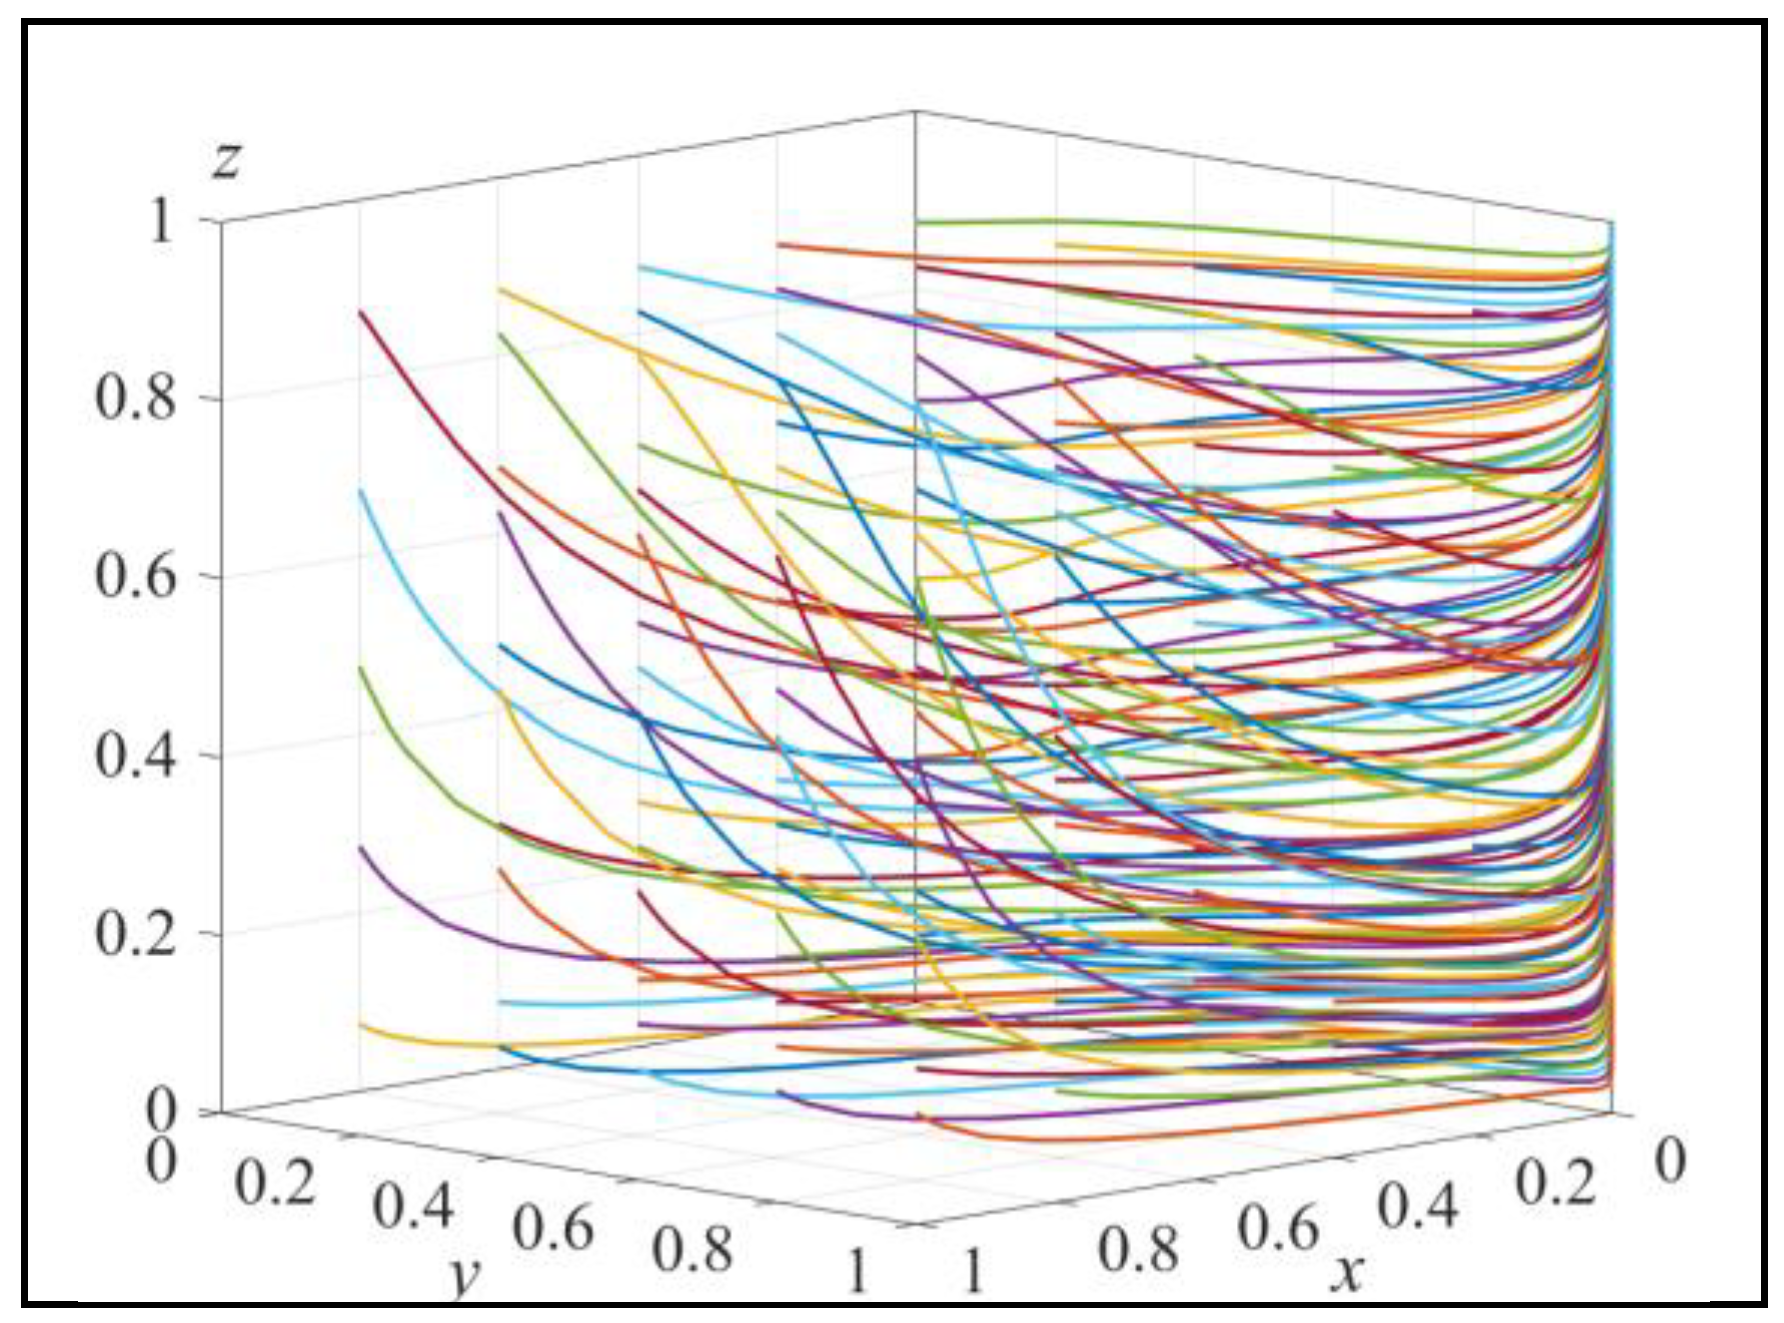
n=200. Simulate the evolution of the system starting from different initial strategy combinations for 50 iterations. The results are shown in
Figure 9-11.
Based on the given information, it appears that in the simulation results:
Figure 9 shows that when satisfying Condition ②, the system only exhibits one strategy combination (LCP, SI, LR). This aligns with the conclusion in Lemma 7, indicating that the system is in a mature stage where the government does not need to implement incentive measures.
Figure 10 indicates that when satisfying Condition ①, the system has a stable point with the strategy combination of (TP, SI, LR). This aligns with the conclusion in Lemma 8, suggesting that the system is in an early stage where the investment required for carbon emission reduction technology is high and consumers have weak awareness of recycling. The government incurs low costs for regulation and promotion, resulting in low levels of recycling volume.
Figure 11 illustrates that
E9 (
x1,1,
z1) and
E10 (
x1,0,
z1) are unstable equilibrium points. In this scenario, the system exhibits only one stable evolutionary strategy combination (TP, SI, SR). This suggests that the system is in an early stage where the investment required for carbon emission reduction technology is high. Remanufacturers do not choose the low-carbon product strategy, but the government promotes consumers’ recycling behavior by allocating a higher proportion of resources between recycling volume and investment. These observations align with the conclusions derived from the data analysis.
6. Conclusions
The role of Internet + recycling in the context of platform economy has been increasing in the field of waste recycling. Taking into account the behavior of remanufacturers in producing low-carbon products and the investment decisions of platforms in recycling services, as well as the regulatory actions of the government, this study constructed an evolutionary game model involving remanufacturer, platform, and the government. The stability of strategy choices and combinations among these participants and the relationships between different factors were analyzed. Finally, simulations were conducted to derive several conclusions.
The main findings are as follows: First, increasing government promotion of recycling and implementing carbon taxes on traditional products can encourage remanufacturers to produce low-carbon products and motivate platforms to invest in recycling services. Second, remanufacturers are incentivized to produce low-carbon products when they can enjoy higher sales revenues for such products. Third, when consumers are sensitive to the level of recycling services, platforms’ increased investment in recycling services can enhance waste recycling and prompt remanufacturers to choose low-carbon production. Forth, when the cost of improving carbon emission reduction levels for remanufacturers and the cost of enhancing recycling services for platforms are too high, the inherent subsidies provided by the government may not be effective. In such cases, external forces are needed to lower the costs associated with carbon emission reduction and service enhancement. This could be achieved through support from the national level, encouraging relevant industries and research institutions to accelerate the development of related technologies, thus advancing them to a more mature stage more quickly.
In summary, these findings demonstrate the increasing significance of Internet + recycling in waste management within the platform economy. They also shed light on the strategic choices and dynamics among remanufacturers, platforms, and the government, providing insights for policymakers and stakeholders involved in promoting sustainable practices and low-carbon production.
