
Submitted:
16 November 2023
Posted:
17 November 2023
You are already at the latest version
Abstract
We report a detailed investigation of vibrational modes, structure, and dynamics of glutathione (GSH) solutions using ultrasonic relaxation spectroscopy, FT-IR vibrational spectroscopy and electronic absorption measurements. The experimental data were analyzed in view of density functional theory (DFT) and molecular docking calculations. Three distinct Debye-type relaxation processes are resolved in the acoustic spectra, which are assigned to conformational changes between GSH conformers, self-association of GSH, and protonation processes. The standard volume changes for each process were estimated both experimentally and theoretically revealing a close resemblance among them. The higher the effect of the relaxation process in the structure, the greater the induced volume changes. From the temperature dependence of specific acoustic parameters, the thermodynamic characteristics of each process were determined. The experimental FT-IR spectra were compared with the corresponding theoretically predicted vibrational spectra revealing that the GSH dimers and extended conformers dominate the structure of GSH solutions in the high concentration region. The absorption spectra in the ultraviolet region confirmed the gradual aggregation mechanism that takes place in the aqueous GSH solutions. The results of the present study were discussed and analyzed in the framework of the current phenomenological status of the field.
Keywords:
glutathione
; tripeptides
; ultrasonic relaxation spectroscopy
; molecular docking
; self-association
; proton-transfer
1. Introduction
Glutathione (GSH) is a well-known tripeptide with molecular formula C10H17N3O6S that consists of a glutamic acid attached through its side chain to the terminal N atom of cysteinylglycine and derivative of thiol and L-cysteine. It contains a rather unusual peptide linkage between the amine group belonging to cysteine and the carboxyl group belonging to the glutamate side chain [1]. Glutathione is present in most living cells from bacteria to mammals, and as antioxidant, helps protect cells from reactive oxygen species such as free radicals and peroxides [1,2]. It is used scientifically as a measure of cellular toxicity. The IUPAC name of GSH is (2S)-2-Amino-5-({(2R)-1-[(carboxymethyl)amino]-1-oxo-3-sulfanylpropan-2-yl}amino)-5-oxopentanoic acid. The γ-bond between the glutamic acid and cysteine amino acids, provides peculiar characteristics, including the property of GSH to be insusceptible to proteolysis. Additionally, the presence of the thiol-containing cysteine residue awards GSH with redox catalytic properties [3].
Minimization of GSH amount in the human body has been accepted as a common strategy in the therapy of aggressive and metastatic cancers by enhancing the sensitivity of cancer cells to chemotherapy with toxic drugs and to application of radiations [4,5,6]. On the other hand, several other diseases including cardiovascular diseases [7], stroke [8], HIV/AIDS [9], diabetes [10], and brain disorders as Alzheimer’s [11], Parkinson’s [12] diseases and schizophrenia [13], are linked with the minimization of GSH and a parallel oxidative stress. Recently, it has been reported that the defensive glutathione antioxidant ability in a human body decreases linearly after the age of 45 causing several diseases that are associated with age [14]. Thus, it is of crucial importance to provide methodologies aiming to reinstate the glutathione amount in the body despite its low-partition coefficient and high-degradation rate via catalytic pathways including bacterial and epithelial GGT [15]. All these processes that are related with the GSH bioavailability are based on the physicochemical and structural properties of glutathione and in essence, the atomic arrangement at short- and intermediate-range length scales is the decisive factor for tuning the physicochemical properties of GSH.
In this paper, we report on the structural aspects of GSH aqueous solutions and their concentration and temperature dependence. Ultrasonic relaxation spectroscopy, Fourier-Transform infrared spectroscopy and electronic absorption measurements have been used for this purpose. Ultrasonic relaxation spectroscopy covers the 104 to 1010 Hz frequency region and can provide information for processes with relaxation times in wide time scale in the range 10−5 to 10−11 s corresponding to intermediate-range length scales [16,17,18]. One the other hand, vibrational spectroscopies may provide information about vibrational dynamics in short-range order with time scales between 10−12 to 10−14 s [19,20,21]. The combination of these spectroscopic tools with a so-wide time scale, has been proved a powerful and effective tool to describe the dynamics of a molecular system without any kind of restrictions concerning the type of the relaxation processes involved. Density functional theory (DFT) calculations and molecular docking methodologies were applied to evaluate theoretically the possibility of conformational changes, self-association, and protonation processes. The associated volume changes due to these processes were also estimated and compared with the experimental findings.
2. Materials and Methods
2.1. Solution preparation
Crystalline glutathione as white powder in the reduced form (Merck, purity > 99%) was used as received to prepare a series of aqueous solutions under ambient conditions and continuous stirring utilizing triply distilled water. The resulting solutions corresponding to molar concentrations 1, 2, 3, 4, 5, 7.5 and 10 mM, were clear and colorless. The final volume of each solution was 5 ml. Special attention has been paid to acquire all measurements from fresh solutions to ensure the absence of GSH degradation. Two more dense aqueous GSH solutions with 3.2 and 6.76 % w/v were prepared for the IR absorption measurements. Because of the relatively great amount of GSH in dense solutions, the solid occupies a considerable volume of the final solution. As a result, the use of Molarity units is incorrect since the final volume is different from the quantity of the added solvent. Therefore, it is more accurate the usage of the percent weight per volume concentration (% w/v).
Mass density and pH of each solution were measured using a temperature-controlled cell (DMA 40, Anton Paar) with accuracy of ±0.0001 g/cm3 and a pH-meter (Crison, micropH 2002) at 20°C. The resolution of the pH measurements is 0.01 and the accuracy was ±0.03 units.
2.2. Infrared and electronic absorption measurements
The infrared spectra of the two more dense solutions corresponding to 3.2 and 6.76 % w/v were measured in the mid-IR spectral region, namely in the 4000 to 370 cm-1 spectral region in transmittance mode under isobaric conditions by means of a compact FT/IR-4700 spectrometer (JASCO International Co. Ltd., Tokyo, Japan). The liquid sample was placed between two KBr pellets of ~1 mm thickness in sandwich mode. Dry potassium bromide powder of spectroscopic grade was used to prepare the pellets. The spectrometer was equipped with a stable 45° Michelson sealed interferometer with corner-cube mirror, auto-alignment, and DSP control. The spectral resolution of all measurements was fixed at 2 cm-1. The signal-to-noise ratio was estimated to be equal to 35,000:1. The light source was a standard high-intensity ceramic source. The signal was detected by a DLATGS detector with Peltier-type cooling. The spectrum of an “empty” KBr pellet was recorded as a background to account for atmospheric vapor compensation and KBr absorption [22].
The electronic absorption spectra of all solutions were recorded at 20 °C by means of the UV-1600 PC series double beam spectrophotometer (VWR International, Pennsylvania, USA) from 190 to 700 nm with a spectral resolution of 0.5 nm. The pathlength was fixed at 1 cm for all measurements. The quartz cell was thermostated with an accuracy of ± 0.01 °C. More details about the measurement procedures can be found in [23].
2.3. Acoustic absorption and velocity measurements
A set of wide-band piezoelectric elements was used to measure the sound absorption coefficient in parallel-path pulse mode as a function of concentration and temperature. The first transducer sends the acoustic wave to the sample, while the second one detects the transmitted signal after the sample. The distance between the two piezoelectric elements, namely the acoustic path, was fixed at 1 cm. The transmitting transducer was triggered by a sinusoidal burst of of specific frequency. A repetition rate of 5 ms was adequate to avoid coincidence between the next pulse and the echoes. All signals were monitored in the time-domain by means of a digital oscilloscope (Tektronix, TBS 1202B). The excess sound absorption coefficient αexcess(f) as a function of frequency, which is attributed to solute, is calculated by subtracting the absorption of the solvent from that of the solution. The so-called pulse-echo overlap technique was utilized for the speed of sound measurements. The sound absorption of the solvent (water) in the frequency range covered in this work was found constant and thus, non-relaxing. All acoustic absorption and sound speed measurements have been performed in the temperature range of 10-35 °C with a constant step of 5 °C. The temperature during measurements was controlled within ±0.01 °C. The accuracy of the experimental sound absorption and velocity are ±5 % and ±0.01 %, respectively. More details about the experimental setup and the measurement protocols can be found elsewhere [24,25,26].
2.4. Density Functional Theory (DFT) calculations
The structure and the vibrational spectroscopic properties of GSH molecule were estimated by employing density functional theory (DFT) methodology combined with 6-311G (d,p) basis set. All calculations were carried out in vacuum after applying tight optimization criteria without adjusting force constants utilizing Gaussian 09 suite of programs [27]. The calculated vibrational frequencies were corrected with the corresponding scaling factor.
2.5. Molecular docking calculations
Molecular docking calculations were carried out in AutoDock software (version 4.2). To elucidate the self-aggregation process, one molecule of glutathione was used as the receptor and a second one as the ligand. The structure of glutathione’s molecule was optimized using B3LYP/6-311G (d,p) basis set and the optimized structure was used in the molecular docking analysis. The receptor was placed in the center of the simulation box with dimensions 25Å × 25Å × 25Å, while the ligand was moving freely within its boundaries. The grid spacing was fixed at its default values that is 0.375Å, which is adequate considering the size of glutathione’s molecule [28]. The number of rotating bonds for the ligand was set at maximum. Charges were assigned by means of Gasteiger charges that model the electrostatic potential of the molecule through summation over the atomic electron densities in the molecule. Best poses were selected after evaluation by the Lamarckian genetic algorithm (LGA) [29]. Following the above procedure, we received the structure of the glutathione self-aggregate. The structure of the so obtained dimer was subsequently subjected to optimization with the same basis set before proceeding to the calculation of the theoretical IR spectra and additional physicochemical properties including molecular volume.
2.6. Conformational Search and Clustering procedures
The possible conformers of glutathione were found by applying the OPLS force field considering water as solvent and the Mixed torsional/Low-mode sampling method. For each rotatable bond 100 steps were permitted, while the energy difference between conformers was set as usual at 5.02 kcal/mol [30]. The probability of a torsion rotation to molecule translation was set at 0.5. Elimination of similar conformers was performed based on atom distance deviation. Conformers with distance between their atoms smaller than 0.5Å were considered as similar and thus eliminated. Minimization of the conformers’ energy was achieved by the Conjugate Gradient (CG) methodology with maximum iterations of 2500 and 0.05 convergence threshold. The total number of conformers generated by this protocol was estimated equal to 134. All calculations were performed in GROMACS molecular dynamics package [31].
Conformers clustering was based on the calculation of the root-mean-square deviation of atomic positions (RMSD) Matrix, which is the measure of the average distance between the atoms that are usually the backbone atoms, using the atomic coordinates for each conformer. As a linkage method, the centroid based clustering was implemented. The criterion to select an optimal number of clusters is the Kelley index, which levels the clusters’ spread at a particular level with the number of clusters at this level. According to Kelley index, 13 clusters were found. In a dendrogram at the left side was the closed and on the right side was the open conformer of glutathione [32].
3. Results and discussion
3.1. Relaxation processes occurring in GSH aqueous solutions
The characteristic molecular structure is the reason for the participation of GSH in a variety of structural and dynamical processes including (i) conformational changes due to its inherent flexibility, (ii) molecular self-aggregation reaction upon dilution of GSH in aqueous solutions in the low-concentration region and (iii) protonation and deprotonation reactions due to the presence of the two carboxylic acids, the amine, and the thiol groups. The overall structure of the GSH molecule includes eight coordination sites, that is two carboxyl-, one amino-, two carbonyl-, two amide-and one thiol-functional groups.
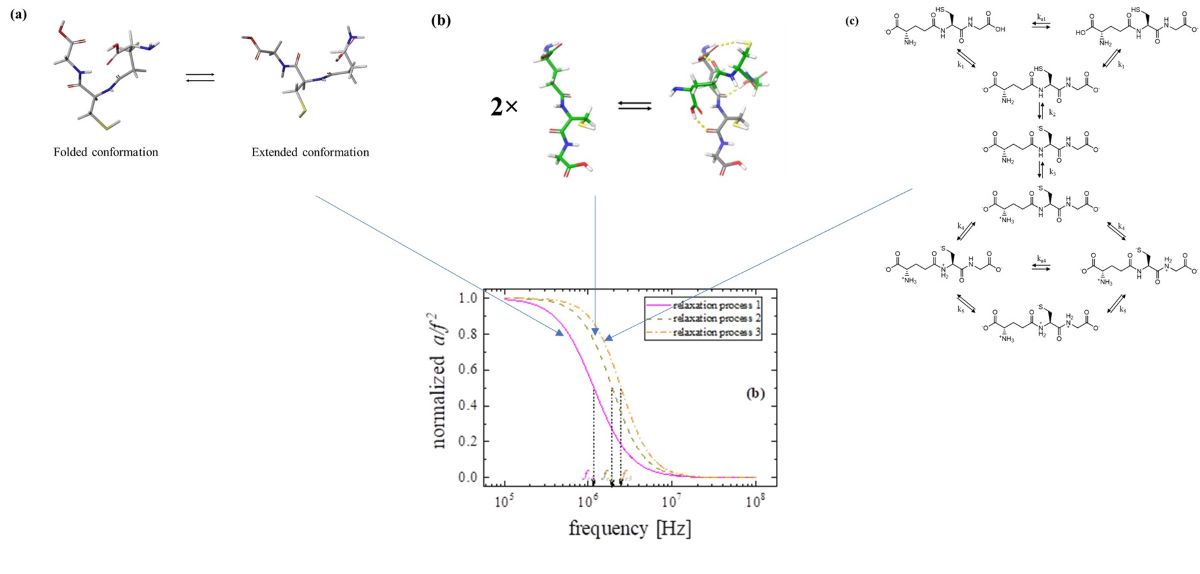
The theoretical investigation of the possible conformations of glutathione performed in this work revealed that GSH may exist in an extended and in a folded form with the extended conformer to be the more energetically favored. Both folded and extended conformations of GSH are presented in Figure 1(a) and were experimentally evidenced [33]. Furthermore, it was found that the dominating conformation at neutral environment is the one with the maximum distance between the thiol group and the amine and carboxylate of the Glutamic acid (Glu) residue. Each of the two peptide bonds that are near the Cysteine (Cys) residue is in trans-configuration relative to the thiol-functional group [34,35]. In general, the equilibrium reaction between the folded and extended GSH conformers can be written as:
where (GSH)* indicates one possible GSH conformer.
When GSH is subjected to intracellularly or chemically oxidative stress, it is transformed to oxidized glutathione dimer (GSSG) through a disulfide S-S bond. The GSSG is converted back into GSH only when the enzyme glutathione reductase is used. The GSH-to-GSSG oxidation is of crucial importance for almost all key intercellular-reactions that involve GSH. In aqueous environment, this reaction occurs only when an oxidizing agent is engaged. Despite that GSH is stable in the solid state for at least 5 years when stored at 4°C, it appears very unstable in aqueous solutions [36]. When aqueous solutions are exposed to air, the reduced glutathione converts to its disulfide dimer forming the oxidized glutathione (GSSG).
Our theoretical molecular docking study indicated that a glutathione dimer is formed constituted by hydrogen bonds, while the sulfur atoms of the two GSH monomeric units are far away the one from the other. As input in molecular docking calculation, we used an optimized structure of glutathione molecule, which is presented in the left side of Figure 1(b). The output of the calculation is the GSH dimer shown in the right side of Figure 1(b), respectively. The two monomers interact each other forming four new bonds. Indeed, in Figure 1(b), two new hydrogen bonds are formed between the hydroxyl of the glutamic acid of the one monomer with the oxygen atom of the glutamic acid and with the hydrogen atom of the sulfur group of cysteine of the other monomer. A third hydrogen bond is formed between the oxygen of the cysteine of the one monomer and the hydroxyl group of the glutamic acid of the other monomeric unit. Finally, the fourth hydrogen bond is formed between the hydroxyl group of glycine of the one monomer with the oxygen of glutamic acid of the other monomer.
The self-aggregation reaction leading to the formation a GSH dimer is expected to occur in the low-concentration region and can be written as:
GSH and (GSH)n denote the monomeric and aggregate units, respectively with the aggregation number is equal to n=2. Trimers and tetramers with n=3 and 4, respectively, may also be formed, however these higher aggregates are hardly to be present in the highly dilute solutions explored in this study. The binding free energy for the dimerization reaction was evaluated theoretically equal to -3.44 kcal/mol. The self-assembling of glutathione in aqueous environment was recently studied by ultrasonically induced birefringence method [37].
For high GSH concentrations, solvent (water) and GSH molecules interact forming mixed water-GSH aggregates. This association reaction can be written:
with (H2O)m and GSH∙(H2O)m representing the water clathrates and the mixed water-GSH aggregate that both are formed by hydrogen-bonding.
The molecular structure of the reduced glutathione, which is characterized by various biological donor atoms and its inherent flexibility, allows the presence of several possible tautomers of glutathione in aqueous environment. The relative population of these tautomers is strongly affected by the pH of the solution. The structure of the reduced glutathione with its eight coordination sites are shown in Figure 1(c). Protonation and deprotonation of the two carboxylic acids, the amine, and the thiol groups take place upon dissolution of GSH in water. The corresponding dissociation steps and the relevant dissociation constants ka,i with i=1, 2, 3 and 4.
3.2. Concentration effect on the relaxation behavior
The absorption a of high-frequency sound waves in solutions has two main contributions, namely the non-relaxing and the relaxing contributions. Viscous and thermal losses of the sound energy are the non-relaxing contributions and thus independent on the ultrasound frequency f. These losses account for a smaller portion of the ultrasonic absorption. The dynamic chemical equilibria present in neat liquids and solutions contribute to a much greater degree to the sound absorption at the corresponding relaxation frequencies or resonant frequencies fr that characterize the inherent chemical equilibria of the system. In Figure 2 are illustrated the excess ultrasonic absorption a/f2 curves as a function of frequency for all concentrations studied at 20 °C. The absorption coefficient of the solvent (water) is measured near ~20×10-17 s2/cm and frequency independent. The contribution of the solvent is subtracted from the measured absorption coefficient of the solutions. If the system contains more than one sound absorbing chemical equilibria, the frequency reduced sound absorption a/f2 data can be fitted in the frequency domain by the well-known Debye-type equation:
where k = 1,2,… denotes the maximum number of the relaxation processes that the system exhibits, Ai is the relaxation amplitude of the i-th relaxation process and B is the non-relaxing background sound absorption ratio in the high-frequency limit . Each relaxation process modelled by equation (4) is shown as a sigmoidal excess over the non-relaxing background sound absorption in the semi-log a/f2 vs f plot. The characteristic relaxation frequency fr is the frequency that corresponds to the sagmatic point of the sigmoidal function in this representation. Additional relaxation frequencies are observed as extra sagmatic points in the sigmoidal function with distinct values.
In the case of glutathione aqueous solutions, three distinct relaxation processes were detected in the MHz frequency range studied in this work. The three individual processes are quantitatively estimated by the Levenberg–Marquardt’s fitting method and representative results are presented in Figure 3 (a) for a solution corresponding to 1 mM concentration. To stress out the presence of distinct relaxation frequencies, we normalized the y-axis values from zero to one and the resulting spectra are shown in Figure 3 (b). The presence of three relaxation processes is clearly evidenced.
Figure 4 (a) and (b) illustrate the concentration dependence of the characteristic frequency and amplitude of the relaxation processes, respectively that detected in the acoustic spectra. The and free fitting parameters received from the non-linear least-mean square fitting procedure are summarized in Table 1.
Starting from the lower frequency mechanism, it seems that the relaxation frequency fr1 appears almost constant with solution concentration, while the corresponding amplitude increases monotonically. This behavior is typical of a unimolecular reaction, such as the reported conformational change between the folded and extended GSH conformers and formulated in equation 1. Raman and NMR spectroscopic studies evidenced in the past these conformational changes [33,34,35]. In general, the relaxation processes observed in a molecular system such as the glutathione aqueous solutions, can be categorized into thermal and structural processes. Thermal relaxation mechanisms are usually observed in systems where the fluctuations of the ultrasonic wave perturb a chemical intra-molecular equilibrium, such as this one detected here between the folded and extended GSH conformers, which involves intra-molecular rotational rearrangements through translational and vibrational coupling. The second relaxation process detected in the acoustic spectra is characterized by an increase of the relaxation amplitude and a red shift of the characteristic frequency. This process is attributed to the aggregation reaction of glutathione that is experimentally evidenced recently by ultrasonically induced birefringence technique [37]. The increase of the relaxation amplitude indicates that the aggregation mechanism is enhanced with increasing solution concentration. The third process identified in the acoustic spectra appears in higher frequencies and is attributed to the proton transfer reactions between possible tautomers of the reduced GSH in aqueous solutions in various pH. Tautomers differ from each other by a dissociation step with a distinct dissociation constant as presented in Figure 1 (c). At more acidic environment with low values of pH, tautomers on the left of Figure 1 (c) are favored. The amplitude of this relaxation mechanism remains almost constant with solution concentration revealing that this process is relatively insensitive to concentration, while the opposite holds for the acidity of the solutions. In our case and at 20°C, pH varies between 3.37 at 1 mM to 2.74 at 10 mM. This variation is minor, and it does not seem to strongly affect the amplitude of the relaxation assigned to protonation and deprotonation reactions. The second and the third relaxation processes are classified into structural processes, since they involve intermolecular rearrangements that are frequently associated with large volume changes between different equilibrium states. In general, structural processes are linked with shear (structural) viscosity and have been observed to prevail in strongly associated liquids consisting of polar molecules interacting through hydrogen bonding [38,39].
The standard volume change for the conformational change, the association-dissociation reaction, and the protonation and deprotonation reactions can be directly evaluated from the experimental maximum excess absorption per wavelength , the solution density ρ, the sound velocity u, the absolute temperature T, the gas constant R and the concentration term Γ from the following equation [40,41]:
The maximum value of the absorption per wavelength is a function of the relaxation frequency fr, the relaxation amplitude A and the sound velocity u, namely:
The reciprocal of the concentration term can be estimated as [42]:
With j are represented the number of the species involved in the chemical reaction, while cj and Δνj are the molar concentrations corresponding at equilibrium and the difference of the reactants and products stoichiometric coefficients, respectively.
Considering the conformational changes represented in equation (1) as a first-order reaction, then the equilibrium kinetics is described by a relaxation time, which is given by [43,44,45]:
Subscript 1 denotes the relaxation process 1, which is assigned to the equilibrium reaction between the folded and extended GSH conformers. and represent the probabilities of the forward and backward transition, respectively and . Furthermore, the equilibrium constant is:
The corresponding concentration term for this case will be:
Concentrations and are the concentrations at the equilibrium state. The equilibrium constant was estimated equal to .
For the association-dissociation reaction presented by equation (2), considering the mechanism in one mean stage, the kinetics can be described as [46,47]:
This equation expresses the relation between the relaxation time and the reactant concentration [GSH] at the equilibrium state. and are the forward and backward rate constants, respectively. The interaction between the GSH and water molecules are expected at frequencies well above 70 MHz and thus the second relaxation process detected is attributed to association-dissociation reaction described by equation (2). To determine the aggregation number, we tested different values on n. The value n=2 was found to provide the least error of plots of as a function of . Higher values than 2 resulted in continuously increasing errors, which means that the most favorable aggregation number is n=2 and GSH dimers reveal as the most thermodynamically favorable. Afterwards, the forward and backward rate constants values were estimated equal to and , respectively. The corresponding concentration term for this case will be given by:
Concerning the charge-transfer reaction, the possible tautomers of the reduced GSH in aqueous solutions at various pH that are presented in Figure 1 (c) can be described as:
Tautomers Gi with i=1, 2, 3, 4 and 5 are presented in Figure 1 (c) starting from left to right and differ from each other by a dissociation step with a distinct dissociation constant. Tautomers on the left are favored in solutions with low pH. The corresponding concentration term for this case will be:
Since our experiments were performed at 20°C and pH varied between 3.37-2.74 for 1-10 mM, then the last two terms in equation (14) can be eliminated and we have:
From equations (10), (12) and (15) we were able to calculate the corresponding concentration term for each relaxation mechanism and subsequently we evaluated the standard volume changes for each process as a function of GSH concentration at 20°C. The results are presented in Figure 5. Solid, dotted and dash-dotted lines correspond to the theoretically estimated isentropic standard volume changes corresponding to each relaxation process that have been calculated by means of the B3LYP/6-311G (d,p) basis set. The theoretical volume changes were found close to the experimentally determined volume changes, even though the calculation was performed in a vacuum environment free of potential intermolecular interactions. The volume changes due to dimerization of GSH (structural relaxation) are affected by concentration to a greater extent compared with the volume changes due to the conformational variations between rotational isomers (thermal relaxation). Structural relaxation is expected to have a much stronger impact on the structure than thermal relaxation and the higher the structural effect, the greater the volume change will be.
3.3. Temperature effect on the relaxation behavior
The frequency dependence of the excess ultrasonic absorption a/f2 is presented in Figure 6 for a 5 mM solution and for all temperatures studied. The continuous lines represent the Debye-type relaxation curves modelled by equation (4). The observed reduction in the ultrasonic absorption ratio a/f2 of glutathione with increasing ultrasonic frequency in the 10 to 35°C temperature range is characteristic of relaxational behavior.
The and free fitting parameters received from the non-linear least-mean square fitting procedure for each temperature are illustrated in Figure 7 (a) and (b), respectively and summarized in Table 2. The relaxation frequencies for all processes increase linearly with temperature, although with different slopes. On the other hand, relaxation amplitudes A1 and A2 exhibit a slight increase, while amplitude A3 decreases with temperature.
From the temperature dependence of the characteristic frequency of the relaxation process, the activation enthalpy, entropy, and free energy can be estimated in the context of the Eyring's rate theory [43,44,45]:
is the activation free energy of the i-th process, while kB and h denote the Boltzmann and Planck constants, respectively. The variation of as a function of reciprocal temperature is presented in Figure 8 for all relaxation processes. The results reveal a clear linear dependency with a negative slope as expected. The activation enthalpy for each relaxation mechanism is estimated directly from the slope of this graph following the equation:
and the activation entropy of the i-th process is estimated from the intercept of each line.
For the conformational change (relaxation process 1) the activation enthalpy, entropy and free energy were found equal to , and , respectively. For the aggregation reaction (relaxation process 2) the activation enthalpy, entropy and free energy were found equal to , and , respectively. Finally, for the protonation-deprotonation (relaxation process 3) the activation enthalpy, entropy and free energy were found equal to , and , respectively. The linear dependency that is observed in Figure 8 supports our assumption that the entropy and the entropy change for each process are almost constant in the temperature range studied here. Another interesting finding is that the entropy change contribution to the free energy change is small for all relaxation mechanisms.
From the maximum value of the absorption per wavelength , the absolute temperature and the sound velocity, we may evaluate the enthalpy difference for a relaxation process through the equation [42,43,44,45]:
In the above equation, parameters V, Θ and J are the molar volume, the thermal expansion coefficient and the unit conversion factor (J=4.187 J/cal). The rest of the symbols are CP and ρ that denote the specific heat per unit mass at constant pressure and the solution mass density, respectively. From equation (18) we obtain:
The variation of with reciprocal temperature for the relaxation processes attributed to conformational changes (process 1) is presented in Figure 9. Also in this case, the observed linear dependency is in line with our assumption that the enthalpy and the entropy difference for the specific relaxation process is constant and temperature independent, at least in the temperature range studied. The derivation of the equation (18) has been reported in [24]. This equation is valid only when the equilibrium constant is well below unity and the volume change ΔV associated with the relaxation mechanism is negligible compared to the corresponding enthalpy change ΔH0. These assumptions are valid only for the relaxation related with the conformational changes. From the slop of the versus plot (Figure 9) we can estimate the enthalpy difference between the extended conformer and the folded conformer, which was estimated equal to ΔH0= 3.23±0.28 kcal/mol.
3.4. Probing molecular structure and conformation by vibrational and electronic properties
To further elucidate the mechanisms that affect the structure of GSH upon dilution in molecular level, we recorded the IR vibrational spectra of representative relatively dense solutions corresponding to concentrations of 3.2 and 6.76 % w/v. These spectra are presented in Figure 10. In the same figure, are also shown the theoretically predicted IR spectra corresponding to the GSH monomer, dimer, extended conformer, and folded conformer in the vapor phase. The main bands observed in the IR spectra of GSH aqueous solutions and their assignments are summarized in Table 3. Starting from the high frequencies, the broad spectral envelope located at 3250–3628 cm-1 is attributed to –OH, NH, and NH2 functional groups. The bands near ~3020 and ~2523 cm-1 are assigned to C–H stretching modes and –SH functional group. Finally, the bands near ~1712 and ~1598 cm-1 are attributed to –C=O of acid and amide groups, respectively. We will focus our attention on the 1700-1500 cm-1 spectral region. The GSH dimer and the extended conformer are expected to dominate the structure of the GSH solutions in this relatively denser concentration region. Due to the inherent flexibility of GSH, when dissolved in water it does not remain in a regular state causing variations in the conformations and in the hydrogen-bonding network. On the other hand, due to the small size of the water molecules and their ability to provide and accept protons, these molecules are forming bridging hydrogen bonds with GSH and break down the folded conformers. The conformational flexible GSH can convert between the extended to the folded conformation, nevertheless it mostly stays in the extended conformation in aqueous environment. Indeed, the comparison reveals that the four bands in the region 1685-1620 cm-1 and the band at ~1508 cm-1 of the theoretically predicted IR spectrum of the GSH dimer almost coincide with the ~1650 cm-1 band and the shoulder band at 1520 cm-1 of the experimental spectra, respectively. Furthermore, the bands observed in the theoretically predicted spectrum of the extended conformer between 1684-1645 cm-1 also coincide with the experimental bands of the GSH solutions in the same spectral range. The resemblance between theoretical findings and the experimental IR spectra is adequate even though the calculation was performed in vacuum without the presence of any intermolecular interactions. Definitely, the FT-IR spectroscopy is proved sensitive to changes in the chemical structure of molecules and to molecular conformation.
The ultraviolet absorption spectrum of glutathione in water is presented in Figure 11 (a). We observe an absorption band near ~203 nm in the spectra of glutathione, which is assigned to the electronic transition from HOMO to LUMO, LUMO+1, and LUMO+2 states. Two additional bands are also detected near ~232 and ~225 nm depending on the solution concentration that are related to various electronic transitions of glutathione molecule instead of dissociation of peptide bonds [48]. In Figure 11 (b) and (c) are illustrated the absorbance and the wavelength corresponding to the maximum of the broad band as a function of concentration. Both spectral parameters seem to follow a monotonous increasing trend. It is interesting to note that above concentration of 4 mM, the variation of the Amax follows a linear dependency with Pearson’s r=0.99835. A sudden change near 4 mM is also observed in the concentration dependency of the structural (shear) viscosity, density, specific conductivity, sound velocity, isentropic compressibility, and pH. This behavior is associated with the gradual aggregation mechanism that takes place in the aqueous GSH solutions [37].
4. Conclusions
Ultrasonic relaxation and FT-IR spectroscopies combined with electronic absorption measurements have been used to describe the dynamics of the GSH solutions and elucidate the relaxation processes involved. DFT and molecular docking calculation were performed to theoretically examine the presence of possible conformational changes, self-association, and protonation processes. Three distinct Debye-type relaxation processes are resolved in the acoustic spectra. The process observed in the lower frequency is assigned to conformational change between the folded and extended GSH conformers. The second relaxation process detected in the acoustic spectra is attributed to the aggregation reaction of glutathione, while the third process identified in the spectra appears in the higher frequency is related with the proton transfer reactions between possible tautomers of the reduced GSH in aqueous solutions depending on the acidity of the solution. The standard volume changes for each process were evaluated experimentally and found close to the theoretically predicted values. The volume changes due to structural relaxation (dimerization of GSH) are higher relative to the volume changes due to thermal relaxation (conformational variations between rotational isomers). Higher structural alterations induce greater volume changes. For the conformational change, the activation enthalpy, entropy and free energy were found equal to , and . For the aggregation reaction, the activation enthalpy, entropy and free energy were found equal to , and . For the protonation-deprotonation, the activation enthalpy, entropy and free energy were found equal to , and . The enthalpy difference could be accurately estimated only for the conformational changes, and it was found equal to ΔH0= 3.23±0.28 kcal/mol. The experimental FT-IR spectra corresponding to dense solutions are dominated by the presence of vibrational bands characteristic of GSH dimer and extended conformer. The ultraviolet absorption spectra of glutathione in water revealed the gradual aggregation mechanism that takes place in the aqueous GSH solutions.
Author Contributions
Conceptualization, A.G.K.; methodology, A.G.K.; quantum mechanical calculations, A.T. and P.S.; molecular docking calculations, C.K.; validation, A.G.K.; investigation, A.T., P.S, C.K. and A.G.K.; writing—original draft preparation, A.G.K; writing—review and editing, A.G.K.; review and editing, A.T., P.S. and C.K.; supervision, A.G.K. All authors have read and agreed to the published version of the manuscript.
Funding
This research received no external funding.
Data Availability Statement
Data will be made available on request.
Acknowledgments
This work was carried out in fulfilment of the requirements for the Ph.D thesis of A. Tryfon according to the curriculum of the Department of Chemistry, University of Ioannina, under the supervision of A. G. Kalampounias.
Conflicts of Interest
The authors declare that they have no known competing financial interests or personal relationships that could have appeared to influence the work reported in this paper.
References
- Hunter, G.; Eagles, A. Glutathione: A critical study. J. Biol. Chem. 1927, 72, 147–166. [Google Scholar] [CrossRef]
- Hamilton, C.J.; Arbach, M.; Groom, M. Beyond Glutathione: Different Low Molecular Weight Thiols as Mediators of Redox Regulation and Other Metabolic Functions in Lower Organisms. In Recent Advances in Redox Active Plant and Microbial Products; Jacob, C., Kirsch, G., Slusarenko, A., Winyard, P., Burkholz, T., Eds.; Springer: Dordrecht, The Netherlands, 2014; Volume 11, pp. 291–320. [Google Scholar]
- Gaucher, C.; Boudier, A.; Bonetti, J.; Clarot, I.; Leroy, P.; Parent, M. Glutathione: Antioxidant Properties Dedicated to Nanotechnologies. Antioxidants 2018, 7, 62. [Google Scholar] [CrossRef] [PubMed]
- Estrela, J.; Obrador, E.; Navarro, J.; Delavega, M.; Pellicer, J. Elimination of Ehrlich tumours by ATP-induced growth inhibition, glutathione depletion and X-rays. Nat. Med. 1995, 1, 84–88. [Google Scholar] [CrossRef] [PubMed]
- Mena, S.; Benlloch, M.; Ortega, A.; Carretero, J.; Obrador, E.; Asensi, M.; Petschen, I.; Brown, B.D.; Estrela, J.M. Bcl-2 and glutathione depletion sensitizes B16 melanoma to combination therapy and eliminates metastatic disease. Clin. Cancer Res. 2007, 13, 2658–2666. [Google Scholar] [CrossRef]
- Rocha, C.R.R.; Garcia, C.C.M.; Vieira, D.B.; Quinet, A.; de Andrade-Lima, L.C.; Munford, V.; Belizário, J.E.; Menck, C.F.M. Glutathione depletion sensitizes cisplatin- and temozolomide-resistant glioma cells in vitro and in vivo. Cell Death Dis. 2014, 5, e1505. [Google Scholar] [CrossRef] [PubMed]
- Vargas, F.; Rodríguez-Gómez, I.; Pérez-Abud, R.; Vargas Tendero, P.; Baca, Y.; Wangensteen, R. Cardiovascular and renal manifestations of glutathione depletion induced by buthionine sulfoximine. Am. J. Hypertens. 2012, 25, 629–635. [Google Scholar] [CrossRef] [PubMed]
- Anderson, M.F.; Nilsson, M.; Eriksson, P.S.; Sims, N.R. Glutathione monoethyl ester provides neuroprotection in a rat model of stroke. Neurosci. Lett. 2004, 354, 163–165. [Google Scholar] [CrossRef] [PubMed]
- Herzenberg, L.A.; De Rosa, S.C.; Dubs, J.G.; Roederer, M.; Anderson, M.T.; Ela, S.W.; Deresinski, S.C.; Herzenberg, L.A. Glutathione deficiency is associated with impaired survival in HIV disease. Proc. Natl. Acad. Sci. USA 1997, 94, 1967–1972. [Google Scholar] [CrossRef] [PubMed]
- Lagman, M.; Ly, J.; Saing, T.; Kaur Singh, M.; Vera Tudela, E.; Morris, D.; Chi, P.-T.; Ochoa, C.; Sathananthan, A.; Venketaraman, V. Investigating the causes for decreased levels of glutathione in individuals with type II diabetes. PLoS ONE 2015, 10, e0118436. [Google Scholar] [CrossRef]
- Martin, H.L.; Teismann, P. Glutathione—a review on its role and significance in Parkinson's disease. FASEB J. 2009, 23, 3263–3272. [Google Scholar] [CrossRef]
- Pocernich, C.B.; Butterfield, D.A. Elevation of glutathione as a therapeutic strategy in Alzheimer disease. Biochim. Biophys. Acta 2009, 1822, 625–630. [Google Scholar] [CrossRef] [PubMed]
- Gu, F.; Chauhan, V.; Chauhan, A. Glutathione redox imbalance in brain disorders. Curr. Opin. Clin. Nutr. Metab. Care 2015, 18, 89–95. [Google Scholar] [CrossRef] [PubMed]
- Jones, D.P.; Mody, V.C.; Carlson, J.L.; Lynn, M.J.; Sternberg, P. Redox analysis of human plasma allows separation of pro-oxidant events of aging from decline in antioxidant defenses. Free Radic. Biol. Med. 2002, 33, 1290–1300. [Google Scholar] [CrossRef] [PubMed]
- Witschi, A.; Reddy, S.; Stofer, B.; Lauterburg, B. H. The systemic availability of oral glutathione. Eur. J. Clin. Pharmacol. 1992, 43, 667–669. [Google Scholar] [CrossRef] [PubMed]
- Siafarika, P.; Papanikolaou, M.G.; Kabanos, T.A.; Kalampounias, A.G. Probing the equilibrium between mono- and di-nuclear nickel(II)-diamidate {[NiII(DQPD)]x, x = 1,2} complexes in chloroform solutions by combining acoustic and vibrational spectroscopies and molecular orbital calculations. Chem. Phys. 2021, 549, 111279. [Google Scholar] [CrossRef]
- Tsigoias, S.; Kouderis, C.; Mylona-Kosmas, A.; Boghosian, S.; Kalampounias, A.G. Proton-transfer in 1,1,3,3 tetramethyl guanidine by means of ultrasonic relaxation and Raman spectroscopies and molecular orbital calculations. Spectrochim. Acta A Mol. Biomol. Spectrosc. 2020, 229, 117958. [Google Scholar] [CrossRef] [PubMed]
- Siafarika, P.; Kouderis, C.; Kalampounias, A.G. Non-Debye segmental relaxation of poly-N-vinyl-carbazole in dilute solution. Molec. Phys. 2021, 119, e1802075. [Google Scholar] [CrossRef]
- Kalampounias, A.G.; Kirillov, S.A.; Steffen, W.; Yannopoulos, S.N. Raman spectra and microscopic dynamics of bulk and confined salol. J. Molec. Struct. 2003, 651–653, 475–483. [Google Scholar] [CrossRef]
- Kalampounias, A.G. Dilution effect on the vibrational frequency and vibrational relaxation of PbCl2–KCl ionic liquids. J. Mol. Liq. 2015, 202, 68–74. [Google Scholar] [CrossRef]
- Kalampounias, A.G.; Tsilomelekis, G.; Boghosian, S. Unraveling the role of microenvironment and hydrodynamic forces on the vibrational relaxation rates of pyridine–water complexes. J. Mol. Liq. 2014, 198, 299–306. [Google Scholar] [CrossRef]
- Latsis, G.K.; Banti, C.N.; Kourkoumelis, N.; Papatriantafyllopoulou, C.; Panagiotou, N.; Tasiopoulos, A.; Douvalis, A.; Kalampounias, A.G.; Bakas, T.; Hadjikakou, S.K. Poly Organotin Acetates against DNA with Possible Implementation on Human Breast Cancer. Int. J. Mol. Sci. 2018, 19, 2055. [Google Scholar] [CrossRef] [PubMed]
- Kalampounias, A.G.; Papatheodorou, G.N. Ligand Field States and Vibrational Modes of Solid and Molten Elpasolite: Cs2NaHoCl6. Z. Naturforsch. 2007, 62a, 169–175. [Google Scholar] [CrossRef]
- Stogiannidis, G.; Tsigoias, S.; Kalampounias, A.G. Conformational energy barriers in methyl acetate – Ethanol solutions: A temperature-dependent ultrasonic relaxation study and molecular orbital calculations. J. Mol. Liq. 2020, 302, 112519. [Google Scholar] [CrossRef]
- Kalampounias, A.G. Exploring conformational change profile of n-propyl ester of formic acid by combining ultrasonic relaxation spectroscopy and molecular orbital calculations. J. Mol. Struct. 2020, 1212, 128146. [Google Scholar] [CrossRef]
- Kouderis, C.; Siafarika, P.; Kalampounias, A.G. Disentangling proton-transfer and segmental motion relaxations in poly-vinyl-alcohol aqueous solutions by means of ultrasonic relaxation spectroscopy. Polymer 2021, 217, 123479. [Google Scholar] [CrossRef]
- Frisch, M.J.; et al. Gaussian 09, Revision A.02; Gaussian, Inc: Wallingford CT, 2009. [Google Scholar]
- Kouderis, C.; Tsigoias, S.; Siafarika, P.; Kalampounias, A.G. The Effect of Alkali Iodide Salts in the Inclusion Process of Phenolphthalein in β-Cyclodextrin: A Spectroscopic and Theoretical Study. Molecules 2023, 28, 1147. [Google Scholar] [CrossRef] [PubMed]
- Morris, G.M.; Goodsell, D.S.; Halliday, R.S.; Huey, R.; Hart, W.E.; Belew, R.K. , Olson, A.J. Automated docking using a Lamarckian genetic algorithm and an empirical binding free energy function. J. Comput. Chem. 1998, 19, 1639–1662. [Google Scholar] [CrossRef]
- Gürsoy, O.; Smieško, M. Searching for bioactive conformations of drug-like ligands with current force fields: how good are we? J. Cheminform. 2017, 9, 29. [Google Scholar] [CrossRef]
- Van Der Spoel, D.; Lindahl, E.; Hess, B.; Groenhof, G.; Mark, A.E.; Berendsen, H.J.C. GROMACS: Fast, flexible, and free. J. Comput. Chem. 2005, 26, 1701–1718. [Google Scholar] [CrossRef]
- Shao, J.; Tanner, S.W.; Thompson, N.; Cheatham, T.E. Clustering Molecular Dynamics Trajectories: 1. Characterizing the Performance of Different Clustering Algorithms. J. Chem. Theory Comput. 2007, 3, 2312–2334. [Google Scholar] [CrossRef]
- Singh, G.; Dogra, S.D.; Kaur, S.; Tripathi, S.K.; Prakash, S.; Rai, B.; Saini, G.S.S. Structure and vibrations of glutathione studied by vibrational spectroscopy and density functional theory. Spectrochim. Acta. A. Mol. Biomol. Spectrosc. 2015, 149, 505–515. [Google Scholar] [CrossRef] [PubMed]
- Fujiwara, S.; Formicka-Koziowska, G.; Kozlowski, H. Conformational Study of Glutathione by NMR. Bull. Chem. Soc. Jap. 1977, 50, 3131–3135. [Google Scholar] [CrossRef]
- Lampela, O.; Juffer, A.H.; Rauk, A. Conformational Analysis of Glutathione in Aqueous Solution with Molecular Dynamics. J. Phys. Chem. A 2003, 107, 9208–9220. [Google Scholar] [CrossRef]
- Stevens, R.; Stevens, L.; Price, N.C. The stabilities of various thiol compounds used in protein purifications. Biochem. Educ. 1983, 11, 70–70. [Google Scholar] [CrossRef]
- Tryfon, A.; Siafarika, P.; Kouderis, C.; Kalampounias, A.G. Self-assembling of glutathione in aqueous environment: A combined experimental and theoretical study. J. Molec. Liq. 2023, 390, 122957. [Google Scholar] [CrossRef]
- Tsigoias, S.; Papanikolaou, M.G.; Kabanos, T.A.; Kalampounias, A.G. Structure and dynamics of aqueous norspermidine solutions: an in situ ultrasonic relaxation spectroscopic study. J. Phys.: Condens. Matter 2021, 33, 495104. [Google Scholar] [CrossRef]
- Risva, M.; Tsigoias, S.; Boghosian, S.; Kaziannis, S.; Kalampounias, A.G. Exploring the influence of urea on the proton-transfer reaction in aqueous amine solutions with Raman and ultrasonic relaxation spectroscopy. Mol. Phys. 2023, 121, e2163314. [Google Scholar] [CrossRef]
- Nishikawa, S.; Yasunaga, T.; Takahashi, K. Kinetic studies of fast reactions in aqueous solutions of amylamine by means of ultrasonic absorption. Bull. Chem. Soc. Jpn 1973, 46, 2992–2997. [Google Scholar] [CrossRef]
- Kouderis, C.; Siafarika, P.; Kalampounias, A.G. Molecular relaxation dynamics and self-association of dexamethasone sodium phosphate solutions. Chem. Pap. 2021, 75, 6115–6125. [Google Scholar] [CrossRef]
- Kaatze, U.; Hushcha, T.O.; Eggers, F. Ultrasonic broadband spectrometry of liquids a research tool in pure and applied chemistry and chemical physics. J. Solution Chem. 2000, 29, 299–368. [Google Scholar] [CrossRef]
- Herzfeld, K.F.; Litovitz, T.A. Absorption and Dispersion of Ultrasonic Waves, 1st ed.; Academic Press: New York, 1959. [Google Scholar]
- Ensminger, D.; Bond, L.J. Ultrasonics: Fundamentals, Technologies, and Applications, 3rd ed.; CRC Press: New York, 2011. [Google Scholar]
- Blandamer, M.J. Introduction to Chemical Ultrasonics; Academic Press: New York, 1973. [Google Scholar]
- Nishikawa, S.; Haraguchi, H.; Fukuyama, Y. Effect of ether oxygen on proton transfer and aggregation reactions of amines in water by ultrasonic absorption method. Bull. Chem. Soc. Jpn. 1991, 64, 1274–1282. [Google Scholar] [CrossRef]
- Nishikawa, S.; Kamimura, E. Dynamic characteristic of amitriptyline in water by ultrasonic relaxation method and molecular orbital calculation. J. Phys. Chem. A 2011, 115, 535–539. [Google Scholar] [CrossRef] [PubMed]
- Beaven, G.H.; Holiday, E.R. Ultraviolet Absorption Spectra of Proteins and Amino Acids. Adv Protein Chem. 1952, 7, 319–386. [Google Scholar] [PubMed]
Figure 1.
(a) The two conformation isomers (left: folded-isomer and right: extended-isomer) observed in GSH. The extended-isomer is confirmed as the most stable by DFT theoretical calculations. (b) Left: the optimized molecular structure of GSH monomer. Right: the formed dimer as estimated from the molecular docking study of self–aggregation. The two monomers that formed the dimer are designated with grey and green carbon atoms to facilitate the observation of the docking regions. The dimer is confirmed as the most stable by DFT calculations. (c) Possible tautomers of the reduced GSH in aqueous solutions in various pH. Tautomers differ from each other by a dissociation step with a distinct dissociation constant. Tautomers on the left are favored in solutions with low pH.
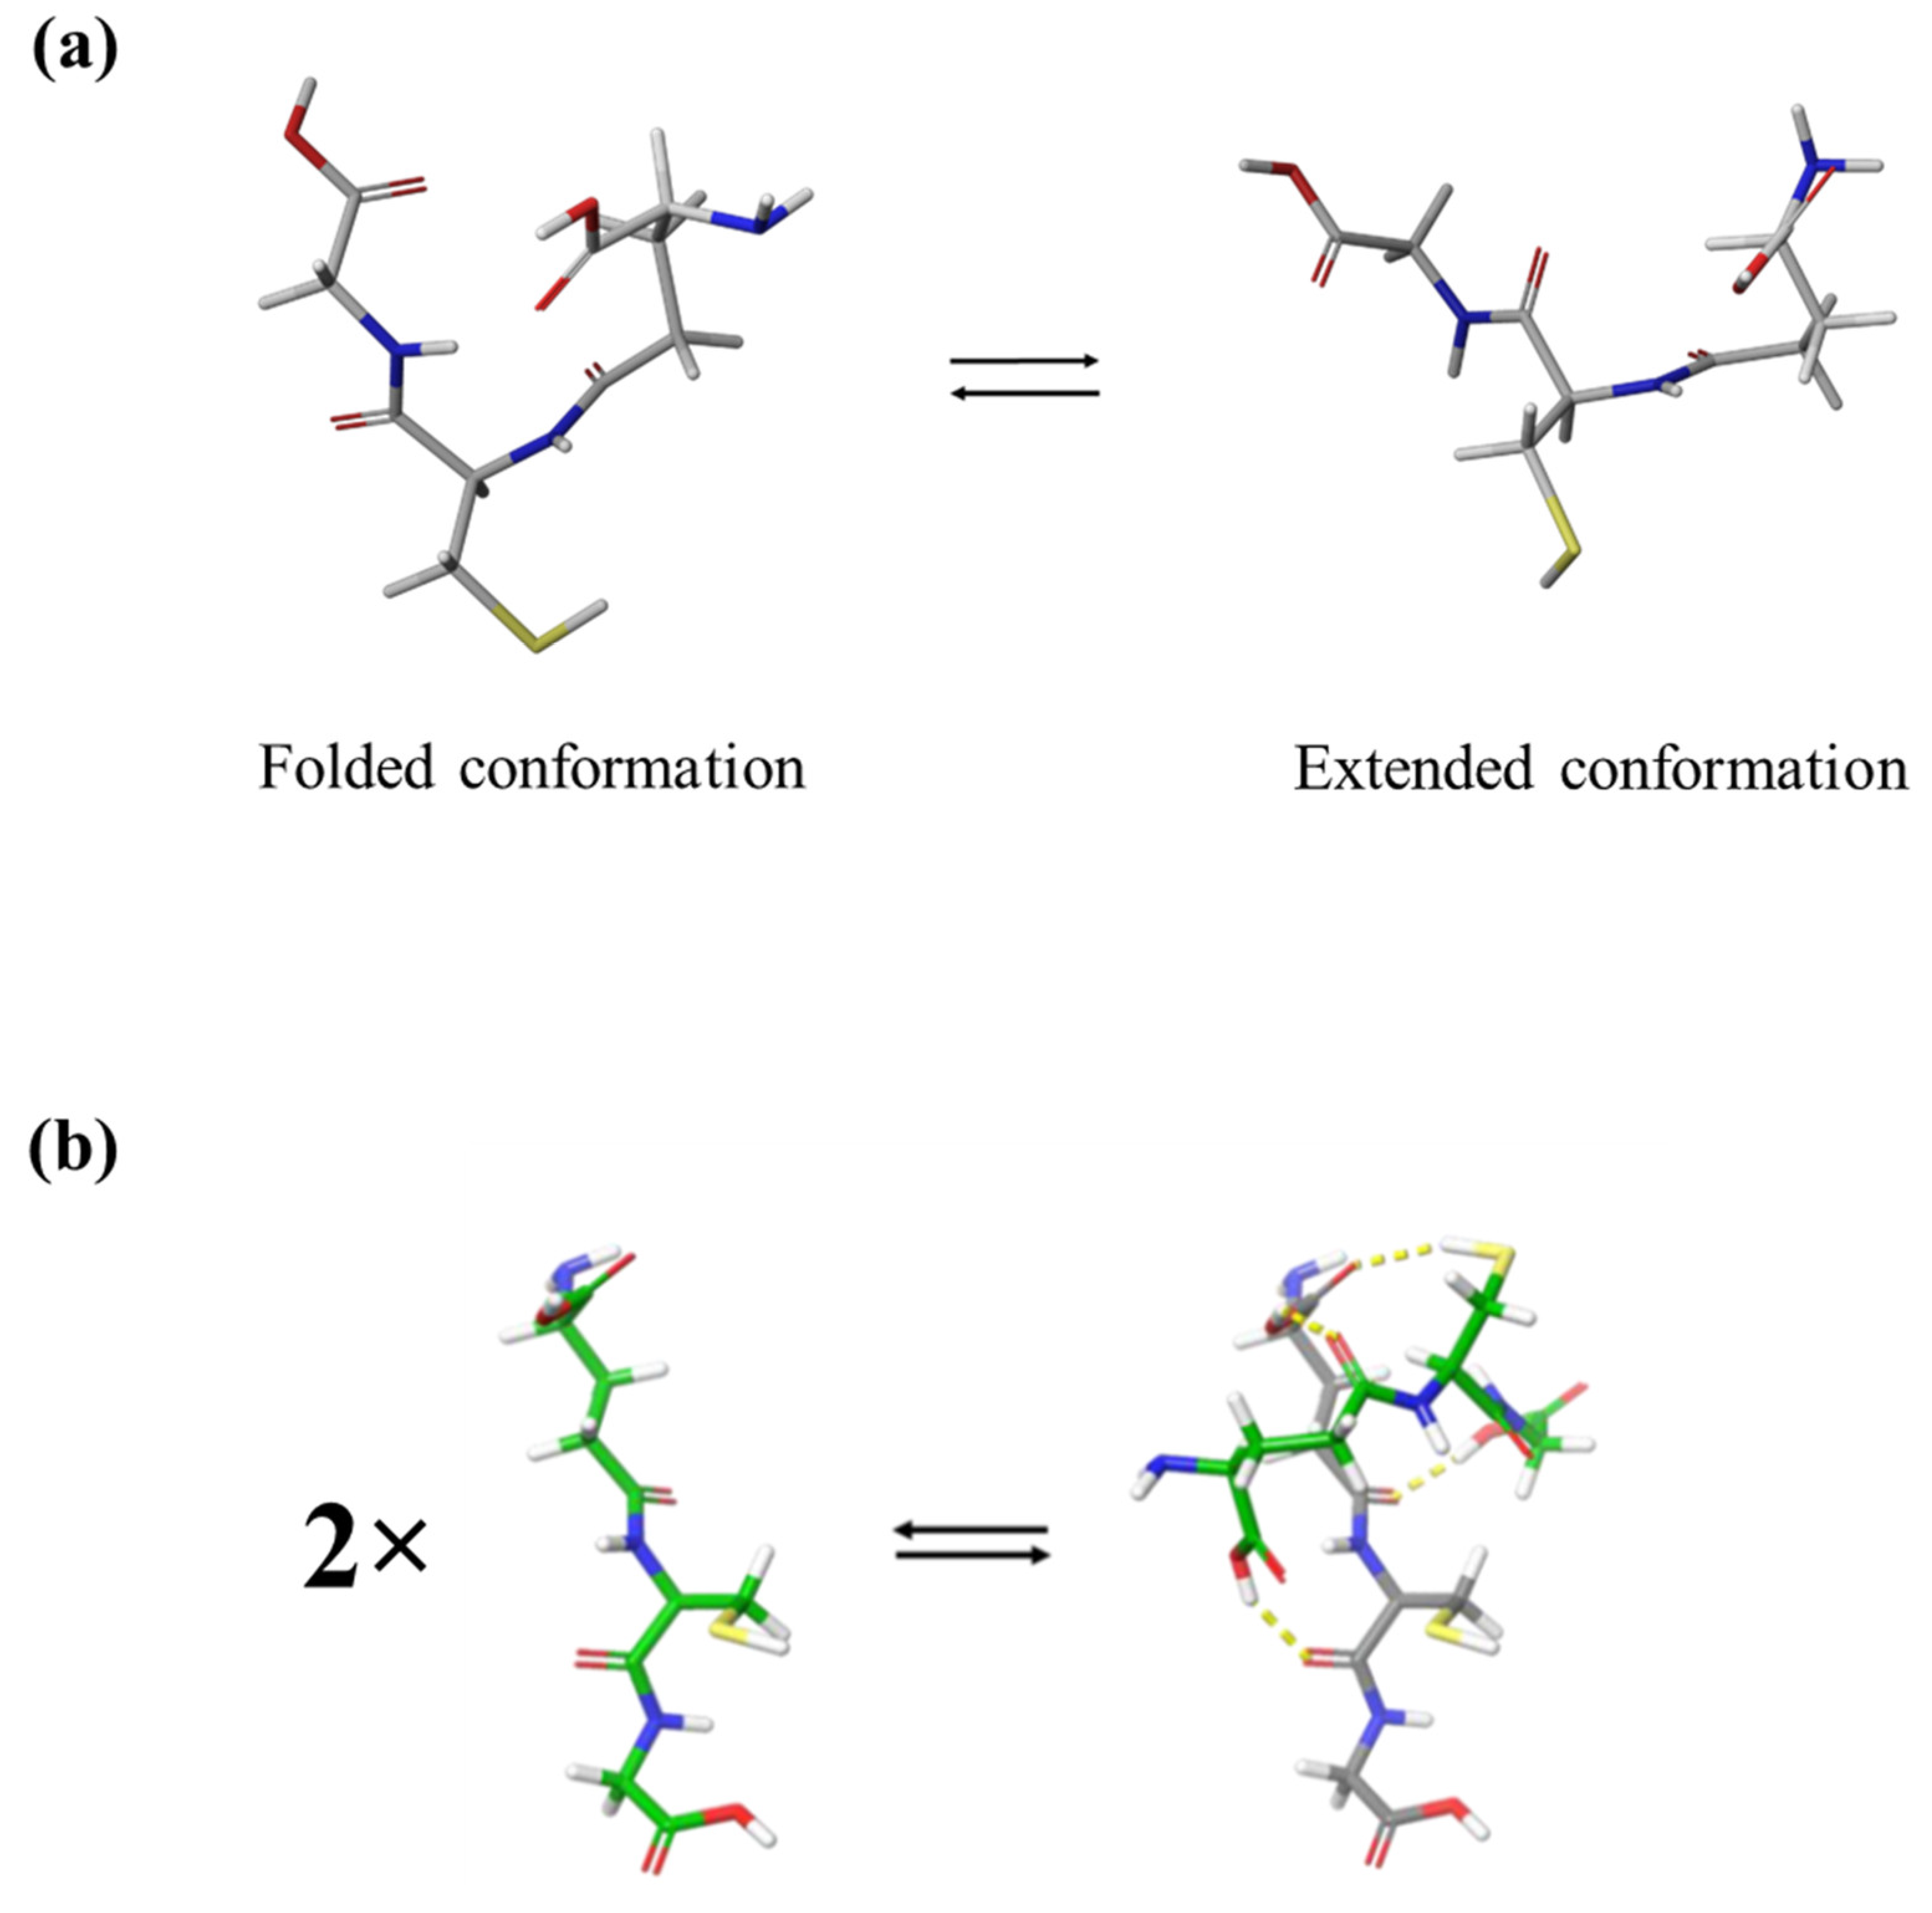
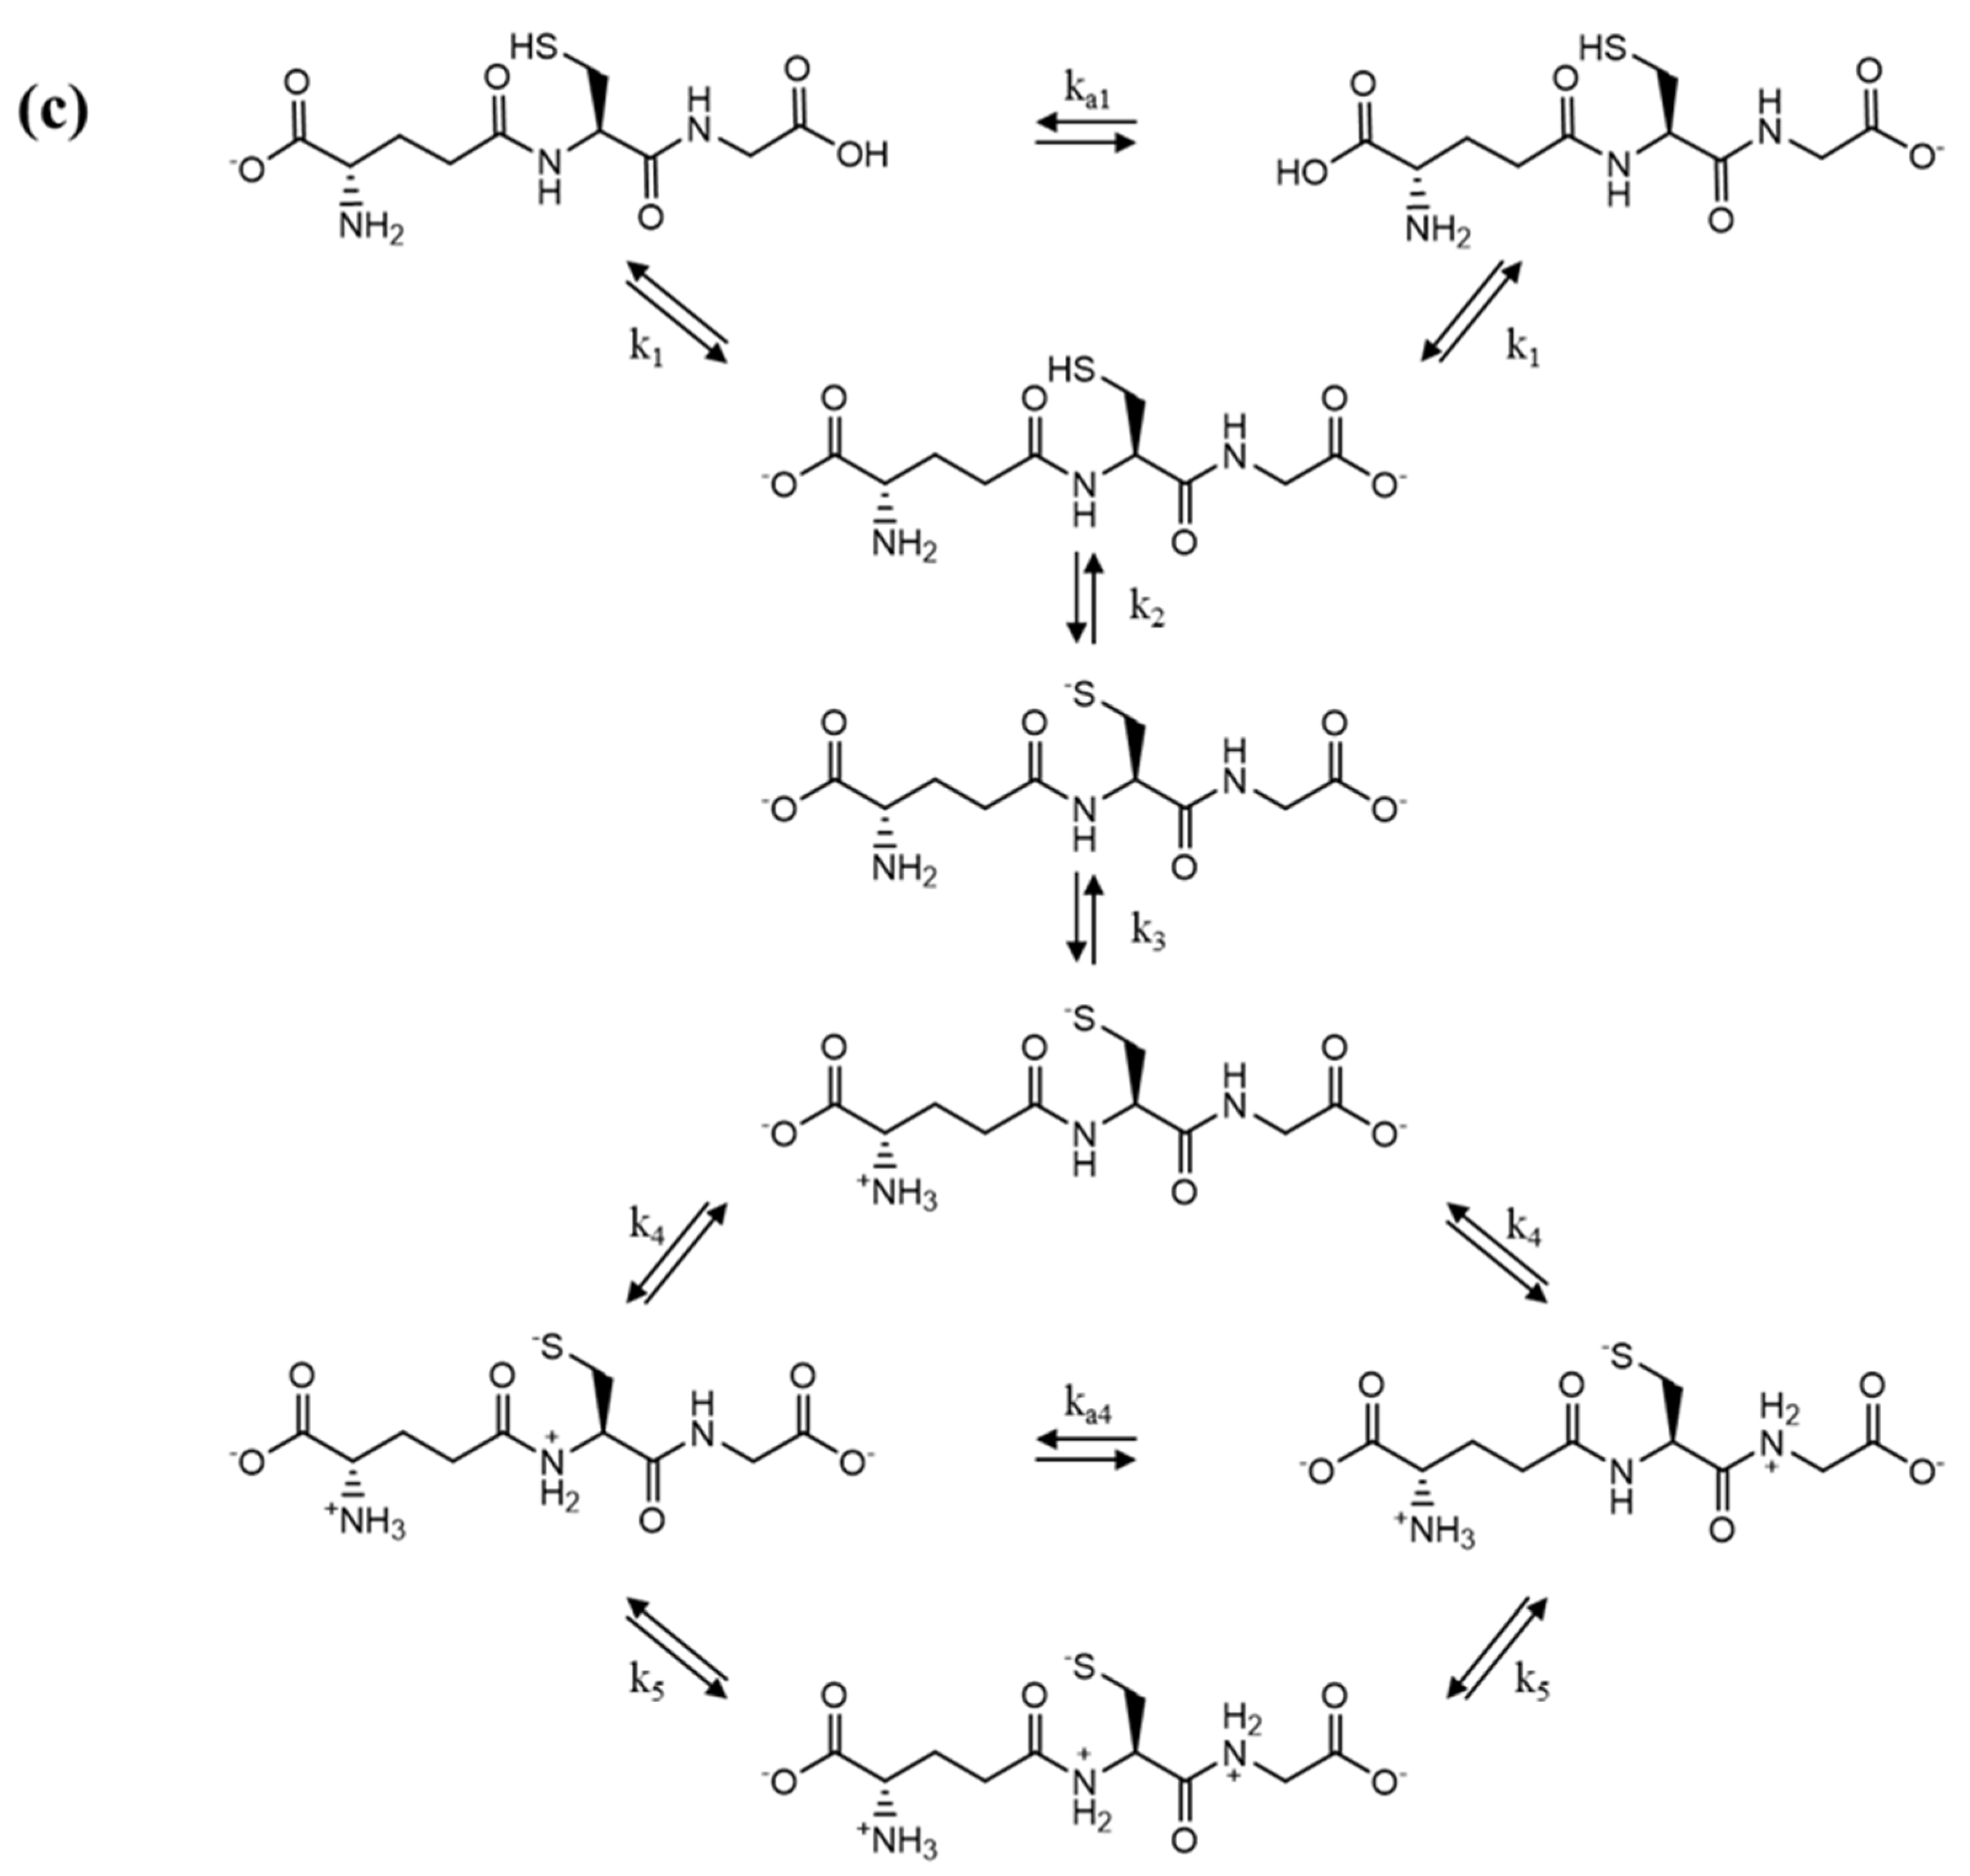
Figure 2.
Excess ultrasonic absorption a/f2 as a function of frequency for all concentrations studied at 20°C. Continuous lines correspond to Debye-type relaxation curves after the fitting procedure described in the text.
Figure 2.
Excess ultrasonic absorption a/f2 as a function of frequency for all concentrations studied at 20°C. Continuous lines correspond to Debye-type relaxation curves after the fitting procedure described in the text.
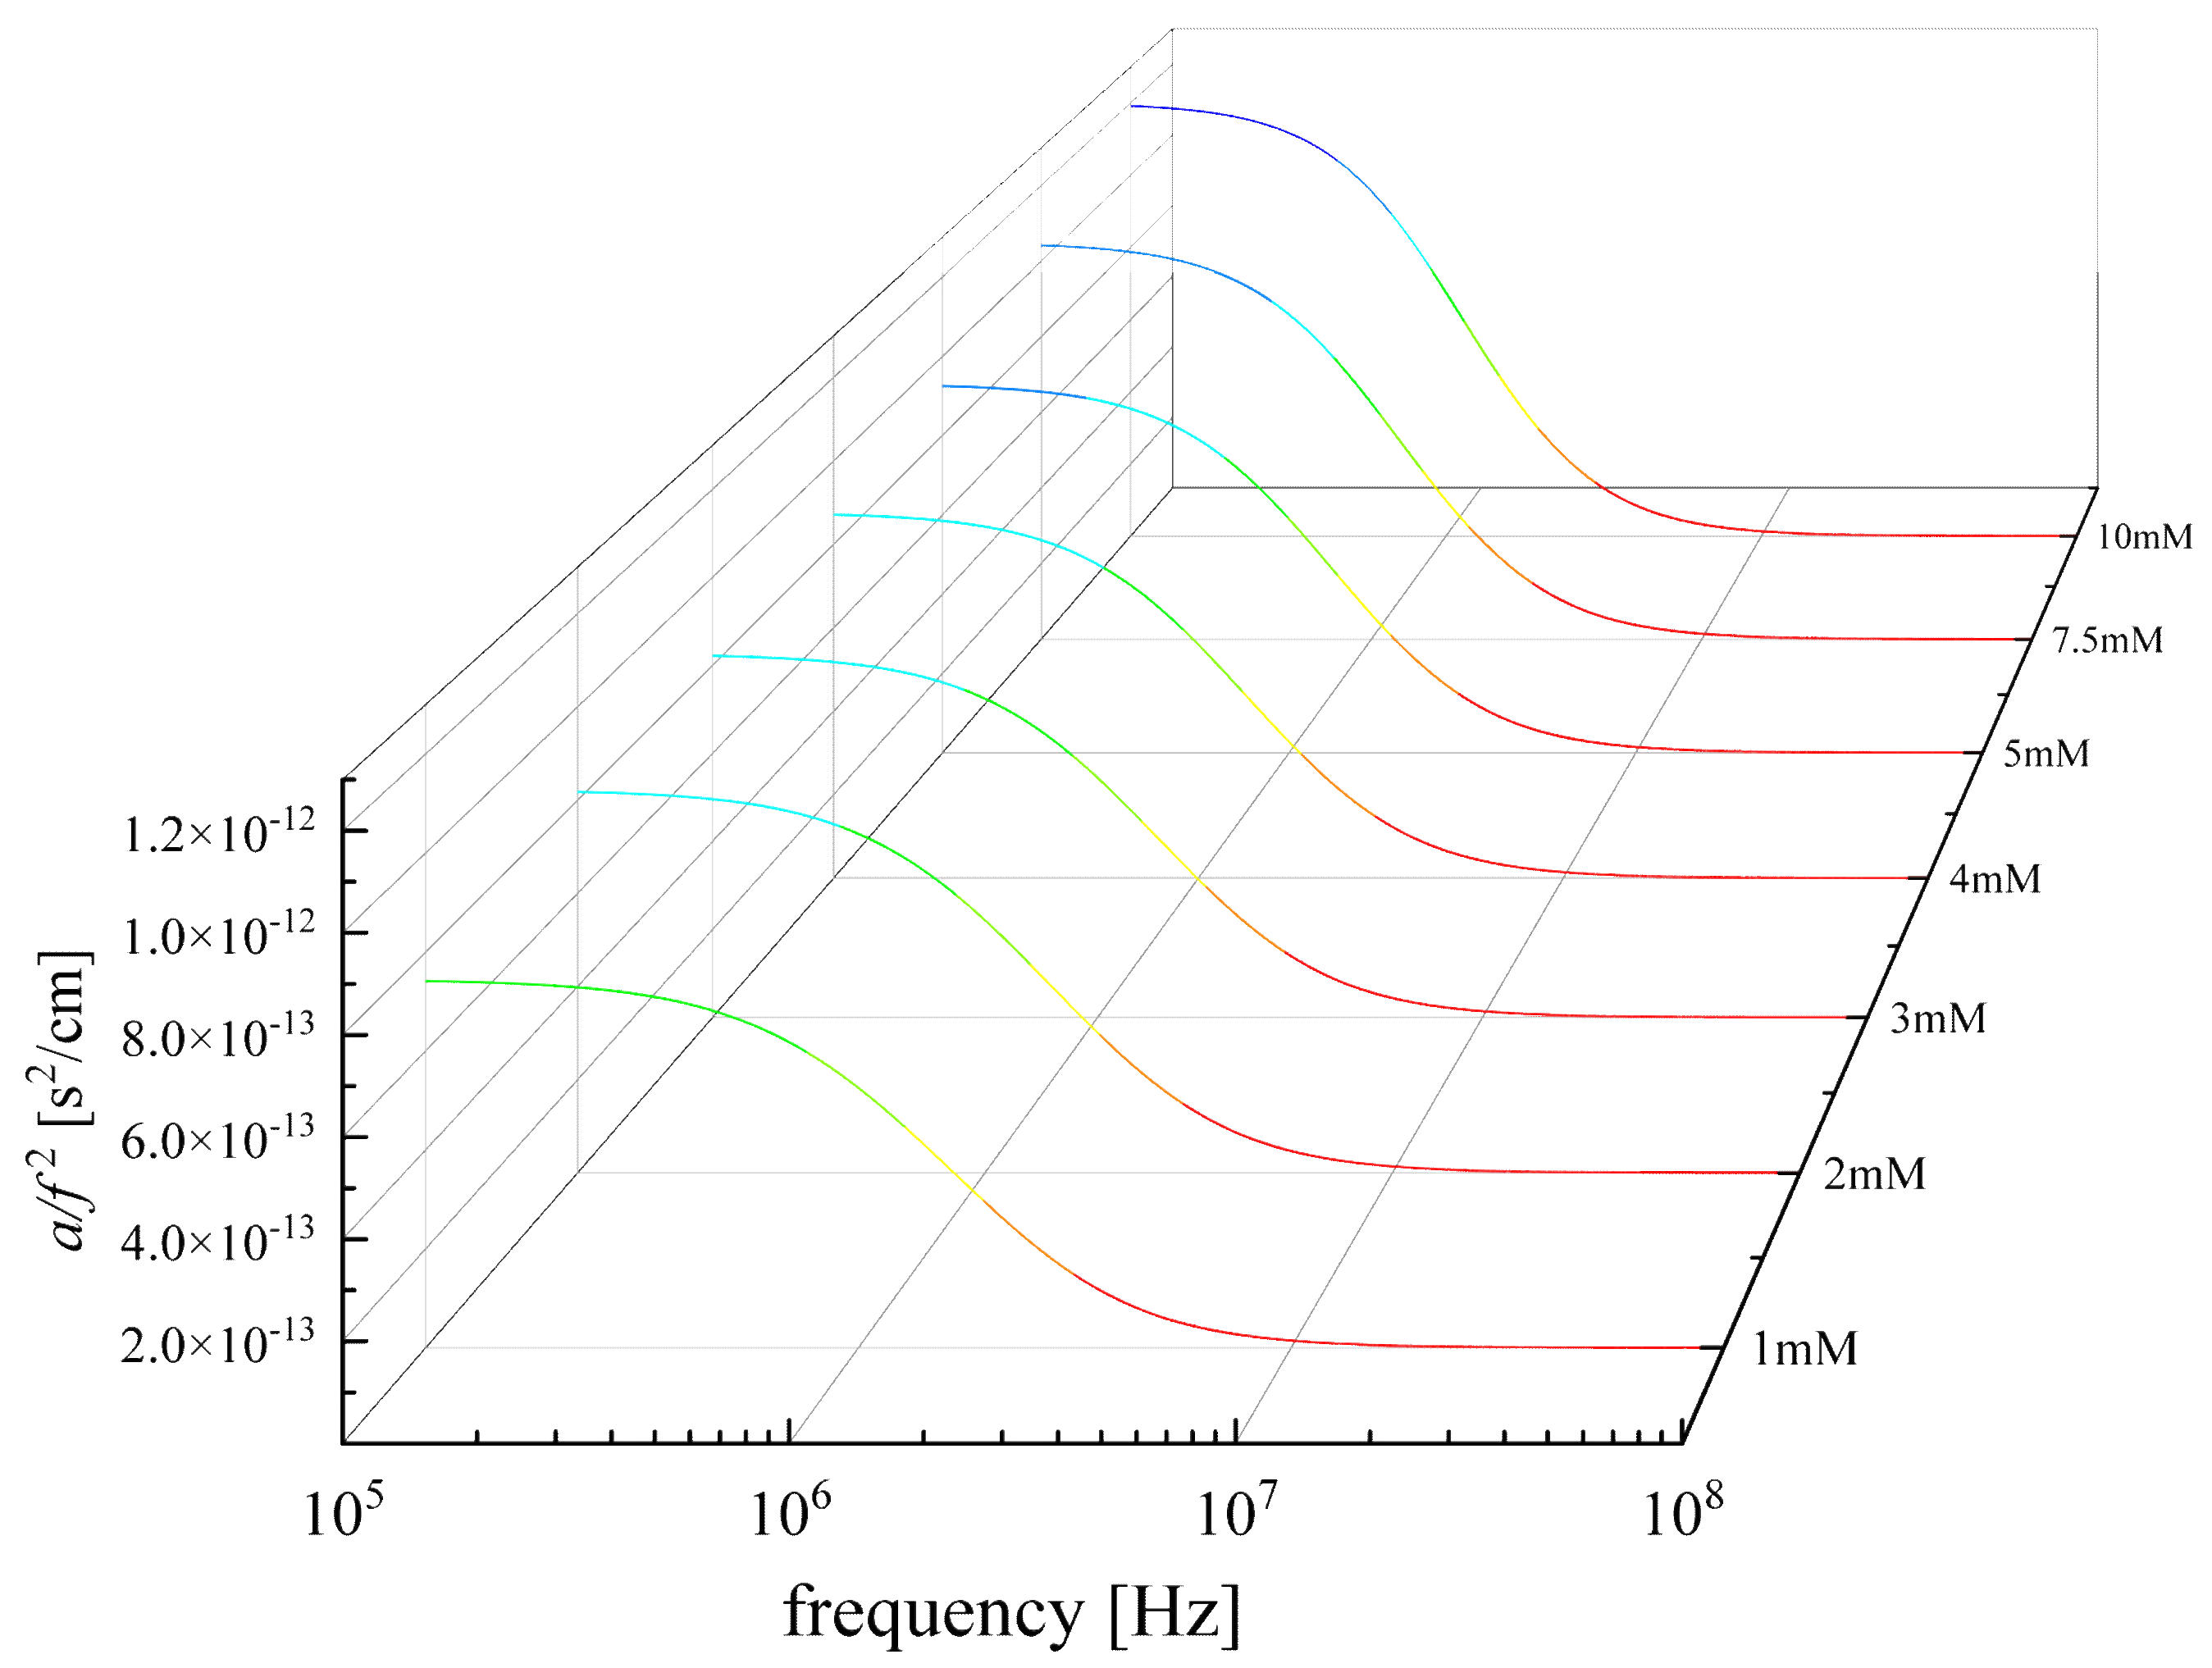
Figure 3.
(a) Excess ultrasonic absorption as a function of frequency for a solution corresponding to concentration of 1 mM. Open symbols denote the experimental values and solid lines correspond to the total fitting and the individual curves related with the three relaxation processes, respectively. (b) Normalized excess ultrasonic absorption spectra in the same frequency range. The three distinct relaxation frequencies are detected as sagmatic points in the sigmoidal Debye-type profiles.
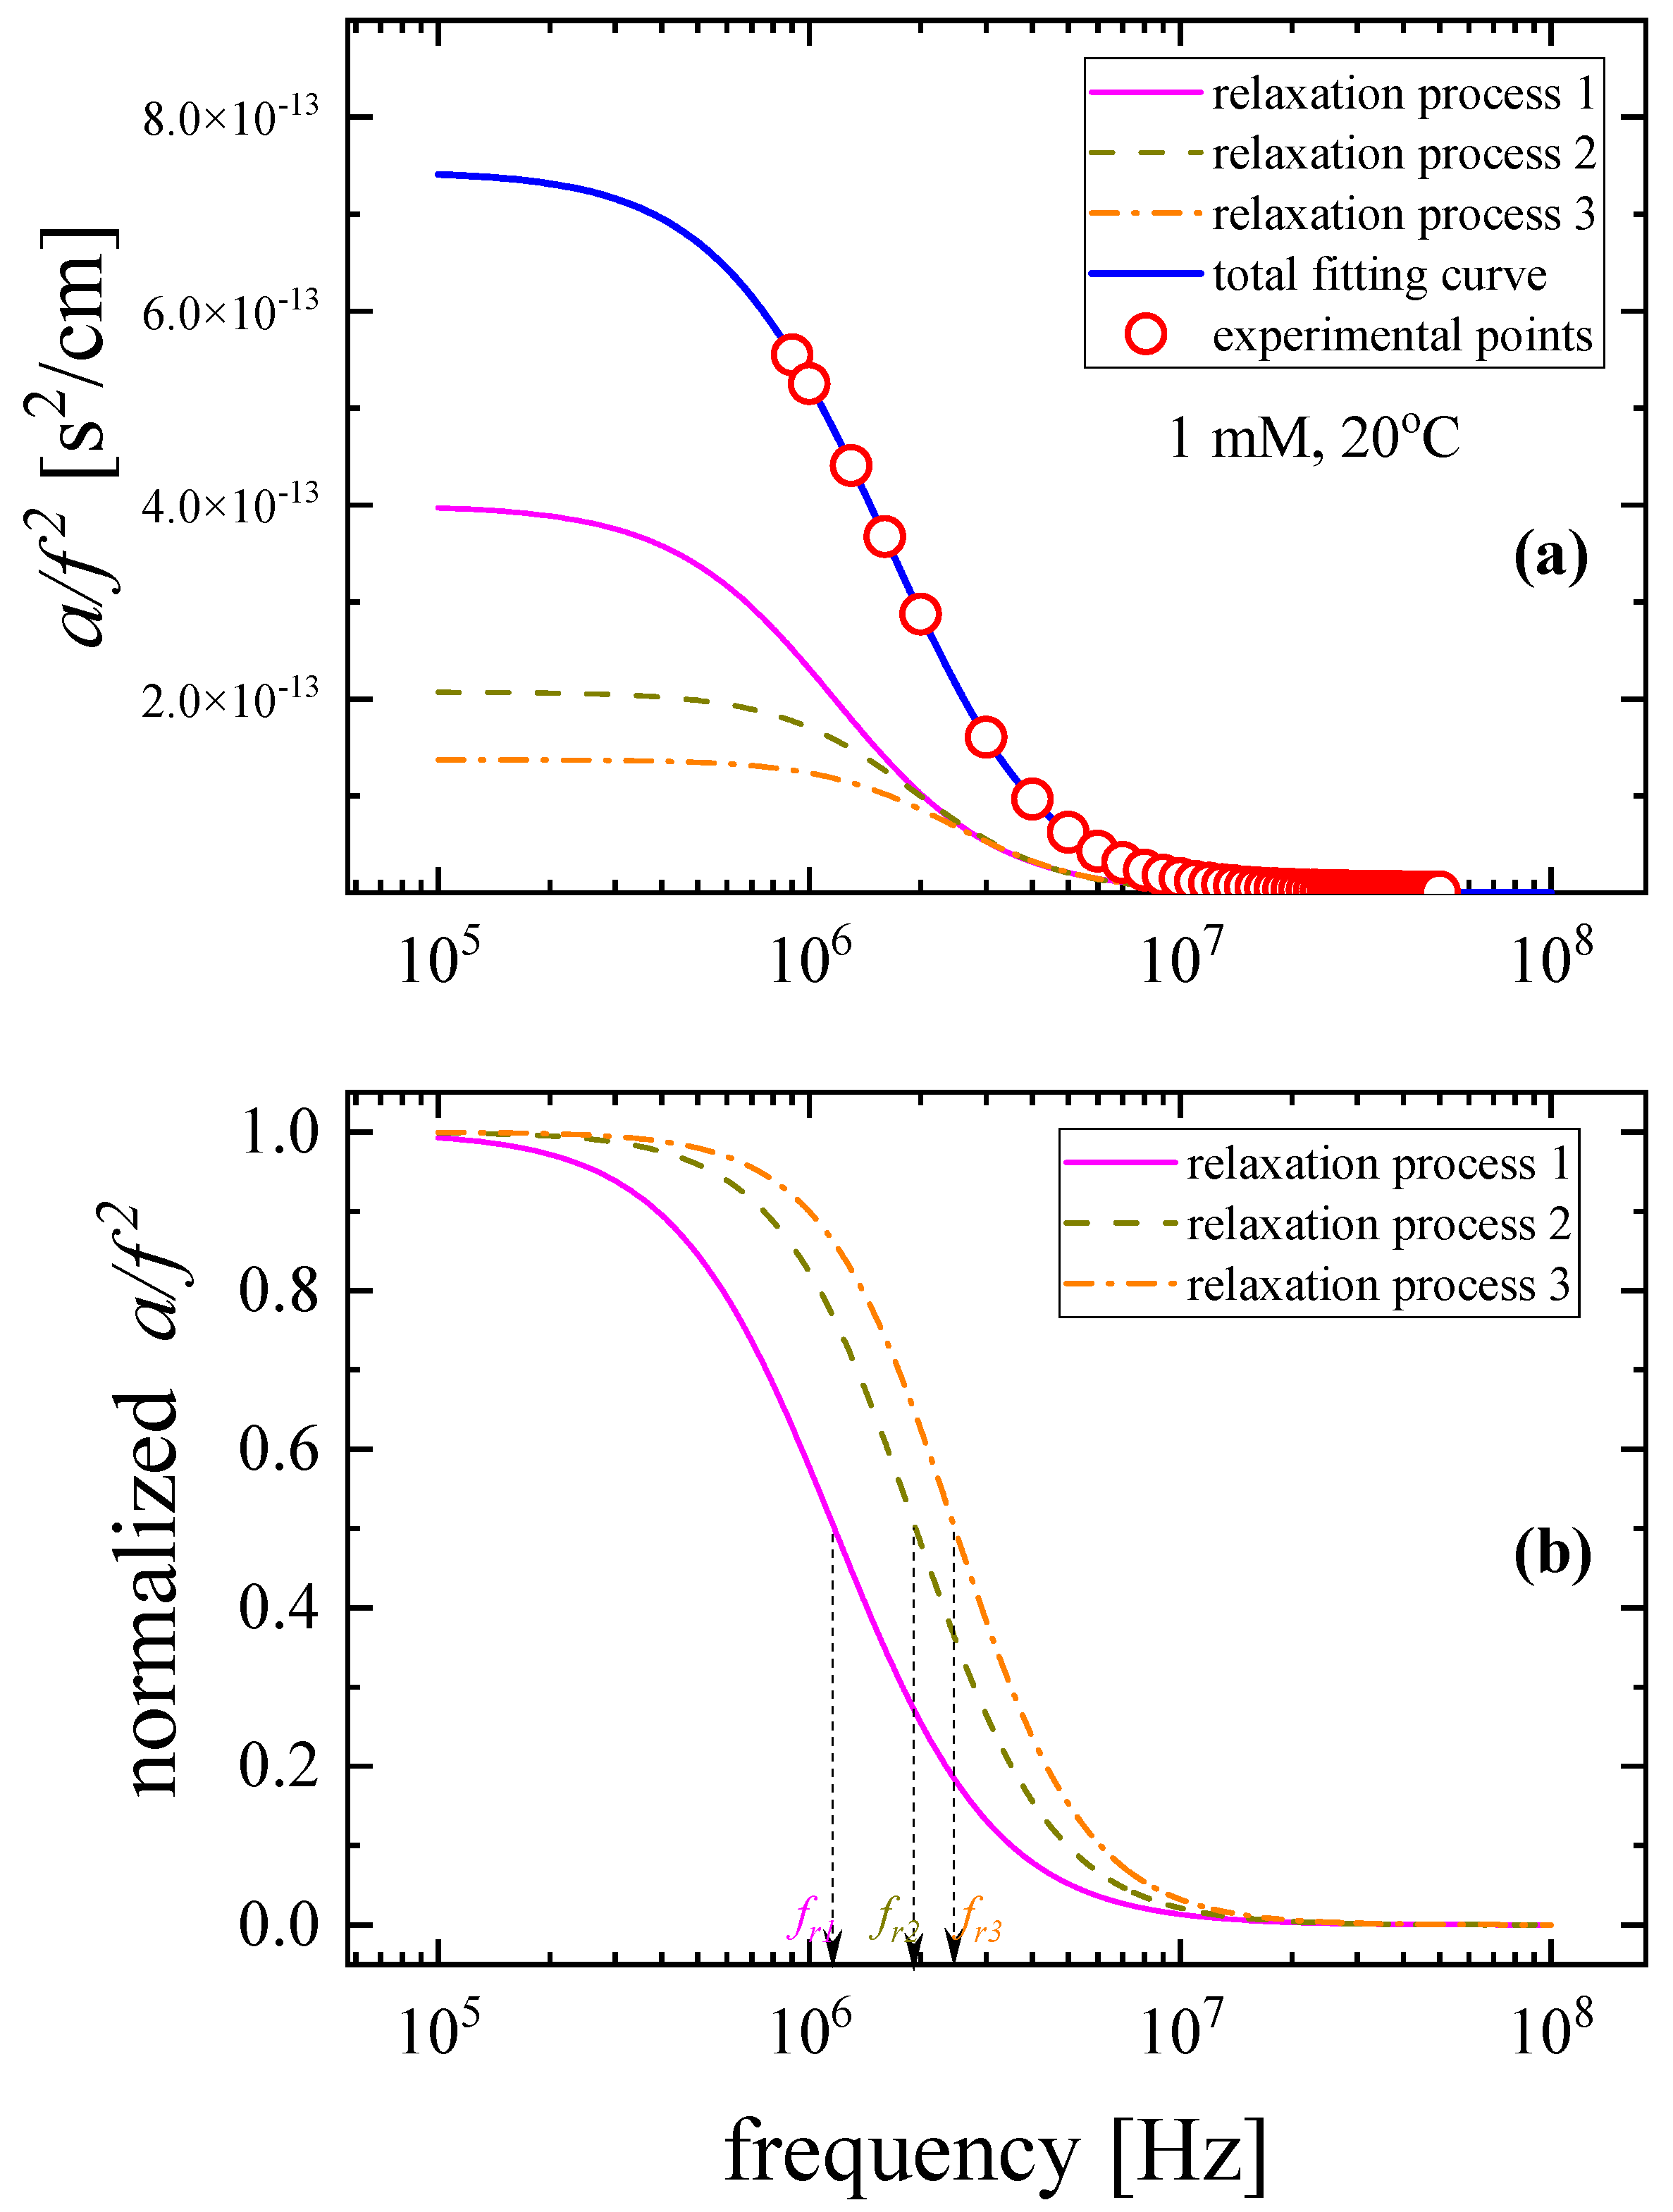
Figure 4.
Concentration dependence of the relaxation frequencies (a) and amplitudes (b).
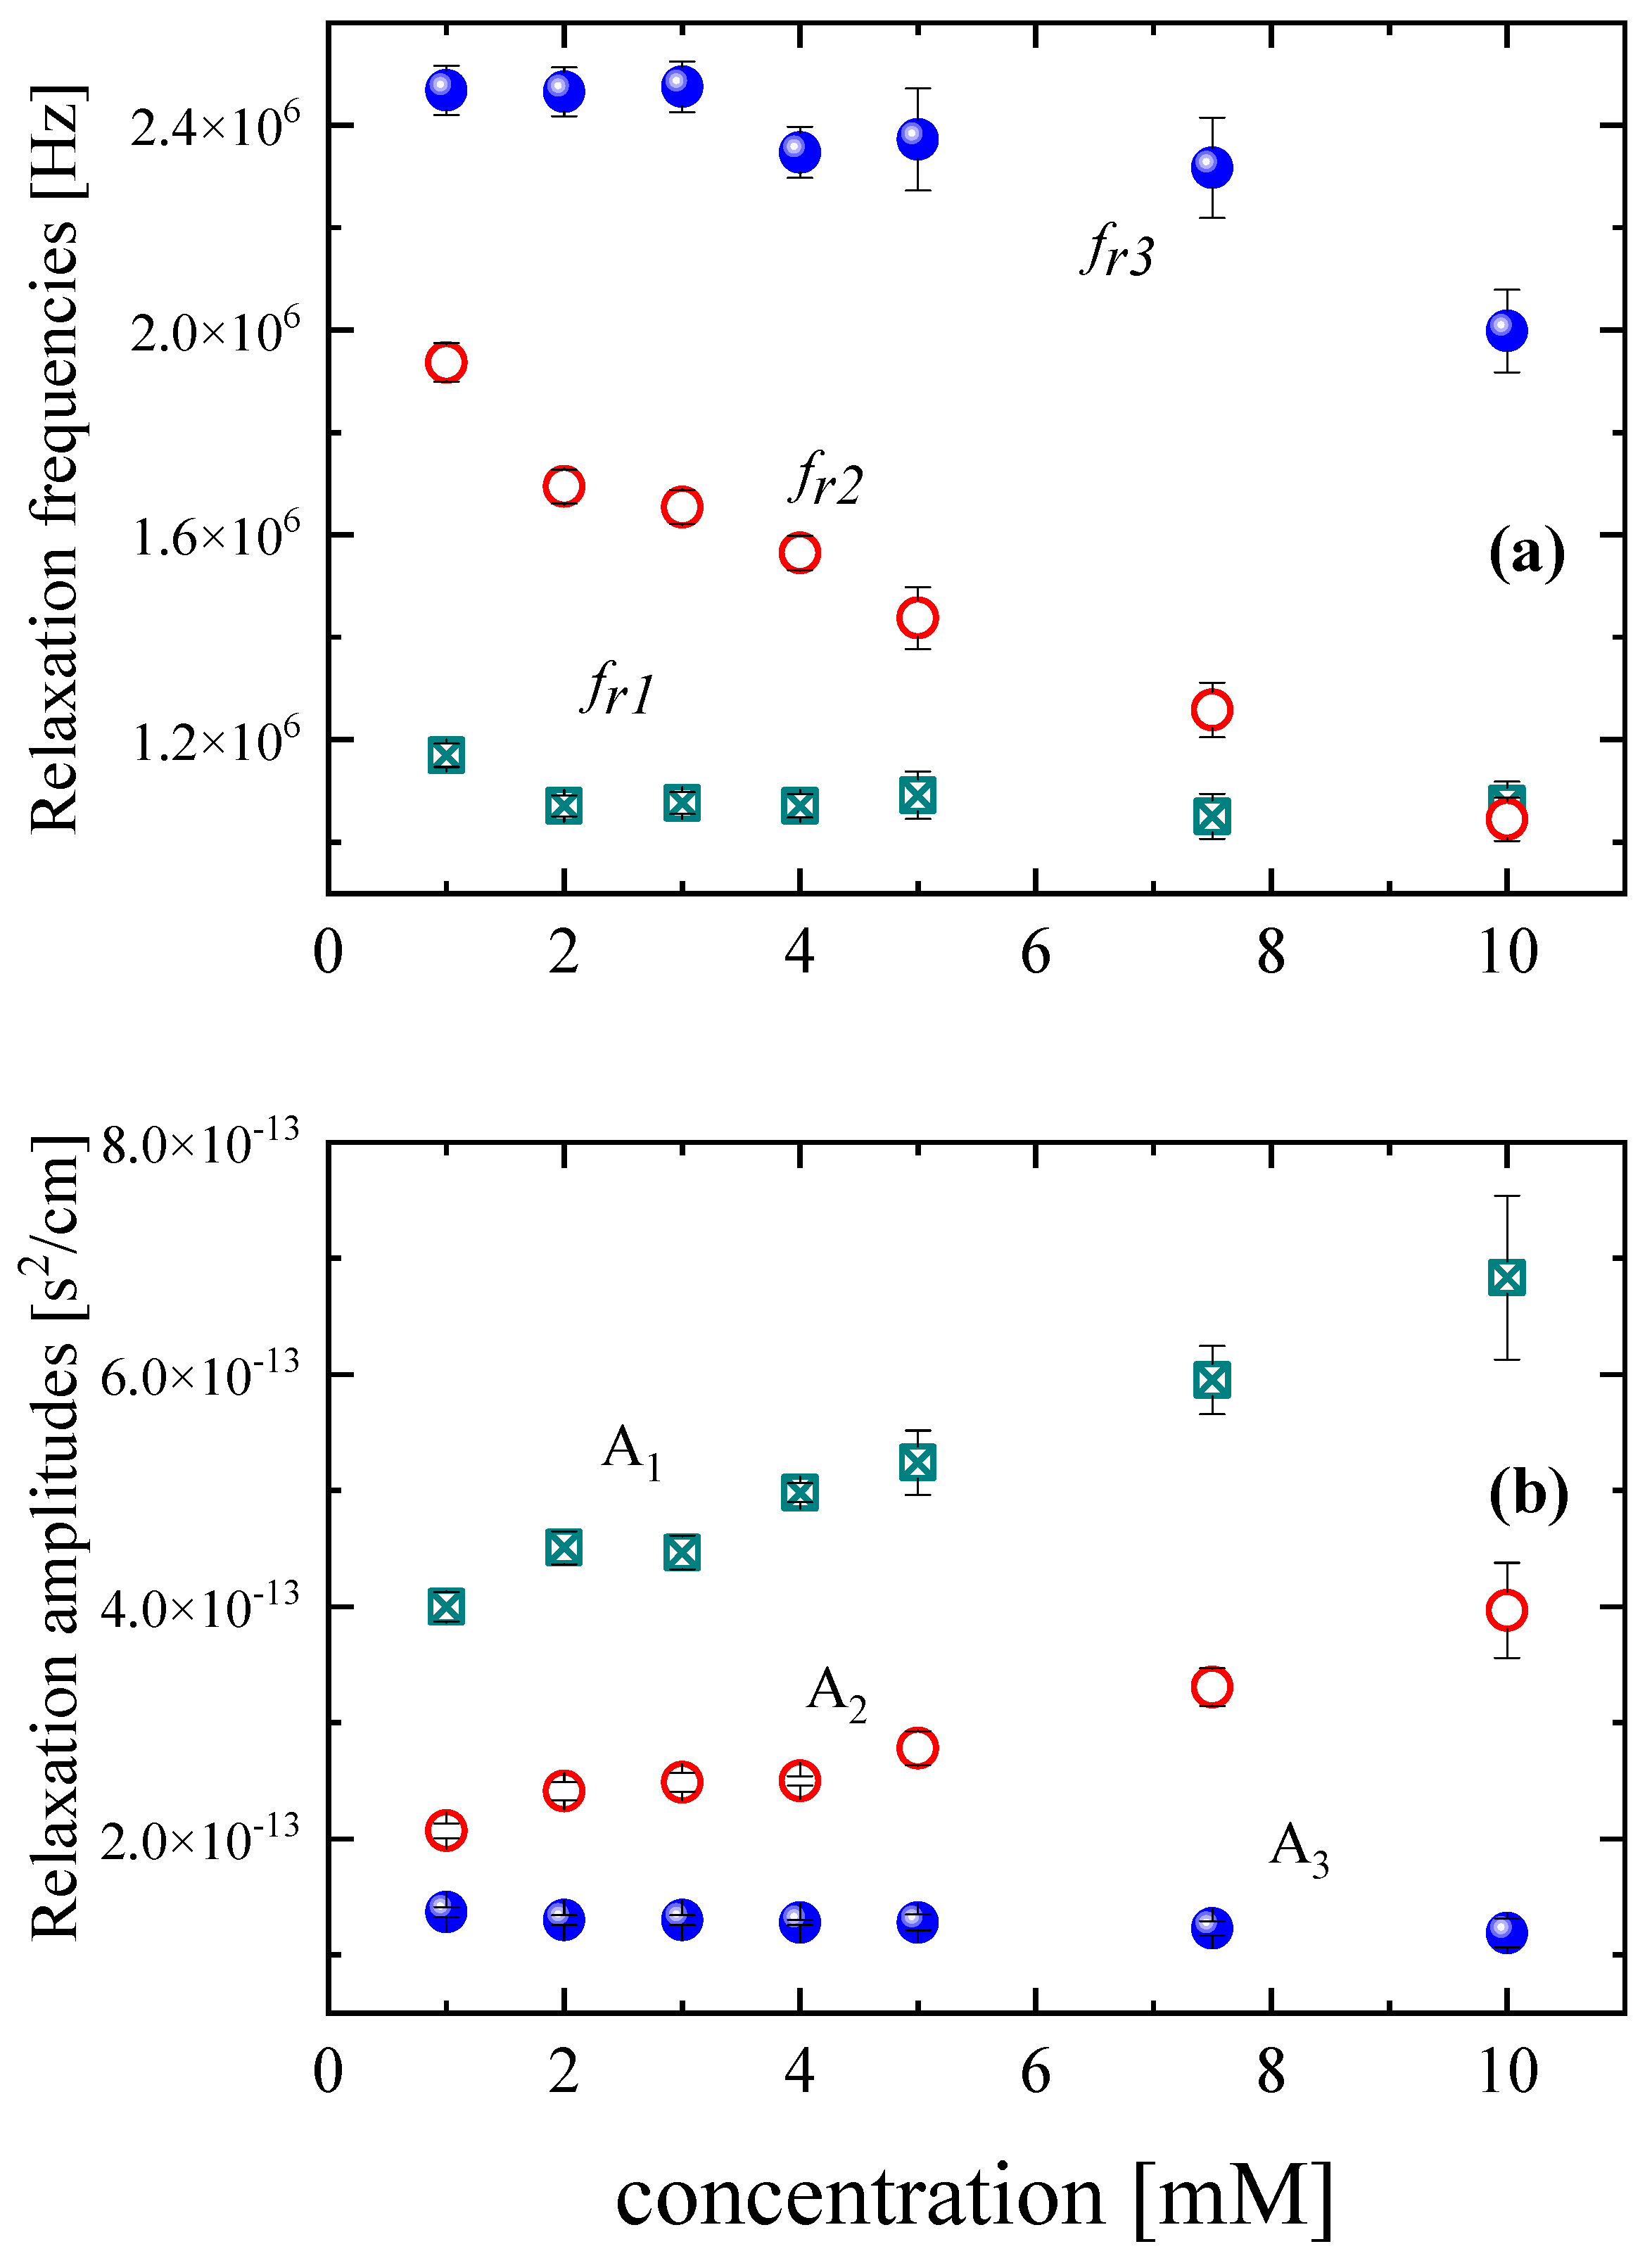
Figure 5.
Standard volume change for the conformational change (relaxation process 1), the association-dissociation reaction (relaxation process 2) and the protonation and deprotonation reactions (relaxation process 3) as a function of GSH concentration at 20°C. Solid, dotted and dash-dotted lines correspond to the theoretically estimated standard volume changes corresponding to each relaxation process. See text for details about the calculation procedure.
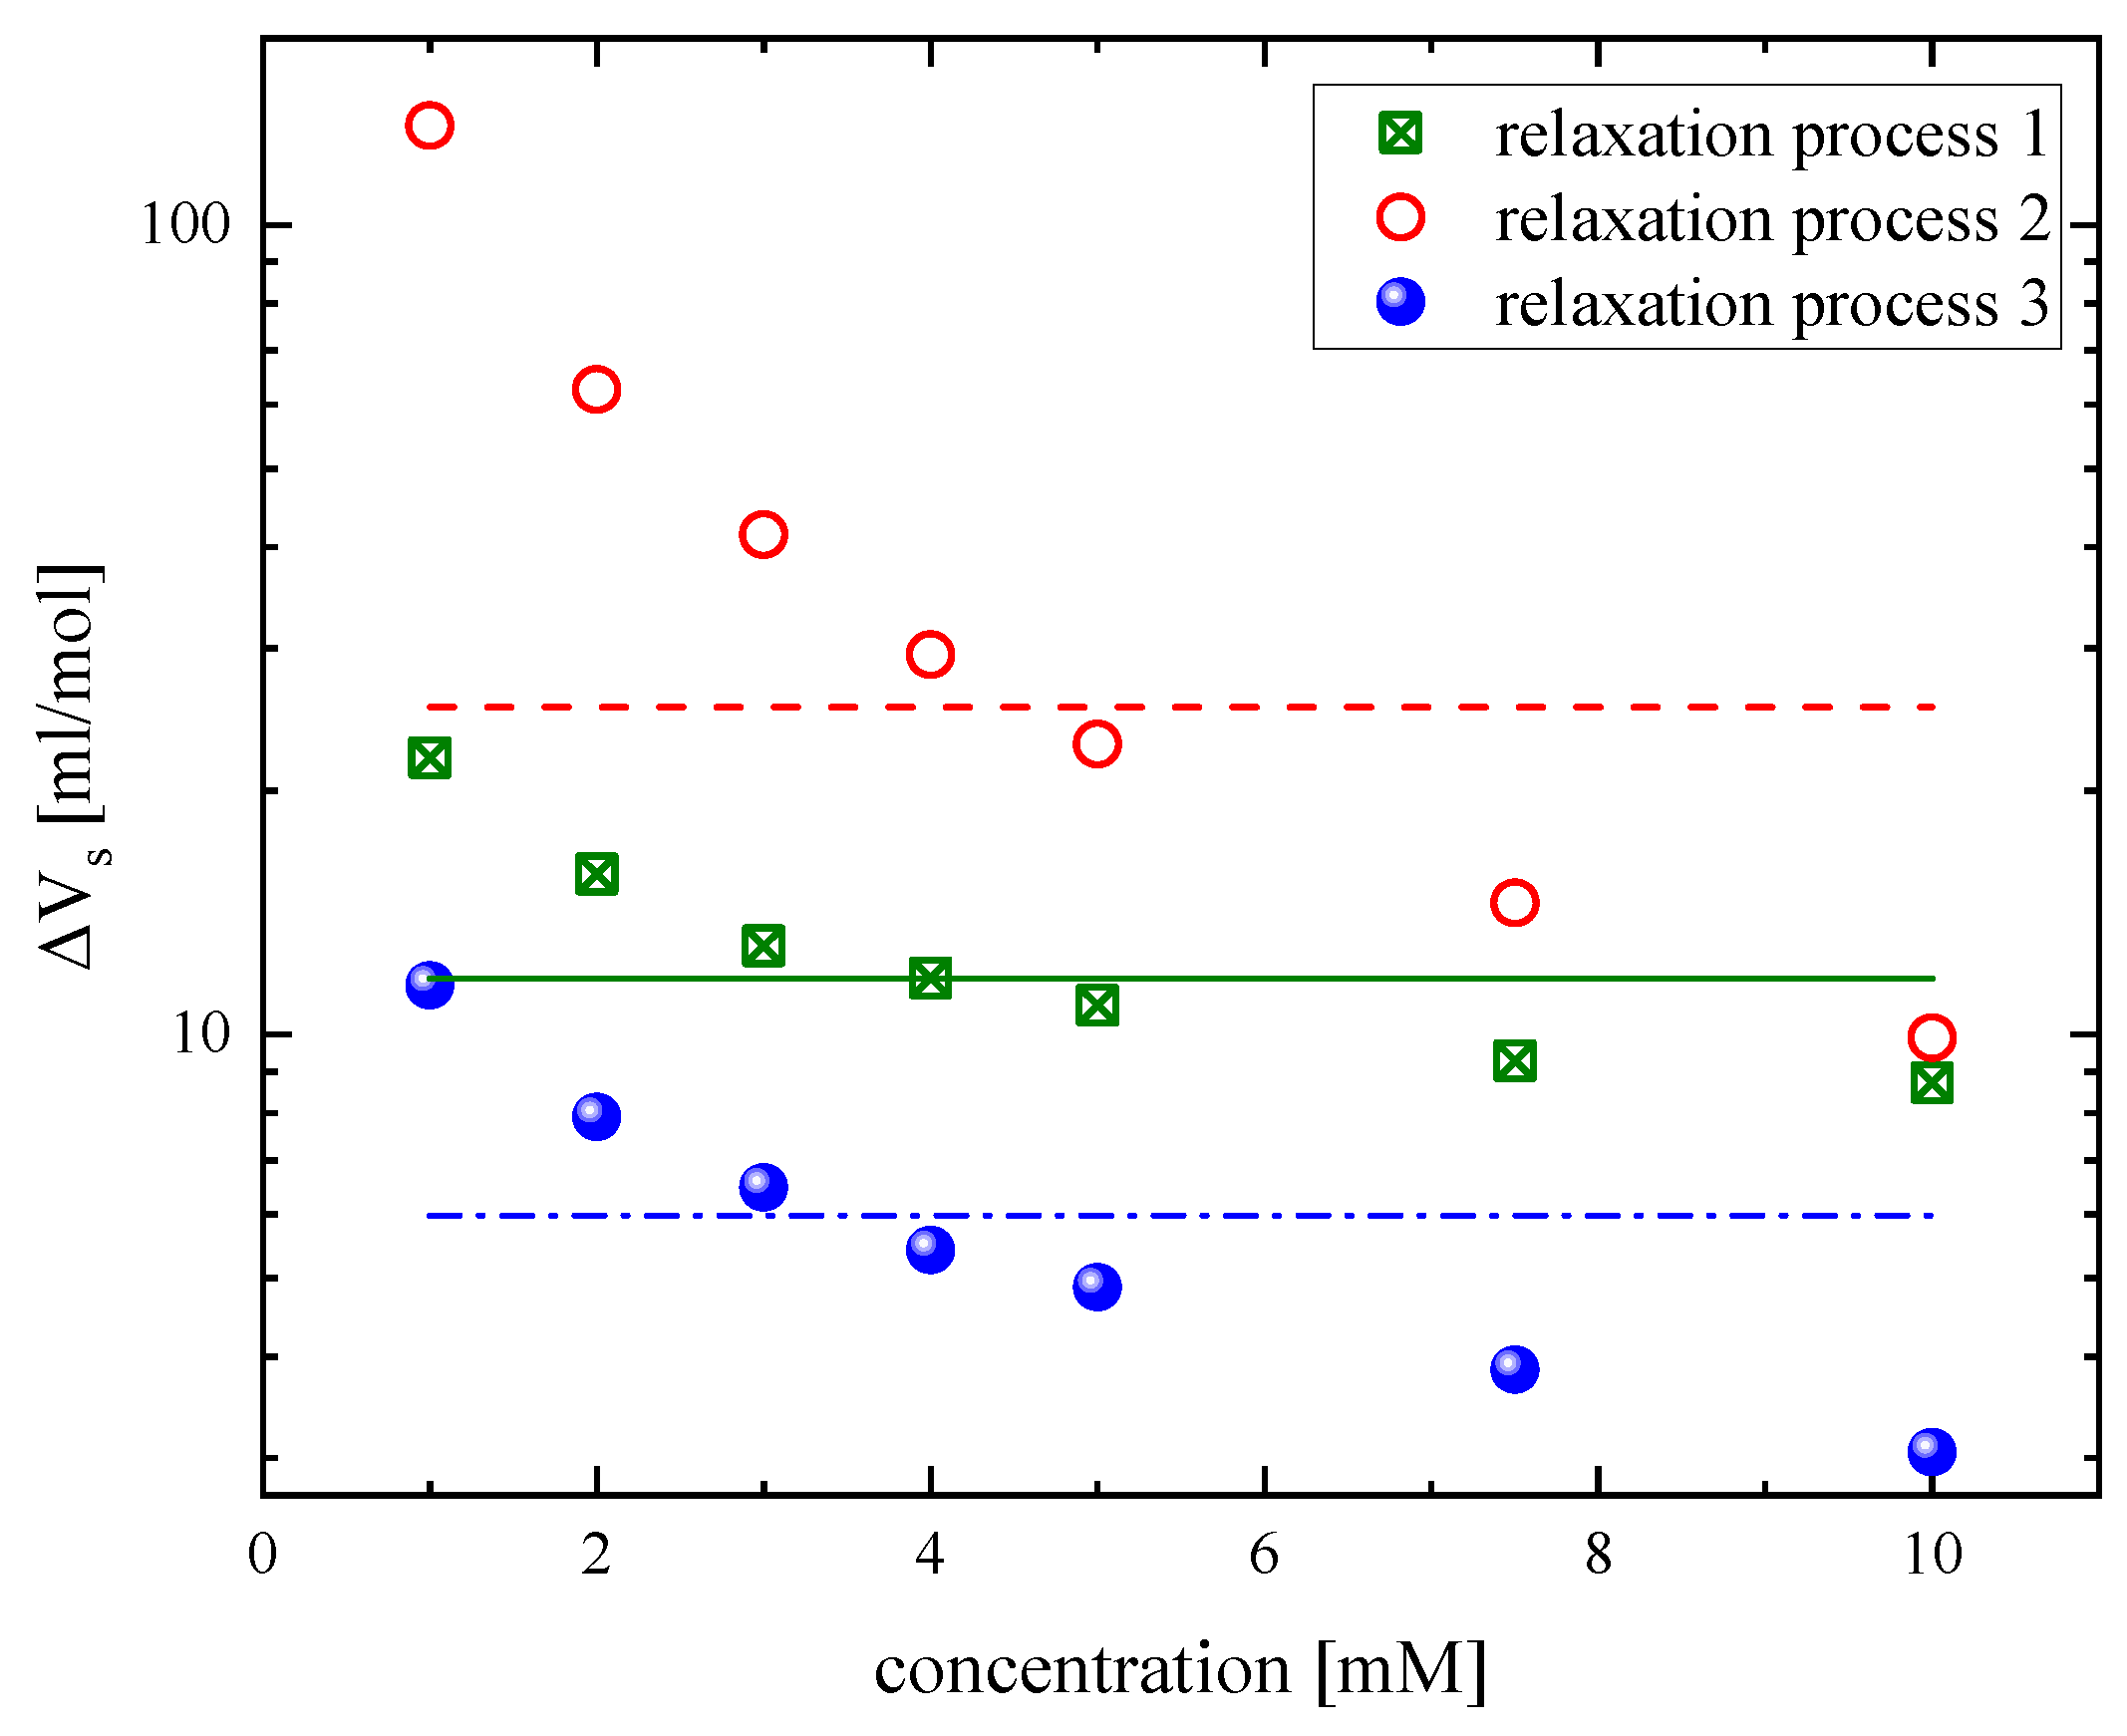
Figure 6.
Excess ultrasonic absorption a/f2 as a function of frequency for a solution with concentration 5 mM for all temperatures studied. Continuous lines correspond to Debye-type relaxation curves for each temperature.
Figure 6.
Excess ultrasonic absorption a/f2 as a function of frequency for a solution with concentration 5 mM for all temperatures studied. Continuous lines correspond to Debye-type relaxation curves for each temperature.
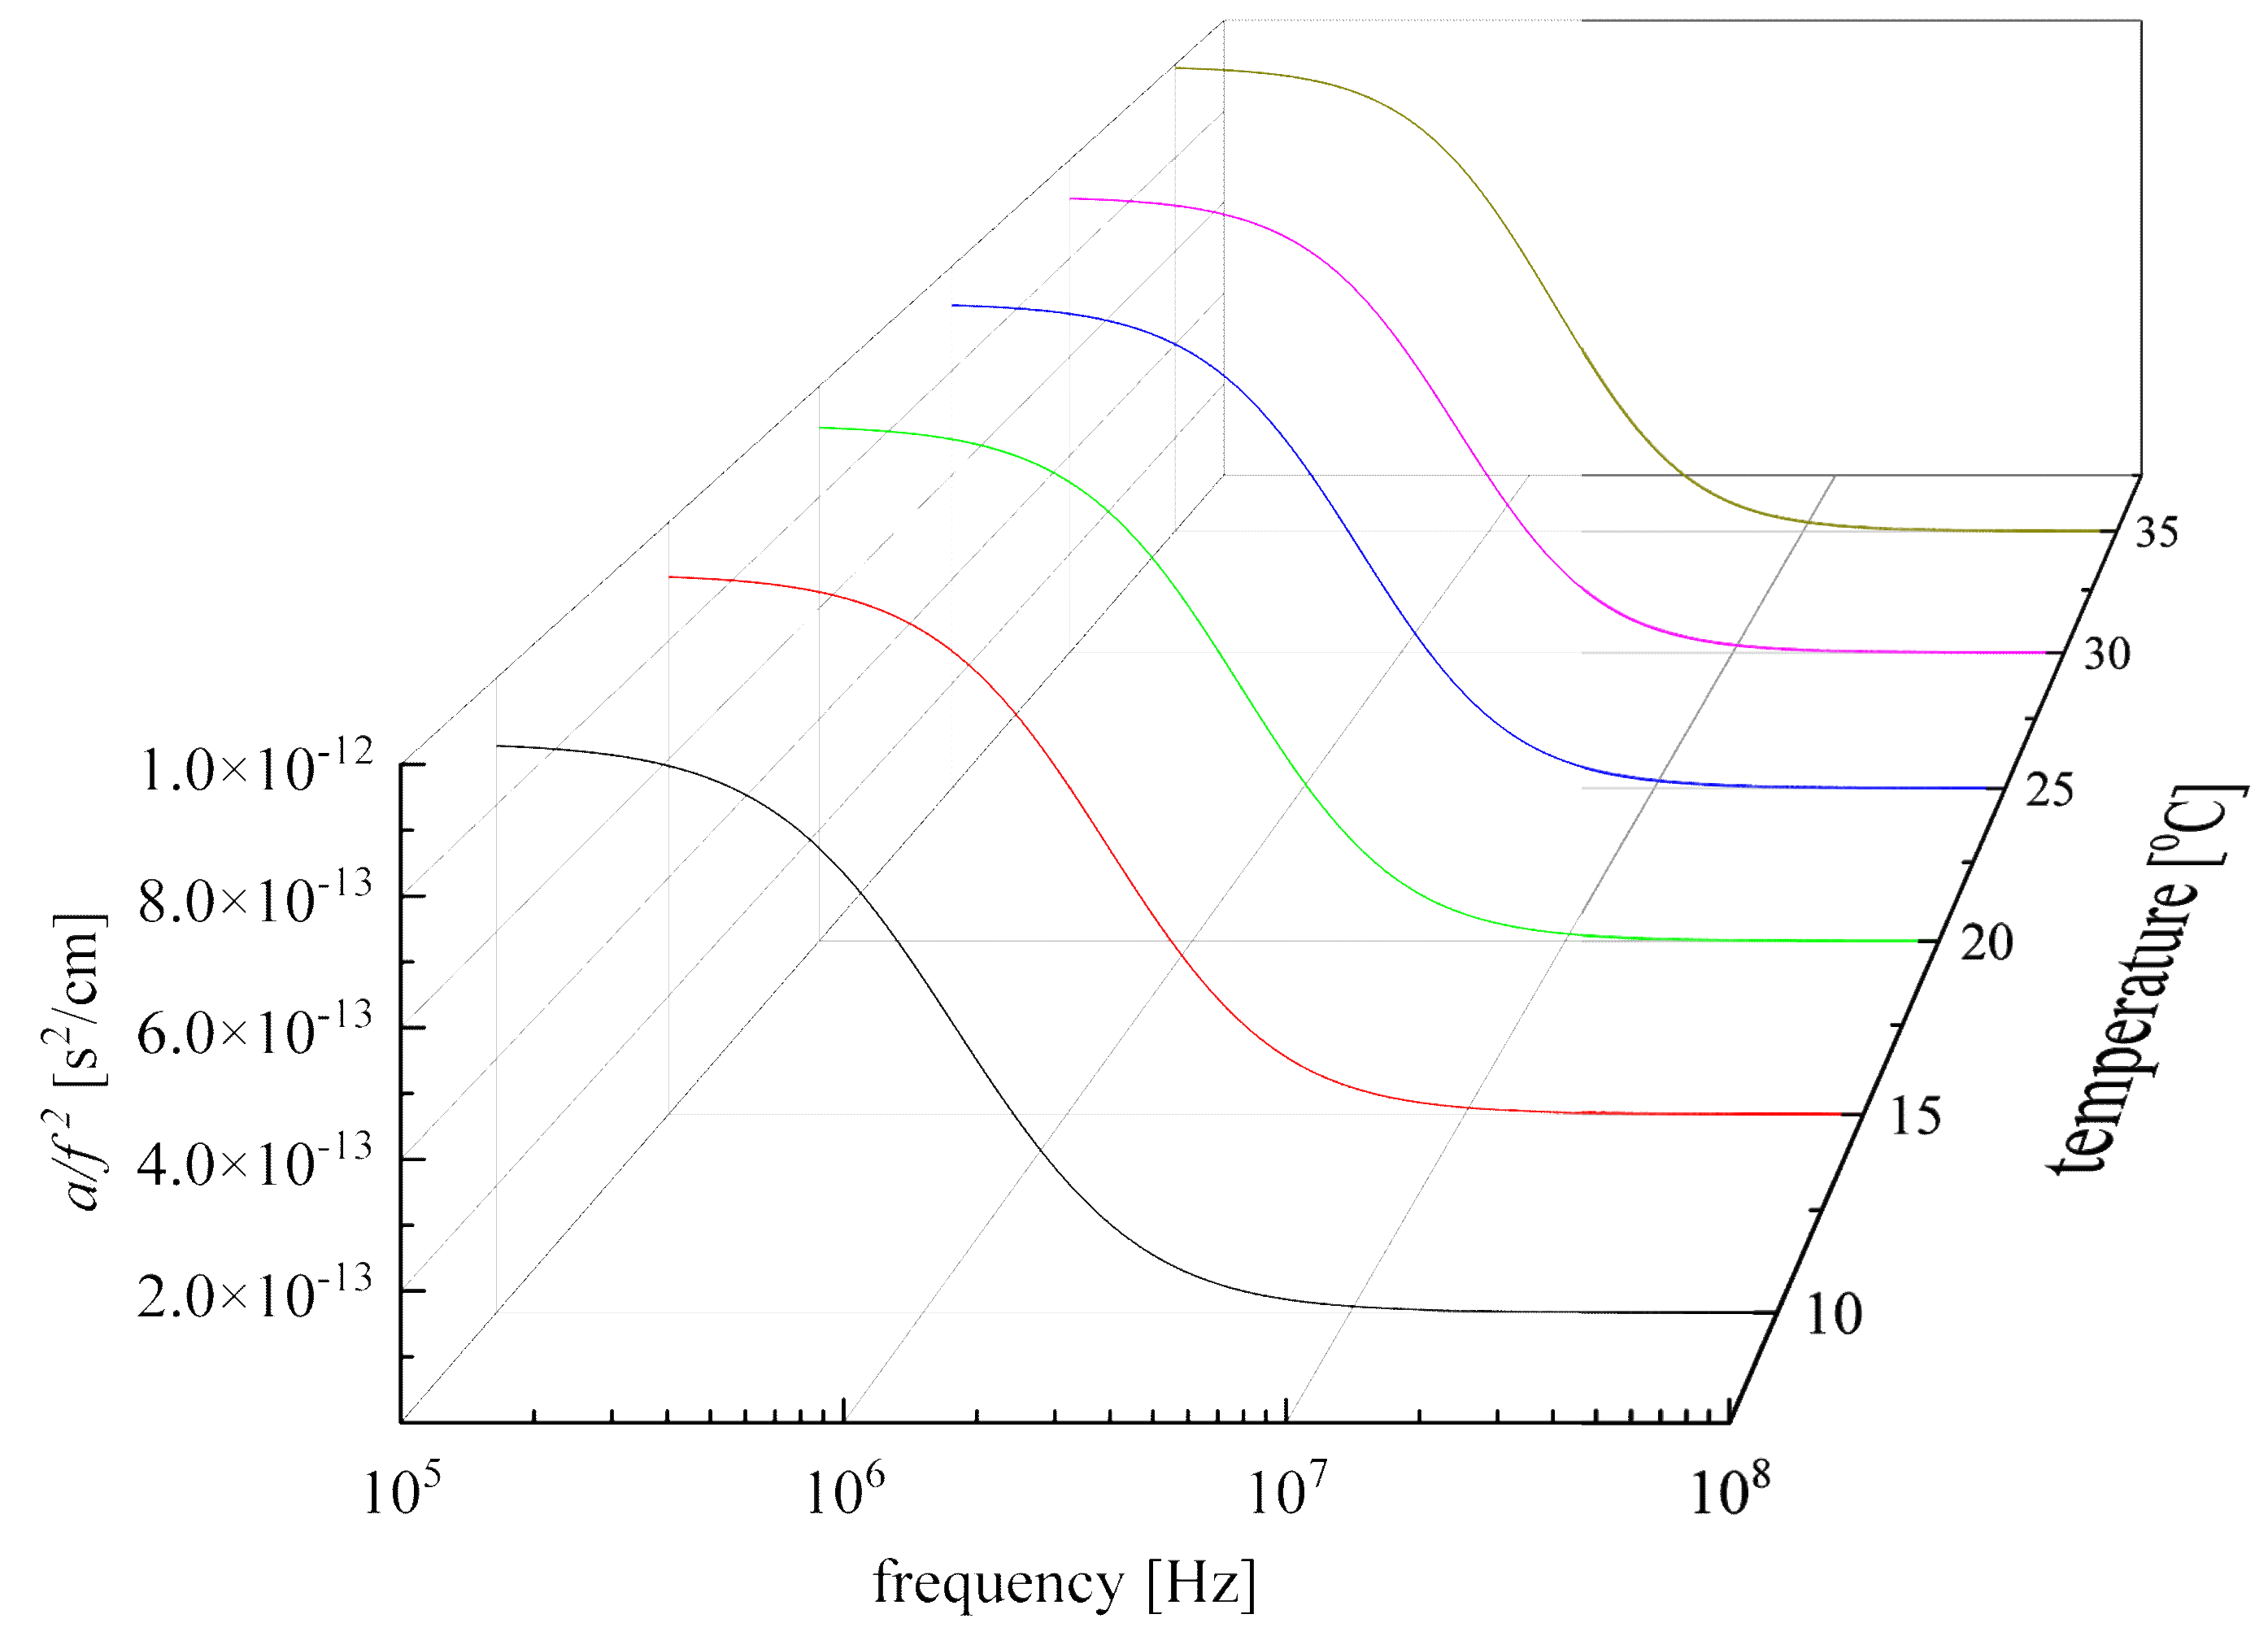
Figure 7.
Temperature dependence of the characteristic ultrasonic relaxation frequency (a) and amplitude of relaxation (b).
Figure 7.
Temperature dependence of the characteristic ultrasonic relaxation frequency (a) and amplitude of relaxation (b).
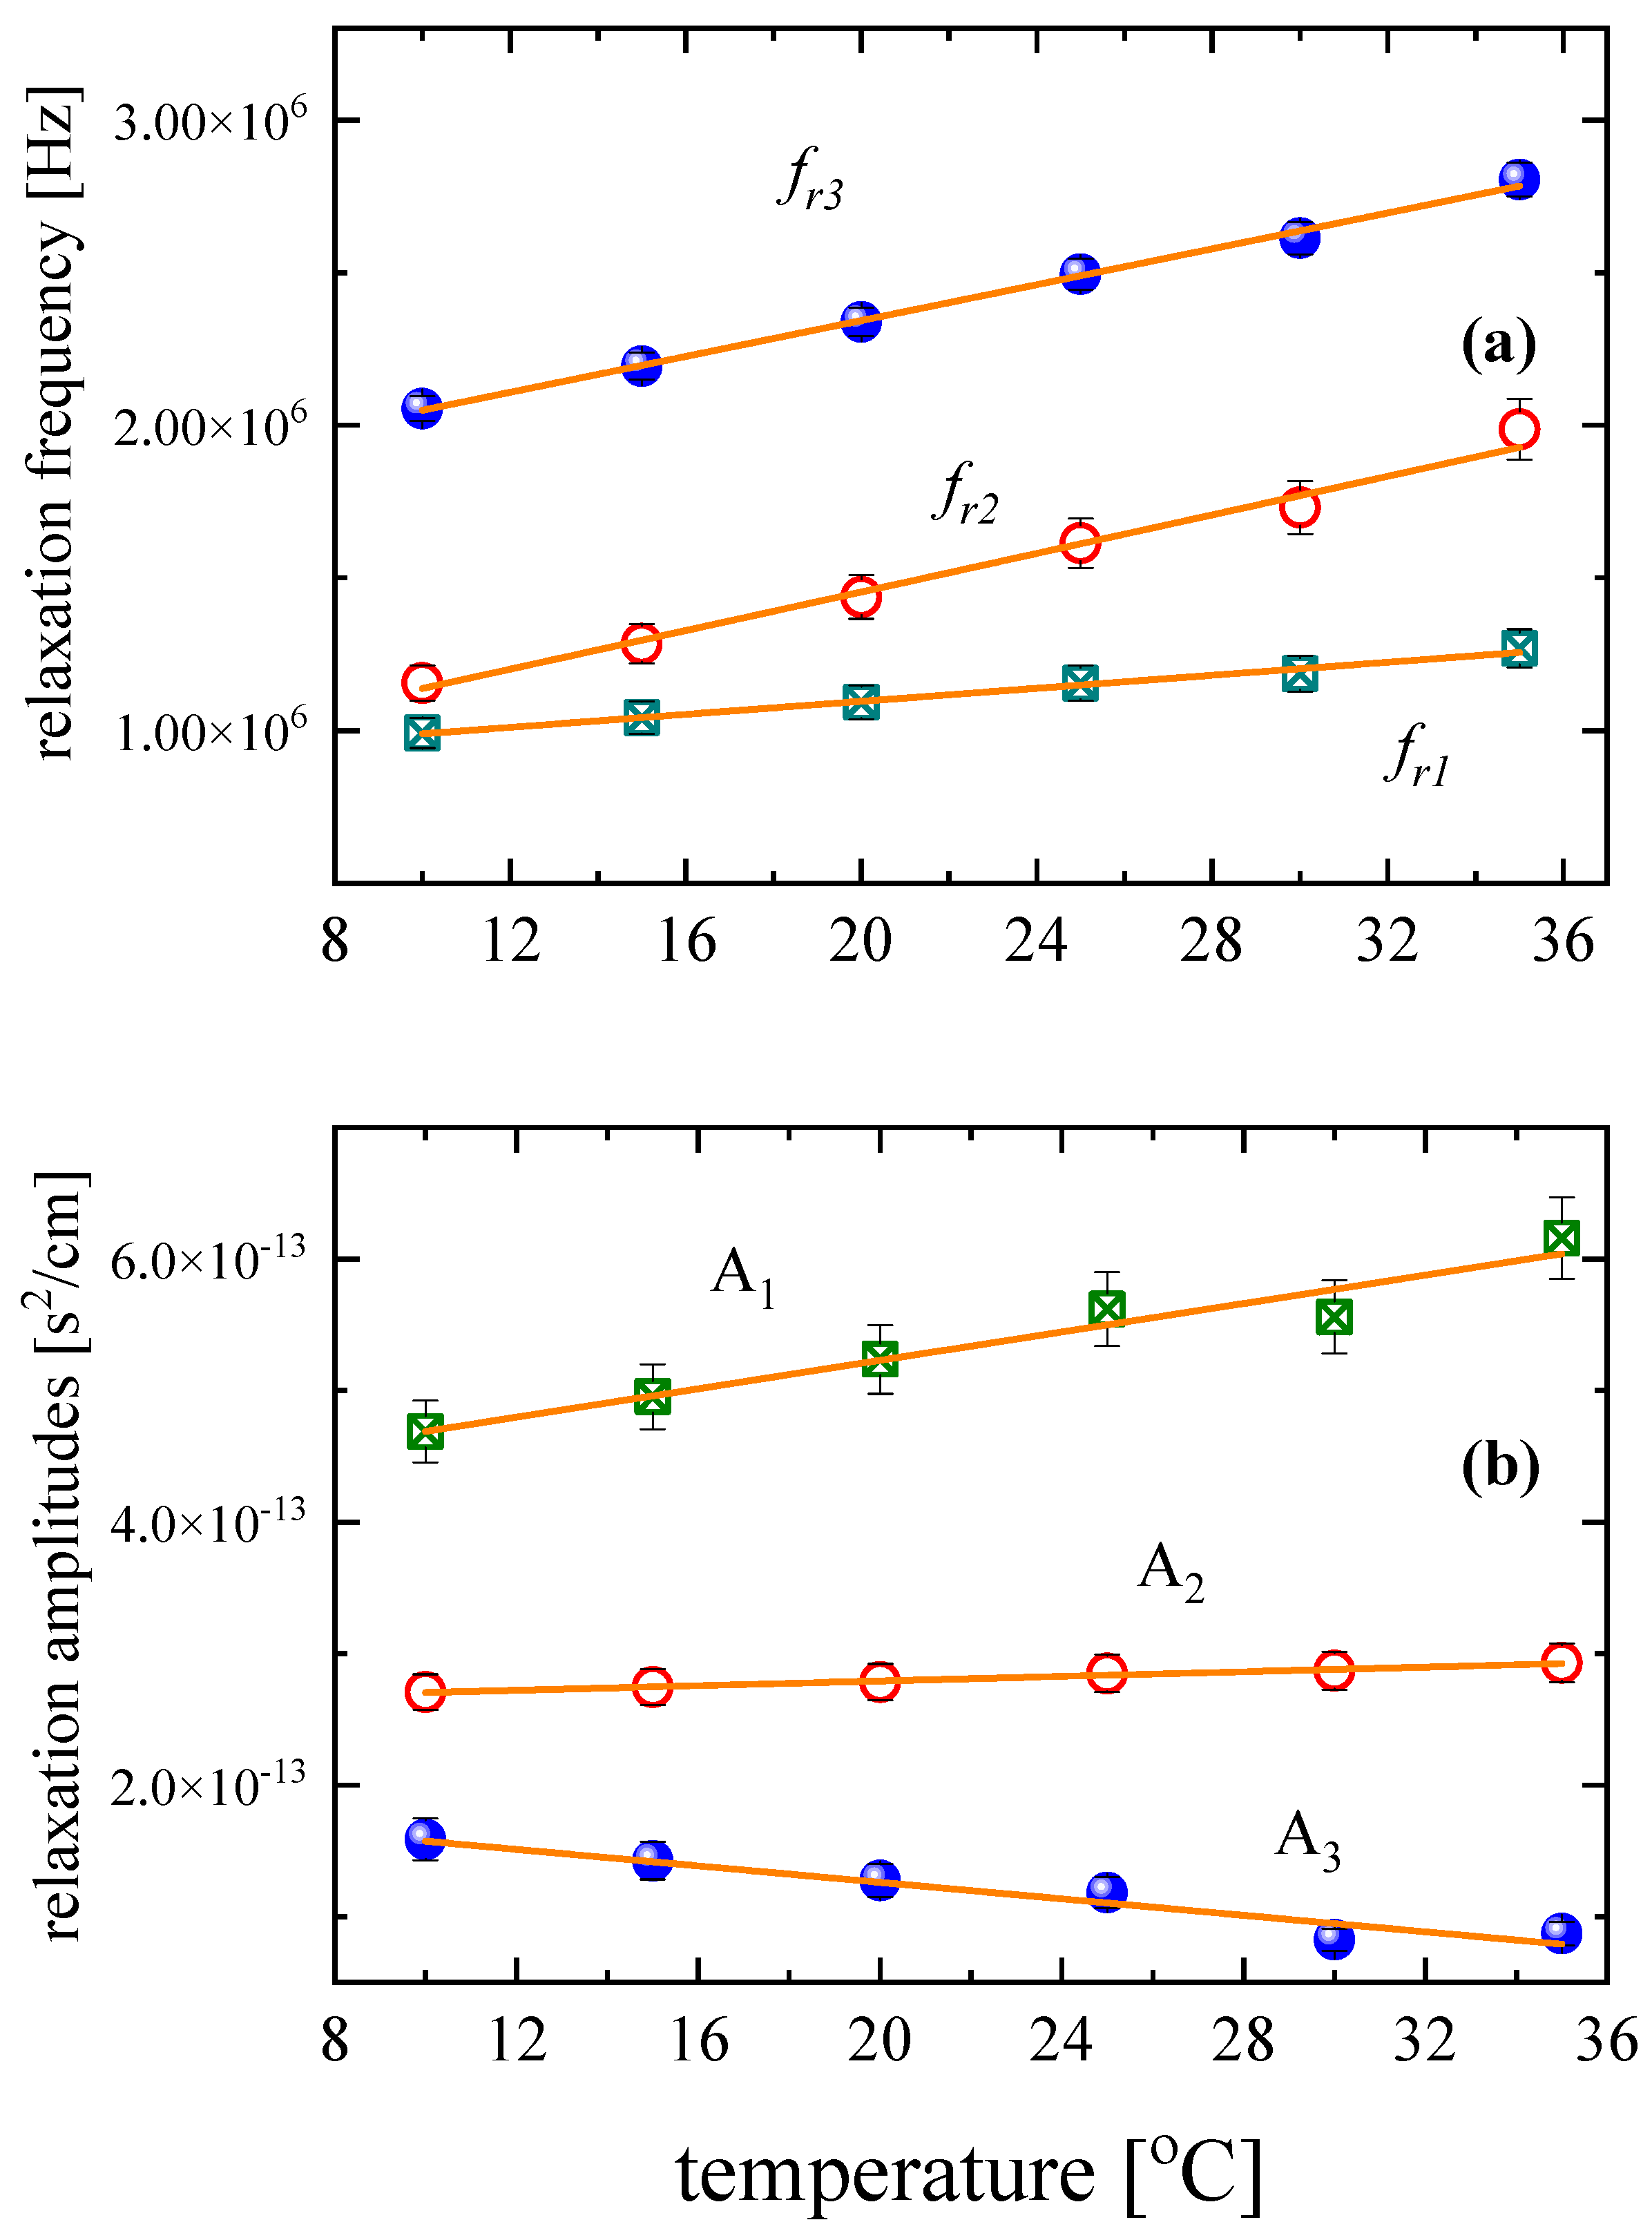
Figure 8.
Variation of as a function of reciprocal temperature for all relaxation processes.
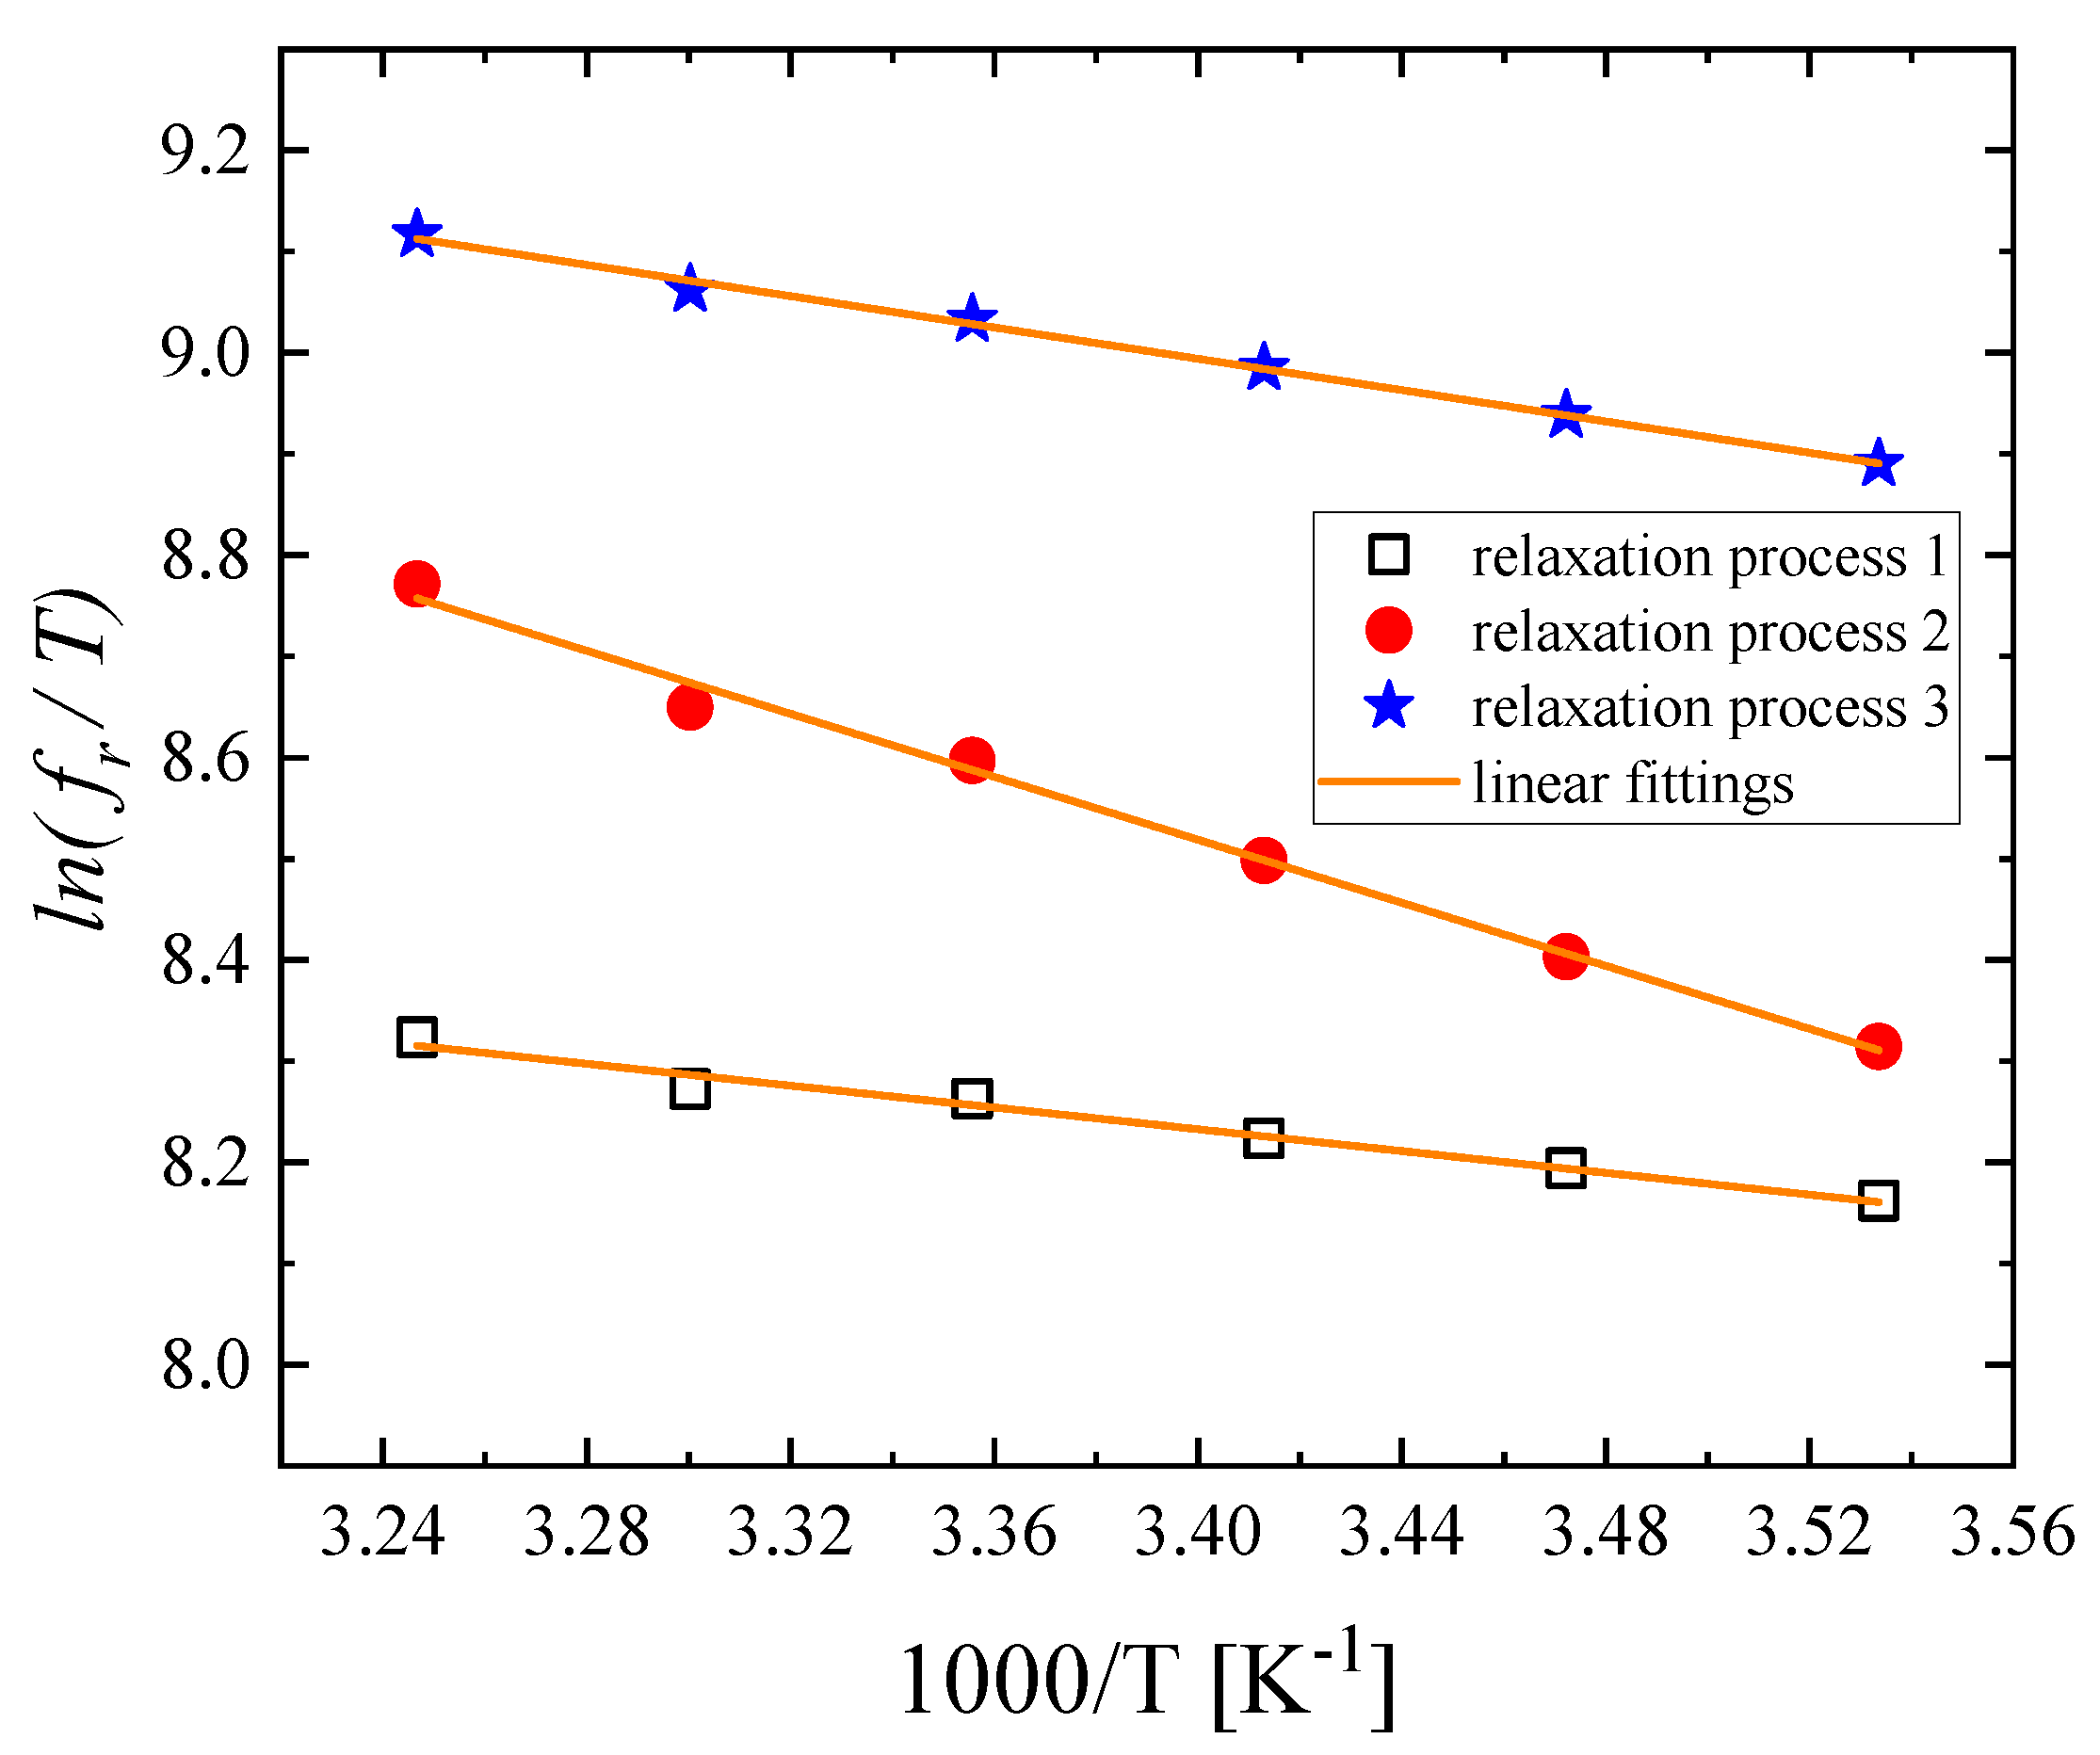
Figure 9.
Reciprocal temperature dependence of for the relaxation process attributed to conformational changes (process 1).
Figure 9.
Reciprocal temperature dependence of for the relaxation process attributed to conformational changes (process 1).
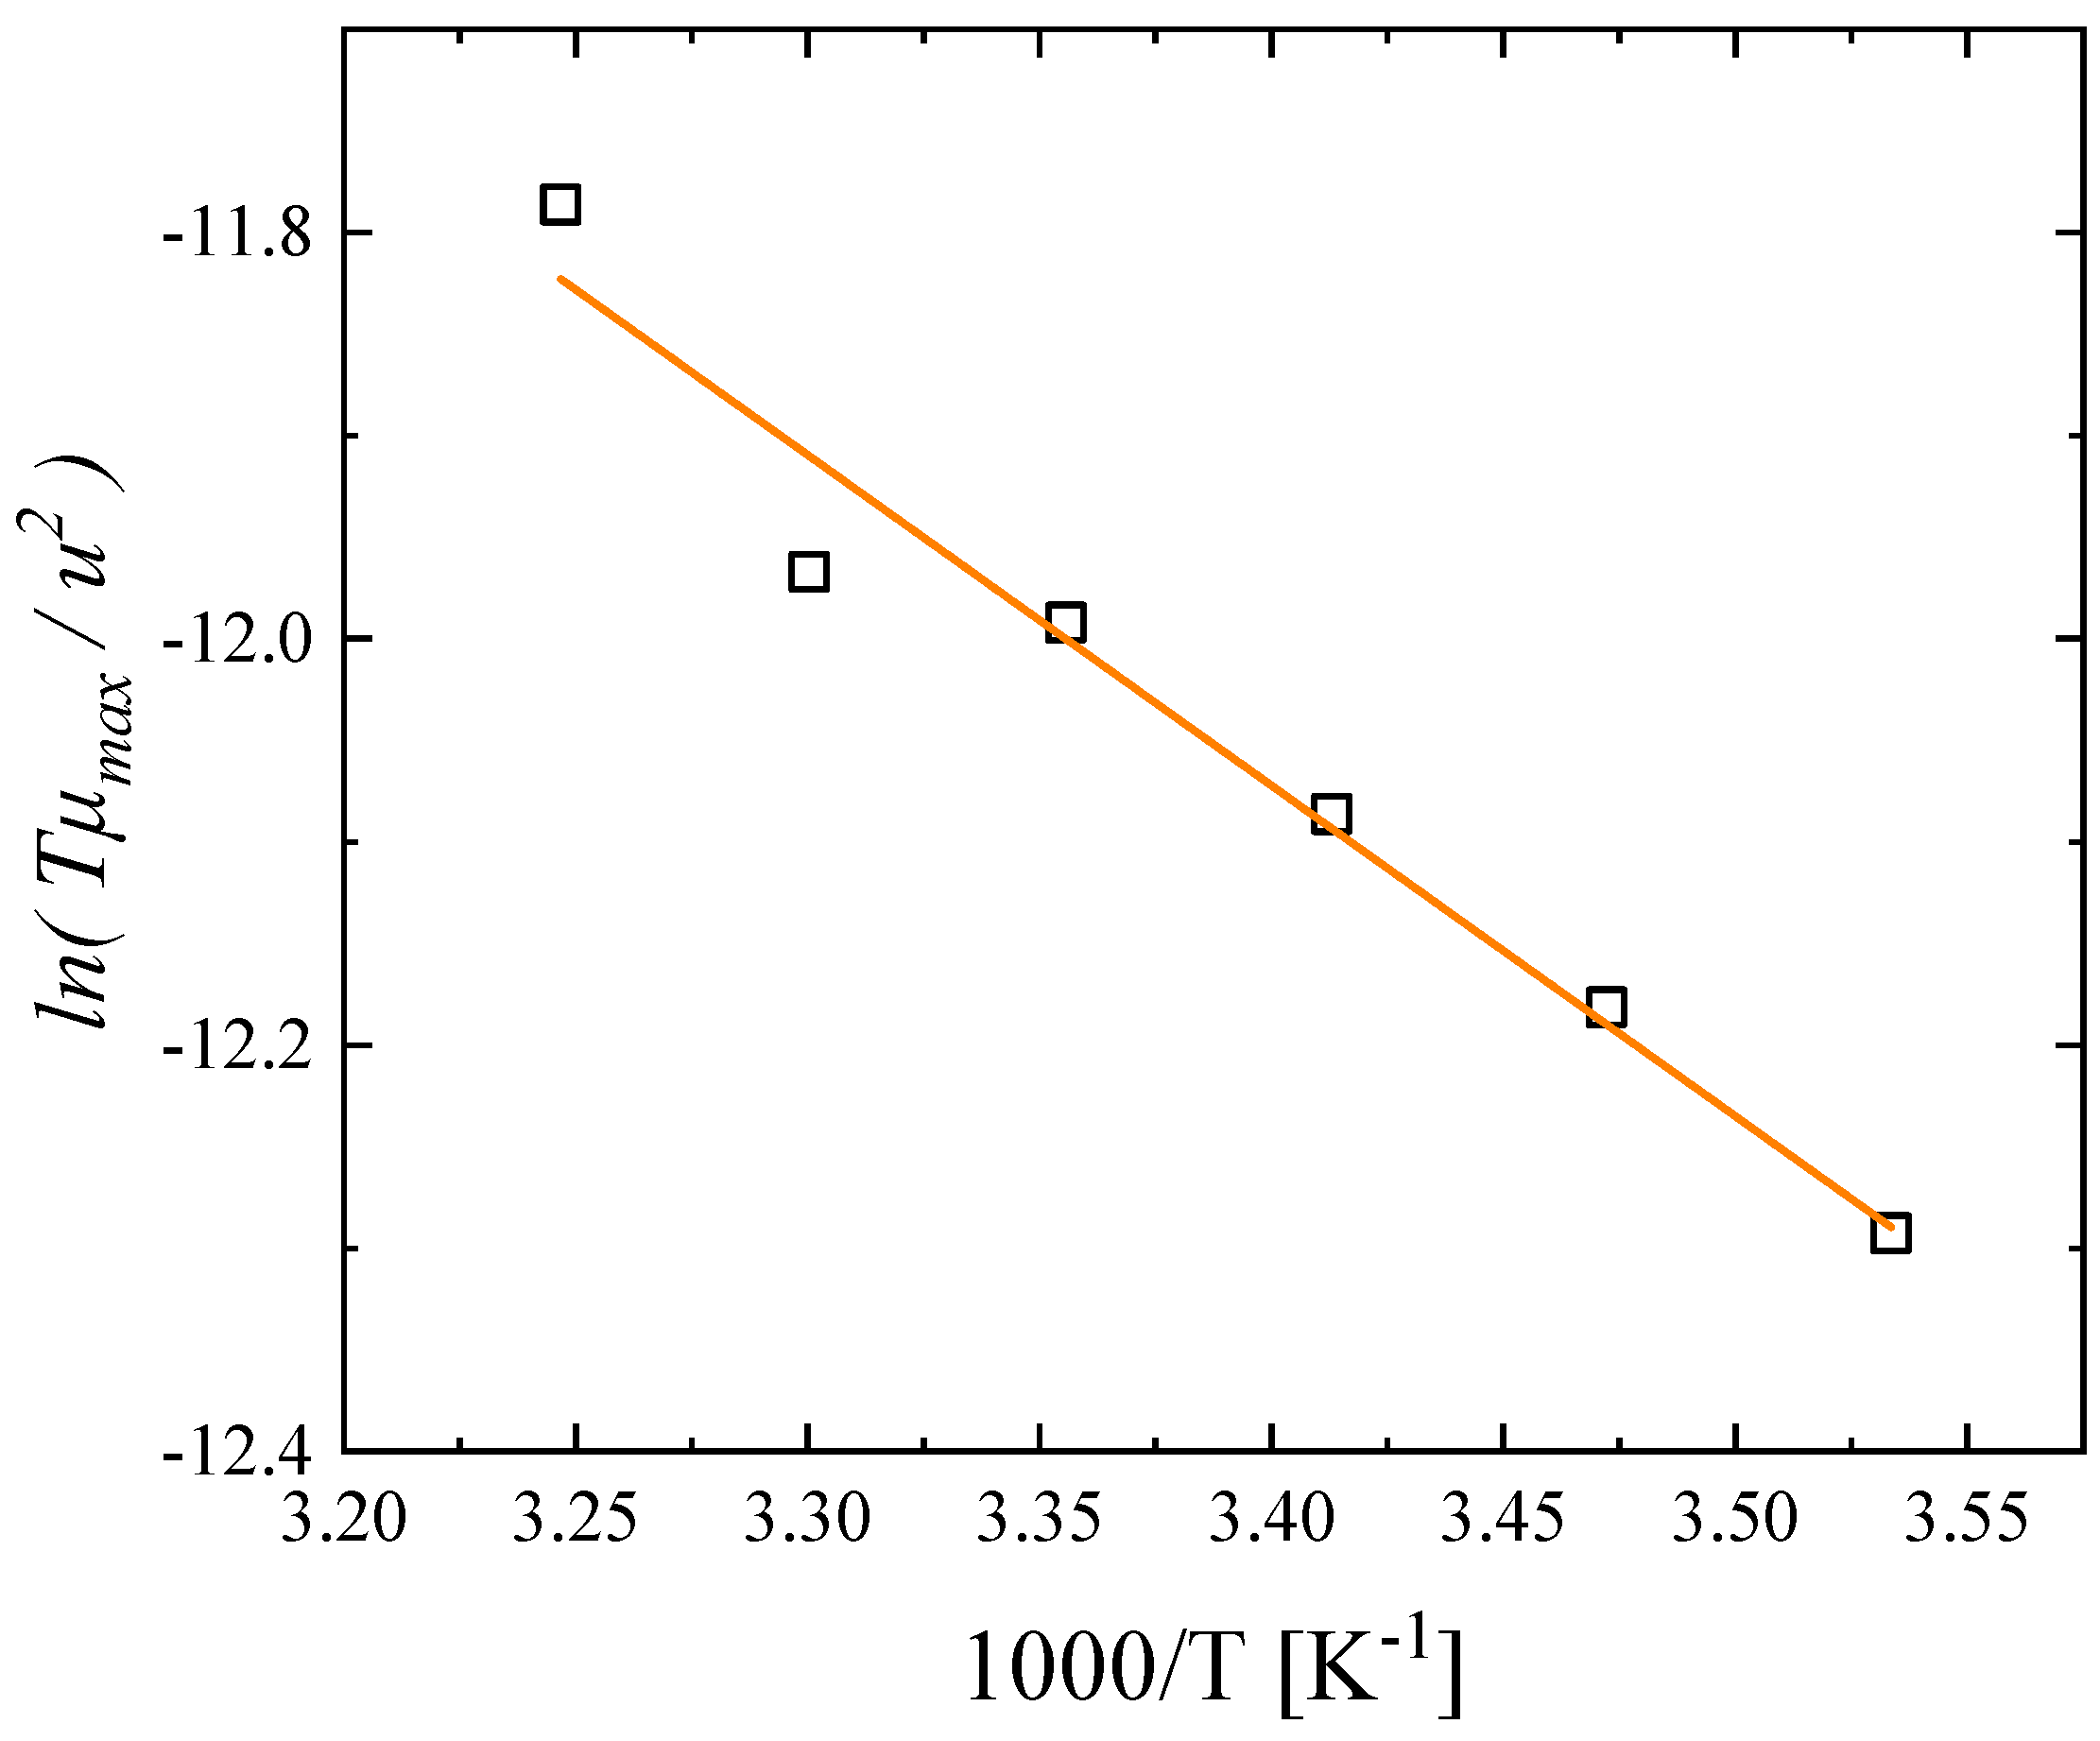
Figure 10.
Experimental IR absorbance spectra of aqueous GSH solutions with 3.2 and 6.76 % w/v. The calculated IR spectra of the GSH monomer, dimer, extended conformer, and folded conformer are also shown for direct comparison.
Figure 10.
Experimental IR absorbance spectra of aqueous GSH solutions with 3.2 and 6.76 % w/v. The calculated IR spectra of the GSH monomer, dimer, extended conformer, and folded conformer are also shown for direct comparison.
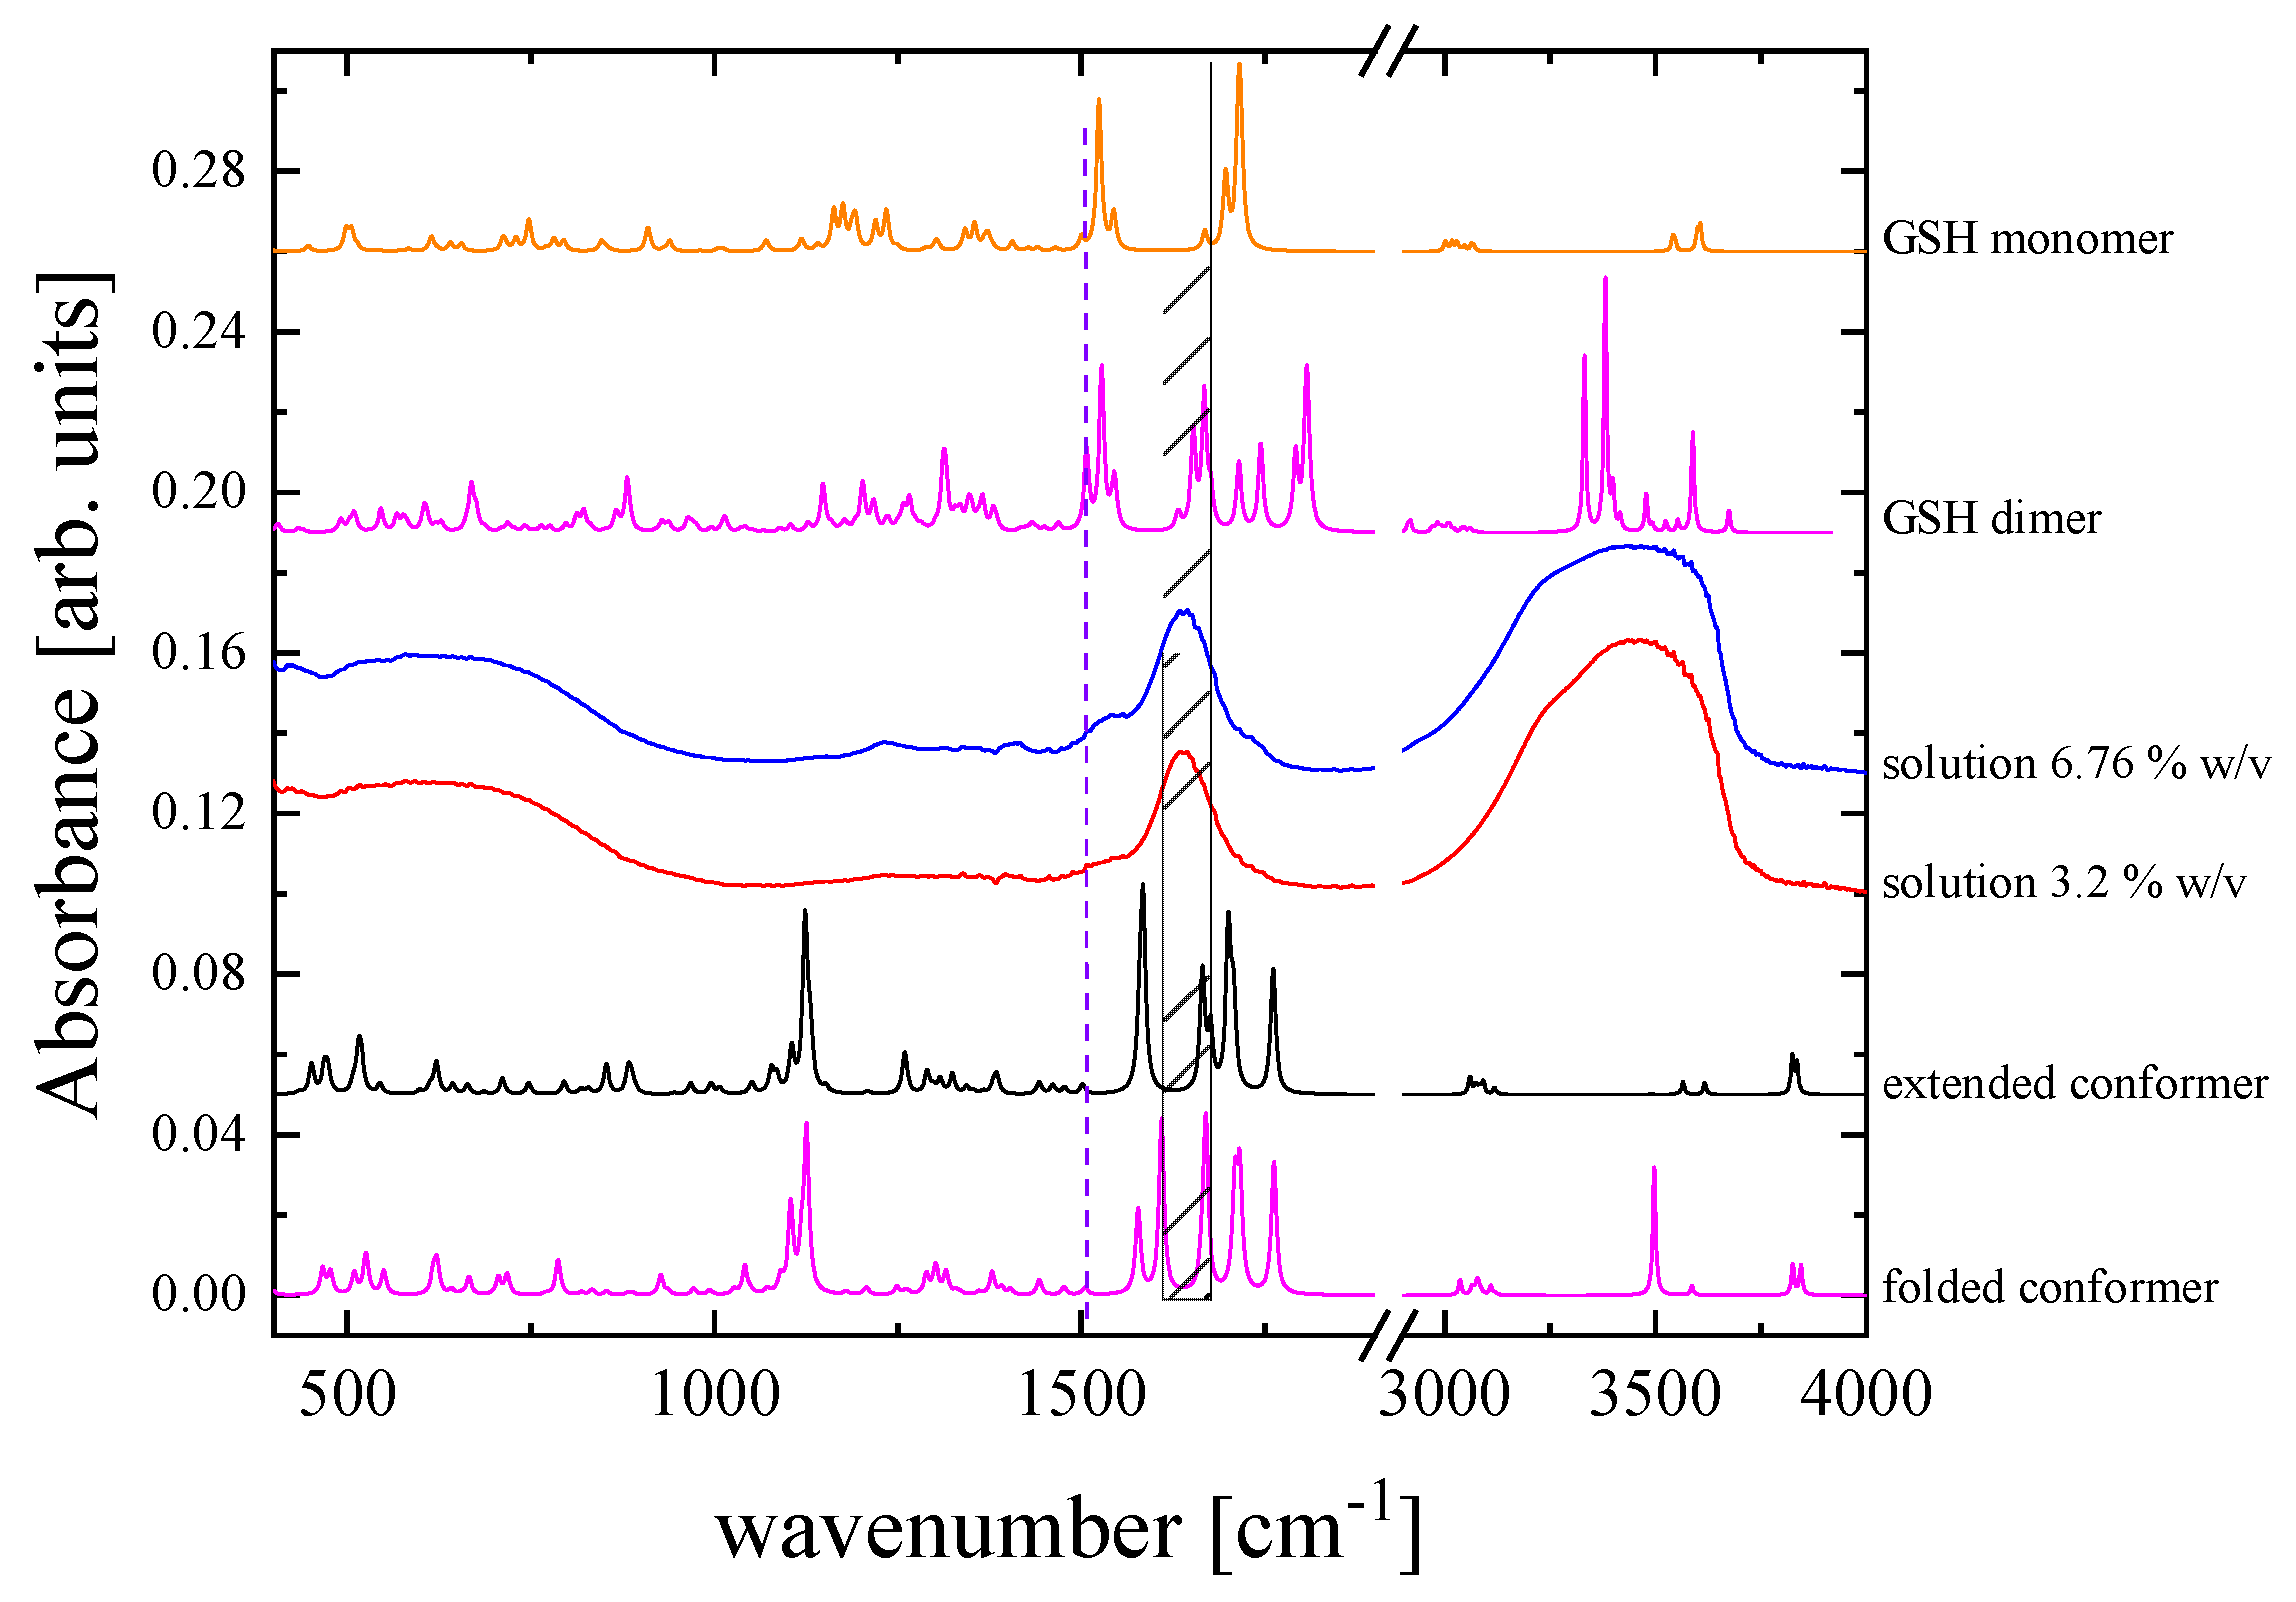
Figure 11.
(a) UV-Vis absorption spectra of GSH aqueous solutions at 20°C for all concentrations studied. Absorbance (b) and wavelength (c) corresponding to the maximum of the broad band as a function of concentration.
Figure 11.
(a) UV-Vis absorption spectra of GSH aqueous solutions at 20°C for all concentrations studied. Absorbance (b) and wavelength (c) corresponding to the maximum of the broad band as a function of concentration.
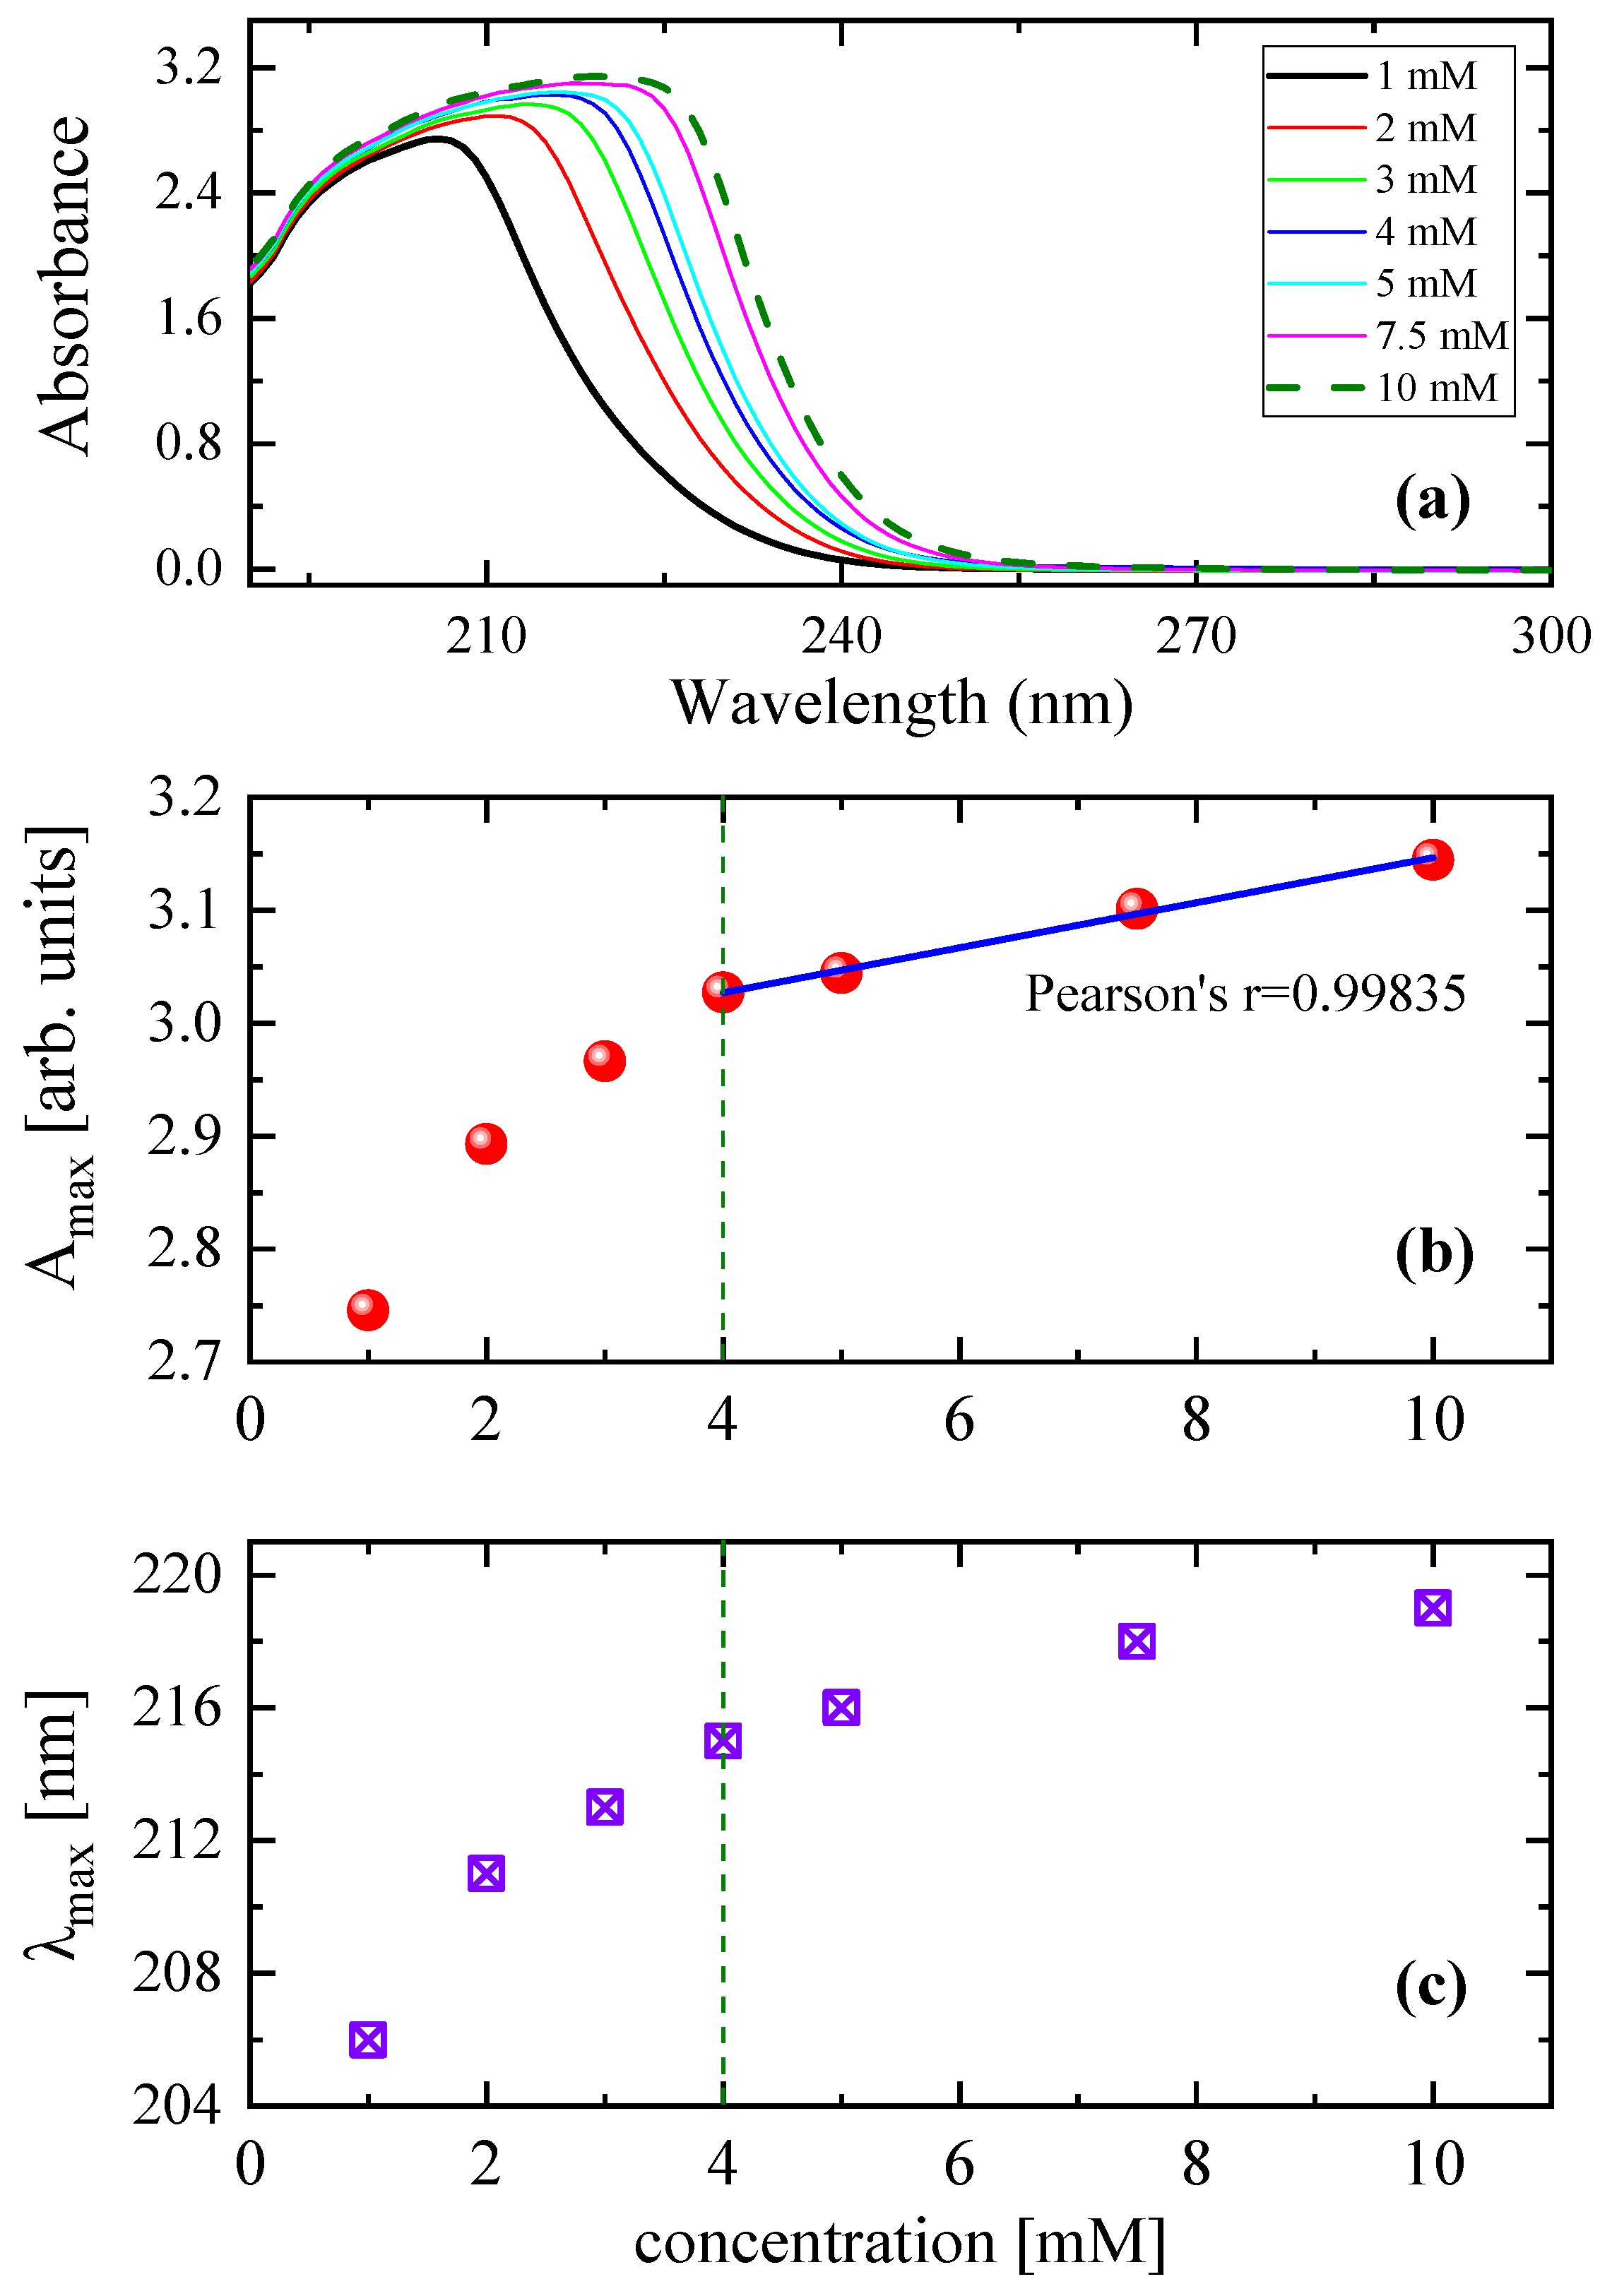

Table 1.
Relaxation parameters for all GSH solutions at 20°C.
|
c (mM) |
A1 (×10-13 s2/cm) |
fr1 (MHz) |
A2 (×10-13 s2/cm) |
fr2 (MHz) |
A3 (×10-13 s2/cm) |
fr3 (MHz) |
Β (×10-16 s2/cm) |
|---|---|---|---|---|---|---|---|
| 1 | 4.00 | 1.170 | 2.07 | 1.937 | 1.37 | 2.468 | 2.50 |
| 2 | 4.51 | 1.071 | 2.41 | 1.694 | 1.30 | 2.465 | 2.50 |
| 3 | 4.47 | 1.077 | 2.49 | 1.654 | 1.30 | 2.475 | 2.50 |
| 4 | 4.98 | 1.071 | 2.50 | 1.565 | 1.28 | 2.347 | 2.50 |
| 5 | 5.24 | 1.092 | 2.78 | 1.438 | 1.28 | 2.372 | 2.50 |
| 7.5 | 5.95 | 1.050 | 3.31 | 1.258 | 1.23 | 2.317 | 2.50 |
| 10 | 6.83 | 1.075 | 3.97 | 1.044 | 1.19 | 1.998 | 2.50 |
Table 2.
Relaxation parameters of GSH solution with concentration 5 mM for all temperatures studied.
Table 2.
Relaxation parameters of GSH solution with concentration 5 mM for all temperatures studied.
|
Τ ( oC) |
A1 (×10-13 s2/cm) |
fr1 (MHz) |
A2 (×10-13 s2/cm) |
fr2 (MHz) |
A3 (×10-13 s2/cm) |
fr3 (MHz) |
Β (×10-16 s2/cm) |
|---|---|---|---|---|---|---|---|
| 10 | 4.69 | 0.992 | 2.71 | 1.155 | 1.59 | 2.055 | 2.50 |
| 15 | 4.95 | 1.042 | 2.75 | 1.284 | 1.43 | 2.194 | 2.50 |
| 20 | 5.24 | 1.092 | 2.78 | 1.438 | 1.28 | 2.372 | 2.50 |
| 25 | 5.62 | 1.155 | 2.85 | 1.614 | 1.18 | 2.495 | 2.50 |
| 30 | 5.56 | 1.186 | 2.87 | 1.730 | 8.25 | 2.613 | 2.50 |
| 35 | 6.16 | 1.269 | 2.93 | 1.986 | 8.73 | 2.805 | 2.50 |
Table 3.
Relaxation parameters of GSH solution with concentration 5 mM for all temperatures studied.
Table 3.
Relaxation parameters of GSH solution with concentration 5 mM for all temperatures studied.
| Absorption Band Frequency (cm-1) | Assignment |
|---|---|
| 3250–3628 | –OH, NH, NH2 |
| 3020 | C–H |
| 2523 | –SH |
| 1712 | –C=O acid |
| 1598 | –C=O amide |
Disclaimer/Publisher’s Note: The statements, opinions and data contained in all publications are solely those of the individual author(s) and contributor(s) and not of MDPI and/or the editor(s). MDPI and/or the editor(s) disclaim responsibility for any injury to people or property resulting from any ideas, methods, instructions or products referred to in the content. |
© 2023 by the authors. Licensee MDPI, Basel, Switzerland. This article is an open access article distributed under the terms and conditions of the Creative Commons Attribution (CC BY) license (http://creativecommons.org/licenses/by/4.0/).
Copyright: This open access article is published under a Creative Commons CC BY 4.0 license, which permit the free download, distribution, and reuse, provided that the author and preprint are cited in any reuse.


