Preprint
Article

Mismatch Responses to Speech Contrasts in Preschoolers With and Without DLD

Altmetrics

Downloads

95

Views

43

Comments

0

A peer-reviewed article of this preprint also exists.

This version is not peer-reviewed

Submitted:

16 November 2023

Posted:

17 November 2023

You are already at the latest version

Alerts
Abstract
This study compared cortical responses to speech in preschoolers with typical language development (TLD) and Developmental Language Disorder (DLD), and in adults. We investigated whether top-down language effects modulate speech perception in an adult-like manner. We compared cortical mismatch responses (MMR) during passive perception of speech differing in linguistic complexity in three groups of participants: preschoolers with TLD (n=11), preschoolers with DLD (n=16) and adults (n=20). We also measured children’s phonological skills and investigated if they are associated with the cortical responses. MMR results indicated top-down language effects in adults, with enhanced cortical discrimination of lexical stimuli but not of non-words. In preschoolers, the TLD and DLD groups did not differ on the MMR measures and no top-down effects were detected. Moreover, we found no association between MMRs and phonological awareness skills, even though the DLD group’s phonological skills were significantly lower. Our findings suggest that top-down language modulations on speech discrimination may not be present during early childhood, and that children with DLD may not exhibit cortical speech perception deficits. The lack of association between phonological and MMR measures indicates that further research is needed to understand the link between language skills and cortical activity in preschoolers.
Keywords: 
Subject: Biology and Life Sciences  -   Neuroscience and Neurology

1. Introduction

Between the ages of three and six years, children can understand spoken language effortlessly. However, preschoolers do not perceive speech as efficiently as adults do, and there may also be differences between children of the same age who have different language skills, for example, children with typical language development (TLD) versus those with Developmental Language Disorder (DLD). DLD, previously referred to as Specific Language Impairment (SLI), affects around 7% of children and is characterised by a range of language deficits, especially in morphosyntactic and phonological processing, without an identifiable medical cause [1]. The underlying causes of DLD are still largely unknown but many studies suggest that children with language difficulties process speech differently to their typically developing peers [2, 3].
However, the neural mechanisms underlying speech processing in young children are not well understood. Despite plenty of behavioural and brain imaging research, we do not know yet what patterns of speech perception are typical at preschool age or if these patterns vary between children and adults or in children with TLD and DLD [4]. Understanding this is important because early childhood is a period of significant language growth, and spoken language perception is critical for children's later communication and literacy development. It is also during early childhood when many children with language disorders are first diagnosed, suggesting that some language symptoms could become more apparent at this age. Therefore, identifying neural patterns associated with typical and atypical speech processing could aid the development of objective clinical measures, fostering earlier detection and intervention in language disorders.
As for the role of speech perception deficits in DLD, different hypotheses have pointed out that specific problems with processing speech sounds could be an underlying marker of this disorder [5, 6]. However, there is no clarity about the nature of these difficulties. Some early theories of DLD state that low-level speech perception deficits are a hallmark of DLD. For example, difficulties in detecting rapid acoustic changes within speech sounds or extracting distinctive acoustic cues from the speech stream could lead to unstable phonological representations which then manifest as phonological deficits such as difficulties in repeating non-words (see [7] for a review). Other accounts have proposed that speech perception deficits in DLD could be a consequence and not a cause of language difficulties [8], where less efficient speech processing in DLD derives from limited language skills, and not vice versa. For example, poorer phonological processing skills in DLD than in TLD may affect children's ability to detect subtle acoustic changes in speech sounds but not in other sound contrasts [9]. Notably, several studies have failed to detect any evidence of atypical speech processing in DLD [10], suggesting that either these deficits do not exist or they cannot be detected with the current methods. So far, neurobiological findings are contradictory, making it difficult to identify any neural markers of speech perception deficits in DLD.
To investigate the processing of complex, rapidly changing acoustic signals in the brain, such as speech, the electroencephalogram (EEG) is an advantageous method because of its high temporal resolution. From the EEG, it is possible to extract event-related potential (ERP) components, such as the Mismatch Negativity (MMN), which has been extensively used across a wide range of ages and populations [11, 12], and the less-studied Late Discriminative Negativity (LDN). Unlike early auditory detection responses as the P50/P1/N1 components, the MMN and LDN reflect cortical sound discrimination, a process that occurs later in the brain, at fixed latencies (time-locked), after a change in auditory stimulation. In adults, the auditory MMN is a negative deflection of about 0.5-5 µV that occurs 100-250 ms after a discriminable change in any acoustic feature [12]. The LDN appears later (250-400 ms) and seems to be more pronounced in children than adults [13] and for auditory contrasts involving speech rather than non-speech sounds [14], for which some studies consider it a signature of sound processing complexity [15]. In infants and young children, the MMN and LDN may present an immature form, so mismatch response (MMR) is a generic term to refer to these responses deviating from the adult-like pattern [16]. Like the adult MMN/LDN, the MMR reflects the brain's sensitivity to physical and abstract changes ("deviants") in a sequence of regular sounds ("standards") as it occurs in many acoustic contrasts, including speech. The MMR/MMN/LDN can be elicited during unattended listening, making it a valuable measure when behavioural responses are not possible or less reliable as in young children or clinical groups [12].
In speech perception research, the MMR/MMN/LDN is used as a pre-attentive discrimination index of general auditory processing elicited by low-level, physical changes (i.e., in pitch, duration or intensity) but also of speech-specific processing elicited by changes in higher-level, abstract linguistic representations (e.g., phonemic categories, lexical status or word classes). Thus, the MMR/MMN/LDN do not only depend on bottom-up (afferent) processing of the speech acoustic features but are influenced in a top-down manner by psycholinguistic factors such as the listener's knowledge of phonological categories and structures, word's grammatical function, distributional frequency and meaning [17] Evidence from adults indicates that language-specific top-down mechanisms selectively facilitate the processing of speech [18], developing gradually during childhood from around the age of 7 years [19]. However, there is little evidence about how top-down modulations on speech perception operate at different language developmental stages or if they are impaired in children with language difficulties. Considering several studies indicating reduced or slower MMR/MMN/LDN in DLD (see [20] for a review), it is possible that the MMR/MMN/LDN response could serve as a neural marker of speech-specific difficulties in DLD.
One potential factor contributing to this gap in knowledge about the underlying nature and cause of DLD is the methodological complexity of conducting MMR research in young children (especially in clinical populations) and comparing groups of children and adults [21]. Children are less able to tolerate long, repetitive testing sessions and may become fuzzy, introducing movement-related artifacts in the EEG. There are also neuroanatomical differences between adults and children (e.g. in head size, skull and cortical thickness, cortical fibre density) that complicates a direct comparison of their ERP responses [22]. In general, adult's ERPs are intrinsically smaller and more consistent in timing than those of children, which are larger and much more variable [23]. Thus, when studying speech perception development across broad age ranges, it would be appropriate to complement conventional time-domain measures (e.g. amplitude and latency) with time-frequency measures (e.g. changes in spectral power or phase coherence over time). This would allow the measure of important cortical oscillatory activity that is not consistently time-locked to the stimulus and would be otherwise lost in the ERP averaging [24]. In the next sections, we will review what is known about the speech-elicited MMR/MMN/LDN patterns in young children with and without DLD and in adults, both in studies using conventional ERP measures and time-frequency analysis.

1.1. MMR/MMN/LDN in Speech Perception Development

Multiple studies have shown that the MMR changes from birth to adulthood, reflecting auditory and brain maturation [16, 25, 26]. Throughout development, the MMR can present a different polarity, latency, amplitude, and scalp distribution than the adult MMN/LDN. In infants and young children, the MMR polarity is usually reversed towards positive values [27], with some studies reporting positive MMRs until the age of 6-7 years [28, 29]. Others, however, report negative, MMN-like responses much earlier, i.e., in the first six months of life [30]. MMR scalp localisation is usually more broadly distributed in children than in the adult MMN/LDN, which is more focalised and shows maximal amplitude at frontocentral electrodes (e.g. Fz, Cz) [31, 32].
Regarding temporal patterns, the MMR latency correlates negatively with age during infancy and childhood, with delayed and longer responses in young children than adults [16, 23]. In infants between 7-11 months, MMRs have been reported with a latency of 250-500 ms [33]. At three years old, there is evidence of MMR peaking between 120-400 ms, whereas, for 5–8-year-olds, peak latencies occurred between 190 and 270 ms, a more adult-like range [28]. Shafer et al. [34] observed similar latencies using narrower age bands, with later and longer MMRs in 4–5- than 6–7-year-old children, whereas Bishop et al reported similar latencies in children (age: 7-12) and adolescents (age: 13-16 years), in both cases slower than in adults [13]. On the contrary, some studies indicate adult-like latencies much earlier, for example, in children between 6-13 years [35]. The MMR amplitude, however, seems not to follow a linear trajectory but a U-shaped curve during development [25]. Adult-like amplitudes are often observed in infants, with significantly smaller responses in early childhood (until around 7-8 years) until late childhood (12-13 years) followed by an increase in amplitudes until late adolescence (16-18 years). Paquette et al. [27] reported smaller MMRs in children (age: 3-13 years) than adults and in younger (age 3-7 years) than in older children (age 8-13 years). Bishop et al. [13] reported significant age-related increases in mean amplitude for the MMN time-window from childhood (children between 7-12 years) to adolescence (13-16 years) and from adolescence to adulthood (35-56 years) but amplitude decreases in the LDN time-window for the same age groups. Other studies, however, report that the MMR amplitude is slightly smaller in infants but as large as, or larger, in children above 6 years and in adults [36]. On the contrary, some studies indicate an amplitude reduction from early childhood to adult age. A longitudinal study by Chen, Tsao and Liu [37] in Mandarin speakers detected an MMR amplitude reduction from preschool (mean= 3.40 years) to school age (mean = 8.57 years) to adulthood (mean age = 22.4 years). In sum, despite the variability of findings, the MMR seems to become more stable with age, showing greater amplitude, shorter latency, and a more localised negativity until finally reaching the fully mature pattern during early adulthood (see [38] for a review).
Another aspect to consider is that, like the adult MMN/LDN, the children's MMR patterns reflect the acoustic and linguistic content (e.g., phonological, lexical, semantic information) in the speech input. Thus, there are differences in the MMR elicited by speech versus other non-speech sounds [13, 27, 35] and for speech involving different linguistic contrasts. For example, some studies have reported larger MMRs for speech (syllables) than for acoustically matched non-speech sounds in infants [38] and 6-year-old children [39]. However, in adults, some studies indicate the opposite: smaller MMN for speech stimuli than for their acoustically matched non-speech counterparts [40]. For speech stimuli, MMRs show different age-related trajectories for different linguistic features such as native versus non-native phonemic contrasts [41], word versus non-words or even distinctions between different word classes [42]. MMRs for non-native phonemic contrasts have been reported at the age of 7 months but disappearing by the age of 11 months, whereas the MMR for native phonemes becomes more robust during the same period [33]. For native phonemes, Finnish children at age three years show MMN-like responses in the 300-400 ms range for vowel contrasts [43] whereas French-speaking children at the same age show adult-like MMNs peaking at 270 ms for syllable (word?) initial consonant contrasts [27].
MMRs are also modulated by the linguistic context [42], for example, by the type of syllable or word in which speech sounds are presented. David et al. [14] investigated discrimination of syllables with different phonological complexity, reporting smaller MMN-like but larger LDN-like responses in children (age: 6-10 years) than adults for more complex syllables, but no difference between adults and children for less complex ones. Other studies report MMR enhancement when the deviant syllable occurs in a word compared to when it occurs in isolation or in a non-word, which has been linked to top-down lexical or semantic modulations. In 3-year-old children, Strotseva-Feinschmidt et al. [44] reported the effects of the word lexical frequency on the presence or absence of the MMRs for two German function words (articles der/den). They found that the high-frequency article der elicited an MMN-like and an LDN-like response. In contrast, the low-frequency den elicited only an LDN, suggesting easier processing of higher-frequency words. In adults, there is evidence of larger MMN for words than non-words, indicating an enhancement of the MMN amplitude by the stimulus lexical-semantic content [17, 45].
In children with DLD, cortical speech processing and its MMR signatures are less well understood, especially when compared with other neurodevelopmental disorders such as developmental dyslexia or autism [46]. Overall, compared to TD children, children with DLD show poorer and slower cortical discrimination of speech sounds, resulting in smaller MMN amplitudes, delayed latencies, atypical scalp distributions and less left hemisphere lateralisation than TLD children (for a review, see [20]). Furthermore, other MMN findings suggest that children with DLD have difficulties in processing the acoustic features of speech and in detecting phonemic contrasts in their native language [21, 29, 47]. However, other studies have reported no differences in MMR between children with DLD and typically developing children (see [21] for a review). For example, a magnetoencephalography (MEG) study by Pihko et al. [48] in children between 5–7 years compared MMRs for syllables with changing vowels or consonants and detected no differences between children with DLD and controls. Similarly, Bishop, Hardiman, and Barry [49] compared discrimination of phonemes with ‘small’ and ‘large’ differences between the standard and the deviants (e.g., standard /ba/ vs small deviant /da/ and large deviant /bi/) in children and teenagers with DLD and TLD aged 7-16 years. They reported no group differences for the MMN and LDN amplitude for large deviants, although LDN were reduced in the DLD group for the small deviants.
With regards to the debate concerning the underlying causes of DLD, several studies suggest a connection between the MMR/MMN/LDN and language skills, both in children with TLD and DLD. For example, studies in infants aged 7.5 to 24 months have reported a positive correlation between the MMR amplitude for native phonemic contrasts with behavioural phoneme discrimination measures [33, 50]. Furthermore, Linnavalli et al. [51] demonstrated that children (age 5-6 years) with better phoneme discrimination performance showed larger MMRs than those with poorer behavioural results. Similarly, a study in preschoolers (mean age: 5 years six months) by Norton et al. [52] found significantly larger MMRs in the late window (300-500 ms) for /ba/-/da/ contrasts in children with typical phonological awareness (PA) skills than in those with low PA skills. In 2-month-old infants at risk for DLD, Friederich et al. [53] found delayed MMRs for vowel deviants with different durations. Overall, findings indicate that the MMR amplitude correlates with language abilities in children with DLD, with weaker or slower MMRs associated with poorer language outcomes (see [20] for a review). More specifically, the evidence indicates reduced amplitude, particularly over the left scalp areas, and delayed latency in infants and children at familial risk for language deficits or with DLD diagnosis.
The MMR may also predict children's receptive language skills at later ages [5]. Guttorm et al. [54] found that the MMN measured in infants 1-6 days after birth with and without risk of developmental dyslexia predicted pre-reading language skills at age five years. Specifically, positive MMRs in the right hemisphere were associated with lower phonological, rapid naming and letter knowledge skills. However, other studies show no relationship between the MMR and behavioural language measures [55], especially at the individual level [10].
In sum, the evidence indicates that MMR patterns in children change as a function of age which suggests ongoing maturation of cortical speech processing until later childhood. In addition to this, there is also evidence for different developmental rates for different linguistic features at the cortex. Furthermore, the associations between MMRs to speech sounds and later language skills suggest that the MMR could be a valuable tool for predicting language outcomes in children with DLD.

1.2. MMR Time-Frequency Analysis and Speech Perception Development

Although time-frequency analysis (TF) is less popular than conventional ERP analysis in the MMN research field, it may help further our understanding of how speech perception develops in early childhood, and in clinical populations in particular. TF analysis measures non-stimulus-locked neural oscillatory activity that is abundant in children and cancelled out by the ERP technique [56]. Moreover, TF analysis increases the ERP signal-to-noise ratio (SNR) [57], which is an advantage when dealing with noisy data (as is often the case in children's EEG), making it more reliable than time-domain measures for MMR/MMN/LDN identification [55].
In adults, studies using TF analysis of the MMN have found increased neural synchronisation in the theta frequency range (4 to 7-8 Hz) for deviants vs. standard sounds, for example, during discrimination of sound duration contrasts. Fuentemilla et al. [58] found greater theta inter-trial phase coherence (ITPC) at temporal and frontal electrode sites and event-related spectral perturbation (ERSP) for deviant (1000 Hz, 25 ms duration) than standard (1000 Hz, 75 ms) tones at frontal electrodes. Similarly, two studies in adults by Hsiao and colleagues [59, 60] showed larger theta phase locking values (PLV) and spectral power for duration deviants (1000 Hz, 50 ms duration) than for standards (1000 Hz, 100 ms duration). Bishop at al., [13] reported no changes in ERSP power but a significant increase in theta ITPC during the MMN generation, which they considered an index of event-related oscillatory phase resetting. Although these findings indicate a role of increased theta ITPC in auditory deviance detection and the generation of the MMN [55], most of them were elicited by non-speech stimuli, so it is unclear whether they can be generalised to speech sound processing.
In paediatric research, the few studies using TF analysis of the MMN/MMR suggest a relationship between increased stimulus-induced phase synchronisation and developmental changes in auditory perception. A longitudinal study by Bishop et al. [61] showed that between the ages of 7 and 11 years, there was an increase in theta ITPC for tone deviants in frontal-central but not in temporal regions, indicating greater involvement of areas related to top-down modulations as children grow up. Studies by Müller et al. [62] and Poulsen et al. [63] reported that greater theta phase synchrony for deviants than standards was present in children and it increased from childhood to early adolescence, indicating more efficient sound detection. Bishop et al., [13] observed age-related increases in theta phase synchrony for deviant sounds, with the largest ITPC for adults (35-56 years) and larger for adolescents (13-16 years) than for children (7 -12 years). Together, these findings indicate that the maturation of the MMN neural substrates is accompanied by age-related increases in oscillatory synchronisation, mainly in the theta range and frontal cortical regions, suggesting more consistent neural responses and more involvement of areas involved in top-down processing.
Notably, some renowned infant studies using speech stimuli suggest that age-related increases in spectral power and ITPC in the delta, theta and gamma bands between the ages of 6 and 12 months may reflect selective enhancement and perceptual narrowing for native language phonemes [64, 65]. Moreover, in adults, theta synchronisation is thought to play a critical role in syllabic segmentation [66]. However, there is little research on the developmental trajectories of different theta band measures. So far, there is little information about how theta brain activity is related to the linguistic content of the speech stimuli or to the language skills in children with TLD and DLD.
Cortical oscillatory dynamics have been far less investigated in DLD than in other neurodevelopmental disorders such as developmental dyslexia or autism spectrum disorder (for a review, see [56]). However, there is some evidence indicating that atypical oscillatory activity may underlie language disorders [46]. Bishop et al. [49] compared cortical discrimination of tones and speech sounds in children (7 to 16 years old) with DLD and TLD, measuring low-frequency-band synchronisation in the MMN/LDN intervals. Even though they found no between-group differences in the MMN, the TLD (but not the DLD) group had a significant drop in power in the LDN versus the MMN interval for the low-frequency bands (delta, theta, and alpha). The authors suggested that this lack of event-related desynchronisation in the DLD group after the MMN indicates an inability to disengage neural activity after initially 'normal' auditory discrimination responses [49]. Two other studies by Heim et al. [67, 68] examined oscillatory dynamics during rapid auditory processing of tone pairs in children between 6-9 years with and without language disorders. In the language-impaired group, they found atypical early processing (45–75 ms) significantly reduced gamma (29-52 Hz range) amplitude and phase-locking values. The authors interpreted these findings as evidence of altered oscillatory timing in language-impaired children when processing rapid sequences of tones. Again, they used non-speech or simple speech stimuli, making it hard to draw conclusions about how the linguistic content of the stimuli might modulates the brain responses.
In conclusion, the MMR is a valuable tool for investigating the neural mechanisms underlying speech processing in children. In typically developing children, the MMR has an identifiable developmental trajectory and it indicates sensitivity to speech contrasts, positively correlating with later language development. In children with DLD, the MMR has shown reduced amplitudes and delayed latencies, suggesting difficulties in processing the acoustic features of speech sounds. However, only few studies have exploited the advantages of MMR time-frequency measures to characterise children's responses to speech sounds and for conducting comparisons between adults and children.

1.3. The Current Study

The purpose of this study was to compare cortical discrimination of speech with linguistic content of varying complexity in participants with different language skills: preschoolers with TLD (typical development status), preschoolers with DLD (atypical development status), and adults. Although some previous studies have compared similar groups, only a few have tested young children, and most have included relatively broad age ranges. Also, previous studies in children have usually focused on specific phonological contrasts or investigated word versus non-word processing, but, to our knowledge, none have examined how multiple linguistic levels (phonology, semantic content, and grammatical class of a word) modulate the MMR in the same study.
Therefore, we investigated if, during early childhood, cortical responses to speech are modulated by top-down language skills and if children with DLD show atypical MMR patterns to different types of linguistic stimuli. To compare top-down modulations on the MMR, we included linguistic stimuli of varying complexity (native versus non-native phonemes, words versus non-words, content versus function words) presented in the same experiment with a multifeature paradigm. This paradigm alternates several deviants against one standard, increasing the number of contrasts, without losing statistical power, which reduces the EEG testing time considerably (see, e.g., [69, 70]). To account for previous methodological limitations, we complemented conventional ERP measures (latency and amplitude) with time-frequency indices (ERSP and ITPC). Because previous literature has linked phonological awareness deficits to speech processing difficulties in DLD, we also assessed children's phonological skills and examined if they were associated with the MMR measures
Based on previous findings, we hypothesised that an MMR would be present in children for all speech contrasts. However, we expected the MMR patterns would vary between the TLD and DLD groups and between children and adults because of group-level differences in language skills and the interaction of top-down modulations with the linguistic content of the stimuli. Specifically, we predicted that cortical responses in the DLD group would be (1) more immature (e.g., positive instead of negative polarity of MMRs), (2) less robust (e.g., smaller amplitude and longer latency), and 3) less synchronised (e.g., reduced ERSP and ITPC) than in TLD children, and in children than adults. According to our earlier paradigm validation study in adults (Campos et al., in prep), we also expected that the TLD group, but not the DLD group, would show more robust and synchronised MMRs for stimuli with lexical content (words) than those involving only phonological contrasts (non-words). Finally, in both groups of children, we expected MMR measures to correlate with phonological awareness test performance.

2. Materials and Methods

2.1. Participants

Twenty-nine Spanish-speaking children between the ages 4.9 and 5.7 years were invited to the study. However, two children were excluded from the study due to non-compliance with the EEG procedure, leaving the final sample at 27 children. Participants were recruited in Santiago, Chile and divided in two groups according to their language status: a group with a previous diagnosis of expressive-receptive Developmental Language Disorder (DLD, n=16, 6 female, M age 5.2 years, SD= 0.33, range 4.9-5.7 years) and a group of age-matched controls with typical language development (TLD, n=11, 7 female, M age 5.2 years, SD= 0.23, range 4.10-5.6 years). To control for socioeconomic factors, we recruited all children from the same preschool in Santiago, Chile, from the special education (DLD group) and mainstream divisions (TLD controls).
Children in the DLD group were diagnosed at least one year before this study by a Speech and Language Therapist (SLT), as part of the initial assessment for preschool admission of children at-risk or with parental concern of language difficulties. The diagnosis was based on the Chilean legislation for Language Special Preschools, and is requested by a paediatrician, child neurologist or psychiatrist whenever a language disorder is suspected. The SLT assessment includes full parental interview and medical history, functional orofacial and hearing check, speech sound production screening, and three standardised language tests that assess language comprehension and production skills. Although the school assessment records were not available due to data protection restrictions, all children in the DLD group had a diagnosis of expressive-receptive DLD variant and met the following criteria: (i) being affected by language difficulties that significantly impair their day-to-day communication, (ii) exhibiting significant poor performance in the three aforementioned language tests (scores 2 SD below the age-expected norm), and (ii) not being affected by other concomitant neurodevelopmental disorder, health condition or environmental factor that explains the language deficit.
For the control group, children were invited to participate after screening that they were native monolingual Chilean Spanish-speakers, used Spanish as their first language at home and had no history of any neurodevelopmental disorders, learning, language, or hearing difficulties. For the DLD group, all children that met the criteria were invited via a letter to their parents. Children whose parents returned the signed consent form passed a hearing screening (otoscopy and pass/fail play audiometry at 500, 1000, 2000 and 4000 Hz) and were able to complete a non-verbal reasoning task (Block Design subtest of the Wechsler Intelligence Scale for Children, WISC [71] were invited to the study.
In addition, data from 20 native Chilean Spanish-speaking adults (12 female, age, M age 34.2 years, range 24.9-44.11 years SD= 4.8) from a previous validation study was included for age-related comparisons (Campos et al., in prep). Adult participants reported no significant medical history and were invited to participate after confirming that they met the following criteria: (i) pure tone average (PTA) air-conduction thresholds ≤20 dB for both ears at octave frequencies from 500-4000 Hz, or a threshold of ≤25 dB at any given frequency from 250-8000 Hz, and (ii) performing no more than 1 SD below the normative mean (M=50, SD=5) on the Block Design test of the Wechsler Abbreviated Scale of Intelligence (WASI) [72], a standardised measure of nonverbal IQ. Table 1 presents the screening information for both groups of children and for the reference adult group.
This study was conducted in accordance with the Declaration of Helsinki and approved by the Research Ethics Committees of University College London (UCL), and Universidad de Chile. In all cases, participants or their parents/guardians received an information sheet plus a verbal explanation of the study, completed a developmental questionnaire and signed a consent form before the screening phase. Children provided verbal assent before start testing. Parents received £10 for travel expenses and children received a small age-appropriated gift.

2.2. Stimuli

2.2.1. Phonological Awareness Task

We assessed participant’s phonological skills using the syllabic subsection of the Phonological Awareness Assessment Test, PECFO [73]. This test has been normed and standardised for Chilean children between 4 and 7.11 years. The syllabic subsection of this test measures six different phonological awareness (PA) skills: syllable segmentation, initial syllable recognition, rhyme recognition, initial syllable deletion, rhyme deletion and syllable inversion. Each task consisted of five items, with one point assigned for each correct item and a maximum score of 30 for the subsection.

2.2.2. ERP Experiment

The stimulus set consisted of five CVC monosyllables created according to the Spanish language phonotactic rules: one standard (288 in total) and four deviants (72 stimulus for each type, 288 deviants in total) with a total of 576 stimulus. Stimuli were recorded by a female native Chilean Spanish speaker in an acoustically shielded booth, at a 44.100 Hz sampling rate, in stereo channels. During pre-processing, we cut each stimulus from the recorded string defining their beginning/end to the nearest zero crossing. Stimulus duration ranged from 610 to 680 ms with a 15 ms ramp on/off segment. The intensity of all stimuli was normalised to the root-mean-square (RMS) at 66.7 dB.
The five stimuli are presented in Table 2. They consisted of one standard (St, a non-word with a native initial phoneme) and four deviants (D1 to D4) produced by changing the initial phoneme of the standard stimulus while keeping constant the vowel nucleus and the final consonant. These phonemic changes resulted in acoustic and phonological contrasts between the standard and deviant stimulus aiming to elicit the MMR but also involved different levels of linguistic processing: (i) phonological: native (D1) versus non-native (D2) phonemes in non-words (phonotactically allowed word forms without meaning), (ii) lexical: native non-words (D2) versus real words (D3+D4), and (iii) semantic: function (D3) versus content words (D4).
Stimuli were controlled as much as possible for acoustic and linguistic differences known to influence the MMR. According to Guardia [74], the initial phonemes were selected to maximize their similarity in terms of linguistic (e.g., syllable structure, word length/stress) and lexical factors (age of acquisition and oral frequency). Thus, the stimuli met the following criteria: (i) St and D2 are non-words with a Spanish native initial phoneme, (ii) D1 is a non-word with an initial phoneme that is non-native in Spanish, (iii) D3 is a function word in Chilean Spanish, (iv) D4 is a content word in Chilean Spanish, and (v) D3 and D4 are similar in their age of acquisition and oral frequency, and are acquired before the age of 4.6 years, according to Spanish lexical databases by Alonso et al. [75] and Corral et al. [76].
As illustrated in Table 2, “fus” (a non-word in Spanish) was selected as the standard (St) stimulus. To create deviant 1 (D1), the initial phoneme of the St was changed into /ʃ/, but the vowel and final consonant were preserved (/u/ and /s/, respectively), resulting in the non-word /ʃus/ (“shus”) which is non-native in Spanish. For deviant 2 (D2), the initial phoneme was changed into /x/, a native Spanish phoneme that produced the non-word /xus/ (“hus”). For deviant 3 (D3), the initial phoneme was /t/, resulting in the function word /tus/ (“tus”, meaning “yours”), and for deviant 4 (D4), the initial phoneme was /l/, producing the content (lexical) word /lus/ (“luz”, meaning “light”). Although a fricative onset consonant (in St, D1 and D2) and the /u/ vowel nucleus could make the stimulus less salient (because of greater noise and lower amplitude, respectively), only these CVC combinations met all the criteria for our experiment.

2.3. Procedure

To reduce data collection time we used a multifeature experiment, previously validated by our lab in a group of adults. Stimuli were delivered using MATLAB 2016a and a Fireface interface, presented free field at 60 dB via loudspeakers in front of the participants.
Stimuli were divided into four blocks of 3 min 20 seconds duration, with a total duration of around 15 minutes (including breaks). Each experimental block consisted of an initial habituation sequence of 10 standards, and a multi-feature sequence of 144 stimuli, as displayed in Figure 1. In the multi-feature sequence, the four deviants (12% of the trials each) were interspersed in a randomised order with the standard stimulus (50% of the trials). The inter-stimulus interval (ISI) was randomly jittered between 1100-1200 ms to avoid a rhythmic presentation.
Children were tested in three sessions, all conducted in separate days in Santiago, Chile. The first session took place at the children’s preschool after their parent/guardian signed the informed consent and answered a developmental questionnaire. Children who provided verbal assent underwent a hearing screening consistent in otoscopy and a play audiometry (pass/fail at 500-1000-2000-4000 Hz, 40 and 20 dB), and performed the Block Design task from the WASI [71].
The second session was conducted three months later in research facilities at Neurosistemas Lab, Universidad de Chile. Here, the EEG was recorded in a sound attenuated booth, with stereo stimuli presented free field at 70 dB through right and left loudspeakers at 90 cm in a 75 degree angle. During the experiment no response was required and children sat comfortably in an armchair with their parent next to them while watching a silent cartoon in a tablet screen, placed at eye level in front of them at a distance of 100 cm. Each EEG session lasted around 15 minutes (with breaks when needed) plus a set up time of 20 minutes. The final session was held three weeks later, again at Neurosystems Lab, University of Chile, and consisted of the phonological awareness task [72].

2.4. EEG Acquisition and Processing

Continuous EEG was recorded with a 32-channels Biosemi system, at a 2048 Hz sampling rate. Electrodes were positioned according to the 10-20 electrode system, with offsets kept under 30 µV. Vertical and horizontal electrooculogram were recorded in the right supraorbital area and right eye canthus, respectively. The EEG was preprocessed with EEGLab [77] and ERPLab [78].
EEG data were downsampled to 500 Hz and re-referenced off-line to the full head average. A high-pass IIR Butterworth filter (non-causal, zero-phase shift, 2nd order) with cut-offs of 0.1Hz (roll-off 12 dB/octave attenuation, half amplitude -6dB, half-power -3dB), was applied to the continuous EEG remove slow drifts [79] An initial threshold of 350 µV was applied to remove data portions with excessively large artifacts. To retain as much data as possible, we visually inspected each dataset and removed noise-contaminated data portions and channels. Then, we performed ICA to remove blinks, eye movements and other artifacts. After data cleaning, we interpolated the removed channels and re-referenced the data to the full head average. Then, separate pipelines were applied for the ERP and time-frequency analysis.
For ERP analysis, epochs were defined from -200 to 800 ms, with baseline correction between -200 to 0 ms. In total, 619 epochs of 1000 ms duration were extracted per participant. Epochs with artifacts exceeding an absolute threshold of 200 µV were excluded. We quantified EEG noise level as the percentage of epochs rejected per participant for each stimulus type and condition, with an individual maximum artifact rejection criterion of 35% of the trials per stimulus type and a minimum of 44 trials per deviant condition. All ERP statistical analysis were performed in the subtracted difference waveforms (DW, deviant minus standard), using Mass Univariate Analysis [80], peak-centred mean amplitude and peak latency as measures, calculated in two time windows: TW1 (100-250 ms) and TW2 (250-400 ms). Importantly, no participants were excluded on any of the groups as all datasets were below the rejection threshold after data cleaning and artifact correction.
Time-frequency analysis was performed with Fieldtrip [81] in the parent waves for each standard and deviant type, following previous literature (e.g., [82]). We used Morlet wavelets for spectral decomposition of each trial into 19 log-spaced frequencies, from 2 to 45 Hz. Morlet wavelets parameters were defined according to previous literature (e.g., [57]), using 3 cycles at the lowest, and 14 at the highest frequency (0.8 cycles increase), and a window length of 1670 ms . To avoid edge artifacts, non-overlapping epochs of 3000 ms duration were defined between -1000 to 2000 ms for each trial, and then averaged across deviant types for each participant. Baseline correction was applied from -500 to -200 ms to avoid spectral leakage from the following epoch in the low frequencies. Running the decomposition trial by trial allowed us to obtain induced activity and avoid cancelling out responses that were not time-locked. As time-frequency analysis is sensitive to differences in the number of trials per condition [57] we found the participant with the minimum number of trials for a given condition (60 trials) and matched this number in all other participants and conditions by randomly selecting 60 trials from each participant’s pool.
The brain’s oscillatory synchrony in a given frequency band was examined through two time-frequency measures: ERSP and ITPC. ERSP quantified how much energy did the signal had for each frequency at each time point and was measured as power change relative to the -500 to -200 baseline (in dB), averaged across conditions for each group [57]. ITPC was calculated as an index between 0 and 1, and reflected how consistently the oscillations reach the same point in the cycle across stimulus types.

2.5. Statistical Analysis

This study considered a between-subject design, for comparing speech processing under different language status; typically developing, atypically developing and adult-like. The between-subjects factor (IV) was different language status (operationalised as ‘Group’), with three levels; TLD children, DLD children, and adults. Our EEG dependent variable (DV) was cortical responses to speech, operationalised as ERP (peak latency, in ms and mean amplitude, in µV) and time-frequency measures (ERSP, in dB power and ITC, in a 0-1 range). At the behavioural level, the DV consisted of the phonological awareness scores for the syllabic awareness test subsection.
Statistical analyses were conducted with MATLAB and SPSS v26-29. For the ERP analysis, we identified significant MMRs in the TLD and DLD groups using Mass Univariate Analysis (MUA [80]; successive point-by-point t-tests with FDR control [83]) in a broad time window between 100 and 500 ms. Then, we ran between-groups comparisons of peak-centred mean amplitude in an early (TW1, 100-250) and late (TW2, 250-400) windows, for the children and adult groups.
For TF analysis, we wanted to avoid bias when selecting the time windows for ERSP and ITPC. Thus, we determined regions of interest (ROI) for the theta and alpha bands in a way that was blind to the stimulus type, by averaging together the responses for all stimulus type for each group (Figure 3.1). We compared ERSP and ITPC between participant groups and using separate mixed repeated measures ANOVA for each ROI, with Bonferroni correction for multiple comparisons. Effects sizes were measured with eta squared (η2) and partial eta squared (ηp2), considering large effect≥ 0.14; medium effects ≥ 0.06; small effects ≥ 0.01, and Cohen’s d (large effect = 0.8; medium effect= 0.5; small effect= 0.2), when corresponding.

3. Results

3.1. Behavioural Results

After confirming data normality, independent-samples t-tests revealed that the DLD group (M=14.57, SD=4.67) showed significantly lower scores than the TLD group (M=20.87, SD=5.86) for the phonological awareness test [t(19)=2.778, p= .012,] with a large effect size, d=1.23.

3.2. EEG Results

3.2.1. ERP Analysis of MMRs

Characteristics of the ERP responses
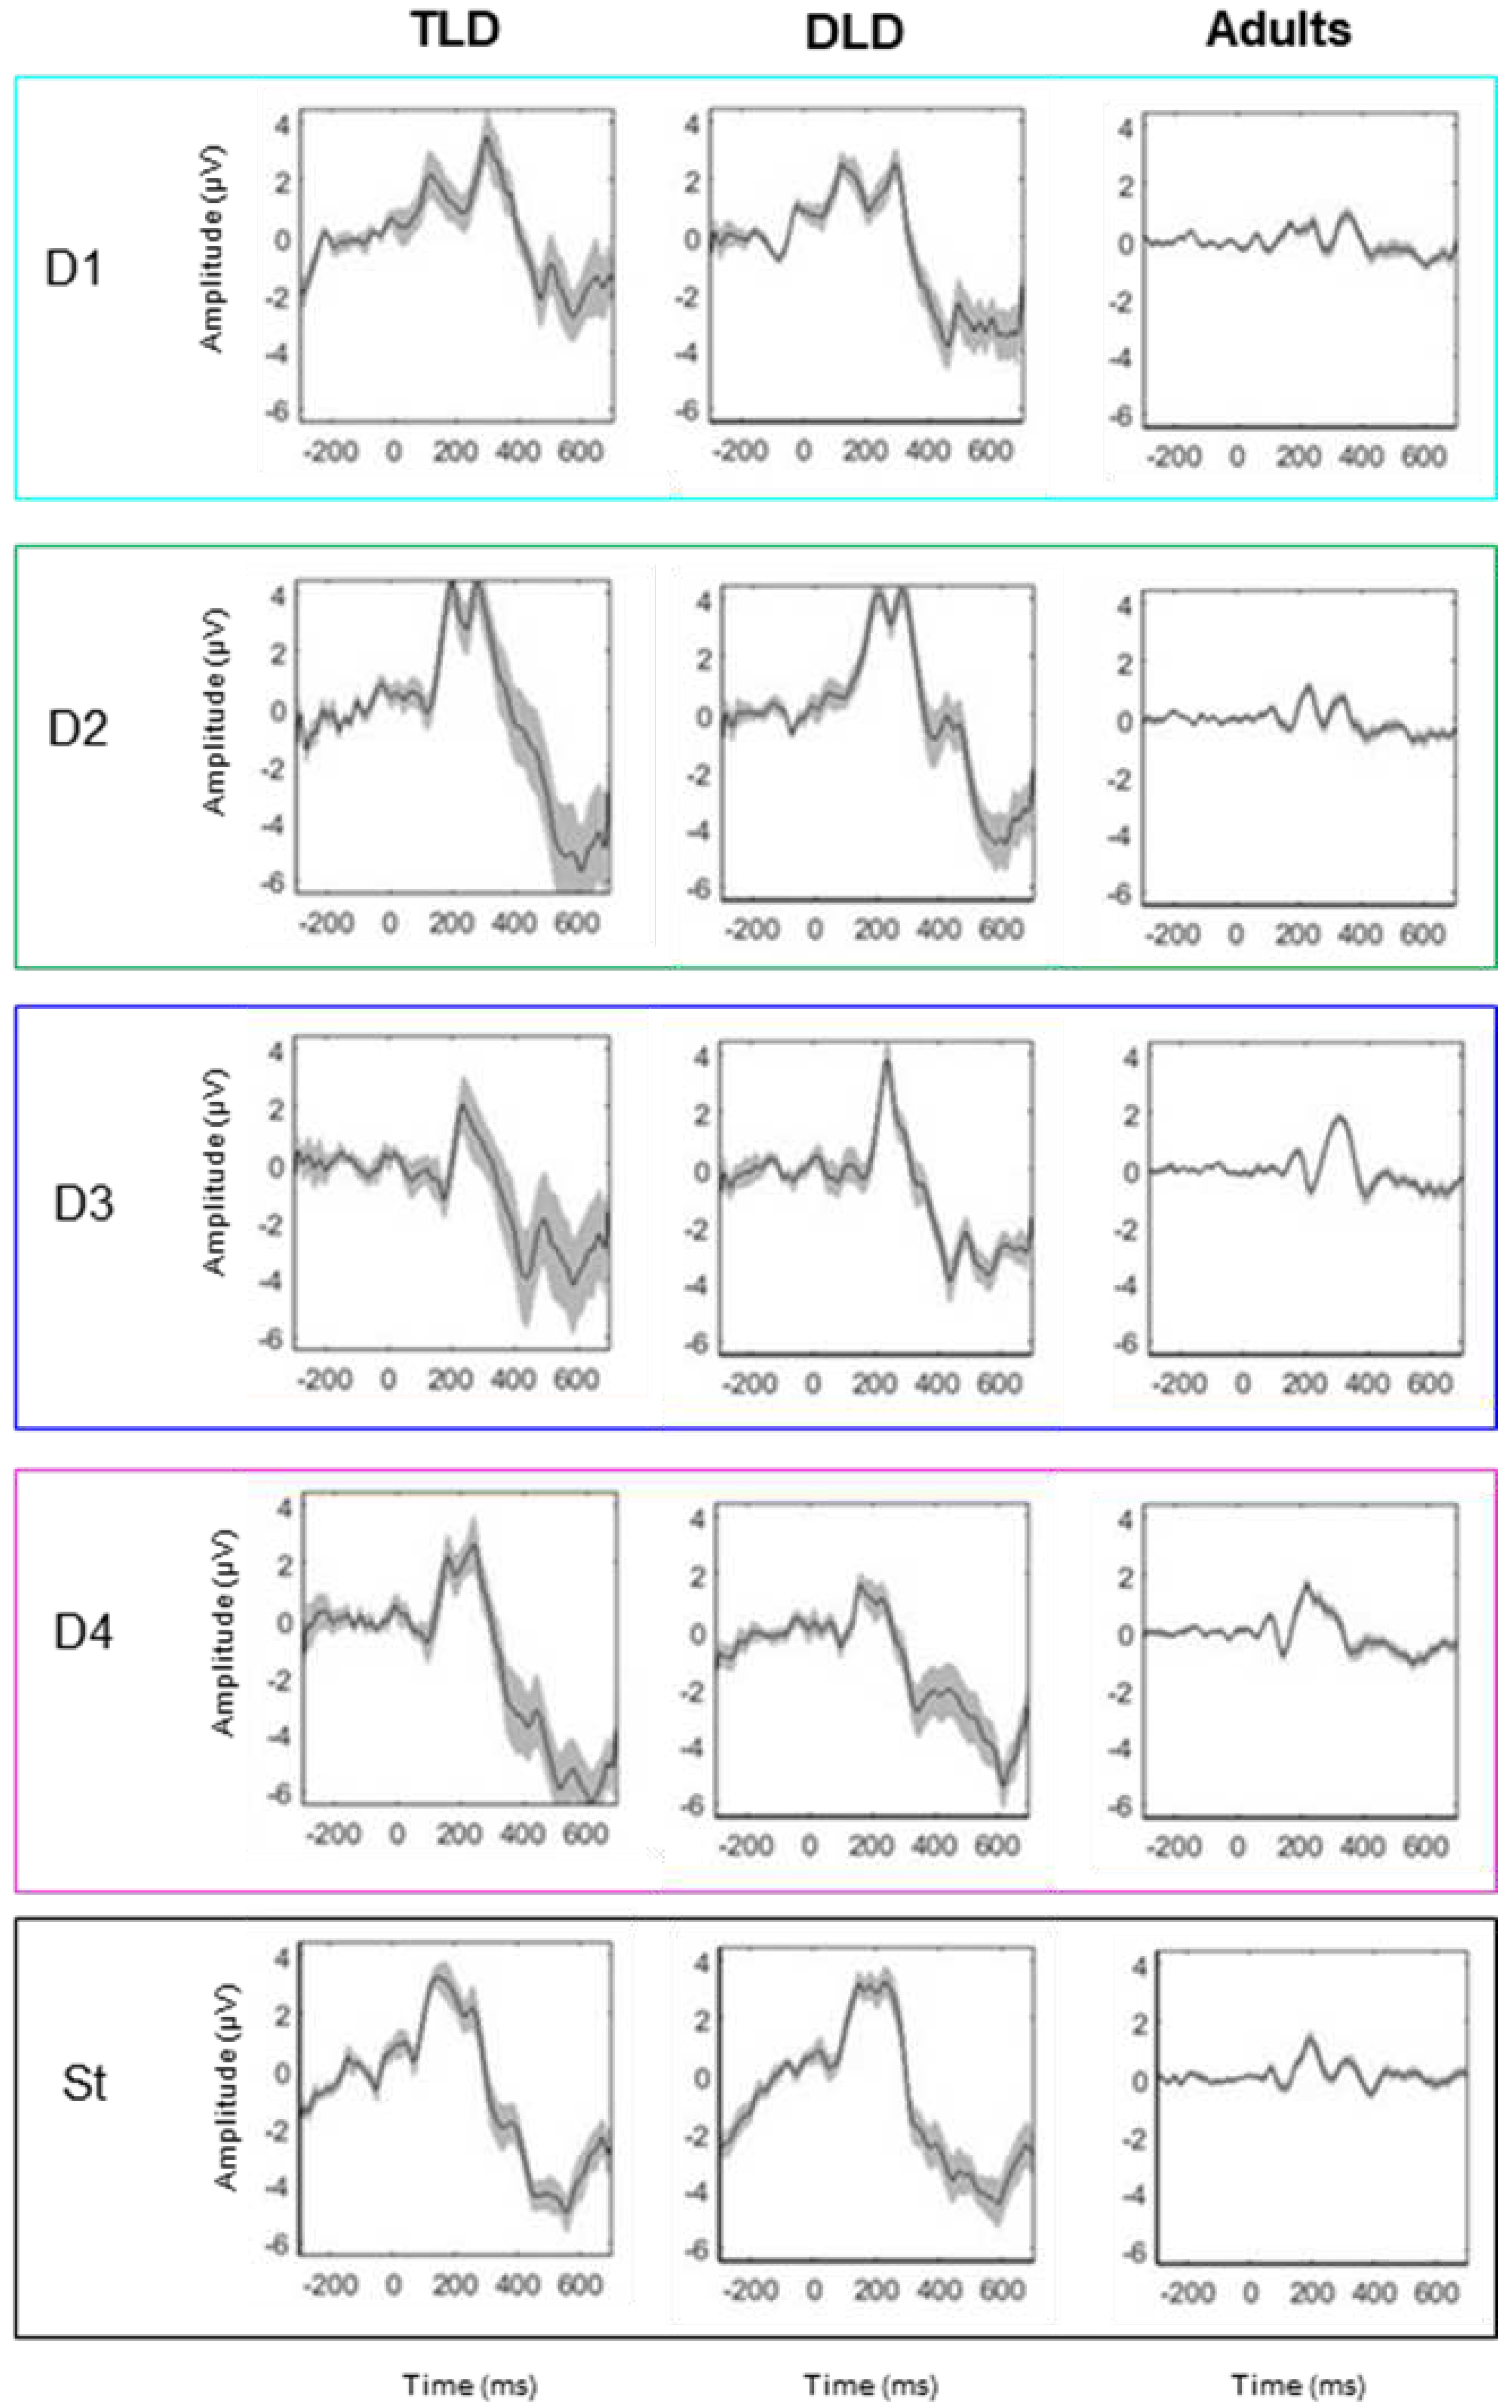
ERP grand average waveforms were computed at Fz for all stimulus types, in consistency with previous literature and with our validation study in adults that showed maximal effect at this electrode using this experiment. Visual inspection of the grand average waveforms (see Figure 2) indicates presence of obligatory auditory responses in all groups for all the stimulus types, with clear positive peaks around 200 and 300 ms, and negative responses before 200 and after 400 ms.
However, Figure 2 shows considerably greater ERP amplitude and standard error in the DLD and TLD groups than in adults, with larger and more variable deflections in children. This indicates that ERP patterns are similar in both groups of children, regardless their language status. On the contrary, there are differences between children and adults in terms of the magnitude, polarity, timing and variability of the responses (Figure 2).
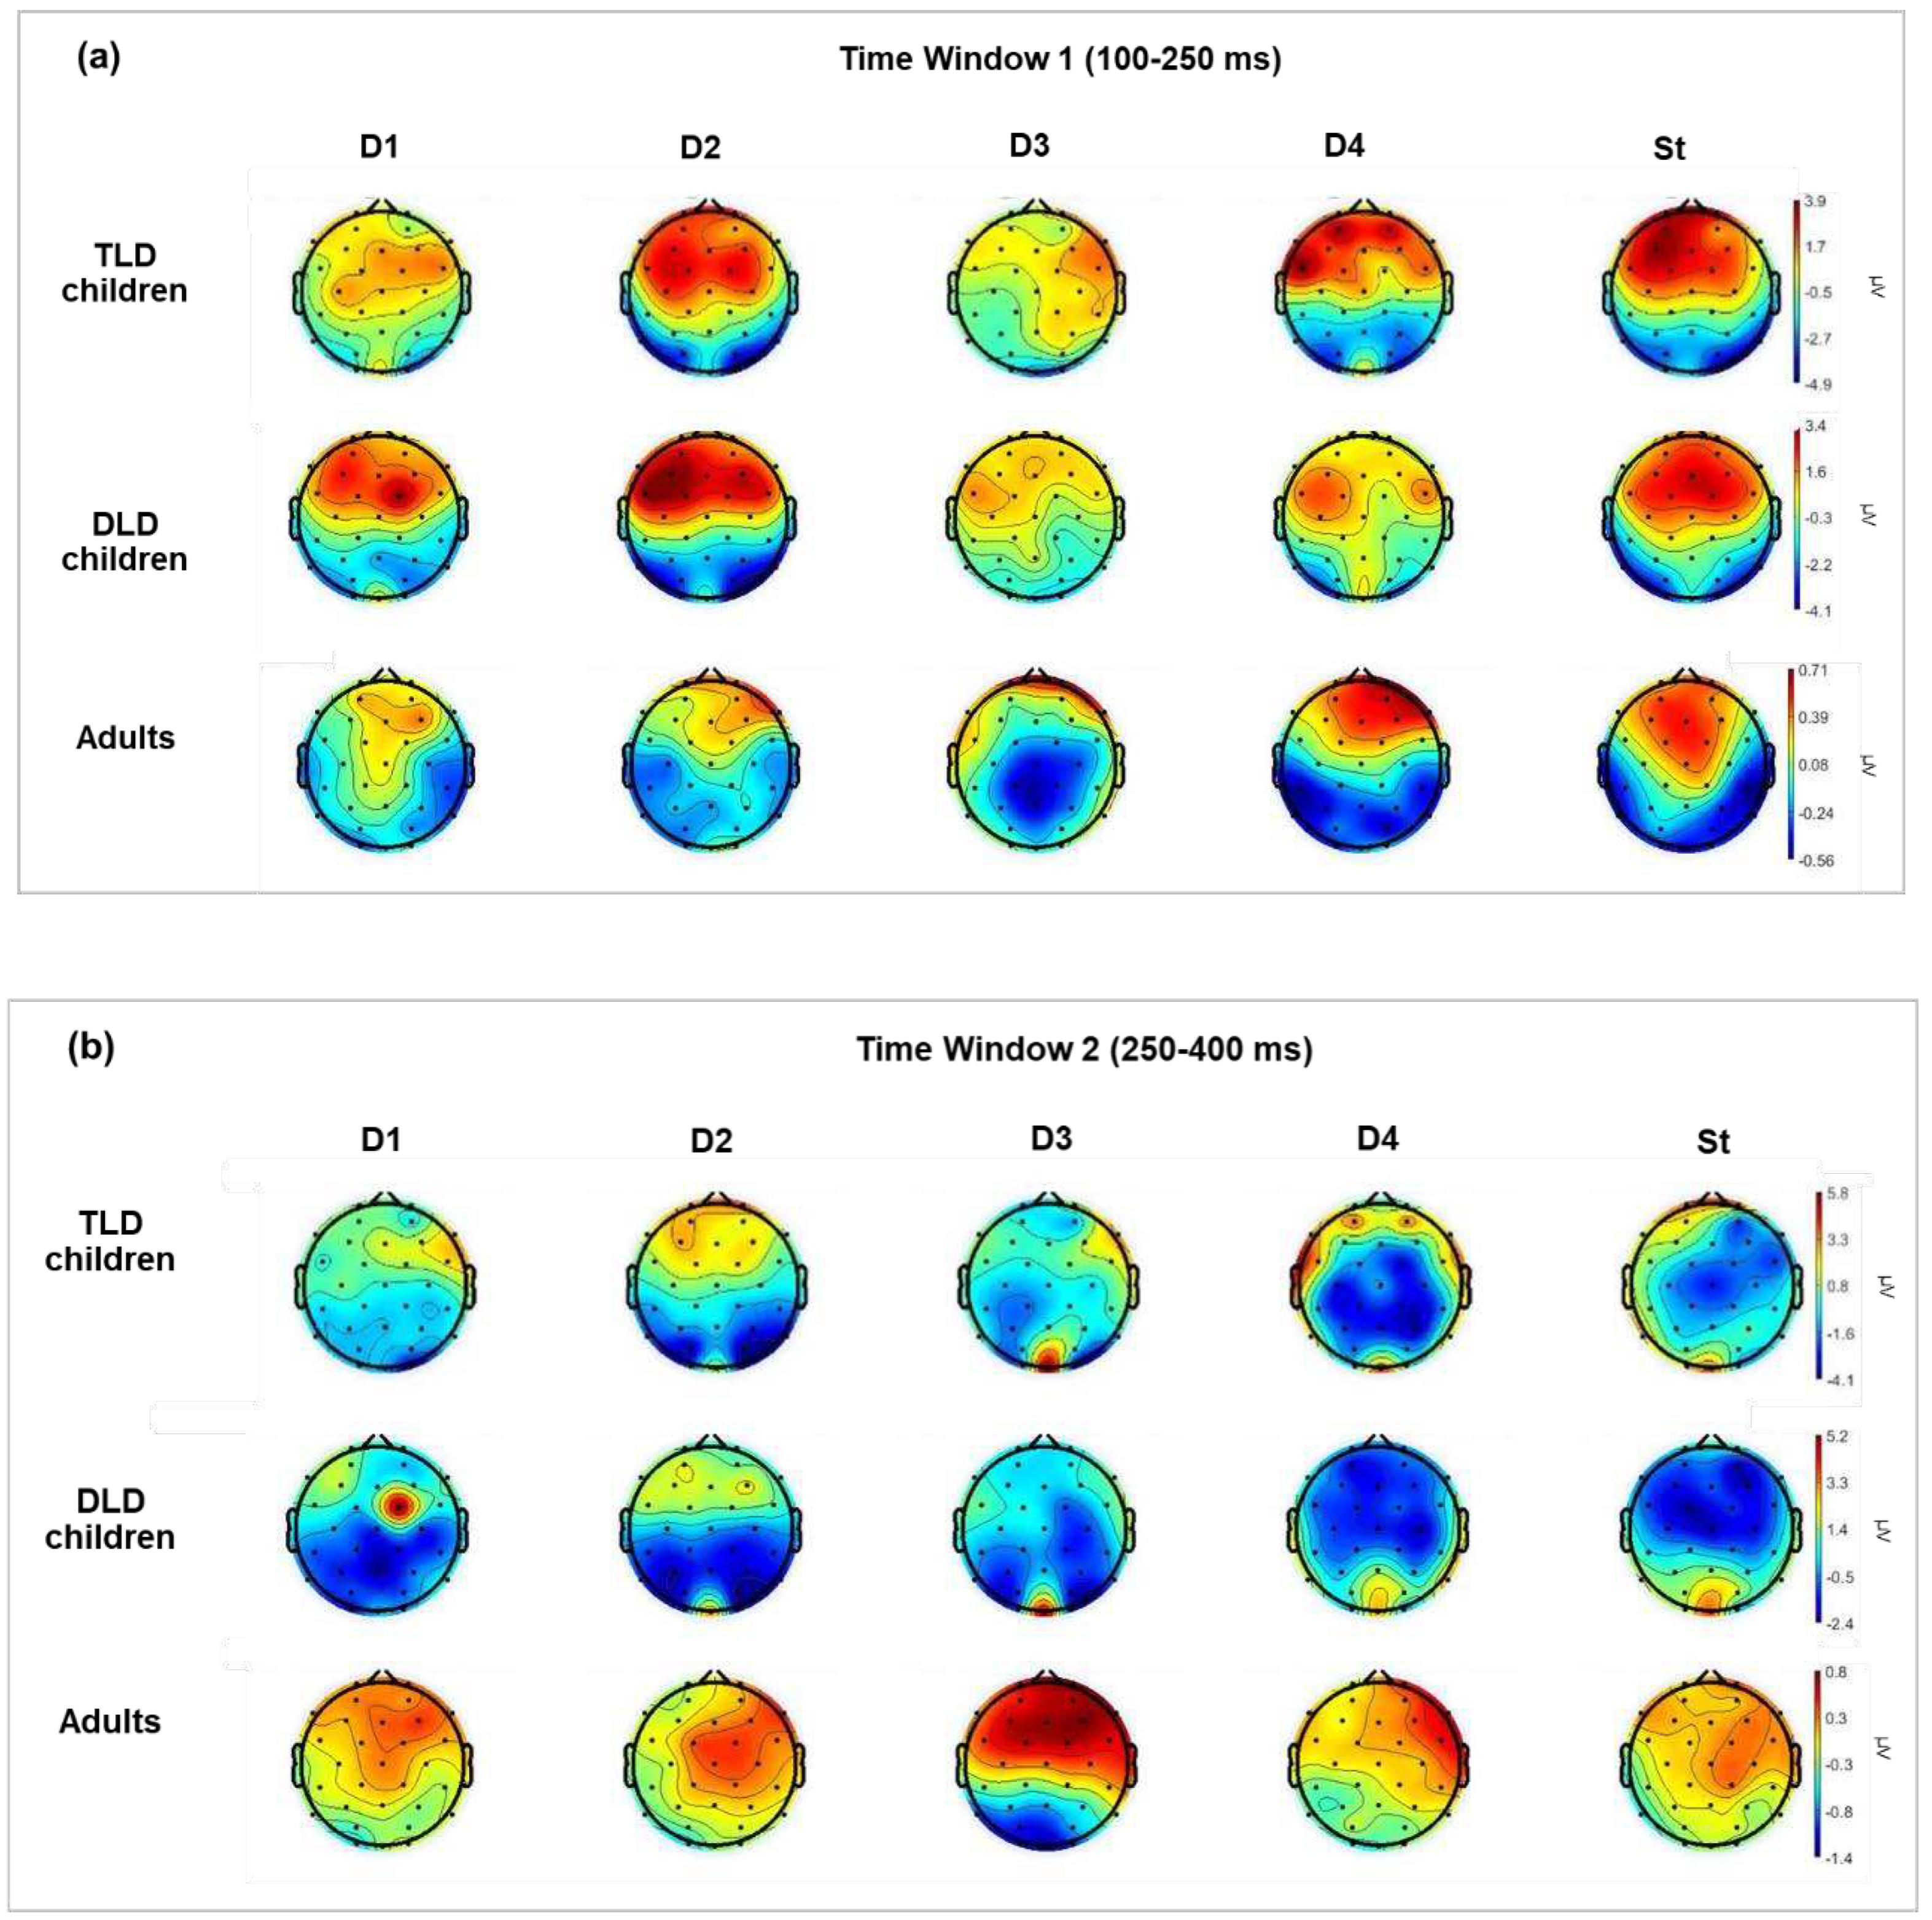
Scalp distributions were computed for each stimulus type by averaging the ERPs amplitude across TW1 (100-250 ms) and TW2 (250-400 ms), as displayed in Figure 3a and 3b, respectively. In both time windows, responses in children had considerably larger magnitude and could show different polarity and less focalized activation than in adults. In general, the scalp patterns for TW1 (Figure 3a) showed frontal-central positive and posterior negative polarity. The activation was similar in adults and children for the standard stimuli, but for the deviants, adults showed more localized frontal positivity and clear temporal negativity. Responses in TLD and DLD children were broadly distributed and mostly of positive polarity, with similar activation for most deviants, except native non-words (D1) and function words (D4): the DLD group showed greater positivity for non-native non-words, but the opposite pattern for content words.
For TW2 (Figure 3b), the scalp patterns showed marked differences between children and adults for all stimuli. Children responses presented broad central-posterior negativity with less focalised activation in the DLD than the TLD group, and some frontal positive sources, for all stimuli in the TLD group but only for non-words in the DLD group. Adults showed a strong positive activation, broadly distributed in frontal-central areas and a less-pronounced posterior negativity for all stimulus types.
Identification of MMRs on difference waveforms
The first ERP analysis focused on detecting statistically significant MMRs and characterising their latency and polarity. We computed four difference waveforms (DW1-4) at electrode Fz from individual ERP sets, by subtracting the standard waveforms from each deviant response and then averaging each DW type across groups. To compare responses for words versus non-words, we created a ‘words’ DW by averaging the responses for the function and content words before subtracting the standards.
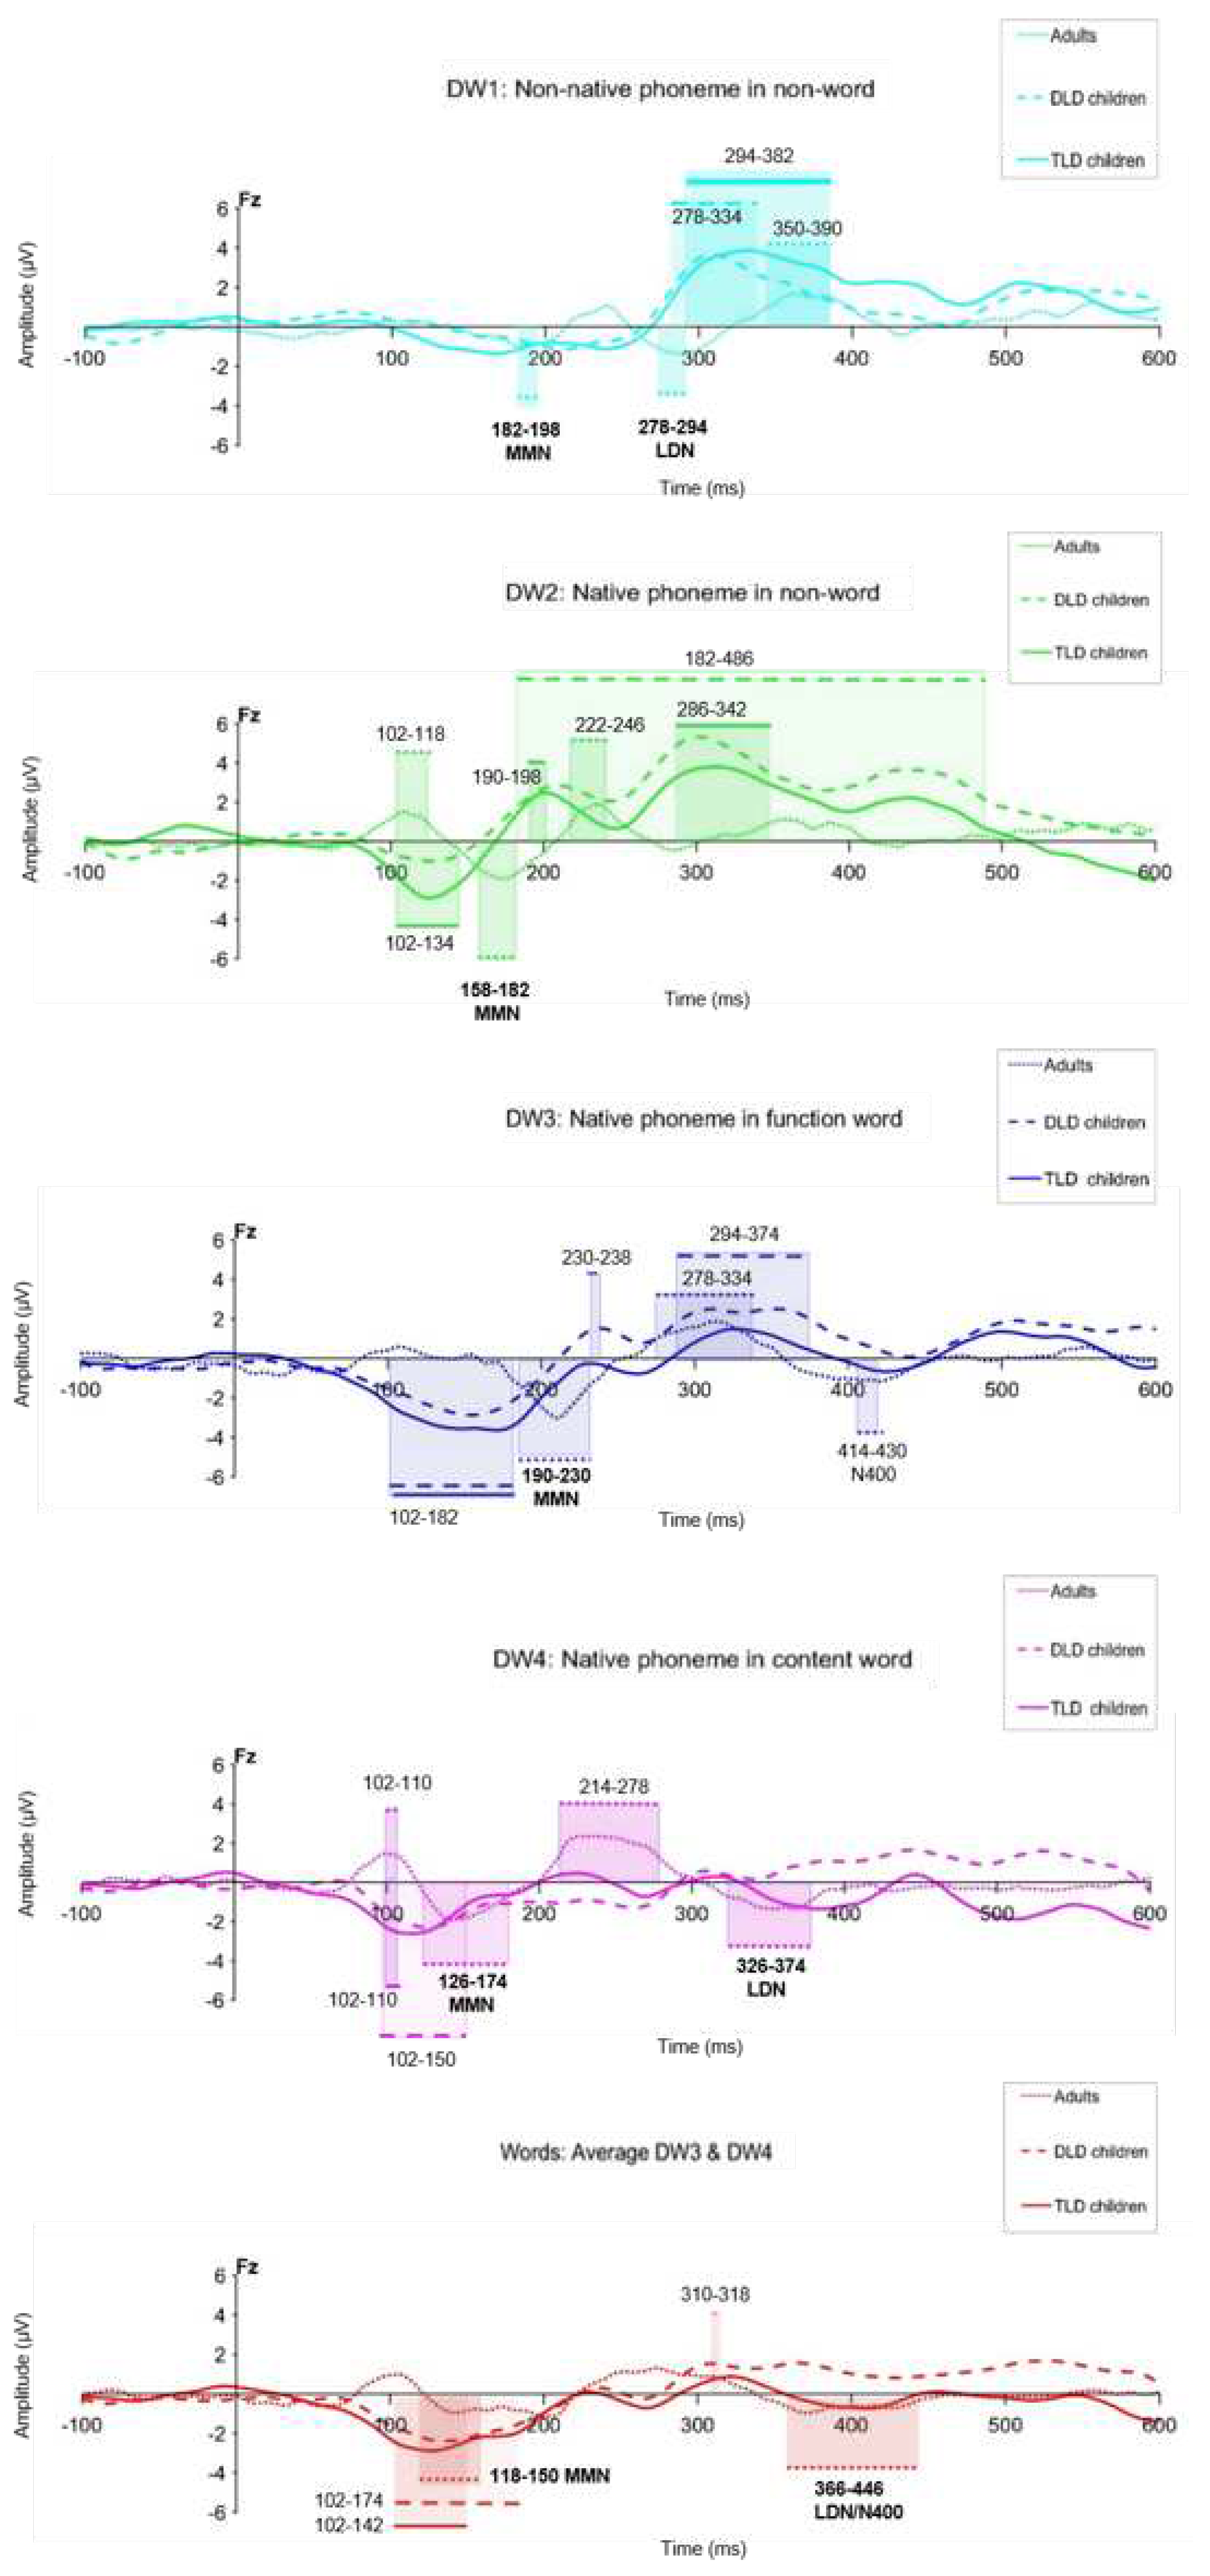
MMR statistical significance was determined using separate Mass Univariate Analysis (MUA,[79]) for each group and stimulus type. To reduce the number of statistical comparisons data was down sampled to 125 Hz (bin size= 8 ms), focusing the analysis on electrode Fz in the 100-450 ms time window. MUA performed point-by-point t-tests and assessed their significance at the 5% level with Benjamini & Hochberg False Discovery Rate (FDR) control procedure [82] testing the null hypothesis that a given DW has an amplitude of 0 µV against the alternative hypothesis is that the DW significantly differs from 0 µV (i.e., using two-tailed tests, see Appendix A). Table 3 presents the results of the MUA, indicating the clusters of significant responses detected in all groups during the 100-450 interval, their timing and polarity patterns on each group. Figure 4 compares the significant responses detected for each DW in all groups.
Table 3 shows significant MMRs for all DW types in all our groups. In adults, consistent MMN responses were present for all stimulus types within 100-250 ms, but LDN responses (250-400 ms) were elicited only for non-native non-words, content words and the combined ‘words’, although with a brief N400-like response for function words. In children, negative MMRs appeared early (within 200 ms) and positive ones appeared after 180 ms, but not all the stimulus types elicited both negative and positive MMRs as observed in adults (except for the combined ‘words’).
Negative, MMN-like responses were detected both in the TLD and DLD group only for DW with lexical status (function words, content words and combined words), and in the TLD group, also for native non-words (DW2). No early negative responses were observed on either group of children for the non-native non-word contrast. Positive MMRs were present for non-words (native and non-native) in both groups, but not for stimuli with lexical status in the TLD group. In the DLD group, positive MMRs were identified for function words (DW3) and briefly, for the combined words. Importantly, no LDN-like responses were detected on either group of children between the 250-450 ms interval.
Visual inspection of the MMRs on Figure 4 suggests similar responses for both groups of children but different patterns for adults. In general, waveform deflections in adults showed the opposite polarity, shorter duration, and later onset than in children, although with variable amplitude depending on the ERP peaks. In children, the amplitude and polarity was similar for all stimulus types. Onset latency for negative MMRs for words and non-words was similar between the TLD/DLD groups, but the DLD showed earlier positive responses for non-words. In terms of duration, responses in the DLD group were longer than in the DLD group.
Statistical comparison between children and adult MMRs
The second ERP analysis focused on examining between-group differences in the MMR latency and amplitude, comparing the responses between TLD and DLD children, and between children and adults in TW1 (100-250) and TW2 (250-400 ms). Peak latency was defined as the time (in ms) at which the largest negative deflection occurred on each TW, whereas mean amplitude was calculated as the average voltage (in µV) over a 50 ms interval centred in the peak latency. Descriptive statistics for peak latency and mean amplitude for all groups are presented in Table 4 and Table 5, respectively.
In general, peak latency was longer in adults than in children both for TW1 and for TW2 (Table 4). In adults though, peak latency coincided with the significant MMN/LDN clusters, which was not observed in children. For children, peak latency values were extracted from negative deflections in TW1 and from positive deflections in TW2, regardless they were significant responses or not. Thus, we performed no further analysis on peak latency measures, as the responses for all groups were not comparable.
For mean amplitude (Table 5), children exhibited larger negative values than adults, and TLD children exhibited larger responses than DLD children in TW1. In TW2, adults showed larger negativities than children for all stimuli except for content words, and TLD children showed more negative values than the DLD group for all stimulus types.
Next, we examined the mean amplitude between-group differences for each TW using planned comparisons for each stimulus type. After Shapiro-Wilk tests confirmed normal distribution (see Appendices B and C) for all measures in TW1 and TW2, except one (DW2-TDL in TW1) we performed one-way ANOVAs, adjusting the significance level for multiple comparisons to 0.01 (0.05/ 5 comparisons, one per stimulus type). To account for unequal sample sizes and unequal variances (Appendices B and C), we used Tamhane’s post-hoc tests, also with corrected alpha= 0.01. Table 6 presents the ANOVA results for mean amplitude between-groups comparisons. In TW1 there was a significant difference in mean amplitude only for the combined words difference wave [F(2,44)= 7.855, p= .001], and in TW2, only for non-native non-words [F(2,44)= 4.701, p= .014], with a large effect size in both cases (η2 = 0. 263 and η2 =.176, respectively). Post-hoc tests for TW1 indicated significantly larger negativities for Word stimuli in both groups of children (TLD M= -3.06, SD= 2.26; DLD M= -2.63 SD=1.78), than in adults (M= -0.95, SD=0.92). In TW2, post-hoc tests showed less negative values for native non-words in DLD children (M= 1.78, SD= 3.08) than in adults (M= - 0.81, SD= 1.01), but no difference between the DLD or the adults groups and TLD children (M=0.85, SD= 3.56).
Finally, for a fine-grained comparison between TLD and DLD children, we performed MUA with FDR control procedure [79] on each DLD-TLD DW pair. Point-by-point t-tests (2-tailed, q level of critical t-scores= 0.05) indicated no between-group amplitude differences at electrode Fz, during the 100-250 ms or the 250-400 ms interval (Appendix D).

3.2.2. Time-Frequency Analysis of MMRs

Spectral Power
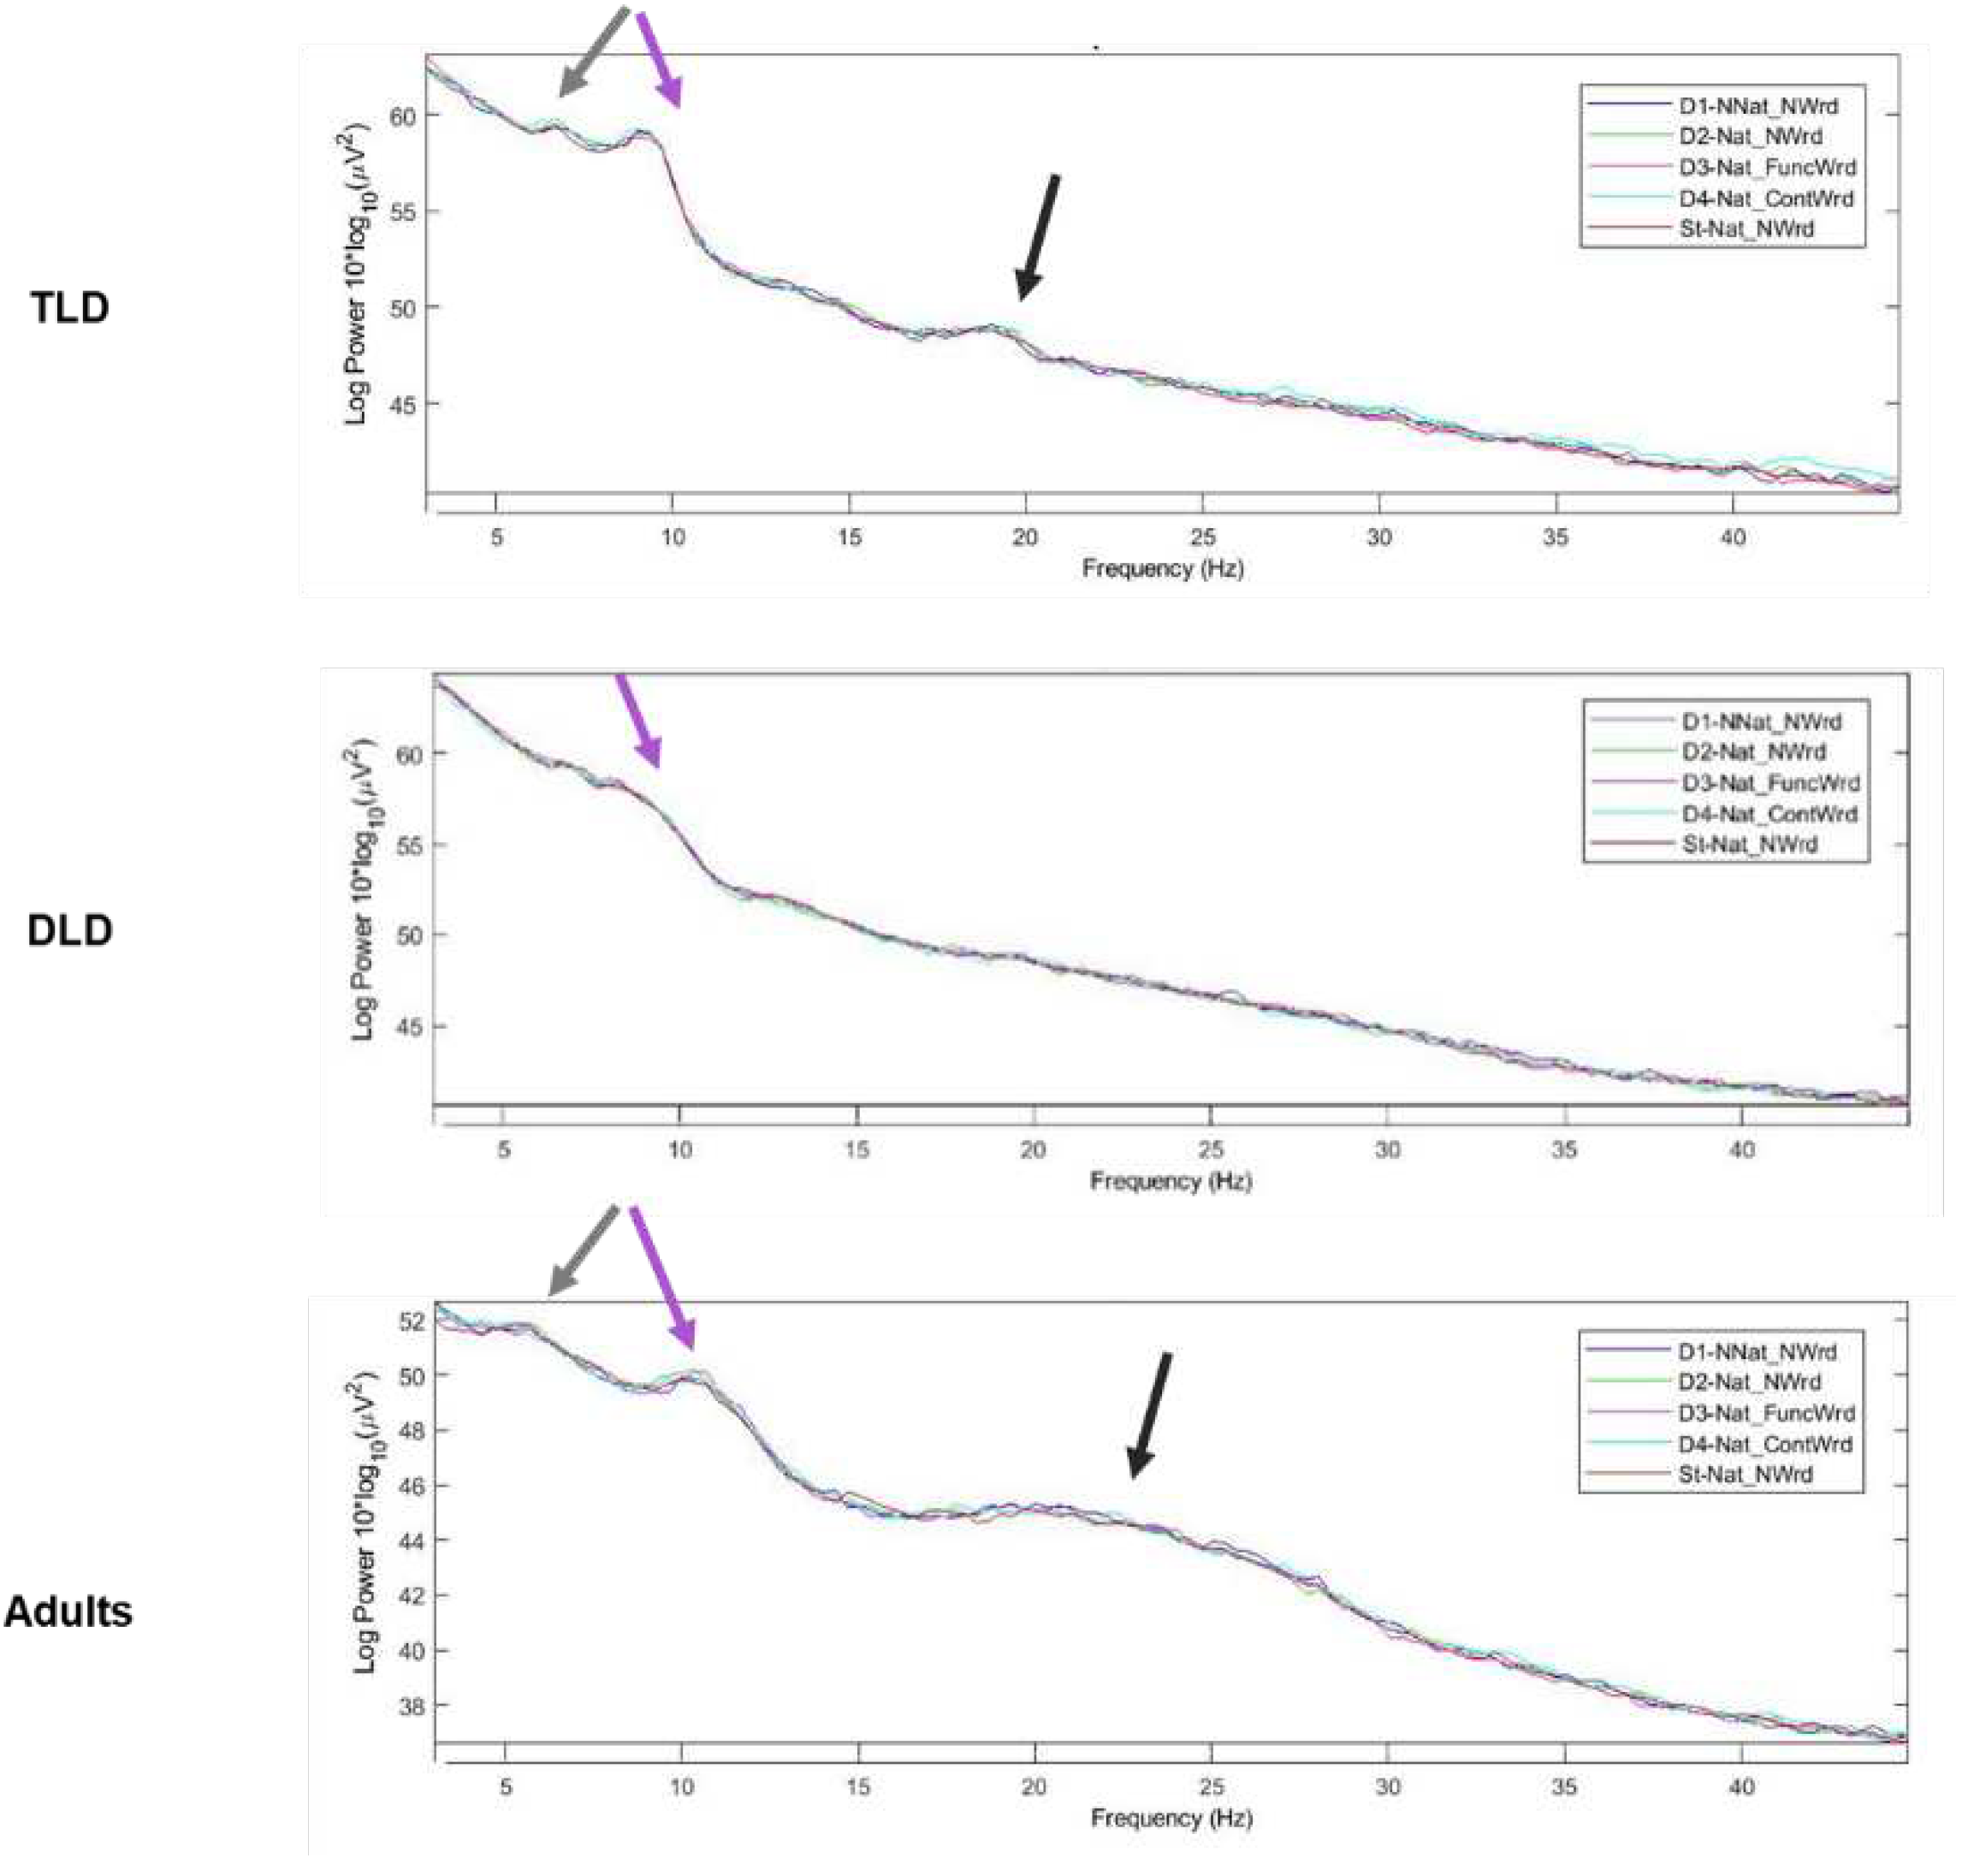
As a data quality check, we first computed the spectrum of each stimulus type for each group, measured as normalized power (µV²). As can be observed in Figure 5, we could confirm that the 1/f pattern and typical peaks in the alpha band were present, indicating that our measures reflected cortical dynamics. All groups exhibited an increase in power around 10 Hz, consistent with alpha band activity. However, only the adults and TLD groups showed additional peaks around 5 Hz and 20 Hz, which was wider in adults (to 30 Hz). In consistency with previous literature (e.g., [77], all TF analysis were conducted in the parent waveforms instead of the difference waveforms.

3.2.2. Event-Related Spectral Perturbation (ERSP)
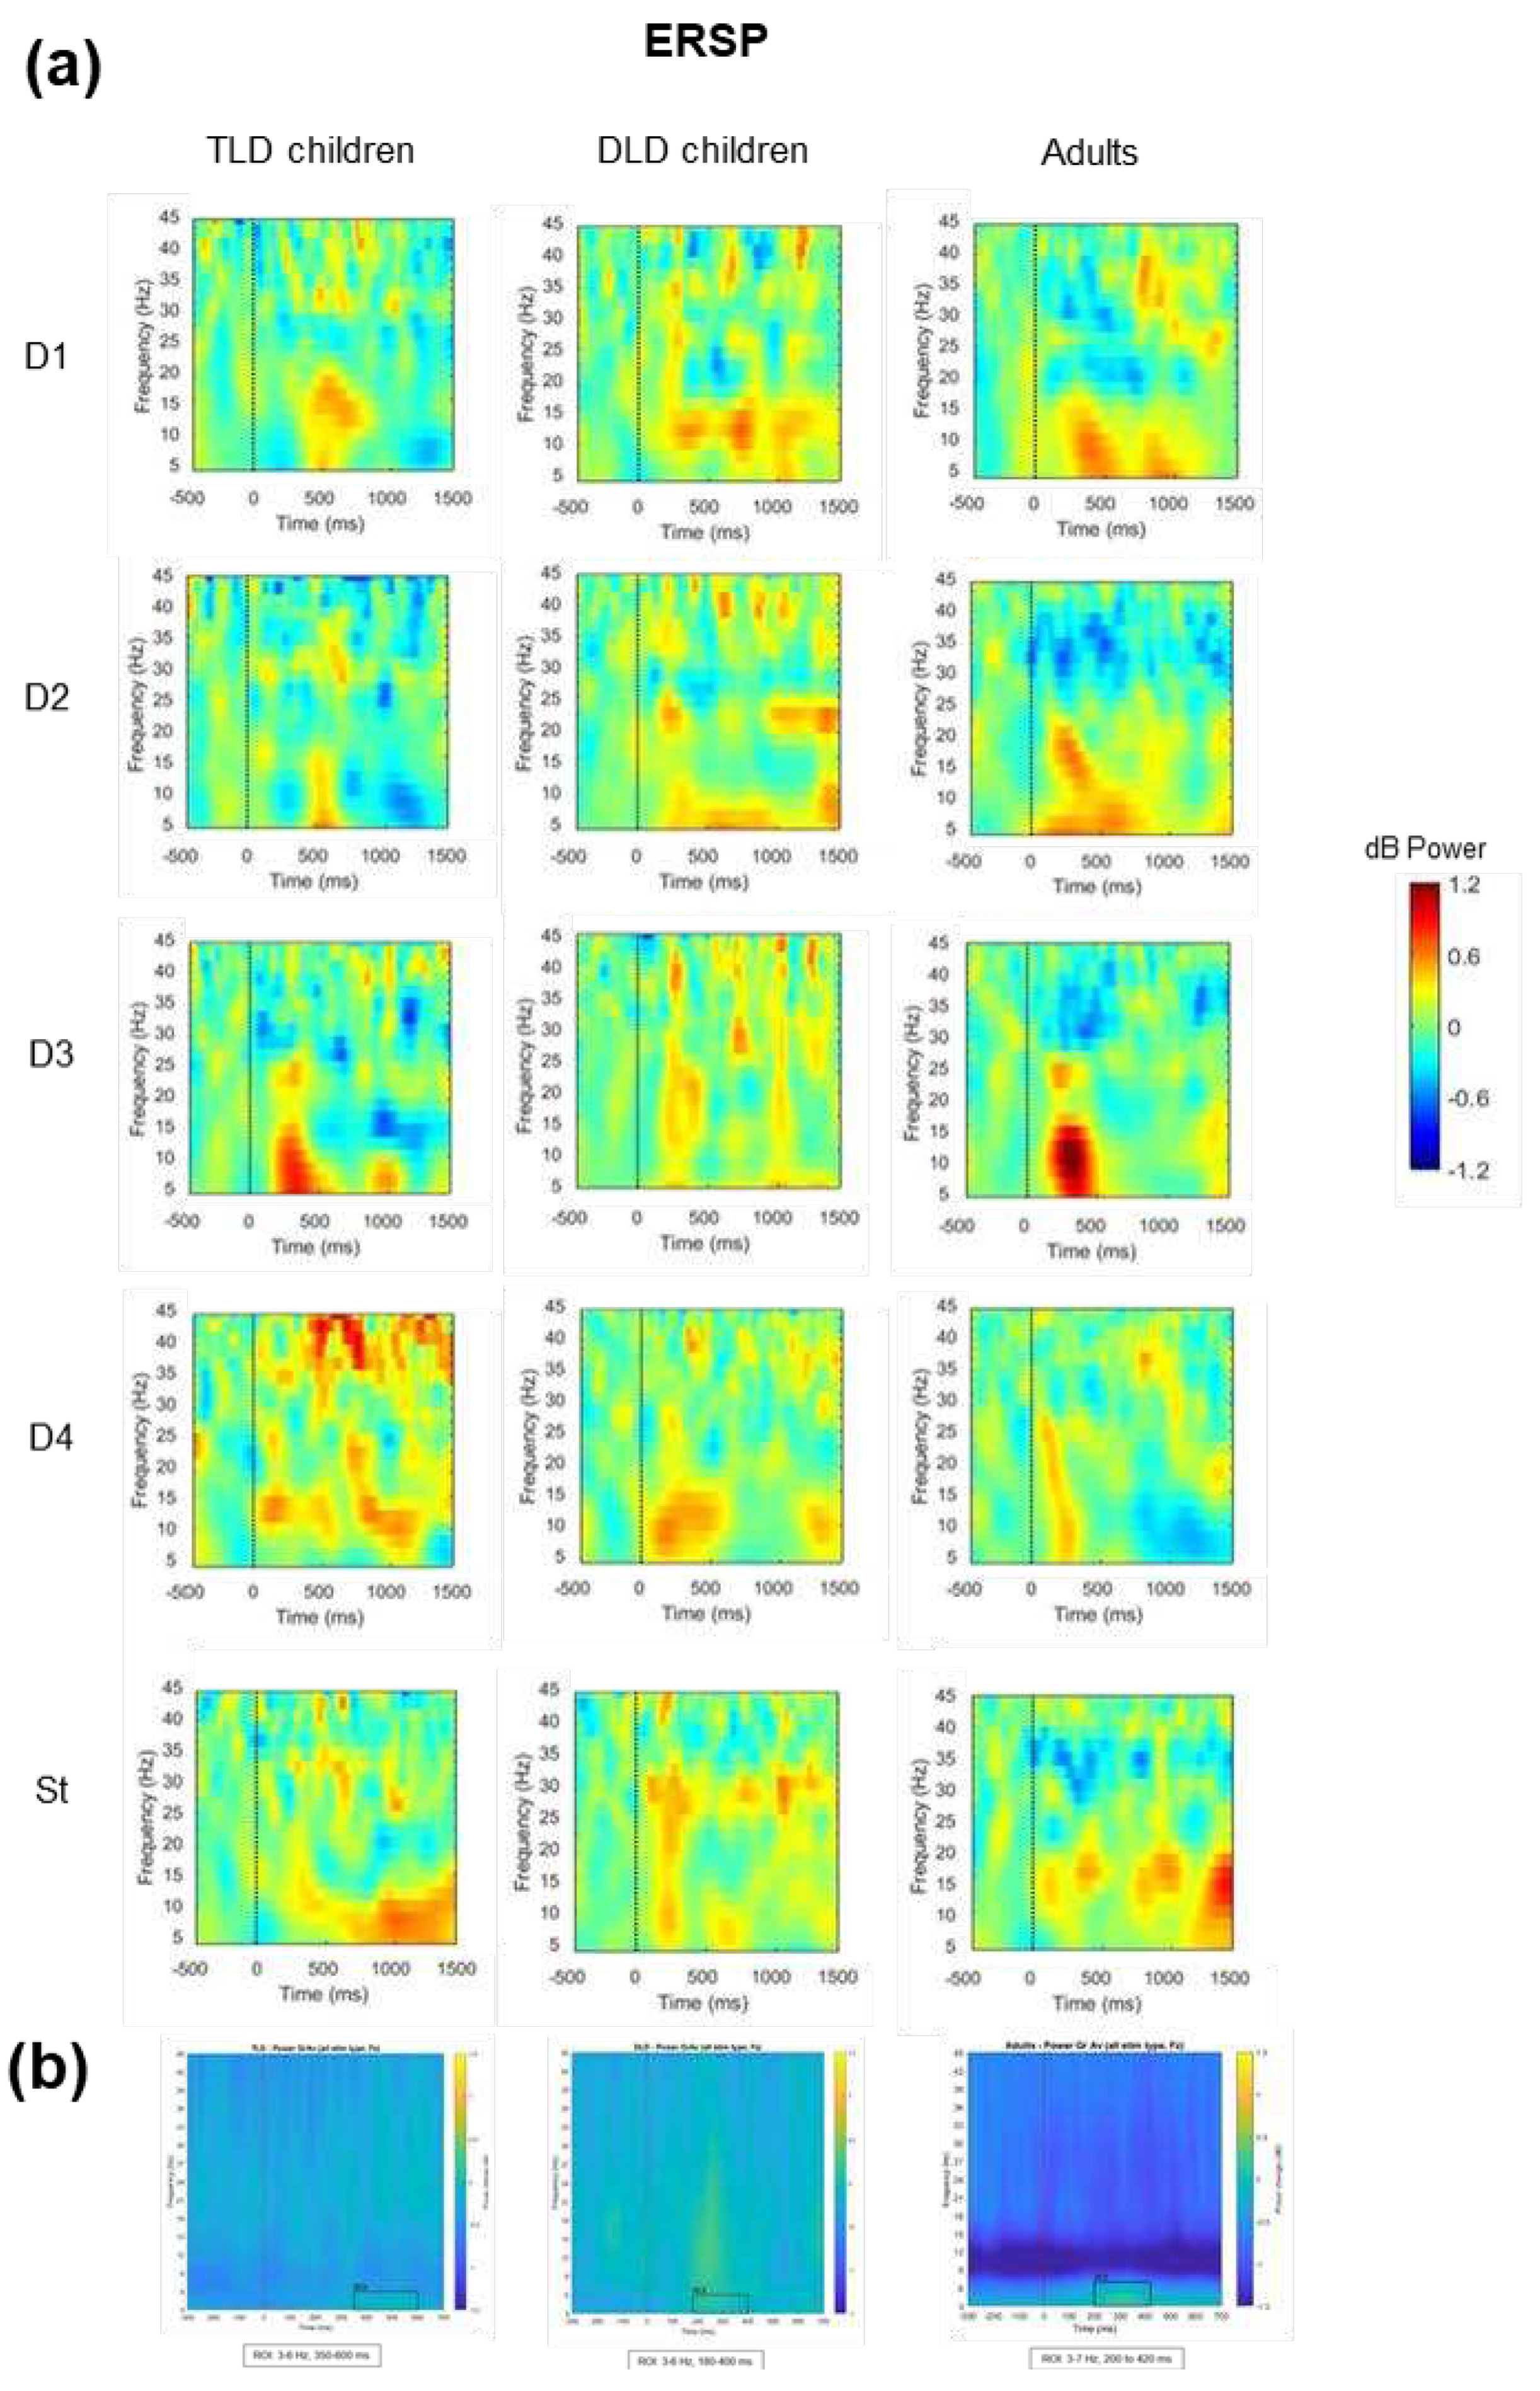
The second TF analysis focused on determining if there were any between-group differences in spectral power over time for each stimulus type, as indexed by the ERSP changes. Figure 6a presents the ERSP for each stimulus type for TLD and DLD children and the adult’s group. To avoid biased selection of the time windows and frequency ranges of interest for statistical analysis, on each group we averaged the responses for all stimulus types and determined regions of interest (ROIs) by visual inspection of the plots in a way that was blind to stimulus types (Figure 6b).
For each group, we identified one ROI with increased activation (colour change towards yellow) in theta band for each group: for the TLD group, between 350-600 ms (3-6 Hz); for the DLD group between 180-400 ms (3-6 Hz) and for the Adult group, between 200-420 ms (3-7 Hz). The onset was earlier in adults (~200 ms) and DLD children (~180 ms) than in the TLD group (~350 ms). Despite the baseline correction, in the adult group there was a power decrease in the alpha range that spread from the start of the baseline to the post-stimulus period, suggesting an artifact affecting this frequency range. For this reason, ERSP analysis only focused on the theta ROI.
To compare ERSP between groups, dB power was averaged across ROI time points, and collapsed across frequencies to get theta band ERSP power. Table 7 presents the descriptive statistics for theta ERSP. In general, adults showed negative theta ERSP values for all stimulus types, except for function words, whereas children showed power changes towards both positive and negative values. In the TLD group, theta ERSP was similar to adults in magnitude and polarity for all non-words (non-native and native, including the standards), but not for word stimuli. The DLD group showed the opposite pattern, with similar responses to adults for function and content words but not for non-words.
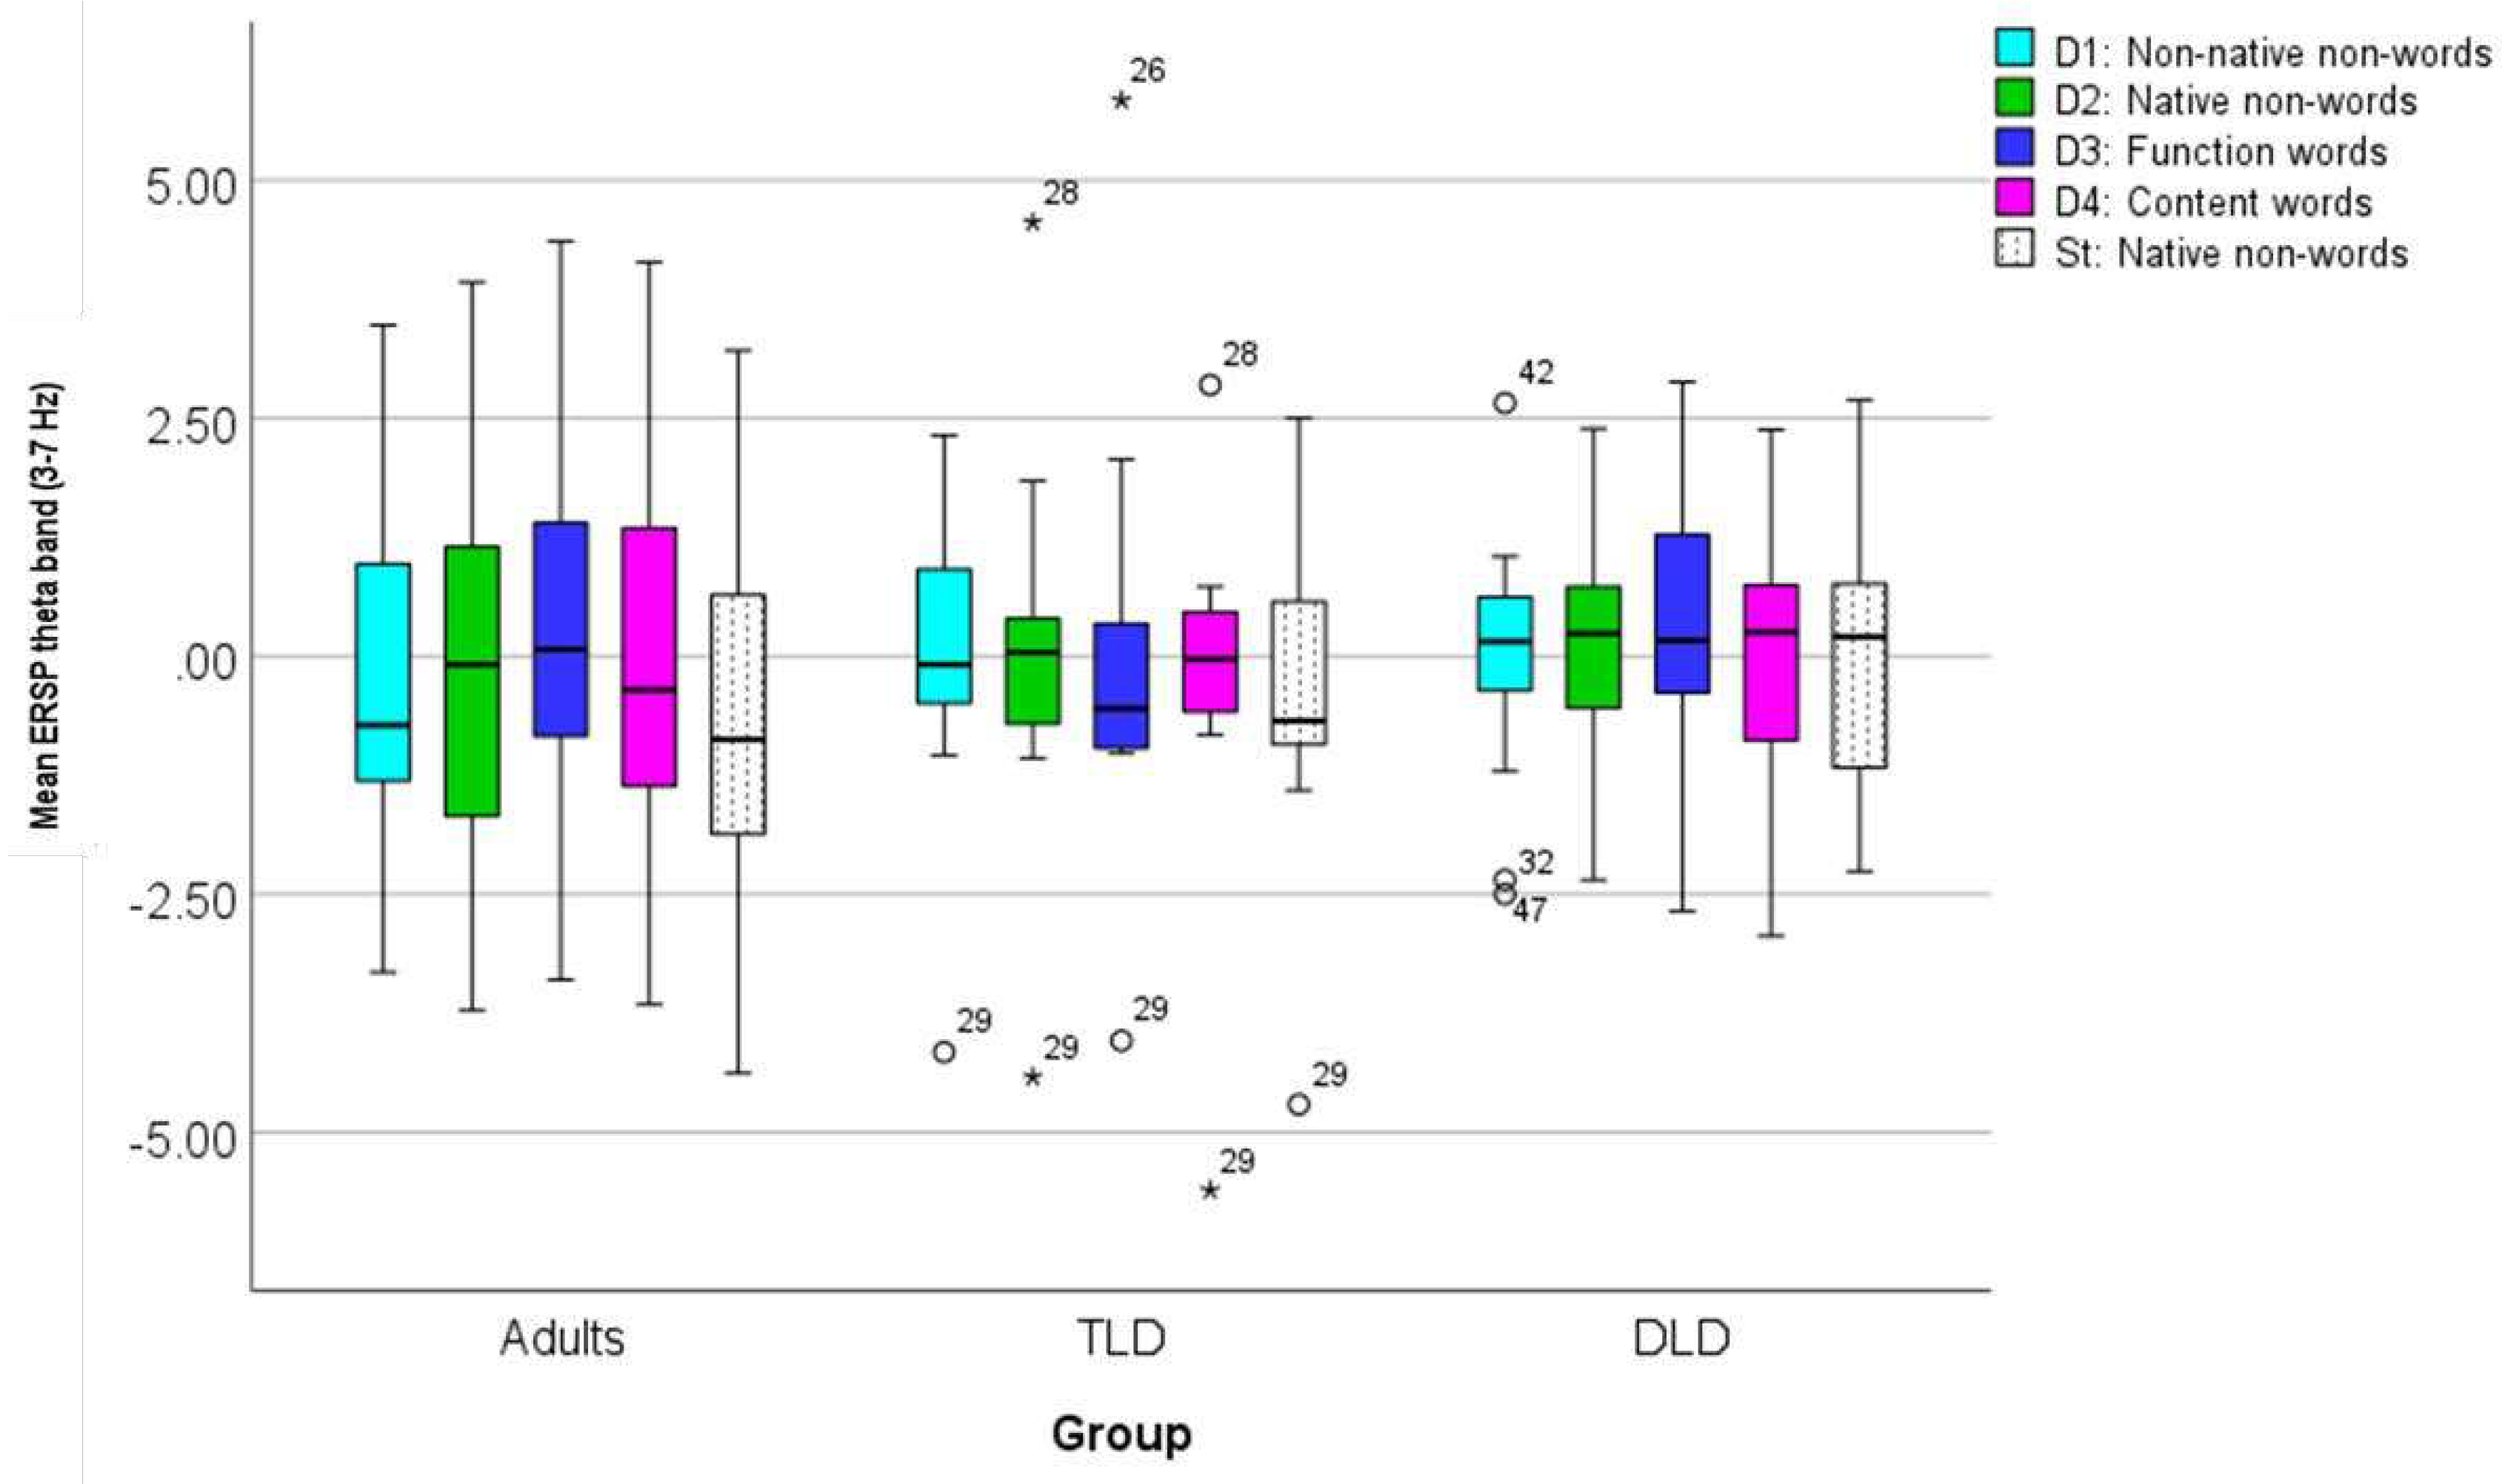
Theta ERSP values for each group and each stimulus type are compared in Figure 7, indicating greater variability in adults than children responses, but a greater number of extreme values in the children groups, especially TLD. To quantify the differences in ERSP theta power for each stimulus type between TLD children, DLD children, and adults we conducted a mixed repeated measures ANOVA with ‘Group’ as between-subject factor and ‘Stimulus Type’ as within-subject factor. After checking data normality, equality of variances, and equality of covariance matrices (Appendix E), we used Greenhouse-Geisser correction to account for unmet sphericity (Mauchly’s W=.355, p<.001, df =9).
The ANOVA revealed a significant effect of Stimulus Type [F(2.57,113)=3.358, p=.027], with a medium effect size (ηp2 = .071) and adequate power= 0.70. Post-hoc pairwise tests on Stimulus Type effects indicated significantly larger ERSP power change for standards (M= -.313, SD= 1.71) than for non-native non-words (M= -.078, SD=1.60), native non-words (M= -.008, SD= 1.86), and function words (M= .185, SD= 1.95), but not for content words (M=-.136, SD=1.82). However, there was non-significant effect of Group [F(1,44)= .048, p=.953], and a non-significant Group*Stimulus Type interaction, [F(5.14.,113)= .505, p=.774], both with a small effect size (ηp2 =.002 and ηp2 =.022, respectively) and low statistical power (0.6% and 19%, respectively).
Inter-trial Phase Coherence (ITPC)
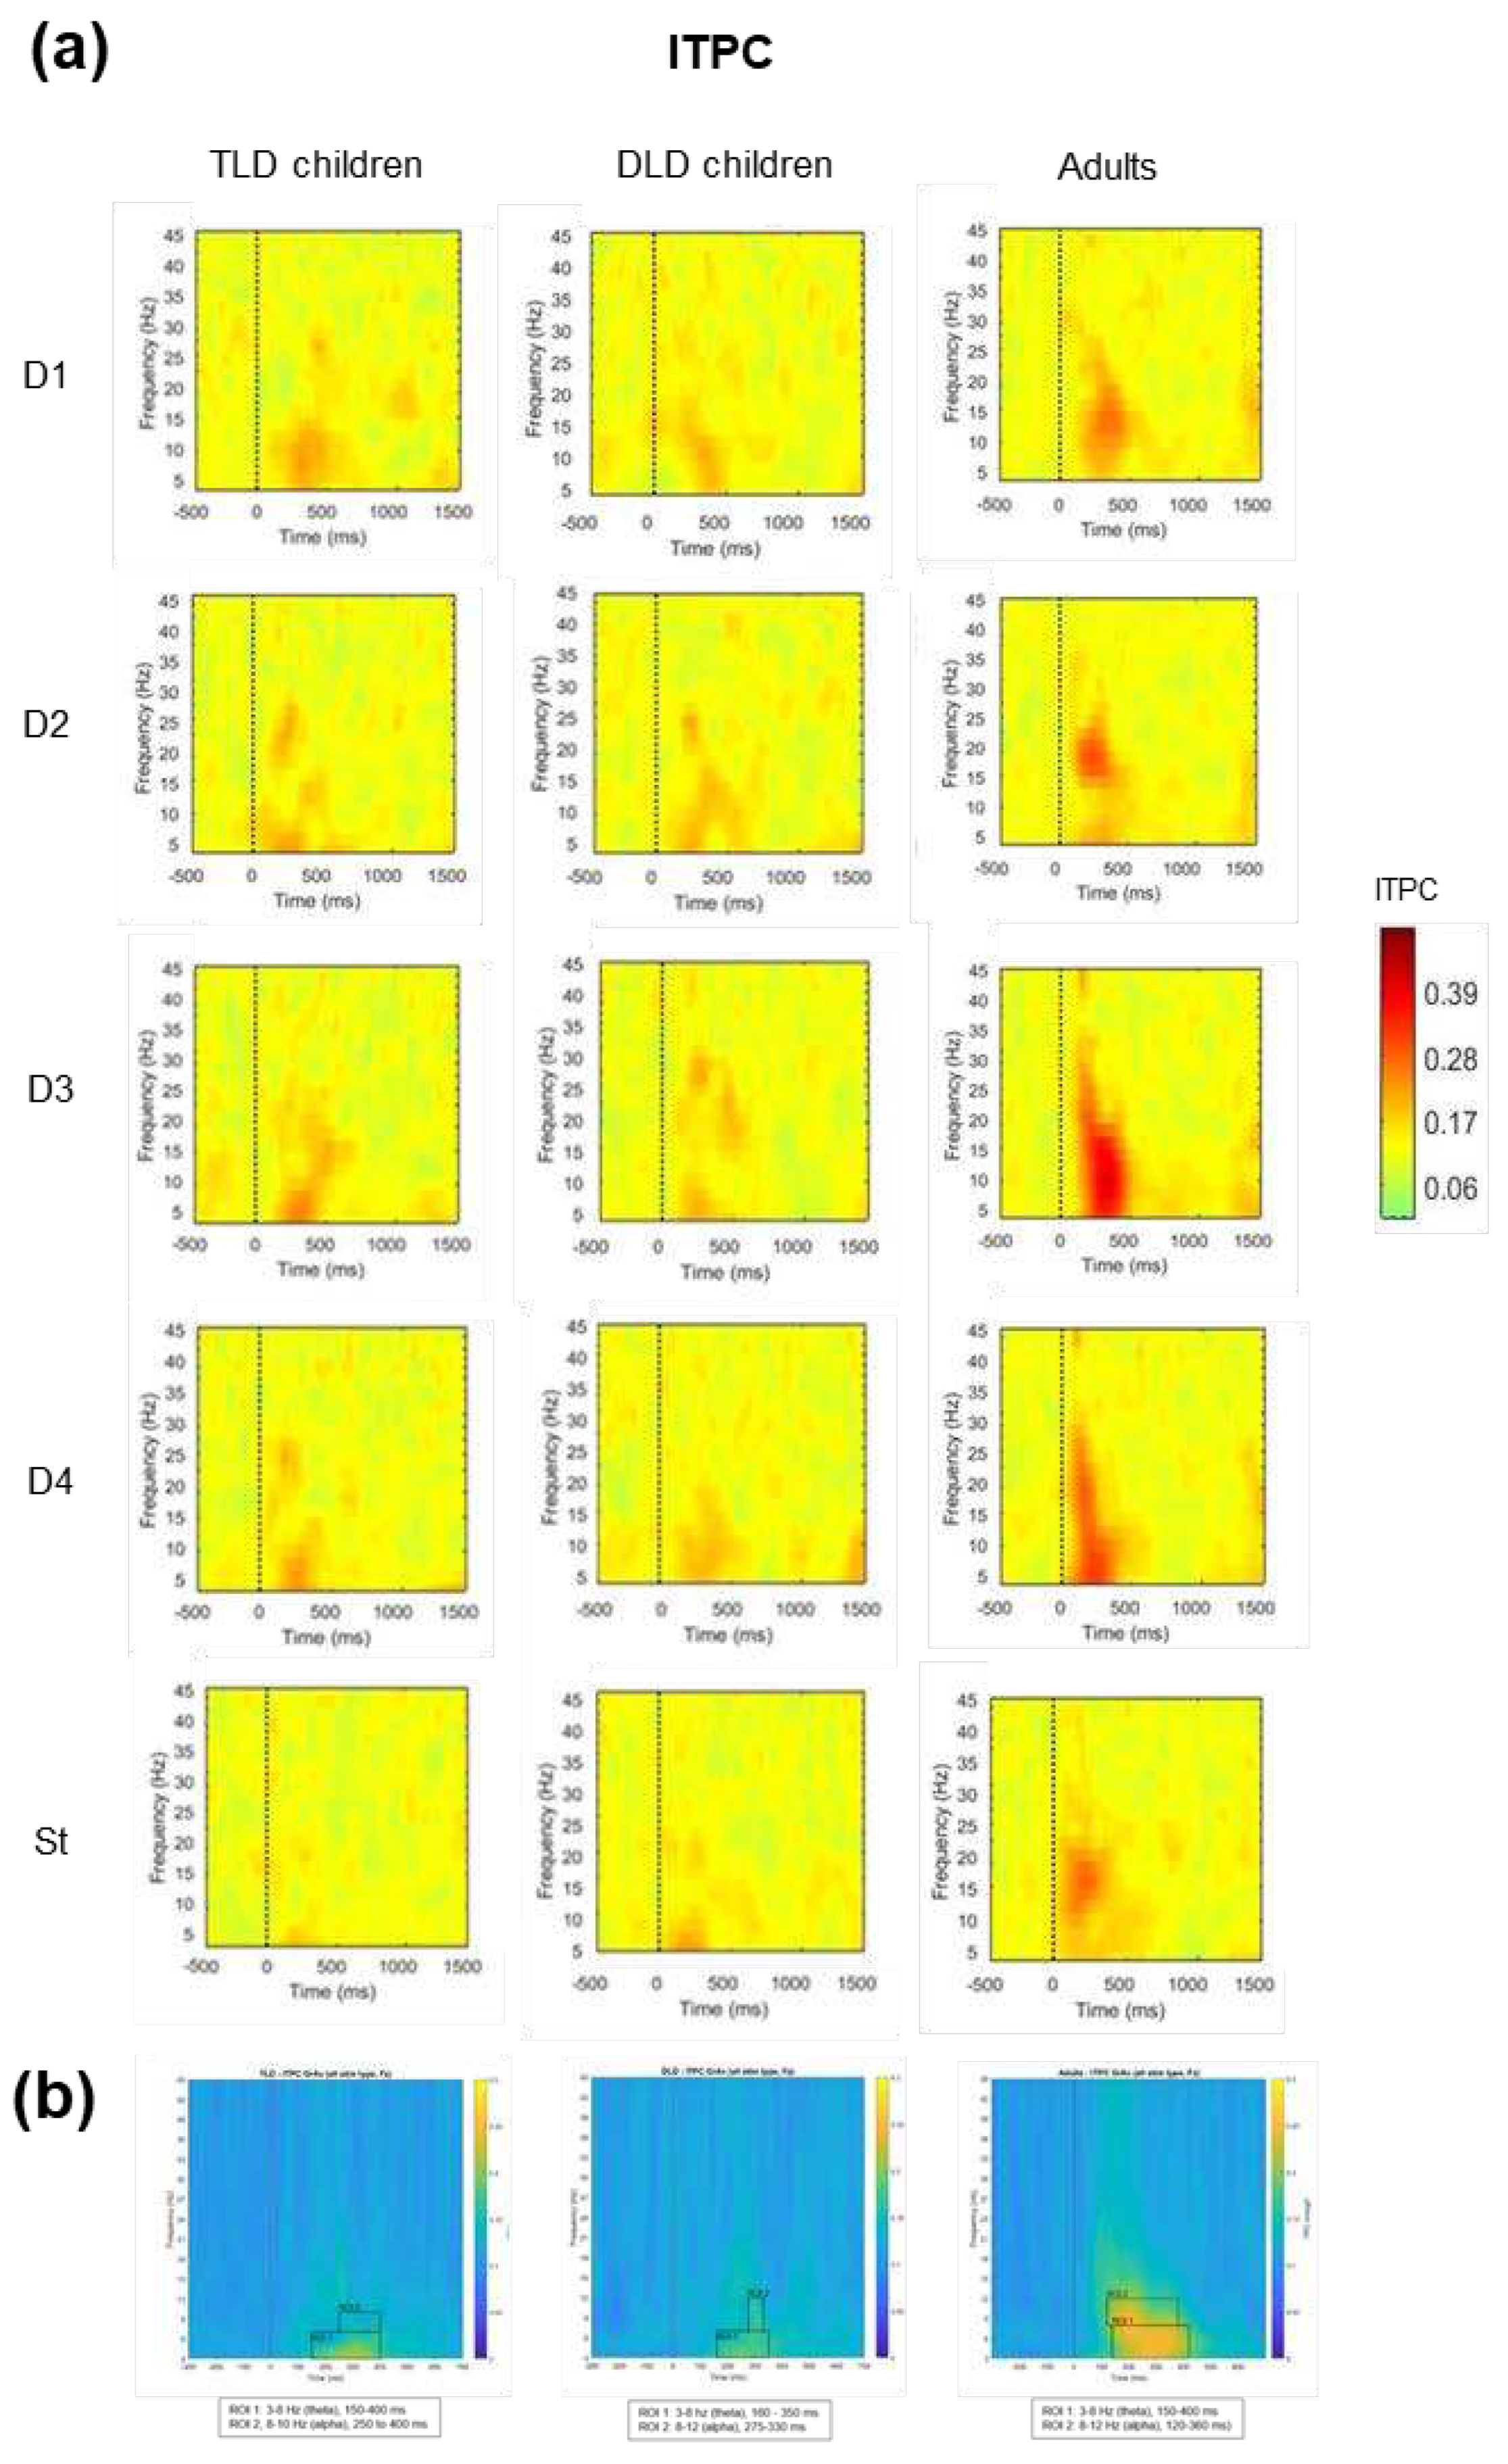
The final TF analysis focused on determining if there were any between-group differences in phase coherence over time for each stimulus type, as indexed by ITPC. Figure 8a presents ITPC values for each stimulus type for TLD, DLD, and adult groups. In general, increases in ITPC appear in frequencies below 30 Hz and before (or around) 500 ms. For all stimulus types, ITPC increases are larger in adults than in both groups of children. As in ERSP measures, ROIs for ITPC statistical analysis were determined by visual inspection of the plots containing the average of all stimulus types for each group (Figure 8b). In all the groups, it was possible to identify two ROIs in different frequency bands; ROI 1 in theta (3 to 7-8 Hz) and ROI 2 in alpha band (8 to 10-12 Hz).
Theta band ITPC increases (ROI 1) had a similar onset and duration in TLD children and adults (150-400 ms) but it was slightly shorter in the DLD group (160-350 ms). Alpha band ITPC increases (ROI 2) exhibited earlier onset and longer duration in adults (120-360) ms than in TLD (250-400) and DLD children (275-330), with the DLD group showing the shortest alpha ITPC increase. Table 8 presents the descriptive statistics for theta band (ROI 1). Adults showed higher ITPC for meaningful stimuli (words than non-words), but in general, with no difference for deviants and standard stimuli. In the TLD group, all deviants show higher ITPC than the Standards. No such standard-deviant distinction is present in the DLD group.
To compare theta ITPC (ROI 1), we conducted a repeated-measures ANOVA with ‘Stimulus Type’ as within-subjects factor and ‘Group’ as between-subjects factor, after confirming all the test assumptions were met (Appendix F). Results indicate a significant main effect of Stimulus Type [F(4,176)= 6.75, p<.001], with a large effect size (ηp2 = 0.133) and adequate power (99%). Post-hoc comparisons showed significantly higher theta ITPC for function (M= .22, SD= .094) and content words (M=.19, SD= .069), than for native non-words (M=.18, SD= .049).
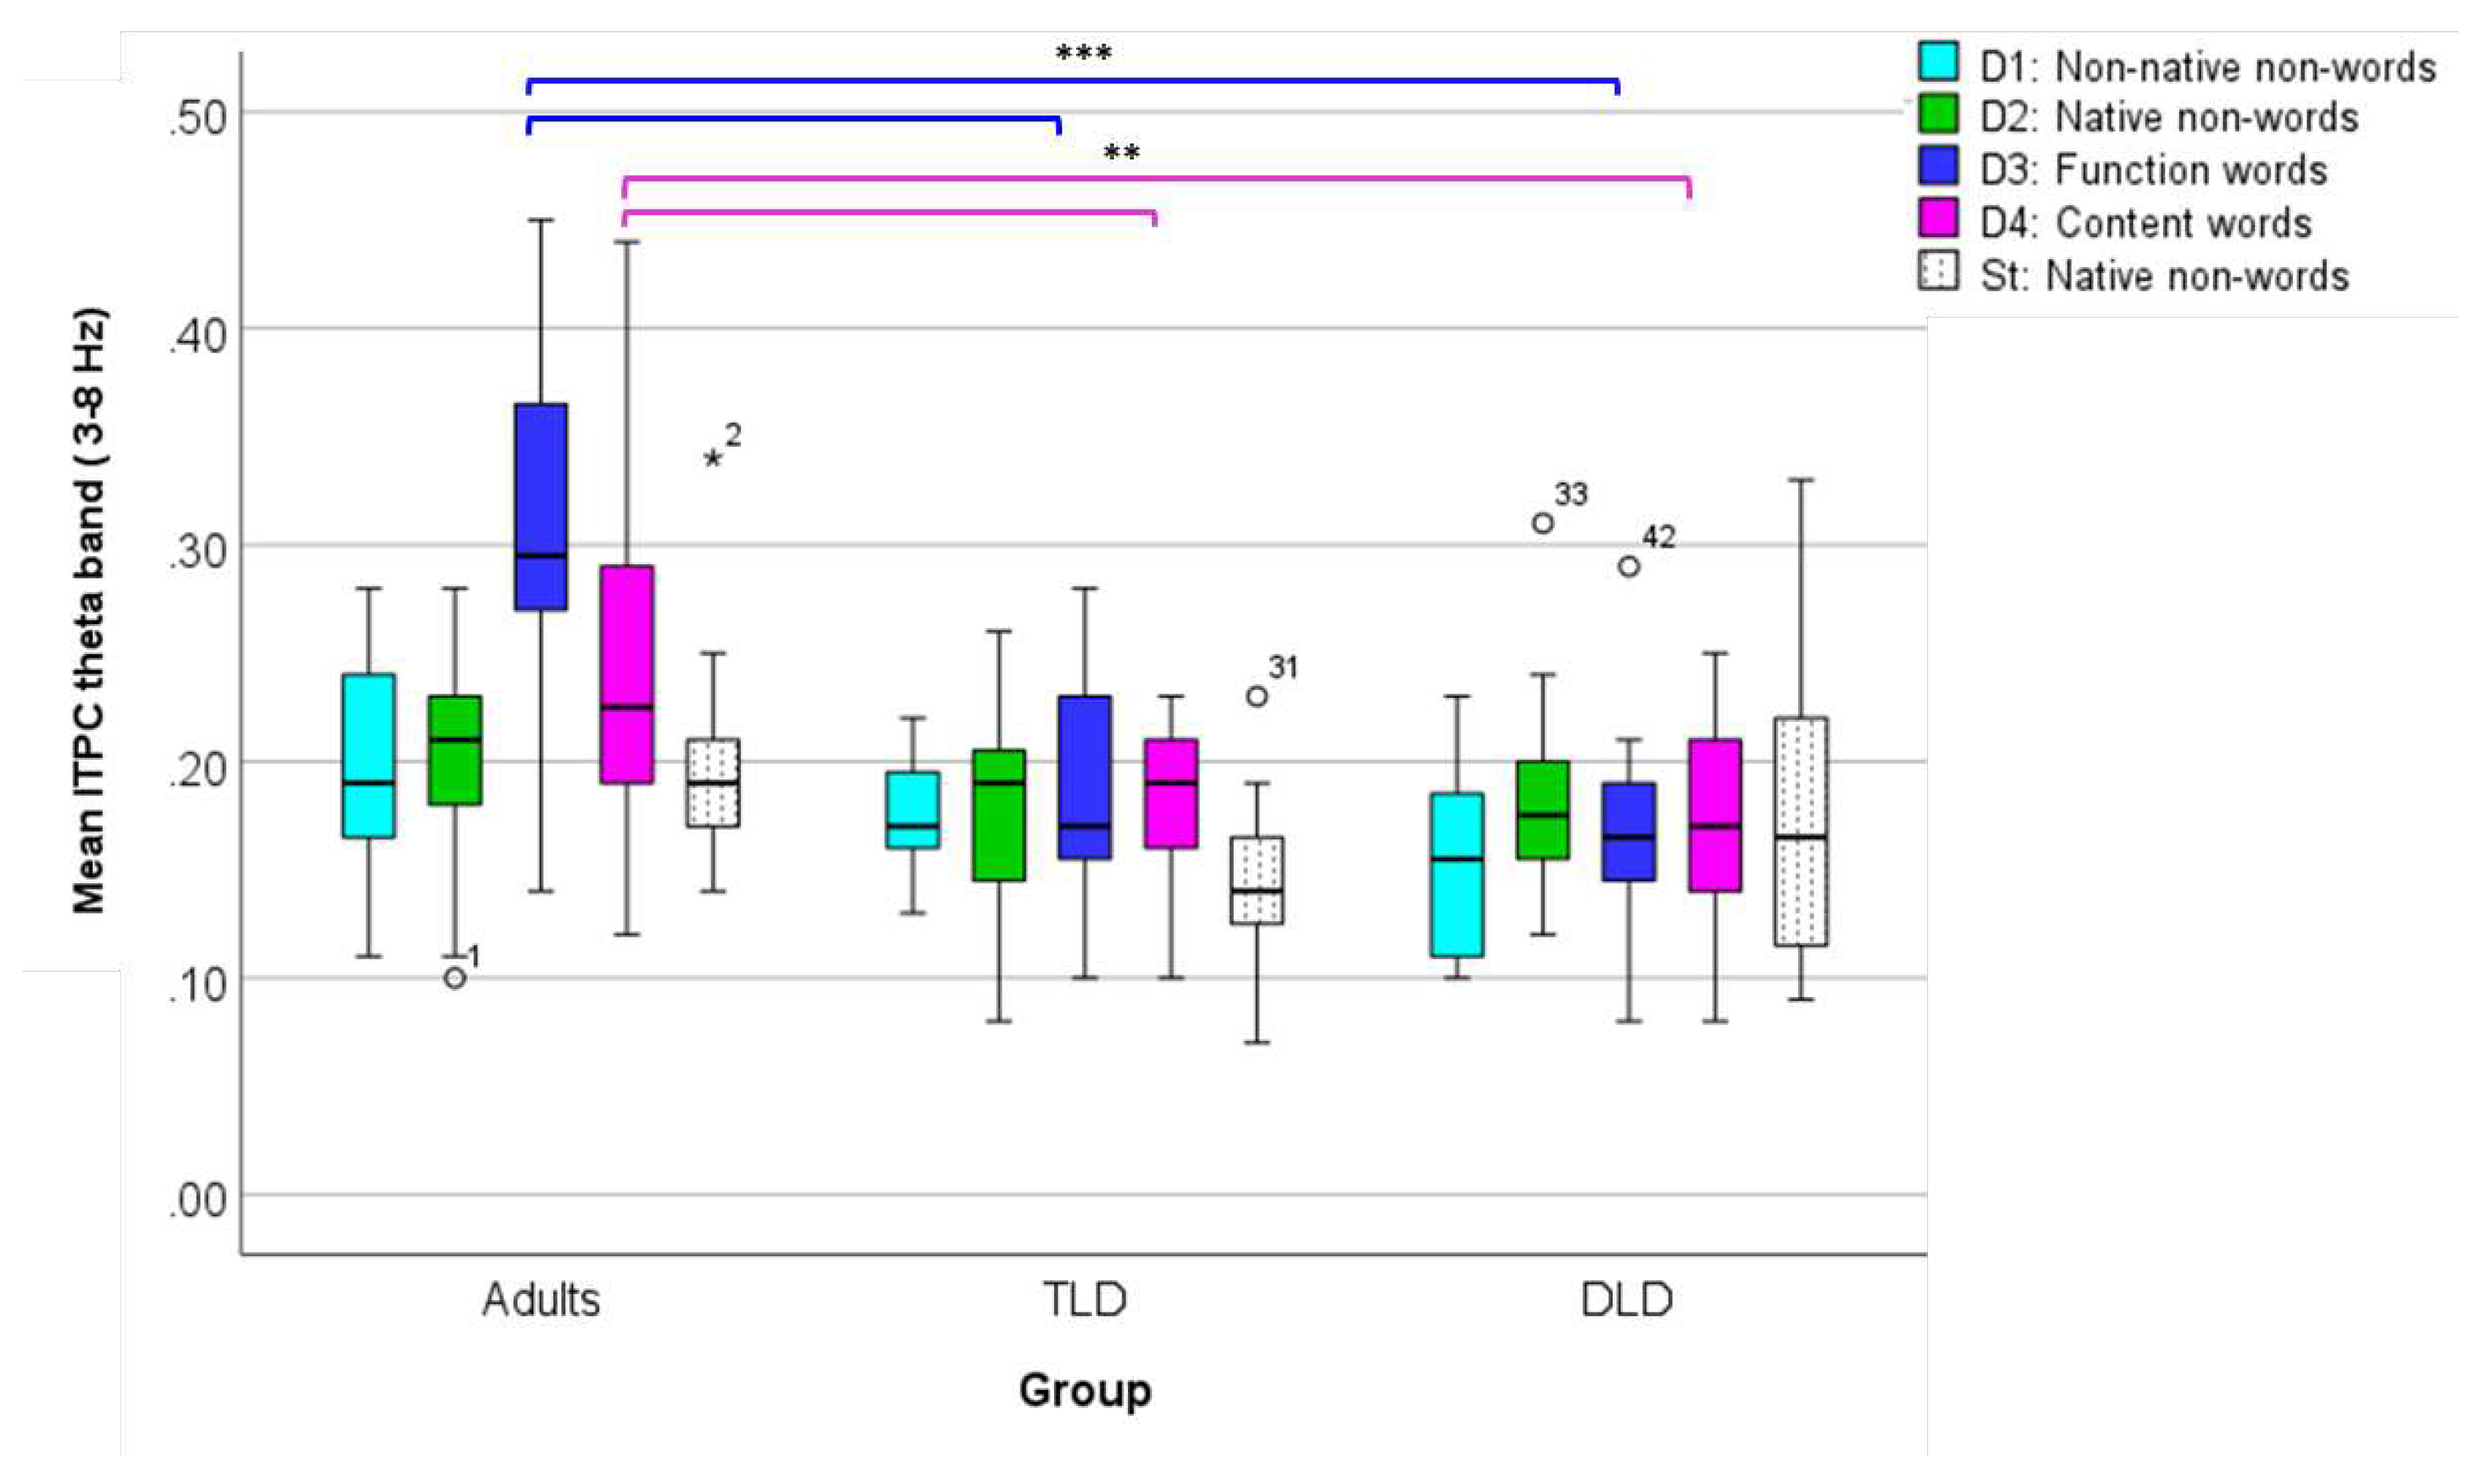
There was also a significant main effect of Group [F(2,44)=18.85, p< .001], with a large effect size (ηp2 = 0.461) and adequate power (100%), with larger theta ITPC for adults (M=.23, SD=.061) than for the TLD (M=.17, SD=.093) and DLD (M=.17, SD=.051) groups. Finally, there was a significant Stimulus Type*Group interaction [F(8,176)=5.06, p<.001], with a large effect size (ηp2 = 0.187), and adequate statistical power (99%). The interaction was followed-up with one-way ANOVAs (Bonferroni-corrected p=.01), comparing theta ITPC between groups for each Stimulus Type triad. For meaningless stimuli (non-words), theta ITPC showed no significant between-group differences for non-native non-words [F(2,44)=4.003, p= .025] or native non-words [F(2,44)=1.194, p= .313], as well as for standard stimuli [F(2,44)=3.117, p= .054].
On the contrary, theta ITPC for meaningful stimuli showed significant between-group differences. For function words, theta ITPC varied significantly between groups [F(2,44)=23.129, p<.001], with Tukey HSD post-hoc comparisons indicating higher phase coherence values in adults (M= .310, SD= .082) than in the TLD (M=.186, SD=.062) and DLD (M=.167, SD= .047) groups, but with no differences between both groups of children. Similarly, for content words, [F(2,44)=6.901, p=.002], Tukey HSD post-hoc test showed significantly higher values in adults (M=. 241, SD= .076) than in TLD (M=.181, SD= .040) and DLD (M=.170, SD= .051) children, but no differences between children’s groups.
Figure 10 illustrates theta ITPC average values in all groups for each stimulus type. In adults, there is a marked increase in theta phase synchrony for those stimulus with lexical status (function and content words), which is not present in the groups of children. For all other stimulus, theta ITPC is rather similar within and between groups.
Figure 10. Box plots for theta band ITPC (ROI 1) for each stimulus type, all groups. ITPC range: 0-1. (***) significant at the 0.001 level. (**) significant at the 0.01 level.
Preprints 90706 g009
Next, we compared ITPC in the alpha band (ROI 2). Table 3.11, presents the descriptive statistics for alpha ITPC, indicating higher values for adults than for children, especially for non-words (all types). Between children’s groups, alpha ITPC values look similar for standards, but are higher in the DLD than in the TLD group for non-word deviants and content words, and higher in the TLD group for function words.
Table 9. Descriptive statistics for average alpha ITPC (ROI 2), all groups.
TLD (n=11) DLD (n=16) Adults (n=20)
M SD M SD M SD
Non-native non-words .146 .043 .166 .065 .175 .047
Native non-words .146 .053 .176 .061 .223 .075
Function words .156 .054 .127 .040 .246 .082
Content words .134 .034 .159 .065 .197 .052
St (native non-word) .143 .065 .154 .074 .205 .065
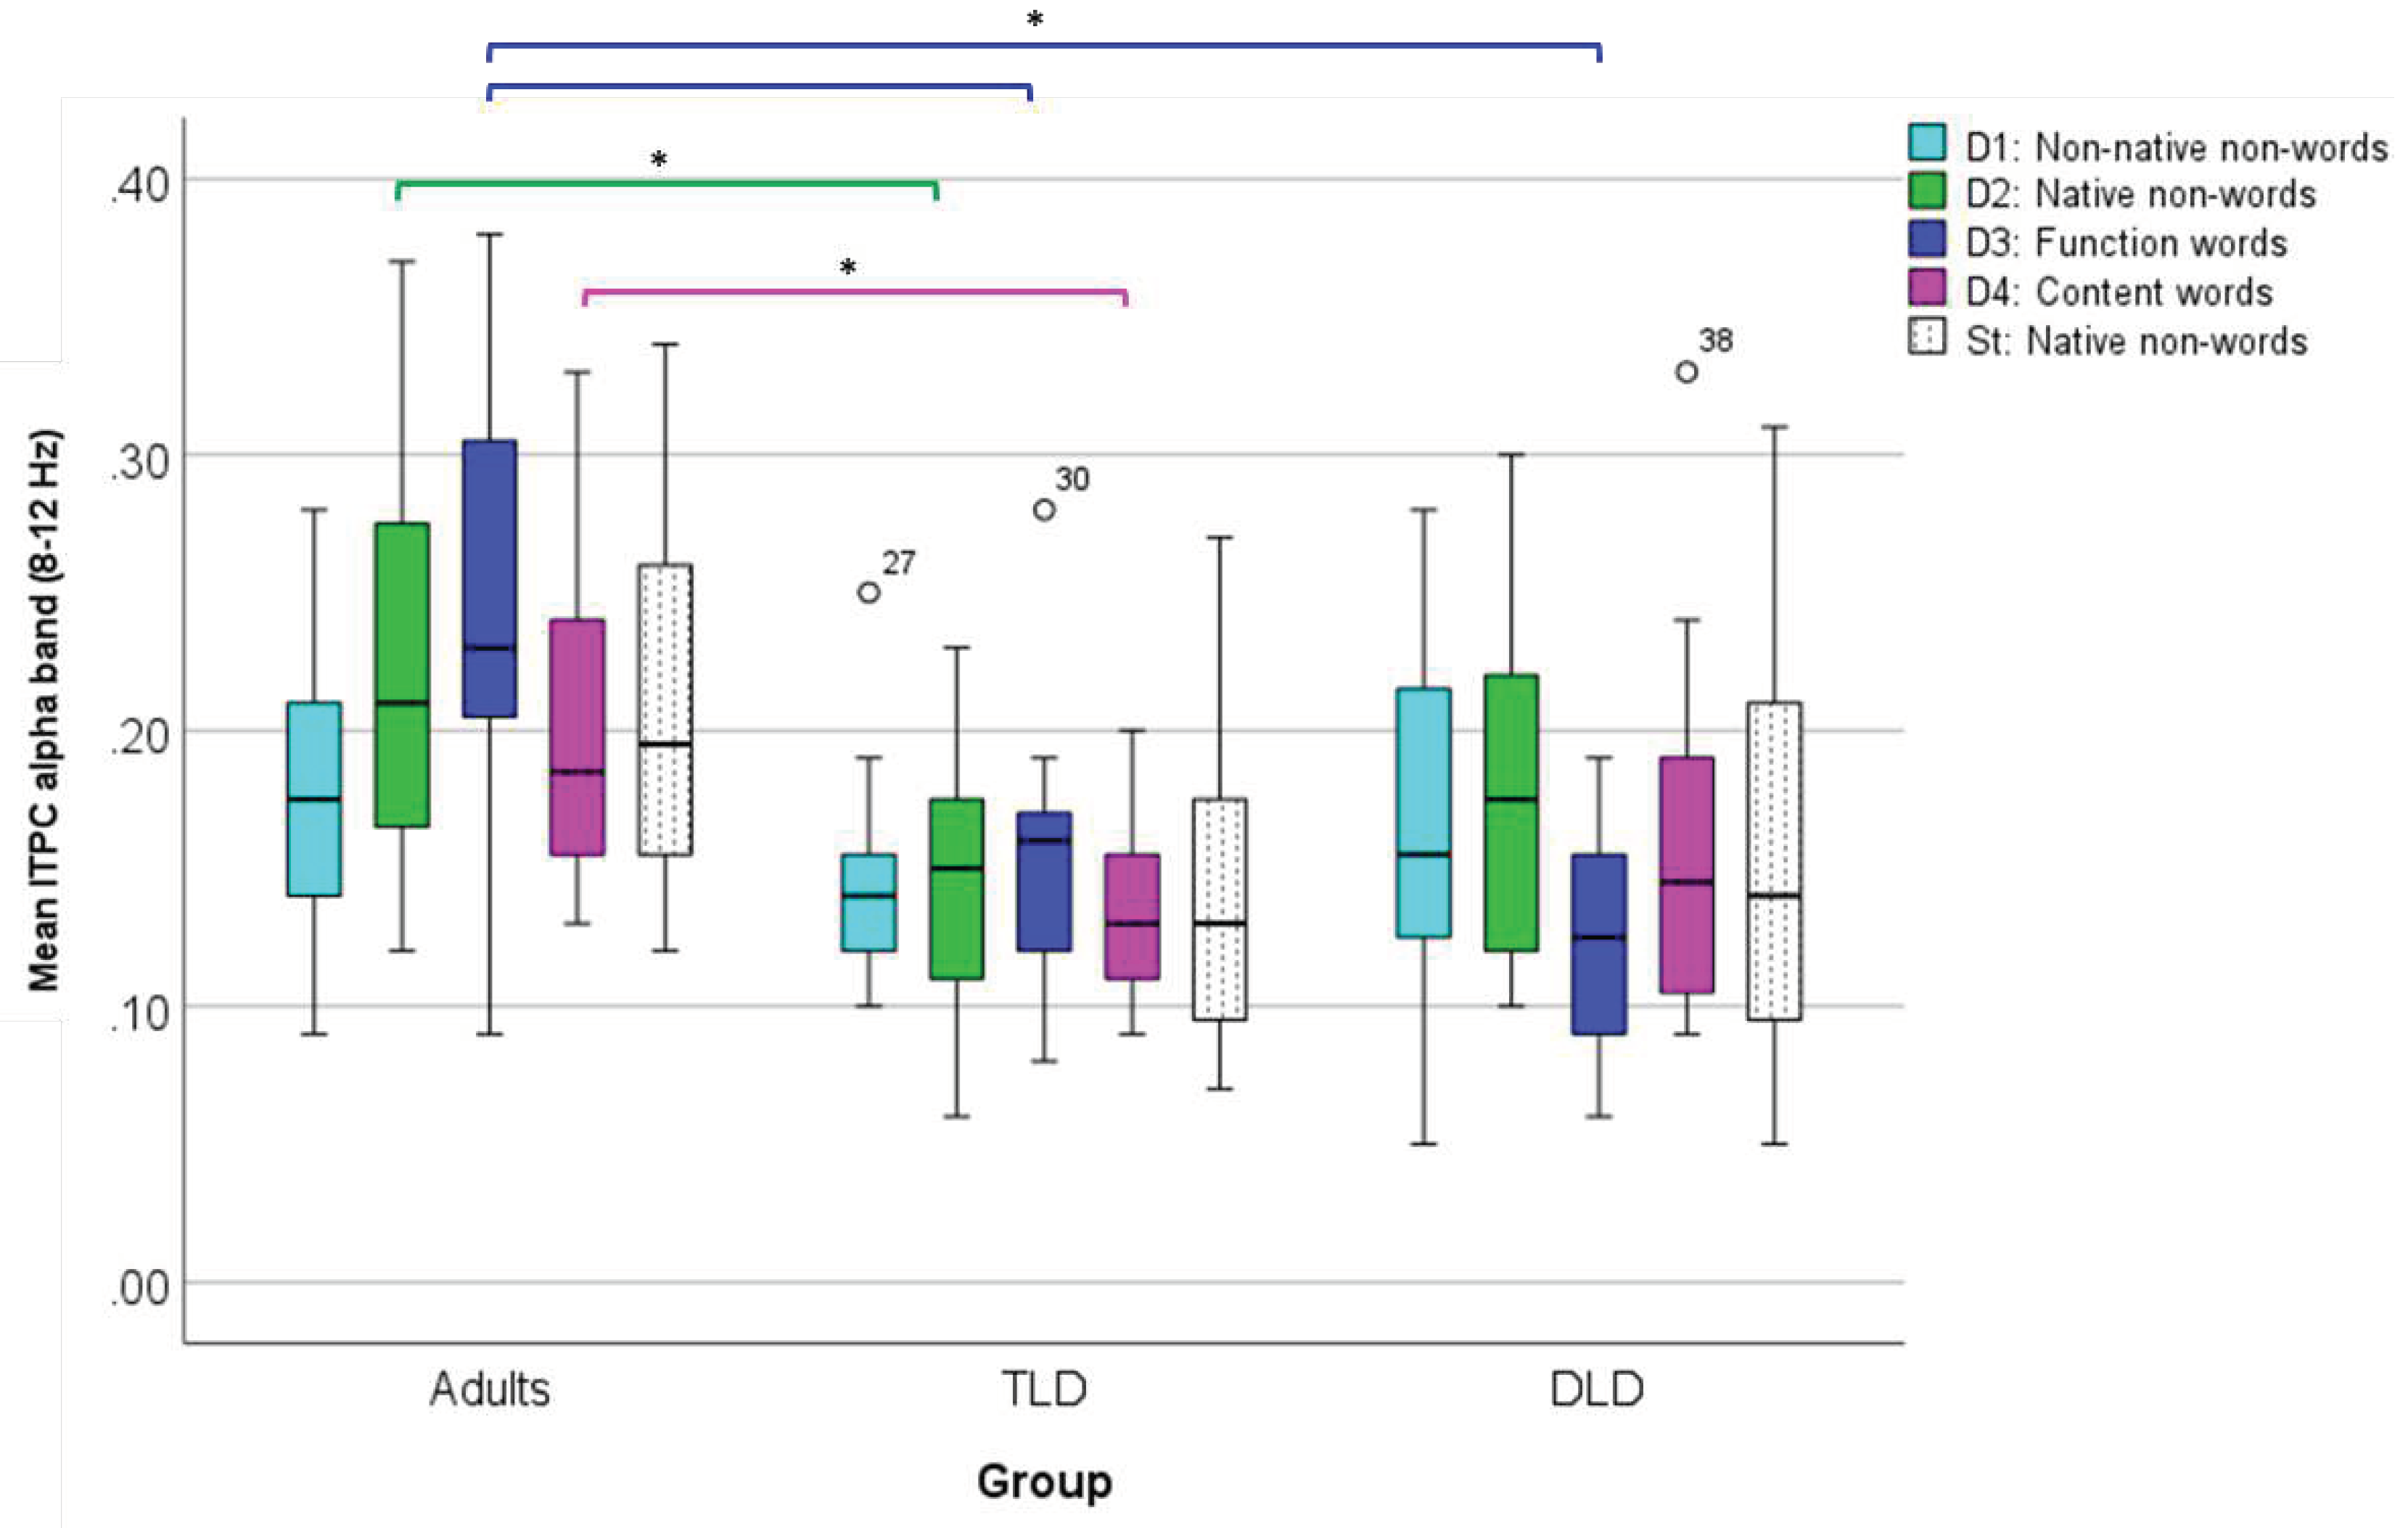
To compare changes in alpha band ITPC (ROI 2) between groups, we conducted a repeated-measures ANOVA with the same factors as for theta, after confirming that all the test assumptions were met (Appendix E). Results indicated that the main effect of Stimulus Type was non-significant [F(4,176)= 1.073, p=.371], with a small effect size (ηp2 = 0.024) and low statistical power (34%). However, there was a significant effect of Group, [F(2,44)=14.84, p<0.001],with a large effect size (ηp2 = .401) and adequate power (99%), with Tamhane’s post-hoc comparisons indicating significantly higher alpha ITPC in adults (M=.209, SD=.008) than in the TLD (M=.144, SD=.011), and the DLD (M=.156, SD=.009) groups at the p<.001 level. Also, a significant Group* Stimulus Type interaction was detected [F(8,176)=2.606, p=0.01], with a large effect size (ηp2 = .106) and adequate power (92%). Figure 11 compares mean alpha ITPC for all groups.
The interaction was followed-up with one-way ANOVAs (Tamhane post-hoc, corrected alpha=0.01) to compare each Stimulus Type triads between groups. For function words, results indicate significant between-group differences in alpha ITPC [F(2,44)=16.902, p<.001] with a large effect size (ηp2 = .434). Post-hoc pairwise comparisons indicated higher alpha ITPC in adults (M=.246, SD=.082) than in TLD children (M=.156, SD=.056) and in DLD (M=.127, SD=.039).
Similarly, adults showed significantly higher alpha ITPC for native non-words (M=.223, SD=.075, [F(2,44)=5.363, p=.008]) and for content words (M=.197, SD=.051, [F(2,44)=5.431, p=.008]) than the TLD group (M=.145, SD= .054 for native non-words, and M=.133, SD= .034, for content words), with a large effect size in both cases (η2 = .196, and η2 = .198, respectively). Finally, there were no differences between adults and the DLD group.
Figure 11. Box Plots for Alpha Band ITPC (ROI 2) for Stimulus Type, all Groups. (*) indicates significant differences at .01 level.
Preprints 90706 g010
Taken together, results from the TF analysis indicate an effect of group and the stimulus linguistic content in MMR responses. Stimuli involving meaning (function and content words) elicited greater cortical synchrony with higher ITPC in the theta band, and to a less extent, in the alpha band, but the interaction indicates this effect was only present in adults. Such effects were not detected for power change measures (ERSP).

3.2.4. Correlation between Phonological Awareness and EEG Measures

Finally, we examined whether there was an association between scores in the phonological awareness test (PECFO) and the EEG measures. As we had already compared the TLD and DLD groups in a previous section (3.1), the current analysis pooled all children together, regardless their language status. Pearson correlation analysis was performed separately between phonological awareness scores (PECFO) and each EEG measure: mean amplitude (TW1 and TW2), ERPS and ITPC (ROI 1 and ROI 2).
Results of the correlation analysis are displayed in Table 10. No significant correlations between mean amplitude, ERSP and ITPC ROI 2 and phonological awareness scores were observed on TW1 or TW2 for any stimulus type. For ITPC ROI 1 we only observed a significant negative correlation between theta ITPC for standards and PECFO scores [r=-.467, p=.028], but this was no longer significant after Bonferroni correction for multiple comparisons was applied to each measure (alpha=0.01).

4. Discussion

The present study investigated cortical discrimination of speech contrasts with varying linguistic complexity in young children with and without DLD and in adults. Cortical speech discrimination was measured via ERP and time-frequency analysis of the MMR. As hypothesised, we detected significant MMRs for all speech stimuli in both groups of children and in adults, with different patterns between children and adults in terms of polarity, mean amplitude and ITPC. However, contrary to our expectations, we found no differences between TLD and DLD children on any of the EEG measure, nor correlation with behavioural tests of phonological abilities, although the phonological awareness scores were significantly lower in the DLD than in the TLD group. Finally, only adults were sensitivity to manipulations in the stimulus linguistic content, with more robust MMNs for higher order representations (words than non-words). These results suggest that language top-down modulations on speech perception are present in adulthood but they are not developed yet in early childhood, as children did not show enhanced responses for contrasts with lexical status. Alternatively, such top-down modulations may be present but not detectable with the current ERP paradigm in these groups of children. Importantly, we found no evidence of impaired speech processing in DLD at the cortical level, indicating that speech perception in children with DLD and TLD could be similar, although such null results should be interpreted cautiously.
Importantly, our results confirm that all our stimulus types elicited at least one significant negative or positive MMR for all our groups. However, a key difference of the children with the adult group was the lack of significant early MMNs in children for most non-words, and of later LDNs for all stimulus types. These findings contradict previous literature reporting an early presence of the MMN [30] and greater LDNs in children than adults [13]. For example, Kuuluvainen et al. [39] reported that different speech and nonspeech contrasts elicited significant MMNs between 200-350 ms and LDNs for the 350-500 interval. However, children in their study were 6–7-year-old, thus older than our participants and their speech stimuli did not include change in the meaning. An alternative explanation for the lack of MMN/LDNs relates to a possible attenuation effect of an extended ISI duration. In young children, the MMR reflects sensory memory capacity which has been reported to increase between the ages of 2 and 6 years resulting in progressively better discrimination of memory traces at longer delays, this is ISIs over 500 ms [83]. In our experiment, we used an ISI of 1000 ms to avoid neural refractoriness [16], however, this could have had a detrimental effect in eliciting the MMN/LDN.
As predicted, we observed that both groups of children exhibited immature responses when compared to adults as indicated by positive MMRs during the MMN and LDN intervals. Previous literature have described a positive polarity for the MMR for infants [31] and, for children, until the age of 7 years in response to complex stimuli [24]. On the contrary, other studies in pre-schoolers [39, 43] indicate one could expect a typical, adult-resembling MMN/LDN patterns, even if occurring at longer latencies. However, we observed positive polarity only for non-words, indicating that meaningless word forms elicited more immature responses than words, maybe because the lack of meaning makes them more complex to perceive. This interpretation contradicts the possible lack of top-down language effects discussed earlier, but could be explained by the fact that point-by-point analysis reveals differences that are no longer detectable when averaging values across a time-window (e.g. because they are cancelled out). In addition, scalp patterns in children showed broad distributions, especially for the later time-window (TW2), instead of the more focalised responses often seen in adults [30] also indicating less mature MMRs.
Another indicator of immaturity is that children exhibited greater MMR latency and longer duration (for example, a 164-ms-long MMR for native non-words in the DLD group), making it hard to differentiate early and late MMRs for some stimuli, and to compare latencies between groups, particularly, for non-words. In the literature, responses in 3-year-olds for monosyllabic function words differing in their final consonant peaked at 262 ms after deviance [28]. Strotseva-Feinschmidt et al., [44], reported latencies between 180 and 350 ms in children between 5–8 years, whereas Paquette et al, [27] showed MMRs for phonemic contrasts peaking at 272 ms in 3 to 7 year-old children. These findings are consistent with the MMR latency and duration we observed for non-words but occur much later than the responses we detected for function and content words. Again, this could indicate easier and faster cortical processing of meaningful stimuli. For phoneme or word deviants, Strotseva-Feinschmidt et al. [44], who used similar stimuli as in our study (contrasts between monosyllabic function words) in the same age group, reported overall latencies of 400 ms for the MMN and 700 ms for the LDN, which are much longer. However, the use of peak measures for ERPs may be sub-optimal as they are sensitive to noise level [79], which can be high in paediatric EEG [85].
Regarding the MMR mean amplitude, our findings are partially consistent with previous literature. For example, Paquette et al, [27] reported an amplitude of - .067 µV at Fz for phonemic contrasts in 3–7-year-old children, which agrees with our results for non-words in TW2 but not in TW1, in which children showed much larger negative values. The lack of amplitude differences between the two groups of children is consistent with multiple studies failing to differentiate TLD and DLD groups based on speech-elicited MMRs [20]. When comparing children versus adults, our findings support our prediction of significantly smaller amplitude in adults than children, but this occurred only for words in TW1. Contrary to our hypothesis, mean amplitude was smaller in children than adults, but only for the DLD group in TW2 for native non-words. This resembles previous findings of smaller MMN amplitudes for 6-year-old children [69].
In terms of TF analysis, we confirmed less synchronized activity in children than adults but only for words and when measured by ITPC but not by ERSP. Theta ERSP was affected by the linguistic content (stimulus type), with reduced power change for standards than for most deviants (except function words), which is consistent with the idea of increased theta synchronisation for novel stimuli. Larger ERSP for deviants is consistent with findings reported by Fuentemilla et al. [58] and Hsiao et al. [59, 60]. The lack of power differences we observed between standards and function words could be explained by a larger ERP negativity, thus, the lack of significant effect may result from acoustic differences. However, if this is the case, we would expect to see a consistent pattern for function words along all measures that was not present, for example, increased amplitude with higher ERSP and ITPC. Importantly, there were no ERSP differences between groups of children, or between children and adults contradicting our predictions, but in line with findings reported by Bishop and colleagues [13]. Also, it is worth considering some methodological issues in our ERSP analysis: (i) Determing ROIs by visual inspection of the condition average plots was suboptimal, as despite baseline correction, the adult plot presented unexplained pre-stimulus negative alpha power, suggesting a remaining artifact, and (ii) For most analysis the effect size was small, except for ITPC, meaning that some between-group differences may have gone undetected.
On the contrary, ITPC in the theta band (and to a less extent in alpha) showed a main effect of linguistic content and language status, with a significant interaction between them, all with large effect size. This is a key finding as it indicates higher synchrony in adults than children but only for meaningful stimuli (function and content words), consistent with our hypothesis of greater top-down language modulations for higher order linguistic representations in participants with more advanced language skills. Previous research has linked increased theta ITPC to syllable encoding and discrimination [82] whereas alpha ITPC is thought to reflect automatic allocation of attentional resources for speech sounds and inhibition of task-irrelevant stimuli [87]. The presence of robust ITPC differences indicates more efficient responses to speech in adults than children, which is in line with previous studies. This aligns with Skeide & Friederici’s [19] proposal of greater bottom-up and slow emergence of top-down modulations after the age of six years. However, as there is no difference between TLD and DLD children, it could be argued that our results come from brain maturational changes (effect of age) rather than top-down influences based on linguistic abilities.
Finally, phonological awareness test scores did not correlate with any EEG measure, even though significantly lower scores were observed in the DLD than in the TLD group. This contradicts previous evidence of better phonological skills associated with larger MMNs for phonemic changes in 5-6 year-old children [50], but is consistent with many studies that report no clear links between ERPs and behavioural measures.
To our knowledge, this is the first study to use a multifeature paradigm in Spanish-speaking preschoolers with DLD diagnosis and to compare their responses to age-matched TLD controls and adults. Moreover, few MMR studies in children have used not only syllables or non-words but also words and validated the experiment in a previous study to obtain reference adult response patterns. One contribution of this study is that we confirmed that our multifeature experiment was able to elicit robust MMR in young children presenting multiple speech deviants while reducing the EEG testing time. In less than 20 minutes (plus set-up times), it was possible to collect enough clean data for all the children that underwent the EEG session, as demonstrated by noise levels under 35% for all participants and stimulus type. Combining artifact rejection and correction procedures, we were able to include the data of all the participants, with a minimum of 42 trials per stimulus type which is well above the standard threshold for paediatric studies (10 trials, according to [22]). This highlights the importance of combining manual and automatic data cleaning procedures to improve data quality [56], helping to reduce data loss and sampling bias due to participant’s exclusion [22].
Retaining all the participants was especially important for this study, as one of the main limitations was the small sample size for each group, which was a consequence of the COVID-19 pandemic restrictions for data collection. Although small samples are not uncommon in children EEG studies because of difficult recruitment and high drop-out rates [18], especially for including clinical groups, is worth noting that the reduced number of child participants may have affected the statistical power of our results. This is a relevant aspect to consider in paediatric EEG studies, as even children with typical development show high inter-individual variability, which makes it harder to detect differences between TLD and DLD children. Importantly, differences in the language and cognitive skills within the DLD group could have influenced the MMR results. Although all language-impaired children in this study had an expressive-receptive disorder diagnosis, it was impossible to determine the exact level of homogeneity in their language development and cognitive profiles. This could have introduced higher variability in their MMR impeding a distinction between the DLD and TLD groups based on their cortical activity. Moreover, a large body of evidence indicates that the language symptoms in DLD are dynamic over time [88, 89], suggesting that identifying neural markers of language outcomes at the group level could be more challenging than expected.
A second limitation is that, our stimuli differed in their acoustic structure. Acoustical matching of the initial phonemes for non-words was considerably easier than for word stimuli, as they should also be matched in their age of acquisition and oral frequency. Thus, larger acoustic differences rather than effects of language knowledge or linguistic content may have driven some of our results, as in Lee et al. [90], who reported negative, adult-like MMRs for larger syllabic deviants and positive MMRs for small deviants. However, if this were the case, we would expect a consistency between the different EEG measures; for example, greater MMR amplitude should coincide with greater ERSP and ITPC for the same type of stimulus, which we did not found.
An important remaining question is what EEG analysis and statistical methods are more suitable when comparing cortical speech perception responses between groups of children, and children versus adults, given the high diversity of latencies and amplitude values, electrodes and time windows reported in the previous literature. This complicates the a priori selection of time windows and electrodes for analysis, as findings vary substantially across studies. A possible approach to reduce bias in our ERP analysis to follow the same steps used in the TF analysis for determining ROIs for amplitude and latency, for example, using global field power from the total group average as in François et al. [91]. Nevertheless, a contribution of this study is that it confirms that ITPC is a robust measure, probably a more suitable one for comparing children and adults, chiefly, because ITPC results showed large effect sizes, which was not the case for the ERSP and ERP measures. Moreover, theta ITPC increases were independent of changes in amplitude or power, as the MMN amplitude was not larger for adults than children, and the ERSP showed no between-group differences. Thus, our findings corroborate the value of TF analysis, as a relevant complement to ERP measures, encouraging its use in further speech perception development studies. However, it is important to note that ITPC distortions may also occur due to effects of noise or small ERP amplitude [92].
Future research in TLD/DLD groups could explore other EEG measures related with speech perception, as resting-state analysis or linear modelling of continuous speech tracking, helping to increase the ecological validity of the experiments. Another possibility is to replicate this study in older children, ideally by a longitudinal, follow-up study to re-test these same children at later age or a new group of older participants. Likewise, other statistical methods could be more informative than MUA or ANOVA as these assume independence of observations, which contradicts the multivariate nature of the EEG [93]. For example, multivariate pattern analysis (MVPA) could determine if children can be correctly classified into groups based on individual EEG measures [94]

5. Conclusions

Taken together, these findings confirm that the adult group showed more consistent speech processing responses than children, but in children this was not determined by their typical or atypical language status. Importantly, the fact that adults showed greater ITPC in theta (and alpha) bands for function and content words, indicates that they may detect phonemic changes better than children, but they do so when these contrasts are contained in meaningful word forms and not in non-words. The lack of that top-down language effects on the TLD/DLD groups suggest these emerge at some point in childhood although later than the age range we studied, although it could also be explained by the characteristics of our sample and stimuli. Thus, future studies could explore language modulations on speech processing in TLD/DLD children at older ages, for example, late childhood or adolescence

Author Contributions

Conceptualization, A.C. and O.T.; methodology, A.C., J.T. and O.T.; validation, A.C., J.T. and O.T.; formal analysis, A.C.; writing—original draft preparation, A.C.; writing—review and editing, O.T.; visualization, A.C.; supervision, J.T and O.T. All authors have read and agreed to the published version of the manuscript.

Funding

This research was funded by ANID CHILE, PhD studentship 3814/2018, and supported by Funds for Woman Graduates (FfWG), UK. FfWG provide grants, bursaries and fellowships to women graduates to help with living expenses.

Institutional Review Board Statement

This study was conducted in accordance with the Declaration of Helsinki, and approved by University College London Research Ethics (protocol code CEHP/2018/906, approved on 18/10/2018) and Universidad de Chile, Faculty of Medicine Research Ethics Committee (protocol code 007/2019, approved on 17/05/2019).

Informed Consent Statement

Informed consent was obtained from all subjects involved in the study and in the case of children, from their parents/guardians.

Data Availability Statement

The data generated and analysed in this study are available on reasonable request from the corresponding author. The data are not publicly available as they are human data from adults and children in neurotypical and clinical groups.

Acknowledgments

We thank Dr Lorna Halliday (University of Cambridge) for useful discussions and advice. We also thank Dr Rocio Loyola and Flga Claudia Gonzalez (Universidad de Chile) for assistance in data collection. Special thanks to Prof. Pedro Maldonado (Universidad de Chile) for providing access to his research facilities in Santiago, Chile.

Conflicts of Interest

The authors declare no conflict of interest. The funders had no role in the design of the study; in the collection, analyses, or interpretation of data; in the writing of the manuscript; or in the decision to publish the results.

Appendix A

Table A1. MUA results for MMR identification at Fz, all groups.
TLD DLD Adults
Critical t-scores Test-wise alpha upper bound FDR Critical t-scores Test-wise alpha Upper bound FDR Critical t-scores Test-wise alpha Upper bound FDR
Non-Nat
Non-words
-3.24 /
3.24
0.009 0.6 -3.25 /
3.25
0.005 0.4 -2.85 /2.85 0.01 0.6
Native non-words -3.07 /
3.07
0.012 0.7 -2.78 /
2.78
0.014 2.0 -2.80 /2.80 0.01 0.7
Function Words -3.19 /
3.19
0.010 0.6 -2.81 /
2.81
0.013 1.1 -2.69 /2.69 0.02 0.9
Content
Words
-- 0.002 -- -3.34 /
3.34
0.005 0.4 -2.41 /2.41 0.03 1.4
Words -3.74 /
3.74
0.004 0.3 -2.98 /
2.98
0.010 0.6
Note: For TLD/DLD time window: 100-550 ms; Adults time window: 50-550 ms. TLD group, dF=10; DLD group, df=15; Adults df=19.

Appendix B

Table A2. ANOVA assumptions check for variable Mean Amplitude (TW1).
Mean Amplitude (100-250 ms, Peak Centred)
Homogeneity of Varianceᵃ Normalityᵇ
DW type Levene st. df1 df2 p Group Shap.-Wilk st. df p
DW1 3.7 2 44 .033 Adults .943 20 .277
TLD .975 11 .935
DLD .92 16 .168
DW2 0.429 2 44 .654 Adults .97 20 .761
TLD .79 11 .007
DLD .939 16 .336
Words 4.659 2 44 .015 Adults .927 20 .133
TLD .929 11 .398
DLD .98 16 .966
DW3 5.104 2 44 .01 Adults .922 20 .109
TLD .865 11 .066
DLD .946 16 .436
DW4 5.046 2 44 .011 Adults .981 20 .943
TLD .922 11 .334
DLD .933 16 .276
Phonological Awareness Test
TLD     873        8    .162
DLD      .909        14    .151
Within Subjects Effect: Stimulus Type
Equality of Covariance Matricesᶜ Sphericityᵈ
Box's M F df1 df2 p Mauchly's W Approx. Chi^2 df p
93.16 2.538 30 3795 <.001 0.181 72.46 9 <.001
Note. Significant tests are indicated in bold fonts. ᵃ Tests the null hypothesis of equal variances across groups, ᵇ Tests the null hypothesis of a normal data distribution, ᶜ Tests the null hypothesis of equal observed covariance matrices of the dependent variables (DV) across groups. ᵈ Tests the null hypothesis that the error covariance matrix of the orthonormalized transformed DVs, is proportional to an identity matrix.

Appendix C

Table A3. ANOVA assumptions check for variable Mean Amplitude (TW2).
Mean Amplitude (250-400 ms, Peak Centred)
Homogeneity of Varianceᵃ Normalityᵇ
DW type Levene st. df1 df2 p Group Shap.-Wilk st. df p
DW1 4.087 2 44 .024 Adults .929 20 .151
TLD .916 11 .288
DLD .983 16 .981
DW2 4.533 2 44 .016 Adults .979 20 .920
TLD .910 11 .242
DLD .878 16 .036
Words 1.048 2 44 .359 Adults .857 20 .007
TLD .767 11 .003
DLD .959 16 .645
DW3 3.070 2 44 .056 Adults .961 20 .574
TLD .970 11 .884
DLD .939 16 .340
DW4 4.675 2 44 .014 Adults .849 20 .005
TLD .937 11 .489
DLD .946 16 .433
Within Subjects Effect: Stimulus Type
Equality of Covariance Matricesᶜ Sphericityᵈ
Box's M F df1 df2 p Mauchly's W Approx. Chi^2 df p
109.75 2.99 30 3795 <.001 .240 60.53 9 <.001
Note. Significant tests are indicated in bold fonts. ᵃ Tests the null hypothesis of equal variances across groups, ᵇ Tests the null hypothesis of a normal data distribution, ᶜ Tests the null hypothesis that the observed covariance matrices of the DVs are equal, across groups. ᵈ Tests the null hypothesis that the error covariance matrix of the orthonormalized transformed DVs is proportional to an identity matrix.

Appendix D

Table A4. MUA results for MMR amplitude comparisons in TLD/DLD children.
100-250 ms 250-400 ms
All FDR adjusted p-values ≥ All FDR adjusted p-values ≥
Non-native non-words 0.869 0.853
Native non-words 0.275 0.492
Function words 0.558 0.404
Content words 0.725 0.618
Words 0.978 0.478
Note: t-score degrees of freedom=25, total comparisons = 19 (number of time points, exact boundaries102-246 and 246-398 ms).

Appendix E

Table A5. ANOVA assumptions check for variable: ERSP.
ERSP
Homogeneity of Varianceᵃ Normalityᵇ
Stimulus Type Levene st. df1 df2 p Group Shap.-Wilk st. df p
D1 2.043 2 44 .142 Adults .940 20 .235
TLD .881 11 .108
DLD .919 16 .163
D2 1.657 2 44 .202 Adults .965 20 .658
TLD .894 11 .157
DLD .922 16 .180
D3 .274 2 44 .762 Adults .959 20 .519
TLD .859 11 .056
DLD .955 16 .573
D4 1.033 2 44 .364 Adults .969 20 .726
TLD .788 11 .007
DLD .963 16 .711
St 1.005 2 44 .374 Adults .955 20 .441
TLD .903 11 .203
DLD .960 16 .661
Within Subjects Effect: Stimulus Type
Equality of Covariance Matricesᶜ Sphericityᵈ
Box's M F df1 df2 p Mauchly's W Approx. Chi^2 df p
69.32 1.89 30 3795 .002 .355 43.91 9 <.001
Note. Significant tests are indicated in bold fonts. ᵃ Tests the null hypothesis of equal variances across groups, ᵇ Tests the null hypothesis of a normal data distribution, ᶜ Tests the null hypothesis that the observed covariance matrices of the dependent variables are, equal across groups. ᵈ Tests the null hypothesis that the error covariance matrix of the orthonormalized transformed, dependent variables is proportional to an identity matrix.

Appendix F

Table A6. ANOVA assumptions check for variable ITPC.
ROI 1
Homogeneity of Varianceᵃ Normalityᵇ
Stimulus Type Levene st. df1 df2 p Group Shap.-Wilk st df p
D1 2.806 2 44 .071 Adults .953 20 .407
TLD .967 11 .86
DLD .891 16 .059
D2 .316 2 44 .731 Adults .928 20 .141
TLD .932 11 .428
DLD .879 16 .037
D3 2.198 2 44 .123 Adults .965 20 .64
TLD .928 11 .39
DLD .931 16 .25
D4 2.291 2 44 .113 Adults .944 20 .286
TLD .945 11 .583
DLD .968 16 .811
St 2.746 2 44 .075 Adults .872 20 .013
TLD .983 11 .982
DLD .926 16 .211
ROI2
Homogeneity of Varianceᵃ Normalityᵇ
Stimulus
Type
Levene st. df1 df2 p Group Shap.-Wilk st df p
D1 1.748 2 44 .186 Adults .97 20 .761
TLD .849 11 .042
DLD .981 16 .97
D2 .980 2 44 .383 Adults .941 20 .245
TLD .972 11 .903
DLD .945 16 .419
D3 4.083 2 44 .024 Adults .961 20 .555
TLD .915 11 .278
DLD .956 16 .592
D4 1.916 2 44 .159 Adults .912 20 .069
TLD .933 11 .439
DLD .877 16 .035
St .453 2 44 .639 Adults .97 20 .761
TLD .849 11 .042
DLD .981 16 .97
Equality of Covariance Matricesᶜ Sphericityᵈ
ROI Box's M F df1 df2 p Mauchly's W Approx. Chi^2 df p
1 35.75 .974 30 3795 .506 .779 10.57 9 .306
2 36.03 .982 30 3795 .495 .845 7.13 9 .624
Note. Significant tests are indicated in bold fonts. ᵃ, ᵇ,ᶜ, ᵈ, as in Appendix C.

References

  1. Tomblin, J. B., Records, N. L., Buckwalter, P., Zhang, X., Smith, E., & O’Brien, M. (1997). Prevalence of specific language impairment in kindergarten children. Journal of Speech, Language, and Hearing Research, 40(6), 1245-1260. [CrossRef]
  2. Sussman JE. Perception of formant transition cues to place of articulation in children with language impairments. Journal of Speech and Hearing Research. 1993;36:1286–1299. [CrossRef]
  3. Schwartz, R. G., Scheffler, F. L., & Lopez, K. (2013). Speech perception and lexical effects in specific language impairment. Clinical linguistics & phonetics, 27(5), 339–354. [CrossRef]
  4. Bishop, D. V., Hardiman, M., Uwer, R., & von Suchodoletz, W. (2007). Maturation of the long-latency auditory ERP: step function changes at start and end of adolescence. Developmental science, 10(5), 565–575. [CrossRef]
  5. Kujala, T. (2007). The role of early auditory discrimination deficits in language disorders. Journal of Psychophysiology, 21(3-4), 239-250. [CrossRef]
  6. Ziegler, J. C., Pech-Georgel, C., George, F., Alario, F. X., & Lorenzi, C. (2005). Deficits in speech perception predict language learning impairment. Proceedings of the National Academy of Sciences, 102(39), 14110-14115. [CrossRef]
  7. Friederici, A. D. "The neural basis of language development and its impairment." Neuron 52.6 (2006): 941-952.
  8. Bishop, D. V. M., Hardiman, M. J., & Barry, J. G. (2012). Auditory deficit as a consequence rather than endophenotype of specific language impairment: electrophysiological evidence. PLoS One, 7(5), e35851. [CrossRef]
  9. Bishop, D.V. M., Carlyon, R. P., Deeks, J. M., & Bishop, S. J. (1999). Auditory temporal processing impairment: Neither necessary nor sufficient for causing language impairment in children. Journal of Speech, Language, and Hearing Research, 42(6), 1295-1310. [CrossRef]
  10. Bishop, D. V. M., & McArthur, G. M. (2005). Individual differences in auditory processing in specific language impairment: a follow-up study using event-related potentials and behavioural thresholds. Cortex, 41(3), 327-341. [CrossRef]
  11. Näätänen, R., Kujala, T. & Light, G. (2019). 'The development of MMN', The Mismatch Negativity: A Window to the Brain (Oxford; online edn, Oxford Academic, 23 May 2019). [CrossRef]
  12. Näätänen, R., Paavilainen, P., Rinne, T., & Alho, K. (2007). The mismatch negativity (MMN) in basic research of central auditory processing: a review. Clinical Neurophysiology, 118(12), 2544-2590. [CrossRef]
  13. Bishop, D. V. M., Hardiman, M. J., & Barry, J. G. (2010a). Is auditory discrimination mature by middle childhood? A study using time-frequency analysis of mismatch responses from 7 years to adulthood. Developmental Science, 14(2), 402-416. [CrossRef]
  14. Cheour, M., Korpilahti, P., Martynova, O., & Lang, A. H. (2001). Mismatch negativity and late discriminative negativity in investigating speech perception and learning in children and infants. Audiology and Neurotology, 6(1), 2-11. [CrossRef]
  15. David, C., Roux, S., Bonnet-Brilhault, F., Ferré, S., & Gomot, M. (2020). Brain responses to change in phonological structures of varying complexity in children and adults. Psychophysiology, 57(9), e13621. [CrossRef]
  16. Morr, M. L., Shafer, V. L., Kreuzer, J. A., & Kurtzberg, D. (2002). Maturation of mismatch negativity in typically developing infants and preschool children. Ear and Hearing, 23(2), 118–136. [CrossRef]
  17. Baart, M., & Samuel, A. G. (2015). Early processing of auditory lexical predictions revealed by ERPs. Neuroscience Letters, 585, 98-102. [CrossRef]
  18. Cutler, A. (2008). The 34th Sir Frederick Bartlett Lecture: The abstract representations in speech processing. Quarterly Journal of Experimental Psychology, 61(11), 1601-1619. [CrossRef]
  19. Skeide, M. A., & Friederici, A. D. (2016). The ontogeny of the cortical language network. Nature reviews. Neuroscience, 17(5), 323–332. [CrossRef]
  20. Kujala, T., & Leminen, M. (2017). Low-level neural auditory discrimination dysfunctions in specific language impairment—A review on mismatch negativity findings. Developmental Cognitive Neuroscience, 28, 65-75. [CrossRef]
  21. Bishop, D. V. M. (2007). Using mismatch negativity to study central auditory processing in developmental language and literacy impairments: Where are we, and where should we be going? Psychological Bulletin, 133(4), 651–672. [CrossRef]
  22. Bell, M. A., & Cuevas, K. (2012). Using EEG to study cognitive development: Issues and practices. Journal of Cognition and Development, 13(3), 281-294. [CrossRef]
  23. Shafer, V. L., Morr, M. L., Kreuzer, J. A., & Kurtzberg, D. (2000). Maturation of mismatch negativity in school-age children. Ear and Hearing, 21(3), 242–251. [CrossRef]
  24. Makeig, S., Debener, S., Onton, J., & Delorme, A. (2004). Mining event-related brain dynamics. Trends in Cognitive Sciences, 8(5), 204-210. [CrossRef]
  25. de Haan, M. (Ed.). (2007). Infant EEG and Event-Related Potentials (1st ed.). Psychology Press. [CrossRef]
  26. Sussman, E., Kujala, T., Halmetoja, J., Lyytinen, H., Alku, P., & Näätänen, R. (2004). Automatic and controlled processing of acoustic and phonetic contrasts. Hearing Research, 190(1-2), 128-140. [CrossRef]
  27. Paquette, N., Vannasing, P., Lefrançois, M., Lefebvre, F., Roy, M. S., McKerral, M. ... & Gallagher, A. (2013). Neurophysiological correlates of auditory and language development: a mismatch negativity study. Developmental Neuropsychology, 38(6), 386-401. [CrossRef]
  28. Maurer, U., Bucher, K., Brem, S., & Brandeis, D. (2003). Development of the automatic mismatch response: from frontal positivity in kindergarten children to the mismatch negativity. Clinical Neurophysiology, 114(5), 808-817. [CrossRef]
  29. Shafer, V.L., Morr, M.L., Datta, H., Kurtzberg, D., & Schwartz, R.G. (2005). Neurophysiological indexes of speech processing deficits in children with specific language impairment. Journal of Cognitive Neuroscience, 17, 1168–1180.
  30. Cheour, M., Alho, K., Čeponiené, R., Reinikainen, K., Sainio, K., Pohjavuori, M., ... & Näätänen, R. (1998). Maturation of mismatch negativity in infants. International Journal of Psychophysiology, 29(2), 217-226. [CrossRef]
  31. Cheour, M. (2007). Development of mismatch negativity (MMN) during infancy. In M. de Haan (Ed.), Infant EEG and event-related potentials (pp. 171–198). Psychology Press.
  32. Cooray, G. K., Garrido, M. I., Brismar, T., & Hyllienmark, L. (2016). The maturation of mismatch negativity networks in normal adolescence. Clinical Neurophysiology, 127(1), 520-529. [CrossRef]
  33. Rivera-Gaxiola, M., Silva-Pereyra, J., & Kuhl, P. K. (2005). Brain potentials to native and non-native speech contrasts in 7-and 11-month-old American infants. Developmental Science, 8(2), 162-172. [CrossRef]
  34. Shafer, V. L., Yu, Y. H., & Datta, H. (2010). Maturation of speech discrimination in 4- to 7-yr-old children as indexed by event-related potential mismatch responses. Ear and hearing, 31(6), 735–745. [CrossRef]
  35. Csépe, V. (1995). On the origin and development of the mismatch negativity. Ear and Hearing, 16(1), 91-104. 16(1): p 91-104, February 1995.
  36. Kraus, N., McGee, T., Micco, A., Sharma, A., Carrell, T., & Nicol, T. (1993). Mismatch negativity in school-age children to speech stimuli that are just perceptibly different. Electroencephalography and clinical neurophysiology, 88(2), 123–130. [CrossRef]
  37. Chen, Y., Tsao, F., & Liu, H. (2016). Developmental changes in brain response to speech perception in late-talking children: A longitudinal MMR study. Developmental Cognitive Neuroscience, 19, 190 - 199. [CrossRef]
  38. Cheour, M., Leppänen, P. H., & Kraus, N. (2000). Mismatch negativity (MMN) as a tool for investigating auditory discrimination and sensory memory in infants and children. Clinical neurophysiology : official journal of the International Federation of Clinical Neurophysiology, 111(1), 4–16. [CrossRef]
  39. Kuuluvainen, S., Alku, P., Makkonen, T., Lipsanen, J., & Kujala, T. (2016). Cortical speech and non-speech discrimination in relation to cognitive measures in preschool children. European Journal of Neuroscience, 43(6), 738-750. [CrossRef]
  40. Dehaene-Lambertz, G., & Baillet, S. (1998). A phonological representation in the infant brain. Neuroreport, 9(8), 1885-1888. 9(8):p 1885-1888, June 1, 1998.
  41. Werwach, A., Männel, C., Obrig, H., Friederici, A. D., & Schaadt, G. (2022). Longitudinal trajectories of electrophysiological mismatch responses in infant speech discrimination differ across speech features. Developmental cognitive neuroscience, 56, 101127. [CrossRef]
  42. Jacobsen, T., Bäß, P., Roye, A., Winkler, I., Schröger, E., & Horváth, J. (2021). Word class and word frequency in the MMN looking glass. Brain and Language, 218, 104964. [CrossRef]
  43. Čeponienė, R., Lepistö, T., Alku, P., Aro, H., & Näätänen, R. (2003). Event-related potential indices of auditory vowel processing in 3-year-old children. Clinical neurophysiology: official journal of the International Federation of Clinical Neurophysiology, 114(4), 652–661. [CrossRef]
  44. Strotseva-Feinschmidt, A., Cunitz, K., Friederici, A. D., & Gunter, T. C. (2015). Auditory Discrimination Between Function Words in Children and Adults: A Mismatch Negativity Study. Frontiers in psychology, 6, 1930. [CrossRef]
  45. Pulvermüller, F., T. Kujala, Y. Shtyrov, J. Simola, H. Tiitinen, P. Alku, K. Alho, S. Martinkauppi, R.J. Ilmoniemi, R. Näätänen, Memory traces for words as revealed by the mismatch negativity, NeuroImage 14 (2001) 607–616.
  46. Nallet, C. & Gervain, J. (2022) Atypical neural oscillations in response to speech in infants and children with speech and language impairments: a systematic review, Hearing, Balance and Communication, 20:3, 145-154. [CrossRef]
  47. Schwartz, R.G. and Shafer, V.L. (2012). The Neurobiology of Specific Language Impairment. In The Handbook of the Neuropsychology of Language (eds D. Mostofsky and M. Faust). [CrossRef]
  48. Pihko, E., Kujala, T., Mickos, A., Alku, P., Byring, R., & Korkman, M. (2008). Language impairment is reflected in auditory evoked fields. International journal of psychophysiology, 68(2), 161-169. [CrossRef]
  49. Bishop, D.V. M., Hardiman, M. J., & Barry, J. G. (2010b). Lower-frequency event-related desynchronization: a signature of late mismatch responses to sounds, which is reduced or absent in children with specific language impairment. Journal of Neuroscience, 30(46), 15578-15584. [CrossRef]
  50. Kuhl, P., & Rivera-Gaxiola, M. (2008). Neural substrates of language acquisition. Annu. Rev. Neurosci., 31, 511-534. [CrossRef]
  51. Linnavalli, T., Putkinen, V., Huotilainen, M., & Tervaniemi, M. (2017). Phoneme processing skills are reflected in children's MMN responses. Neuropsychologia, 101, 76-84. [CrossRef]
  52. Norton, E. S., MacNeill, L. A., Harriott, E. M., Allen, N., Krogh-Jespersen, S., Smyser, C. D., ... & Wakschlag, L. (2021). EEG/ERP as a pragmatic method to expand the reach of infant-toddler neuroimaging in HBCD: Promises and challenges. Developmental Cognitive Neuroscience, 51, 100988. [CrossRef]
  53. Friedrich, M., Weber, C., & Friederici, A. D. (2004). Electrophysiological evidence for delayed mismatch response in infants at-risk for specific language impairment. Psychophysiology, 41(5), 772-782. [CrossRef]
  54. Guttorm, T. K., Leppänen, P. H. T., Hämäläinen, J. A., Eklund, K. M., & Lyytinen, H. J. (2010). Newborn Event-Related Potentials Predict Poorer Pre-Reading Skills in Children at Risk for Dyslexia. Journal of Learning Disabilities, 43(5), 391–401. [CrossRef]
  55. Bishop, D. V. M., & Hardiman, M. J. (2010). Measurement of mismatch negativity in individuals: a study using single-trial analysis. Psychophysiology, 47(4), 697-705. [CrossRef]
  56. Maguire, M. J., & Abel, A. D. (2013). What changes in neural oscillations can reveal about developmental cognitive neuroscience: Language development as a case in point. Developmental Cognitive Neuroscience, 6, 125-136. [CrossRef]
  57. Cohen, M. X. (2014). Analyzing neural time series data: theory and practice. MIT press.
  58. Fuentemilla, L. L., Marco-Pallarés, J., Münte, T. F., & Grau, C. (2008). Theta EEG oscillatory activity and auditory change detection. Brain Research, 1220, 93-101. [CrossRef]
  59. Hsiao, F. J., Wu, Z. A., Ho, L. T., & Lin, Y. Y. (2009). Theta oscillation during auditory change detection: an MEG study. Biological Psychology, 81(1), 58-66. [CrossRef]
  60. Hsiao, F. J., Cheng, C. H., Liao, K. K., & Lin, Y. Y. (2010). Cortico-cortical phase synchrony in auditory mismatch processing. Biological Psychology, 84(2), 336-345. [CrossRef]
  61. Bishop, D.V. M., Anderson, M., Reid, C., & Fox, A. M. (2011). Auditory development between 7 and 11 years: an event-related potential (ERP) study. PLoS One, 6(5), e18993. [CrossRef]
  62. Müller, V., Gruber, W., Klimesch, W., & Lindenberger, U. (2009). Lifespan differences in cortical dynamics of auditory perception. Developmental Science, 12(6), 839-853. [CrossRef]
  63. Poulsen, C., Picton, T. W., & Paus, T. (2009). Age-related changes in transient and oscillatory brain responses to auditory stimulation during early adolescence. Developmental Science, 12(2), 220-235. [CrossRef]
  64. Kuhl, P. K. (2010). Brain mechanisms in early language acquisition. Neuron, 67(5), 713-727. [CrossRef]
  65. Ortiz-Mantilla, S., Hämäläinen, J. A., Musacchia, G., & Benasich, A. A. (2013). Enhancement of gamma oscillations indicates preferential processing of native over foreign phonemic contrasts in infants. Journal of Neuroscience, 33(48), 18746-18754. [CrossRef]
  66. Giraud, A. L., & Poeppel, D. (2012). Cortical oscillations and speech processing: emerging computational principles and operations. Nature Neuroscience, 15(4), 511-517. [CrossRef]
  67. Heim, S., Friedman, J. T., Keil, A., & Benasich, A. A. (2011). Reduced sensory oscillatory activity during rapid auditory processing as a correlate of language-learning impairment. Journal of Neurolinguistics, 24(5), 538-555. [CrossRef]
  68. Heim, S., Keil, A., Choudhury, N., Thomas Friedman, J., & Benasich, A. A. (2013). Early gamma oscillations during rapid auditory processing in children with a language-learning impairment: changes in neural mass activity after training. Neuropsychologia, 51(5), 990–1001. [CrossRef]
  69. Lovio, R., Pakarinen, S., Huotilainen, M., Alku, P., Silvennoinen, S., Näätänen, R., & Kujala, T. (2009). Auditory discrimination profiles of speech sound changes in 6-year-old children as determined with the multi-feature MMN paradigm. Clinical Neurophysiology, 120(5), 916-921. [CrossRef]
  70. Näätänen, R., Pakarinen, S., Rinne, T., & Takegata, R. (2004). The Mismatch Negativity (MMN): Towards the optimal paradigm. Clinical Neurophysiology, 115, 140–144.
  71. Wechsler, D. (2003). The Wechsler intelligence scale for children—fourth edition. London: Pearson.
  72. Wechsler, D. (2011). Wechsler Abbreviated Scale of Intelligence–Second Edition. Bloomington, MN: Pearson.
  73. Varela Moraga, V. M., & Barbieri, Z. D. (2015). PECFO. Prueba de evaluación de conciencia fonológica: manual anual y set de láminas.
  74. Guardia Gutiérrez, P. A. (2010). The effect of linguistic, phonetic and lexical factors on phonological skills and reading acquisition in Spanish: A longitudinal study (Doctoral dissertation, University of Cambridge). Available on https://ethos.bl.uk/OrderDetails.do?uin=uk.bl.ethos.608697.
  75. Alonso, M. A., Fernandez, A., & Díez, E. (2015). Subjective age-of-acquisition norms for 7,039 Spanish words. Behavior research methods, 47(1), 268–274.doi.org/10.3758/s13428-014-0454-.
  76. Corral, S., Ferrero, M. & Goikoetxea, E. LEXIN: A lexical database from Spanish kindergarten and first-grade readers. Behavior Research Methods 41, 1009–1017 (2009). [CrossRef]
  77. Delorme A, Makeig S (2004) EEGLAB: an open source toolbox for analysis of single-trial EEG dynamics including independent component analysis. J Neurosci Methods 134(1):9–21. [CrossRef]
  78. Lopez-Calderon, J., & Luck, S. J. (2014). ERPLAB: an open-source toolbox for the analysis of event-related potentials. Frontiers in Human Neuroscience, 8, 213. [CrossRef]
  79. Luck, S. J. (2014). An introduction to the event-related potential technique. MIT press.
  80. Groppe, D.M., Urbach, T.P. and Kutas, M. (2011), Mass univariate analysis of event-related brain potentials/fields I: A critical tutorial review. Psychophysiology, 48: 1711-1725. [CrossRef]
  81. Oostenveld, R., Fries, P., Maris, E. & Schoffelen, JM. FieldTrip: Open Source Software for Advanced Analysis of MEG, EEG, and Invasive Electrophysiological Data. Computational Intelligence and Neuroscience, 2011; 2011:156869. [CrossRef]
  82. Gansonre, C., Højlund, A., Leminen, A., Bailey, C., & Shtyrov, Y. (2018). Task-free auditory EEG paradigm for probing multiple levels of speech processing in the brain. Psychophysiology, 55(11), e13216. [CrossRef]
  83. Benjamini, Y., & Hochberg, Y. (1995). Controlling the false discovery rate: A practical and powerful approach to multiple testing. Journal of the Royal Statistical Society. Series B (Methodological), 57(1), 289-300. [CrossRef]
  84. Glass, E., Sachse, S., & von Suchodoletz, W. (2008). Development of auditory sensory memory from 2 to 6 years: an MMN study. Journal of Neural Transmission, 115, 1221-1229. [CrossRef]
  85. Trainor, J. L., Samuel, S. S., Desjardins, N. R., & Sonnadara, R. R. (2001). Measuring temporal resolution in infants using mismatch negativity. NeuroReport, 12(11), 2443–8. [CrossRef]
  86. Ortiz-Mantilla, S., Roesler, C. P., Realpe-Bonilla, T., & Benasich, A. A. (2022). Modulation of Theta Phase Synchrony during Syllable Processing as a Function of Interactive Acoustic Experience in Infancy. Cerebral Cortex (New York, N.Y.: 1991), 32(5), 919–932. [CrossRef]
  87. Strauß, A., Wöstmann, M., & Obleser, J. (2014). Cortical alpha oscillations as a tool for auditory selective inhibition. Frontiers in Human Neuroscience, 8, 350. [CrossRef]
  88. Bishop, D.V. M., Snowling, M. J., Thompson, P. A., Greenhalgh, T., & Catalise Consortium. (2016). CATALISE: A multinational and multidisciplinary Delphi consensus study. Identifying language impairments in children. PLOS One, 11(7), e0158753.
  89. Bishop, D.V. M., Snowling, M. J., Thompson, P. A., Greenhalgh, T., Catalise-2 Consortium, 9Adams, C., ... & House, A. (2017). Phase 2 of CATALISE: A multinational and multidisciplinary Delphi consensus study of problems with language development: Terminology. Journal of Child Psychology and Psychiatry, 58(10), 1068-1080.
  90. Lee, C. Y., Yen, H. L., Yeh, P. W., Lin, W. H., Cheng, Y. Y., Tzeng, Y. L., & Wu, H. C. (2012). Mismatch responses to lexical tone, initial consonant, and vowel in Mandarin-speaking preschoolers. Neuropsychologia, 50(14), 3228-3239. [CrossRef]
  91. François, C, Rodriguez-Fornells, A, Teixidó, M, Agut, T, Bosch, L. Attenuated brain responses to speech sounds in moderate preterm infants at term age. Dev Sci. 2021; 24:e12990. [CrossRef]
  92. van Diepen, R. M., & Mazaheri, A. (2018). The caveats of observing inter-trial phase-coherence in cognitive neuroscience. Scientific Reports, 8(1), 2990. doi.org/10.1038/s41598-018-20423-z.
  93. Volpert-Esmond, H. I., Page-Gould, E., & Bartholow, B. D. (2021). Using multilevel models for the analysis of event-related potentials. International Journal of Psychophysiology, 162, 145-156. [CrossRef]
  94. Petit, S., Badcock, N. A., Grootswagers, T., & Woolgar, A. (2020). Unconstrained multivariate EEG decoding can help detect lexical-semantic processing in individual children. Scientific Reports, 10(1), 10849. [CrossRef]
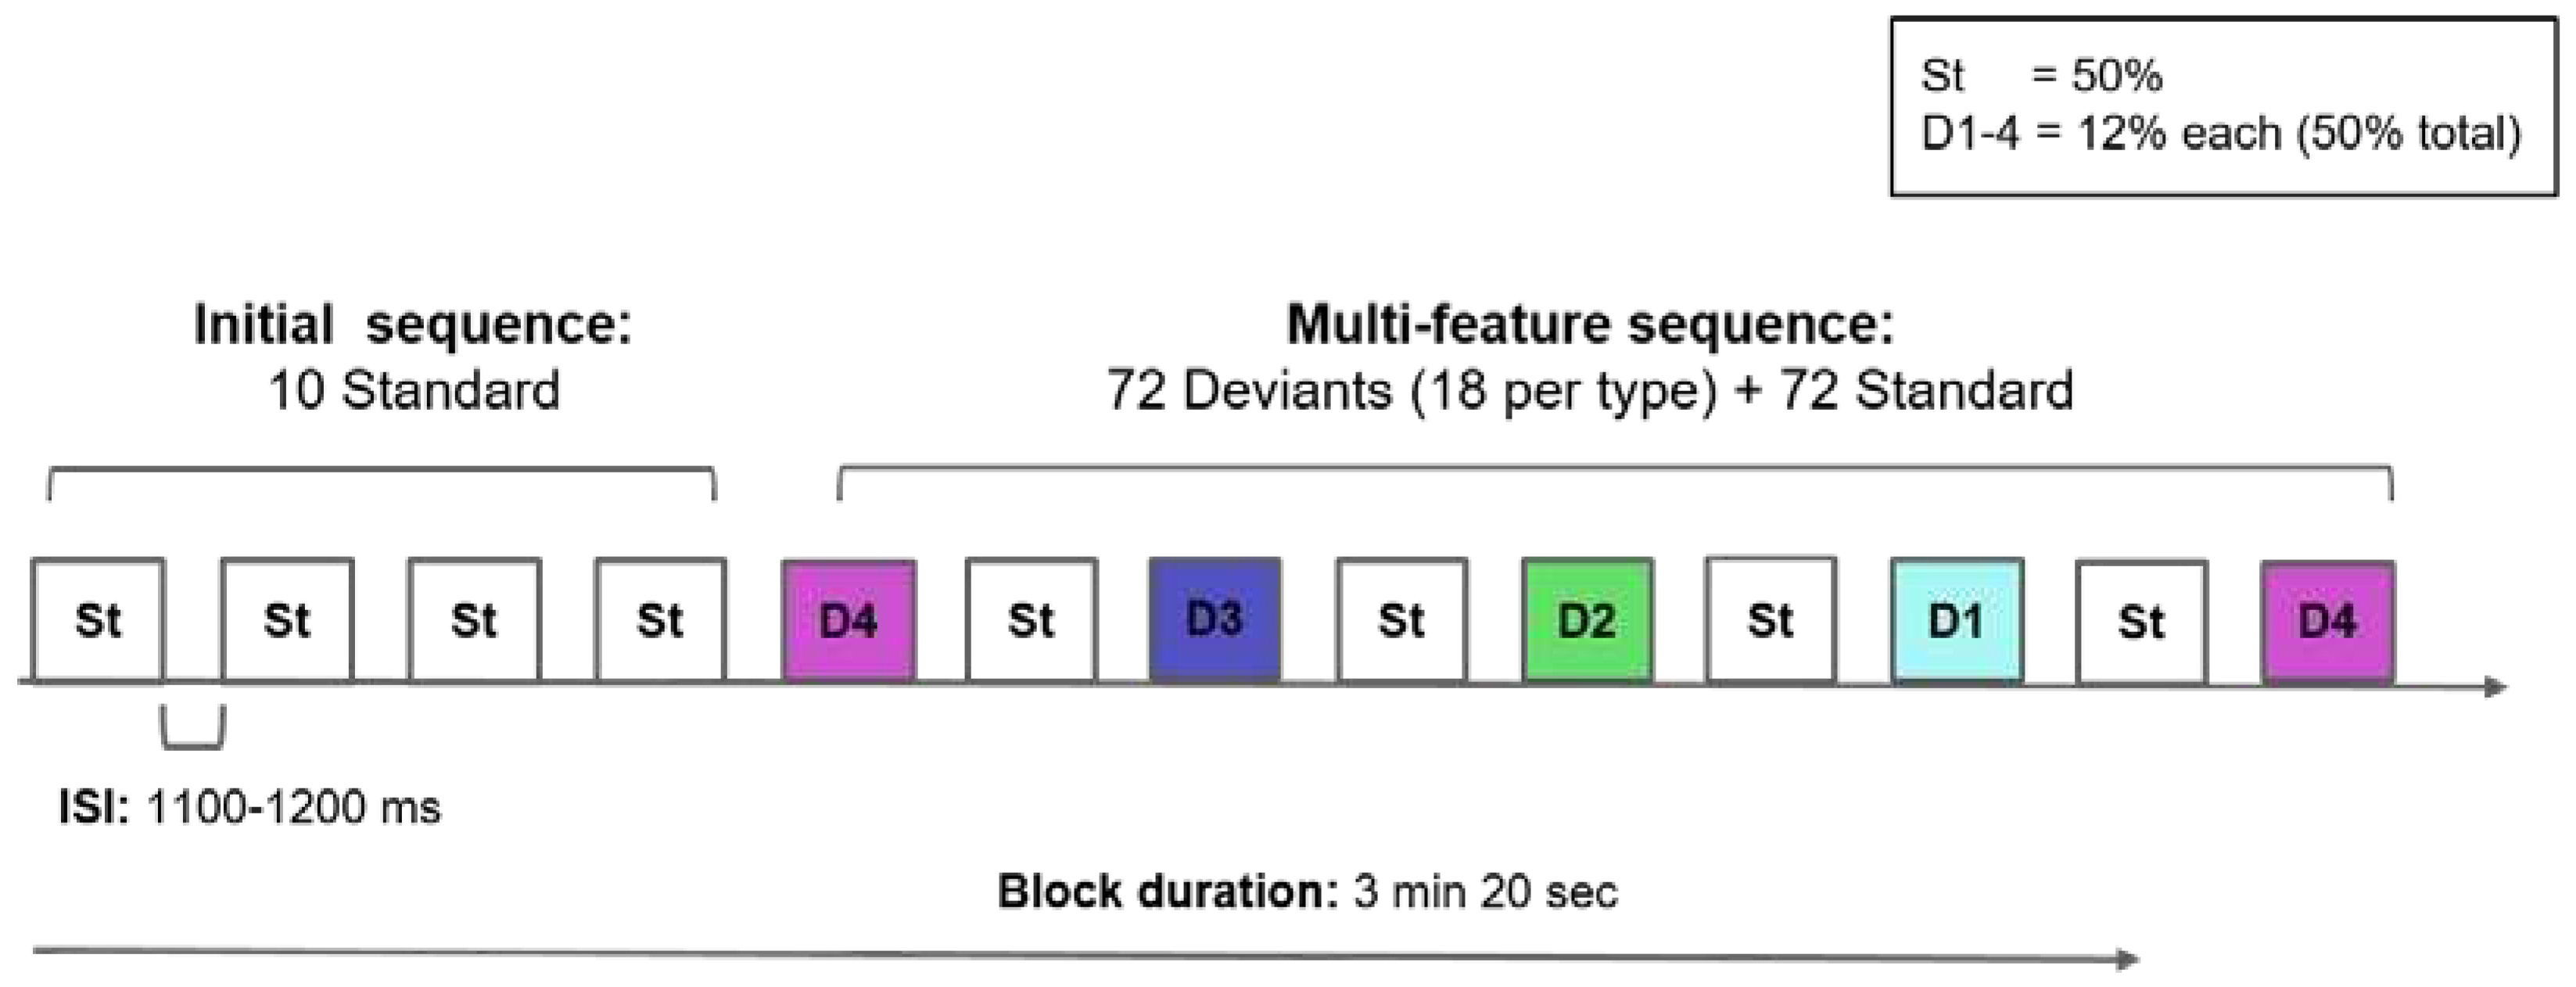
Figure 1. Structure of each experimental block for the Multifeature experiment. Each experimental block consisted of an initial sequence of 10 standards (white squares), and a Multifeature sequence, in which D1 (light blue), D2 (green), D3 (blue), and D4 (pink) were randomly alternated with the standard. Total number of stimuli per block= 154. ISI: Inter-stimulus interval.
Preprints 90706 g001
Figure 2. ERPs at Fz, grand average for all groups and stimulus type. Parent waveforms for the TLD (left column), DLD (middle column) and Adult group (right column). D1: non-native non-words (light blue box); D2: native non-words (green box); D3: function words (blue box); D4: content words (pink box) and St: native non-words (standards, black box). Central lines: Mean ERPs; shaded areas: standard error (SE). Time 0 = stimulus onset.
Preprints 90706 g002
Figure 3. ERP scalp distribution for each stimulus type in all groups. Panel (a) TW1: 100-250 ms; Panel (b) TW2: 250-400 ms. On each panel, columns from left to right, D1: non-native non-words; D2: native non-words; D3: Function words; D4: content words; St: standard stimuli. Colour bar: µV.
Preprints 90706 g003
Figure 4. Comparison of MMRs in children and adults for each difference wave type at Fz. Continuous line: TLD children; Dashed line: DLD children; Dotted line: Adults. Panel (a): DW1; (b); DW2; (c) DW3; (d) DW4 and (e) Words DW. Adult MMN/LDN responses are in bold type. Data low-passed filtered at 35 Hz for plotting.
Preprints 90706 g004
Figure 5. Spectral Decomposition for Children and Adults Waveforms (all stimulus types). Normalised power spectra for all stimulus types. Grey arrows: Peaks at or below 5 Hz; Purple arrows: Peaks around 10 Hz; Black arrows: Increases around or after 20 Hz.
Preprints 90706 g005
Figure 6. ERSP power changes (in dB) over time for all stimulus types. Panel (a) ERSP for all stimulus types and groups. Panel (b) ROIs detected in the all-condition ERSP average for TLD children (3 to 6 Hz), DLD children (3 to 6 Hz), and adults (3-7 Hz). Yellow and blue indicate power change toward positive and negative values, respectively. Baseline correction from -500 to -200 ms.
Preprints 90706 g006
Figure 7. Box plots for theta ERSP (dB power) per stimulus type, all Groups. ERSP baseline= -500 to -200 ms. Between-groups differences are non-significant for all stimulus types at the 0.05 level.
Preprints 90706 g007
Figure 8. Changes on ITPC strength over time for all stimulus types. Panel (a) ITPC for all stimulus types and groups. Panel (b) ROIs detected in the all-condition ITPC average for TLD, DLD children, and adults. ROI 1: 3 to 7-8 Hz (theta band), ROI 2: 8-12 Hz (alpha band). Colour changes towards orange/red indicates ITPC increases over time, and green indicate phase synchrony decrease.
Preprints 90706 g008
Table 1. Participant’s age, hearing levels and non-verbal intelligence scores.
Measure TLD (n=11) DLD (n=16) Adults (n=20)
M SD min-max M SD min-max M SD min-max
Age
(years.months)
5.2 0.23 4.10-5.6 5.2 0.33 4.9-5.7 34.2 4.8 24.9-44.11
PTA left ear
(dB HL)
20.9 1.69 20-25 20.6 .91 20-22.5 6.9 3.6 0-13
PTA right ear
(dB HL)
21.3 1.58 20-25 20.6 1.12 20-23.8 6.2 3.7 0-13
Block Design
(Z score)
18.1 1.58 15-19 15.7 2.98 10-19 60.7 7.8 44 - 79
Note. Group mean values (M), SD, and minimum/maximum values for age, pure tone audiometry (PTA) and the Block Design test.
Table 2. Linguistic parameters for standard and deviant stimuli.
Type Class Initial
Consonant
Vowel Final Consonant Age of Acquisition a Oral Frequencyb
St non-word /f/
Native, labiodental, unvoiced fricative
/u/ /s/ -- --
D1 non-word /ʃ/
Non-Native,
postalveolar, unvoiced fricative
/u/ /s/ -- --
D2 non-word /x/
Native,
velar, unvoiced fricative
/u/ /s/ -- --
D3 function word (determiner) /t/
Native, dental, unvoiced, alveolar
/u/ /s/ 4.24 ª 2.63 ᵇ
D4 content word
(noun)
/l/
Native, alveolar, voiced, lateral
/u/ /s/ 3.18 ª
2.53 ᵇ
Note. St: Standard, D1: Deviant 1, D2: Deviant 2; D3: Deviant 3; D4: Deviant 4. ª Subjective AoA in years [75], ᵇ Among the 100 most frequent words and monosyllables in Spanish [76].
Table 3. Significant ERP responses for all DW types detected between 100-450 ms .
Group TLD DLD Adults
DW Type Significant responses (ms) Duration (ms) Polarity Significant responses (ms) Duration (ms) Polarity Significant responses (ms) Duration (ms) Polarity
Non-native
non-word
--
--
294-382
--
--
88
--
--
Pos.
--
--
278-334
--
--
56
--
--
Pos.
182-198
278-294
350-390
24
16
40
Neg.
Neg.
Pos.
Native
non-word
102-134
--
190-198
286-342
32
--
8
56
Neg.
--
Pos.
Pos
--
--
182- 486
--
--
--
164
--
--
--
Pos.
--
102-118
158-182
222-246
--
16
24
24
--
Pos.
Neg.
Pos.
--
Function word 102-182
--
--
--
80
--
--
--
Neg.
--
--
--
102-182
230-238
294-374
--
80
8
80
--
Neg.
Pos.
Pos.
--
--
190-230
278-334
414-430
--
40
56
16
--
Neg.
Pos.
Neg.
Content word 102-110
--
--
--
8
--
--
--
Neg.
--
--
--
102-150
--
--
--
48
--
--
--
Neg.
--
--
--
102-110
126-174
214-278
326-374
8
48
64
48
Pos.
Neg.
Pos.
Neg.
Words
(function
+ content)
102-142
--
--
40
--
--
Neg.
--
--
102-174
310-318
--
72
8
--
Neg.
Pos.
--
118-150
--
366-446
32
--
80
Neg
--
Neg
Note. Adult MMN responses are marked with in bold type and LDN responses are underlined.
Table 4. Descriptive statistics for MMR peak latency (ms), for all groups in TW1-TW2.
TW1
TLD DLD Adults
M SD M SD M SD
Non-native non-words 184.6 50.71 197.1 37.9 178.5 29.8
Native non-words 136.6 38.5 127.9 22.2 167.4 22.5
Function words 145.1 23.2 160.1 28.5 202.5 23.2
Content words 137.1 38.9 161.3 51.0 157.0 21.3
Words 131.8 21.7 160.0 38.0 154.4 35.7
TW2
TLD DLD Adults
M SD M SD M SD
Non-native non-words 340.9 35.6 316.9 28.6 323.3 62.4
Native non-words 310.0 21.7 314.0 28.5 335.4 64.2
Function words 337.3 32.7 329.4 32.0 364.9 65.1
Content words 321.6 42.3 338.6 42.0 371.2 41.4
Words 326.6 32.9 330.4 34.2 400.1 24.1
Table 5. Descriptive statistics for MMR mean amplitude (µV), all groups in TW1-TW2.
TW1
TLD DLD Adults
M SD M SD M SD
Non-native non-words -2.35 2.73 -1.57 2.16 -0.76 1.13
Native non-words -2.45 2.55 -1.19 2.02 -1.59 1.51
Function words -3.97 3.22 -3.16 2.55 -2.08 0.92
Content words -2.72 2.62 -2.60 1.68 -1.58 1.11
Words -3.06 2.26 -2.63 1.78 -0.95 0.92
TW2
TLD DLD Adults
M SD M SD M SD
Non-native non-words -0.81 2.80 -0.29 2.77 -1.45 1.48
Native non-words 0.85 3.56 1.78 3.08 - 0.81 1.01
Function words -1.66 3.55 -0.03 2.17 -1.85 1.88
Content words -2.27 3.07 -1.67 2.30 -1.56 1.55
Words -1.58 2.50 -0.43 1.67 -1.72 1.68
Table 6. One-Way ANOVA results for mean amplitude comparisons between groups.
TW1 F p η2
Non-native non-words 2.441 .099 .100
Native non-words 1.368 .265 .059
Function words 2.277 .115 .094
Content words 2.139 .130 .089
Words 7.855 .001 (*) .263
TW2 F p η2
Non-native non-words 1.141 .329 .049
Native non-words 4.701 .014 (*) .176
Function words 2.727 .076 .110
Content words .382 .685 .017
Words 2.275 .115 .094
Note. For all tests, df = (2, 44). (*), significant at the 0.01 level.
Table 7. Descriptive statistics for theta band average ERSP (dB power) for all groups.
TLD DLD Adults
Mean SD Mean SD Mean SD
Non-native non-words -.109 1.65 .001 1.25 -.125 1.88
Native non-words .039 2.15 .008 1.27 -.072 2.16
Function words .032 2.43 .257 1.63 .267 2.01
Content words -.326 2.03 -.021 1.39 -.063 2.07
St (native non-word) -.428 1.81 -.041 1.34 -.471 1.97
Table 8. Descriptive statistics for average theta ITPC (ROI 1), all groups.
TLD DLD Adults
Mean SD Mean SD Mean SD
Non-native non-words .174 .027 .154 .047 .196 .049
Native non-words .175 .052 .180 .046 .200 .050
Function words .186 .062 .167 .046 .308 .082
Content words .181 .040 .170 .051 .241 .076
St (native non-word) .147 .043 .172 .067 .196 .046
Table 10. Correlation between phonological awareness scores and EEG measures.
ERP measures
Non-native non-words Native
non-words
Function words Content words Words
Mean amplitude TW1
PECFO r - .299 - .185 - .229 - .034 - .167
p .176 .409 .305 .879 .458
Mean amplitude TW2
r -.194 - .043 - .305 - .169 - .353
p .388 .851 .167 .451 .107
Time-frequency measures
Non-native non-words Native
non-words
Function words Content words Standard
(native non-word)
PECFO ERSP theta
r .082 - .321 - .271 - .283 - .319
p .716 .145 .223 .201 .147
ITPC theta (ROI 1)
r .206 - .183 - .112 .32 - .467
p .358 .415 .619 .146 .028
ITPC alpha (ROI 2)
r .039 - .368 .206 - .052 - .31
p .863 .092 .357 .818 .16
Note. r= Pearson’s correlation coefficient; p= significance value. Corrected alpha=0.01.
Disclaimer/Publisher’s Note: The statements, opinions and data contained in all publications are solely those of the individual author(s) and contributor(s) and not of MDPI and/or the editor(s). MDPI and/or the editor(s) disclaim responsibility for any injury to people or property resulting from any ideas, methods, instructions or products referred to in the content.
Copyright: This open access article is published under a Creative Commons CC BY 4.0 license, which permit the free download, distribution, and reuse, provided that the author and preprint are cited in any reuse.
Prerpints.org logo

Preprints.org is a free preprint server supported by MDPI in Basel, Switzerland.

Subscribe

© 2024 MDPI (Basel, Switzerland) unless otherwise stated