Preprint
Article

Thermophysical and Transport Properties of Deep Eutectic Solvent Mixtures Containing Pure Choline Chloride/Ethylene Glycol with a Mole Ratio of 1:4 and Mixed with LiPF6 for Application in Redox-flow Batteries

Altmetrics

Downloads

120

Views

52

Comments

0

This version is not peer-reviewed

Submitted:

16 November 2023

Posted:

17 November 2023

You are already at the latest version

Alerts
Abstract
Redox-flow batteries are rechargeable batteries that store energy in two liquid electrolytes, separated by a membrane. During charging and discharging, the electrolytes flow through the membrane and undergo chemical reactions that generate or consume electrical energy. These batteries are known for their scalability and long cycle life and are versatile energy storage technologies developed to enhance efficiency and lower costs. Deep Eutectic Solvents (DES) are eco-friendly alternatives to traditional electrolytes, and their properties have been studied to improve the performance of redox-flow batteries. We investigated choline chloride/ethylene glycol (ChlCl/Eg) mixtures with LiPF6 salt at four concentrations through experimental and MD simulations. The thermophysical and transport properties of the mixture, including density, diffusion coefficient, viscosity, and ionic conductivity, were calculated across a temperature range of 298.15–398.5 K. Our findings indicate that an increase in salt concentration leads to a decrease in diffusion coefficients and ionic conductivity, while increasing the viscosity of the deep eutectic solvent. This research provides valuable insights into the behavior of DES mixtures and can aid in the design and optimization of DES-based processes for use in redox-flow batteries.
Keywords: 
Subject: Chemistry and Materials Science  -   Applied Chemistry

1. Introduction

The rise in the world’s population, coupled with apprehensions about the overconsumption of fossil fuels and the threat of global warming, has necessitated a collective endeavor toward creating eco-friendly battery systems that can efficiently store electrical energy[1]. An effective power grid requires a certain degree of flexibility to maintain a balance between consumers’' electricity demand and its supply. Due to its intermittent nature, maintaining this balance is difficult, and as a result, traditional methods of electricity generation are still needed to fill the necessary gap[2]. Using energy storage to prevent such interruption and provide electricity even during times of low production and high demand is a promising solution. Thus far, various energy storage technologies have existed, including mechanical, electrical, chemical, and electrochemical storage.
Batteries are a family of energy storage technologies that cover a wide range of applications and have created great hopes for themselves[3]. Batteries take advantage of their ability to convert reversible electrical energy into chemical energy through redox reactions that occur inside the cell between positive and negative electrodes. Different materials and configurations of batteries enhance the efficiency of these energy storage technologies[3]. Current research trends focus on developing newer, more stable, and efficient materials, and methods for their production, which predict lower costs, higher capacities, and better performance systems[4]. This promising outlook is an important factor for continuous development and cost reduction, which must be considered when choosing a suitable storage technology for network scale use.
Redox flow batteries (RFBs) are an energy storage technology that stores large amounts of energy for long periods using two electrolyte solutions that undergo redox reactions[5]. During charging, electrical energy is used to oxidize the chemical species in one electrolyte while reducing the chemical species in the other. This process accumulates energy in the electrolyte, which is released as electrical energy during discharge[6]. RFBs consist of large external tanks containing positive and negative oxidizing and reducing materials in liquid form, which circulate through a central cell where redox reactions occur on carbon-based electrodes. A membrane separates the positive and negative materials to prevent cross-contamination while allowing only the passage of charge-balancing ions.
Deep eutectic solvents (DESs) are a new and less well-known class of liquid mixtures that have high conductivity, low vapor pressure, strong solvency power, and are made from inexpensive and environmentally friendly materials. These solvents have properties that make them suitable candidates for use in redox flow batteries[7].
The majority of studies on DESs as electrolytes for RFBs have focused on inorganic metal salts[8,9,10]. DESs consisting of choline chloride and urea have high solubility of vanadium and iron, resulting in an increased capacity compared with aqueous electrolytes [11]. However, the high viscosity of the DESs presented sluggish redox kinetics and large internal resistance, thus resulting in low voltage efficiency. Elevating the operating temperature has been shown to be lower viscosity and improve energy storage efficiency[11]. Recent studies have sought to build hybrid RFBs with DES electrolytes using metal chlorides as hydrogen bond acceptors (HBAs) coupled with hydrogen bond donors (HBDs) such as urea and acetamide[12,13,14]. These hybrid RFBs provide high concentrations of the redox species with high metal ion activities. These studies demonstrate that the H-bonding network in DESs increases viscosity and reduces conductivity, but it can also be modified through additives to weaken Coulombic interactions.
Metal ion coordination was investigated by Miller et al. to understand its impact on the electrochemical performance of an all-iron battery using ChlCl:Eg electrolytes[15]. The study found that the Fe+2 /Fe+3 redox reaction was more robust compared with Fe+2 /Fe0. The coordination structure of Fe, which depends on the Cl:Fe ratio in the electrolyte, plays a crucial role. At low concentrations of Cl (Cl:Fe < 4:1), the formation of Fe- Eg complexes dominated over that of tetrahedral iron complexes. These complexes improved electrochemical stability, reduced side reactions, and enhanced plating efficiency. However, the conductivity was lower in the 3:1 mixture than in the 4:1 mixture (Cl:Fe). Similarly, Shen et al. studied the effect of complexation on Cu+2 /Cu+1 redox kinetics in ChlCl:Eg electrolytes[16]. They found that the exchange current density (i0) for Cu2+ to Cu1+ reduction reaction was significantly smaller in ChlCl:Eg electrolytes than in aqueous electrolytes. The complexation of Cu+2 and Cu+1 with Cl was believed to be responsible for this difference. Further research is needed to understand the complexation and speciation of metal ions in DESs to gain insights into the reaction mechanisms and facilitate the design of redox flow batteries (RFBs).
To date, relatively little is known about the molecular properties of DESs that give rise to their unique macroscopic properties, and most of their applications have been specific to the aforementioned fields. Therefore, the design of DESs is mainly a trial-and-error process, and very little information is available on the molecular underpinnings that justify the performance of deep eutectic solvents or the methods for designing them to improve their macroscopic behavior. Using classical molecular dynamics (CMD) simulations and a multidisciplinary team of experimental and computational experts, models for DESs can be constructed and their properties validated. Using these models, the fundamental structural and dynamic properties of these solvents are finally revealed, and the way to exploit them to improve their performance as electrolytes for redox flow batteries is determined.
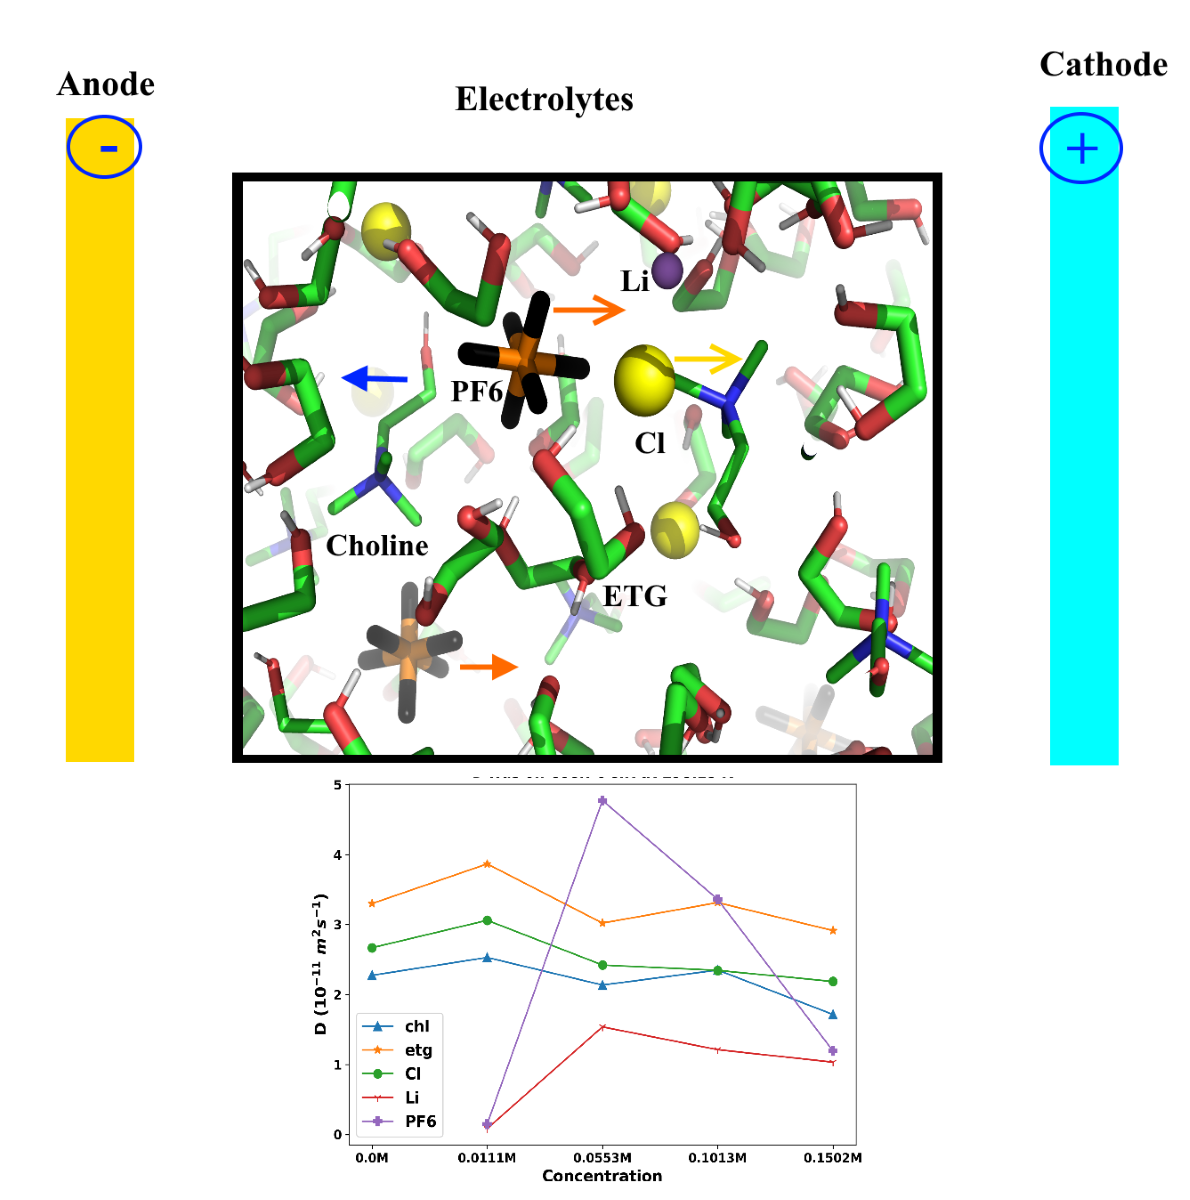
The current study focuses on experimental measurement and MD simulation of the density, viscosity, and ionic conductivity of ChlCl/Eg with a mole ratio of 1:4 DES doped with LiPF6 salt. The aim of this study was to examine how the addition of LiPF6 affects the density, viscosity, ion self-diffusion coefficients, and ionic conductivity of the solution from the perspective of an RFB electrolyte, using an experimental and MD simulation approach. A schematic representation of the imaginary RFB and the electrolyte used in this study are shown in Figure 1a and b, respectively.

2. Methods

2.1. Experimental Section

Materials, Apparatus, and Procedure 

To determine the transport properties of the ChlCl/Eg-LiPF6 salt mixture, experimental techniques were used. Initially, the ChlCl/Eg mixture was produced by subjecting the components to a 1:4 molar ratio and, heating and stirring them at 351 K for 1 h until a transparent and homogeneous solution was obtained. Subsequently, LiPF6 was dissolved in dry methanol under dry nitrogen gas and added to the ChlCl/Eg mixture. The resulting solution was stirred before the methanol was removed under vacuum. The chemicals employed in the experiment are listed in Table 1, accompanied by their source, CAS number, purity, and structure.
An analytical balance (AW 220, GR220, Shimadzu, Japan) was employed to prepare the DES with a precision of 10-4 g. The experimental density of the mixture was measured using an Anton Para DSA 5000 at a frequency of approximately 3 MHz after calibration with distilled deionized and degassed water and dry air to maintain a constant temperature during the measurement. The Peltier device integrated within the densimeter provided a precision of 0.01 K.
The viscosity of the ChlCl/4Eg-LiPF6 salt mixture was measured in a temperature-controlled water bath using a Ubbelohde-type viscometer. The experiment involved measuring the flow time and density of the mixture to obtain the viscosity data, which was calculated using the following equation:
η d = k t l t
Where η is dynamic viscosity, d is density, k is the viscometer constant, and t is flow time. To determine the viscometer constants, the calibration of the viscometers was conducted at different temperatures using the density and viscosity of ethylene glycol. The average of three flow times was obtained using a stopwatch with a resolution of ±0.01 s. Precise temperature control was ensured throughout the measurement process.
The measurement of specific electrical conductance, represented by κ , was conducted using a Metrohm model 712 conductivity meter from Switzerland with an accuracy of ±0.005 μ S cm−1. To calibrate the apparatus, the conductivity meter values were adjusted to the KCl solution with a concentration of 0.01 mol·kg−1. The mixtures were created by adding pre-determined quantities of API-IL to the cell of the conductivity meter and stirring it with a magnetic stirrer. The temperature of the mixture was maintained using a thermostatic water bath, with an uncertainty of ±0.02 K. Using the formula σ = 1000 κ C , the molar conductivities ( σ ) of the mixtures were computed given the molar concentration of API-IL and the specific conductance of the (glycine + API-IL + water) mixture.

2.2. Computational Section

The GROMACS 21.4 software package was utilized for performing calculations on four systems with a ChlCl/Eg mole ratio of 1:4 and LiPF6 salt concentrations of 0. 0111, 0.0553, 0.1013, and 0.1502 M [17]. Table 2 provides information on the number of molecules, box size, and LiPF6 concentration in each mixture. The module used for inserting molecules was employed to pack the molecules within the box. To observe the impact of solvents on thermophysical and transport properties, simulations were performed at different temperatures, including 298.15, 308.15, 318.15, 328.15, 348.15, and 398.15 K, and simulation times were selected to obtain sufficient sampling of thermophysical properties. A modified Berendsen thermostat and Parrinello−Rahman barostat were employed to control temperature and pressure, with coupling constants of 0.4 and 2.0 ps, respectively[18]. The LINC algorithm constrained all bond lengths[19], whereas the PME method calculated long-range electrostatic interactions [20]. In addition, a short-range cutoff of 1.1 nm was used for VDW and electrostatic interactions. The Verlet leapfrog algorithm [21] was used to integrate equations of motion with a time step of 2 fs, and periodic boundary conditions were employed in three directions.

Calculation of the Physicochemical Properties 

Density. Molecular dynamic simulations were performed using GROMACS software. The DES mixture containing choline chloride and ethylene glycol in a 1:4 molar ratio in a pure form and LiPF6 was modeled in a cubic box. The system was energy-minimized to reduce any bad steric interactions. Temperature equilibration simulations were then performed in the NPT ensemble at given temperatures to obtain the required temperature. The equilibration protocol involved simulated annealing with an initial 2 ns at 500 K followed by cooling to the target temperature for 2 ns. The system was then equilibrated for an additional 6 ns at constant temperature and pressure. A time step of 2 fs was used for the integration of the equations of motion. Production runs were then performed for 40 ns in the NPT ensemble at constant temperature and pressure to calculate the density. Configurations were saved every 2 ps for data analysis.
Self-Diffusion Coefficients. MD simulations were performed using the GROMACS software, following a protocol similar to that for density calculations. The system was energy-minimized and then equilibrated at the desired temperature through simulated annealing. However, to calculate transport properties such as self-diffusion coefficients, production runs were performed in the NVT ensemble at constant number of particles, volume, and temperature, rather than in the NPT ensemble. This is a more suitable ensemble for transport property calculations. Production runs of 40 ns duration were performed in the NVT ensemble at the equilibrated temperature, with configurations saved every 2 ps. The mean-square displacements of the molecules were then determined from the trajectories, and the self-diffusion coefficients were calculated using the Einstein relation: [22]:
D = 1 6 l i m t d d t | r i ( t ) r 0 ( t ) | 2
where ri is the position vector of particle i at time t. D was obtained from the slope of the linear region of the mean-square displacement (MSD) curves.
Shear Viscosity. To compute the viscosities of the DES mixtures, the same simulation methodology for diffusion coefficient calculations, as described in the previous section, was executed. In brief, the process entailed energy minimization, followed by simulated annealing for a duration of 4 ns in the NPT ensemble, and subsequently, a 40 ns production run in the NVT ensemble to calculate the transverse-current correlation function (TCCF) [23] via the transverse momentum fields [24]. Using this approach, the viscosity η was determined by fitting the 16 acquired values of η(k) corresponding to the 16 distinct k vectors, in line with the following equation:
η   ( k ) = η   ( 1 a k 2 )
In this equation a is the fitting parameter. The system size does not affect the viscosity in this method [25].
Ionic conductivity. The production runs performed in the NVT ensemble for calculating the self-diffusion coefficients and viscosity were also used to determine the ionic conductivity of the mixtures. The Nernst-Einstein equation was employed, which relates conductivity to self-diffusion coefficients and other system properties. The equation takes following form: [26]:
σ N E = σ + + σ
σ N E = q + 2 ρ D + k T + q 2 ρ D k T
where σNE is the Nernst-Einstein conductivity, D+ and D are the self-diffusion coefficients of the cation and anion, respectively, q+ and q- are their respective charges, ρ is the number density of the salt, k is the Boltzmann constant, and T is the temperature.
The Nernst-Einstein equation, while computationally convenient, overestimates ionic conductivity because of its inability to account for ion-ion correlations. However, it still provides a valuable estimate of conductivity based on the available simulation data.

3. Results and Discussion

To go deep inside the solvent structure at the atomic level, one needs to choose an appropriate forcefield to portrait the interaction of particles in the simulation box. Previous studies [27,28] suggested the FFM3 model from the work of Ferreira et al. [29] and found it to be the most suitable forcefield for pure ChlCl:Eg in 1:2 and 1:3 molar ratios and for their mixture with LiPF6 and discussed the thermophysical, transport, and structural properties of the mixtures mentioned above. These works encourage us to investigate the same DES with a 1:4 molar ratio through experiment and MD simulation studies. Variable properties such as density, viscosity, diffusion coefficient, and ionic conductivity were calculated from the MD simulation and compared with experimental data for ChlCl: 4Eg:LiPF6 mixtures to illustrate the applicability of the applied atomic model.
After careful consideration of the findings reported by Moradi et al. [27,28], we performed a charge scaling in this case study. However, our results did not yield satisfactory results for certain thermophysical properties, particularly the diffusion coefficient. Therefore, we have decided not to consider charge scaling in our study.

3.1. Thermophysical Properties

Primarily, our focus lies on the experimental density data presented in Table 3 for the ChlCl/4Eg + LiPF6 mixtures at various temperatures and LiPF6 concentrations. These experimental values can be compared with the density data from MD simulations to evaluate the accuracy of the simulation (Table 4). Upon scrutiny of these tables, it can be observed that the density of the mixtures increases with increasing LiPF6 concentration for both experimental and MD simulation data. This trend is expected because LiPF6 is a salt that imparts more ions to the mixture, consequently leading to a rise in the density of the solution.
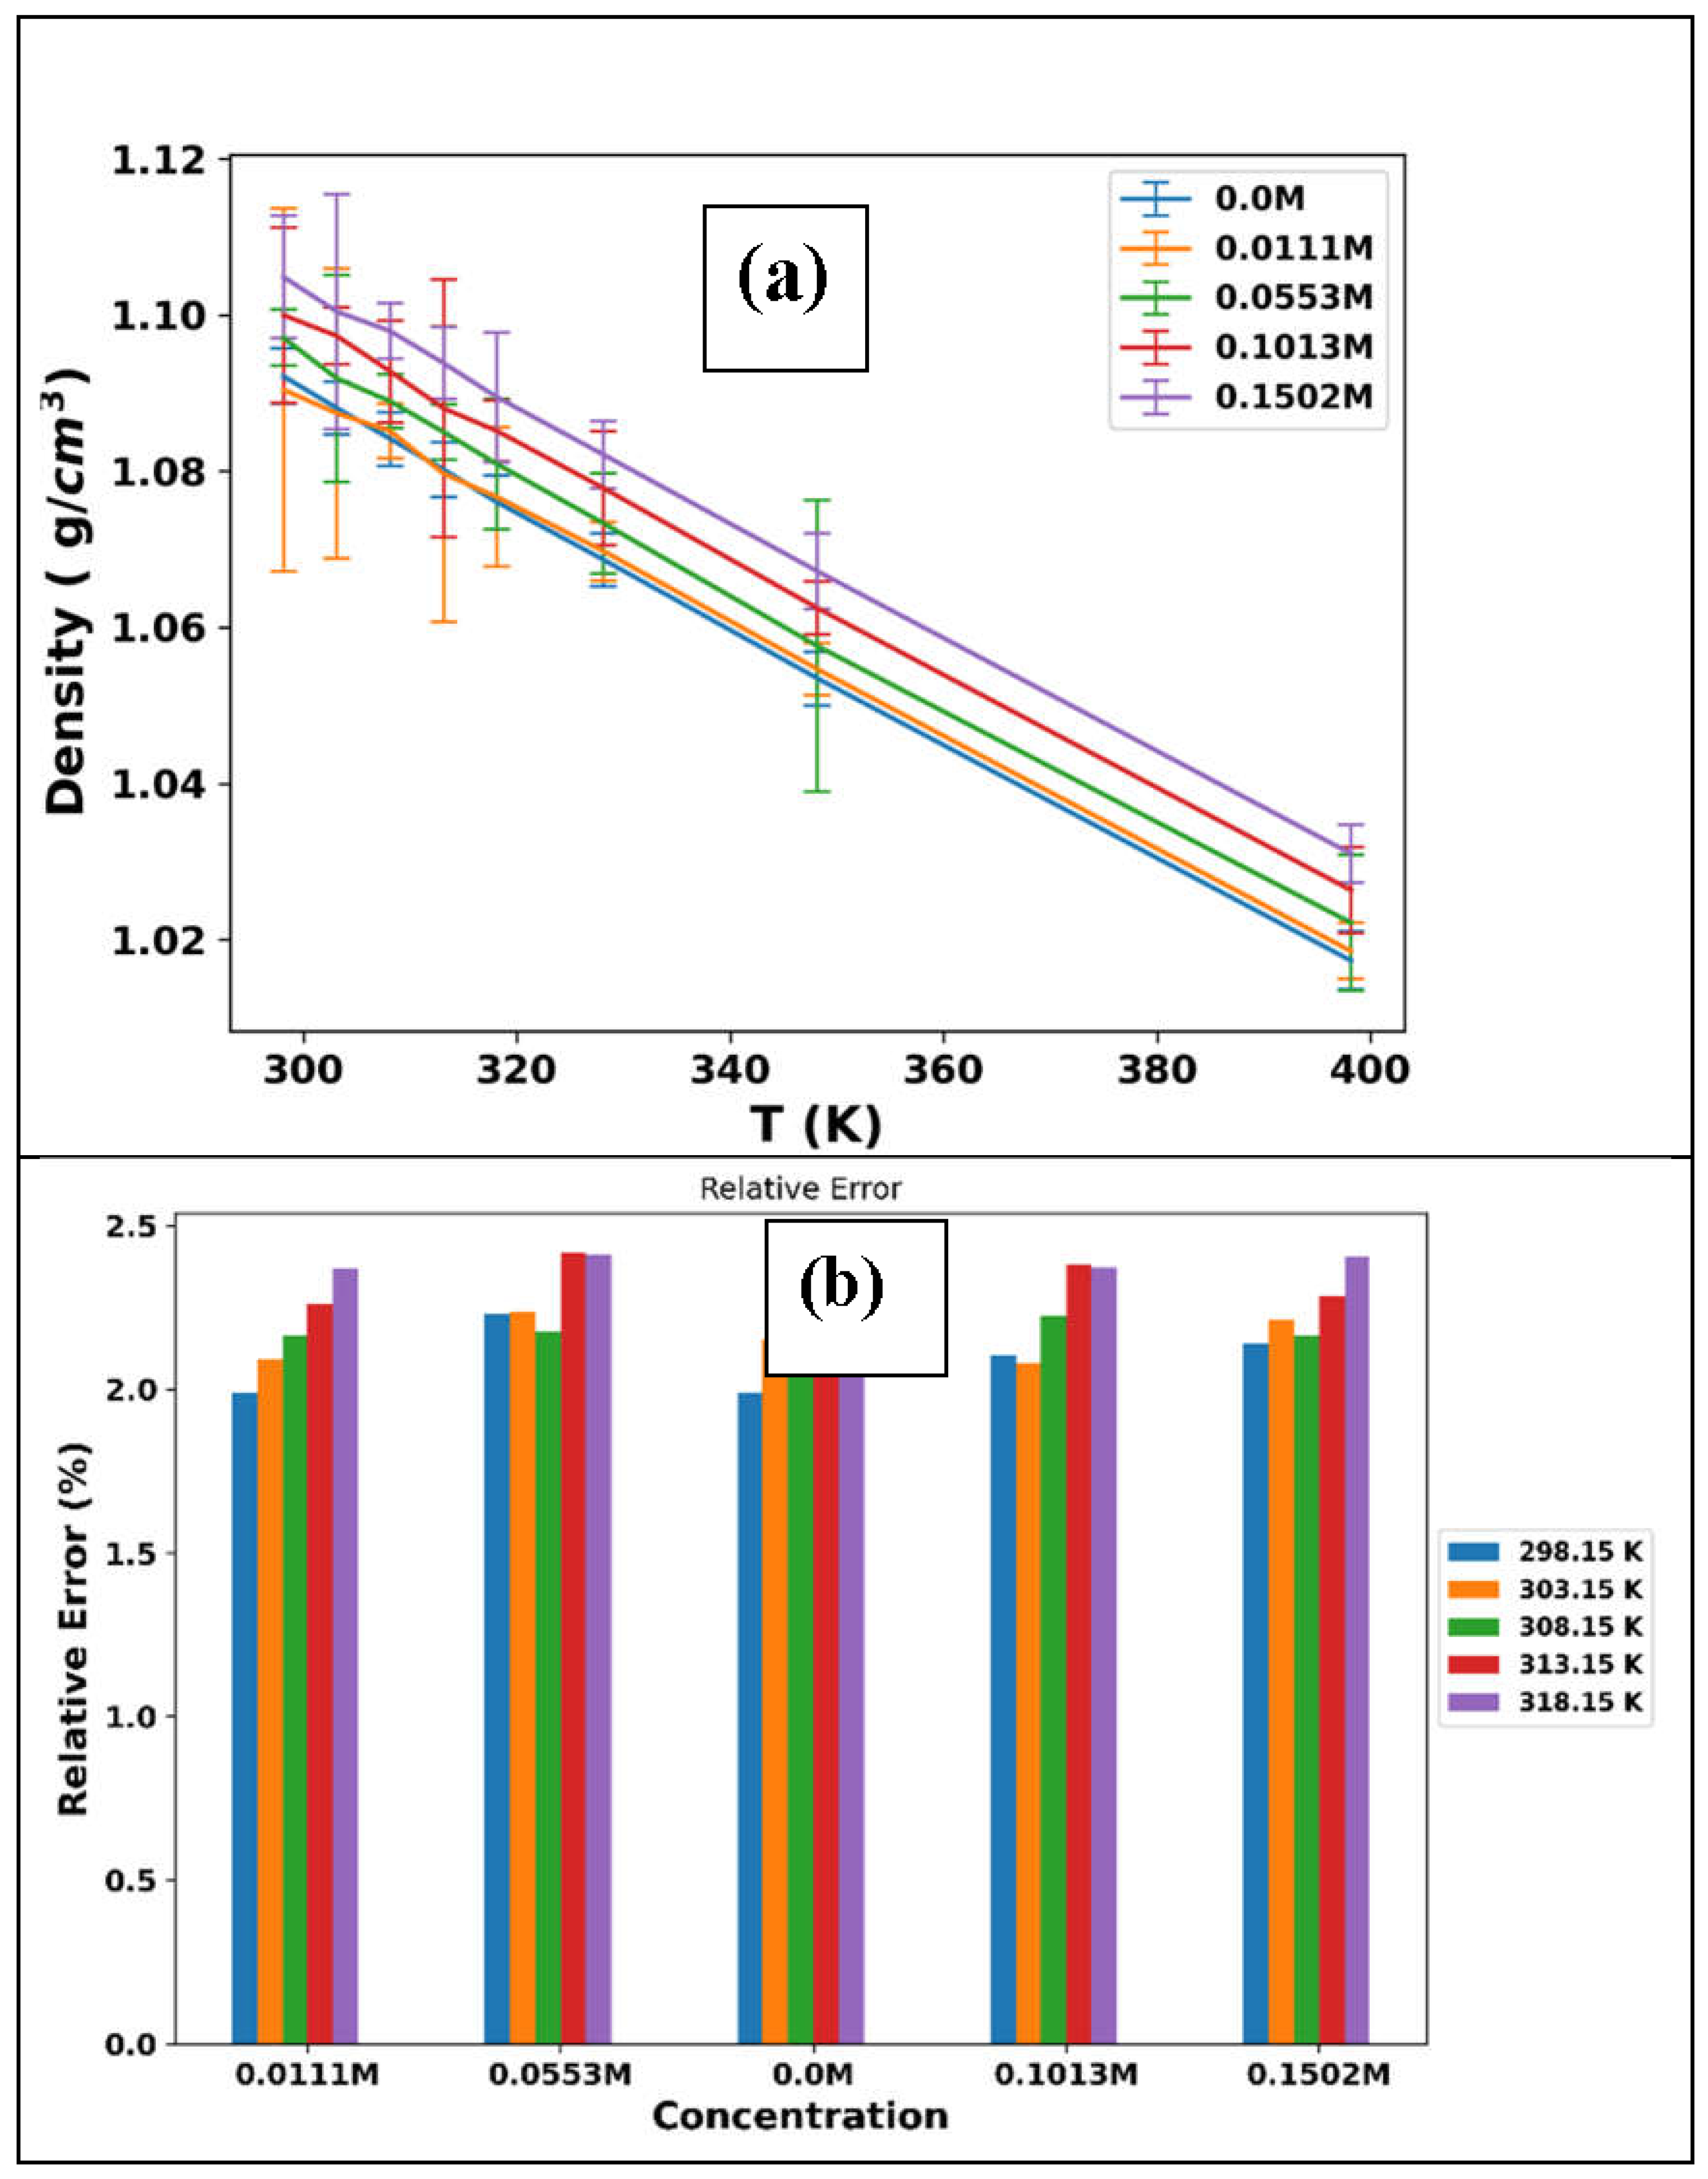
Regarding temperature, the density of the mixtures decreases with increasing temperature for both experimental and MD simulation data. Figure 2(a) illustrates this trend for the simulation data while incorporating the uncertainties for each data point. This trend is also expected because augmenting the temperature results in an expansion of the solution's volume, subsequently decreasing density. However, a comparison of the simulation and experimental densities, as plotted in Figure 2(b), in terms of the percentage of relative error, indicates that the MD simulation data tend to underestimate the density compared with the experimental data. This discrepancy could be attributed to several factors, such as the force field employed and the simulation conditions.
Table 5 displays the results from MD simulations of the diffusion coefficients (D) for choline, chloride, ethylene glycol, lithium, and PF6 in the deep eutectic solvent mixture. It is noteworthy that the force field parameters in the simulation did not use a reduced charge scaling of 0.8. To accurately estimate the mean square displacement (MSD) from molecular dynamics simulation trajectories, Del Popolo and Voth [30] proposed determining the onset of the diffusive regime by calculating the β(t) parameter. The β(t) parameter is defined as
β   t = d   l o g 10   r t 2 d   l o g 10  
where <Δr(t)2 >is the average MSD of the species and t is the time. The optimized value for β (t) indicates the best region for calculating the diffusion coefficient.
In a study by Moradi et al., it was observed that the diffusion coefficient of ethylene glycol (Eg) molecules in ChlCl:2Eg and ChlCl:3Eg mixtures peaked and rose as the number of Eg molecules in the solutions increased [27]. From their study, it is understandable that choline [Chl+] has the lowest diffusion coefficient because of its larger size than ethylene glycol (Eg) and chloride [Cl-] ions. However, the fact that chloride [Cl-] has a lower diffusion coefficient than ethylene glycol molecules despite its smaller size can be explained by considering that chloride [Cl-] did not diffuse independently as a single ion. Rather, the chloride [Cl-] ions likely formed complexes or were associated with the choline [Chl+] ions in the mixture, reducing their mobility and diffusion rate. This indicates that the chloride [Cl-] ions did not diffuse as freely as the ethylene glycol molecules but instead were coupled to the diffusion of the choline [Chl+] ions to some extent.
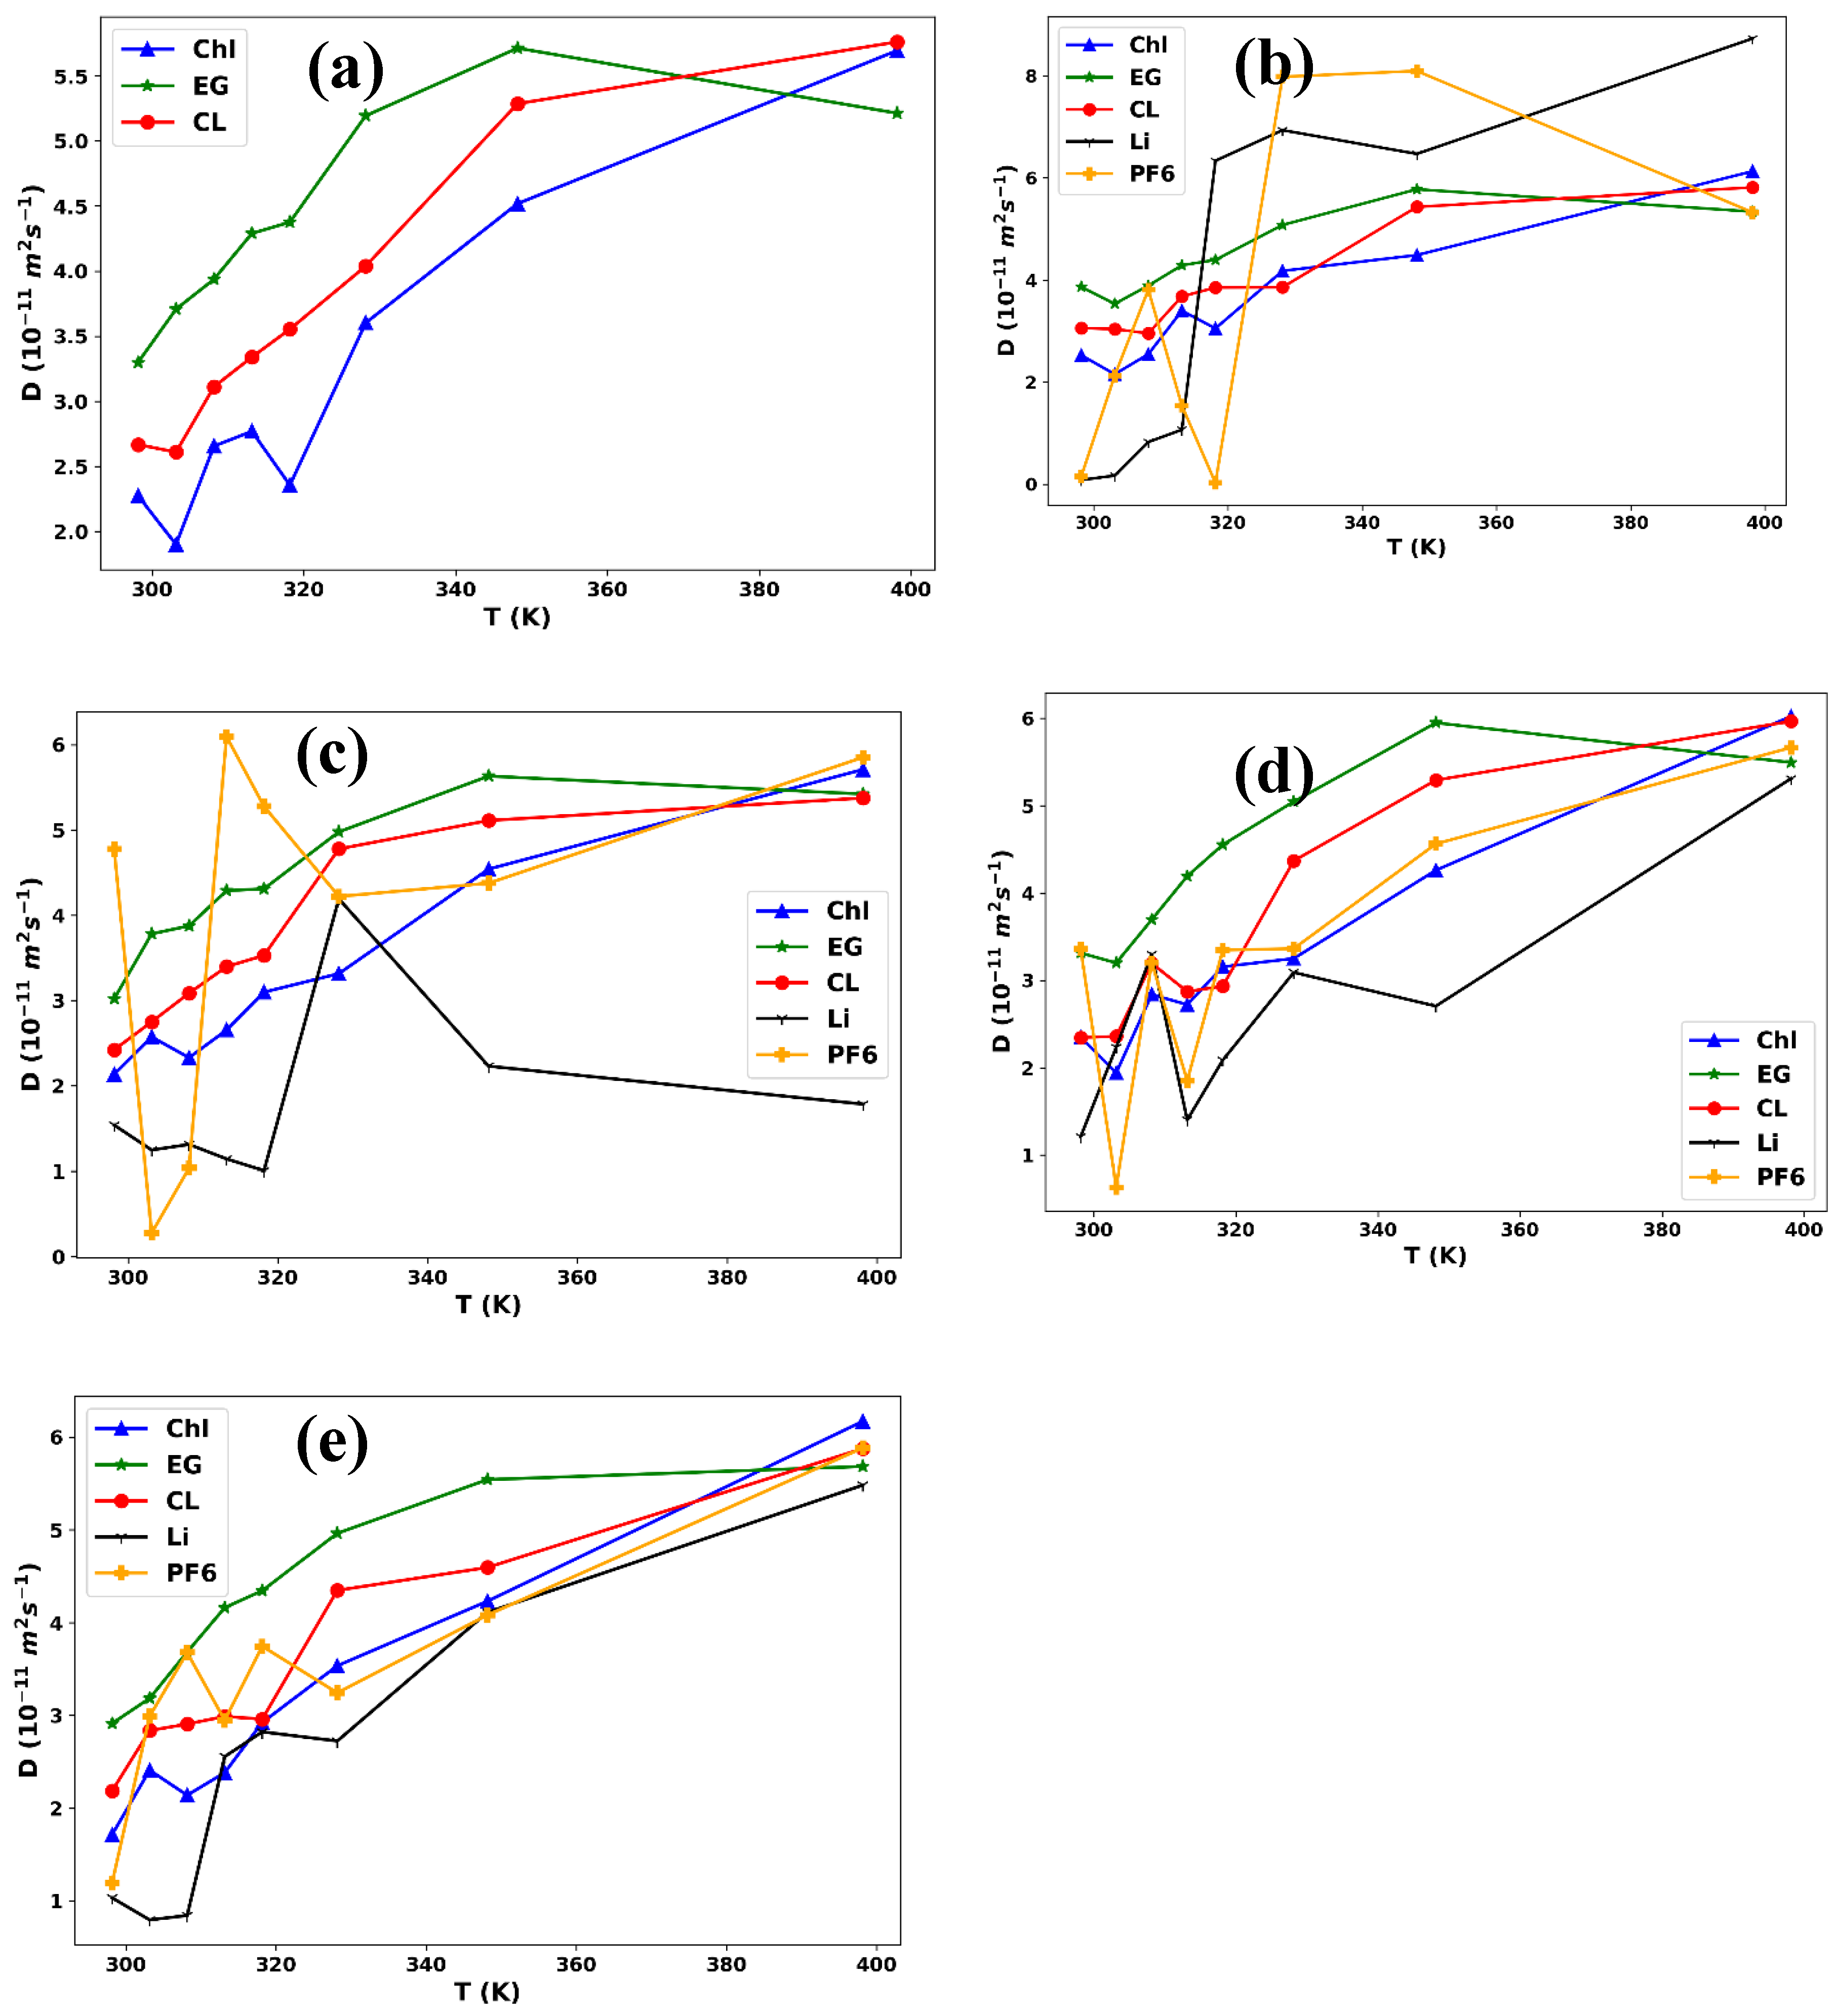
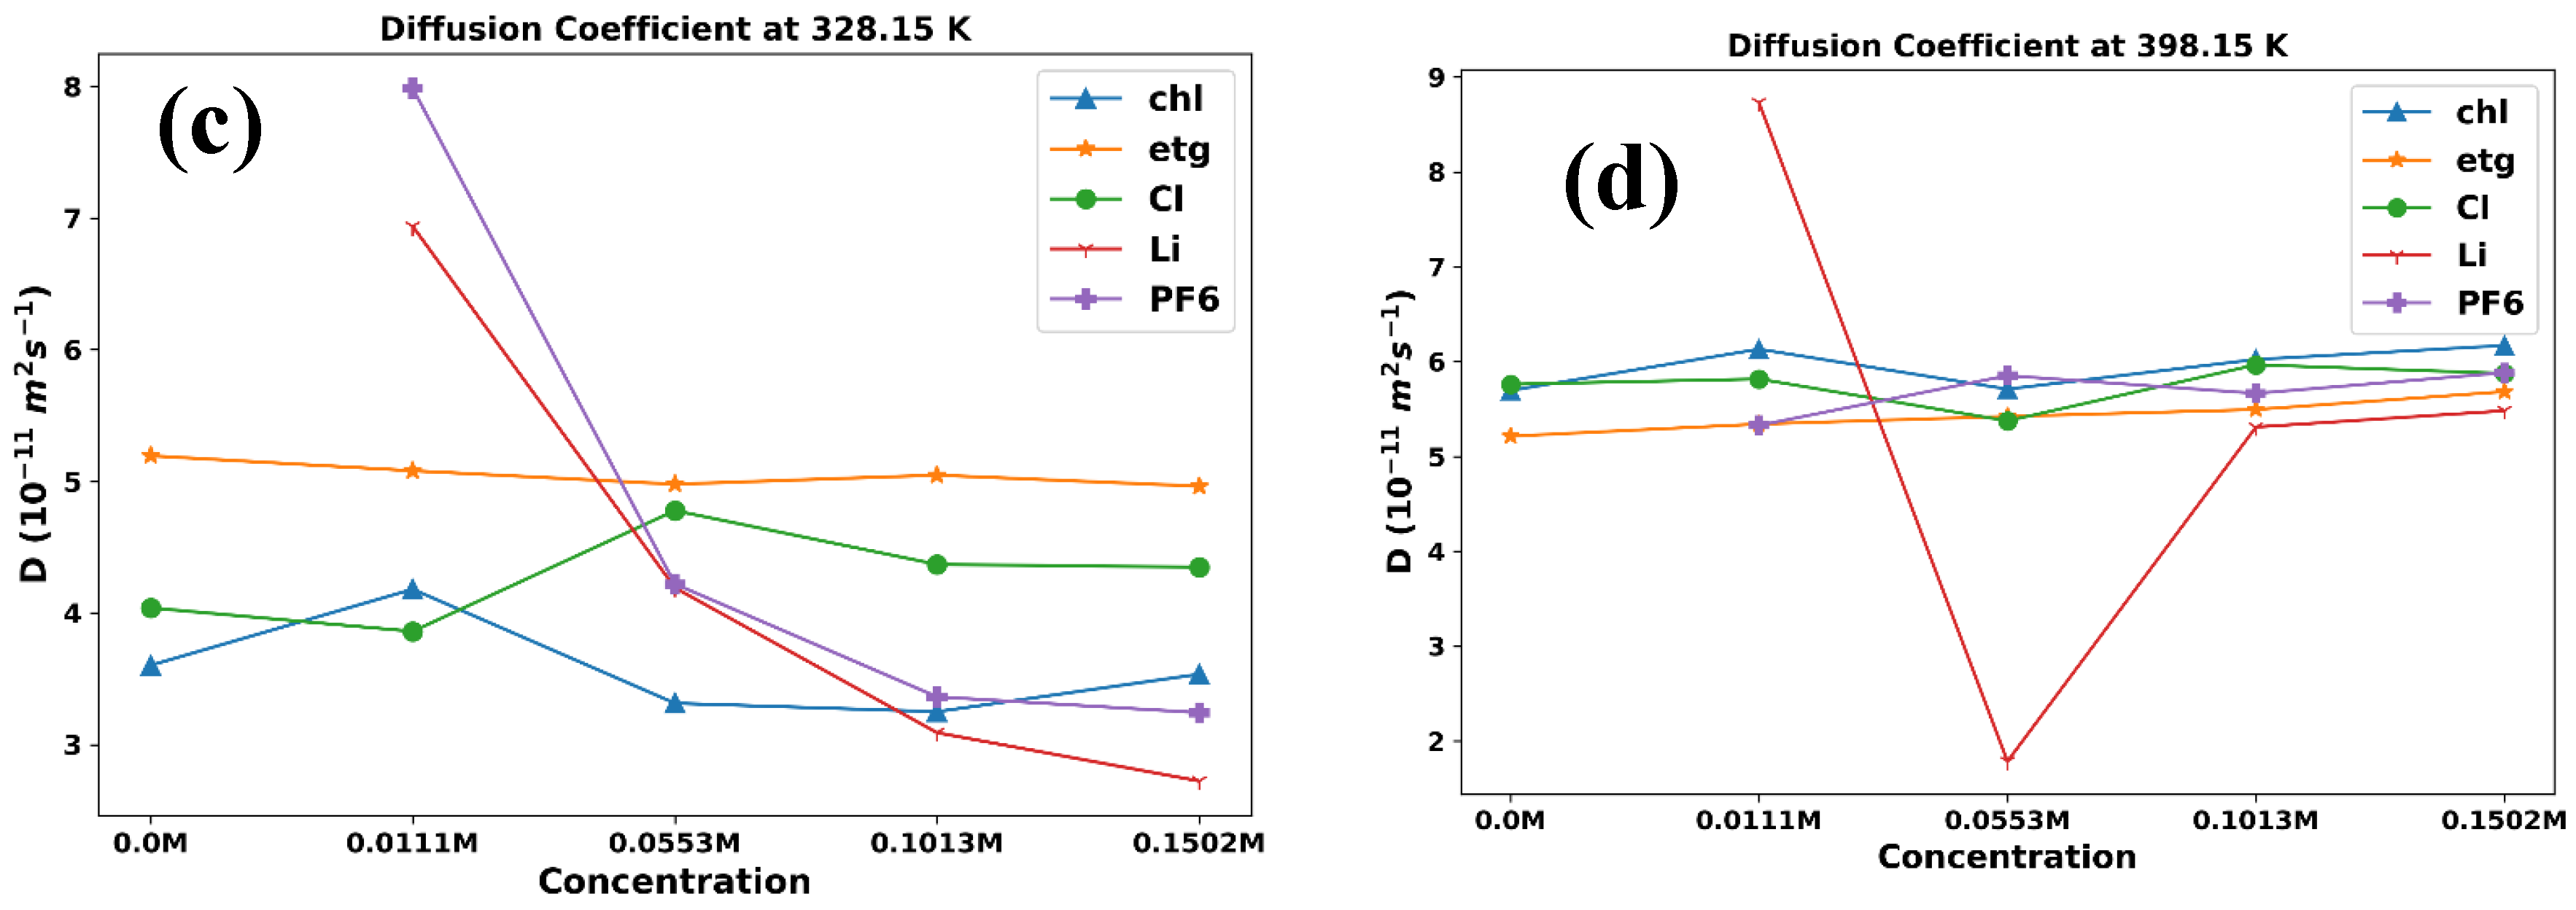
In this study, we can analyze the trends in the diffusion coefficient data and compare them with expected behavior based on previous knowledge of the system. First, we examine the overall trend in the data for each component. For example, we can observe that the diffusion coefficients for choline, ethylene glycol, and chloride tend to increase with increasing temperature (Figure 3), whereas the diffusion coefficients for [Li+] and [PF6-] exhibit a drop when the temperature shifts from 298.15 K to 303.15 K and then increase with increasing temperature (Figure 3b-e). This behavior aligns with the expected behavior of ions in solution, where higher temperatures lead to increased thermal motion of the solvent molecules, enabling the ions to move more freely and increasing their diffusion coefficients.
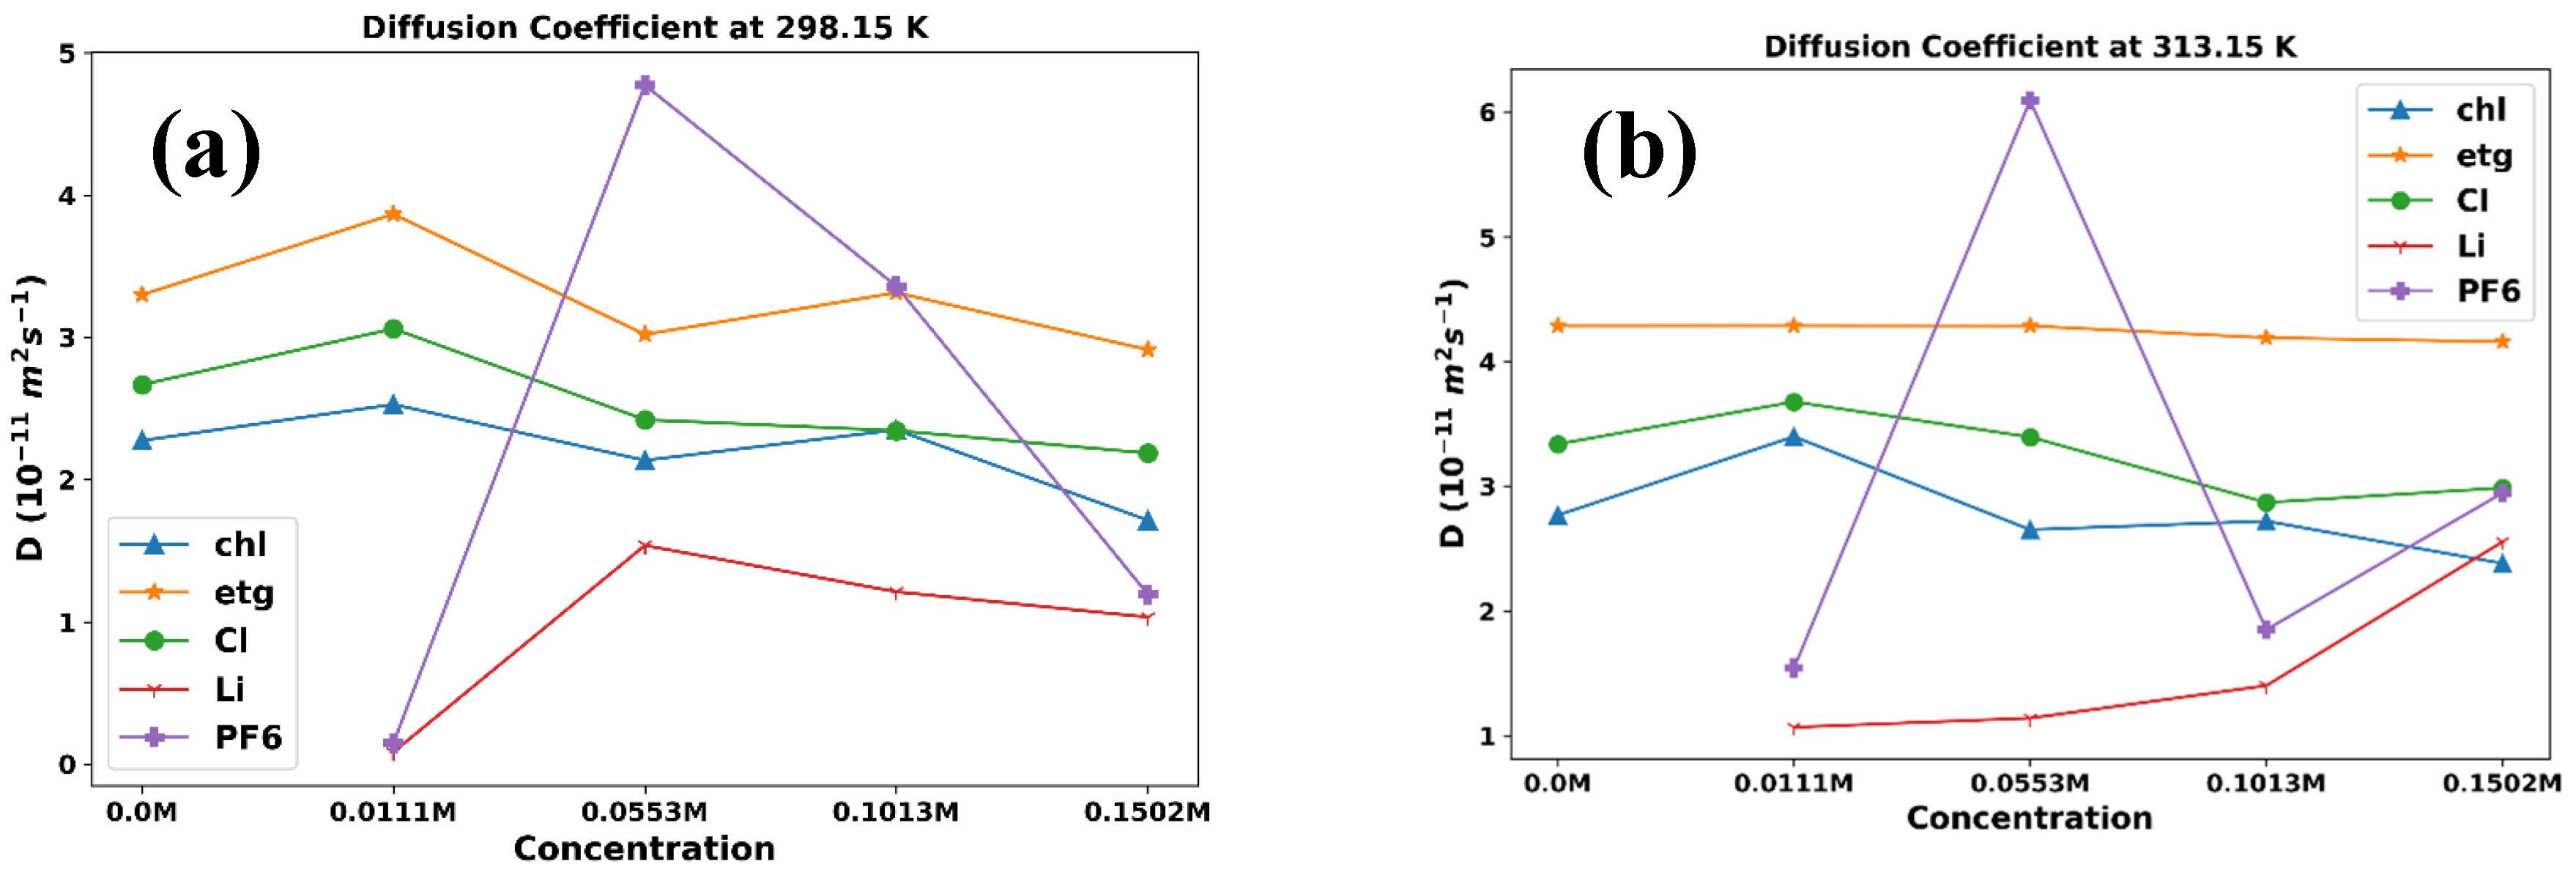
Next, we examined the impact of LiPF6 concentration on the diffusion coefficients. Figure 4 illustrates this trend in the diffusion coefficients. According to this figure, for choline, ethylene glycol, and chloride, the diffusion coefficients tend to marginally decrease with increasing LiPF6 concentration. This is likely due to the increased ionic strength of the solution at higher LiPF6 concentrations, which can lead to increased electrostatic interactions between ions and reduced mobility. However, based on Figure 4, we are not observing regular and systematic behavior for the diffusion coefficients of [Li+] and [PF6-] ions in the mixtures at different temperatures by increasing the LiPF6 concentration.
In general, viscosity is a measure of a liquid’s resistance to flow, and it depends on various factors such as the size, shape, and interaction of molecules, concentration of solutes, and temperature. Electrostatic interactions between ions and the formation of ion clusters can also influence viscosity. The experimental viscosity data of ChlCl/4Eg mixtures with LiPF6 at different concentrations and temperatures are presented in Table 6. The data show that viscosity generally increases with concentration and temperature, as expected for a solute added to a solvent. Increasing the concentration of solutes generally increases the viscosity of the solution.
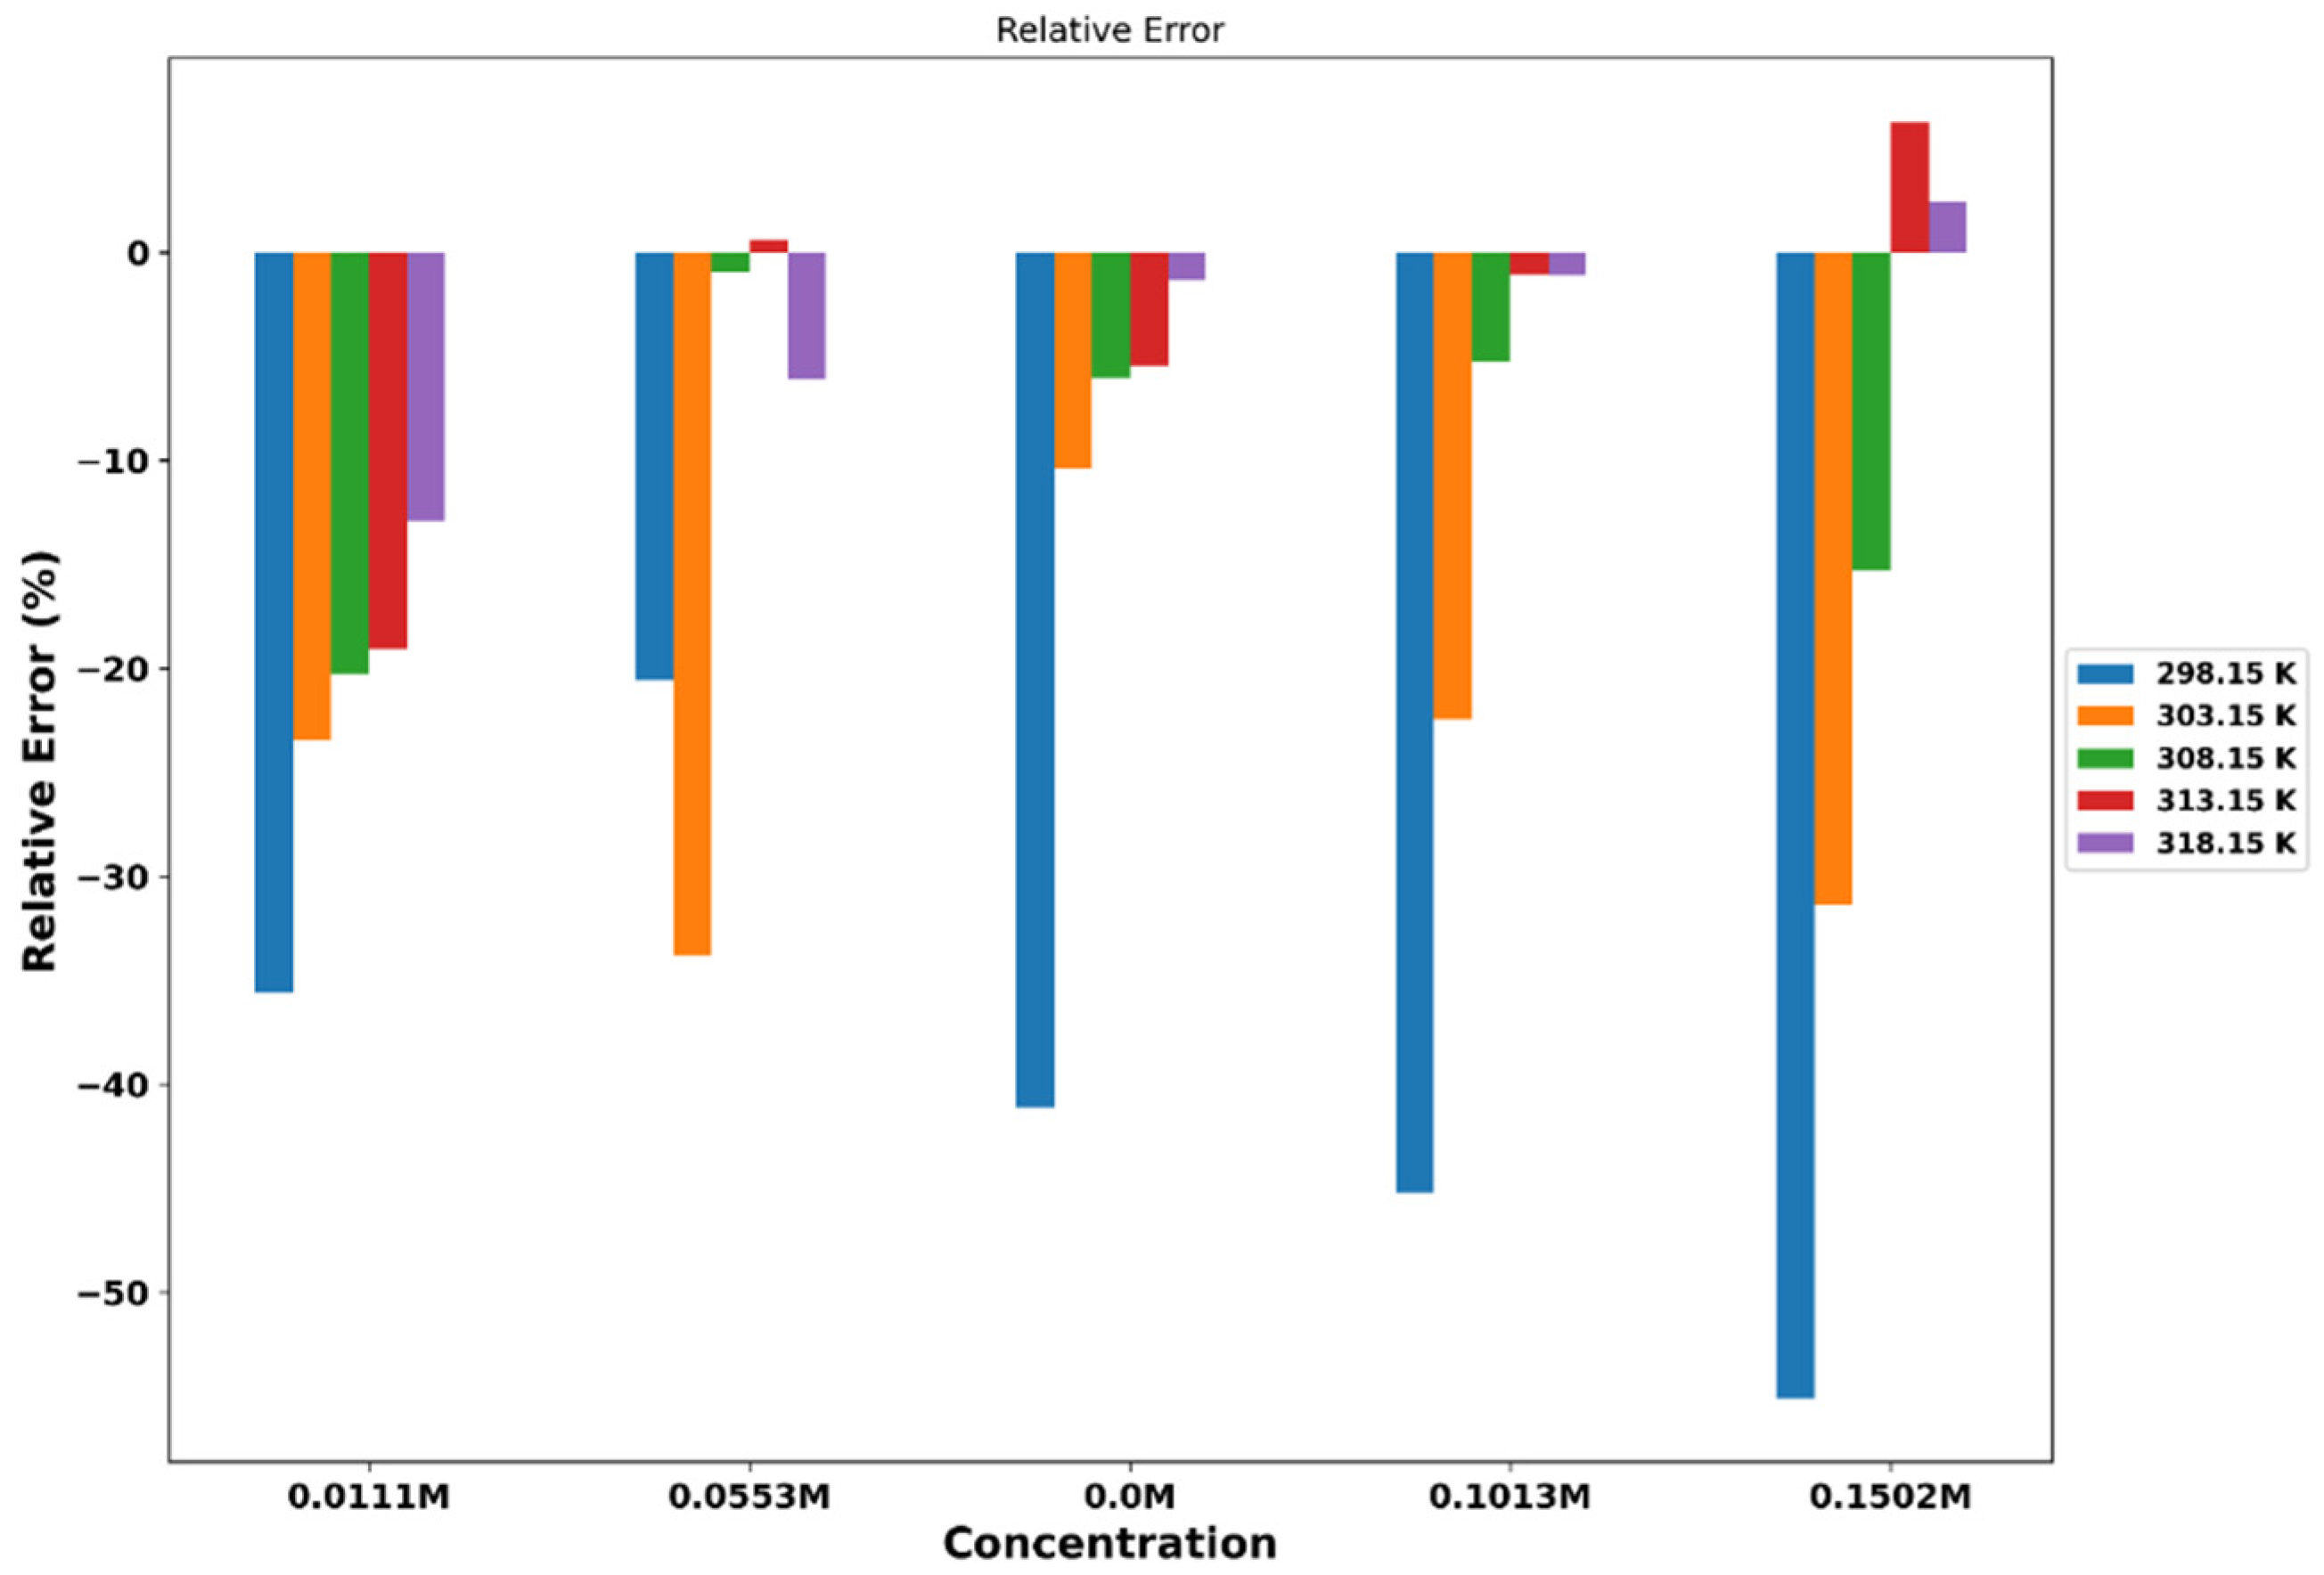
The effect of temperature on viscosity can be explained by the fact that increasing temperature usually reduces the strength of intermolecular forces, making molecules more mobile and decreasing viscosity. In addition, we calculated the viscosity of the aforementioned mixtures using computational approaches, and the results are presented in Table 7. The viscosities obtained from the transverse-current correlation function (TCCF) are compared with the experimental data. The simulation data show a similar trend of increasing viscosity with increasing concentration and temperature. However, MD simulations tend to overestimate viscosity, especially at lower concentrations and temperatures. This indicates that MD simulations may overestimate the strength of the interactions between molecules in the mixture. Figure 5 shows the percentage of relative error between the simulation and experimental data.
Both experimental and MD simulation data show a decrease in viscosity with increasing temperature, as higher temperatures lead to increased molecular motion and reduced intermolecular interactions. The rate of decrease in viscosity with temperature seems to be faster for the experimental data than for the MD simulation data, especially at lower concentrations.
In terms of concentration dependance, both experimental and MD simulation data show an increase in viscosity with increasing concentration of LiPF6. The addition of LiPF6 leads to increased ionic strength and stronger ion-ion interactions, which in turn increase the viscosity. The rate of increase in viscosity with concentration seems to be faster for the experimental data than for the MD simulation data, especially at lower temperatures.
Ionic conductivity is a measure of a solution’s ability to conduct electricity, which depends on the mobility of ions in the solution and is influenced by factors such as ion concentration, temperature, and solvent properties. As ion concentration and/or temperature increase, ionic conductivity typically increases. The experimental ionic conductivity data for mixtures of ChlCl/Eg + LiPF6 at different temperatures and compositions, are presented in Table 8.
The Nernst-Einstein equation relates the ionic conductivity of a solution to the diffusion coefficient and charge of the ions in the solution (equation 6). The equation was used to calculate the ionic conductivity of these mixtures, and the results are presented in Table 9. To use this equation to calculate the ionic conductivity, we used the diffusion coefficient data described above. Then, the number density of the ions is obtained from the concentration of the ions and the volume of the simulation box. The MD simulation data shows similar trends to the experimental data, but the magnitudes of the ionic conductivity values are different. The MD simulation results tend to underestimate the ionic conductivity compared with the experimental data, especially at lower LiPF6 concentrations. This could be due to various factors such as force field parameters, simulation time, or treatment of long-range electrostatic interactions.
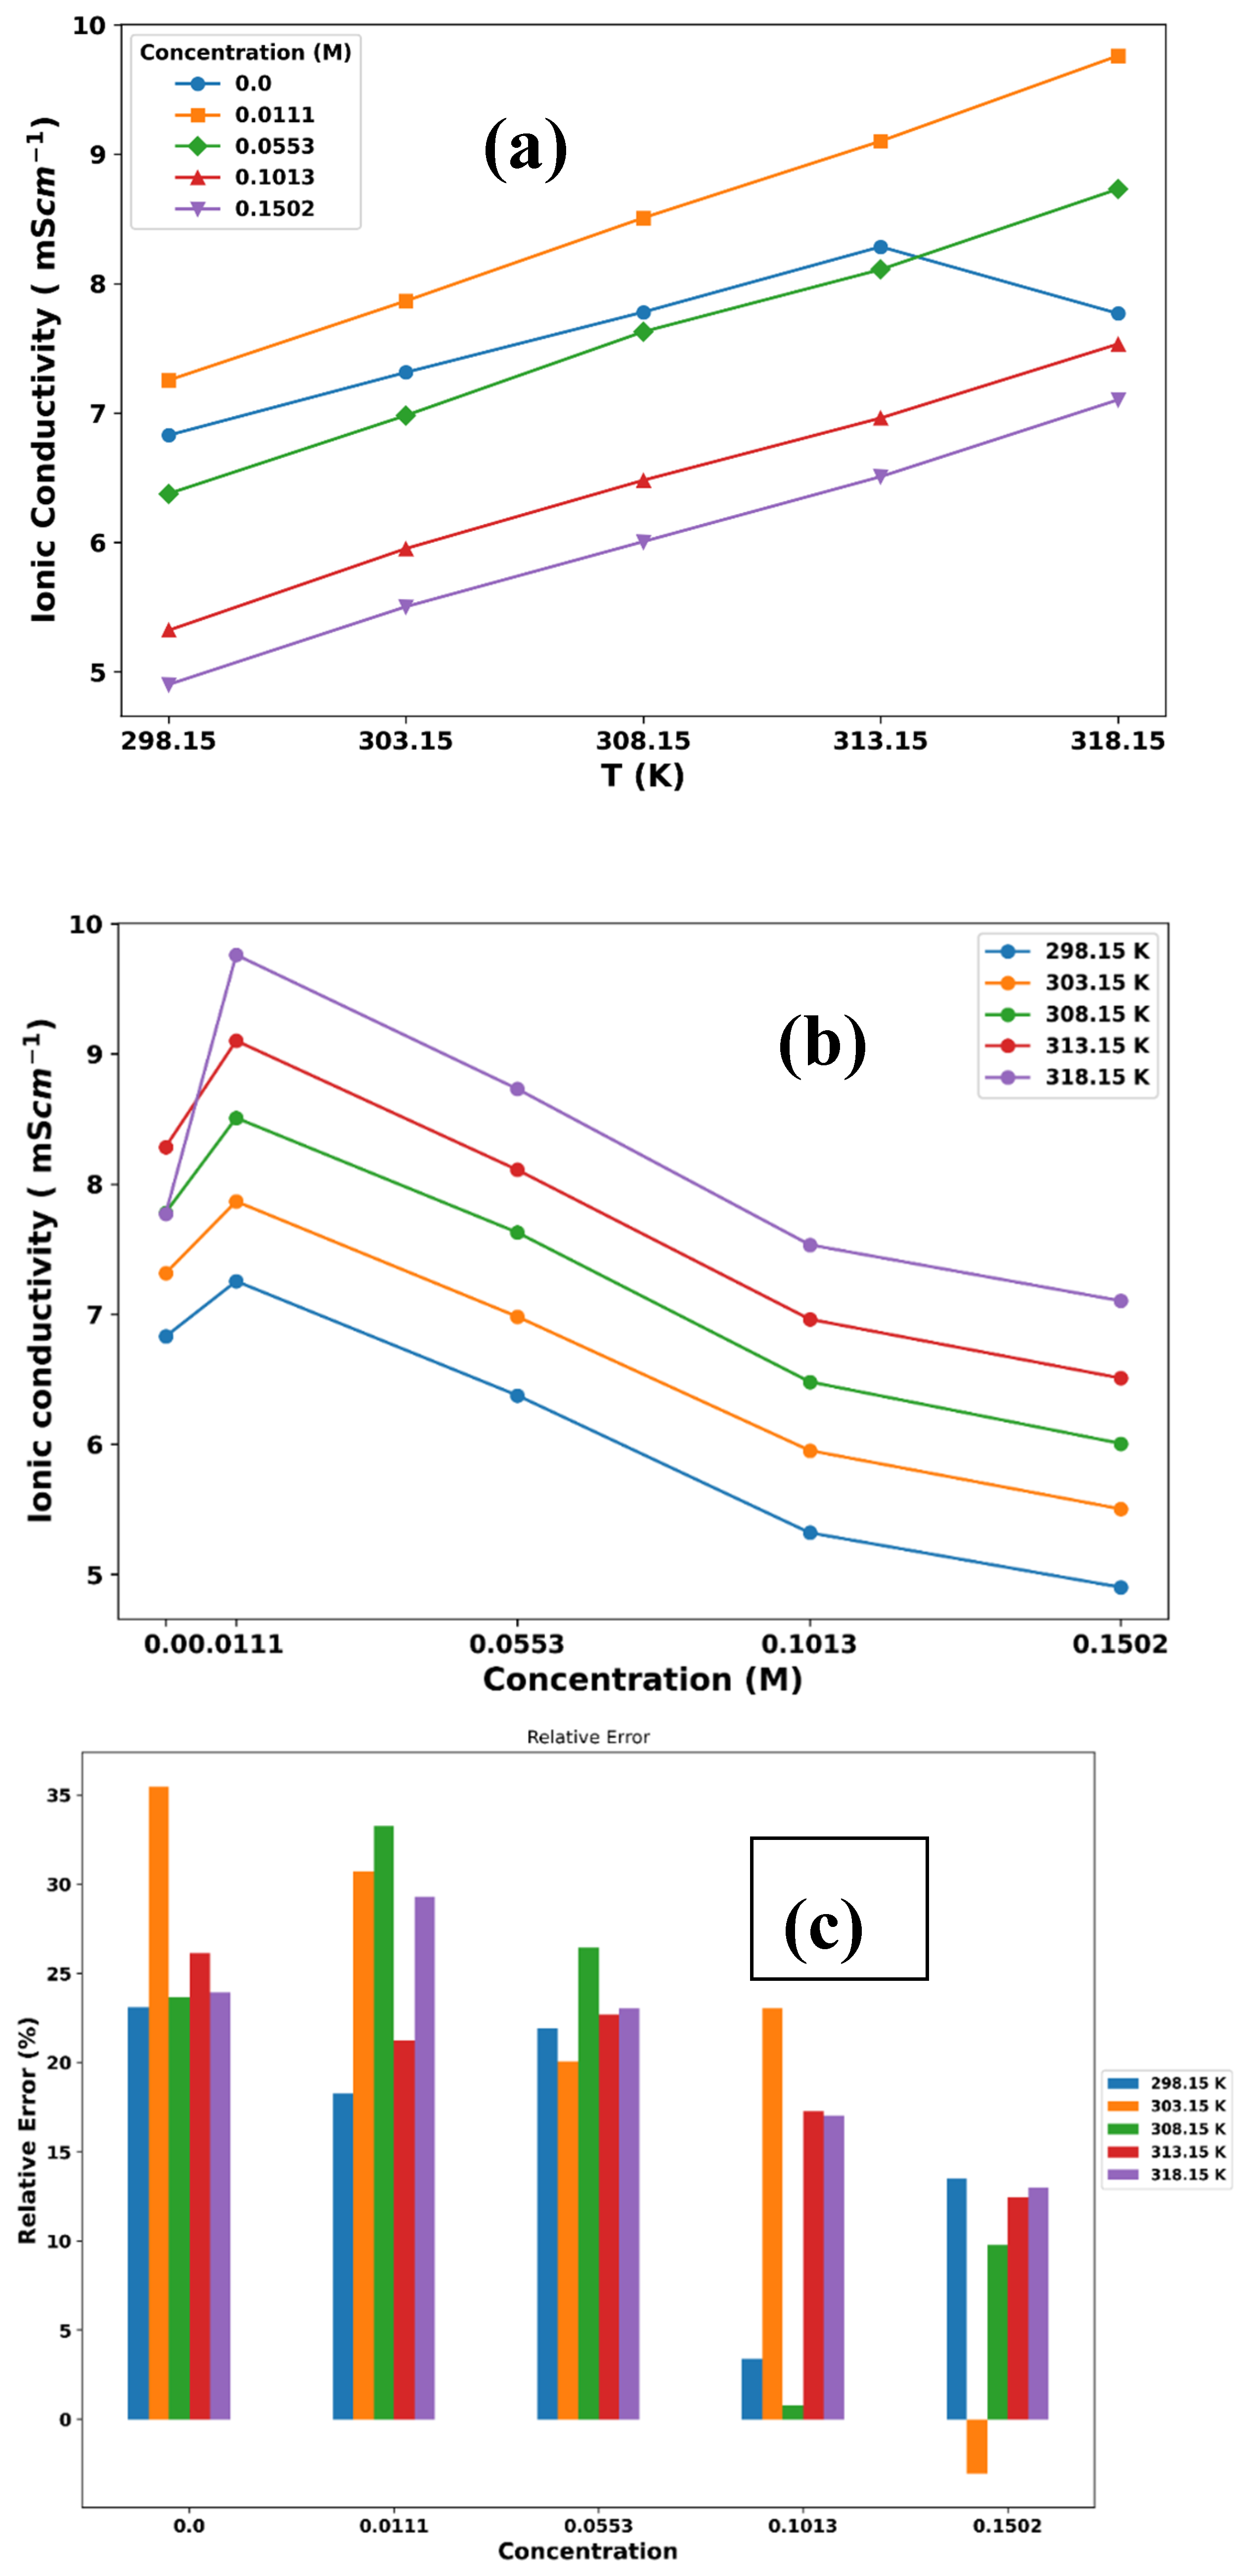
Figure 6 illustrates the trend of these data by variation in temperature (Figure 6a) and concentration of LiPF6 (Figure 6b). The data show that the ionic conductivity decreases with increasing LiPF6 concentration at all temperatures, indicating that the presence of LiPF6 reduces the ionic conductivity of the mixture. This result can be attributed to the increase in ion-pairing and decrease in ion mobility due to the presence of LiPF6. Higher temperatures at the same LiPF6 concentration result in higher ionic conductivity due to increased thermal energy, leading to greater ion mobility (Figure 6a). A plot of the percentage of relative error between the simulation and experimental ionic conductivity data for ChlCl:4Eg versus the concentration of LiPF6 in different temperature also represented in Figure 6c.

3.1. Structural Analysis

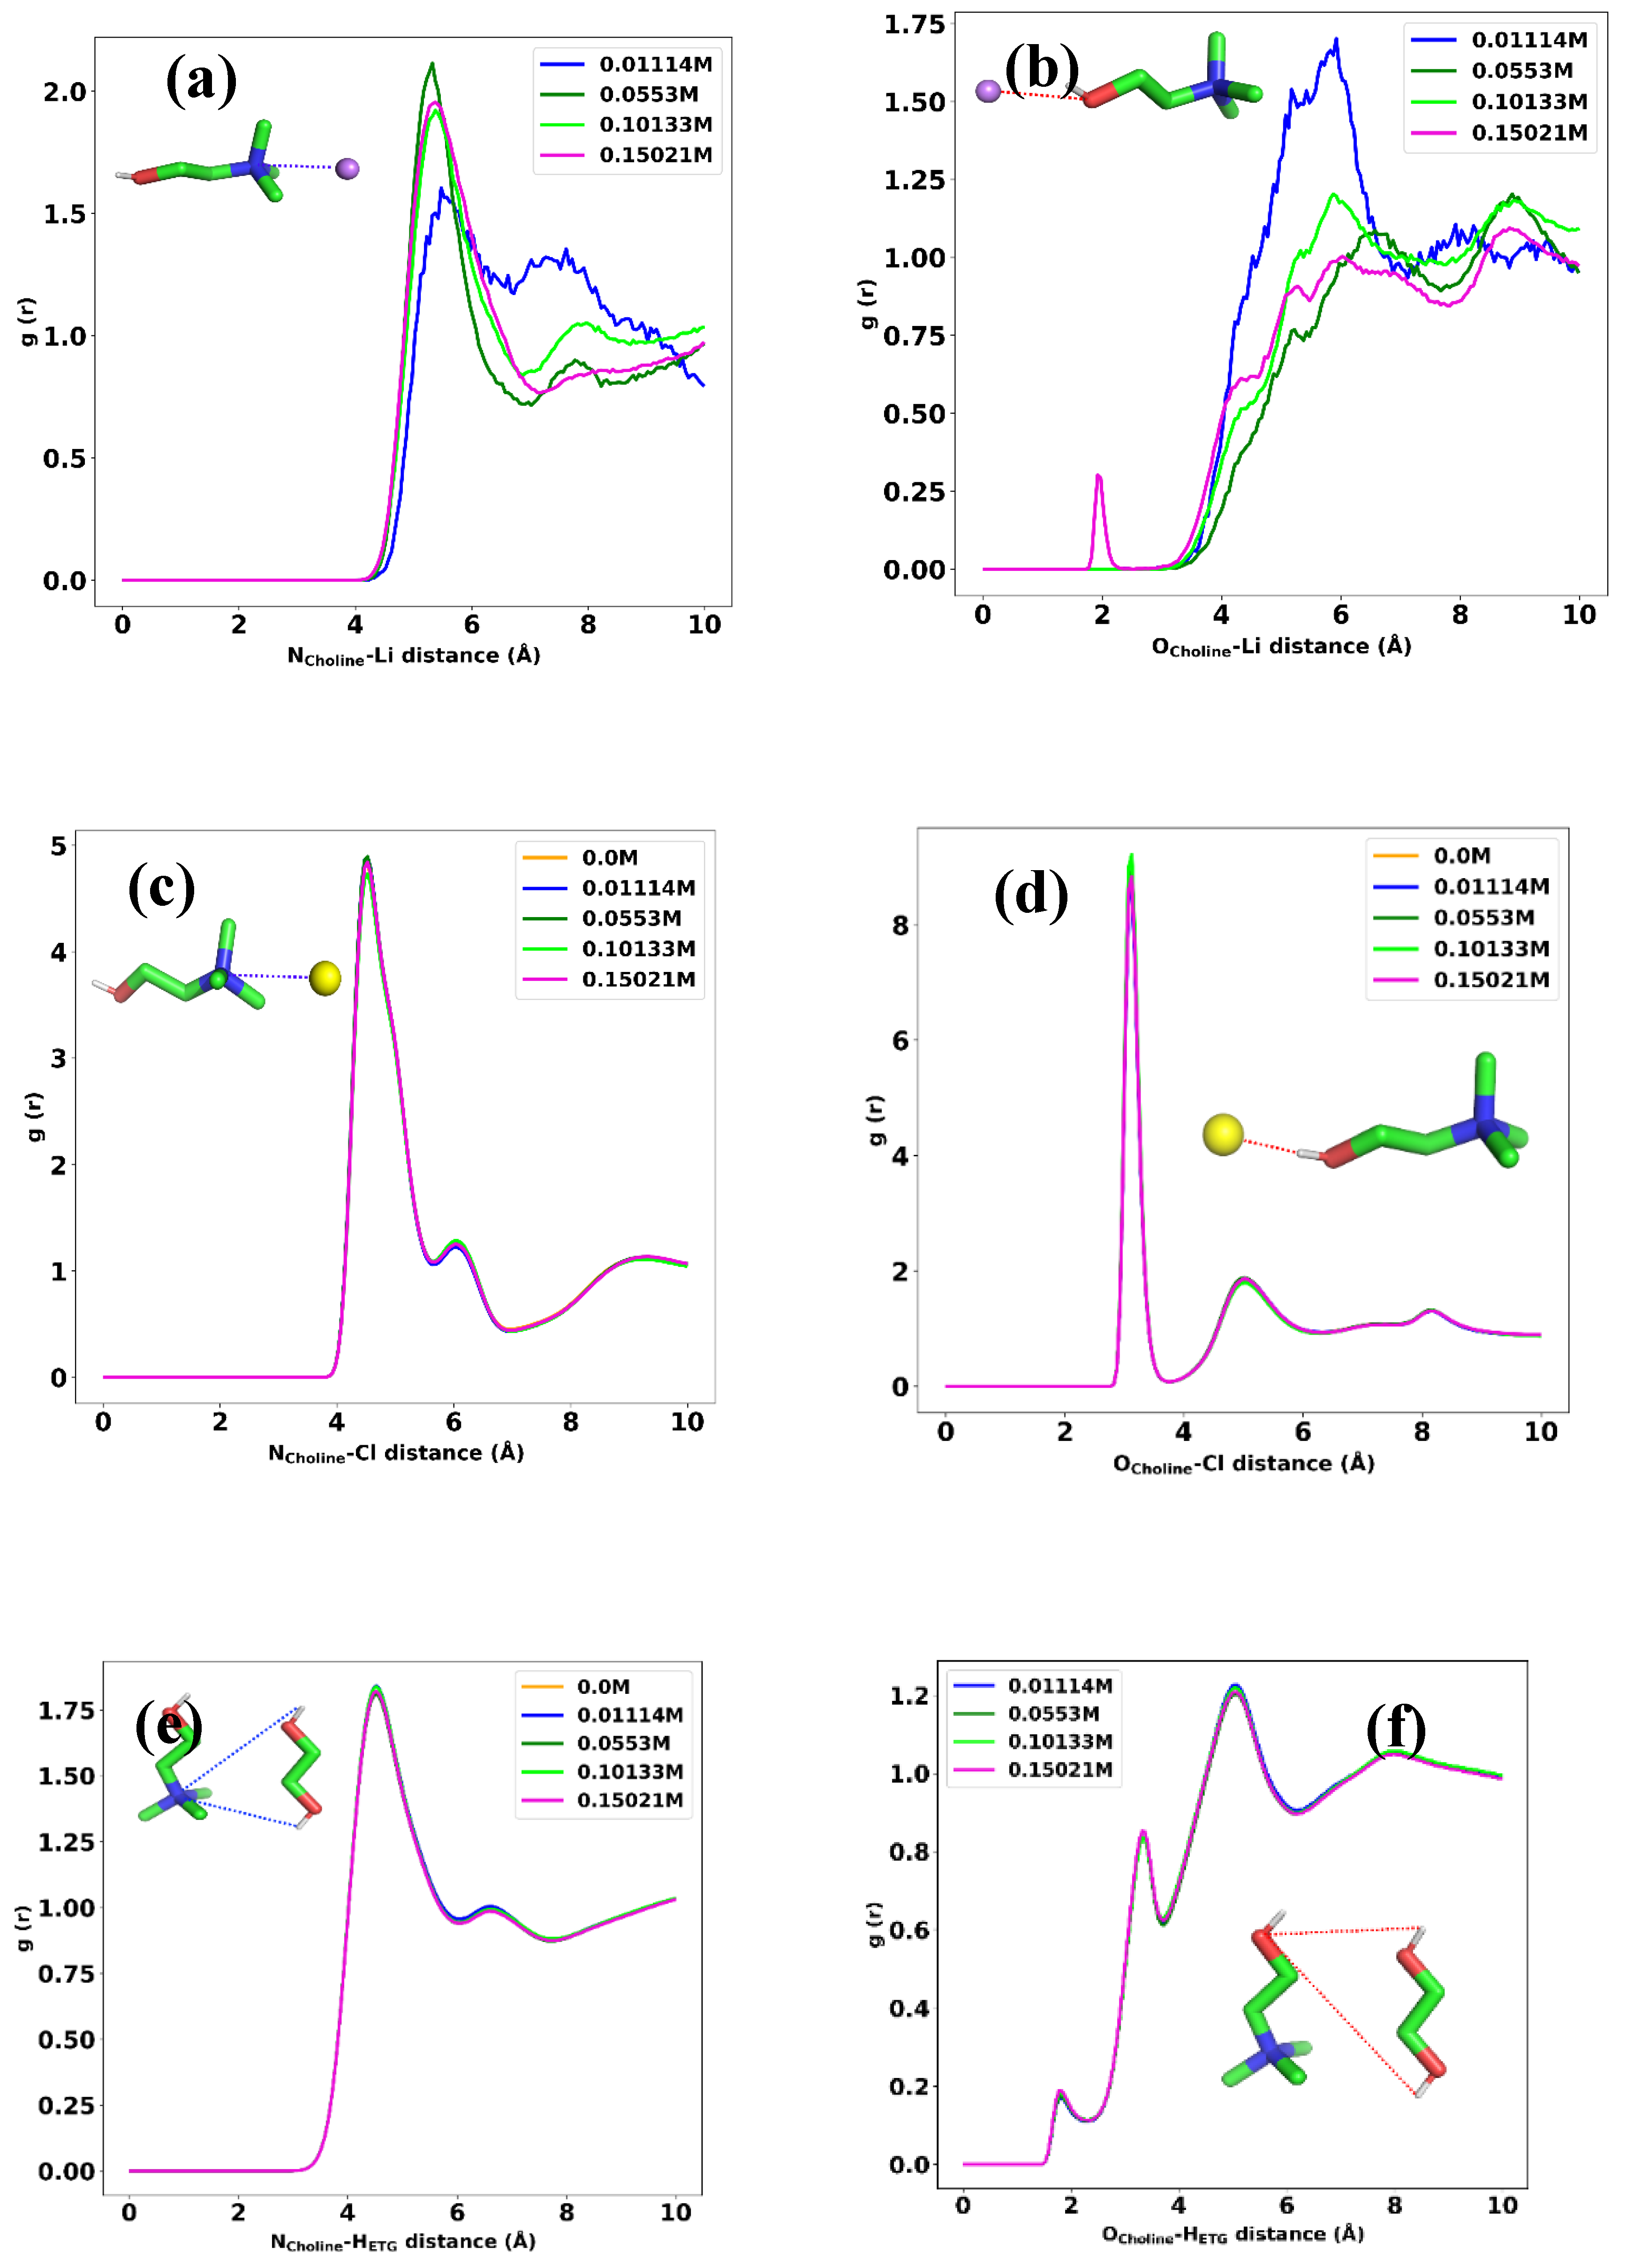
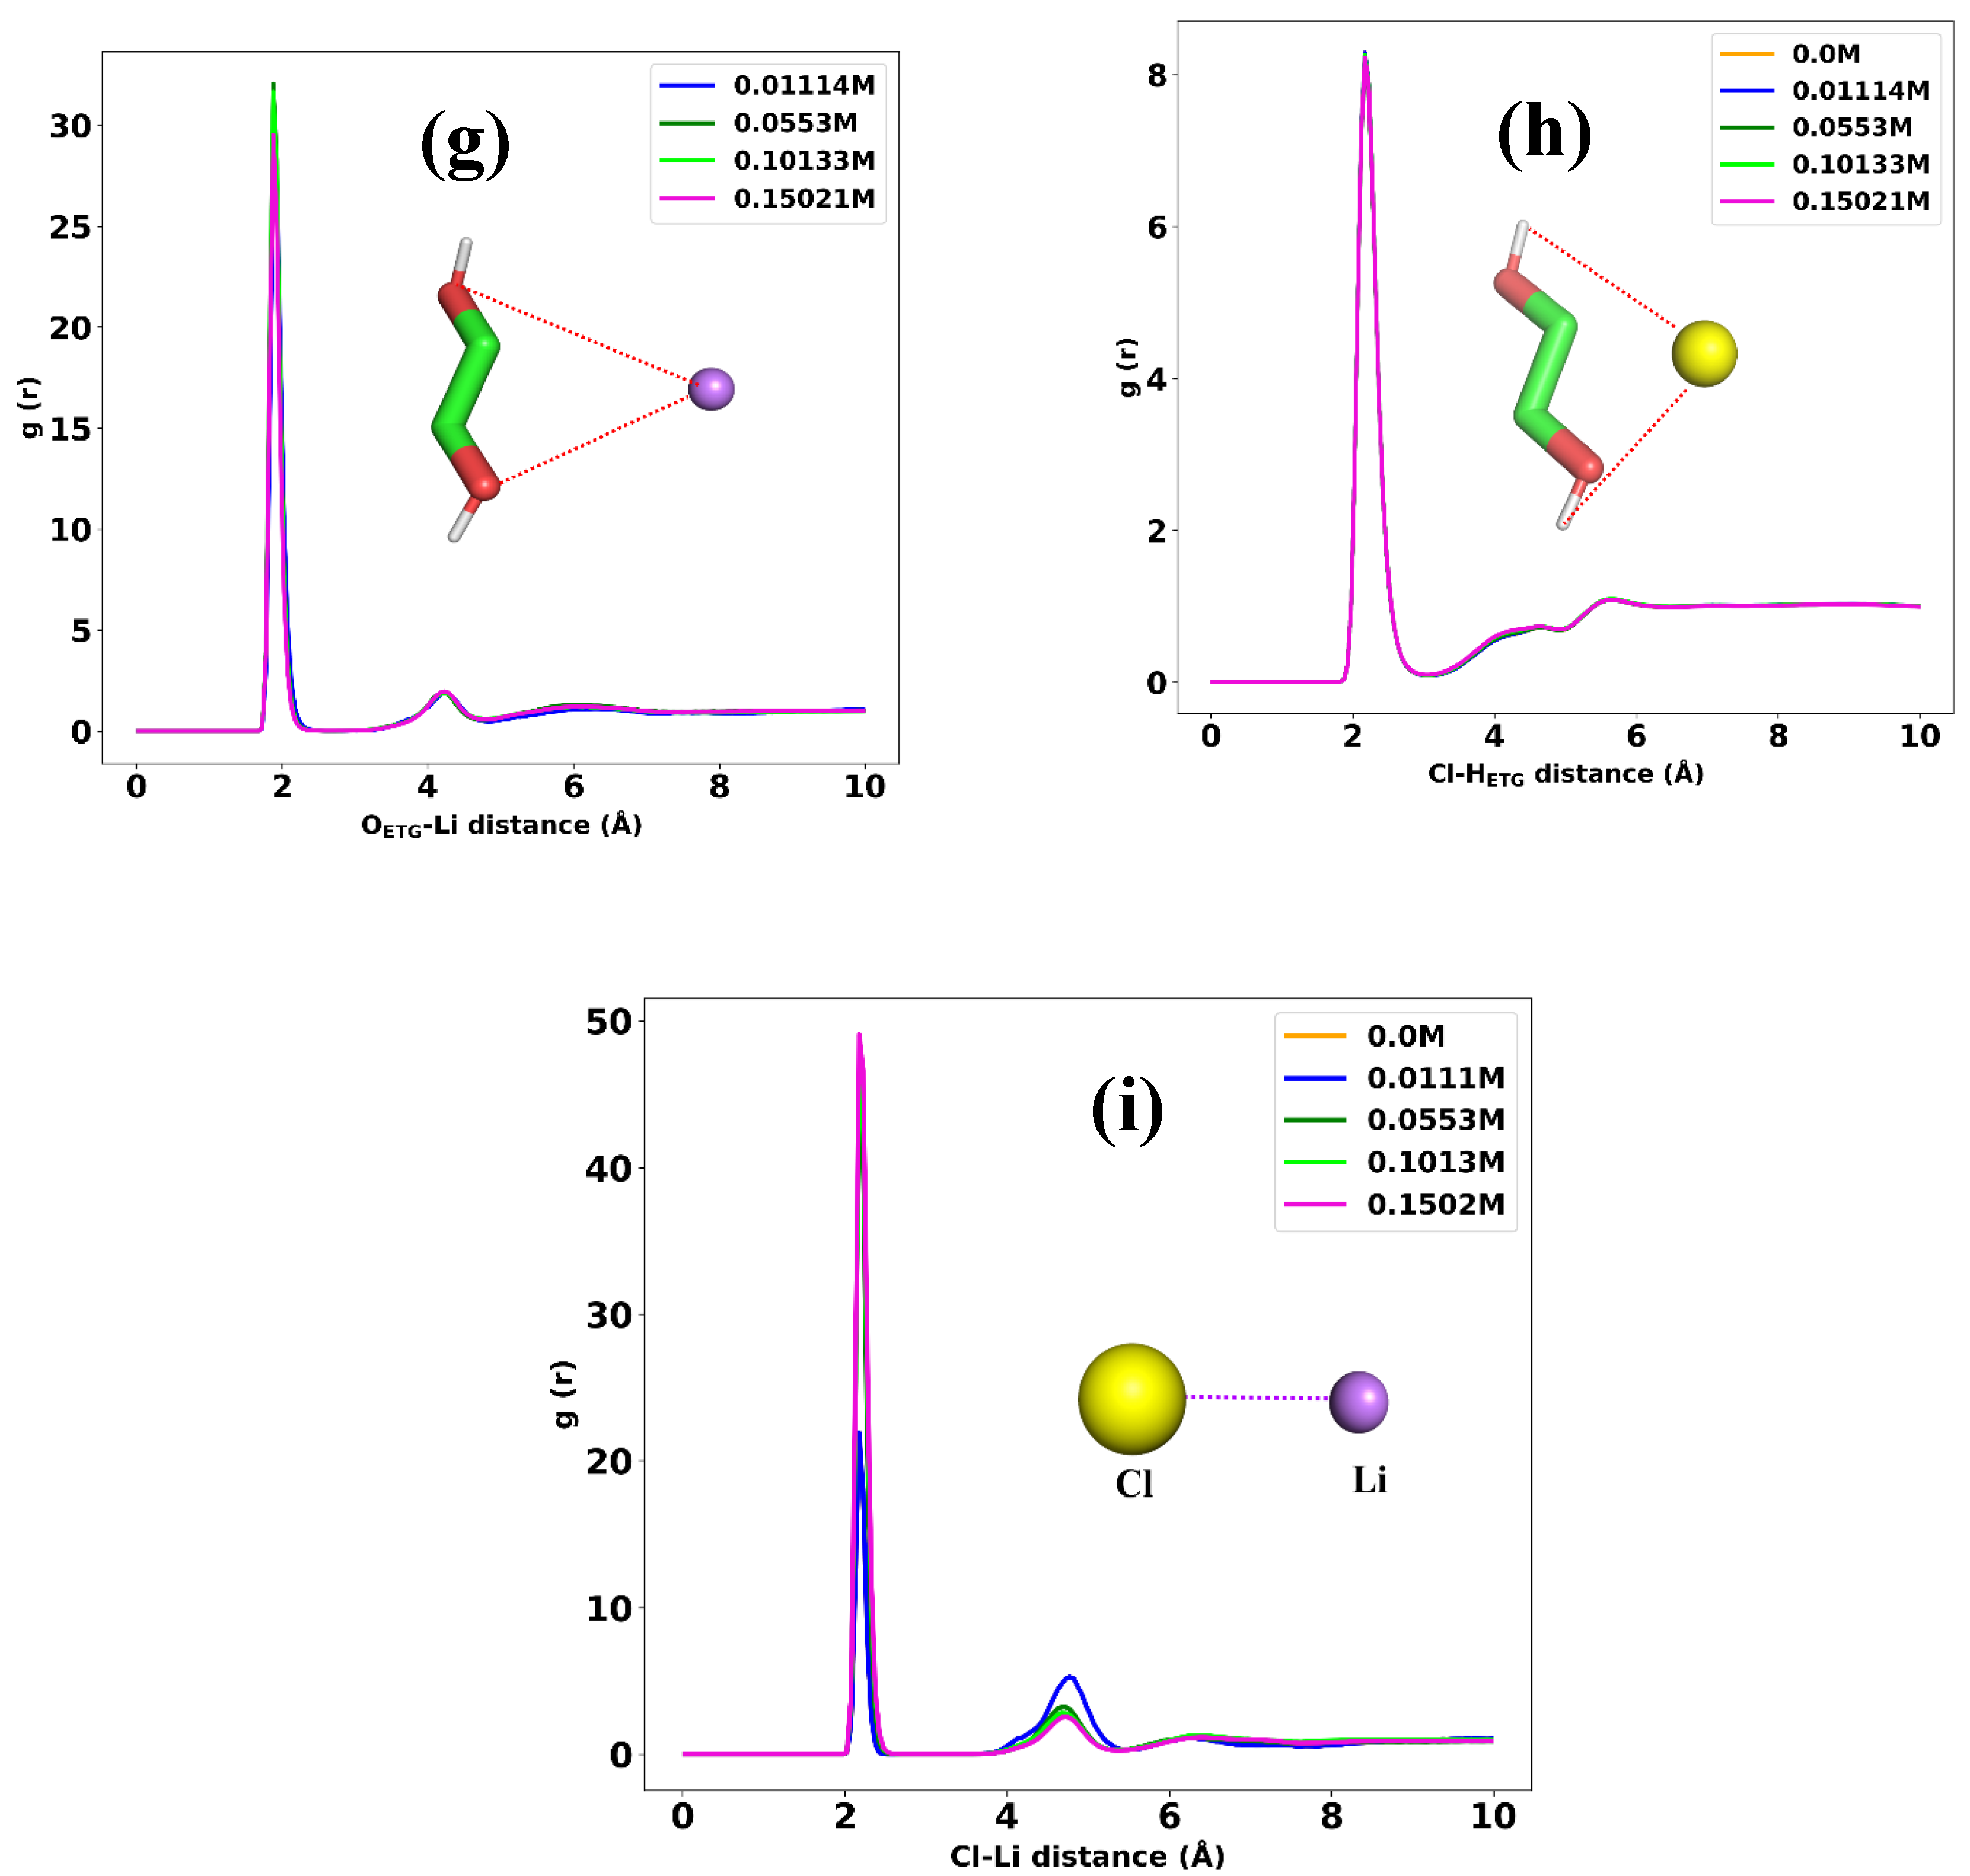
Determining the structural configuration of each constituent in a mixture can provide valuable information regarding the main internal forces between the components of the liquid. To achieve this, we used atom-atom radial distribution functions (RDF) analysis at a temperature of 298 K. We first tried to find the arrangement of choline toward the Li+ ion. Because both sides of choline, the nitrogen (N) and oxygen (O) atom, are of interest, we calculate the RDF of these atoms with Li+. Figure 6a shows the RDF for the N atom in choline with Li+ at different concentrations. According to this figure, at any LiPF6 concentrations (0.01-0.15 M), there is essentially no coordination between nitrogen and lithium, as indicated by RDF values 0 up to approximately 4 angstroms. Then, an RDF peak begins to emerge around 4-4.5 angstroms, indicating the formation of the first solvation shell with lithium ions coordinated to nitrogen atoms. The height and width of the first peak increase with LiPF6 concentration, showing that more lithium ionsinteract with nitrogen and the distances of these interactions increase. As we can see in Figure 6b, the same RDF peak begins around 4-4.5 angstroms, but the intensity for 0.01M LiPF6 is higher than that for the other concentrations indicating that the Li ion tends to arrange toward both sides of the choline molecules at lower concentrations. The interaction between the nitrogen atom in choline and chloride ion is represented as the RDF curve in Figure 6c. This indicates that the first solvation shell with Cl ions coordinated to nitrogen atoms begins to appear around 4-4.5 angstroms. According to Figure 6d, the first coordination shell, which is the distance at which the first peak occurs, is approximately 2.9 angstroms, indicating that the chloride ion and oxygen atom in choline are on average separated by this distance in the DES mixture. According to this figure, increasing the Li ion does not change the intensity of correlation between these two atoms, indicating that the hydrogen bonds between chloride ion and oxygen atom has been not affect by introducing more LiPF6 into the mixture. The RDF values are generally higher at higher LiPF6 concentrations, indicating greater correlation and interaction between the nitrogen and the hydrogen atoms. This shows that as the salt concentration increases, the local structure around these atoms is modified and they tend to come closer together. Figure 6e shows the RDF data of the nitrogen atom in choline and the hydrogen atoms in ethylene glycol in 0, 0.01, 0.05, 0.1 and 0.15 molar of LiPF6. There is a slight difference in RDF values between the 0.01M, 0.1M, and 0.15M concentrations, which slightly increases as the distance decreases. the peaks in the RDF data around 4 Angstroms and 6 Angstroms indicate that the nitrogen and hydrogen atoms exhibit preferential correlations or interactions at those distances. The 4 Angstrom correlations are much stronger and become more prominent at higher LiPF6 concentrations, indicating that they may be facilitated by the salt ions. The 6 Angstrom correlations were weaker and showed a smaller increase with concentration. We investigated the correlation between oxygen atoms in choline and hydrogen atoms in ethylene glycol in 0.01, 0.05, 0.1, and 0.15 molar of LiPF6 and the results are depicted in Figure 6f. It shows that the oxygen and hydrogen atoms have a stronger propensity to interact, and correlate at all distances, as seen from the generally higher RDF values. The local environment around the atoms is perturbed more substantially, allowing for stronger interactions, especially at closer lengths (<4 Angstroms). Preferential correlations emerge at approximately 3–4 Angstroms and are enhanced at higher concentrations, indicating that the LiPF6 ions facilitate these interactions. Figure 6g illustrates the interaction between oxygen in ethylene glycol and Li ions. We can see a strong interaction between these two atoms, indicating that there is a large coordination of Li ions around the ethylene glycol molecules. Increasing the LiPF6 concentration makes this interaction stronger, as we expected, because more Li ions are accessible to the ethylene glycol in the mixture. The same correlation observed in the RDF plot of chloride ions with hydrogen atoms in ethylene glycol, which is depicted in Figure 6h. the distance and intensity of the peak in this figure indicates that strong interaction takes place between these two atoms in the mixture. It is also interesting to evaluate the arrangement of Li ion toward chloride ion in the mixture. We have such a plot in Figure 6i, which shows that strong coordination between Li and chloride ions occurs at a distance of 2 angstroms and increases with increasing the concentration of LiPF6.

4. Conclusions

In this study, we synthesized DES mixtures with varying concentrations of LiPF6 salt while maintaining a constant constituent ratio of ChlCl/Eg as 1:4 mole ratio. The mixtures remained stable at temperatures between 298 and 398 K. The experimental density, viscosity, and ionic cunductivity of the mixtures increased with salt concentration. The study also used MD simulation to validate the forcefield used for other transport and structural properties. The ionic conductivities of the mixtures decreased with increasing salt concentration, with the highest conductivity observed in the mixture containing 0.011 M LiPF6. The diffusion coefficients for all cations and anions increased with temperature, but decreased with increasing salt concentration due to electrostatic interactions between counter ions. The RDFs showed that the Li+ ion was in close contact with Cl and strongly connected to oxygen atoms in the Eg molecules.

References

  1. Larcher, D.; Tarascon, J.-M. Towards greener and more sustainable batteries for electrical energy storage. Nat. Chem. 2015, 7, 19–29. [Google Scholar] [CrossRef] [PubMed]
  2. Lise, W.; van der Laan, J.; Nieuwenhout, F.; Rademaekers, K. Assessment of the required share for a stable EU electricity supply until 2050. Energy Policy 2013, 59, 904–913. [Google Scholar] [CrossRef]
  3. Fan, X.; Liu, B.; Liu, J.; Ding, J.; Han, X.; Deng, Y.; Lv, X.; Xie, Y.; Chen, B.; Hu, W. Battery technologies for grid-level large-scale electrical energy storage. Trans. Tianjin Univ. 2020, 26, 92–103. [Google Scholar] [CrossRef]
  4. Zhao, Y.; Ding, Y.; Li, Y.; Peng, L.; Byon, H.R.; Goodenough, J.B.; Yu, G. A chemistry and material perspective on lithium redox flow batteries towards high-density electrical energy storage. Chem. Soc. Rev. 2015, 44, 7968–7996. [Google Scholar] [CrossRef] [PubMed]
  5. Ye, J.; Xia, L.; Wu, C.; Ding, M.; Jia, C.; Wang, Q. Redox targeting-based flow batteries. J. Phys. D: Appl. Phys. 2019, 52, 443001. [Google Scholar] [CrossRef]
  6. Zhao, E.W.; Liu, T.; Jónsson, E.; Lee, J.; Temprano, I.; Jethwa, R.B.; Wang, A.; Smith, H.; Carretero-González, J.; Song, Q. In situ NMR metrology reveals reaction mechanisms in redox flow batteries. Nature 2020, 579, 224–228. [Google Scholar] [CrossRef] [PubMed]
  7. Chakrabarti, M.H.; Mjalli, F.S.; AlNashef, I.M.; Hashim, M.A.; Hussain, M.A.; Bahadori, L.; Low, C.T.J. Prospects of applying ionic liquids and deep eutectic solvents for renewable energy storage by means of redox flow batteries. Renew. Sustain. Energy Rev. 2014, 30, 254–270. [Google Scholar] [CrossRef]
  8. Miller, M.; Wainright, J.; Savinell, R. Communication—Iron ionic liquid electrolytes for redox flow battery applications. J. Electrochem. Soc. 2016, 163, A578. [Google Scholar] [CrossRef]
  9. Lloyd, D.; Vainikka, T.; Ronkainen, M.; Kontturi, K. Characterisation and application of the Fe (II)/Fe (III) redox reaction in an ionic liquid analogue. Electrochim. Acta 2013, 109, 843–851. [Google Scholar] [CrossRef]
  10. Lloyd, D.; Vainikka, T.; Kontturi, K. The development of an all copper hybrid redox flow battery using deep eutectic solvents. Electrochim. Acta 2013, 100, 18–23. [Google Scholar] [CrossRef]
  11. Xu, Q.; Qin, L.; Ji, Y.; Leung, P.; Su, H.; Qiao, F.; Yang, W.; Shah, A.; Li, H. A deep eutectic solvent (DES) electrolyte-based vanadium-iron redox flow battery enabling higher specific capacity and improved thermal stability. Electrochim. Acta 2019, 293, 426–431. [Google Scholar] [CrossRef]
  12. Zhang, L.; Zhang, C.; Ding, Y.; Ramirez-Meyers, K.; Yu, G. A low-cost and high-energy hybrid iron-aluminum liquid battery achieved by deep eutectic solvents. Joule 2017, 1, 623–633. [Google Scholar] [CrossRef]
  13. Wang, Y.; Niu, Z.; Zheng, Q.; Zhang, C.; Ye, J.; Dai, G.; Zhao, Y.; Zhang, X. Zn-based eutectic mixture as anolyte for hybrid redox flow batteries. Sci. Rep. 2018, 8, 5740. [Google Scholar] [CrossRef] [PubMed]
  14. Wang, Y.; Zhou, H. A green and cost-effective rechargeable battery with high energy density based on a deep eutectic catholyte. Energy Environ. Sci. 2016, 9, 2267–2272. [Google Scholar] [CrossRef]
  15. Miller, M.A.; Wainright, J.S.; Savinell, R.F. Iron electrodeposition in a deep eutectic solvent for flow batteries. J. Electrochem. Soc. 2017, 164, A796. [Google Scholar] [CrossRef]
  16. Shen, D.; Vukmirovic, M.B.; Akolkar, R. Understanding the Role of Complexation in the Charge-Transfer Kinetics of the Cu2++ e↔ Cu1+ Redox Reaction in Ethaline Deep Eutectic Solvent. J. Electrochem. Soc. 2019, 166, E526. [Google Scholar] [CrossRef]
  17. Hess, B.; Kutzner, C.D. vanderSpoel, E. Lindahl. J. Chem. Theory Comput 2008, 4, 435–447. [Google Scholar] [CrossRef] [PubMed]
  18. Parrinello, M.; Rahman, A. Polymorphic transítions in single crystals: A new molecular dynamics method polymorphic transítions in single crystals: A new molecular dynamics method. 2002.
  19. Hess, B.; Bekker, H.; Berendsen, H.; Fraaije, J. AIDJCC4. 3.0. CO: 1997.
  20. Darden, T.; York, D.; Pedersen, L. Particle mesh Ewald: An N⋅ log (N) method for Ewald sums in large systems. J. Chem. Phys. 1993, 98, 10089–10092. [Google Scholar] [CrossRef]
  21. Van Gunsteren, W.F.; Berendsen, H.J. A leap-frog algorithm for stochastic dynamics. Mol. Simul. 1988, 1, 173–185. [Google Scholar] [CrossRef]
  22. Perkins, S.L.; Painter, P.; Colina, C.M. Molecular dynamic simulations and vibrational analysis of an ionic liquid analogue. J. Phys. Chem. B 2013, 117, 10250–10260. [Google Scholar] [CrossRef] [PubMed]
  23. Hess, B. Determining the shear viscosity of model liquids from molecular dynamics simulations. J. Chem. Phys. 2002, 116, 209–217. [Google Scholar] [CrossRef]
  24. Van Der Spoel, D.; Lindahl, E.; Hess, B.; Groenhof, G.; Mark, A.E.; Berendsen, H.J. GROMACS: Fast, flexible, and free. J. Comput. Chem. 2005, 26, 1701–1718. [Google Scholar] [CrossRef] [PubMed]
  25. Yeh, I.-C.; Hummer, G. System-size dependence of diffusion coefficients and viscosities from molecular dynamics simulations with periodic boundary conditions. J. Phys. Chem. B 2004, 108, 15873–15879. [Google Scholar] [CrossRef]
  26. Bittner, E.R. Chemical Dynamics in the Condensed Phases: Relaxation, Transfer, and Reactions in Condensed Molecular Systems By Abraham Nitzan (Tel Aviv University). Oxford University Press: Oxford, New York. 2006. xxii+ 720 pp. $89.50. ISBN 0-19-852979-1. ACS Publications: 2006.
  27. Moradi, H.; Farzi, N. Experimental and computational assessment of the physicochemical properties of choline chloride/ethylene glycol deep eutectic solvent in 1: 2 and 1: 3 mole fractions and 298.15–398.15 K. J. Mol. Liq. 2021, 339, 116669. [Google Scholar] [CrossRef]
  28. Moradi, H.; Farzi, N. The investigation of deep eutectic electrolyte based on Choline Chloride: Ethylene glycol in 1: 3 M ratio and lithium hexafluorophosphate salt for application in Lithium-Ion batteries. J. Mol. Liq. 2022, 360, 119476. [Google Scholar] [CrossRef]
  29. Ferreira, E.S.; Voroshylova, I.V.; Pereira, C.M.; DS Cordeiro, M.N.l. Improved force field model for the deep eutectic solvent ethaline: Reliable physicochemical properties. J. Phys. Chem. B 2016, 120, 10124–10137. [Google Scholar] [CrossRef]
  30. Del Pópolo, M.G.; Voth, G.A. On the structure and dynamics of ionic liquids. J. Phys. Chem. B 2004, 108, 1744–1752. [Google Scholar] [CrossRef]
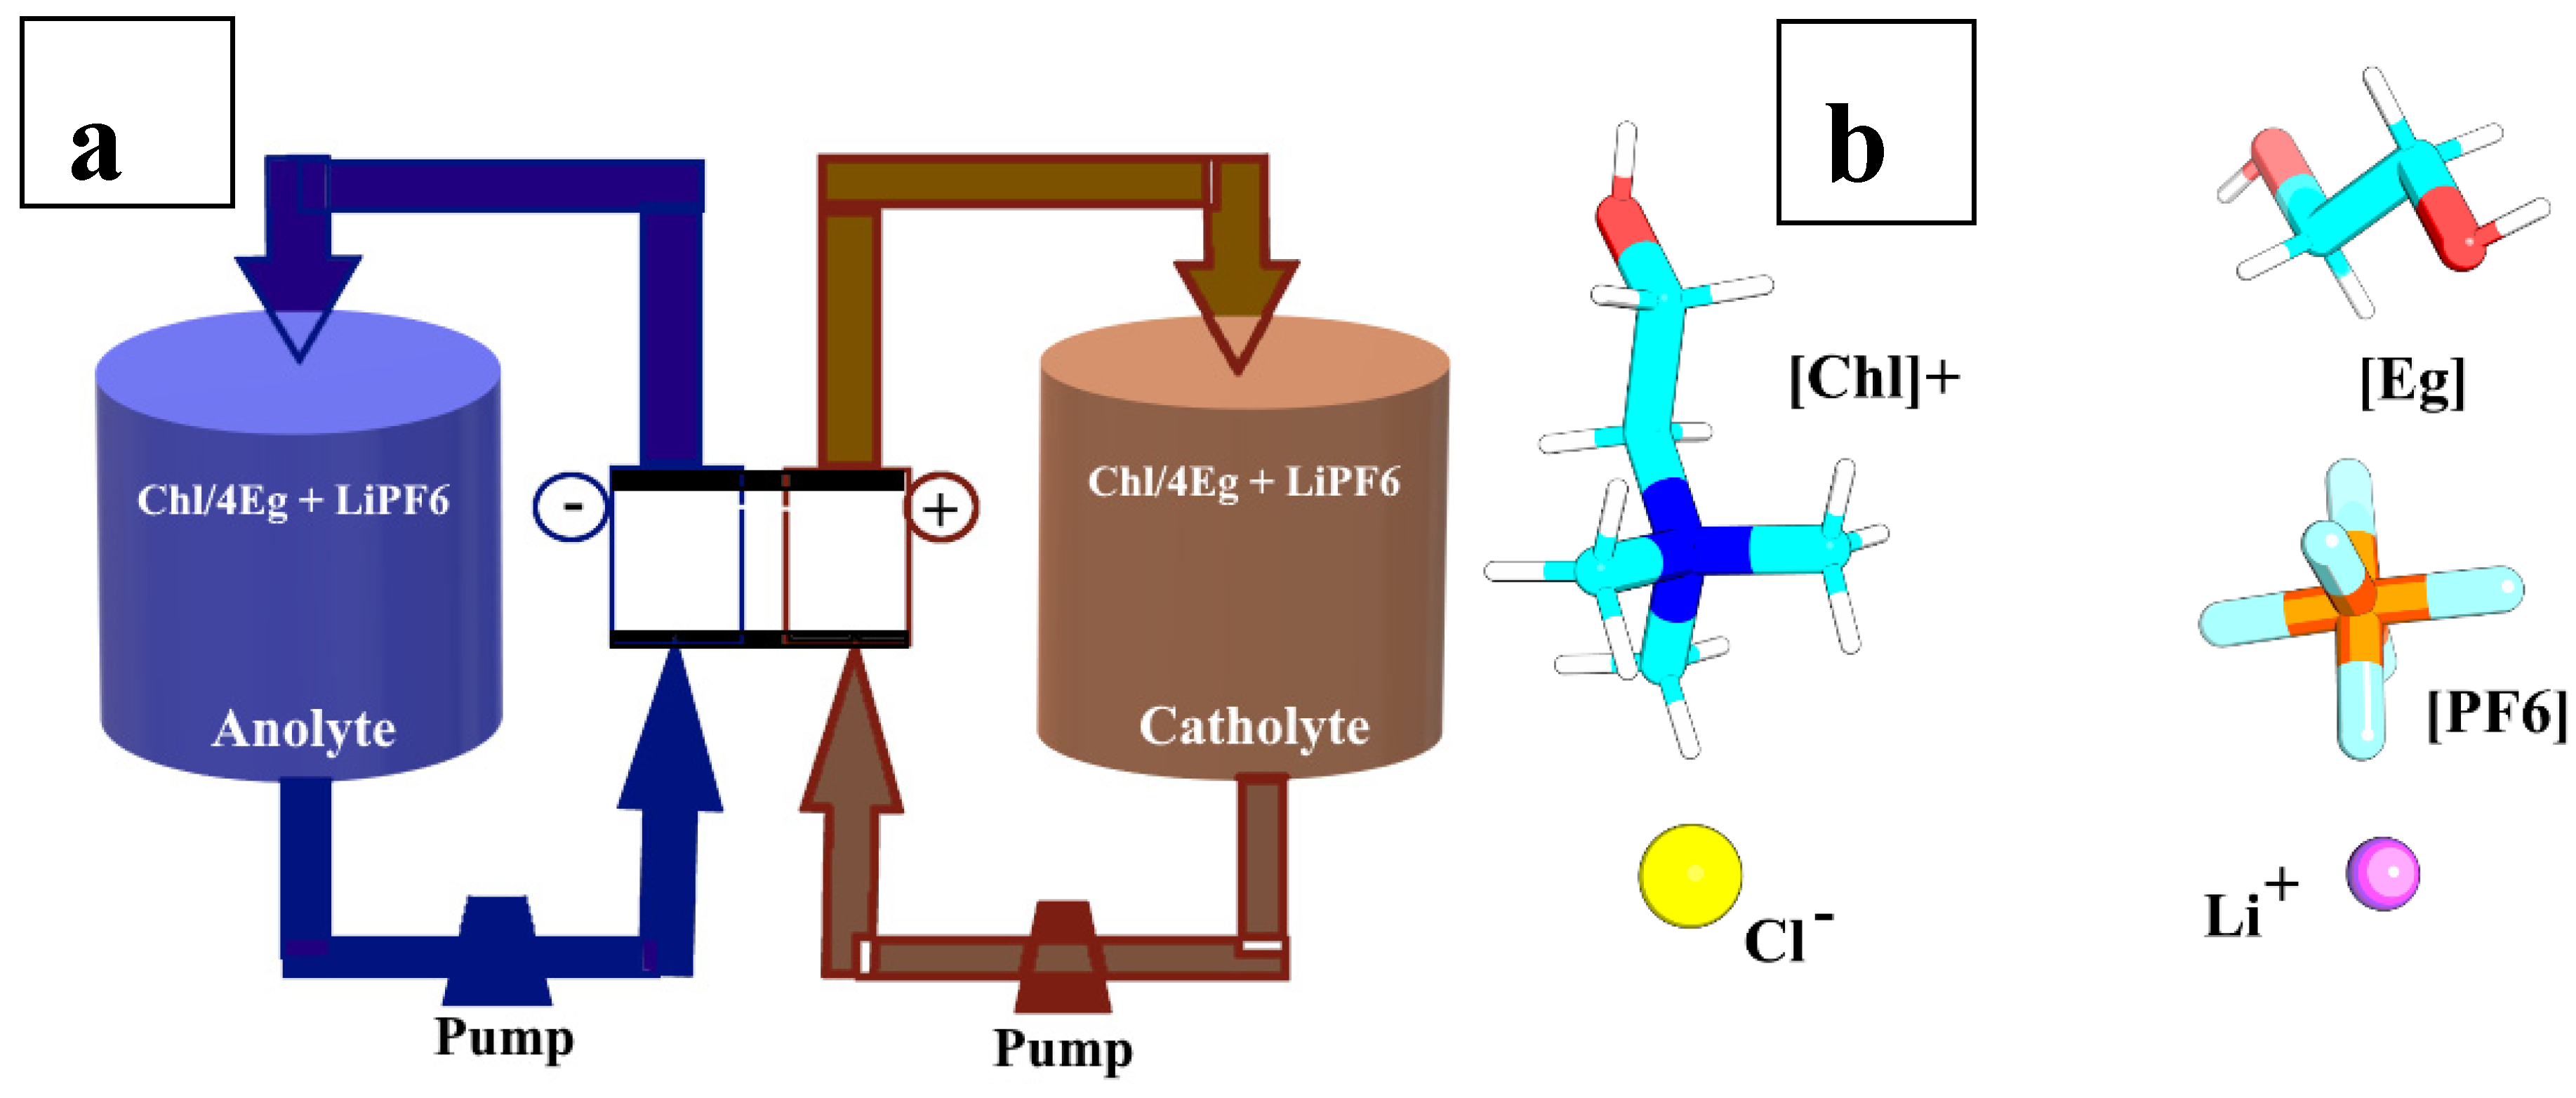
Figure 1. (a) Schematic of the proposed RFB. (b)Structure of choline ([Chl]+), chloride (Cl-), ethylene glycol ([Eg]), and LiPF6.
Preprints 90692 g001
Figure 2. (a)The MD simulation density plot of ChlCl:4Eg versus temperature for different concentrations of LiPF6. The discrepancies of each datapoint calculated by the block averaging method and represented as error bars in the plot. (b) Plot of the percentage of relative error between the simulation and experimental density data versus the concentration of LiPF6 at different temperatures.
Preprints 90692 g002
Figure 3. Diffusion coefficient plots versus temperature for ChlCl:,4Eg mixed with LiPF6 in (a) 0.0M (b) 0.0111M, (c) 0.0553M, (d) 0.1013M, and (e) 0.1502M.
Preprints 90692 g003
Figure 4. Diffusion coefficient plots of ChlCl:4Eg versus different concentration of LiPF6 at (a) 0.0111M, (b) 0. 0.0553M, (c) 0.1013M, and (d) 0.1502M.
Preprints 90692 g004aPreprints 90692 g004b
Figure 5. plot of the percentage of relative error between simulation and experimental viscosity data for ChlCl:4Eg versus LiPF6 concentration at different temperatures.
Preprints 90692 g005
Figure 6. Experimental ionic conductivity plots of ChlCl:4Eg at (a) different temperatures and (b) different concentrations of LiPF6. (c) percentage of relative error between simulation and experimental ionic conductivity data for ChlCl:4Eg versus concentration of LiPF6 at different temperatures.
Preprints 90692 g006
Figure 6. The atom-atom RDF between (a) [Li+] and nitrogen atom in [Chl+], (b) [Li+] and oxygen atom in [Chl+], (c) [Cl-] and nitrogen in [Chl+], (d) [Cl-] and oxygen, (e) hydrogen atoms in [Eg] with nitrogen in [Chl+], (f) hydrogen atoms in [Eg] with oxygen in [Chl+], (g) oxygen in hydroxyl groups of [Eg] molecules and lithium, (h) hydrogens in hydroxyl groups of [Eg] molecules and [Cl-], and (i) [Li+] and [Cl-] at 298 K for different LiPF6 concentrations.
Preprints 90692 g007aPreprints 90692 g007b
Table 1. Materials used in this study.
Chemicals Origin CAS No. Mass fraction (purity) Structure
Ethylene glycol Merck 107-21-1 >0.99
Choline Chloride Merck 67-48-1 >0.99
Lithium hexafluorophosphate Merck >0.99 LiPF6
Table 2. The box size and the number of each molecule (NO.) correspond to LiPF6 concentrations.
LiPF6 conc. Box size (nm3) No.Choline No. Chloride No. Ethylene glycol No. Li No.PF6
0. 0111M 6.87413 553 553 2212 3 3
0.0553M 6.87653 553 553 2212 12 12
0.1013M 6.88713 553 553 2212 22 22
0.1502M 6.89583 553 553 2212 33 33
 
Table 3. Experimental density data of the ChlCl/4Eg-LiPF6 mixture at various temperatures and LiPF6 concentrations and P = 871 hPa.
T/K ρ/g.cm-3
0.0 M 0. 0111M 0.0553M 0.1013M 0.1502M
 
298.15 1.1143 1.1153 1.1193 1.1236 1.1290
303.15 1.1113 1.1123 1.1159 1.1206 1.1253
308.15 1.1081 1.1093 1.1129 1.1176 1.1222
313.15 1.1052 1.1064 1.1099 1.1146 1.1194
318.15 1.1021 1.1033 1.1068 1.1115 1.1163
 
Standard uncertainties are u, in density, viscosity, temperature, and pressure are u(ρ) = 0.05 kg∙m-3, ur(η) = 0.05 mPas, u(T) = 0.01 K, u(p) = 10 hPa, respectively.
Table 4. The calculated densities for two DES studies in this work are 298.15–398.15K.
T/K ρ/g.cm-3
0.0 M LiPF6 0. 0111 M LiPF6 0.0553 M LiPF6 0.1013 M LiPF6 0.1502 M LiPF6
298.15 1.0922 1.0905 1.0971 1.0999 1.1049
303.15 1.0881 1.0874 1.0919 1.0973 1.1005
308.15 1.0842 1.0852 1.0890 1.0928 1.0980
313.15 1.0802 1.0797 1.0850 1.0881 1.0939
318.15 1.0761 1.0767 1.0809 1.0852 1.0895
328.15 1.0687 1.0698 1.0733 1.0778 1.0821
348.15 1.0535 1.0547 1.0576 1.0625 1.0672
398.15 1.0173 1.0186 1.0222 1.0264 1.0310
Table 5. The diffusion coefficient of [ChlCl][4Eg] [LiPF6] mixtures calculated from the MD simulation in this work in the 298.15-398.15 K temperature range.
ChlCl/Eg (1:4)
T/ K D Chl+
(1011 m2s-1)
DEg
(1011 m2s-1)
D Cl-
(1011 m2s-1)
DLi+
(1011 m2s-1)
DPF6
(1011 m2s-1)
0.0 M LiPF6
 
298.15 2.27 3.30 2.67
303.15 1.90 3.70 2.61
308.15 2.65 3.94 3.11
313.15 2.77 4.29 3.34
318.15 2.36 4.37 3.56
328.15 3.60 5.19 4.04
348.15 4.52 5.71 5.29
398.15 5.70 5.21 5.76
 
0. 0111 M LiPF6
 
298.15 2.53 3.87 3.06 0.08 0.15
303.15 2.16 3.54 3.04 0.17 2.13
308.15 2.55 3.89 2.96 0.83 3.81
313.15 3.4 4.29 3.68 1.07 1.54
318.15 3.05 4.4 3.85 6.34 0.03
328.15 4.18 5.08 3.86 6.94 7.98
348.15 4.49 5.78 5.43 6.47 8.1
398.15 6.13 5.34 5.82 8.73 5.33
 
0.0553 M LiPF6
 
298.15 2.14 3.02 2.42 1.54 4.77
303.15 2.57 3.78 2.75 1.25 0.28
308.15 2.33 3.87 3.09 1.31 1.04
313.15 2.65 4.29 3.4 1.14 6.1
318.15 3.1 4.31 3.53 1 5.28
328.15 3.31 4.98 4.78 4.19 4.22
348.15 4.54 5.63 5.11 2.23 4.38
398.15 5.71 5.42 5.37 1.78 5.85
 
0.1013 M LiPF6
 
298.15 2.35 3.31 2.34 1.21 3.36
303.15 1.94 3.2 2.36 2.23 0.63
308.15 2.84 3.69 3.2 3.3 3.2
313.15 2.72 4.19 2.87 1.4 1.85
318.15 3.16 4.55 2.93 2.09 3.35
328.15 3.25 5.05 4.37 3.09 3.36
348.15 4.26 5.95 5.29 2.71 4.56
398.15 6.02 5.49 5.97 5.31 5.66
0.1502 M LiPF6
 
298.15 1.71 2.91 2.19 1.03 1.19
303.15 2.41 3.18 2.84 0.8 2.99
308.15 2.14 3.68 2.91 0.84 3.68
313.15 2.38 4.16 2.99 2.56 2.95
318.15 2.92 4.34 2.96 2.82 3.75
328.15 3.54 4.96 4.35 2.72 3.24
348.15 4.23 5.54 4.59 4.11 4.08
398.15 6.17 5.68 5.88 5.48 5.88
Table 6. Experimental viscosity data for the ChlCl/4Eg-LiPF6 mixture at temperatures from 298.15 K to 318.15 K and LiPF6 concentrations from 0.0 M to 0.1502 M.
T/K η/ mPa·s
 
0.0 M 0. 0111M 0.0553M 0.1013M 0.1502M
 
298.15 20.84 23.20 25.14 26.83 28.04
303.15 17.44 19.20 20.68 22.17 23.51
308.15 15.17 16.67 17.38 18.52 19.19
313.15 12.73 13.92 14.89 15.87 16.72
318.15 11.07 12.05 13.00 13.96 14.84
 
Table 7. Experimental (exp) and calculated (TCCF) viscosity (η) for ChlCl:4Eg at 1 bar pressure.
T/K ηTCCF(cP)
0.0 M LiPF6 0. 0149 M LiPF6 0.0553 M LiPF6 0.1013 M LiPF6 0.1502 M LiPF6
298.15 28.27 ± 5.3 27.99 ± 5.4 35.48 ± 6.9 38.97 ± 7.9 43.49 ± 9.1
303.15 21.54 ± 3.7 25.69 ± 4.6 22.83 ± 4.0 27.16 ± 5.0 30.89 ± 6.1
308.15 18.26 ± 3.2 16.84 ± 2.6 18.44 ± 3.0 19.49 ± 3.2 22.13 ± 3.8
313.15 15.16 ± 2.3 13.84 ± 2.2 15.71 ± 2.4 16.04 ± 2.6 15.68 ± 2.5
318.15 12.51 ± 1.8 12.79 ± 2.0 13.18 ± 1.8 14.12 ± 2.2 14.48 ± 2.1
328.15 9.51 ± 1.2 10.40 ± 1.5 8.51 ± 0.8 9.18 ± 1.0 10.51 ± 1.5
348.15 11.15 ± 1.5 11.20 ± 1.4 9.44 ± 1.4 9.52 ± 1.5 9.89 ± 1.5
398.15 2.23 ± 3.6 2.70 ± 1.3 5.63 ± 1.7 7.84 ± 1.3 7.78 ± 1.4
 
Table 8. Experimental ionic conductivity data for the ChlCl/4Eg-LiPF6 mixture at temperatures from 298.15 K to 318.15 K and LiPF6 concentrations from 0.0-0.1502 M.
T/K σexp (mS cm-1)
0.0 M 0. 0111M 0.0553M 0.1013M 0.1502M
 
298.15 6.828 7.253 6.376 5.320 4.901
303.15 7.314 7.866 6.981 5.952 5.503
308.15 7.780 8.508 7.628 6.480 6.006
313.15 8.285 9.101 8.109 6.961 6.508
318.15 7.769 9.761 8.731 7.533 7.102
 
Table 9. Simulated ionic conductivities of ChlCl:4Eg at different concentrations of LiPF6 over a given temperature range and pressure 1 bar.
T/K σNE (mS cm-1)
0.0 M LiPF6 0. 0149M LiPF6 0.0553M LiPF6 0.1013M LiPF6 0.1502M LiPF6
 
298.15 5.25 5.93 4.98 5.14 4.24
303.15 4.72 5.45 5.58 4.58 5.67
308.15 5.94 5.68 5.61 6.43 5.42
313.15 6.12 7.17 6.27 5.76 5.70
318.15 5.91 6.90 6.72 6.25 6.18
328.15 7.39 7.82 7.96 7.56 7.88
348.15 8.95 9.09 8.88 8.92 8.40
398.15 9.13 9.56 8.94 9.86 10.04
 
Disclaimer/Publisher’s Note: The statements, opinions and data contained in all publications are solely those of the individual author(s) and contributor(s) and not of MDPI and/or the editor(s). MDPI and/or the editor(s) disclaim responsibility for any injury to people or property resulting from any ideas, methods, instructions or products referred to in the content.
Copyright: This open access article is published under a Creative Commons CC BY 4.0 license, which permit the free download, distribution, and reuse, provided that the author and preprint are cited in any reuse.
Prerpints.org logo

Preprints.org is a free preprint server supported by MDPI in Basel, Switzerland.

Subscribe

© 2024 MDPI (Basel, Switzerland) unless otherwise stated