Introduction
Major Depressive Disorder (MDD) and Generalized Anxiety Disorder (GAD) are prevalent psychiatric conditions that significantly impact individuals' mental health and overall well-being [1]. MDD is characterized by persistent feelings of sadness, diminished interest in activities, altered sleep patterns, appetite disturbances, and, in severe cases, thoughts of self-harm or suicide. In contrast, GAD is characterized by excessive, uncontrollable worry about various life aspects, resulting in heightened anxiety, restlessness, muscle tension, and fatigue. If left untreated, these disorders can severely compromise daily functioning, interpersonal relationships, and overall quality of life [2].
Given the substantial societal and economic burdens posed by MDD and GAD, early detection and intervention are of paramount importance [3]. With technological advancements and the proliferation of data, there's a burgeoning interest in harnessing ML to predict and understand these complex conditions. ML with its capability to decipher intricate patterns within vast datasets, offers a promising avenue over traditional statistical methods.
In this study, we focus on four prominent ML algorithms, each renowned for its unique strengths: XGBoost, an optimized gradient boosting library, acclaimed for its efficiency and flexibility [4]; Random Forest, an ensemble method known for its accuracy and ability to manage large, high-dimensional datasets [5]; Logistic Regression, a statistical method offering a probabilistic framework apt for binary classification tasks like predicting MDD and GAD [6]; and the Naïve Bayesian classifier, grounded in Bayes' theorem, celebrated for its simplicity and efficiency, especially in high-dimensional datasets [7].
Our choice of these algorithms is driven by their diverse methodologies, providing a comprehensive lens to the prediction task. By amalgamating the strengths of these algorithms, we aim for a holistic approach to predicting MDD and GAD, ensuring robust and comprehensive findings. This endeavor bridges the gap between cutting-edge ML techniques and the pressing need for early, precise prediction of psychiatric conditions, heralding timely interventions and enhanced patient outcomes.
While ML models like Random Forest and XGBoost have demonstrated effectiveness in predicting depression and anxiety [8-15], their reliability, especially when interpreting subjective survey responses, remains a concern. Subjective data might be susceptible to biases or errors [16], and the robustness of these models in such contexts remains underexplored.
Our primary objective is to scrutinize the stability of the four ML algorithms in predicting MDD and GAD using the comprehensive University of Nice Sophia-Antipolis (UNSA) dataset [17]. We will assess their performance under various scenarios of subjective response errors, such as memory recall biases, subjective interpretation, and health related biases. By evaluating their resilience to such noisy inputs, we aim to discern the more reliable algorithm for mental health prediction tasks involving subjective data.
The insights gained from this research will illuminate the practicality and robustness of ML models in mental health prediction. Furthermore, our findings have the potential to catalyze refinements in early detection and intervention strategies for MDD and GAD, ultimately contributing to better mental health outcomes for individuals and the broader community.
Methods
Participants
The participants in this cross-sectional study consisted of 4,184 undergraduate students from the UNSA [17]. Conducted between September 2012 and June 2013, the study included students from diverse faculties, such as sciences, humanities, medicine, law, sports science, engineering, and business. To be part of the study, participants underwent a mandatory medical examination at the university medical service (UMS), with the exception of those summoned for specific reasons like disability management or psychological support. The de-identified dataset, publicly available on Dryad, adhered to strict privacy protocols and was considered observational, obviating the need for written informed consent in accordance with non-interventional clinical research regulations in France. Of the participants, 57.4% identified as female, while 42.6% identified as male, with their ages grouped into four categories: less than 18, 18, 19, and 20 or older, representing 5%, 36%, 28%, and 31%, respectively. The prevalence rates of MDD and GAD were found to be 12% and 8%, respectively.
Measures
To streamline data collection, the CALCIUM software program, developed by the University of Lorraine (France), facilitated easy data entry and provided standardized metrics. The questionnaire collected demographic details, socioeconomic status, career objectives, and awareness of future opportunities.
Biometric variables, including heart rate, blood pressure, BMI, and visual acuity, were carefully measured and recorded following established guidelines. The study also investigated psychiatric symptoms, focusing on depressive disorder, anxiety disorder, and panic attacks, using a screening process based on clinical experience and DSM-IV criteria.
Lifestyle factors like alcohol consumption, tobacco use, recreational drug usage, and dietary habits were analyzed, with a particular focus on unhealthy dietary behaviors such as irregular meal patterns and unbalanced diets. The comprehensive data collection aimed to understand the intricate relationship between these diverse factors and the overall well-being of undergraduate university students, making it a valuable resource for gaining further insights into their health and mental wellness.
Psychiatric diagnoses
The investigation into psychiatric diagnoses involved a comprehensive assessment of mental health conditions among undergraduate university students. To determine the prevalence of these conditions, a multi-stage process was implemented. Initially, a screening questionnaire was administered, focusing on four key symptoms of MDD and GAD. For MDD, these symptoms encompassed feelings of sadness or irritability, anhedonia, changes in activity levels, and fatigue or loss of energy. Similarly, the screening for GAD emphasized excessive anxiety and worry, restlessness, fatigue, and irritability. Subsequently, students with positive indications for either MDD or GAD underwent further evaluation to ascertain a complete diagnosis based on the Diagnostic and Statistical Manual of Mental Disorders (DSM-IV) criteria. Qualified medical providers conducted these assessments to ensure accuracy and comprehensiveness. The diagnoses were not viewed in strict binary terms, but rather as dimensional constructs, considering the likelihood of having the disorder based on the presence of at least two associated symptoms. Notably, "anhedonia" and "excessive anxiety and worry" served as core features for depression and anxiety, respectively. Additionally, for the diagnosis of panic attacks, students who reported experiencing at least one panic attack in the past year underwent a rigorous evaluation, requiring the presence of four or more specified symptoms. This thorough examination provided valuable insights into the prevalence and impact of MDD, GAD, and panic attacks among the undergraduate student population, informing the development of targeted interventions and support services tailored to their specific needs.
Data with unreliability
Survey-based research is a powerful tool for understanding complex phenomena, but ensuring the reliability of responses is paramount, especially when predicting significant outcomes like mental health conditions. In our study, we specifically considered 17 features from the UNSA dataset that are identified as survey-related and could be susceptible to biases. Various factors, as documented in the literature, can compromise the reliability of these responses.
Memory Recall Biases: Features that require respondents to recall past behaviors or habits are particularly susceptible to memory recall biases. These features include "Long commute," "Irregular rhythm of meals," "Physical activity (3 levels)," "Physical activity (2 levels)," "Cigarette smoker (5 levels)," "Cigarette smoker (3 levels)," "Drinker (3 levels)," and "Drinker (2 levels)." Schwarz et al [18] emphasized that respondents often rely on their memory to reproduce previous answers, which can introduce inaccuracies. Borland, Partos, and Cummings [19] further highlighted the susceptibility of certain events to recall biases based on their salience.
Subjective Interpretation: Some features are open to personal perceptions and subjective interpretations, which can vary among respondents. These include "Difficulty memorizing lessons," "Satisfied with living conditions," "Financial difficulties," "Unbalanced meals," "Eating junk food," "Irregular rhythm or unbalanced meals," and "Parental home." For instance, perceptions of "satisfying" living conditions can differ widely among individuals. Additionally, familiarity bias, where respondents gravitate towards familiar options, can influence responses, especially in habitual behaviors, as documented by research on product identification [20].
Health-Related Biases: Features related to health and lifestyle, such as "Prehypertension or hypertension," "Binge drinking," and "Marijuana use," can be influenced by social desirability bias. This bias arises when participants present answers that are more socially acceptable than their true behaviors or opinions, especially in health-related contexts [21]. For instance, respondents might underreport substance use due to societal stigmas.
Given these potential biases, it's essential to approach the interpretation of data from these features with caution. Enhancing the reliability and validity of survey data requires strategies like refining survey instructions, minimizing ambiguous questions, and cross-validating self-reported data with objective measures. By proactively addressing these biases, we can offer more credible insights into the intricate relationship between lifestyle factors and mental health outcomes.
Data preprocessing
In this study, missing data were imputed using mean values, and categorical columns were transformed into numerical data using Label Encoding. To create biased datasets, a selected probability of 0.2 was applied to randomly choose students for each of the 17 features considered unreliable. The inputs of the selected students were then converted to exclusive inputs, introducing bias into the dataset. The creation of the biased dataset aimed to explore the impact of unreliable features on predictive models and investigate the robustness of the algorithms in the presence of biased data.
Data analysis
Firstly, the data was divided into 70% for training (N = 2929) and 30% for held-out testing (N = 1255), ensuring that the held-out test set remained unseen during model training and was excluded from hyperparameter tuning. The machine learning pipeline encompassed four distinct classifiers: XGBoost, Random Forest, Logistic Regression, and Naïve Bayesian, with each model using unbalanced class weights.
To gauge the predictive performance of the models, multiple metrics were employed, including the AUROC score, prediction accuracy, F1 weighted scores, Cohen's kappa score, negative precision, and positive precision. The AUROC score signifies the area under the receiver operating characteristic curve, providing insights into the models' sensitivity and specificity optimization. Utilizing a fivefold validation technique, prediction accuracy and F1 weighted scores were calculated. Additionally, Cohen's kappa score evaluated inter-rater reliability for categorical items, while negative and positive precisions gauged the models' ability to detect cases with and without depression symptoms, respectively. These assessments were performed for both GAD and MDD outcomes, encompassing both the original dataset and the dataset with introduced random bias.
Furthermore, SHAP (Shapley Additive Explanations) scores were utilized to visualize and ascertain feature importance within the original data. This comprehensive analysis aimed to enhancing the understanding of the models' predictive performance and robustness under various conditions, providing valuable insights into their effectiveness and applicability for mental health prediction tasks.
Results
Predictive performance for the original dataset
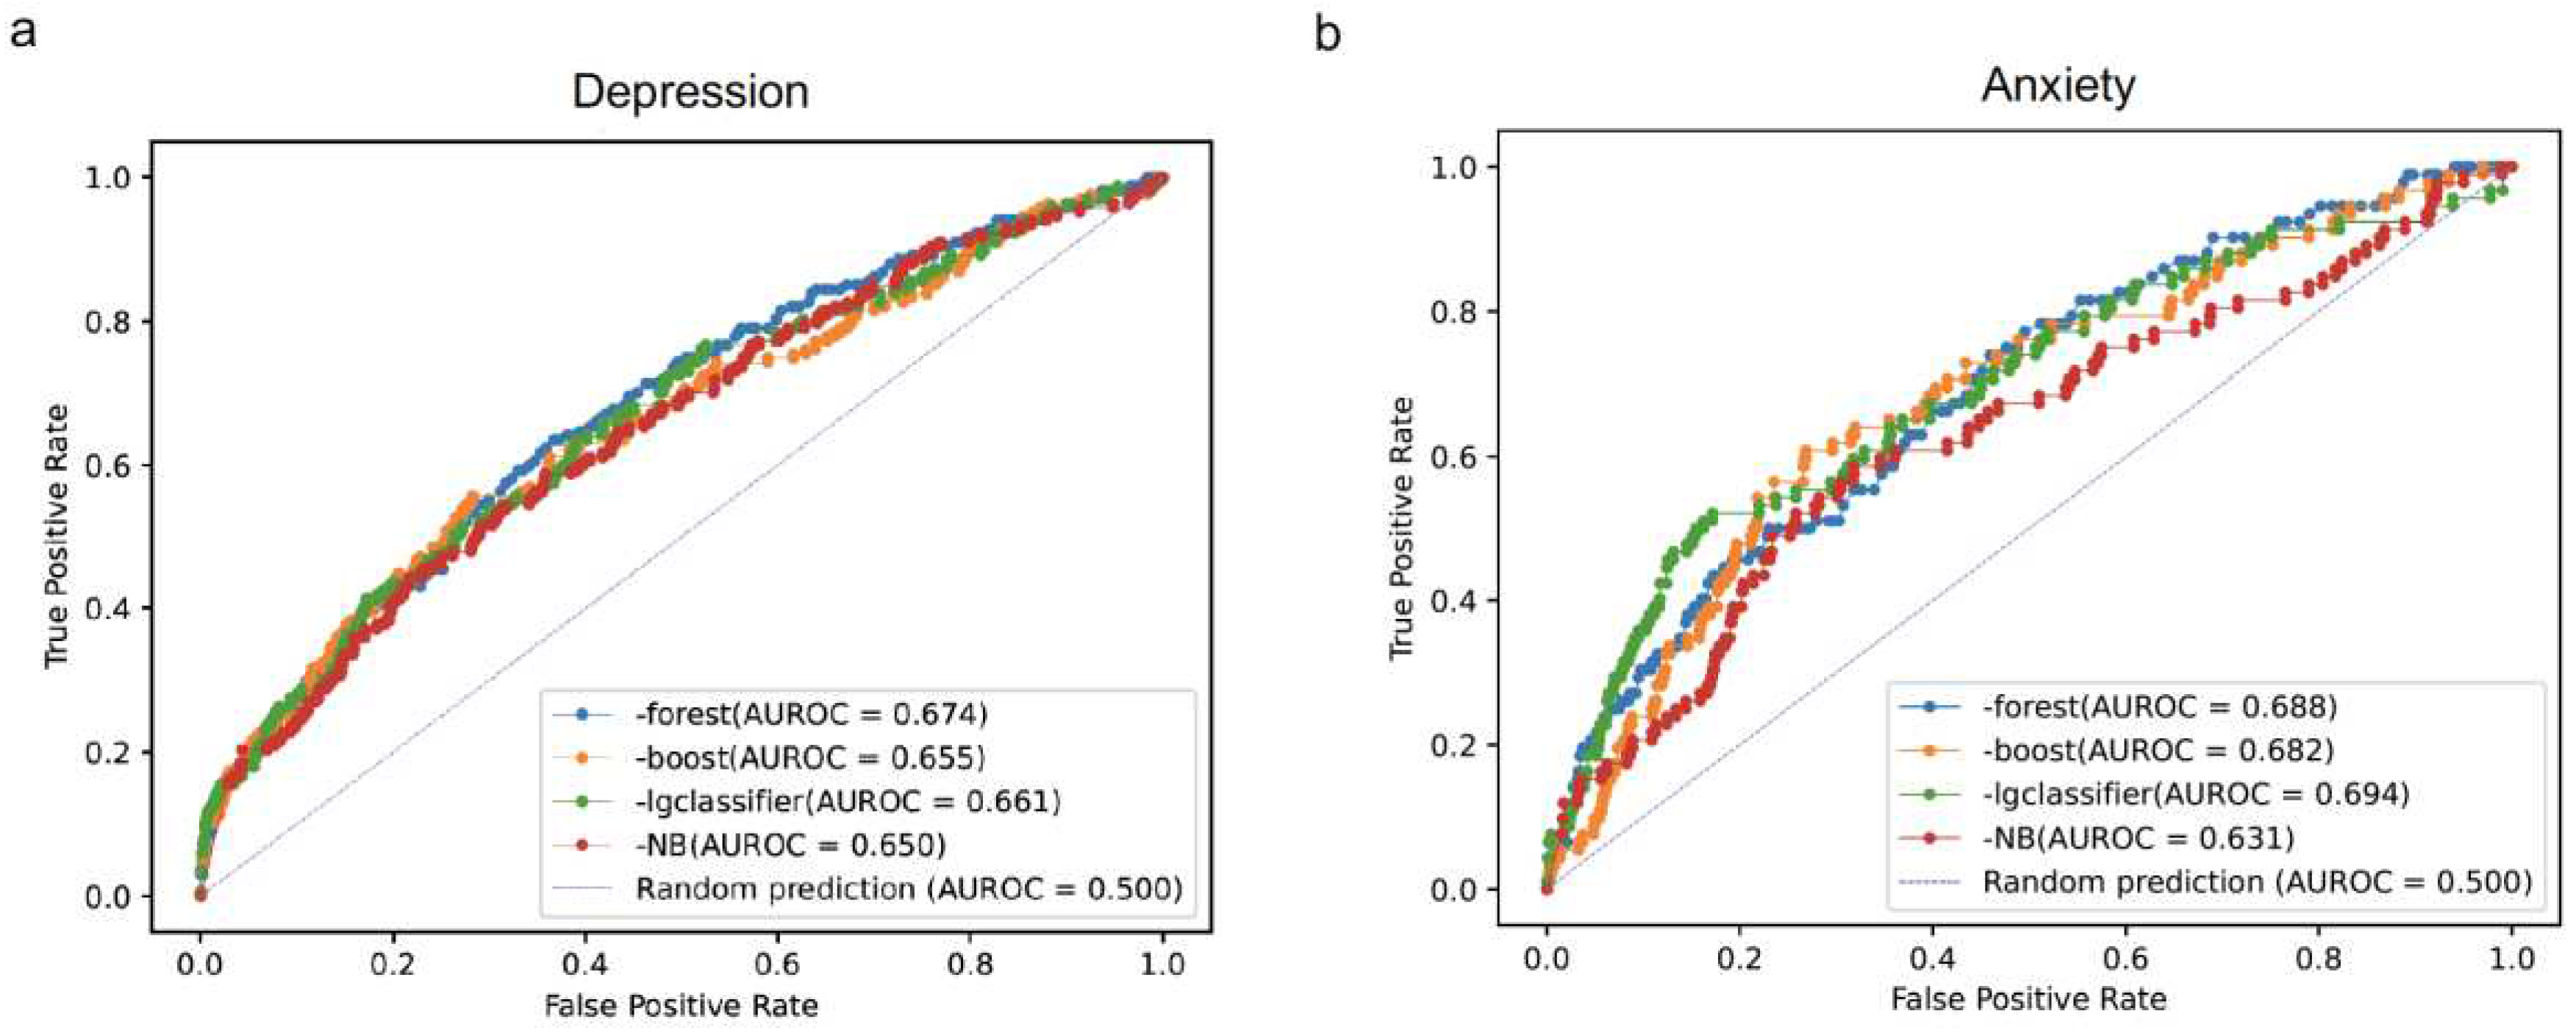
We implemented four ML models, namely random forest, XGBoost, linear regression, and Naïve Bayesian, to predict MDD and GAD using the survey data without introducing any random errors. The AUROC values for MDD were 0.674, 0.655, 0.661, and 0.650 for random forest, XGBoost, linear regression, and Naïve Bayesian, respectively (
Figure 1a). For GAD, the AUROC values were 0.688, 0.682 for, 0.694, and 0.631 for random forest, XGBoost, linear regression, and Naïve Bayesian, respectively (
Figure 1b).
Overall, random forest, XGBoost, and linear regression showed comparable AUROC values for both GAD and MDD. However, random forest and XGBoost outperformed the other models in additional metrics, including accuracy, F1-score, and negative prediction, for both MDD (see
Table 1) and GAD (see
Table 2). These results align with previous findings, particularly highlighting random forest’s higher positive precision scores (0.692 for MDD in
Table 1 and 1.000 for GAD in
Table 2) compared to XGboost (0.257 for MDD in
Table 1 and 0.156 for GAD in
Table 2) and the other methods.
The results suggest that random forest provides more accurate predictions for MDD and GAD but may have a higher false-negative rate, as indicated by the similar F1 scores compared to other methods. This finding highlights the trade-off between sensitivity and specificity in model performance, making random forest a potentially valuable choice for mental health prediction tasks, especially when prioritizing higher accuracy.
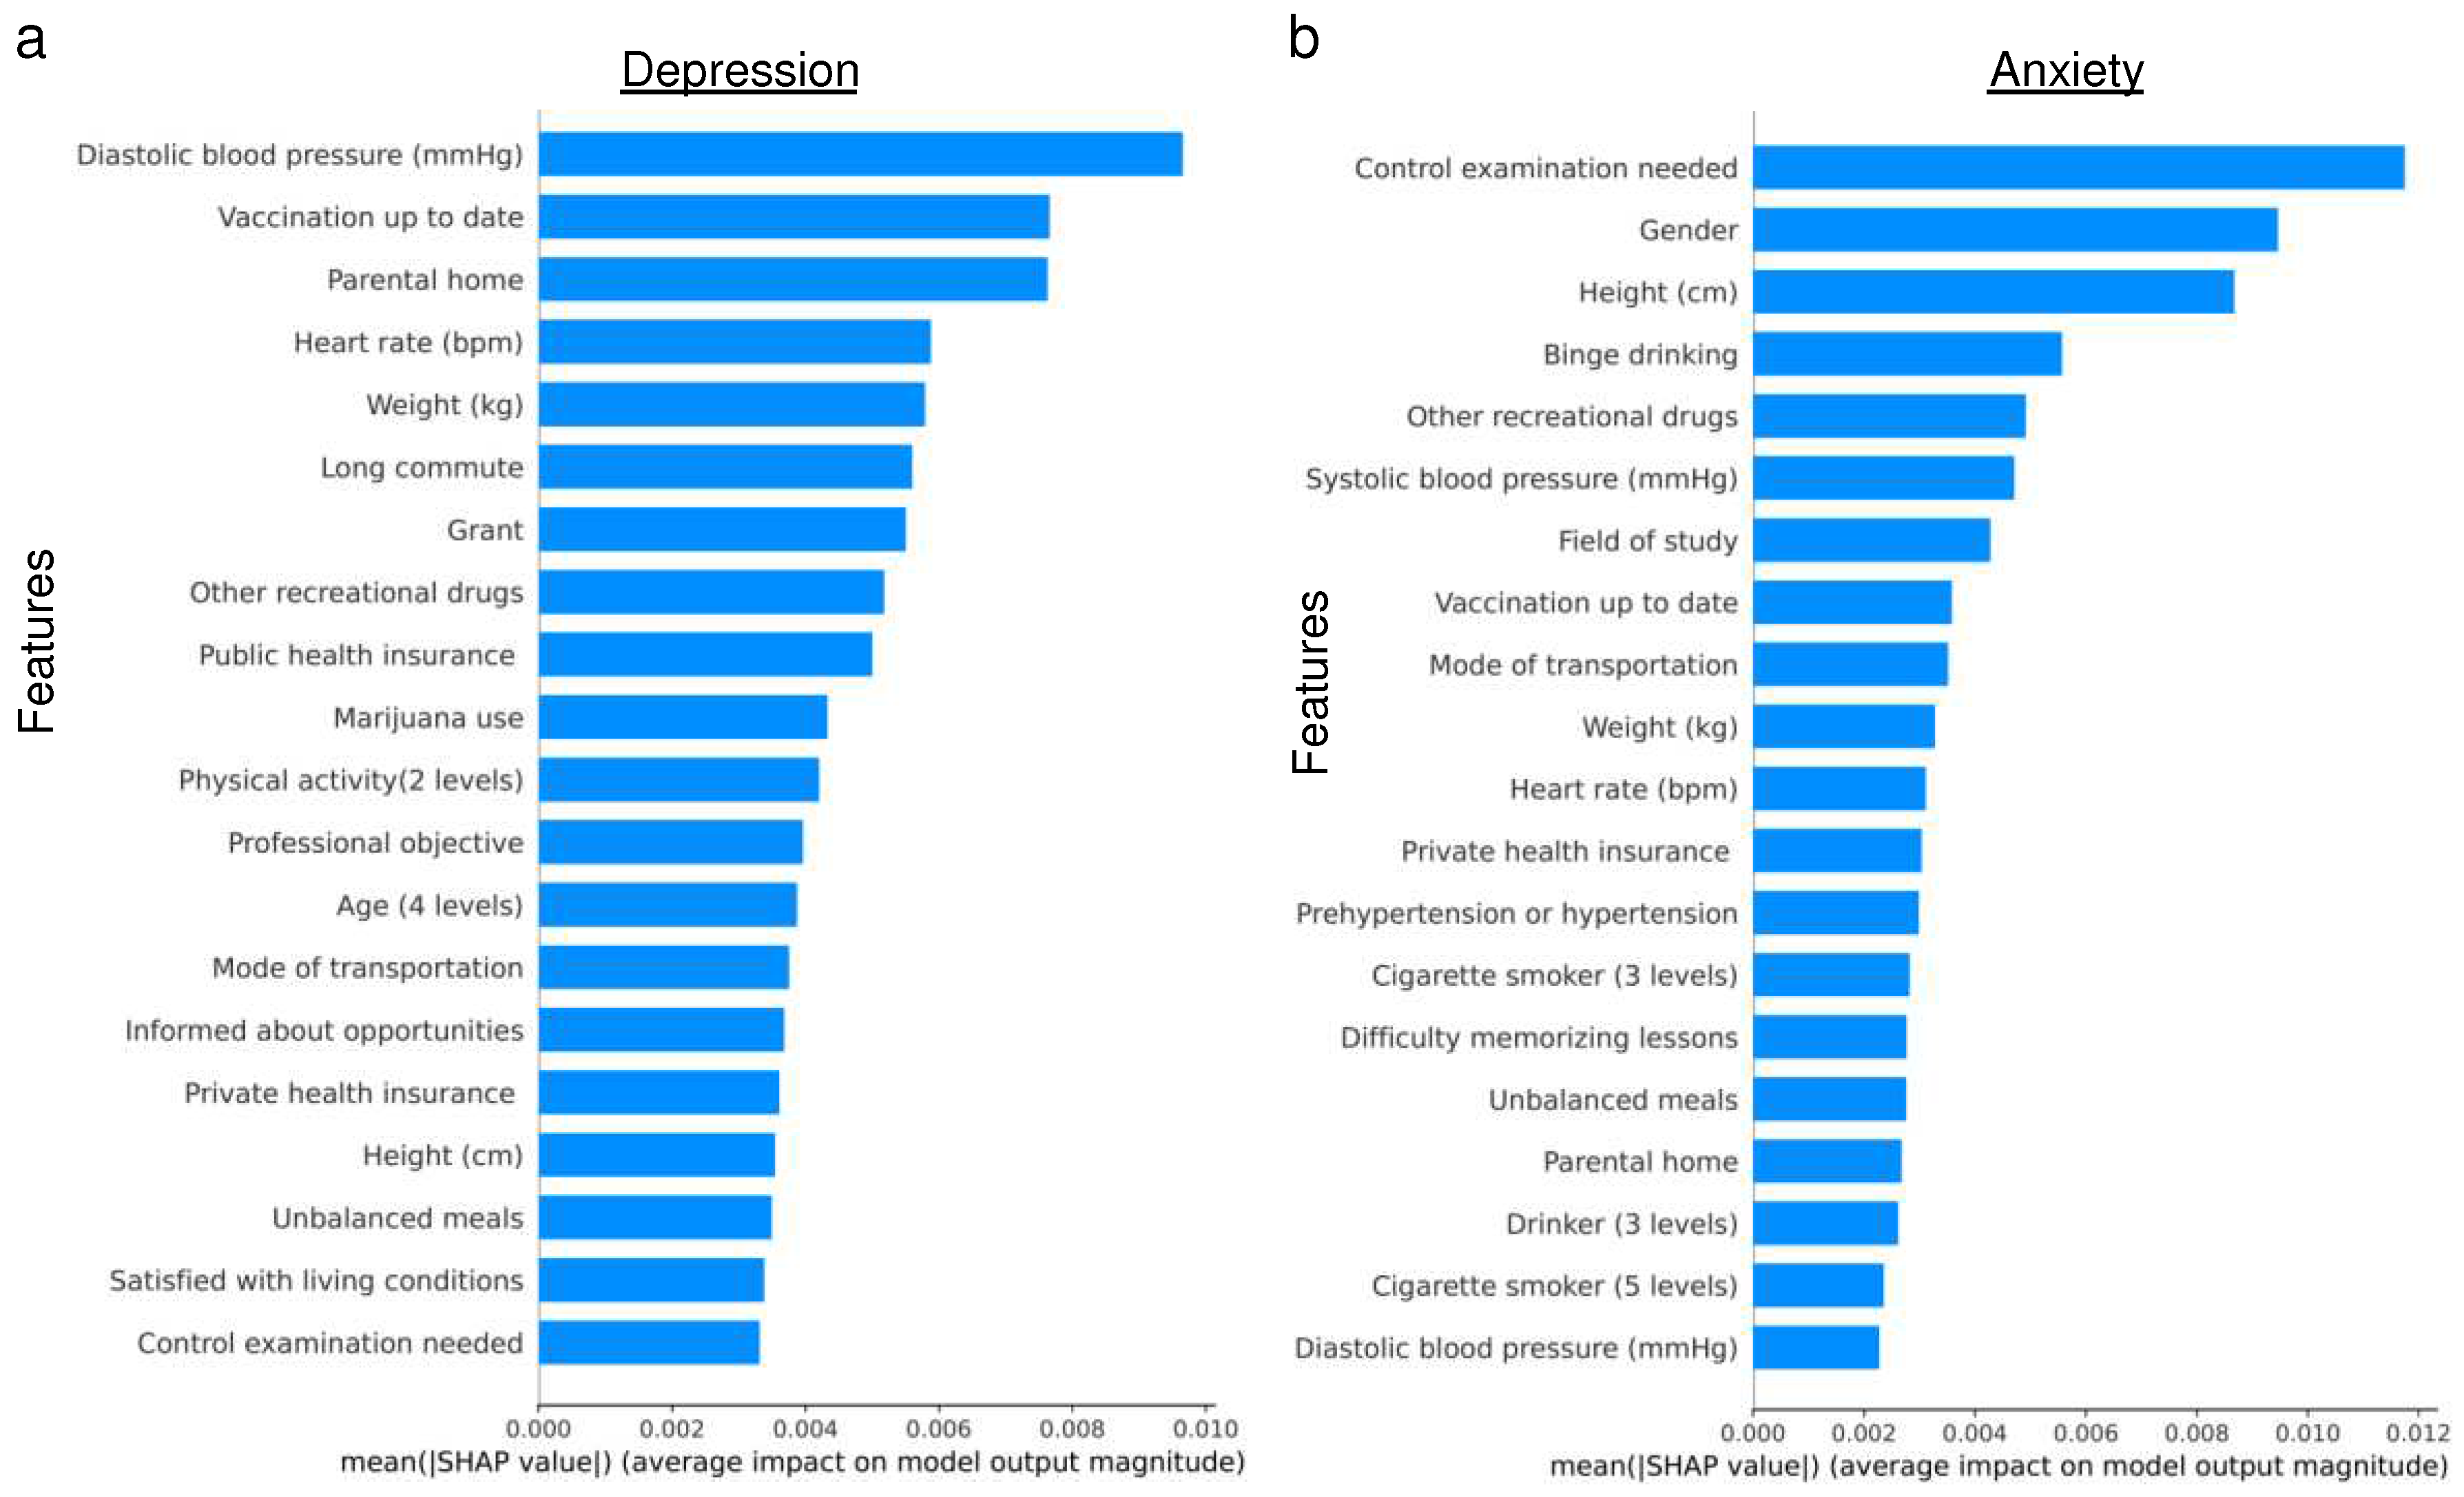
Next, we assessed the feature importance for predicting MDD and GAD using the random forest model (see
Figure 2). Notably, there were no common features among the top five ranked for both conditions. For MDD, the top three ranked features were diastolic blood pressure, up-to-date vaccination status, and parental home. In contrast, the need for a control examination, gender, and height emerged as the top three for GAD. These distinctions are consistent with findings from previous studies, underscoring the unique characteristics associated with each disorder.
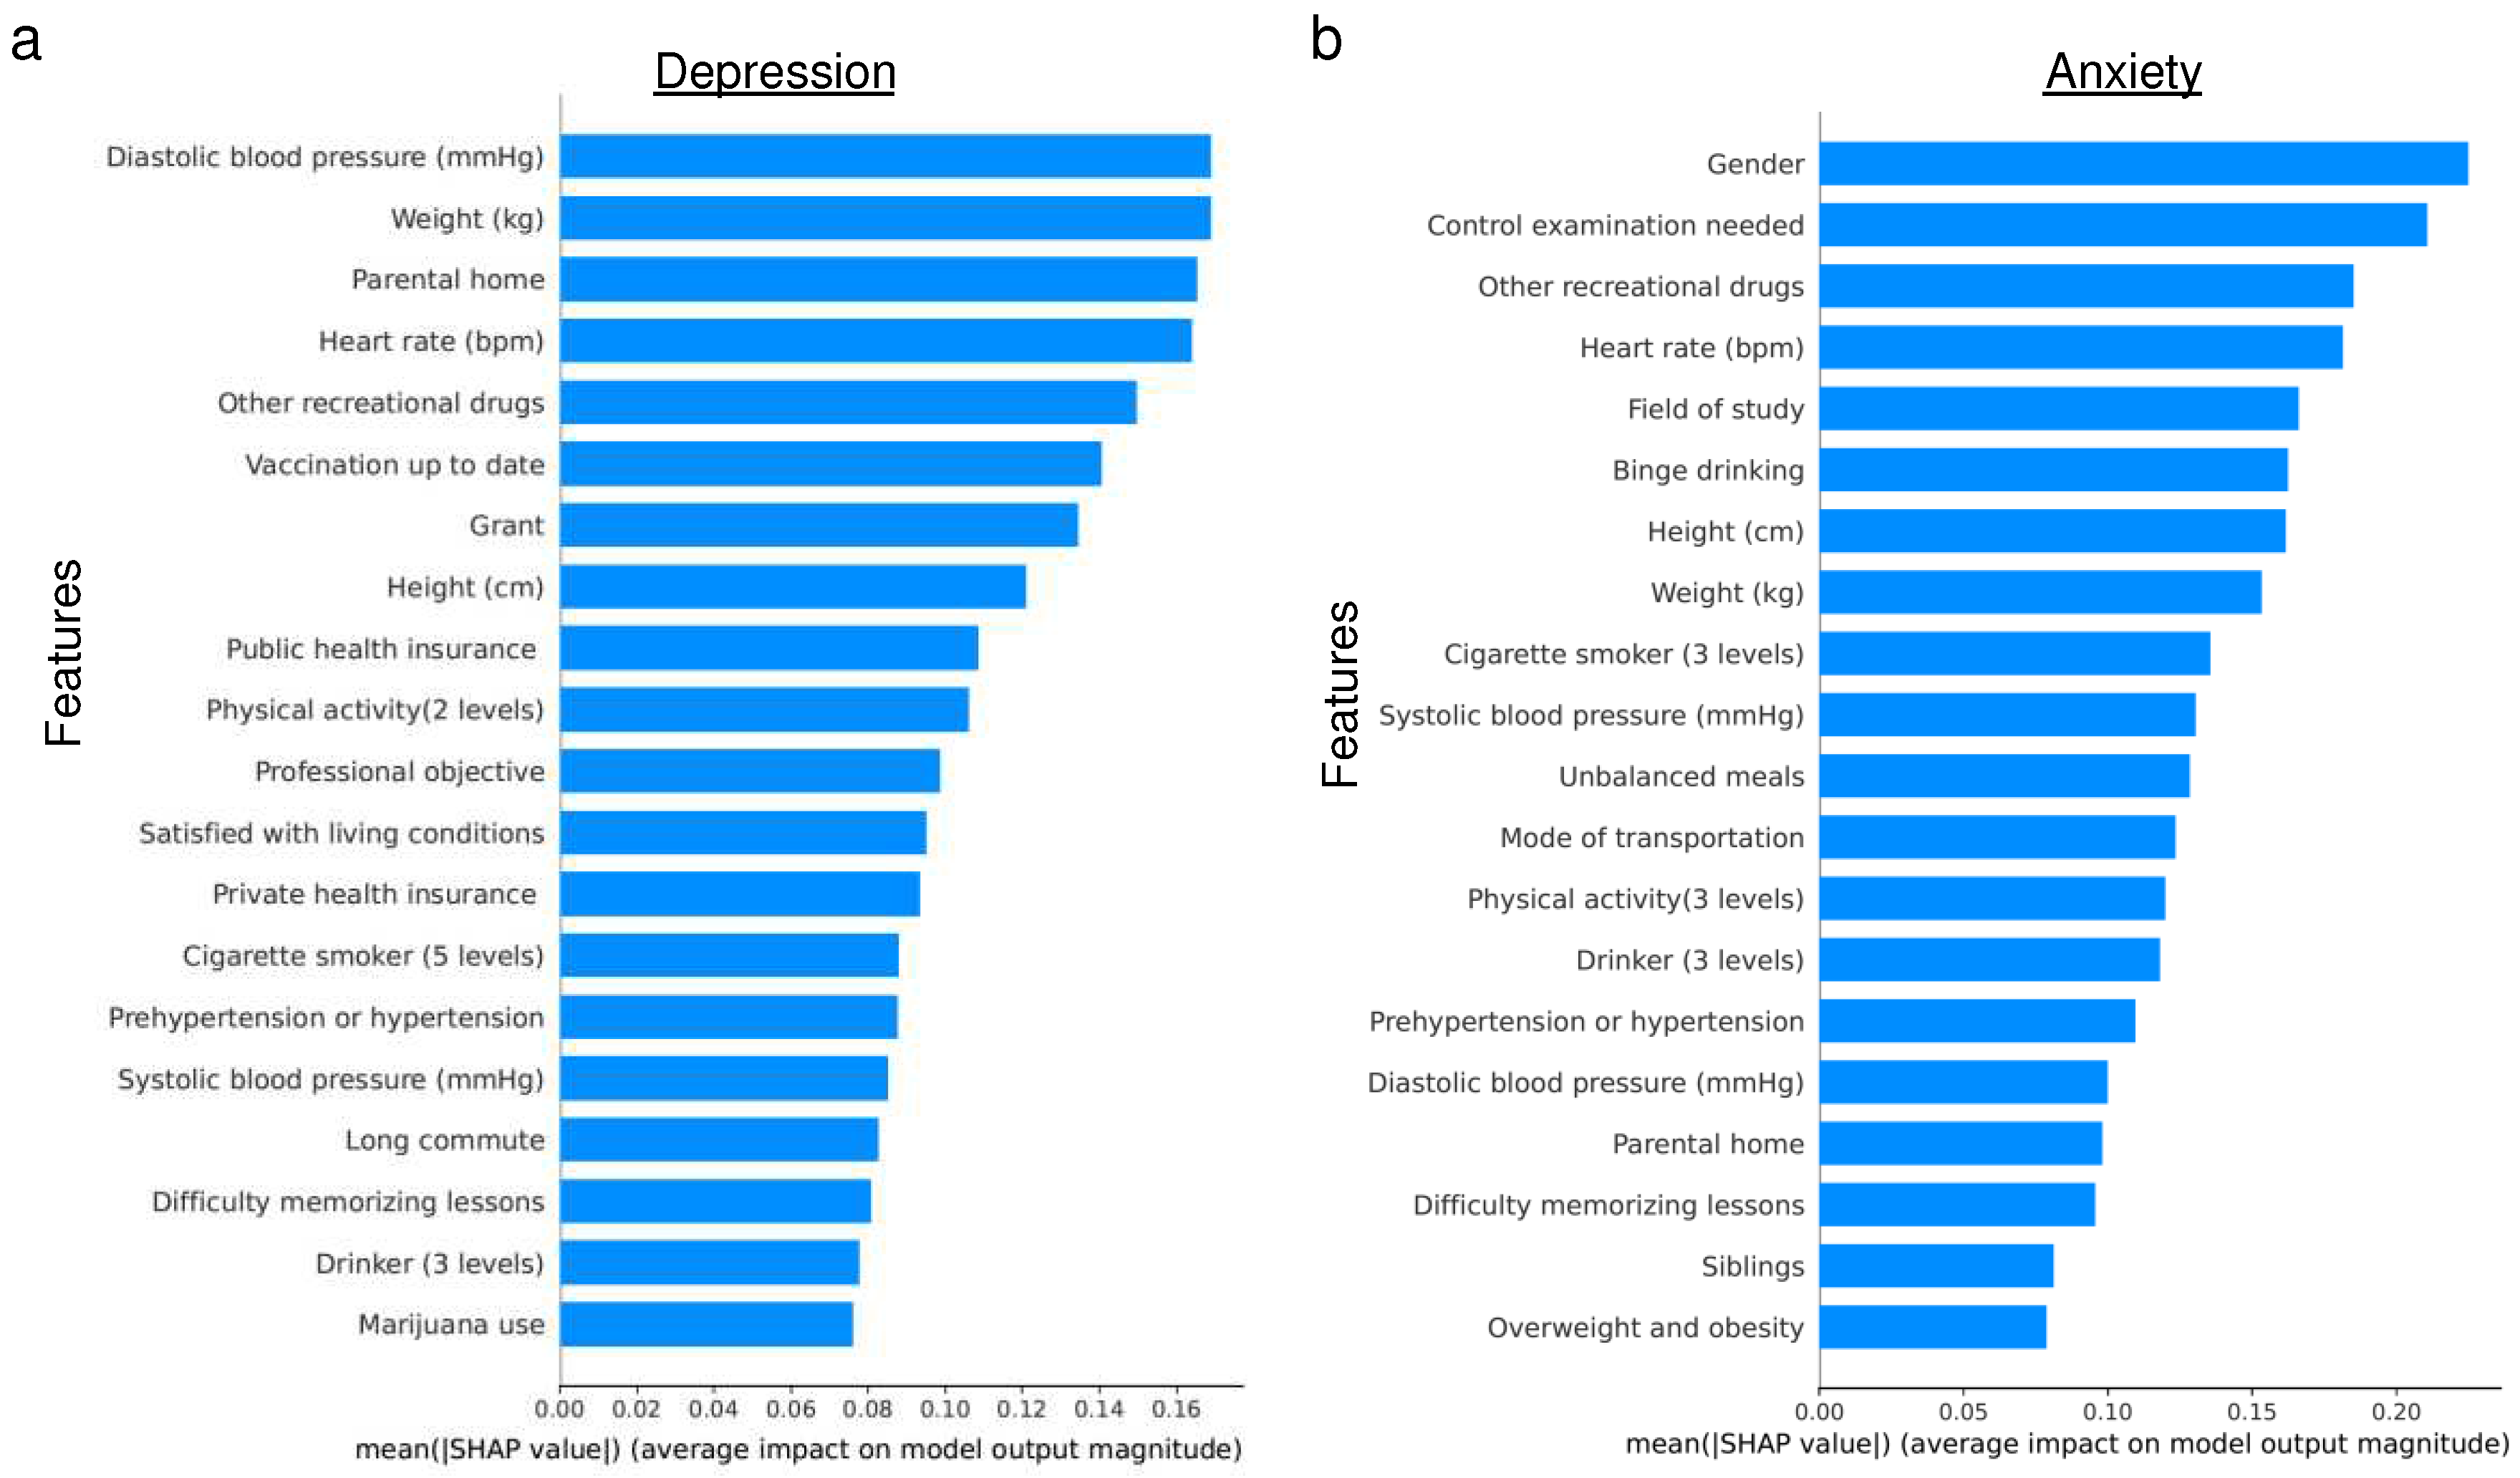
Similarly, when evaluating feature importance for predicting MDD and GAD using XGBoost (see
Figure 3), a contrast was observed compared to the random forest results. Specifically, features such as other recreational drugs and heart rate were shared among the top five ranked features for both MDD and GAD. For MDD, diastolic blood pressure, up-to-date vaccination status, and parental home were of relatively higher importance. In contrast, the need for a control examination, gender, and field of study were more pivotal for GAD prediction. This variation in feature importance between MDD and GAD aligns with the findings from the random forest model.
The table presents the performance metrics of these models on the original dataset without any added random errors. The metrics include accuracy, F1-score, Cohen Kappa score and precision, providing a comprehensive assessment of the models’ predictive capabilities for depression.
The table presents the performance metrics of these models on the original dataset without any added random errors. The metrics include accuracy, F1-score, Cohen Kappa score and precision, providing a comprehensive assessment of the models’ predictive capabilities for anxiety.
Discussion
In recent years, ML methods have gained significant popularity in the field of mental health prediction. However, few studies have evaluated the performance of these ML methods to ensure their reliability and clinical applicability. In this study, we conducted a comprehensive analysis to predict MDD and GAD among undergraduate university students using ML models. The dataset consisted of self-reported survey data from students, covering various socio-demographic characteristics, health-related information, and lifestyle behaviors. We evaluated the reliability of ML methods by comparing the performance of models run on the original data with that of simulated data with added biases.
We explored four different ML classifiers - random forest, XGBoost, linear regression, and Naïve Bayesian - to predict MDD and GAD. The models were initially trained on the original dataset without any added random errors, and we evaluated their performance using various metrics, including AUROC, accuracy, F1-score, Cohen's kappa score, and precision.
The results from the models trained on the original data showed that random forest, XGBoost, and linear regression exhibited similar performance in terms of AUROC for both MDD and GAD. However, random forest and XGBoost outperformed the other models in additional metrics such as accuracy, F1-score, and negative precision. Notably, random forest demonstrated higher positive precision, indicating its ability to accurately predict cases with depression and anxiety.
We further explored the feature importance using SHAP scores for the random forest model and the XGBoost model. The top-ranked physiological features for both MDD and GAD included weight, height, heart rate, and blood pressure, indicating their importance in predicting mental health outcomes. This finding is consistent with existing literature [22]. Additionally, certain environmental features such as parental home emerged as relatively important for predicting MDD and GAD, reflecting potential associations between these factors and mental health conditions. This may be attributed to the influence of the childhood home environment, which is recognized as an important factor in youth mental health [23,24].
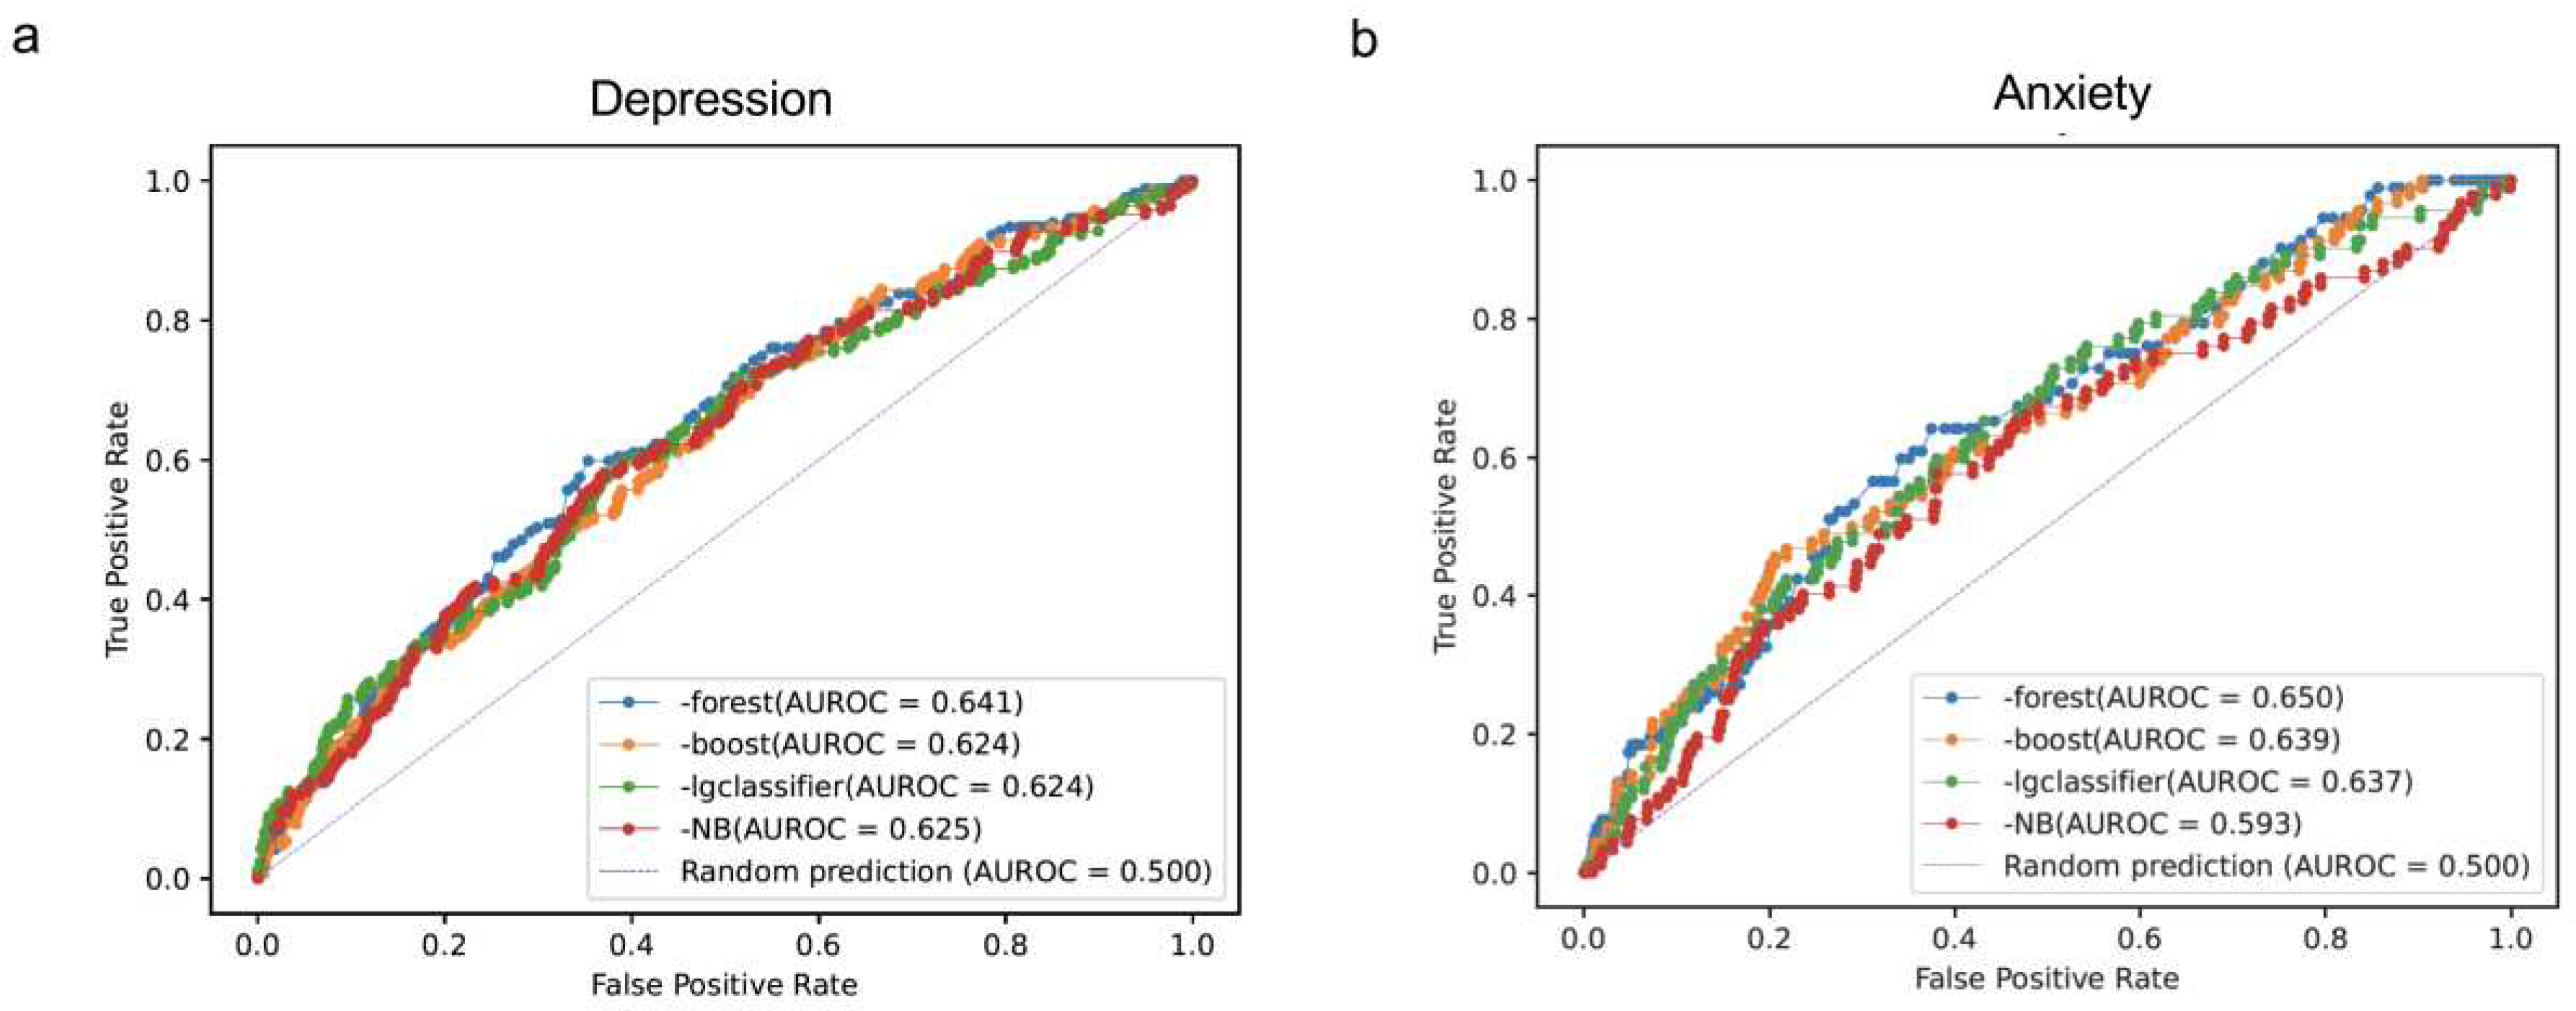
To assess the models' robustness, we introduced random errors into the data for 17 features that were considered susceptible to bias. The performance of all models declined compared to the original data, with lower AUROC values observed. However, XGBoost exhibited better overall performance than random forest and other models in metrics like accuracy, F1-score, and negative precision, even after the introduction of random errors.
Overall, our study highlights the potential of ML models in predicting depression and anxiety among university students based on self-reported survey data. Random forest and XGboost proved to be particularly effective in handling these prediction tasks. However, further research is needed to understand the underlying factors contributing to these mental health conditions and to explore the generalizability of the models to larger and more diverse populations. Additionally, efforts to mitigate biases and enhance data reliability should be considered to improve the models' accuracy and applicability in real-world mental health prediction settings.
Conclusions
In this study, we leveraged ML models to predict MDD and GAD among university students based on self-reported survey data. Our results demonstrate the potential of machine learning, with XGBoost showing robust performance, even in the presence of simulated data errors. While this work represents a significant step toward effective mental health prediction, further research is needed to delve into underlying factors and the generalizability of our models to diverse populations.
References
- Zhou, Y.; Cao, Z.; Yang, M.; Xi, X.; Guo, Y.; Fang, M.; Cheng, L.; Du, Y. Comorbid generalized anxiety disorder and its association with quality of life in patients with major depressive disorder. Sci Rep 2017, 7, 40511. [Google Scholar] [CrossRef] [PubMed]
- Margoni, M.; Preziosa, P.; Rocca, M.A.; Filippi, M. Depressive symptoms, anxiety and cognitive impairment: emerging evidence in multiple sclerosis. Transl Psychiatry 2023, 13, 264. [Google Scholar] [CrossRef]
- Kraus, C.; Kadriu, B.; Lanzenberger, R.; Zarate, C.A.; Kasper, S. Prognosis and Improved Outcomes in Major Depression: A Review. Focus (Am Psychiatr Publ) 2020, 18, 220–235. [Google Scholar] [CrossRef] [PubMed]
- Hong, W.; Zhou, X.; Jin, S.; Lu, Y.; Pan, J.; Lin, Q.; Yang, S.; Xu, T.; Basharat, Z.; Zippi, M.; et al. A Comparison of XGBoost, Random Forest, and Nomograph for the Prediction of Disease Severity in Patients With COVID-19 Pneumonia: Implications of Cytokine and Immune Cell Profile. Front Cell Infect Microbiol 2022, 12, 819267. [Google Scholar] [CrossRef] [PubMed]
- Sun, D.; Xu, J.; Wen, H.; Wang, D. Assessment of landslide susceptibility mapping based on Bayesian hyperparameter optimization: A comparison between logistic regression and random forest. Engineering Geology 2021, 281, 105972. [Google Scholar] [CrossRef]
- Ulinnuha, N., H. Sa’dyah, and M. Rahardjo. A Study of Academic Performance using Random Forest , Artificial Neural Network , Naïve Bayesian and Logistic Regression. 2012.
- Liu, L.; Qiao, C.; Zha, J.R.; Qin, H.; Wang, X.R.; Zhang, X.Y.; Wang, Y.O.; Yang, X.M.; Zhang, S.L.; Qin, J. Early prediction of clinical scores for left ventricular reverse remodeling using extreme gradient random forest, boosting, and logistic regression algorithm representations. Front Cardiovasc Med 2022, 9, 864312. [Google Scholar] [CrossRef] [PubMed]
- Xin, Y.; Ren, X. Predicting depression among rural and urban disabled elderly in China using a random forest classifier. BMC Psychiatry 2022, 22, 118. [Google Scholar] [CrossRef] [PubMed]
- Antoniadi, A.M.; Galvin, M.; Heverin, M.; Hardiman, O.; Mooney, C. Prediction of caregiver burden in amyotrophic lateral sclerosis: a machine learning approach using random forests applied to a cohort study. BMJ Open 2020, 10, e033109. [Google Scholar] [CrossRef] [PubMed]
- Priya, A.; Garg, S.; Tigga, N.P. Predicting Anxiety, Depression and Stress in Modern Life using Machine Learning Algorithms. Procedia Computer Science 2020, 167, 1258–1267. [Google Scholar] [CrossRef]
- Haque, U.M.; Kabir, E.; Khanam, R. Detection of child depression using machine learning methods. PLoS One 2021, 16, e0261131. [Google Scholar] [CrossRef] [PubMed]
- Zhou, Z.; Luo, D.; Yang, B.X.; Liu, Z. Machine Learning-Based Prediction Models for Depression Symptoms Among Chinese Healthcare Workers During the Early COVID-19 Outbreak in 2020: A Cross-Sectional Study. Front Psychiatry 2022, 13, 876995. [Google Scholar] [CrossRef] [PubMed]
- Sharma, A.; Verbeke, W.J.M.I. Improving Diagnosis of Depression With XGBOOST Machine Learning Model and a Large Biomarkers Dutch Dataset. Front Big Data 2020, 3, 15. [Google Scholar] [CrossRef] [PubMed]
- Ghosal, S.; Jain, A. Depression and Suicide Risk Detection on Social Media using fastText Embedding and XGBoost Classifier. Procedia Computer Science 2023, 218, 1631–1639. [Google Scholar] [CrossRef]
- Gomes, S.R.B.S.; von Schantz, M.; Leocadio-Miguel, M. Predicting depressive symptoms in middle-aged and elderly adults using sleep data and clinical health markers: A machine learning approach. Sleep Med 2023, 102, 123–131. [Google Scholar] [CrossRef] [PubMed]
- du Toit, C.; Tran, T.Q.B.; Deo, N.; Aryal, S.; Lip, S.; Sykes, R.; Manandhar, I.; Sionakidis, A.; Stevenson, L.; Pattnaik, H.; et al. Survey and Evaluation of Hypertension Machine Learning Research. J Am Heart Assoc 2023, 12, e027896. [Google Scholar] [CrossRef] [PubMed]
- Tran, A.; Tran, L.; Geghre, N.; Darmon, D.; Rampal, M.; Brandone, D.; Gozzo, J.M.; Haas, H.; Rebouillat-Savy, K.; Caci, H.; et al. Health assessment of French university students and risk factors associated with mental health disorders. PLoS One 2017, 12, e0188187. [Google Scholar] [CrossRef] [PubMed]
- Schwarz, H., M. Revilla, and W. Weber. Memory effects in repeated survey questions: Reviving the empirical investigation of the independent measurements assumption. in Survey Research Methods. 2020.
- Borland, R.; Partos, T.R.; Cummings, K.M. Recall bias does impact on retrospective reports of quit attempts: response to Messer and Pierce. Nicotine Tob Res 2013, 15, 754–755. [Google Scholar] [CrossRef]
- Visconti di Oleggio Castello, M.; Taylor, M.; Cavanagh, P.; Gobbini, M.I. Idiosyncratic, Retinotopic Bias in Face Identification Modulated by Familiarity. eNeuro 2018, 5. [Google Scholar] [CrossRef] [PubMed]
- Bispo Júnior, J.P. Social desirability bias in qualitative health research. Rev Saude Publica 2022, 56, 101. [Google Scholar] [CrossRef] [PubMed]
- Latvala A, Kuja-Halkola R, Rück C, D'Onofrio BM, Jernberg T, Almqvist C, Mataix-Cols D, Larsson H, Lichtenstein P. Association of Resting Heart Rate and Blood Pressure in Late Adolescence With Subsequent Mental Disorders: A Longitudinal Population Study of More Than 1 Million Men in Sweden. JAMA Psychiatry. 2016 Dec 1;73(12):1268-1275. [CrossRef]
- Gillespie ML, Rao U. Relationships between Depression and Executive Functioning in Adolescents: The Moderating Role of Unpredictable Home Environment. J Child Fam Stud. 2022 Sep;31(9):2518-2534. [CrossRef]
- Hannigan LJ, McAdams TA, Eley TC. Developmental change in the association between adolescent depressive symptoms and the home environment: results from a longitudinal, genetically informative investigation. J Child Psychol Psychiatry. 2017 Jul;58(7):787-797. [CrossRef]
|
Disclaimer/Publisher’s Note: The statements, opinions and data contained in all publications are solely those of the individual author(s) and contributor(s) and not of MDPI and/or the editor(s). MDPI and/or the editor(s) disclaim responsibility for any injury to people or property resulting from any ideas, methods, instructions or products referred to in the content. |
© 2023 by the authors. Licensee MDPI, Basel, Switzerland. This article is an open access article distributed under the terms and conditions of the Creative Commons Attribution (CC BY) license (http://creativecommons.org/licenses/by/4.0/).


