1. Introduction
Since the 1980s, prefabricated concrete structures have gained widespread adoption worldwide. As early as the 1970s, the United States began investigating prefabricated concrete structures, with the American Concrete Institute’s ACI 318-11 “
Building Code Requirements for Structural Concrete” and the “
PCI Design Manual” making significant contributions to the development of prestressed concrete. The European prefabricated concrete building industry boasts a long history that has shaped the industrialization of these structures and yielded a relatively comprehensive standard system. The latest research on the performance of prefabricated concrete structures is summarized and published in
“Code and Standard 2010”. Japan has rigorously explored the seismic performance of prefabricated structures and provided a comprehensive explanation of the standards for prefabricated concrete building systems spanning design, manufacturing, and construction. In September 2016, China’s General Office of the State Council issued the
“Guiding Opinions on Vigorously Developing assembled Buildings”, proposing that, within 10 years, prefabricated buildings should account for 30% of new constructions [
1,
2,
3,
4]. Numerous earthquake disaster investigations reveal that damages to prefabricated structural joints are the primary cause of building damage, significantly impacting seismic performance [
5,
6,
7,
8,
9]. Consequently, researchers worldwide have conducted extensive investigations on the joints of prefabricated concrete structures, encompassing steel bar anchorage connections, grouting sleeve connections, welding, and bolt connection [
10,
11,
12,
13].
Ketiyot [
14] introduced a novel T-section steel structure connection joint, incorporating an embedded T-section steel and an embedded steel plate welded to the precast beam. The study indicates an enhancement in the seismic resistance of this connection; however, there is a rapid degradation in stiffness and a bearing capacity lower than anticipated. Yuskel [
15] presented a post-cast concrete joint with a sleeve that includes a grouting slot in the upper portion of the column end, filled after the insertion of the steel bar into the assembled steel sleeve. The research suggests reduced damage and improved ductility of this joint compared to the cast-in-place joint, with a minor effect on the bearing capacity. Yang Hui [
16] devised a novel style of prestressed hybrid beam-column joint, employing the post-tensioned prestressed methodology for connecting the column and beam, casting the remainders of the joint in place. The research found that the ductility of the novel joint has improved, with minimal change in the bearing capacity. Loo and Yao [
17] designed 18 half-scale concrete frame joints, with testing results establishing that the post-cast integral beam-column joints’ strength, seismic performance, and ductility surpass those of the cast-in-site joints. Englekirk [
18] recommended a precast concrete frame joint featuring a ductile connector, with testing indicating commendable energy dissipation and recovery characteristics. Exploring the seismic performance of assembled steel-reinforced concrete beam-column joints, Li [
19] developed two groups of two full-scale joint specimens, providing evidence of exceptional ductility and seismic performance in both groups. Lai [
20] introduced a novel joint composed of a fan-shaped lead viscoelastic damper and an assembled concrete frame, with experimentation proving a solid energy dissipation effect, along with substantial improvements in the joint’s bearing capacity and displacement ductility. Gu [
21] suggested a new variety of hooked assembled concrete beam-column joint, with testing confirming excellent energy dissipation and ductility. Ji [
22] introduced a concrete-filled steel tubular column joint with only ring bars and no ring beams, showing that the hysteresis loop of the joint is quite full, and it possesses considerable energy consumption capacity and ductility. Miao [
23] suggested a novel connection using high-strength bolts to join the assembled beam and assembled column through the embedded steel section, with testing indicating that the seismic performance of the new assembly frame connection parallels that of the traditional cast-in-site joint.
Through the aforementioned research, it is evident that while the general performance of steel bar anchorage connection is enhanced, the quality assurance for concrete pouring is challenging. Grouting sleeve connection technology is comparatively mature, yet the quality of the sleeve connection requires verification, and while the welding bolt connection and installation process is convenient and time-efficient, it demands high precision. The prestressed connection greatly enhances the stiffness, strength, and restoring force of joints, but its energy dissipation capacity is poor. Consequently, this paper proposes a novel type of assembled concrete beam-column L-shaped reinforced connection joint that is convenient to construct and operate. This proposal addresses the deficiencies in current traditional buildings, providing a theoretical and experimental framework for its widespread application and usage.
2. Joint Structure
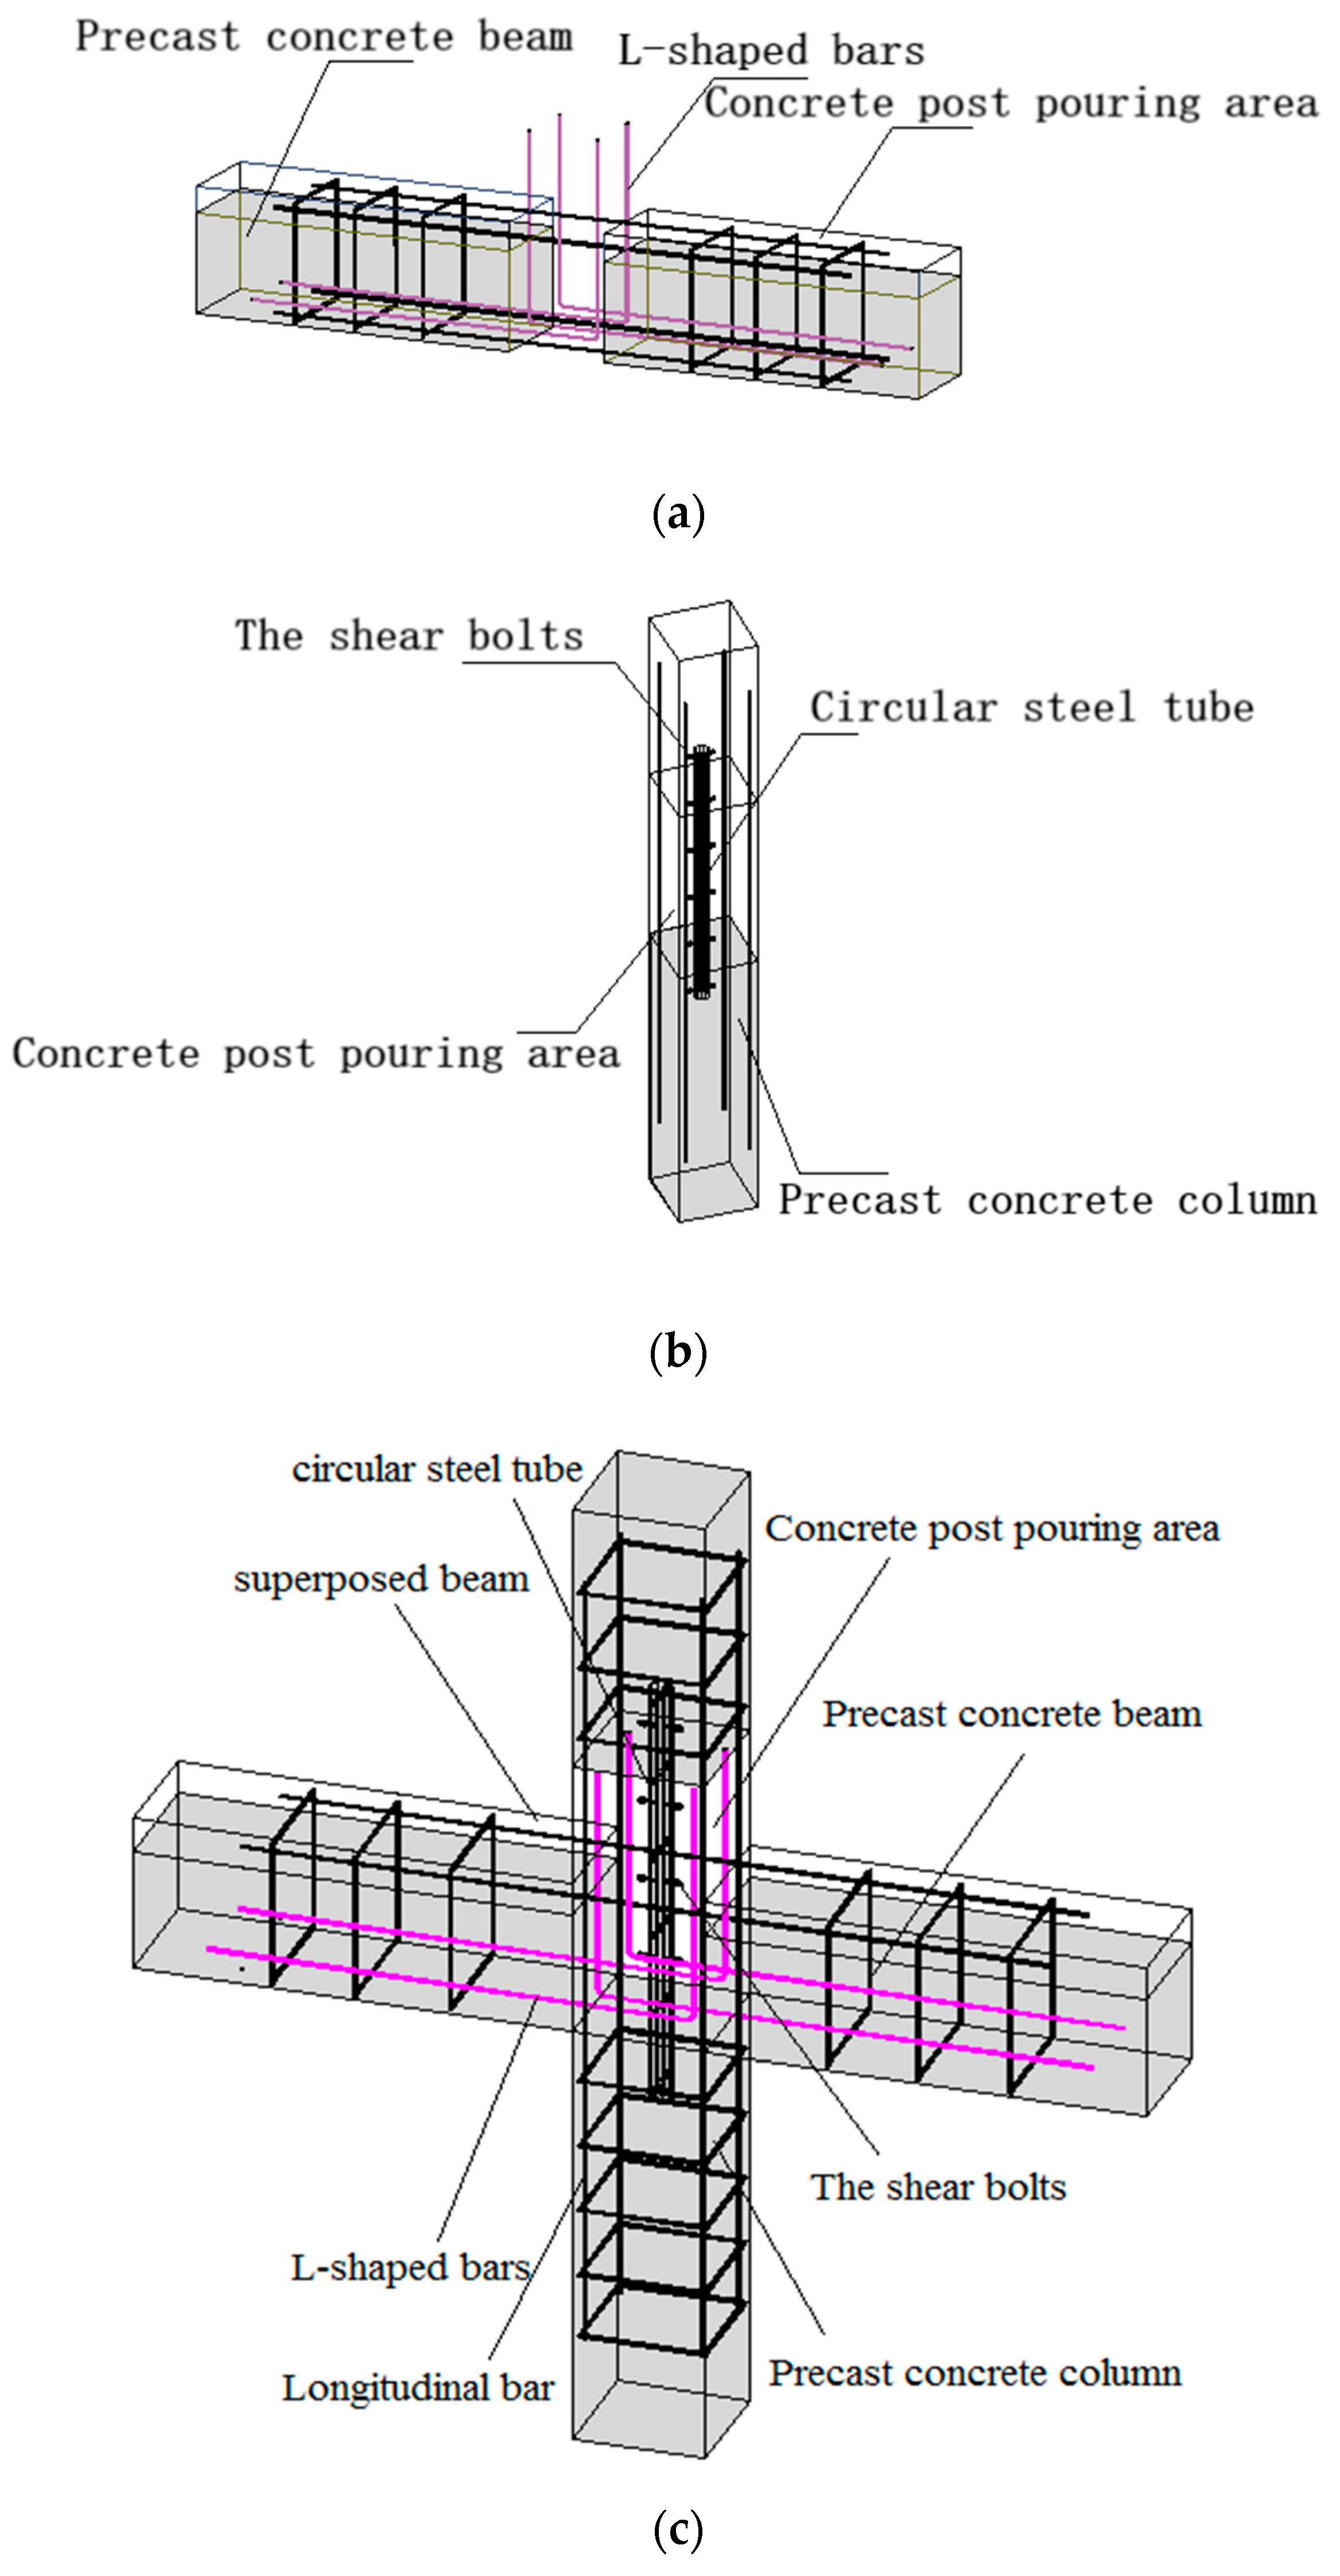
The L-shaped reinforced connection joints primarily connect beams and columns by pouring concrete into the post-cast section of the joints and the composite beam area. This process occurs after two precast beams with L-shaped tendons have been installed on the precast column and the designated position of the lower node area. The upper and lower parts of the precast concrete columns are fixed on the surface using round steel tubes with shear bolts, which serve to increase the bonding force between the concrete and round steel tubes. The new L-shaped reinforced joints are constructed by post-pouring in one piece and are poured twice. In contrast, the conventional construction method involves one-time pouring for precast beams and columns. The key difference lies in the separation of steel bars for beams and columns and the separate support for formwork. The longitudinal bars at the bottom of precast beams are bent upwards by 90 degrees. Stirrups are not initially bound in the core area of precast column nodes, with assembly taking place in the factory. After curing, the precast concrete beam will be installed at the designated position in the node area. U-shaped stirrups are then tied in the core area of the column node. Finally, secondary pouring is conducted in the post-pouring area of the concrete beam-column node and the cast-in-place area at the upper part of the composite beam, achieving a connection between the beams and columns. The joint boasts advantages such as simplicity, robust performance, impressive overall stiffness, easy quality assurance, and convenient transportation of precast components. The joint structure is depicted in
Figure 1.
3. Test
3.1. Specimen Design
Mid-column joints in the middle story, which more readily meet simulated boundary conditions, are selected as specimens. The dimensions of the beams and columns are determined according to the position of the bending point when the frame structure supports the horizontal load. Simultaneously, considering the actual range of the laboratory loading device, the design will adhere to a 1:2 scale.
To evaluate the seismic performance of the joint, five joint specimens were fabricated for the test, including one cast-in-site joint specimen XJ-1 and four newly assembled joint specimens ZP-1, ZP-2, ZP-3, and ZP-4. Except for the bending length of the L-bar, the concrete strength of the composite slab, and the post-cast concrete area, the other factors for the four assembled specimens are identical. As per
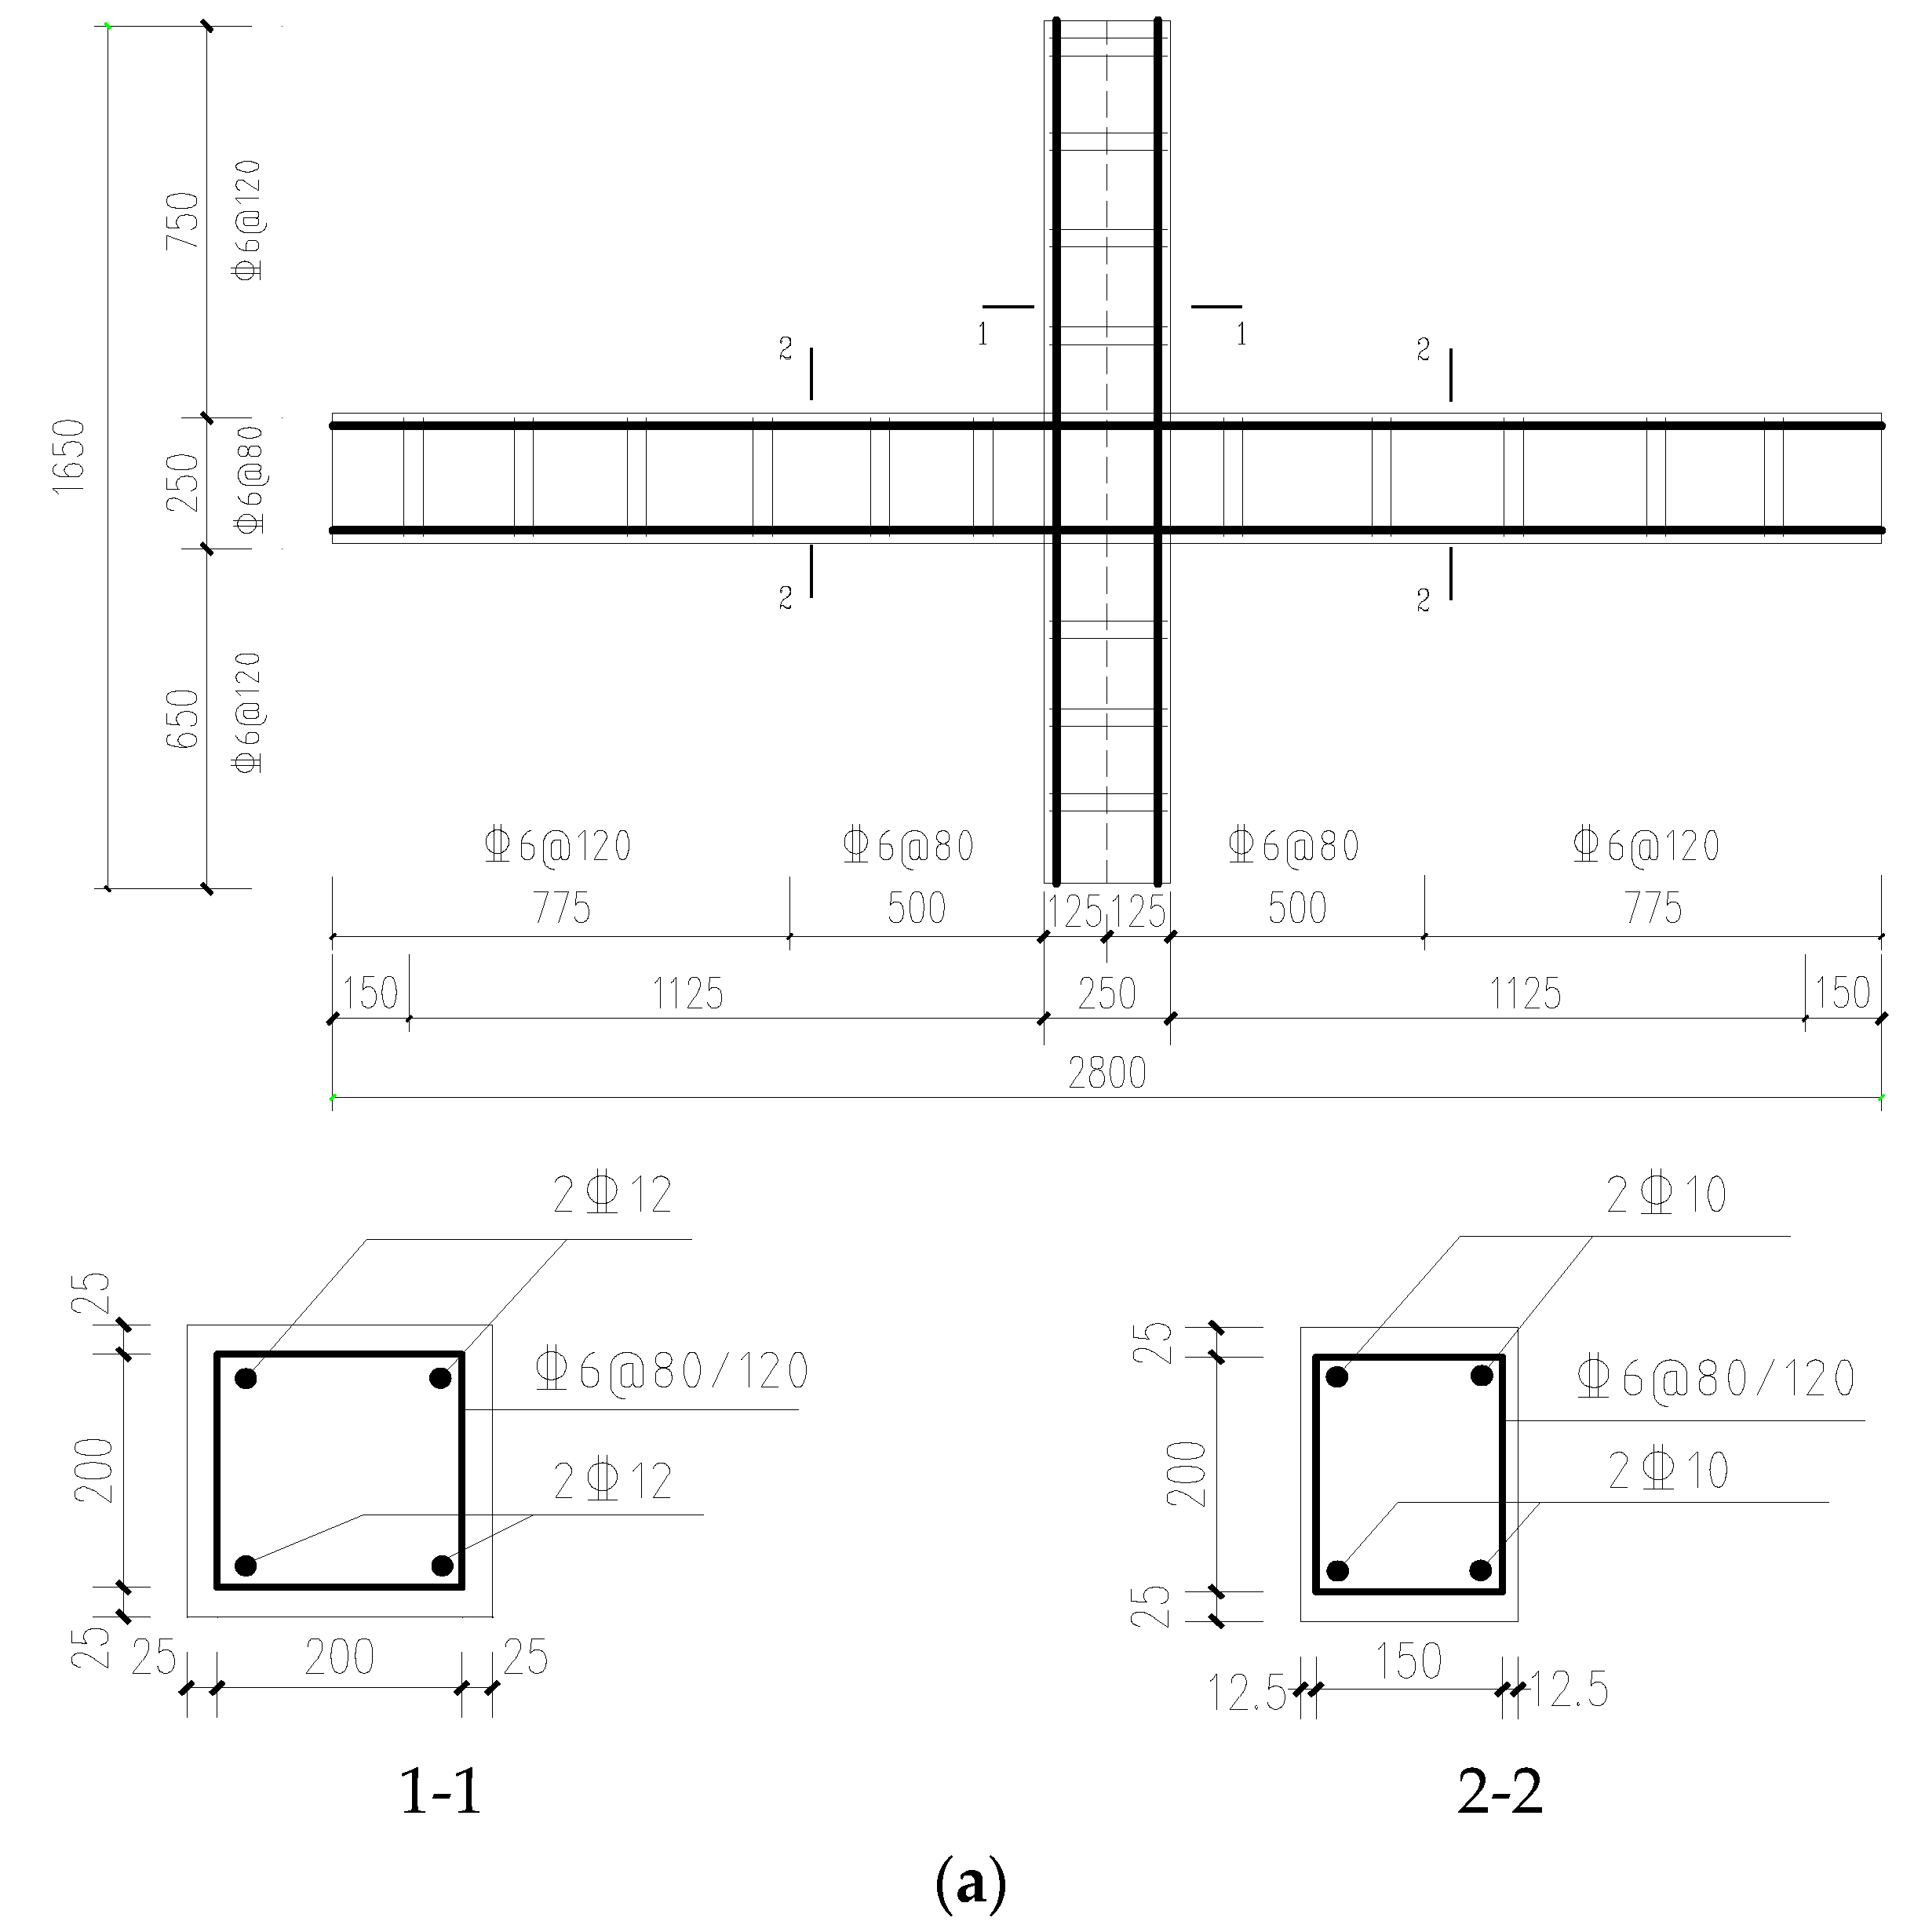
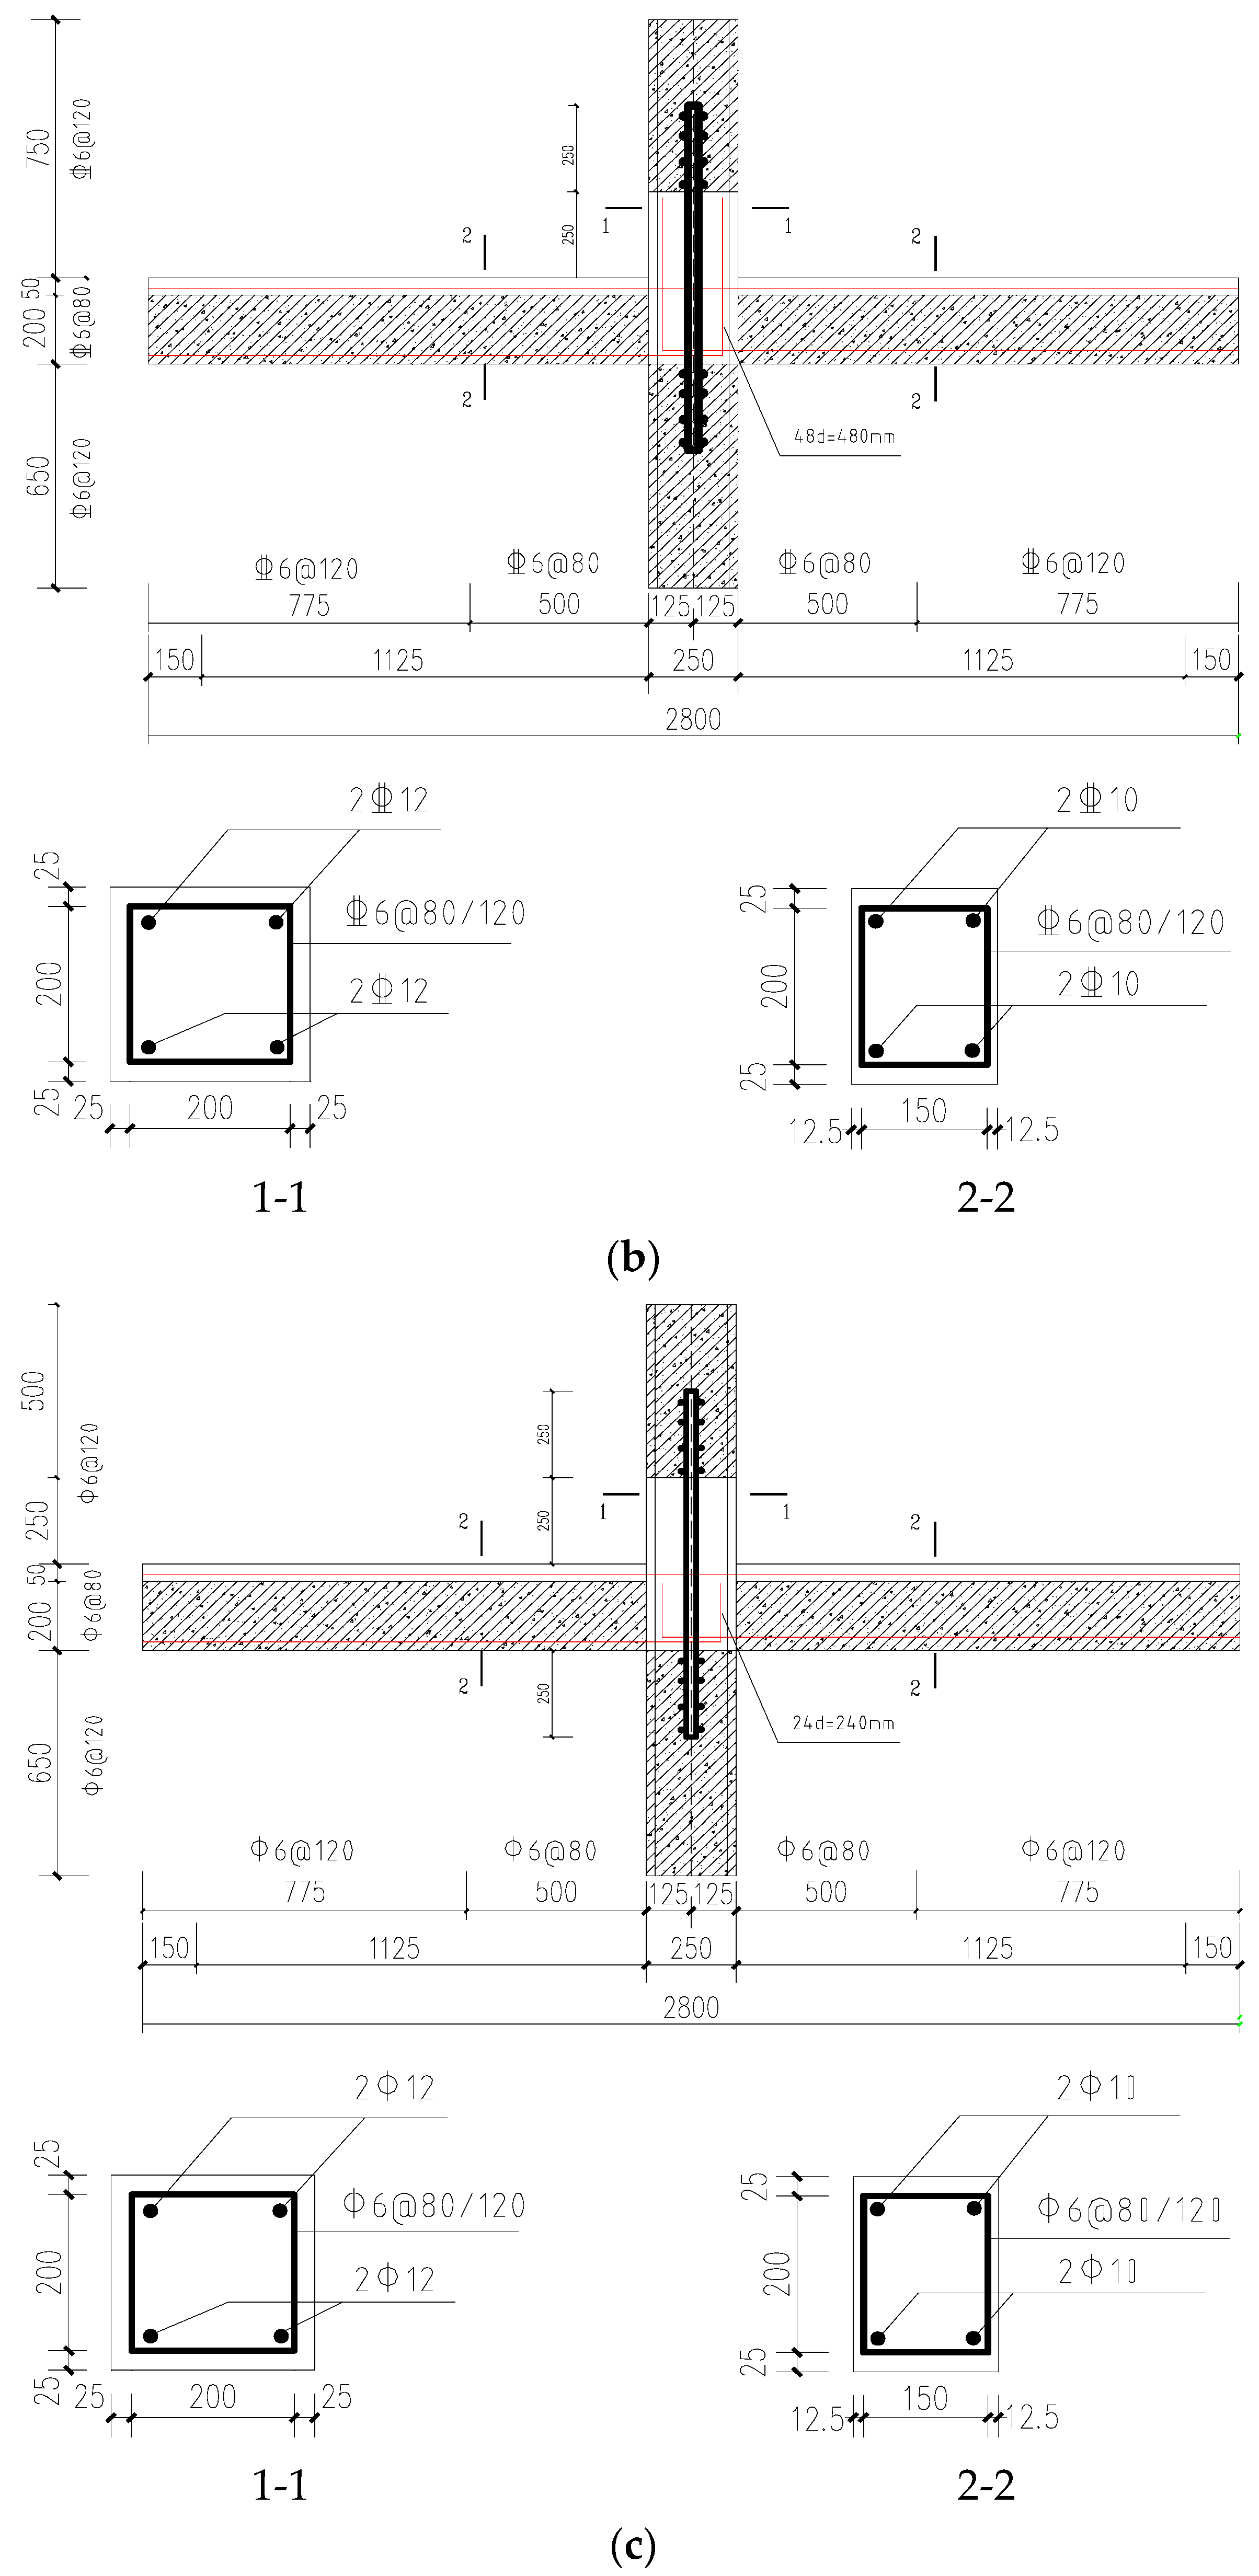
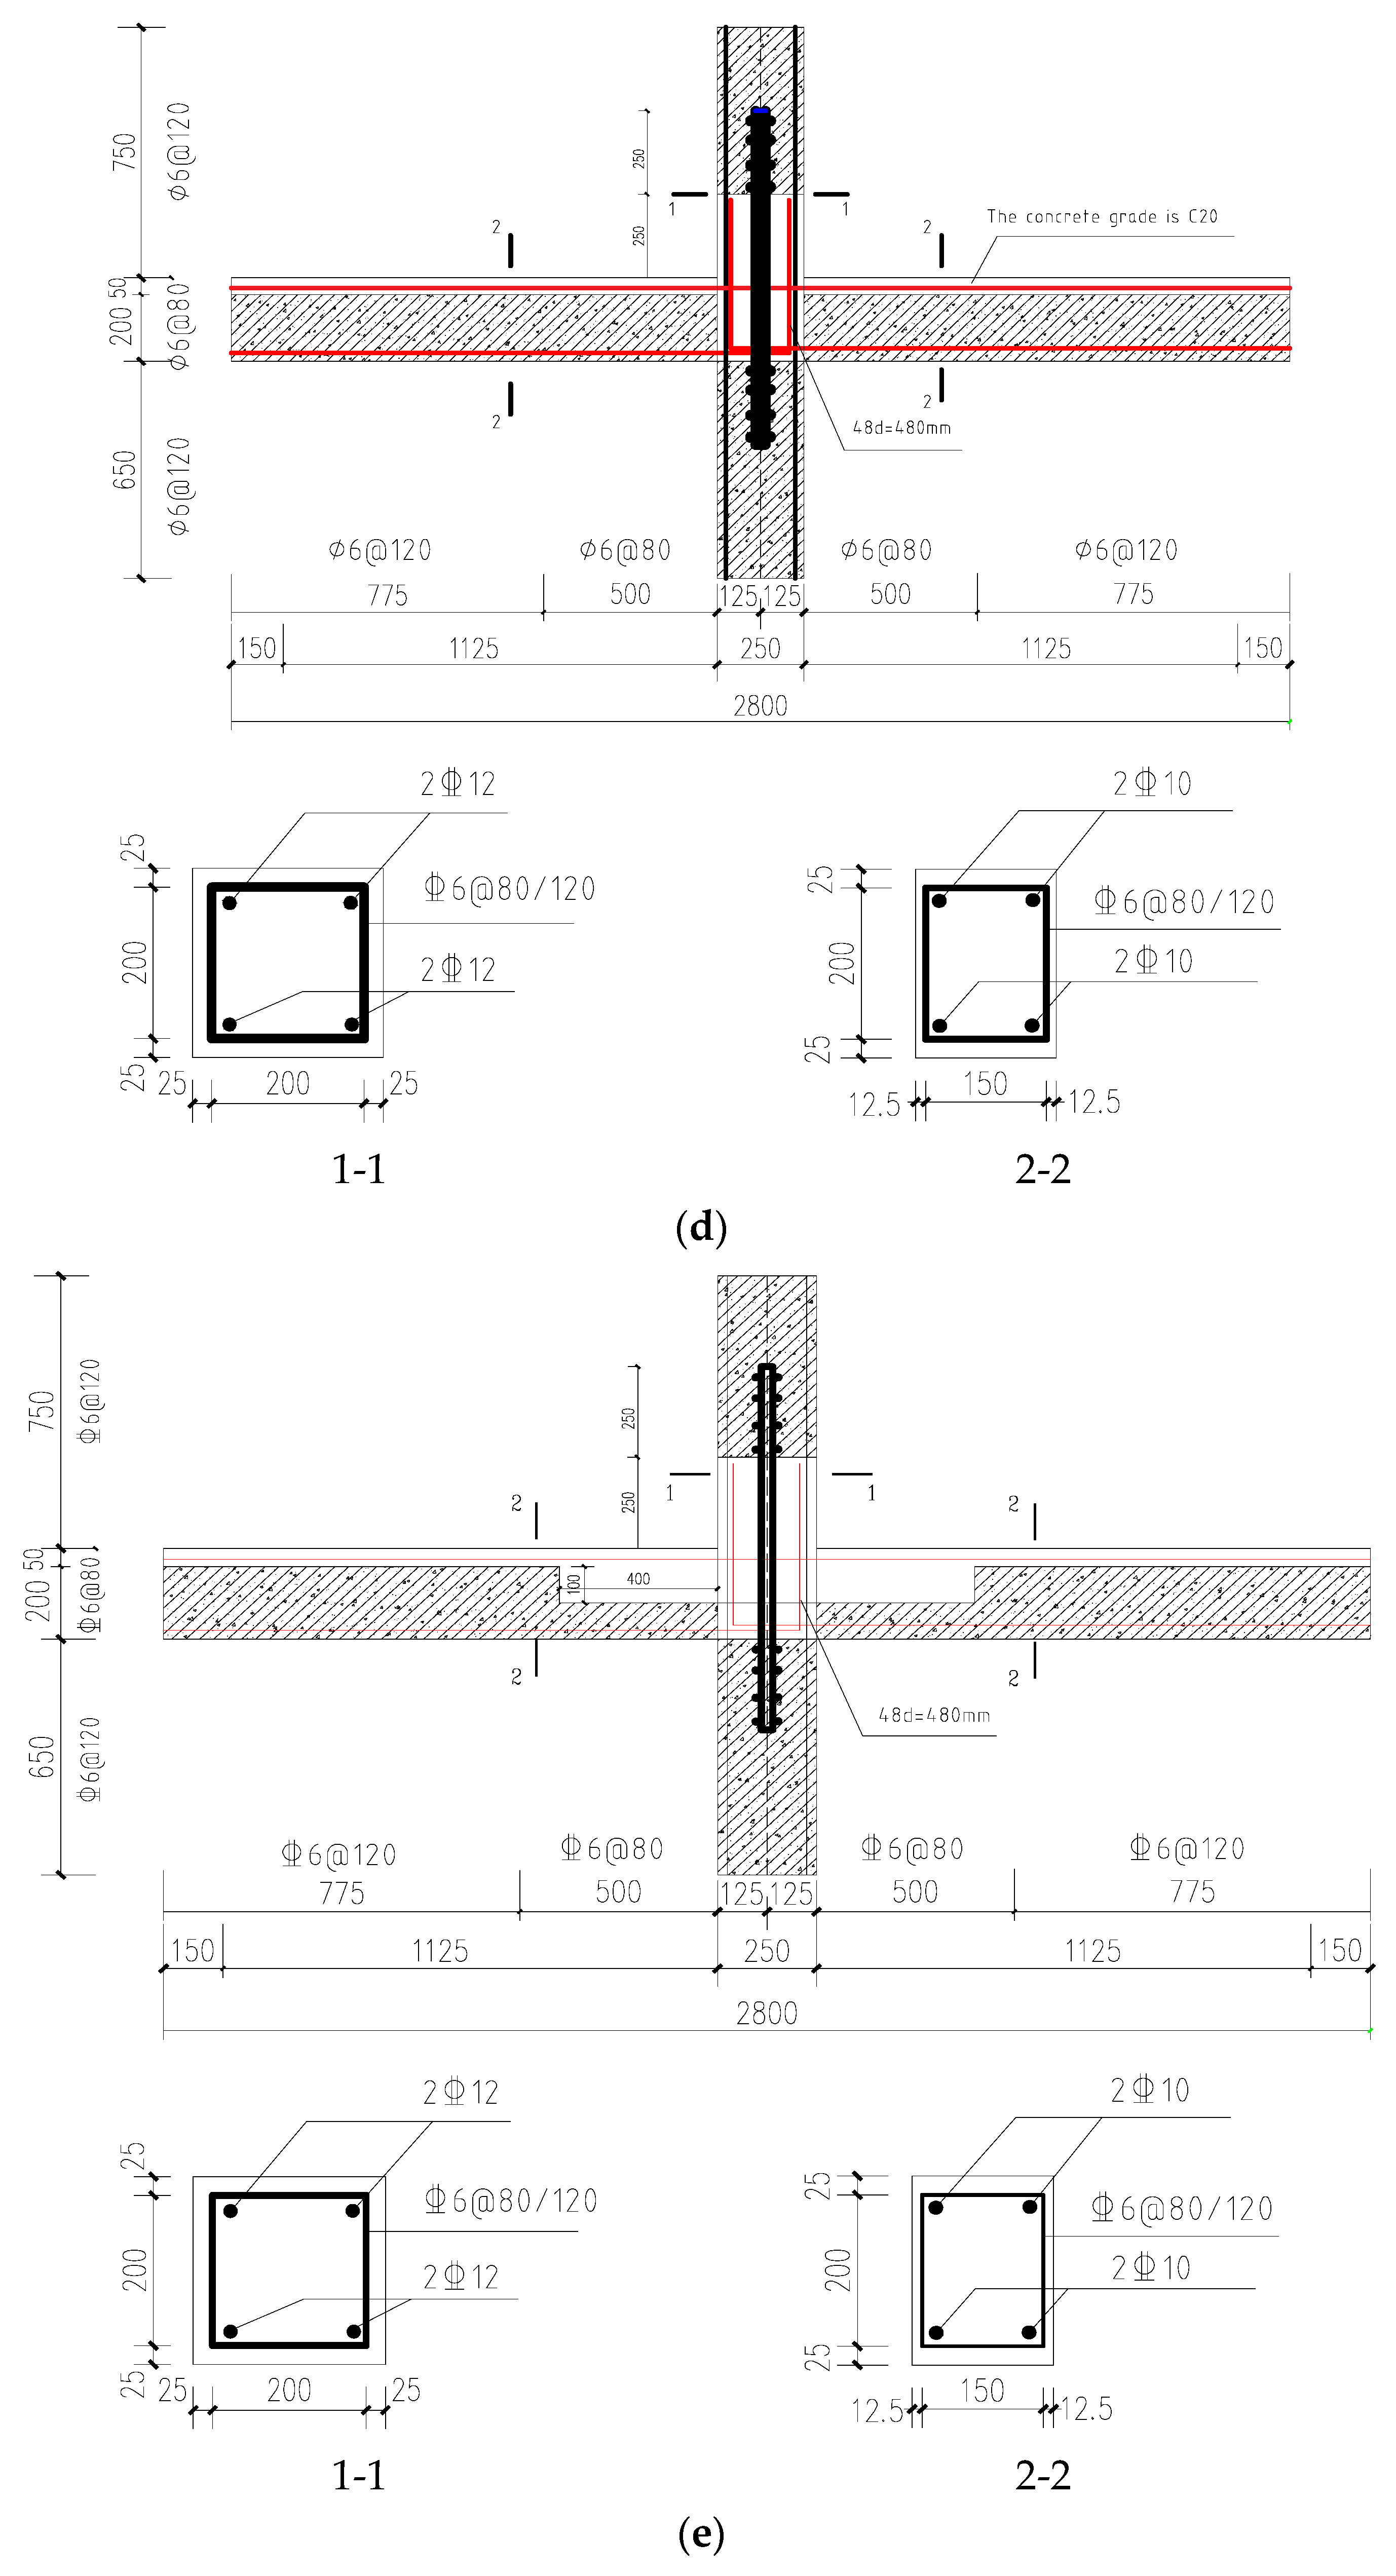
Table 1, the difference between ZP-1 and ZP-2 lies in the bending length of the L-bar, which measures 480 mm and 240 mm for these respective samples. The difference between ZP-1 and ZP-3 pertains to the concrete grades of laminated slabs (C30 and C20, respectively). Conversely, the difference between ZP-1 and ZP-4 concerns the area of post-cast concrete. The specific size and reinforcement of the specimen are displayed in
Table 1 and
Figure 2.
3.2. Material
During the test, reserved steel bars and concrete cube test blocks underwent mechanical property tests in accordance with the Tensile Test of Metallic Materials at Room Temperature (GB/T 228-2010) [
24] and the national standard for Testing Methods of Mechanical Properties of Ordinary Concrete (GB/T 50081-2019) [
25]. The results are presented in
Table 2 and
Table 3.
3.3. Loading Plan
The test utilizes the column end loading mode of beam-column joints. Accommodating the p-∆ effect within the structure under lateral force, the framework’s upper column anti-bending points are rendered as moving horizontal hinges when subjected to horizontal load. The bottom column anti-bending points, however, are considered as fixed hinges. The surrounding beams of the joints function as moving horizontal hinges. This complies with the actual stress state. Turn to
Figure 3 for the depiction of the loading device.
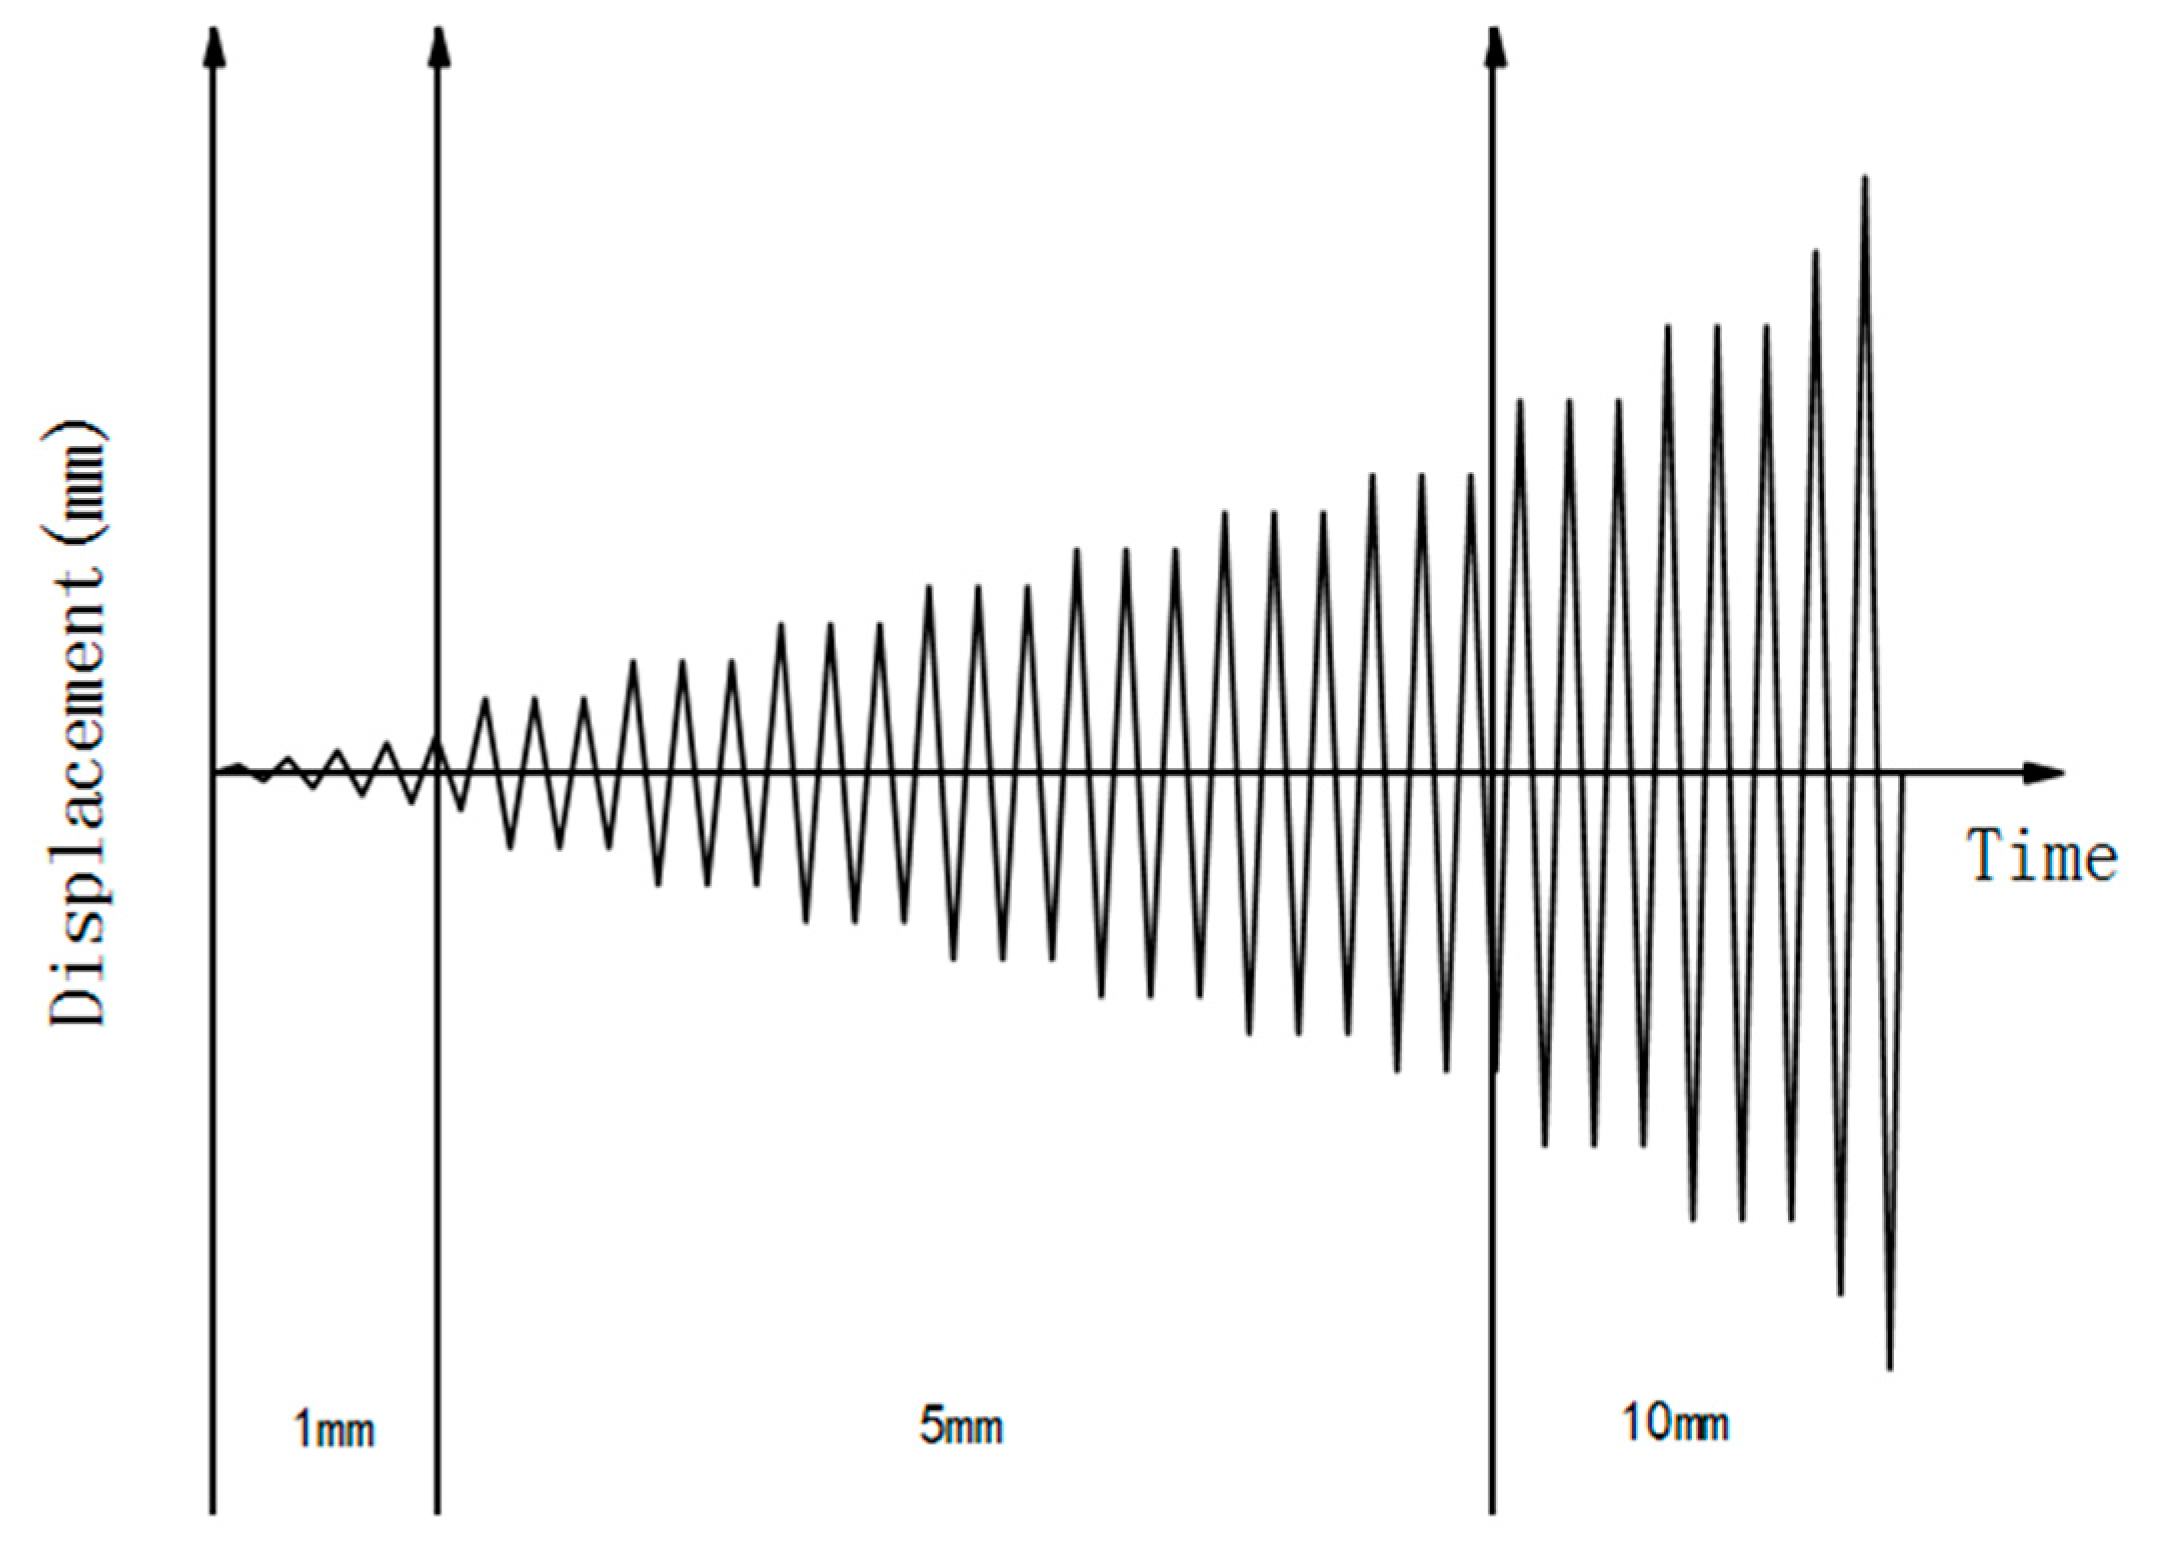
Testing loads are segmented into two categories: vertical and horizontal loads. The process commences with a hydraulic jack pushing a steady vertical load of 180kN at the column peak, considering an axial compression ratio of 0.2 due to limited school laboratory resources. The process is followed by an electro-hydraulic servo actuator (MTS) enforcing cyclic horizontal loading at the upper column peak. To maintain loading steadiness, displacement controls the entire loading. Initial loadings elevate the displacement by 1mm per stage until load-displacement is achieved at 5mm. Subsequently, each cycle stage undergoes displacement upsurge of 5mm three times. Once the load-displacement touches 40 mm, the incremental displacement is adjusted to 10 mm, thrice per horizontal cycle. If the load sinks to approximately 85% of the specimens’ peak load, the specimen can be considered damaged, and loading is terminated.
Figure 4 illustrates the specific loading regime.
3.4. Measurement Plan
The measurement procedures [
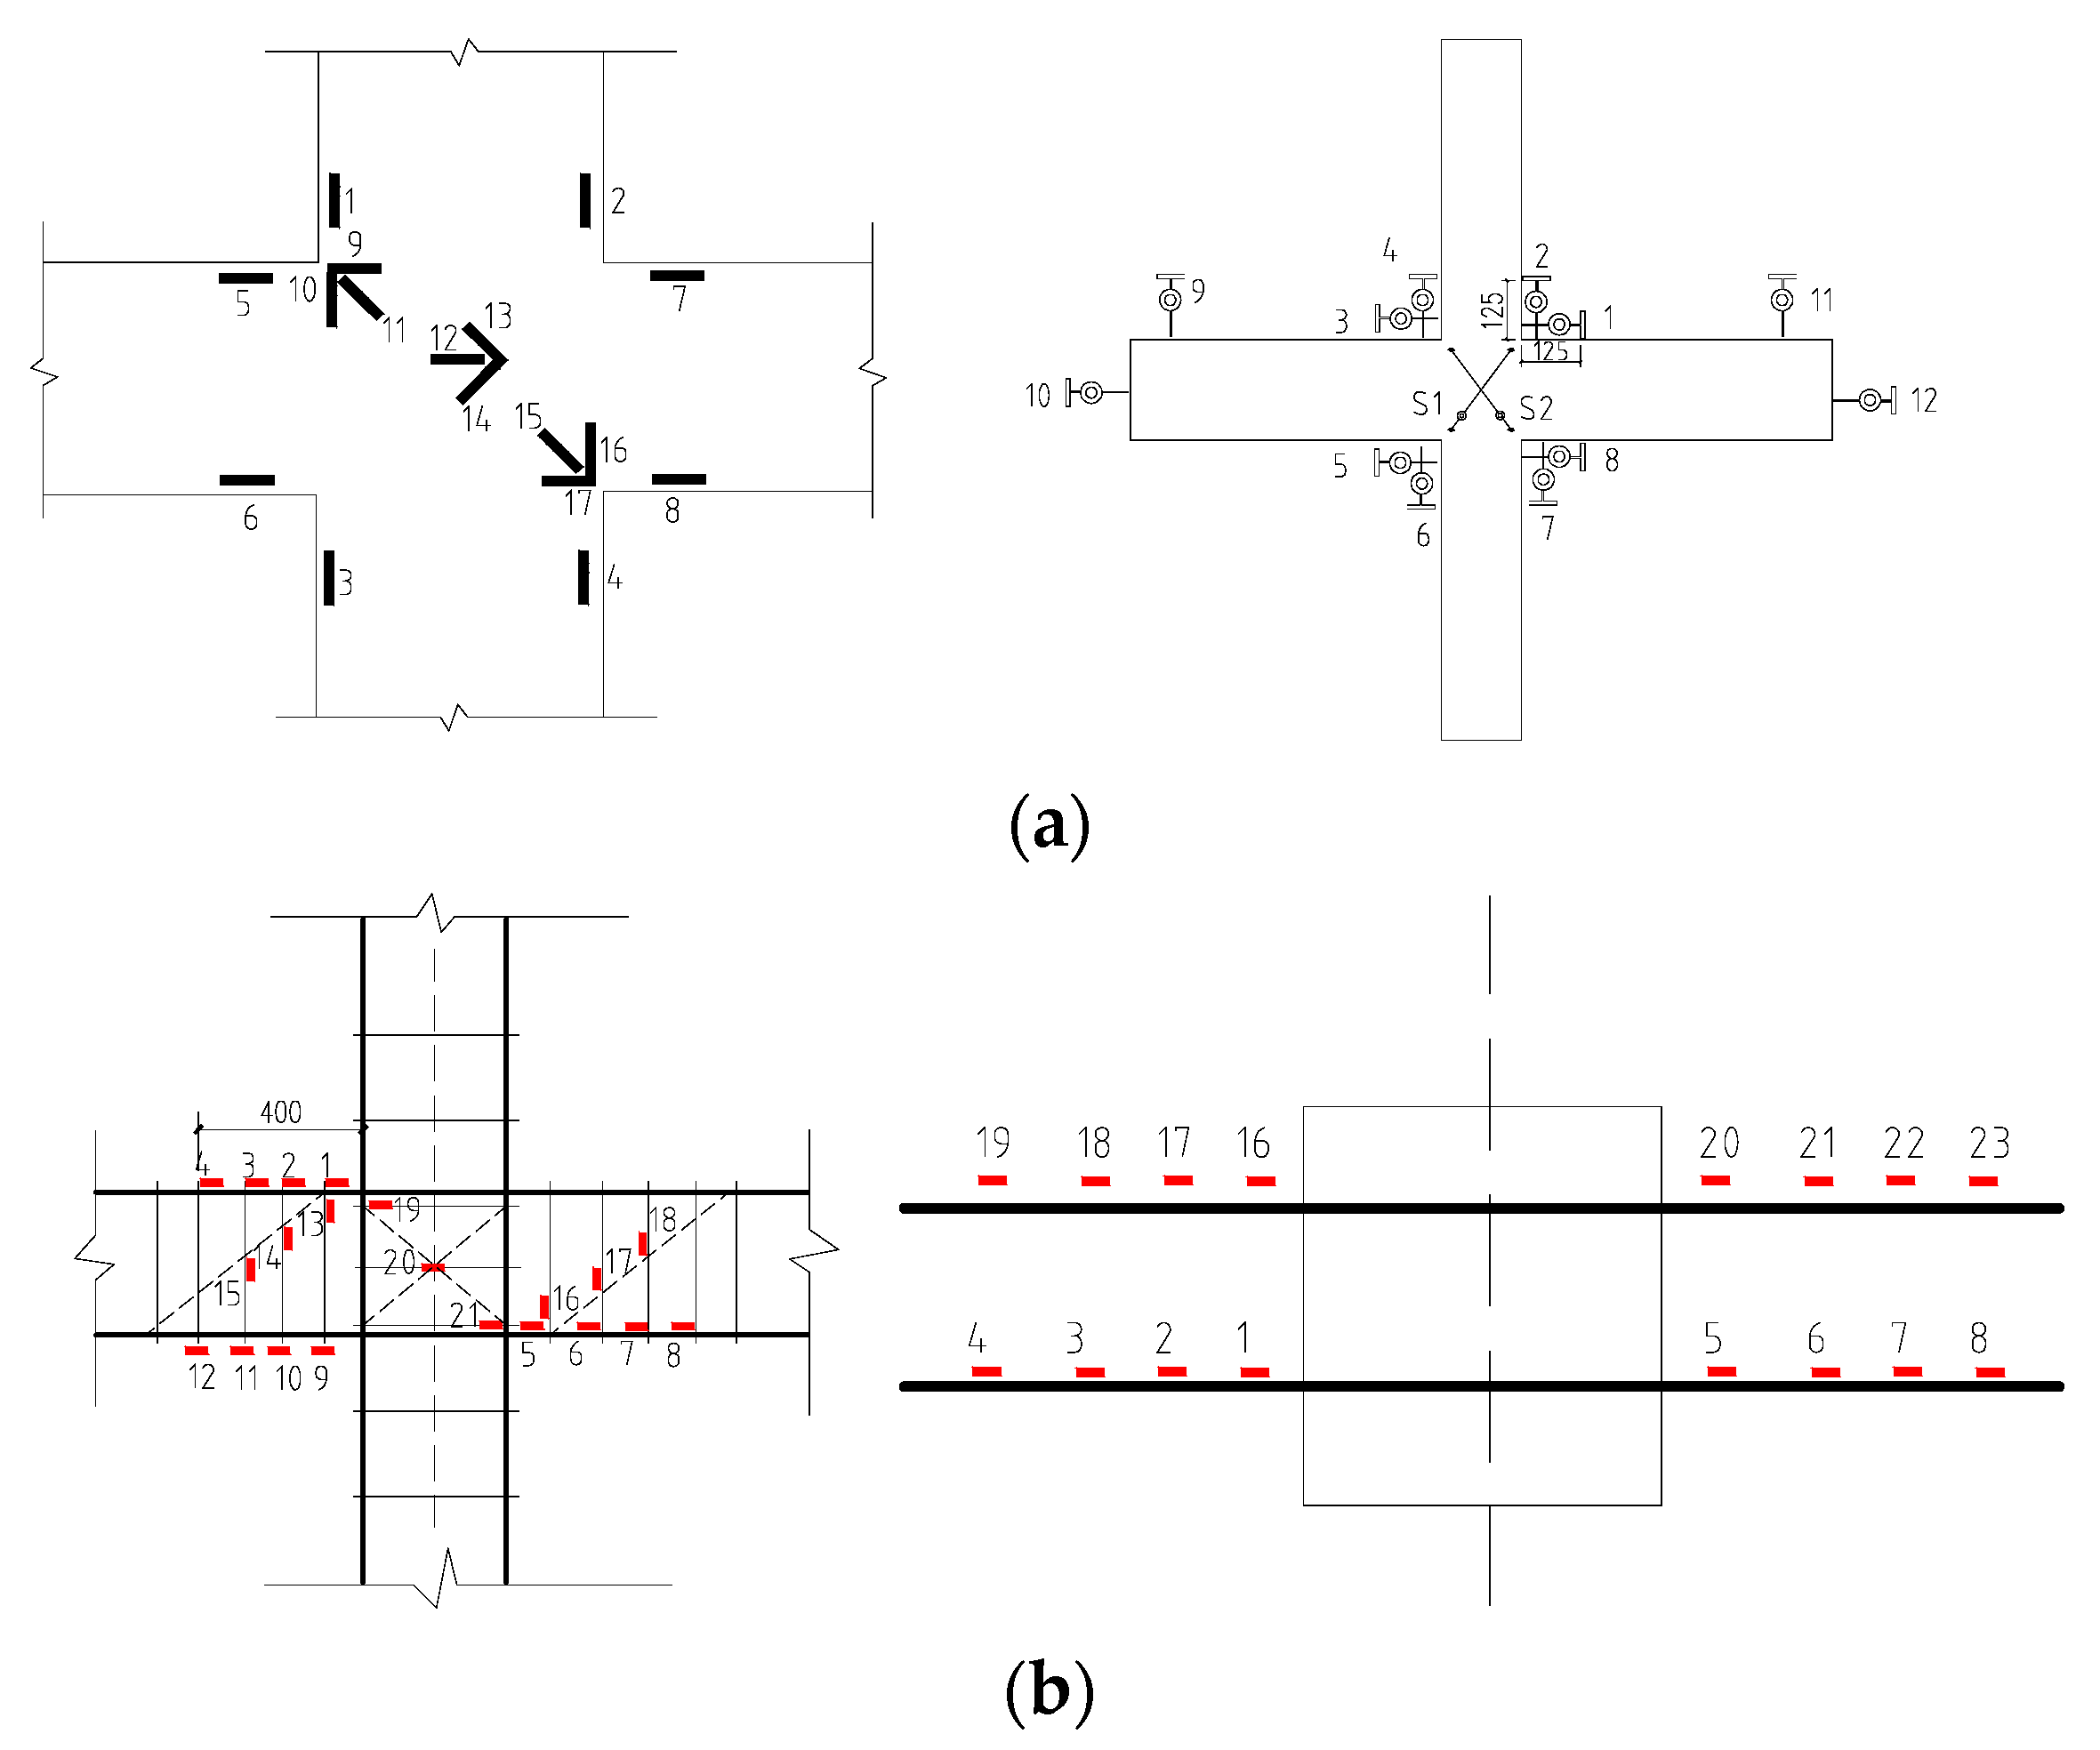
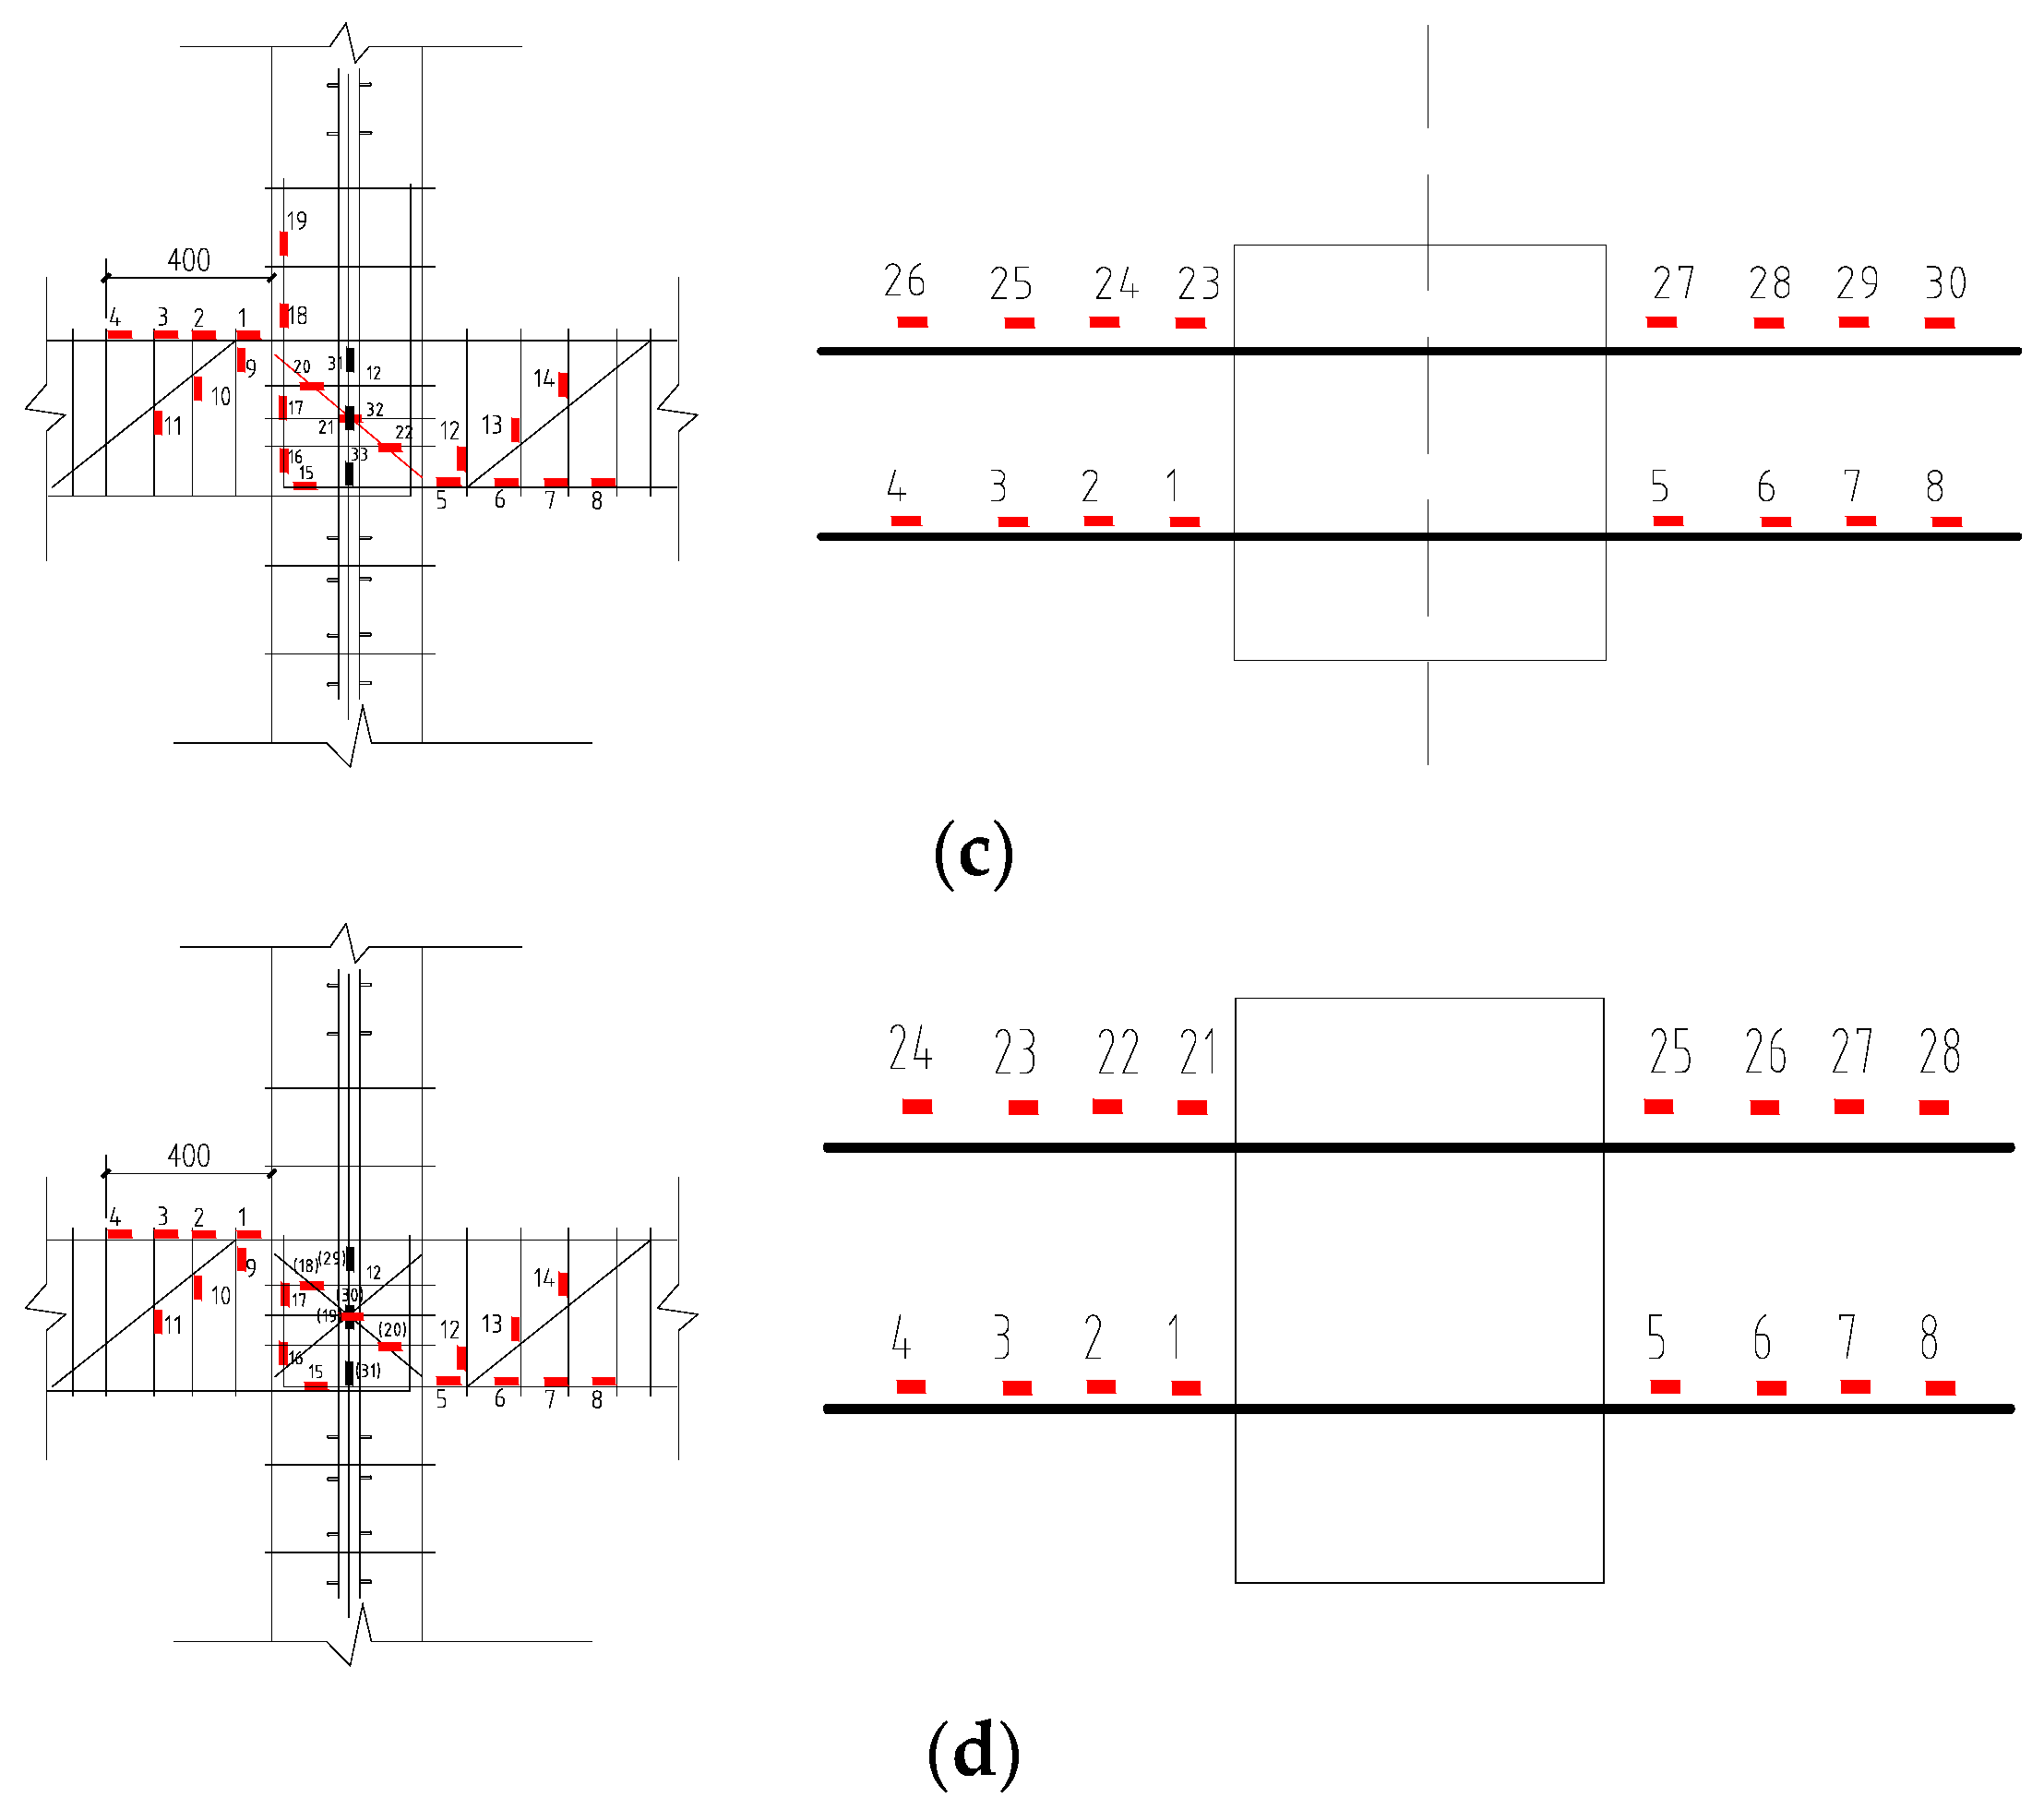
26] include displacement of the upper column end, support reaction force at the beam end, shear deformation at the joints’ core area, rotation angle of the plastic hinge area at the beam-column, overall displacement of the specimen, and strain and crack width of the reinforced concrete at the pivotal position. A detailed representation of the measuring gauge placements within and upon the joints can be found in
Figure 5.
4. Phenomenological and Statistical Analysis of Results
4.1. Analysis of Test Phenomena
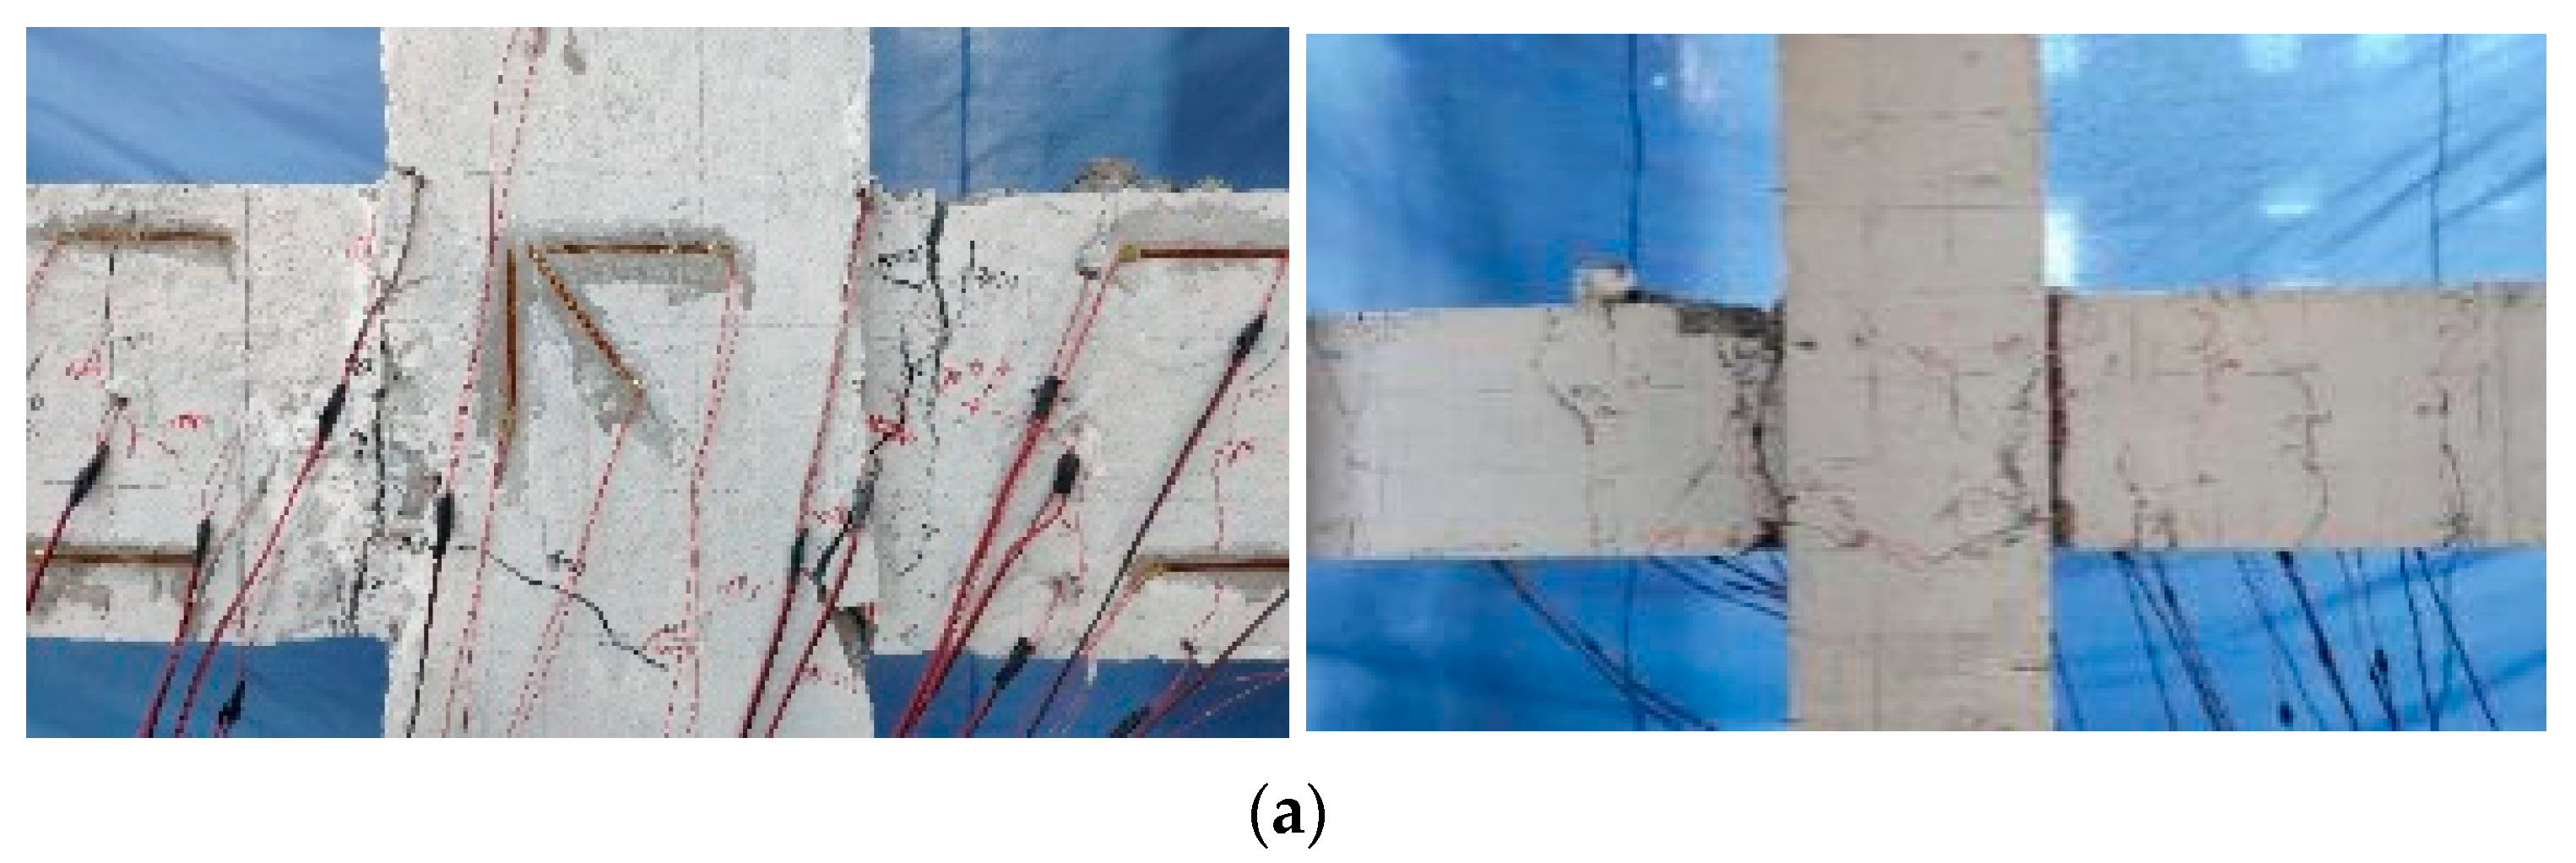
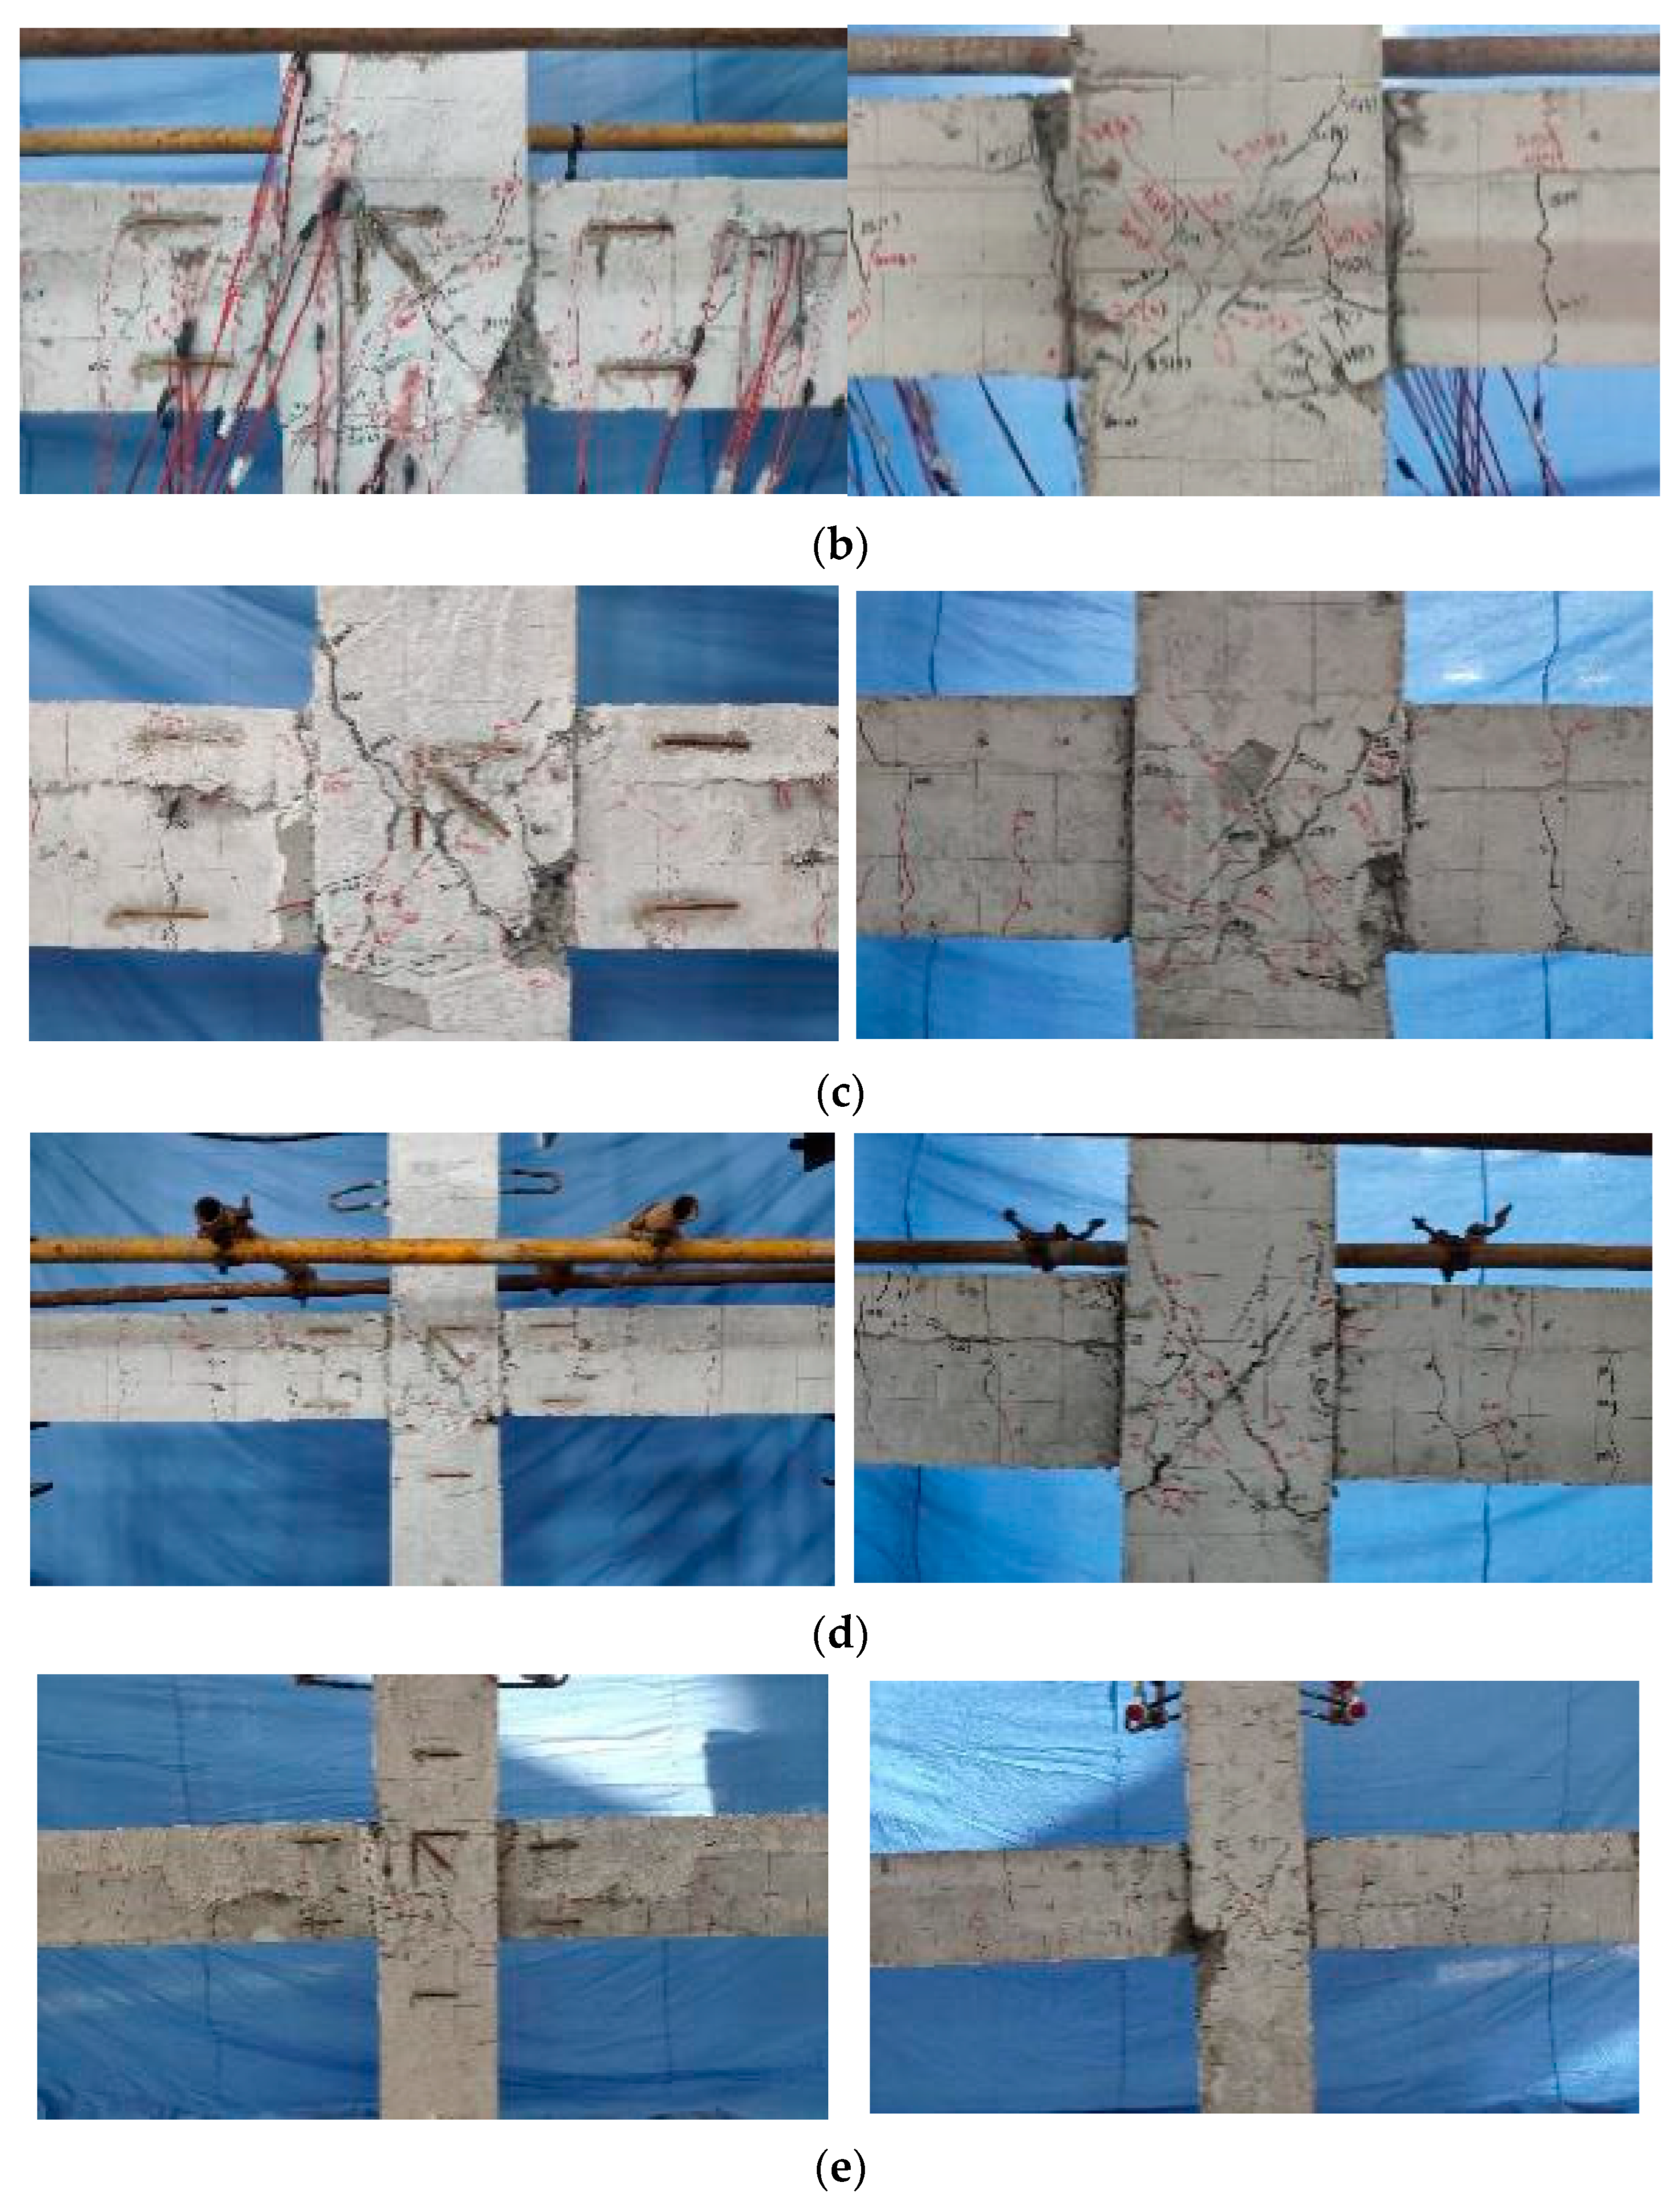
The observation of fissure development during the experimental load application, allied with the quantification of strain and displacement at crucial points, enabled an accurate analysis of joint failure modes. A semi-uniform failure process was noted across the quintet of joint specimens. Initially, single-cycle loads subject to minor amplitude did not visibly alter the concrete surface. However, sequential cyclical loading prompted the formation of vertical fissures around the beam ends. The persistent increase of load displacement instigated appearances of diagonal shear-inclined fractures. The beam-end vertical cracks developed into “U,” “Y,” and circular fractures over time. When displacement varied between △ = ±70 mm~80 mm, the concrete surface started to deteriorate, showcasing a growing number of cracks and significant concrete chunks detaching during loading. This stage also signified a declining bearing capacity of the specimen. When the bearing capacity reduced to around 85% of the maximum load, the specimen was deemed to have suffered damage and the loading was stopped. Specific damages identified included a severe shear failure leading to a significant loss of wedge concrete in ZP-2, attributed to its shorter L-shaped bar. Consequently, ZP-2 was classified as a shear failure. The remaining four joints displayed failures at the beam-column intersection, with the failure mode classified as beam-end failure, as illustrated in
Figure 6.
4.2. Interpretation of Hysteresis and Skeleton Curves
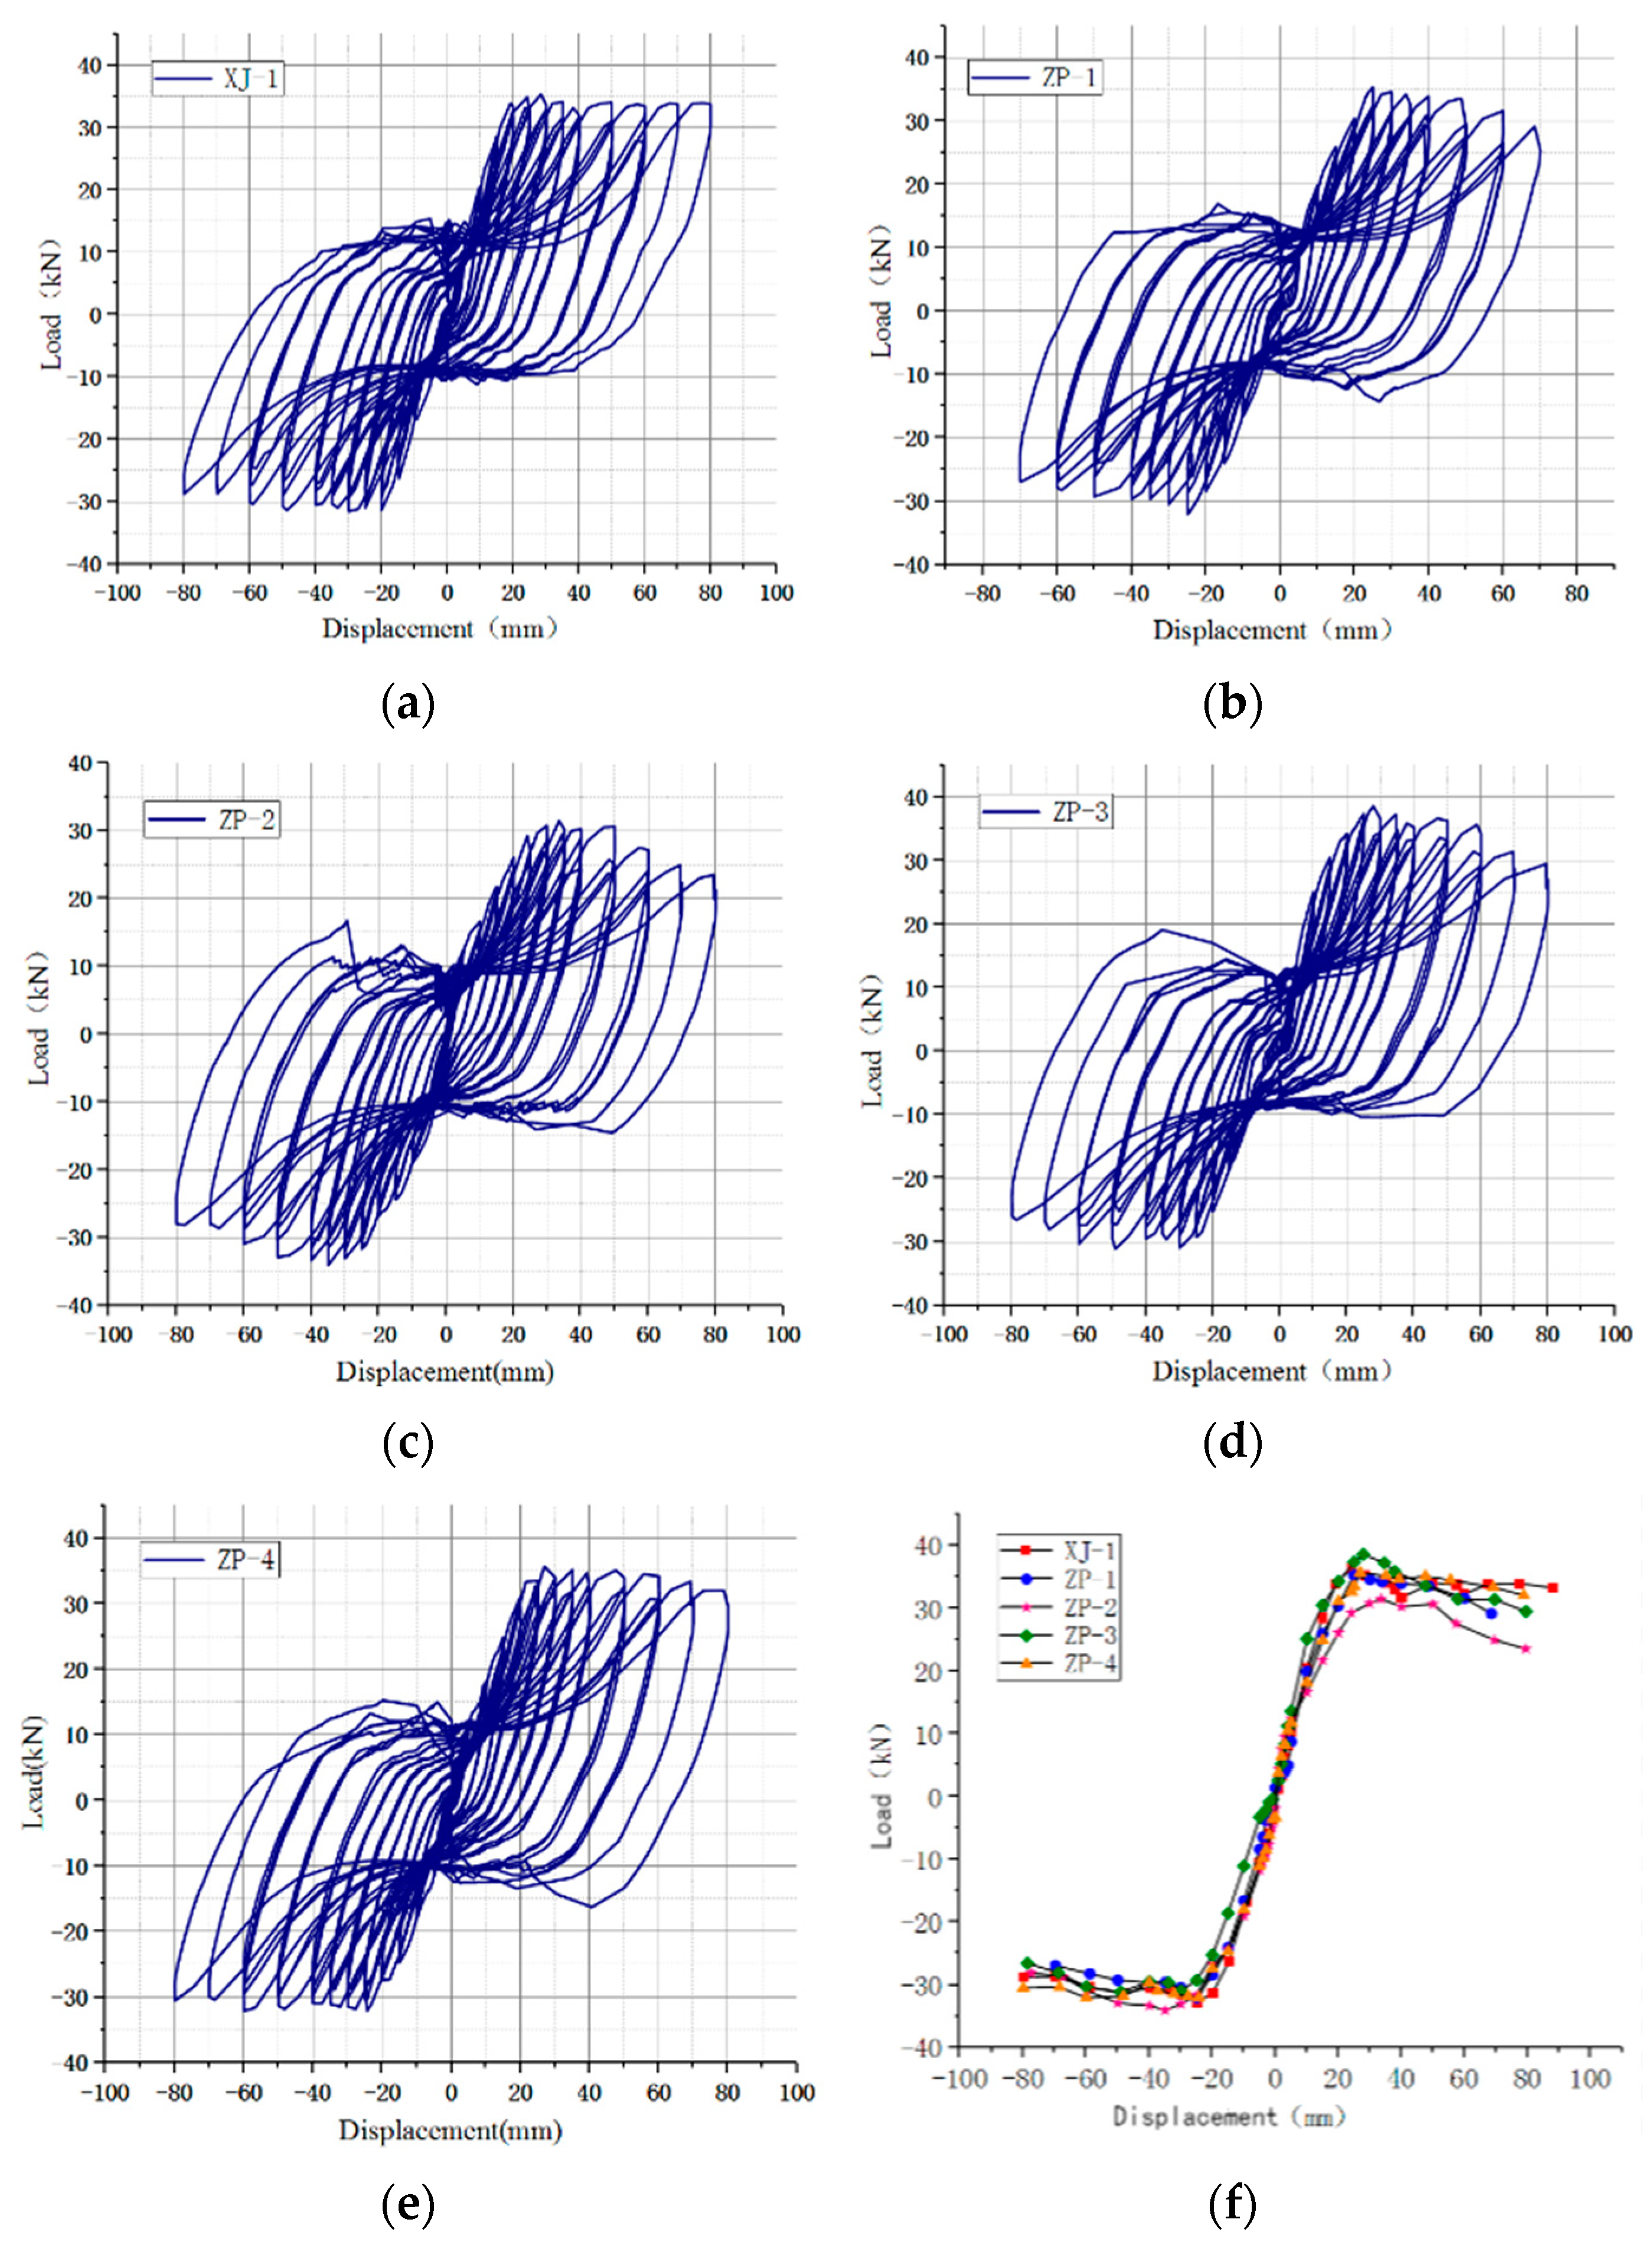
Figure 7 illustrates hysteresis and skeleton curves for each joint specimen, with the hysteresis curves for all five joint specimens resembling each other closely. The hysteresis loops displayed robust fullness and residual deformation post-unloading, typical of reinforced concretes. Despite the similar initial structures, the enduring loading phase revealed a pinching phenomenon. The bearing capacity of the ZP-2 joint decreased at a rapid pace, with recorded positive terminal values significantly lower than the other four specimens. The initial rigidity of ZP-2 was also markedly inferior to the other three new joints. The hysteresis loop area for ZP-2 was notably the smallest.
Figure 7f reveals that the skeleton curves for all joint specimen were “S”-shaped, representing the elastic, plastic, limit, and failure stages. ZP-3’s elastic phase curve initially displayed a steeper slope than the other four specimens but declined faster post-peak. Consequently, the ductility of ZP-3 was considered inferior due to diminished strength post-concrete pouring. A comparison of ZP-4 with ZP-1 indicated minor differences in initial stiffness, with the pre-final load slope of the curve relatively consistent. However, ZP-4’s final load surpassed that of ZP-1. Continuing to heighten the load led to a decline in joint bearing capacity, with ZP-1 declining at a notably faster rate than ZP-4. Compared to ZP-2, ZP-1 had superior bearing capacity, which decreased at a slower rate than ZP-2 post reaching the final load.
The improvement of bearing capacity, ductility, and energy dissipation capacity of joints can be effectively achieved by enhancing the post-casting area of concrete and the length of the L-shaped bars.
4.3. Analysis of Ductility
Ductility [
27] reflects the characterizes the deformation capacity of the joints following yielding. Its extentlargely influences the seismic performance of the structure. It is typically represented by the ratio of the ultimate displacement
to the yield displacement
. The equation for the ductility coefficient is as follows:
In which
represents the failure displacement of the joint specimen, specifically, the corresponding displacement when the load value diminishes to 85% of the peak load.
signifies the yield displacement of joint specimens. Both the load characteristic values and the ductility coefficients of each specimen are computed and the findings are displayed in
Table 4.
Based on the data in
Table 4, the ductility coefficient of ZP-1 is marginally higher than that of ZP-2 and ZP-3, suggesting that an increase in the length of L-shaped bars can effectively enhance the ductility of joint specimens. However, a decrease in concrete strength in the composite beam area can lead to a decline in ductility. The ductility coefficient of ZP-4 is significantly larger than the other three newly assembled joints, indicating that ductility performance is amplified by augmenting the post-cast area of the concrete in the joint. The ductility performance of the cast-in-place joints is notably superior than the other four joints due to the integrity performance. The bonding of new joints between old and new concrete can influence the overall mechanical properties of the joints.
Thus, it is observed that by enlarging the concrete postcast area in the joint area, the length of the L-bar, and the concrete strength in the composite beam, the bonding capability between the postcast area and the assembled component can be effectively realized with the goal of improving the ductility performance of the joints.
4.4. Analysis of Energy Consumption
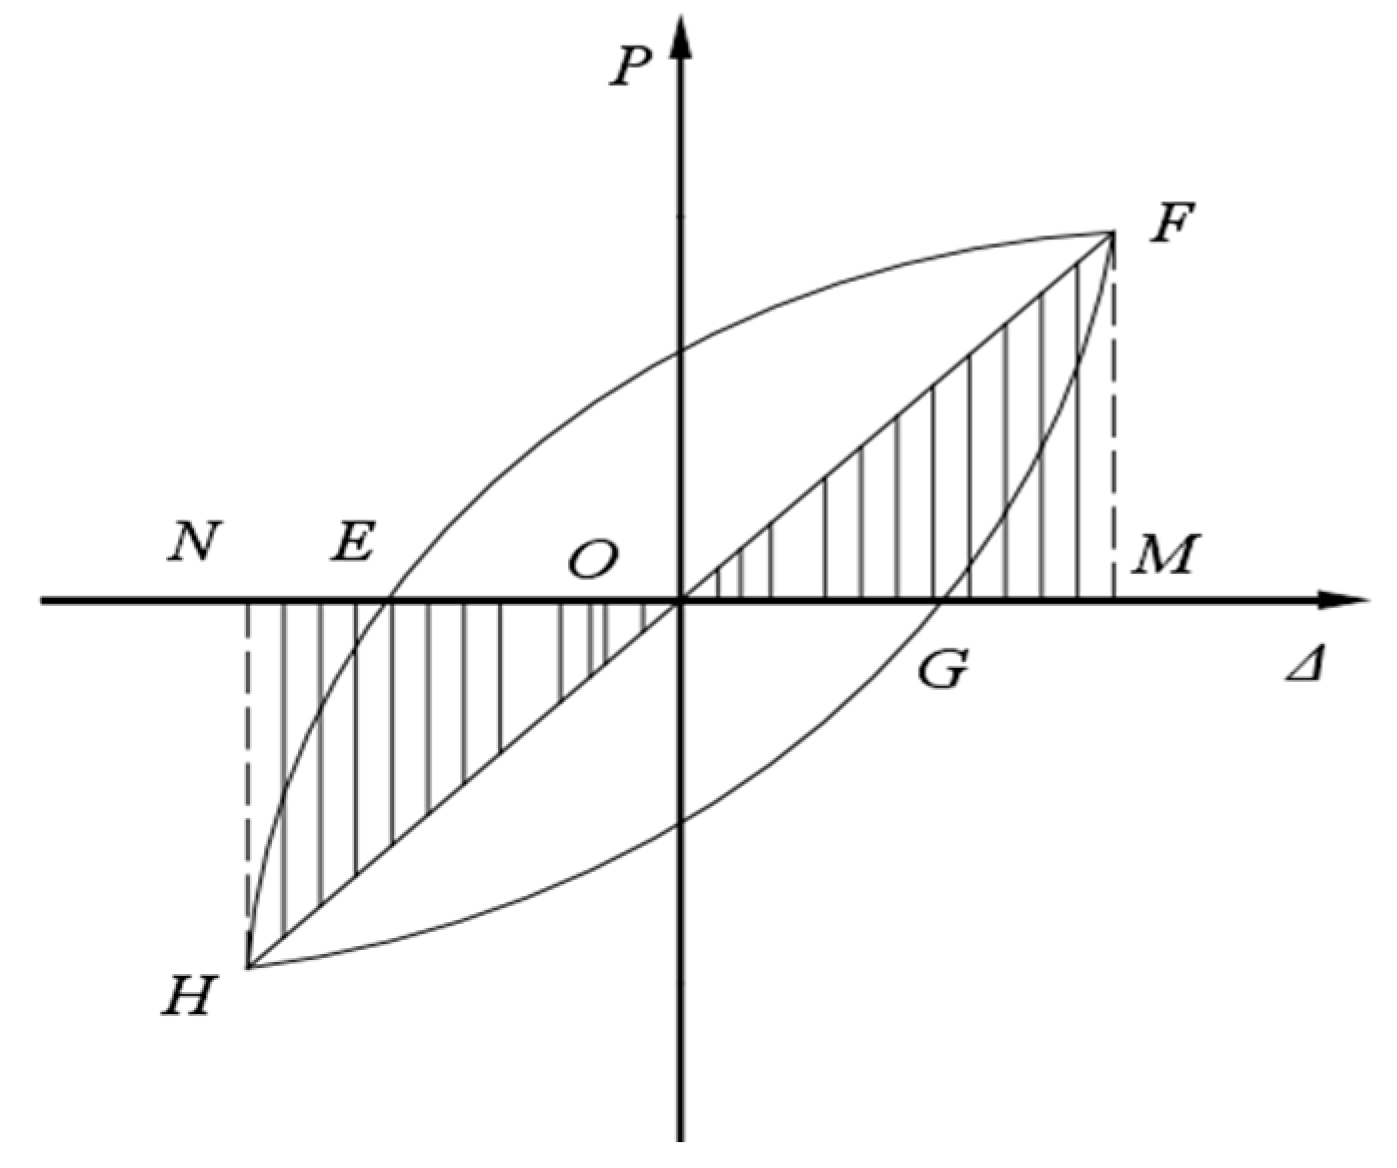
The energy dissipation capacity of the specimen under horizontal load is gauged by the area encompassed by the hysteretic loop in the hysteretic curve. The most commonly used assessment index is the equivalent viscous damping coefficient
, which is represented as follows:
where,
symbolizes the area enclosed by a hysteretic loop;
+
symbolizes the area enclosed by an imaginary elastic line at the same displacement. The visual explanation of
and
+
is portrayed in
Figure 8. The equivalent viscous damping coefficient
of the five joints under the peak state is provided in
Table 5.
Analyzed data in
Table 5 show that the equivalent viscous damping coefficient of cast-in-situ joint XJ-1 is considerably higher than the rest of the four joints. The
of ZP-2 and ZP-3 is notably smaller, suggesting a lower capacity to dissipate energy and more severe shear damage from the perspective of the failure process. It is also observable that enhancing the length of L-bars, the concrete strength of the composite beam, and the post-cast area of concrete in the joint area can boost the energy consumption capacity.
4.5. Analysis of Stiffness Degradation and Strength Degradation
During cyclic loading, when the same peak load is preserved, the occurrence of expanding peak displacement leading to increasing numbers of cycles is termed as stiffness degradation [
28]. Stiffness is measurable via secant stiffness, represented by the equation of secant stiffness, denoted as K:
In this equation,
is indicative of the load present at the forward peak point during the i-th cycle while
the load at the negative peak point under the same cycle.
and
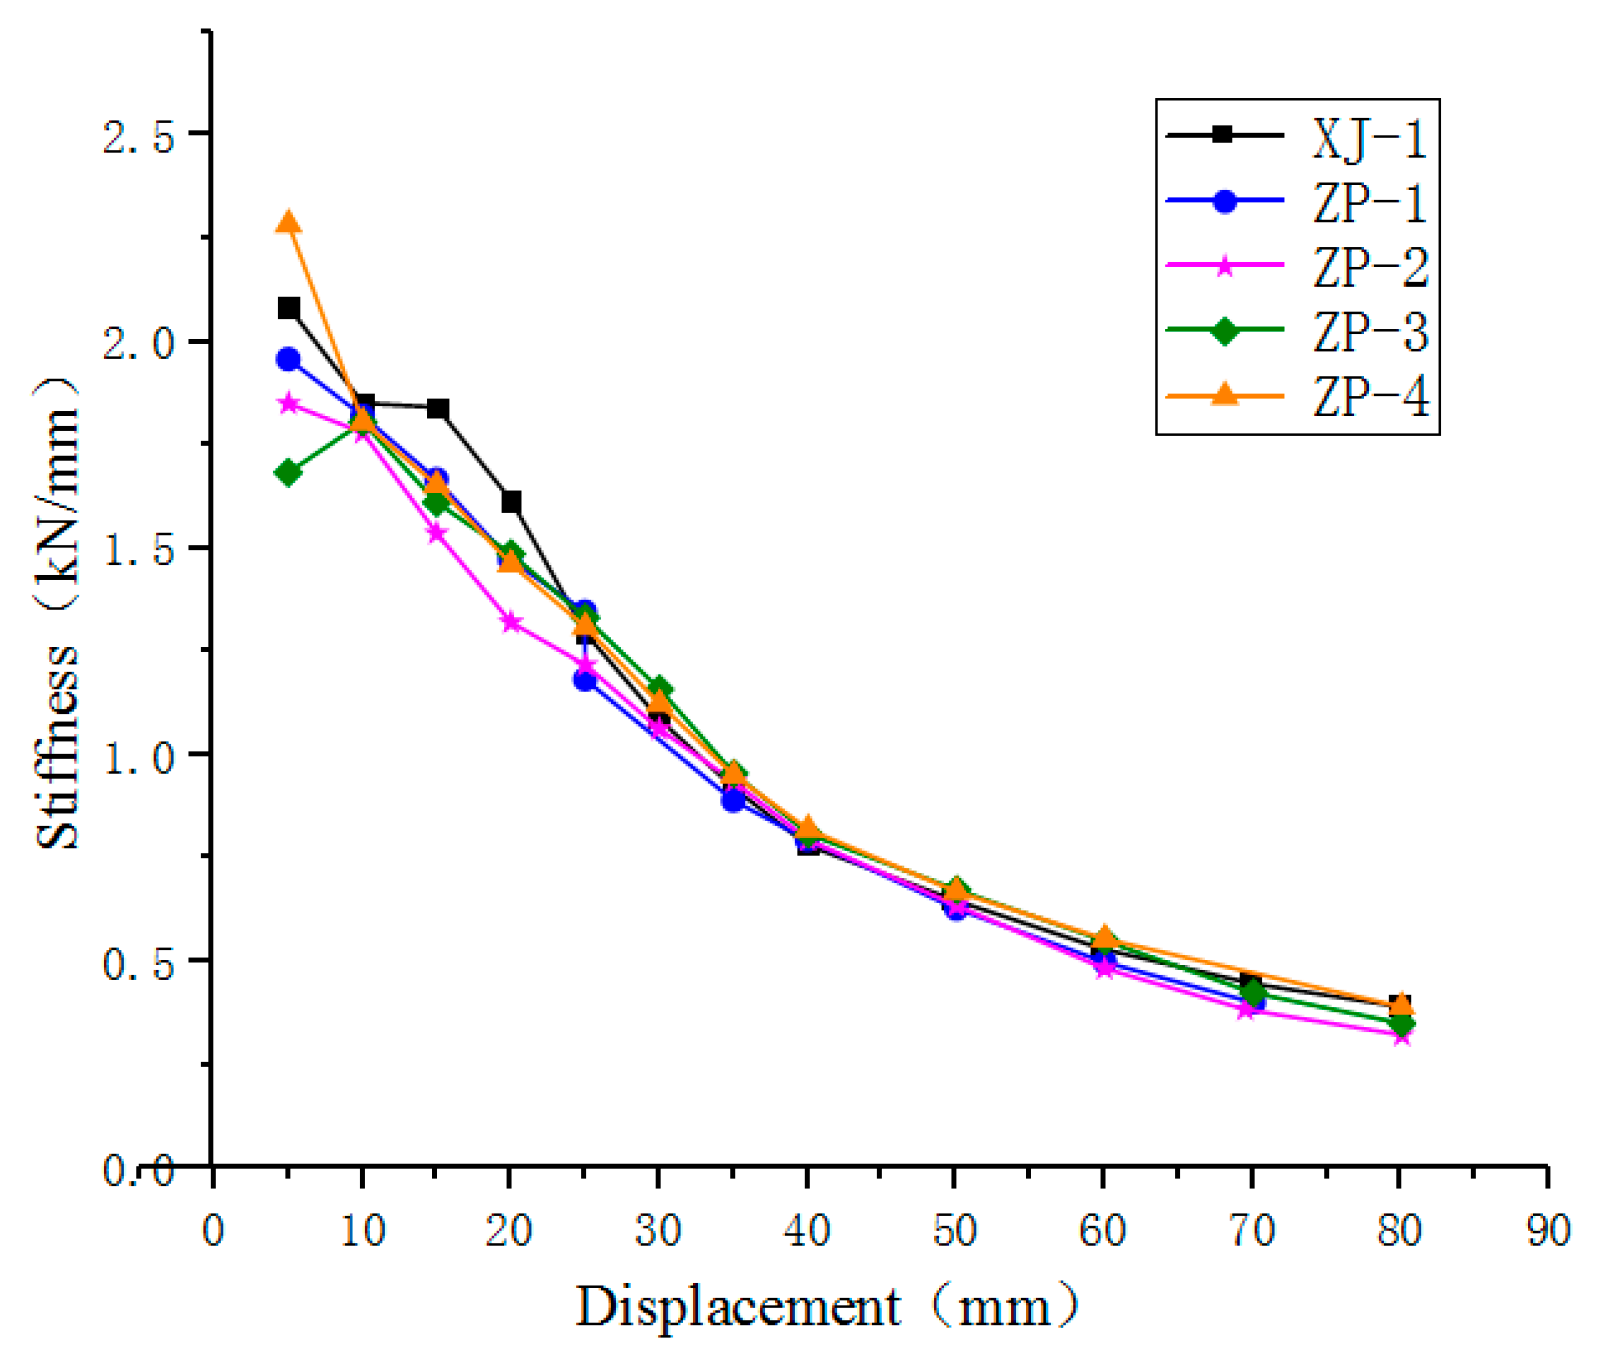
represent the forward peak point displacement and the negative peak point displacement at the i-th level loading respectively. Post-calculation, the stiffness degradation curve can be visualized in
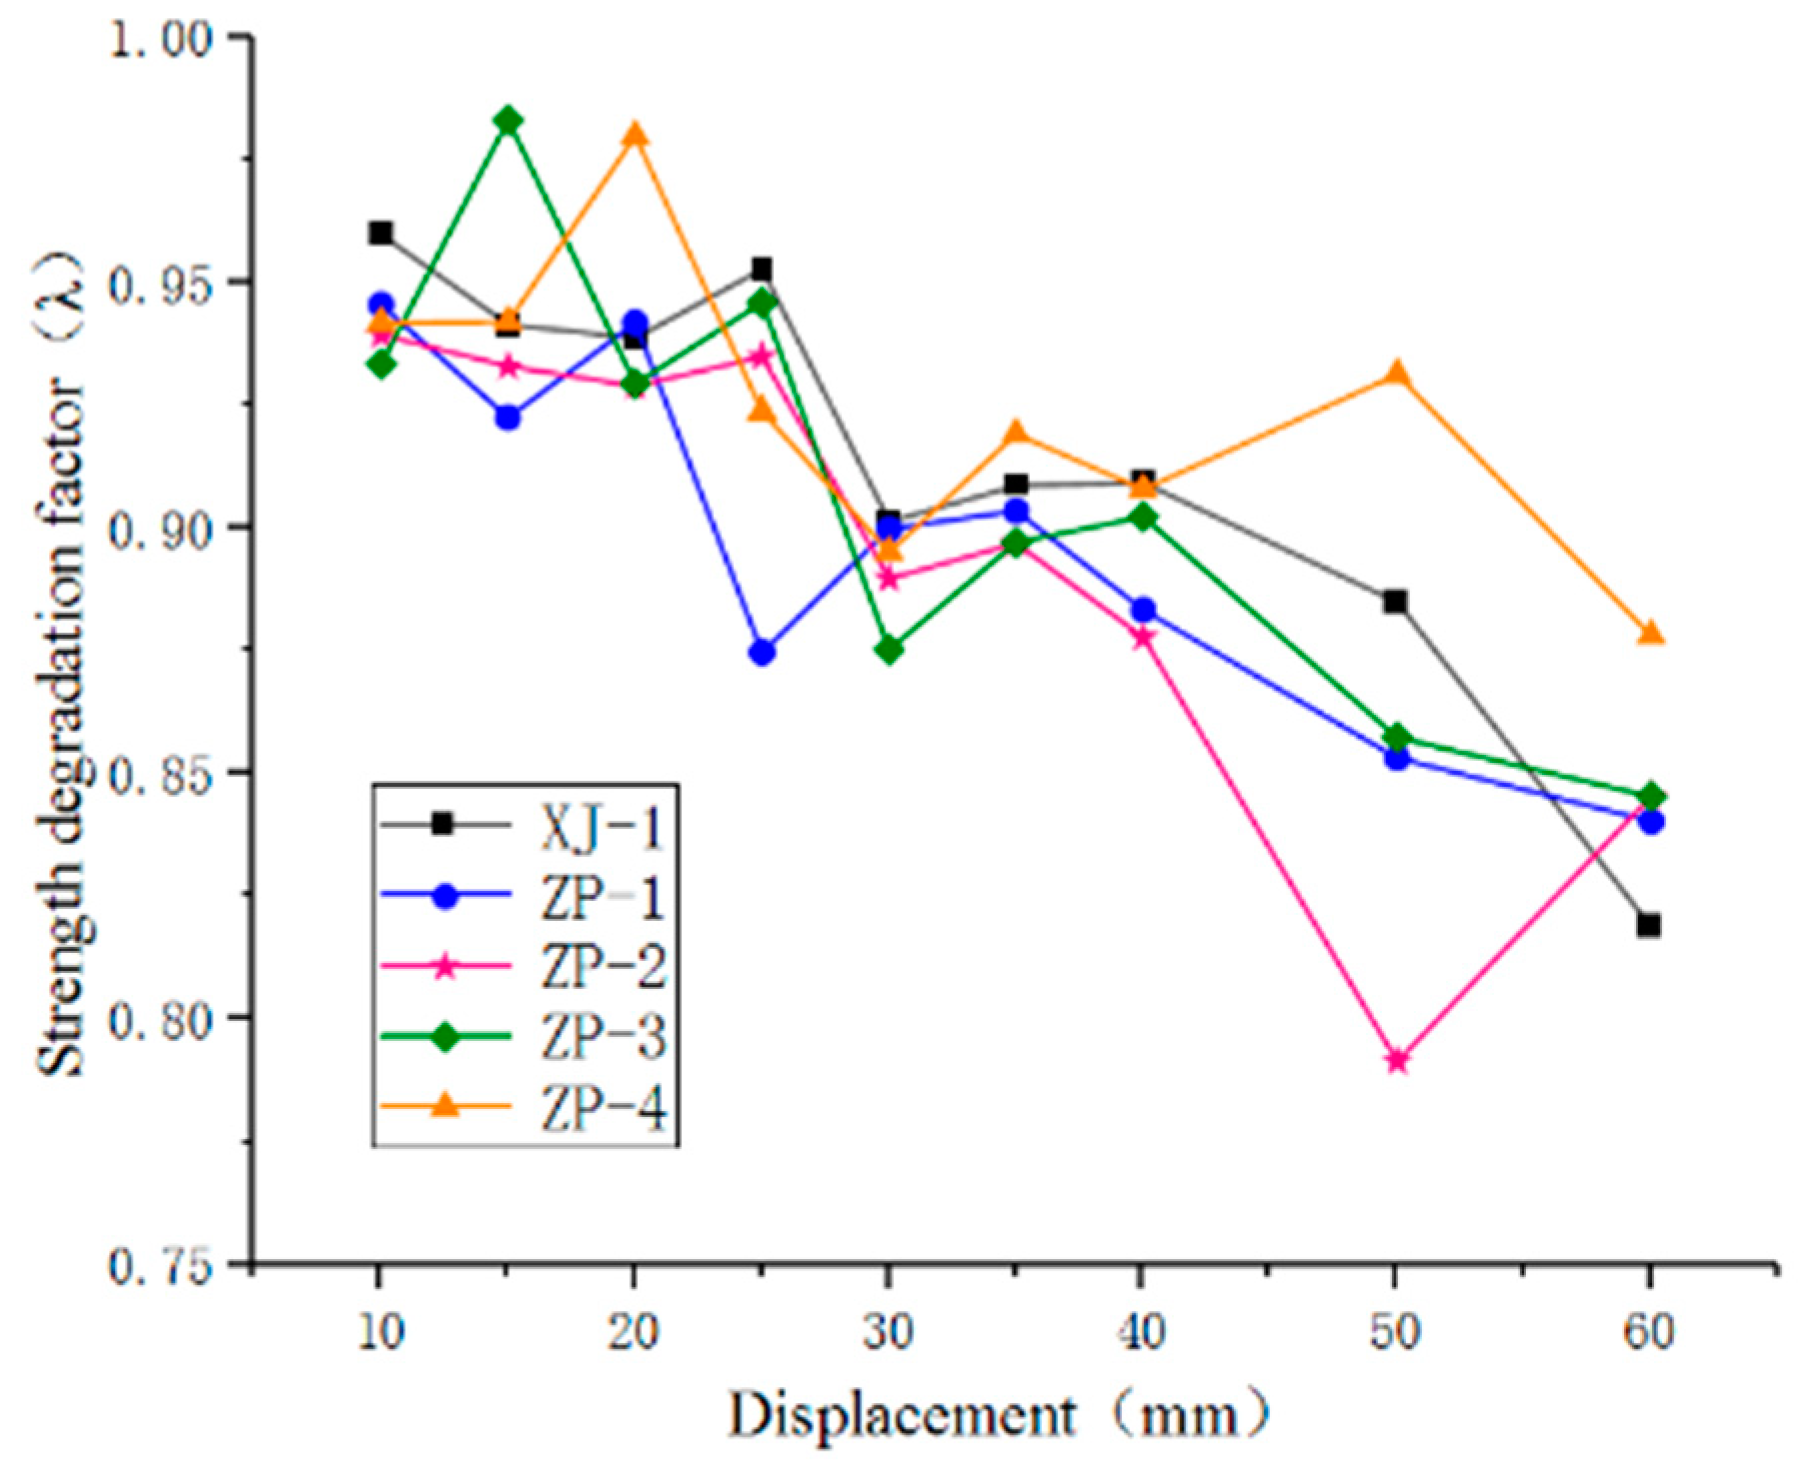
Figure 9.
Our findings from five specimens were near-congruous in terms of overall stiffness and the degradation trends. The XJ-1 joint’s complete stiffness smoothly transitions with the initial stiffness of ZP-4 proving greater due to the inherent pipe, albeit with a high attenuation rate. ZP-2 demonstrates smaller overall stiffness than the remaining joints, attributable to its shorter reinforcement length L, leading to shear failure in its core area. This outcome culminates in a lesser overall stiffness than that of the ZP-1 with longer L bars. Preservation of the steel pipe in the column can notably enhance the initial joint stiffness.
When the strength decrease of a specimen coincides with an increase in cyclic loads of the same level, this is identified as strength degradation [
29], typically estimated by the strength degradation coefficient
. The equation is as follows:
where
is indicative of the peak load of the hysteresis curve for the i-th cycle when the specimen loads at the j-th level.
represents the hysteresis curve’s peak load for the i-1 cycle when the specimen is under load at the j-th stage. The strength degradation curve is shown in
Figure 10.
As displacement and load cycles amplify, the reinforcement of all specimens begins to yield. Periodically, characteristics such as the substantial fracturing of the concrete in the core area, serious damage in the plastic beam hinge area at the beam ends, and partial retreat from work lead to a decrease in joint strength. Additionally, due to the relative slip between concrete and longitudinal reinforcement, joint strength proves irregular. Despite these, the strength of the five joints is stably maintained above 0.75. The strength degradation trend of cast-in-site joints and new assembled joints show similar patterns, suggesting that the novel type of assembled joints possesses an excellent resistance to damage. However, the joint XJ-1 displays the most stable strength degradation. The new ZP-2 joint’s strength experiences a sudden drop due to a large concrete wedge collapsing.
5. Finite Element Analysis and Shear Capacity Checking Calculation
To enable a comprehensive examination of the varying parameter influences on the performance of the newly-assembled joints and to provide substantial data for the joint bearing capacity’s theoretical validation, a finite element simulation and analysis of these joints were implemented based on the aforementioned tests.
5.1. Finite Element Modelling
Leveraging the capabilities of the finite element analysis software, namely ABAQUS, we established four separate models of newly constructed concrete beam-column joints and a single model of a joint created in-situ, these models were constructed in accordance with the test sizes.
The three-dimensional solid element responsible for concrete, C3D8R (linear reduced integration element), was utilized. The simulation and analysis of the concrete material was performed using the Concrete Damage Plasticity model (CDP model).
During the elastic stress phase of concrete, the mechanical aspects of material were directly illustrated by the initial elastic modulus through the CDP model. However, upon the concrete reaching the material damage phase, the computational expression of the elastic modulus is modified as follows:
where E signifies the elastic modulus; E0 represents the initial elastic modulus; d signifies the plastic damage factor, which varies from 0 to 1. Here, 0 implies no material damage to the concrete, and 1 denotes complete damage, signifying no remaining strength.
The expression for the uniaxial stress-strain curve of concrete under tensile and compressive conditions is as follows:
where
,
are the tensile and compressive stress respectively;
,
represent the tensile and compressive strain;
and
are the tensile plastic strain and compressive plastic strain of concrete respectively;
and
are the damage evolution coefficients for concrete under uniaxial tension and compression.
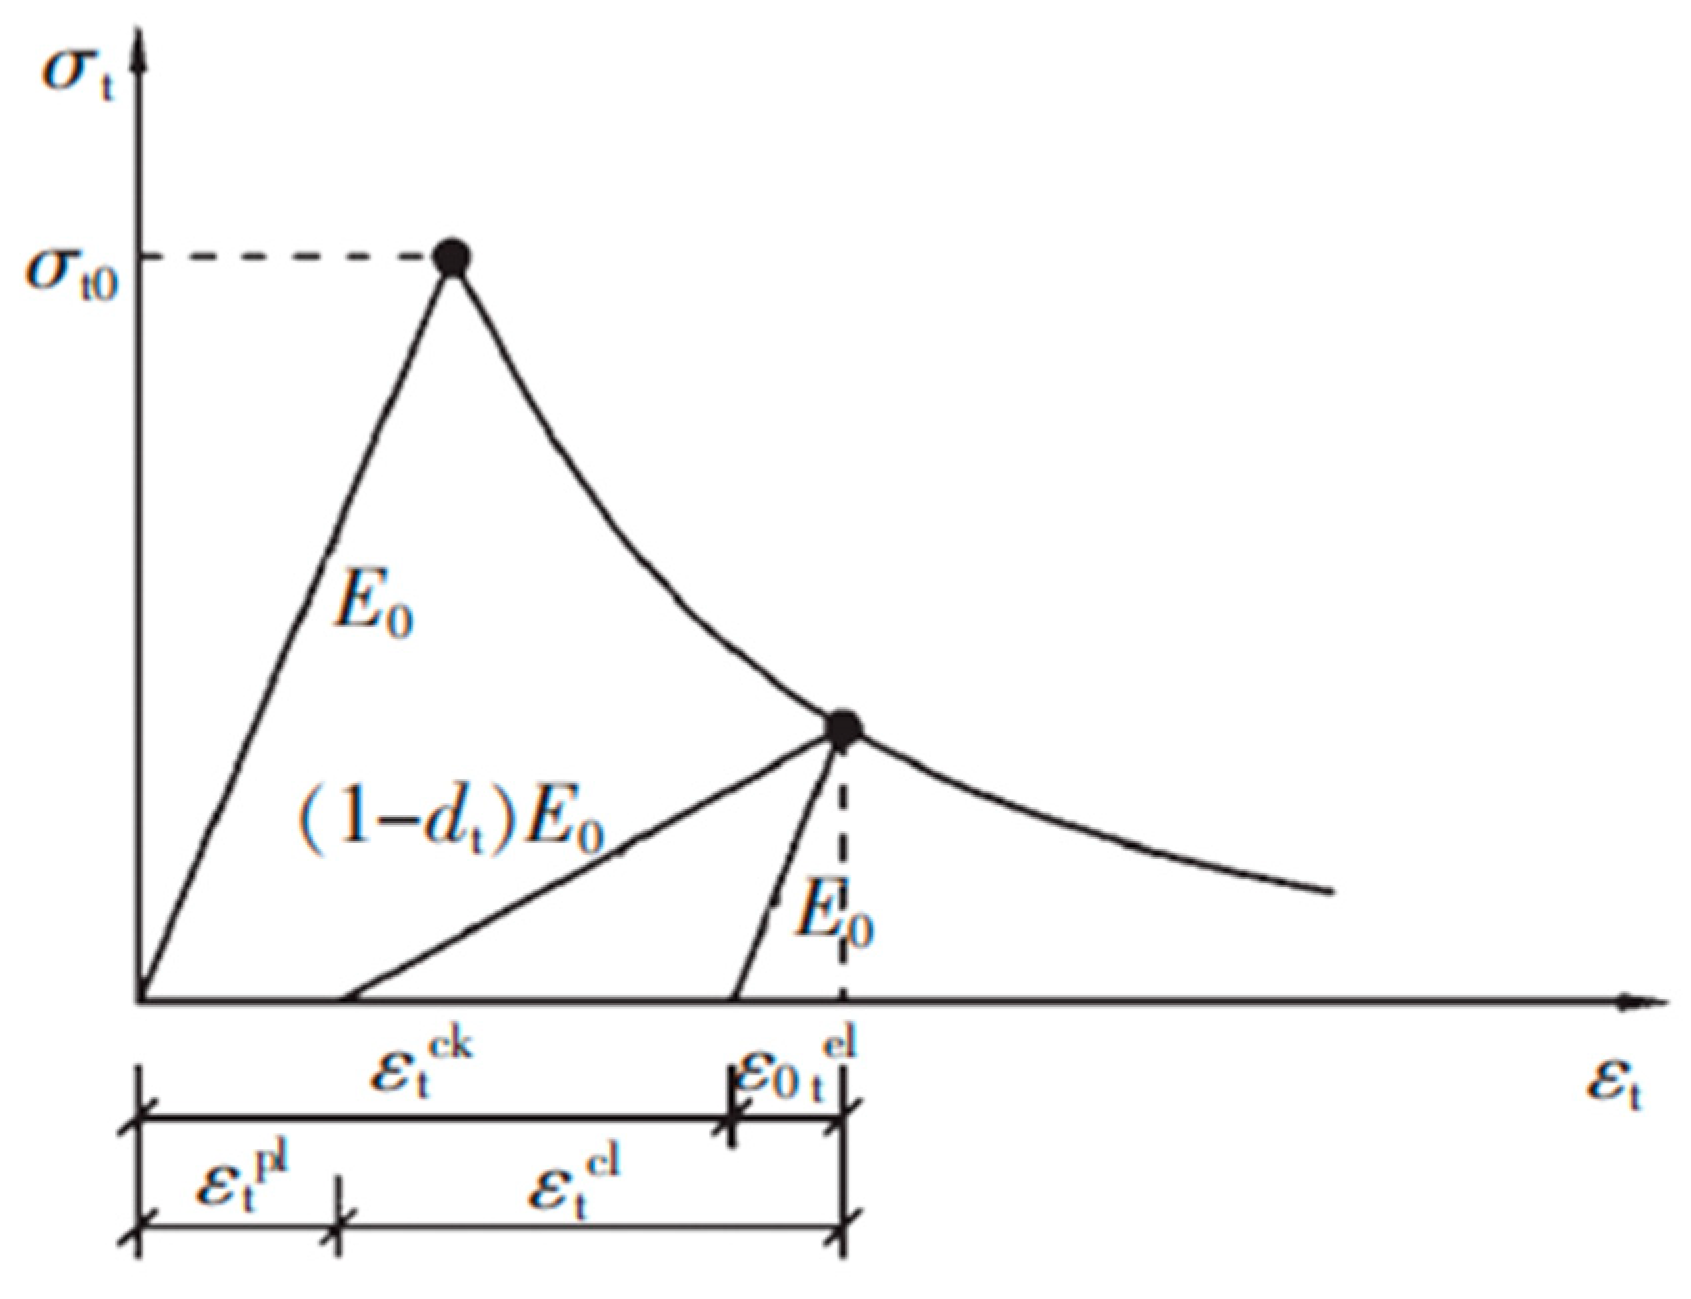
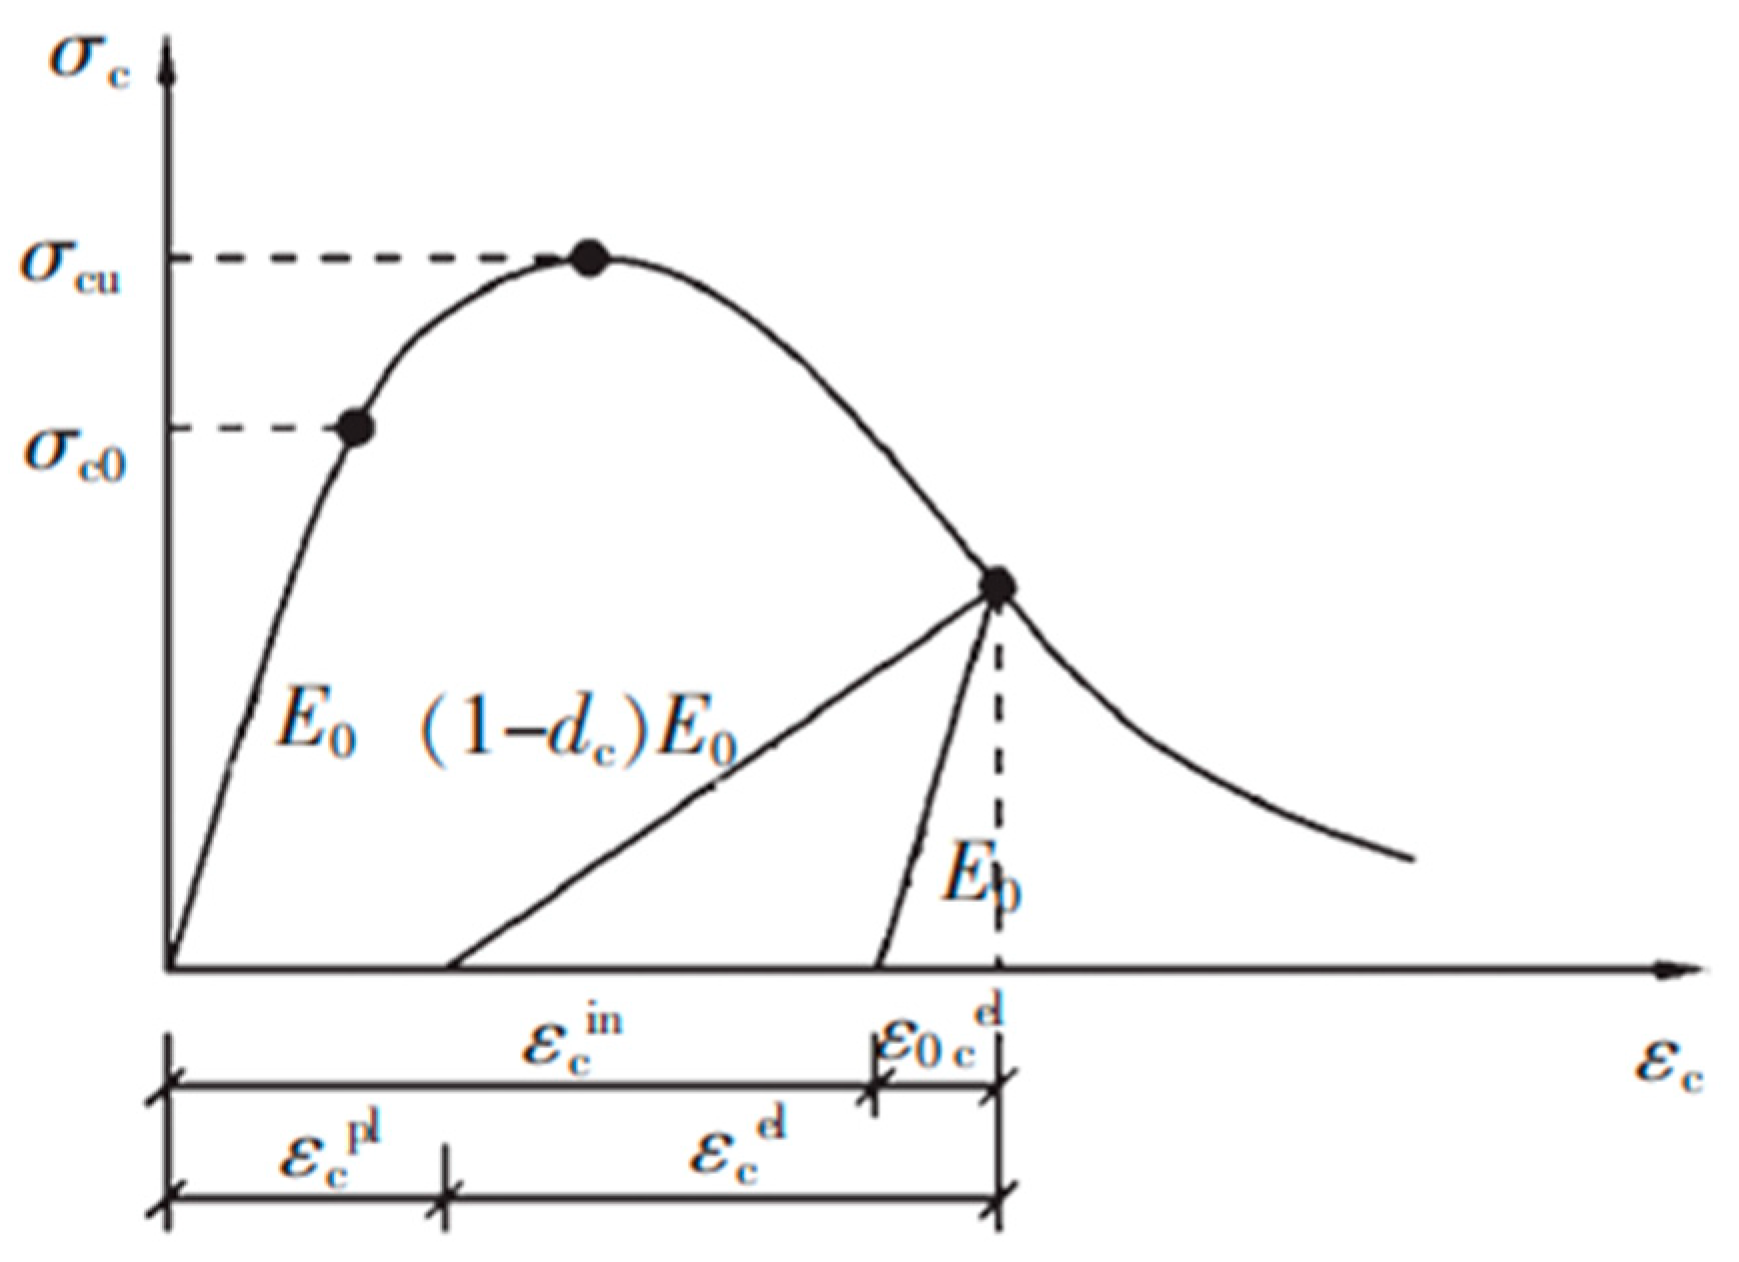
In the CDP model, the transformation of the yield surface or failure surface of the concrete material is chiefly regulated by the sum of two hardening variables. The stress-strain curves of concrete under uniaxial tension and compression along with the corresponding diagrams of cracking strain and inelastic strain are illustrated in
Figure 11 and
Figure 12 respectively. Different damage factors describe the stiffness modification of concrete in uniaxial tension and compression. Refer to
Table 6 for the concrete material parameters.
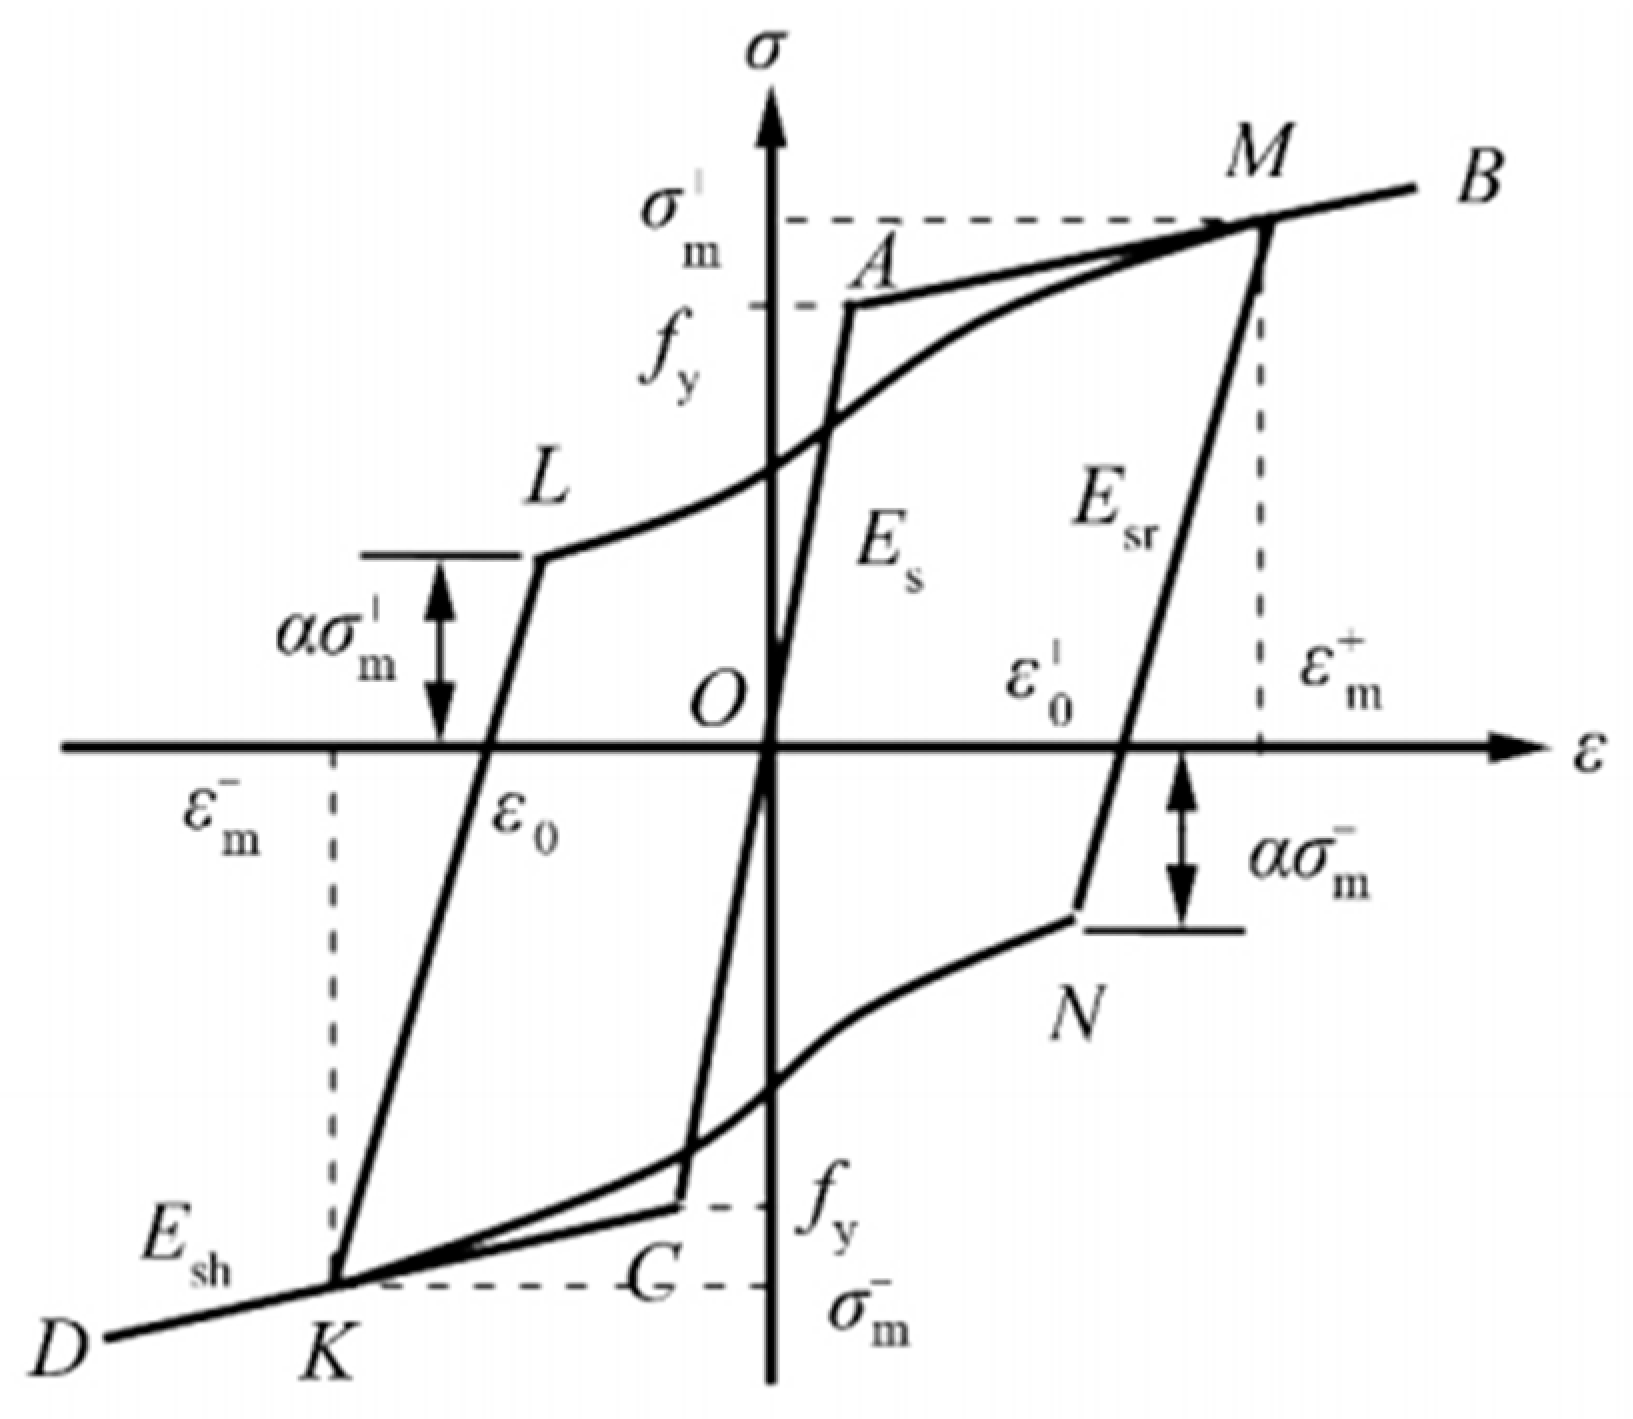
In the model, the three-dimensional, two-node linear truss element T3D2, is utilized for reinforcement. The constitutive model for steel bar, incorporated within, is a modified update of the double-fold steel bar constitutive model developed by Professor Fang Zihu of Shenzhen University. This model, as displayed in
Figure 13, accounts for the bond-slip effect between the steel bar and concrete and considers the influence exerted by concrete materials on the steel bar. It is, therefore, an appropriate model to apply for the hysteresis analysis of the structure.
Unloading stiffness calculation formula:
Load path formula:
where
;
;
is the strain corresponding to point L or point N in
Figure 13; α is the influence coefficient of hysteresis energy consumption.
Finally, it is essential to take into account the elastic modulus, Poisson’s ratio, yield strength, ultimate strength, and associated parameters of reinforced concrete. These should be in accordance with the norms and measured values. Their specific values are exhibited in
Table 7.
In the FE model, three-dimensional solid elements are utilized for the components such as beam, column, and steel pipe. The composite beam’s horizontal joint surface goes through a process of artificial roughening during the construction phase, complemented with a sound stirrup configuration, allowing for a bond slip-free horizontal composite surface. This surface would then necessitate the application of the “Tie” binding constraint. The interface relationship at the intersection of column nodes and core areas is established by setting a surface-to-surface contact. To designate contact attributes, one must separate the consideration of tangential behavior and normal behavior. For the tangential behavior, apply the “penalty” friction formula. Given that the surfaces of the upper and lower columns are irregular, the friction coefficient can be set at 1. Furthermore, normal behavior can be set to “hard contact,” implying unrestricted force transmission in the normal direction. As for the vertical overlapping surface at the beam and column intersection point, an approximate “concrete softening” method is employed. This signifies that while the compressive strength of the concrete remains the same at the overlapping surface, the tensile strength will decrease to roughly 65%~85% of the original value. Compared to the horizontal laminate surface, the vertical one tends to bear not only shear stress but also more significant tensile stress. When it comes to the vertical composite joints of new and old concrete, compared to cast-in-place joints, they exhibit weaker bonding performance alongside lower tensile strength. However, their compressive strength mostly remains the same. Using the “concrete softening” method thus seems more feasible.
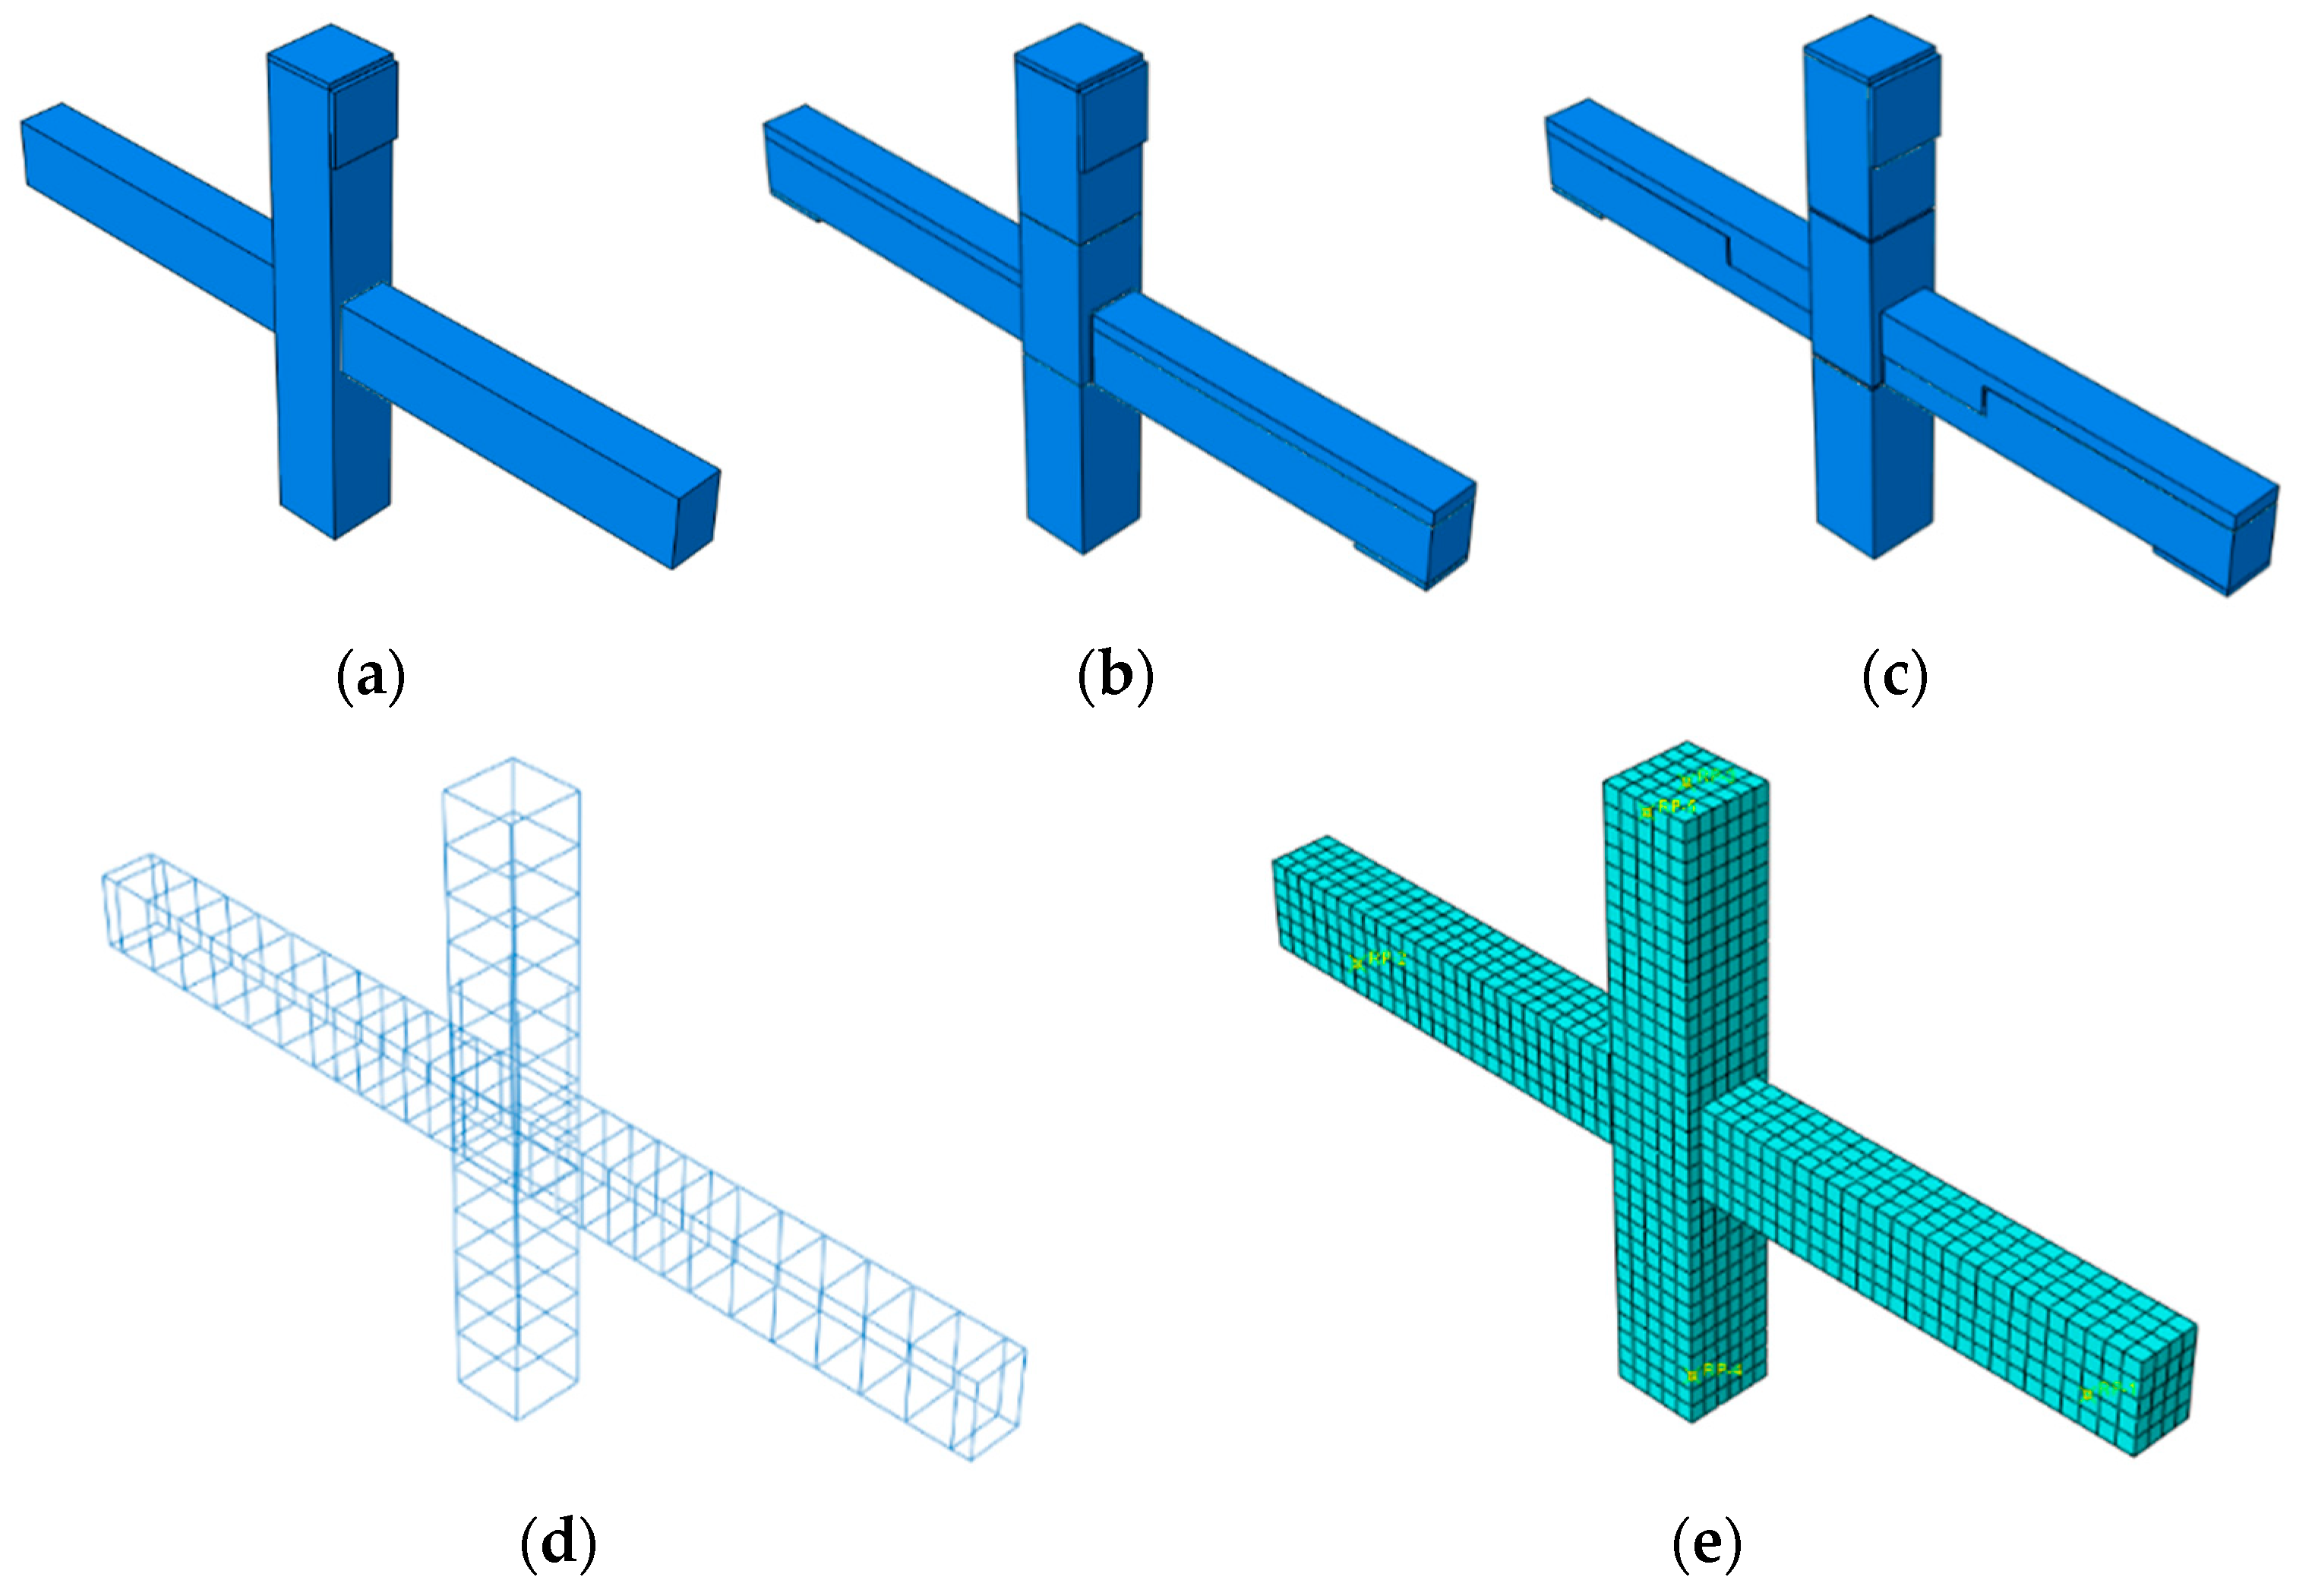
Use of the truss element for steel bars is common, and the standard mesh size stands at 50mm.
Figure 14 gives a representation of the joint models and mesh division. The beam-column connections’ boundary conditions in the finite element simulation need to align with those established in the experiment.
5.2. Stress Cloud Diagram and Hysteresis Curve Analysis
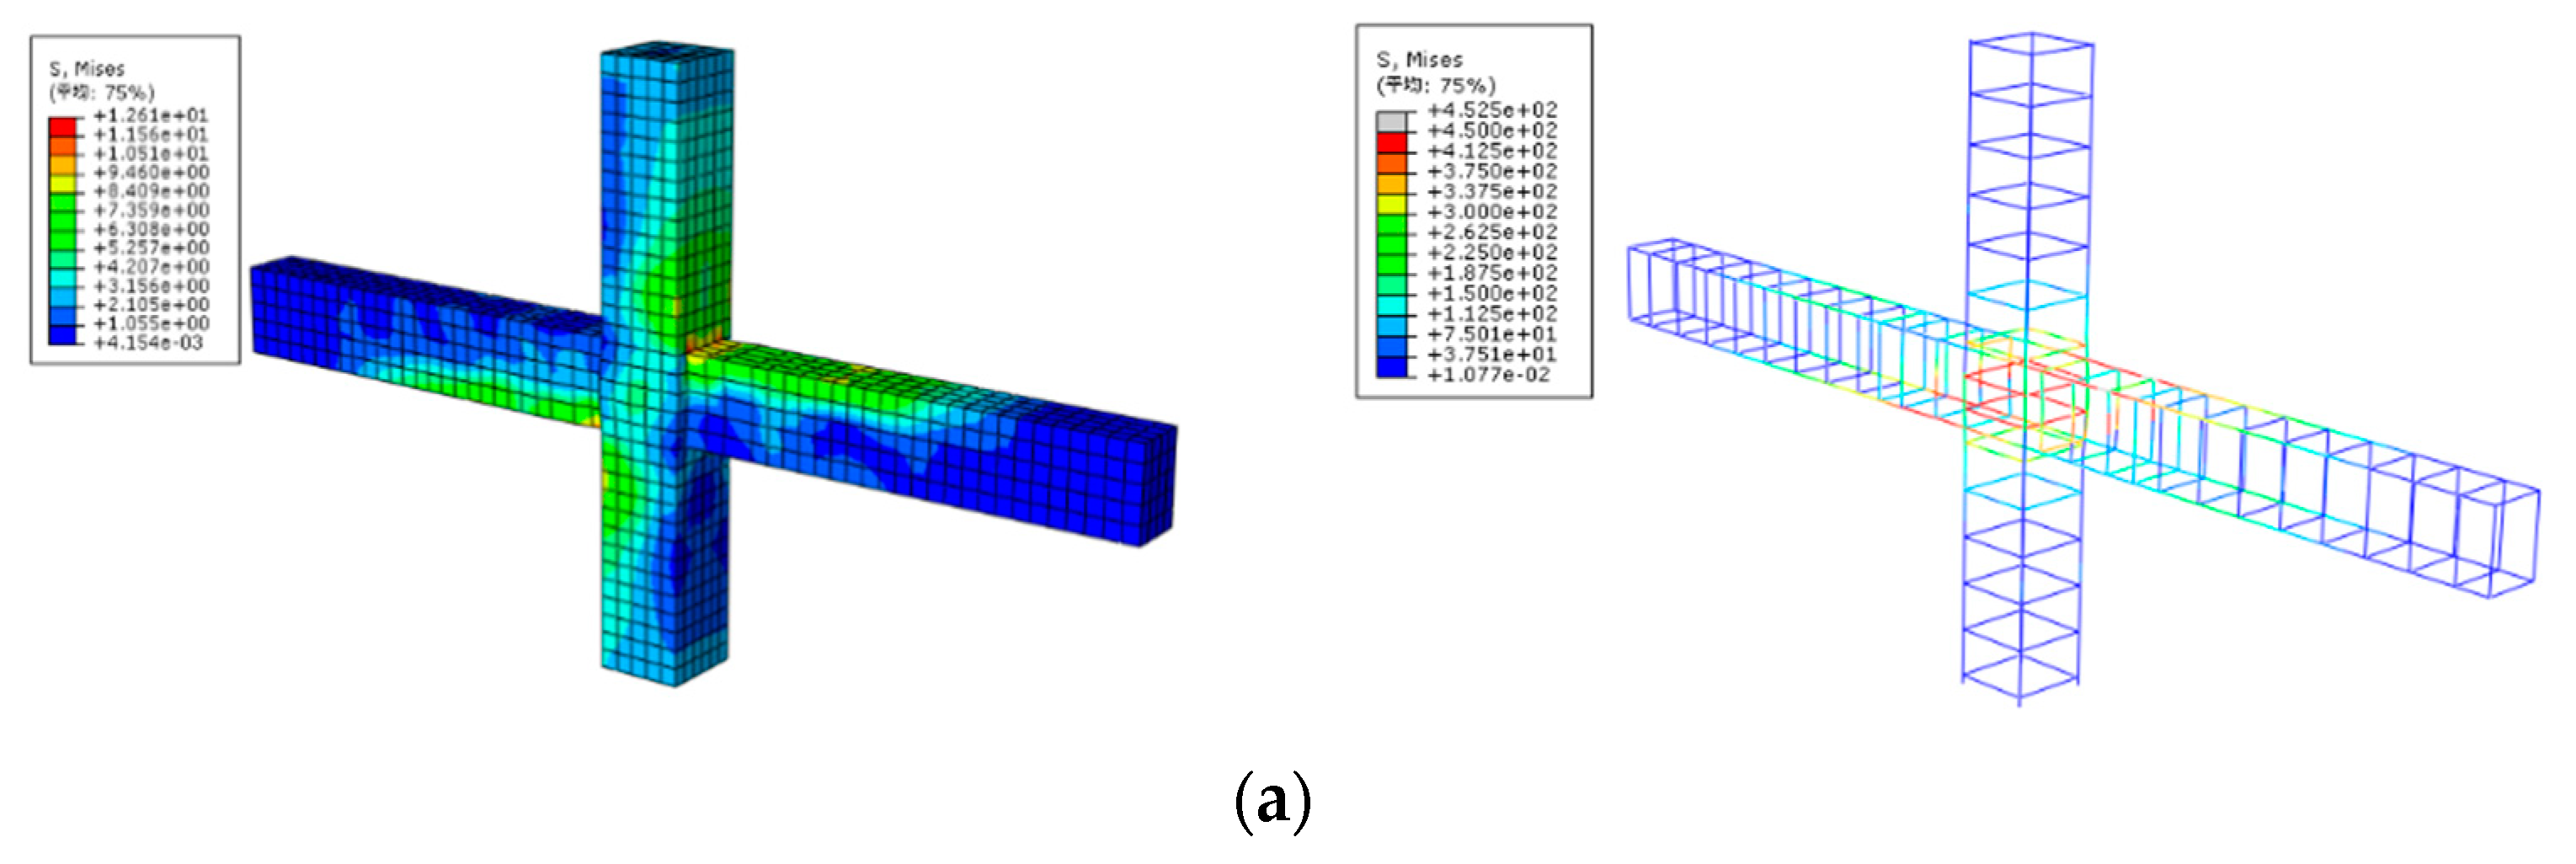
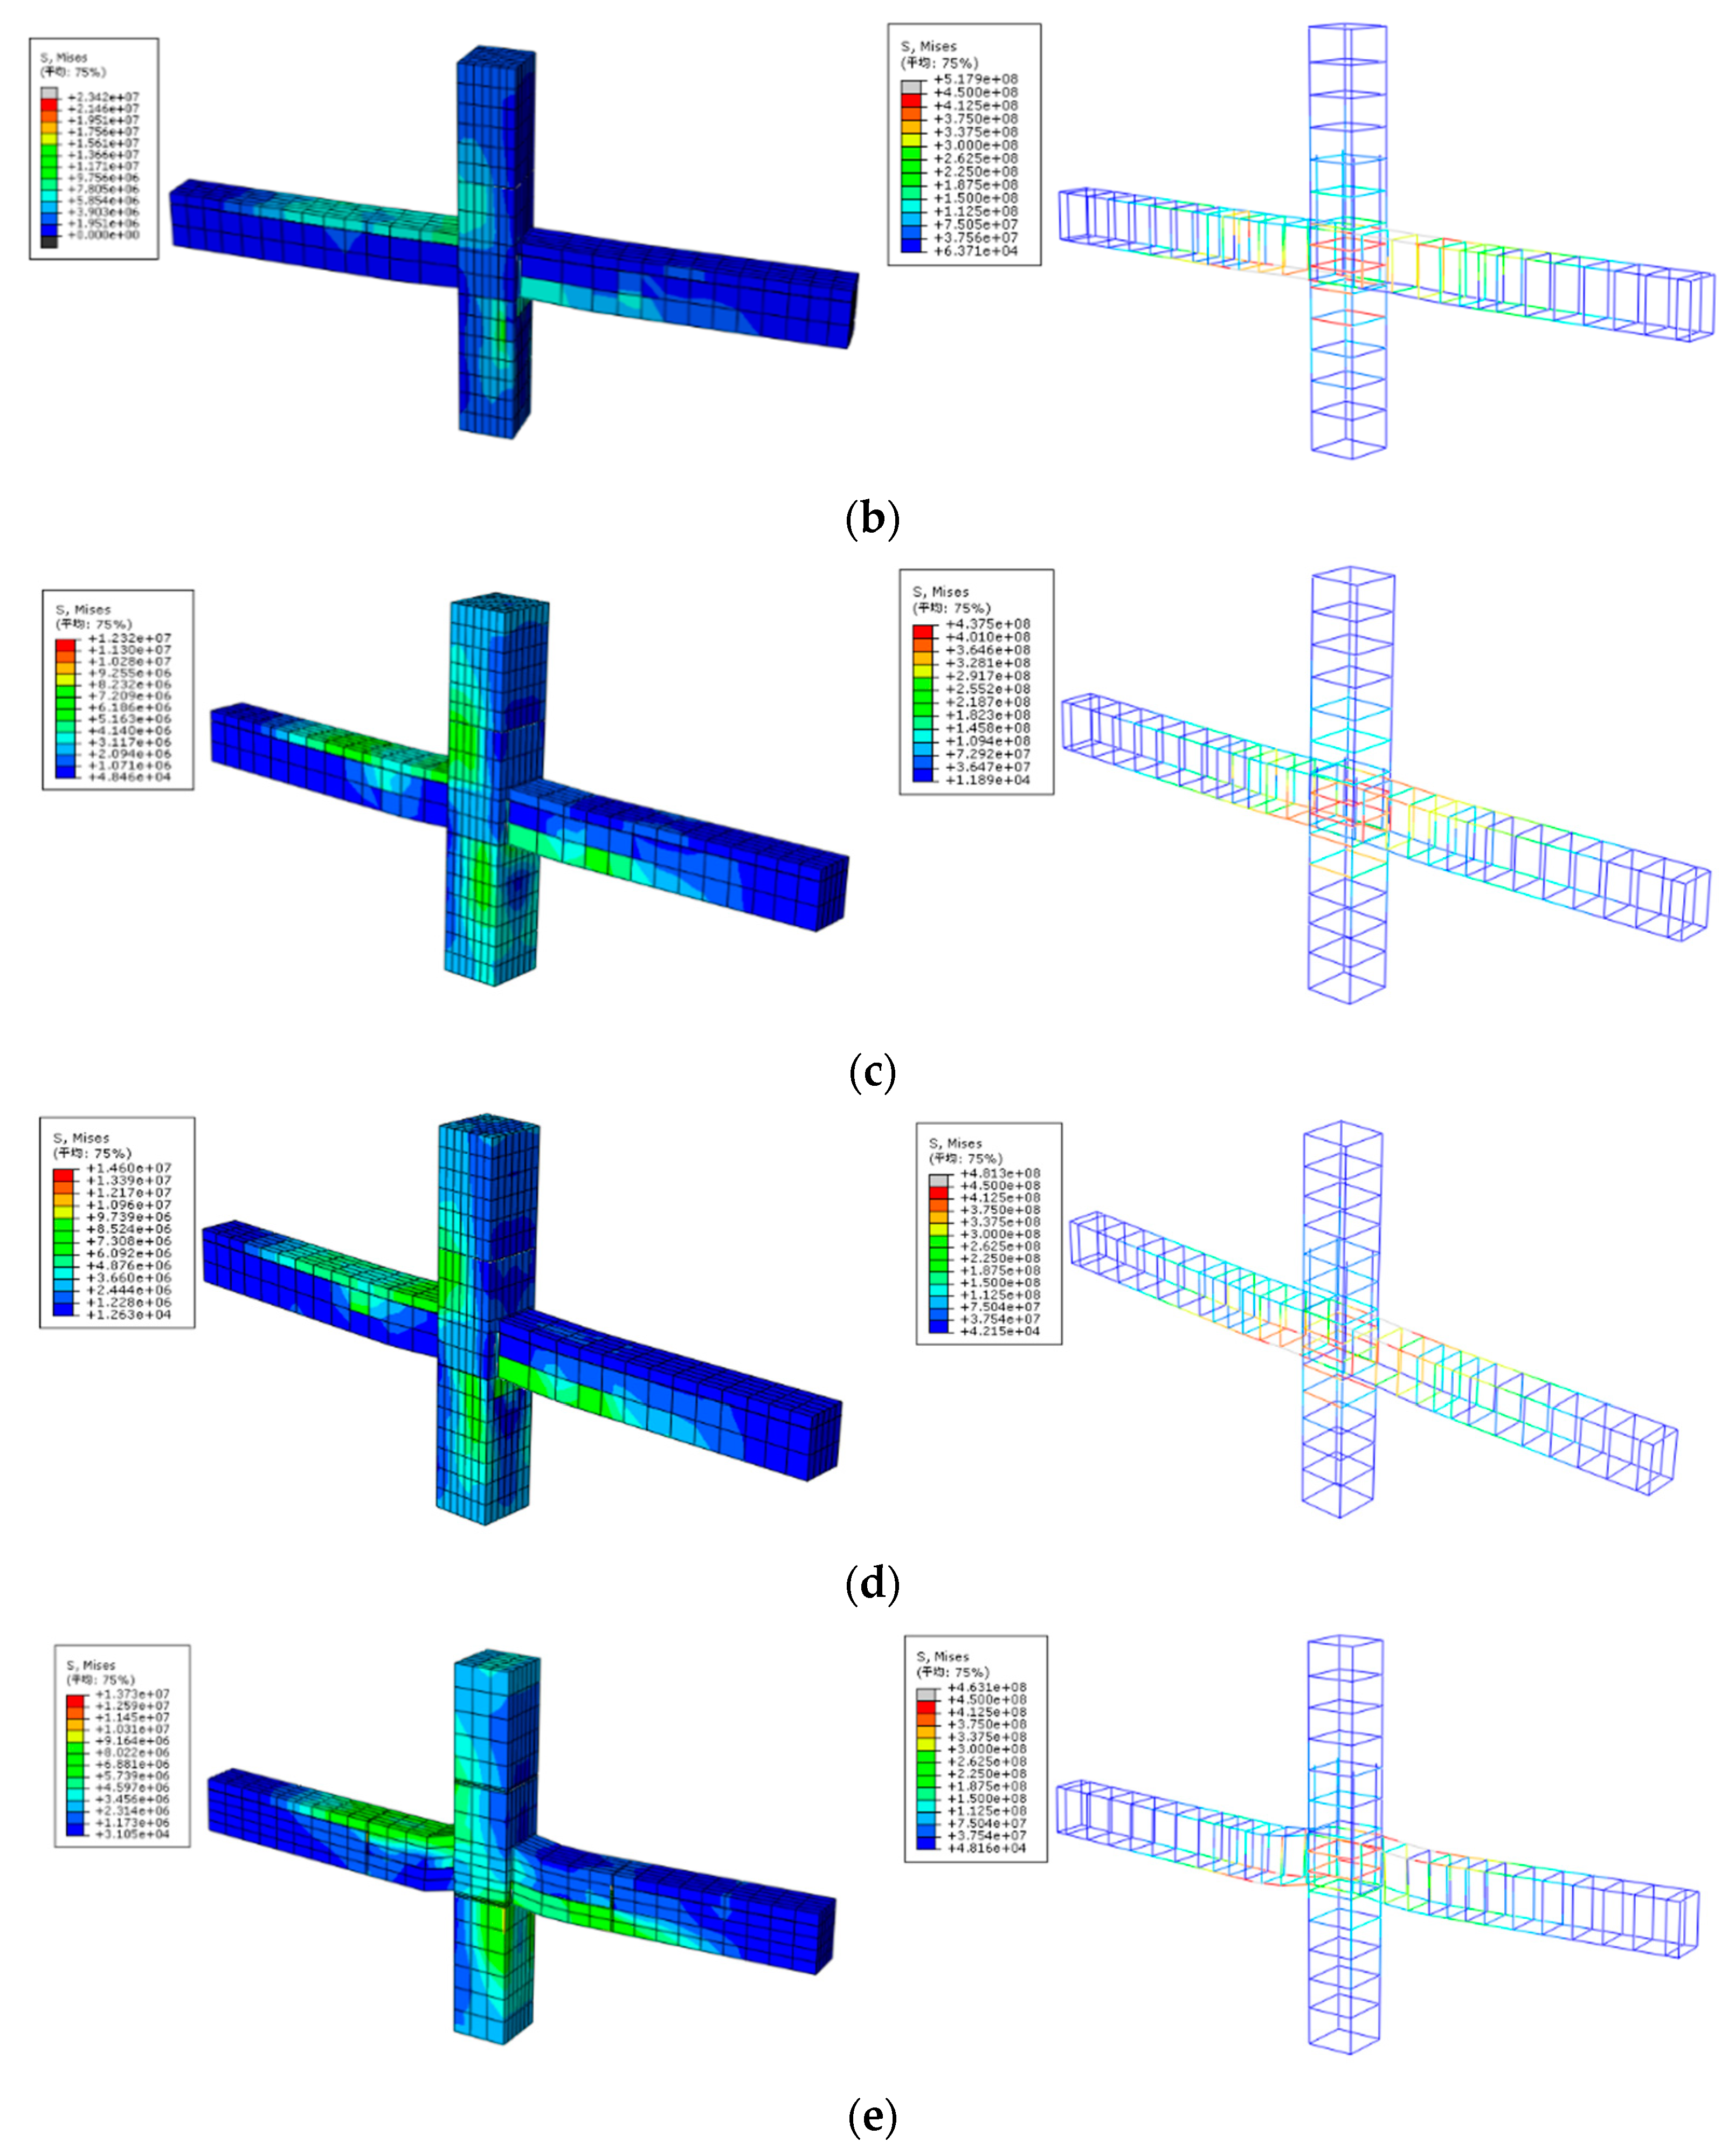
The size of the preassembled unit cast in place uniformly resemble each other. The stress cloud for each joint model is available in
Figure 15. The findings reveal that the longitudinal bars at the beam end tend to yield before the joint area’s stirrups, which aligns with the real test results. The joint area’s stirrups in the ZP-2 specimen yield before the longitudinal bars at the beam end, aligning yet again with the experimental results.
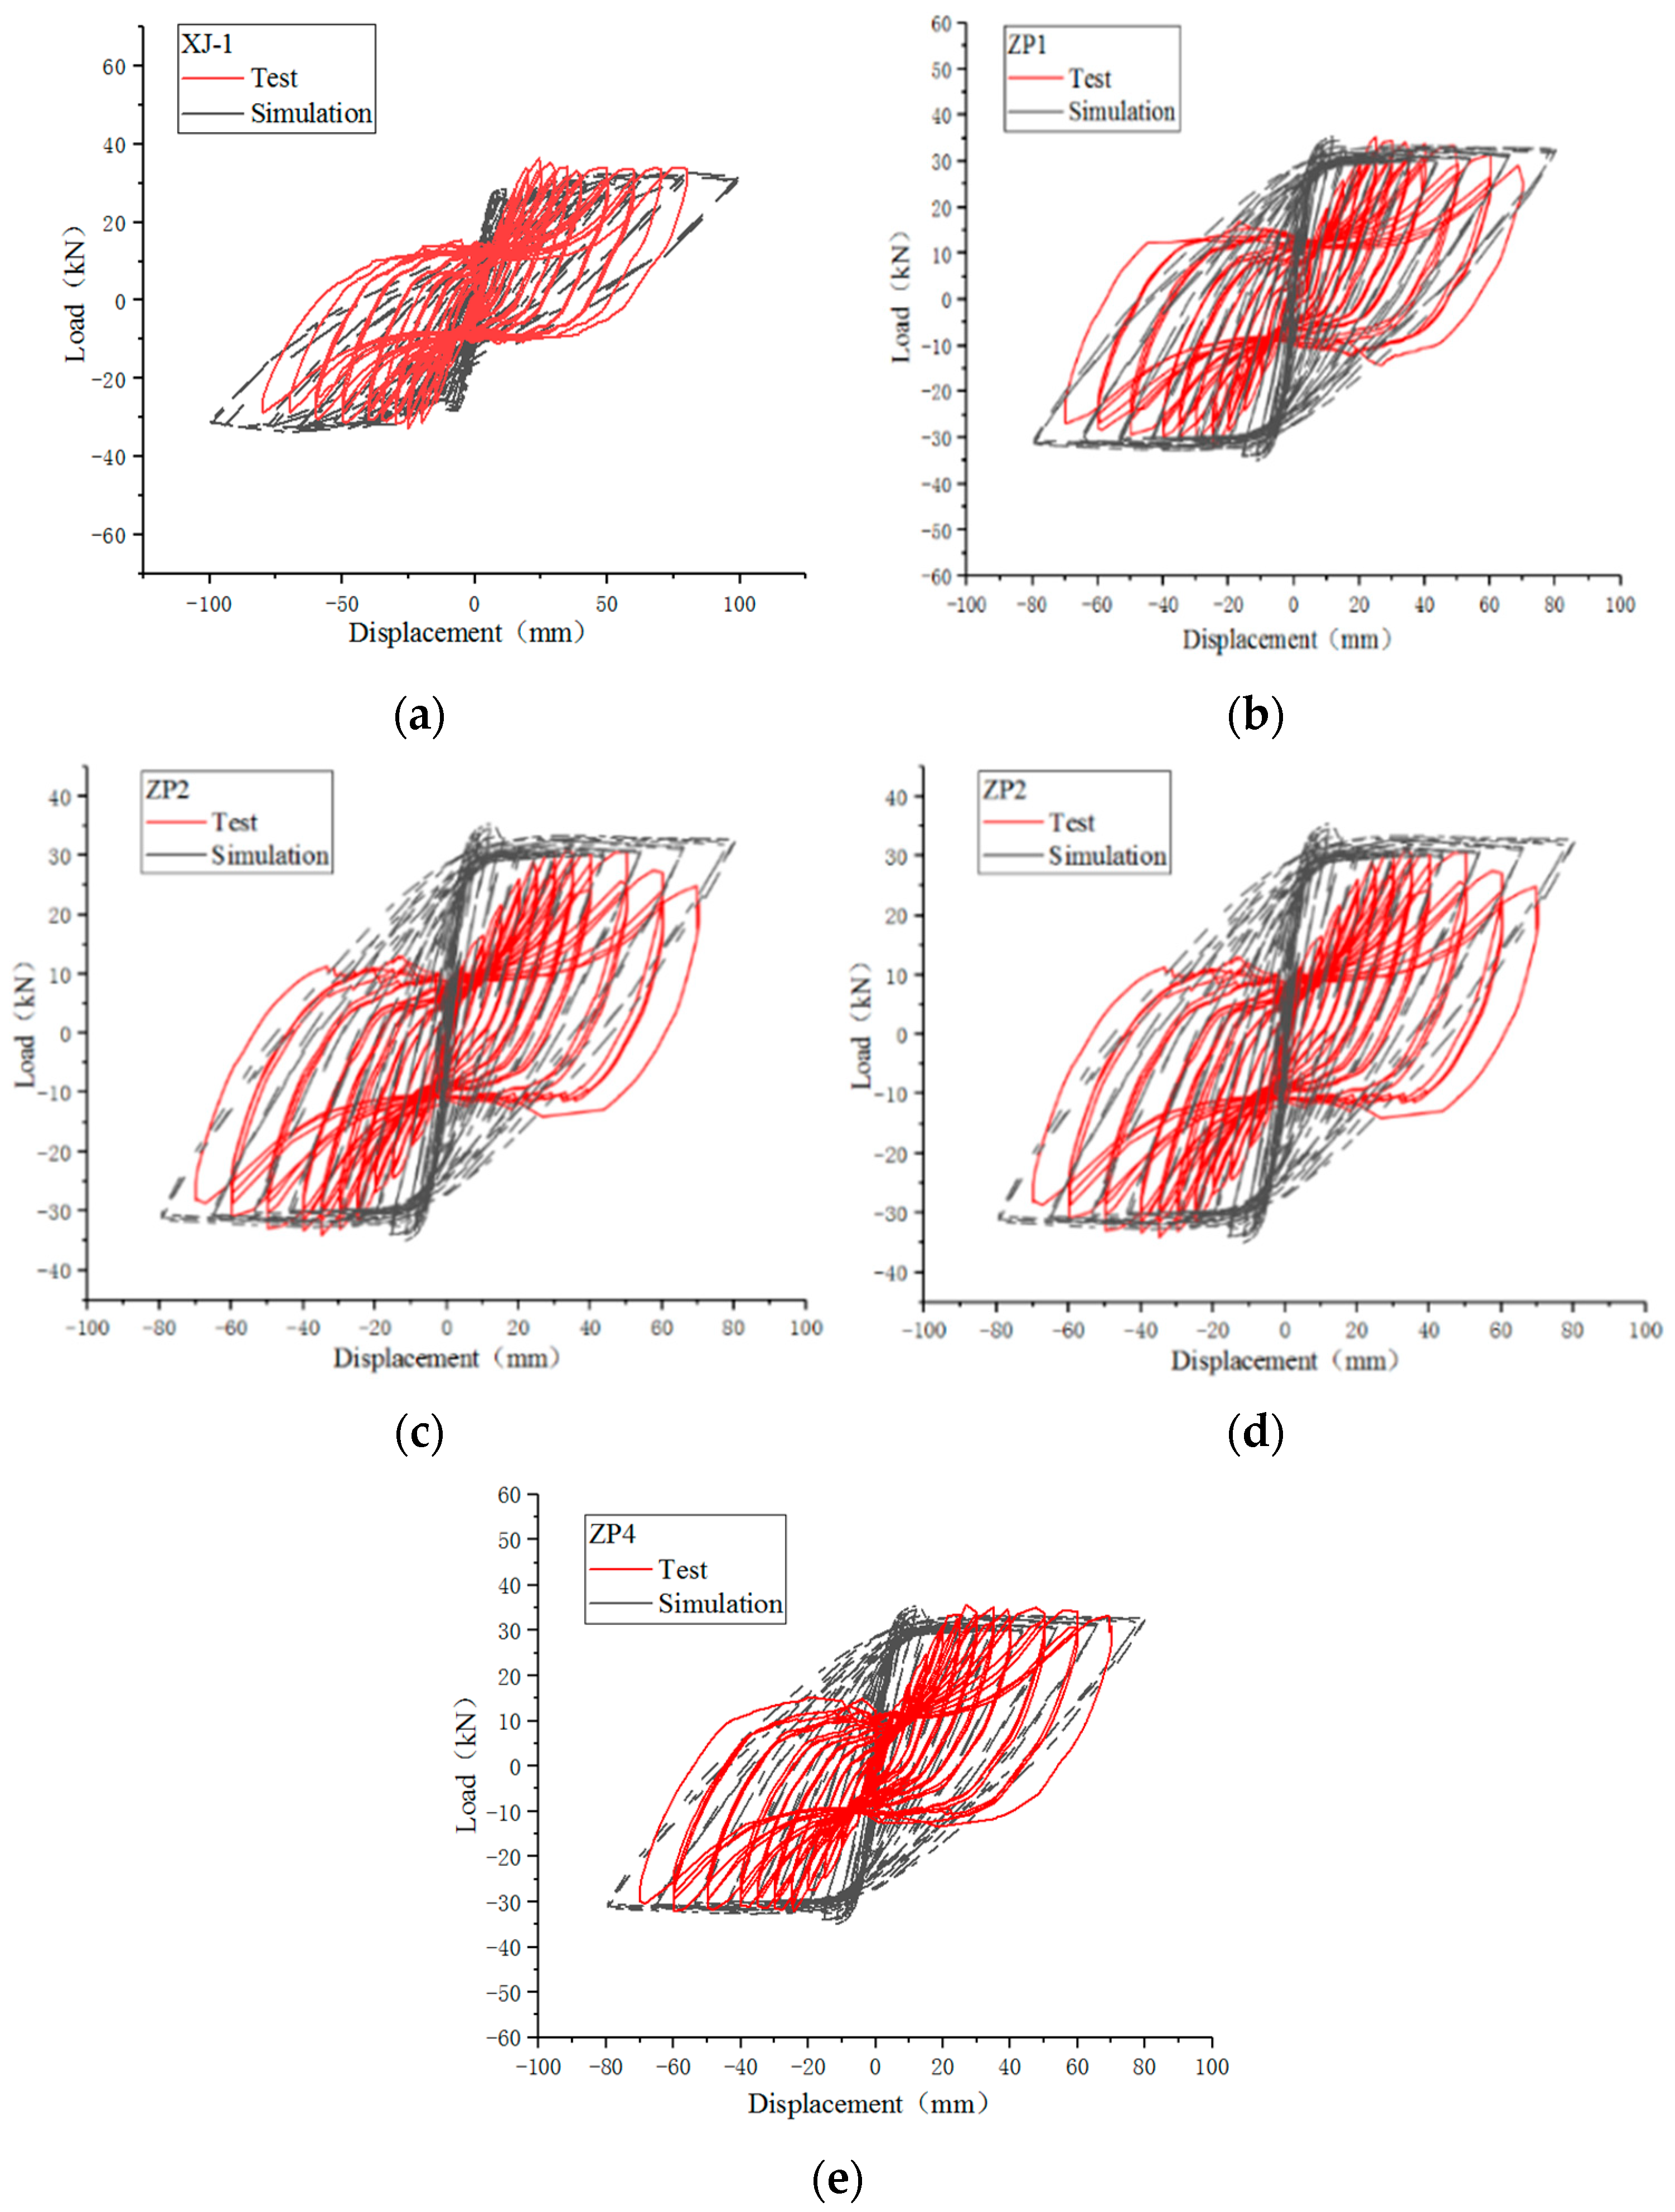
Table 8 clearly shows that the overall hysteresis curve trend from the specimen, as shown in the finite element simulation, is substantially synonymous with the actual test. The peak points for each load also mostly align with the testing data.
As
Figure 16 demonstrates, when contrasted with the finite element simulation’s hysteresis curve, the actual test’s hysteresis curve displayed a broader slip section during the late loading phase, and an evident pinch phenomenon. This is largely because of the challenges in completely simulating the bond-slip action between steel bars and concrete using ABAQUS, which results in a fuller hysteresis curve. At the loading’s initial phase, the displacement changes more quickly than the strain due to the gap between the loading device and the joint specimen. Since the finite element simulation performs its analysis in an ideal state, its hysteresis curve’s initial stiffness is significantly larger than that of the experimental hysteresis curve.
5.3. Parameter Analysis and Shear Capacity Checking Calculation
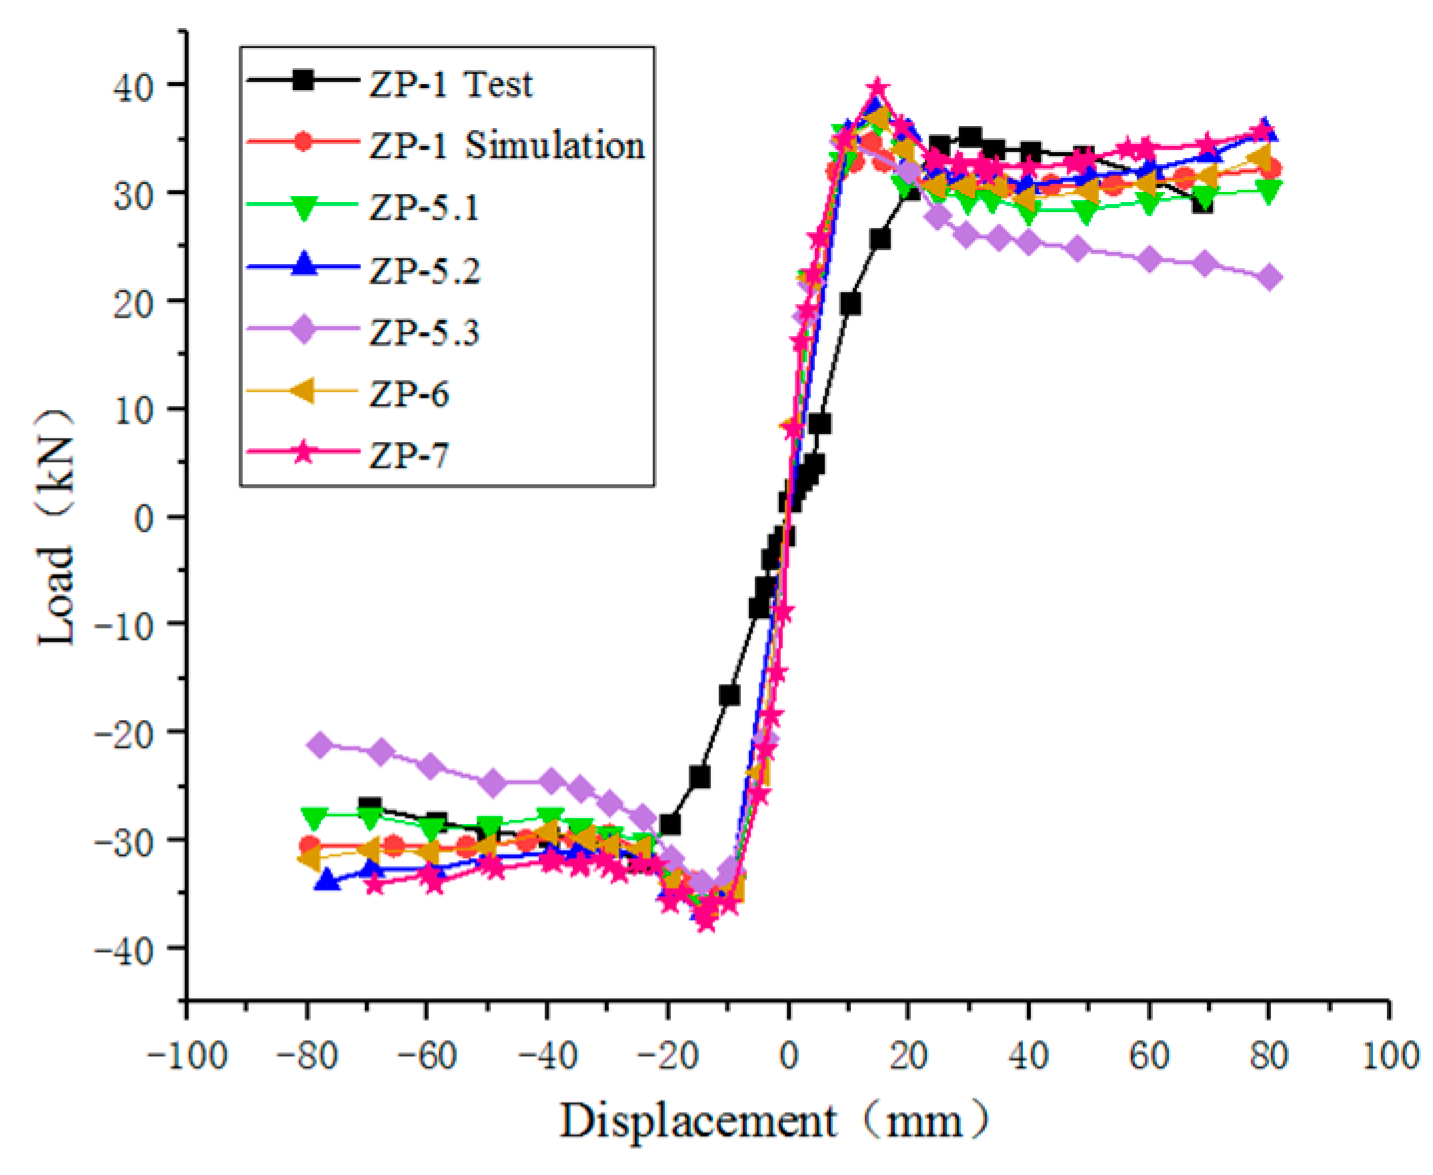
To investigate the impact of varying parameters on the seismic performance of joints, five new finite element models of assembled concrete with distinct axial compression ratios, post-cast concrete strength of joints, and steel tube diameters were developed. In these models, the strength grade of post-cast concrete is increased to C40, and the steel pipe specification is changed to an outer diameter of 60mm and a wall thickness of 3.5mm. These models are respectively designated as ZP-5.1, ZP-5.2, ZP-5.3, ZP-6, and ZP-7. Their specific parameters are articulated in
Table 9.
Investigations were conducted into the effects of different axial compression ratios and the increase of concrete strength in the joint area on the initial stiffness, ultimate load-bearing capacity, and ductility of the joint specimens. The findings are represented through a skeleton curve as depicted in
Figure 17.
Analysis of the skeleton curves in
Figure 17 shows that the skeleton curves of ZP-5.1, ZP-5.2, ZP-5.3, and ZP-6 are fundamentally akin, each featuring an “S” shape. The initial stiffness offered by the numerical simulation results is noticeably higher than those yielded from the test results. Moreover, the overall bearing capacity observed in the ZP-5.1 joint is marginally superior to that from the ZP-1 simulation. Conversely, the ultimate load capacity from the ZP-5.2 joint is almost identical to the ZP-1 simulation, albeit with the former declining at a faster rate and demonstrably poor ductility. The initial stiffness and ultimate load capacity of the ZP-4 joint are in line with the simulated results of the ZP-1; however, the load-bearing potency of the ZP-4 joint experiences a significant decline after achieving peak load, which is considerably lower than the simulated results of ZP-1 and has limited ductility. After increasing the concrete strength of the ZP-6 joint to C40, the initial stiffness, ultimate load-bearing capacity, and ductility essentially match those of the ZP-1 simulation results. The results for ZP-7 show improved initial stiffness, overall load-bearing capacity, and ductility.
The analysis suggests that, within a specific range, axial force is beneficial for shear resistance, aiding the advancement of initial stiffness and ultimate load-bearing capacity. However, when the axial force surpasses a certain limitation, it diminishes the joint’s ductility. Enhancements to initial stiffness, ultimate load-bearing capacity, and ductility properties are achieved by augmenting the strength grade of the concrete in the joint’s post-pouring region and incorporating steel piping into the column.
As per the Chinese GB50010 Concrete Structures Design Code (hereinafter referred to as “Concrete code”) [
30], the shear capacity of reinforced concrete joints is determined by the joint core concrete and stirrups. Nevertheless, introducing an in-built steel pipe in the new type of joint significantly enhances the shear load-bearing capacity. Consequently, the calculation of the new connection’s shear capacity is proposed as follows:
where
is 0.85 when calculating the inclined sectional bearing capacity of frame joints;
is 1.50 for on-site cast floor slabs, the recommended distribution, however, for a 9-degree fortification intensity, it is 1.25. For other conditions, the value is 1.00;
refers to the total cross-sectional area of each leg of the stirrup within the effective checking width range of the core area in the same cross-sectional direction;
is design value of tensile strength for transverse reinforcement;
is distance between the resultant point of reinforcement in longitudinal compression of the beam and the section’s near edge;
bj,
hj is effective check width and height of the core area’s cross-section for frame joints;
hb0, bc is effective height and width for the beam section;
N is design value of axial force corresponding to the bottom of the upper column of the joint, considering the seismic combined shear force’s design value; when in compression, take the lower design value of axial pressure, and it should be less than 0.5fcbchc. When in tension, the value is zero.
Based on test data in
Table 3, the joint core area’s shear force value can be obtained using Equation (10) from the Concrete code [
30], as shown in
Table 10.
where h
b is beam section; h
b′ is core area height of the joint; ΣM
b is sum of bending moments at the left and right beam ends of the joint; H
b is distance between the bending points of the left and right beams; H
c is distance between the bending points of the upper and lower columns.
A comparison and analysis of the shear capacity from theoretical calculation, experimental study, and finite element simulation show that the results in
Table 10 are relatively similar. The error in shear capacity results is less than 15%, indicating that the shear capacity equation proposed by the newly assembled joint is reasonable and meets design and application requirements.
According to the study, to maximize the seismic performance of the new assembly joints, the following requirements should be met. The experimental results show that L-shaped reinforced fabricated joints perform well, and performance improves with increased pouring area; therefore, it is recommended that precast beam ends be L-shaped. As per Chinese specifications, the value should not be less than 15d to ensure performance. In design, higher concrete strength in the back pouring area leads to better joint performance. Therefore, it is recommended to use high-strength concrete for prefabrication, and the strength grade should be one level higher than the frame beams and columns.
6. Conclusions
This study explores the limitations of conventional integrated joint assemblies and introduces a fresh, assembled concrete beam-column L-shaped reinforced joint model. The research encompasses the conceptualization and production of one cast-in-place joint and four assembled joint exemplars, as well as low-cycle cyclic loading tests to investigate the mechanical mechanisms, failure modes, and seismic performance of these joints. A nonlinear analysis of the joints is executed using ABAQUS, with simulation and test results compared. The model’s accuracy is verified, and a parametric analysis is conducted, resulting in a formula for calculating shear capacity. Key conclusions include:
Cast-in-place joint XJ-1 and newly assembled joints ZP-1, ZP-3, and ZP-4 exhibit bending failures at beam ends, complying with the seismic design requirements of “strong joints and weak members.” Joint ZP-2 uses short L-shaped reinforcement, effectively reducing the vertical force component while increasing the concrete load, leading to shear failure in the joint area.
The newly assembled joints demonstrate excellent energy dissipation, damage resistance, and ductility. The stiffness degradation coefficient is above 0.75, indicating impressive damage resistance within the cast-in-place joints.
The study reveals that implementing measures such as increasing the area of post-cast concrete in the joint, extending the length of L-shaped reinforcement, and enhancing the concrete strength in the composite beam area can effectively improve the bonding force between the post-cast and precast members, subsequently boosting the joint’s ductility, energy consumption, and load-bearing capacity. Pre-placing steel tubes in columns can significantly enhance the initial stiffness of joints.
A comparative analysis confirms the strong alignment of the theoretical calculations with experimentally and numerically derived shear capacity values. The proposed formula for joint shear capacity can meet design and application demands, and the newly assembled joint’s shear capacity can be calculated accordingly.
Beam-column joints represent a pivotal research focus for seismic analysis of assembled structures. The paper proposes a novel assembled concrete beam-column L-shaped reinforced joint and preliminarily investigates its seismic performance via pseudo-static testing and finite element simulation. For the successful development and application of this new joint model, the following considerations should be prioritized:
Although newly assembled joints show promising feasibility for the assembled building industry by satisfying requirements for simple structure, ease of construction, and structural integrity, their performance is influenced by various factors, such as L-shaped reinforcement length, post-cast concrete area in the joints, and composite beam area concrete strength. These factors warrant close attention during practical applications.
The test specimens included in this study utilized a 1/3 scaled-down model to abide by actual testing equipment and site constraints. Assessing the seismic performance of four assembled joint specimens provided preliminary insights; however, investigations into other specimens featuring more complex reinforcement and larger dimensions are necessary for a comprehensive understanding.
Owing to the minor discrepancies between the finite element simulation outcomes and test results, we have endeavored to rectify these deviations. The ultimate finite element simulation findings show excellent agreement with the test outcomes, effectively simulating the maximum displacement and maximum load-bearing capacity. This considerably advances the scope of the research. Nevertheless, the issue of concrete material closure in finite element simulations remains unresolved, representing a longstanding challenge in the field of finite element analysis. In-depth investigations are necessary for future development and progress.
In this study, we reference the existing design formula for preassembled joints outlined in the China Code and put forth a novel design formula to determine joint shear capacities. Comparing the theoretical calculations and analysis outcomes against experimental and finite element simulation results reveals a strong correlation among them. Although the proposed load-bearing capacity formula offers significant reference value and practical applicability to some extent, its use in other joint configurations with varying parameters warrants further examination using alternative formulae.
In summary, the innovative assembled L-shaped steel bar connection joints demonstrate practical feasibility, and initial research findings have been achieved. By employing analytical, test, and simulation methods, the assembled joint performance was assessed, verifying that they meet the necessary requirements and hold promising development potential.
Author Contributions
Conceptualization, M. L., T.Y. and M.L.; Methodology, M.L., T.Y. and C.Y.; Software, M.L. and T.Y.; Validation, M.L. and T.Y.; Formal analysis, M.L. and T.Y.; Investigation, M.L. and T.Y.; Resources, M.L., T.Y., C.Y. and Y.P.; Data curation, M.L., T.Y., C.Y. and M.L.; Writing—original draft, M.L. and T.Y.; Funding acquisition, T.Y. and Y.P. All authors have read and agreed to the published version of the manuscript.
Funding
This research was funded by [Natural Science Foundation of Shandong Province] grant number [ZR202102180176].
Data Availability Statement
The data presented in this study are available on request from the corresponding author. The dates are not publicly available due to [the privacy of the data].
Acknowledgments
This research was supported by Natural Science Foundation of Shandong Province, China (Grant No. ZR202102180176) and Ningbo Jiangong Engineering Group Co., Ltd. The opinions and conclusions expressed in this paper are solely those of the authors.
Conflicts of Interest
The authors declare no conflict of interest.
References
- Jiang, Q.Q. Review on the development of prefabricated concrete architecture at home and abroad. Build. Techno. 2010, 41, 1074–1077. [Google Scholar]
- Committee, A. 31895/318R95: Building Code Requirements for Structural Concrete & Commentary; ACI.
- Standard, A. Concrete structures. AS-3600. Sydney: Standards Australia International 2001.
- Precast, P.C.I. Architectural precast concrete; Precast/Prestressed Concrete Institute, 1989.
- Wu, C.L.; Liu, J.M.; Zhao, K.C. Research progress on seismic performance of assembled concrete frame joints. Concrete. 2019, 130–133. [Google Scholar]
- Performance of Precast Concrete Building Structures. Earthq. Spectra 2012, 28, 349–384. [CrossRef]
- Ghosh, S.K.; Cleland, N.M. Performance of precast concrete building structures. Earthq. Spectra 2012, 28, 349–384. [Google Scholar] [CrossRef]
- Nakaki, S.D.; Englekirk, R.E.; Plaehn, J.L. Ductile connectors for a precast concrete frame. PCI J. 1994, 39, 46–59. [Google Scholar] [CrossRef]
- Ghayeb, H.H.; Razak, H.A.; Sulong, N.R. Development and testing of hybrid precast concrete beam-to-column connections under cyclic loading. Constr. Build. Mater. 2017, 151, 258–278. [Google Scholar] [CrossRef]
- Gao, P.N.; Deng, Y.; Li, A.Q.; Lu, F.Y. Research progress on seismic behavior of joints of assembled concrete frame structures. J. Indus. Constr. 2021, 51, 171–185. (in Chinese). [Google Scholar]
- An, H.C.; Shi, M.H. Development of assembled reinforced concrete structure and connection technology. Ju She 2022, 87–89. (in Chinese). [Google Scholar]
- Liu, Y.; Guo, Z.; Ding, J.; Wang, X.; Liu, Y. Experimental study on seismic behaviour of plug-in assembly concrete beam-column connections. Eng. Struct. 2020, 221, 111049. [Google Scholar] [CrossRef]
- Ozturan, T.; Ozden, S.; Ertas, O. Ductile connections in precast concrete moment resisting frames. concrete construction 2006, 9, 11. (in Chinese). [Google Scholar]
- Ketiyot, R.; Hansapinyo, C. Seismic performance of interior precast concrete beam-column connections with T-section steel inserts under cyclic loading. Earthq. Eng. Eng. Vib. 2018, 17, 355–369. [Google Scholar] [CrossRef]
- Yuksel, E.; Karadogan, H.F.; Bal, I.E.; Ilki, A.; Bal, A.; Inci, P. Seismic behavior of two exterior beam–column connections made of normal-strength concrete developed for precast construction. Eng. Struct. 2015, 99, 157–172. [Google Scholar] [CrossRef]
- Yang, H.; Guo, Z.X.; Xu, A.Y.; Guan, D.Z.; Feng, J.S. Experimental study on seismic behavior of local post-tensioned precast concrete beam-to-column connections. Journal of Southeast University. 2019, 49, 1101–1108. (in Chinese). [Google Scholar]
- Loo, Y.C.; Yao, B.Z. Static and repeated load tests on precast concrete beam-to-column connections. PCI J. 1995, 40, 106–115. [Google Scholar] [CrossRef]
- Englekirk, R.E. Development and testing of a ductile connector for assembling precast concrete beams and columns. PCI J. 1995, 40, 36–51. [Google Scholar] [CrossRef]
- Li, Z.X.; Zhang, X.S.; Ding, Y. Ding Yang. Research on seismic performance of steel concrete frame joints with integrated assembly. Journal of Architectural Structures 2005, 32–38. (in Chinese). [Google Scholar]
- Wu, C.X.; Lai, W.S.; Zhou, Y.; Zhang, C.; Deng, X.S. Experimental study on the seismic performance of newly assembled concrete frame joints with energy dissipation. China Civil Engineering Journal. 2015, 48, 23–30. [Google Scholar]
- Gu, W.; Zhang, X.X.; Li, Z.P.; Zhang, Y.N.; Ruan, X.Q. Research on the seismic performance of prefabricated concrete frame hooked middle column Joints. Build. Struct. 2019, 49, 33–37. [Google Scholar]
- Ji, J.; Wu, A.M.; Wang, Y.J.; Han, X.L. Joint test and analysis of a new type of concrete filled steel tubular column with a dark heart. Journal of South China University of Technology (Natural Science). 2008, 114–120. (in Chinese). [Google Scholar]
- Miao, X.Y. Research on new type beam-column steel joint of prefabricated concrete frame structure. Beijing University of Civil Engineering and Aechitecture,2016. (in Chinese).
- Tensile test of metallic materials at room temperature. GB/T228-2010. Beijing: China Building Industry Press, 2010. (in Chinese).
- Standard for test methods for mechanical properties of ordinary concrete. GB/T 50081-2019. Beijing: China Building Industry Press, 2019. (in Chinese).
- Tang, J.R. Seismic resistance of reinforced concrete frame joints. Earthquake Resistant Engineering and Retrofitting. 1989, 39–43. (in Chinese). [Google Scholar]
- Mccrum, D.P.; Williams, M.S. An overview of seismic hybrid testing of engineering structures. Eng. Struct. 2016, 118, 240–261. [Google Scholar] [CrossRef]
- Yu, J.B.; Guo, Z.X. Seismic test and theoretical research of anchor-in-type assembly concrete frame joints with steel stranded wire. Journal of Southeast University (Natural Science Edition). 2017, 47, 760–765. (in Chinese). [Google Scholar]
- Wang, H. Research on seismic performance of assembly joints of square concrete-filled steel tubular column-H-type steel beam. Beijing University of Engineering and Architecture, 2020. (in Chinese).
- Code for design of concrete structures (GB 50010-2015). Building Technology. 2015, 28-30. (in Chinese).
Figure 1.
Joint structure diagram. (a) Details of precast beams; (b) Details of precast column; (c) Details of joint structure.
Figure 1.
Joint structure diagram. (a) Details of precast beams; (b) Details of precast column; (c) Details of joint structure.
Figure 2.
Specimen size and reinforcement. (a) XJ-1; (b) ZP-1; (c) ZP-2; (d) ZP-3; (e) ZP-4.
Figure 2.
Specimen size and reinforcement. (a) XJ-1; (b) ZP-1; (c) ZP-2; (d) ZP-3; (e) ZP-4.
Figure 3.
Loading device.
Figure 3.
Loading device.
Figure 4.
Loading regime.
Figure 4.
Loading regime.
Figure 5.
Arrangement of strain gauge and displacement gauge. (a) Arrangement of concrete strain gage and displacement gauge; (b) Arrangement of strain gage at cast-in-site joints; (c) Arrangement of ZP-1, ZP-3 and ZP-4 strain gages; (d) Arrangement of ZP-2 strain gage.
Figure 5.
Arrangement of strain gauge and displacement gauge. (a) Arrangement of concrete strain gage and displacement gauge; (b) Arrangement of strain gage at cast-in-site joints; (c) Arrangement of ZP-1, ZP-3 and ZP-4 strain gages; (d) Arrangement of ZP-2 strain gage.
Figure 6.
Failure modes of each specimen. (a) Cast-in-site joint; (b) ZP-1; (c) ZP-2; (d) ZP-3; (e) ZP-4.
Figure 6.
Failure modes of each specimen. (a) Cast-in-site joint; (b) ZP-1; (c) ZP-2; (d) ZP-3; (e) ZP-4.
Figure 7.
Hysteresis curve and skeleton curve. (a) XJ-1; (b) ZP-1; (c) ZP-2; (d) ZP-3; (e) ZP-4; (f) Skeleton curve.
Figure 7.
Hysteresis curve and skeleton curve. (a) XJ-1; (b) ZP-1; (c) ZP-2; (d) ZP-3; (e) ZP-4; (f) Skeleton curve.
Figure 8.
Calculation diagram of the equivalent viscous damping coefficient.
Figure 8.
Calculation diagram of the equivalent viscous damping coefficient.
Figure 9.
Stiffness degradation curve.
Figure 9.
Stiffness degradation curve.
Figure 10.
Strength degradation curve.
Figure 10.
Strength degradation curve.
Figure 11.
Uniaxial tension stress-strain curve and cracking strain diagram.
Figure 11.
Uniaxial tension stress-strain curve and cracking strain diagram.
Figure 12.
Uniaxial compression stress-strain curve and inelastic strain diagram.
Figure 12.
Uniaxial compression stress-strain curve and inelastic strain diagram.
Figure 13.
Modified constitutive model of steel bar.
Figure 13.
Modified constitutive model of steel bar.
Figure 14.
Modeling and meshing. (a) XJ-1; (b) ZP-1, ZP-2, ZP-3; (c) ZP-4; (d) Reinforcing cage (e) meshing.
Figure 14.
Modeling and meshing. (a) XJ-1; (b) ZP-1, ZP-2, ZP-3; (c) ZP-4; (d) Reinforcing cage (e) meshing.
Figure 15.
stress cloud diagram. (a) XJ-1 joint; (b) ZP-1 joint; (c) ZP-2 joint; (d) ZP-3 joint; (e) ZP-4 joint.
Figure 15.
stress cloud diagram. (a) XJ-1 joint; (b) ZP-1 joint; (c) ZP-2 joint; (d) ZP-3 joint; (e) ZP-4 joint.
Figure 16.
Hysteretic curve comparison between FEA and TEST. (a) XJ-1; (b) ZP-1; (c) ZP-2; (d) ZP-3; (e) ZP-4.
Figure 16.
Hysteretic curve comparison between FEA and TEST. (a) XJ-1; (b) ZP-1; (c) ZP-2; (d) ZP-3; (e) ZP-4.
Figure 17.
Skeleton curve.
Figure 17.
Skeleton curve.
Table 1.
Specimen dimensions and different.
Table 1.
Specimen dimensions and different.
| Specimen Number |
XJ-1 |
ZP-1 |
ZP-2 |
ZP-3 |
ZP-4 |
| Section dimensions of beams and columns |
Beam: 175 mm × 250 mm; column: 250 mm × 250 mm |
| Thickness of cover |
25 mm |
| Dimensions of steel pipe and shear bolts |
Steel pipe: d = 42mm, t = 3mm, L = 1000mm The shear bolts:M12 L = 60mm |
| Column stirrup, longitudinal reinforcement |
Stirrup: 6@80/120, Longitudinal reinforcement: 12 |
| Beam stirrups, longitudinal bars |
Stirrup: 6@80/120, Longitudinal reinforcement: 10 |
| Lower longitudinal reinforcement of the beam |
Beam longitudinal reinforcement |
Lower beam longitudinal bars bend upward 480mm |
Lower beam longitudinal bars bent upward 240mm |
Lower beam longitudinal bars bend upward 480mm |
Lower beam longitudinal bars bend upward 480mm |
| Length of longitudinal reinforcement at the lower part of the beam |
2750 mm |
1945 mm |
1705 mm |
1945 mm |
1945 mm |
| Concrete strength grade |
C30 |
C30 |
C30 |
C20 |
C30 |
Table 2.
Mechanical properties of reinforcement.
Table 2.
Mechanical properties of reinforcement.
| Steel type |
The diameter of steel pipe/mm |
fy/MPa |
fu/MPa |
Es/MPa |
| HRB400 |
6 |
429.32 |
540.24 |
200 |
| HRB400 |
10 |
443.25 |
625.16 |
200 |
| HRB400 |
12 |
450.13 |
31.02 |
200 |
Table 3.
Mechanical properties of concrete.
Table 3.
Mechanical properties of concrete.
| specimen |
Strength grade |
fcu/Mpa |
fc/Mpa |
Ec/Mpa |
| Group A |
C30 |
32.61 |
21.81 |
3.65×10⁴
|
| Group B |
C30 |
32.72 |
21.88 |
3.66×10⁴
|
| Group C |
C20 |
21.81 |
14.59 |
2.66×10⁴
|
Table 4.
Load characteristic values and ductility coefficient of specimens.
Table 4.
Load characteristic values and ductility coefficient of specimens.
| Specimen number |
Loading direction |
The yield point |
Ultimate point |
Breakdown point |
Ductility coefficient |
|
/kN |
/mm |
/kN |
/mm |
/kN |
/mm |
|
| XJ-1 |
positive |
33.25 |
18.68 |
35.29 |
28.42 |
33.92 |
77.58 |
4.15 |
4.38 |
| reverse |
-28.8 |
-17.37 |
-32.8 |
-25 |
-28.75 |
-80 |
4.61 |
| ZP-1 |
positive |
31.39 |
20.96 |
35.25 |
24.88 |
29.96 |
65.58 |
3.12 |
3.22 |
| reverse |
-29.19 |
-21.04 |
-32.03 |
-24.97 |
-26.92 |
-69.8 |
3.32 |
| ZP-2 |
positive |
26.60 |
20.67 |
31.45 |
29.86 |
26.73 |
60.96 |
2.95 |
3.05 |
| reverse |
-28.13 |
-21.38 |
-34.06 |
-34.99 |
-28.1 |
-67.37 |
3.15 |
| ZP-3 |
positive |
33.05 |
18.40 |
38.57 |
27.85 |
32.78 |
51.55 |
2.8 |
2.87 |
| reverse |
-29.88 |
-26.78 |
-30.94 |
-29.97 |
-26.55 |
-78.63 |
2.93 |
| ZP-4 |
positive |
31.53 |
21.18 |
35.66 |
26.89 |
30.31 |
78.75 |
3.72 |
3.96 |
| reverse |
-26.88 |
-19.07 |
-32.01 |
-24.29 |
-30.5 |
-79.93 |
4.2 |
Table 5.
Equivalent viscous damping coefficient.
Table 5.
Equivalent viscous damping coefficient.
| Joint number |
/kN·mm |
/kN·mm |
|
| XJ-1 |
995.61 |
911.47 |
0.17 |
| ZP-1 |
696.83 |
839.81 |
0.13 |
| ZP-2 |
820.81 |
1065.43 |
0.12 |
| ZP-3 |
632.49 |
945.18 |
0.11 |
| ZP-4 |
890.53 |
919.56 |
0.15 |
Table 6.
Concrete material parameter.
Table 6.
Concrete material parameter.
| Parameter |
Poisson
ratio |
Dilation
Angle |
Eccentricity
ratio |
fb0/fc0
|
K |
Viscous
parameters |
Compression
recovery stiffness |
| value |
0.2 |
38° |
0.1 |
1.16 |
2/3 |
0.01 |
0.6 |
Table 7.
Reinforcement of constitutive data.
Table 7.
Reinforcement of constitutive data.
| Steel type |
Diameter
(mm) |
elasticity modulus
(N/m2) |
Yield strength
Ultimate strength
(MPa) |
Inelastic
strain |
| HRB400 |
6 |
2E11 |
429.32 |
0 |
| 540.24 |
0.002 |
| HRB400 |
10 |
2E11 |
443.25 |
0 |
| 625.16 |
0.002 |
| HRB400 |
12 |
2E11 |
450.13 |
0 |
| 631.02 |
0.0021 |
Table 8.
Hysteretic performance analysis of joints.
Table 8.
Hysteretic performance analysis of joints.
| Joint number |
Maximum displacement |
Maximum load |
| Test |
Simulation |
Test |
Simulation |
| XJ-1 |
80.6903 |
101.2130 |
36.3741 |
31.8476 |
| ZP-1 |
29.2419 |
31.4079 |
35.7401 |
35.7401 |
| ZP-2 |
31.0588 |
32.4706 |
33.8583 |
35.5294 |
| ZP-3 |
31.7797 |
31.5254 |
38.8983 |
35.8475 |
| ZP-4 |
69.7161 |
80.1262 |
35.9528 |
35.9528 |
Table 9.
Model parameters.
Table 9.
Model parameters.
| Serial number |
Axial compression ratio |
Strength of concrete in
the joint core area |
Steel pipe specification |
| ZP-5.1 |
0.15 |
C30 |
D:42mm t:3mm |
| ZP-5.2 |
0.25 |
C30 |
D:42mm t:3mm |
| ZP-5.3 |
0.40 |
C30 |
D:42mm t:3mm |
| ZP-6.0 |
0.20 |
C40 |
D:42mm t:3mm |
| ZP-7.0 |
0.20 |
C30 |
D:60mm t:3.5mm |
Table 10.
Checks the calculation of shear bearing capacity.
Table 10.
Checks the calculation of shear bearing capacity.
| The joint type |
Shearing capacity (kN) |
| Test |
Theory |
error value |
simulation |
error value |
| Cast-in-site joint |
229.02 |
211.34 |
8% |
246.9 |
8% |
| ZP-1 |
220.29 |
239.41 |
7% |
250.66 |
14% |
| ZP-2 |
211.74 |
239.41 |
11% |
230.33 |
9% |
| ZP-3 |
226.21 |
239.41 |
5% |
249.88 |
10% |
| ZP-4 |
240.11 |
239.41 |
1% |
252.55 |
5% |
|
Disclaimer/Publisher’s Note: The statements, opinions and data contained in all publications are solely those of the individual author(s) and contributor(s) and not of MDPI and/or the editor(s). MDPI and/or the editor(s) disclaim responsibility for any injury to people or property resulting from any ideas, methods, instructions or products referred to in the content. |
© 2023 by the authors. Licensee MDPI, Basel, Switzerland. This article is an open access article distributed under the terms and conditions of the Creative Commons Attribution (CC BY) license (http://creativecommons.org/licenses/by/4.0/).
