Preprint
Article

Rheology, Mechanical Properties and Shrinkage of Self-Compacting Concrete Containing Cement Kiln and By-Pass Filter Dust

Altmetrics

Downloads

70

Views

20

Comments

0

A peer-reviewed article of this preprint also exists.

Submitted:

19 November 2023

Posted:

20 November 2023

You are already at the latest version

Alerts
Abstract
Self-compacting concrete (SCC) is a high-quality construction solution combining high fluidity, passing and filling ability with improved mechanical properties and durability. In the present study, the effect of incorporating alternative waste materials, such as two by-products of the ce-ment industry, namely cement kiln dust (CKD) and by-pass dust (BPD), into SCC as partial re-placement for traditional filler material was investigated. The produced compositions were compared with reference mixtures containing only marble powder (MP) as a filler. A series of tests including specific test methods for wet SCC, compressive, flexural and tensile splitting strength tests as well as drying shrinkage determination were conducted to evaluate the quality of the produced SCC in terms of fresh and hardened SCC properties. The use of alternative fine filler materials resulted in a high-performance sustainable SCC of low cement content. Specifi-cally, incorporating CKD into the SCC enhanced its rheological behavior and improved slightly its mechanical properties, while the use of BPD led to SCC mixtures of adequate rheological characteristics but with highly upgraded mechanical and physical properties
Keywords: 
Subject: Chemistry and Materials Science  -   Materials Science and Technology

1. Introduction

In 1983 in Japan a problem related to the durability of structures intensively arose, due to the incomplete or excessive consolidation of the concrete. As a solution, in 1986 Okamura introduced the self-compacting concrete (SCC) with its essential ability of being compacted under its own weight without any mechanical or human effort [1,2,3]. To achieve its enhanced properties, such as the high filling and passing ability, specific modifications in the mix design of the composition of SCC are required, compared to the conventional vibrated concrete (VC) [2,4]. The most widely accepted changes are related to the addition of modern active chemical admixtures and fine-grained fillers at appropriate proportions. The chemical admixtures mostly used are Super-Plasticizers (SP), which provide the mixture with high fluidity by decreasing the yield stress, and Viscosity Modifying Agents (VMA), which increase the robustness and the viscosity of the mixture [5]. Fillers are added to the composition to reduce segregation and improve the microstructure of the concrete by optimizing the packing of the dry ingredients (i.e. cement and aggregates) [6,7,8]. An important subject of scientific research is the type of filler, with parameters such as size, shape and chemical composition being the most critical. Rising number of research teams are trying to use industrial by-products as fillers to contribute to sustainability and greener constructions, utilizing materials that would potentially be air or soil pollutants [7,9]. Especially, when it comes to cement plants, thousands of tons of waste material are collected annually, making the need for their utilization imperative. In more detail, during the continuous feeding of kilns with raw materials for clinker production, large quantities of fine-grained material are trapped in the gases and removed by control devices, such as cyclones, bag houses or electrostatic filters [10]. Their incorporation into concrete to partially replace cement or conventional fillers (such as limestone dust) constitutes a topic of increasing interest.
Wang et al., 2018 [11], claimed that the addition of limestone filler to concrete can either have a positive or negative effect on the workability depending on the incorporation proportion, the particle size in comparison to the corresponding cement particles, or the MgO content; the increase of which enhances the viscosity of concrete. An increase in limestone powder may cause a decrease in the compressive strength of concrete due to the dilution effect of a high filler content, however at an optimum amount and size it can create a closer packing of the dry materials and thus increase the compressive strength. Limestone filler is considered to be a material of higher stiffness compared to concrete, which leads to a higher Modulus of Elasticity. Elyamani et al., 2014 [6], compared the effect of different fillers on the rheological and mechanical properties of SCC. The non-pozzolanic fillers, such as marble dust, alleviated the phenomena of bleeding and segregation compared to pozzolanic fillers, such as silica fume and metakaolin, while the presence of marble dust decreases the water absorption. No significant alterations were observed in terms of compressive strength when comparing pozzolanic to non-pozzolanic fillers, however, the latter, although not involved in the hydration reactions, improved the microstructure of the cement paste with a positive effect on the bulk paste matrix and the transition zone. Sfikas et al., 2014 [12], investigated the partial replacement of limestone filler or cement with metakaolin resulting in a higher demand for chemical admixtures, as the ratio of metakaolin-to-limestone powder or cement increased due to the higher specific surface area and the non-spherical shape of metakaolin particles.
Abukhashaba et al., 2014 [13], used cement kiln dust (CKD) in fiber reinforced SCC and produced a sustainable SCC. However, due to the physical properties of CKD a higher demand of SP dosages required to achieve the desired rheological behavior. Siddique et al., 2006 [14], claimed that the incorporation of CKD into concrete at an appropriate amount can have a positive effect on sorptivity and alkali-silica reactions, while it does not appear to adversely affect properties such as the compressive and flexural strengths. Bagheri et al., 2020 [15], used CKD and fly ash in different proportions (0-40% and 0-30%, respectively) to produce a green concrete with improved fresh and hardened properties. Replacing 20% of cement with 5% of CKD and 15% of fly ash led to a higher compressive strength, while for mixtures with 20% or higher CKD the compressive strength decreased sharply. Maslehuddin et al., 2009 [16], also investigated the mechanical properties and durability of concrete containing 0-15% CKD. Increasing CKD decreases the compressive strength of the concrete. Nevertheless, for 5% of cement replacement with CKD, the compressive strength and drying shrinkage were not affected significantly. Najim et al., 2014 [17] claim that compressive strength decrease due to CKD incorporation could mainly be detected in cases of CKD with high free lime content, as free lime reacts with water and produces additional Ca(OH)2 resulting in pores of higher volume and subsequently greater internal stresses leading to a decreased strength for the chemical compounds of CKD.
Viacava et al., 2012 [18], produced medium strength SCC by replacing cement with CKD at ratios of 20% and 30%. They concluded that replacing cement with CKD improves the rheological properties effectively reducing the use of chemical admixtures. Specifically, for a 20% replacement of cement with CKD, the lowest segregation tendency and highest viscosity are observed from segregation and a V-funnel test respectively.
Ashteyat et al., 2018 [19], produced five SCC compositions by replacing 0-25% cement with white cement by-pass dust (BPD) without facing any problem in terms of workability. Even when the compressive strength was sufficient, a scalable, according to BPD content, reduction occurred. The drying shrinkage as well as capillary porosity measurements showed a slight increase due to the incorporation of BPD. The porosity decreased when replacing 10% of cement with BPD, while the most encouraging result concerned the SCC resistance to alkali-silica reaction.
In almost all the afore-mentioned studies, a common approach is found for the mix design process, considering the specific by-products of clinker processing as supplementary cementitious materials (SCMs) and replacing cement in various percentages. The purpose of this paper is to investigate the possibility of utilizing two raw by-products of cement industry as fine filler materials of SCC; cement kiln dust (CKD) and by-pass dust (BPD) in comparison with a reference mixture containing only marble powder (MP), by designing two series of SCC mixtures of dissimilar water-to-cement ratio and filler content. The properties and the characteristics of CKD and BPD are governed by the clinker raw materials and the kilns’ layout details such as fuels and filters used. Therefore, the quality and the suitability of similar by-products for further use in the building sector should be evaluated by taking into consideration the specific process characteristics of each cement production plant. After the characterization of the fillers in terms of chemical composition, skeletal density and particle size distribution, compositions of concrete of high water-to-cement ratio and low cement content were produced. Properties of fresh and hardened concrete were studied. The analysis of the results on the rheological and mechanical properties, demonstrated a high potential of utilizing the examined by-products for sustainable SCC compositions.

2. Experimental

2.1. Materials

Three nominal grades of locally crushed calcareous limestone aggregate, in accordance with EN 12620:2013 [20], were used as follows: sand 0/4 mm, small gravel (g1) 0/8 mm and medium gravel (g2) 0/16 mm. Portland cement CEM I 42.5R, conforming to EN 197-1:2011 [21], and tap water (pH=7, 20°C) were used. Two aqueous solutions, a viscosity modifying agent (VMA) based on a synthetic copolymer of low viscosity with extremely efficient rheological properties, and a superplasticizer (SP) based on modified polymers, both complying with EN 934-2 [22], were used in appropriate proportions to provide the SCC mixtures with the desirable yield stress, viscosity and robustness.
The behavior of three fine filler materials in concrete mixtures was investigated, namely marble powder (MP), a by-product from marble processing, cement kiln dust (CKD) and by pass dust (BPD) which constitute by-products of clinker production process.
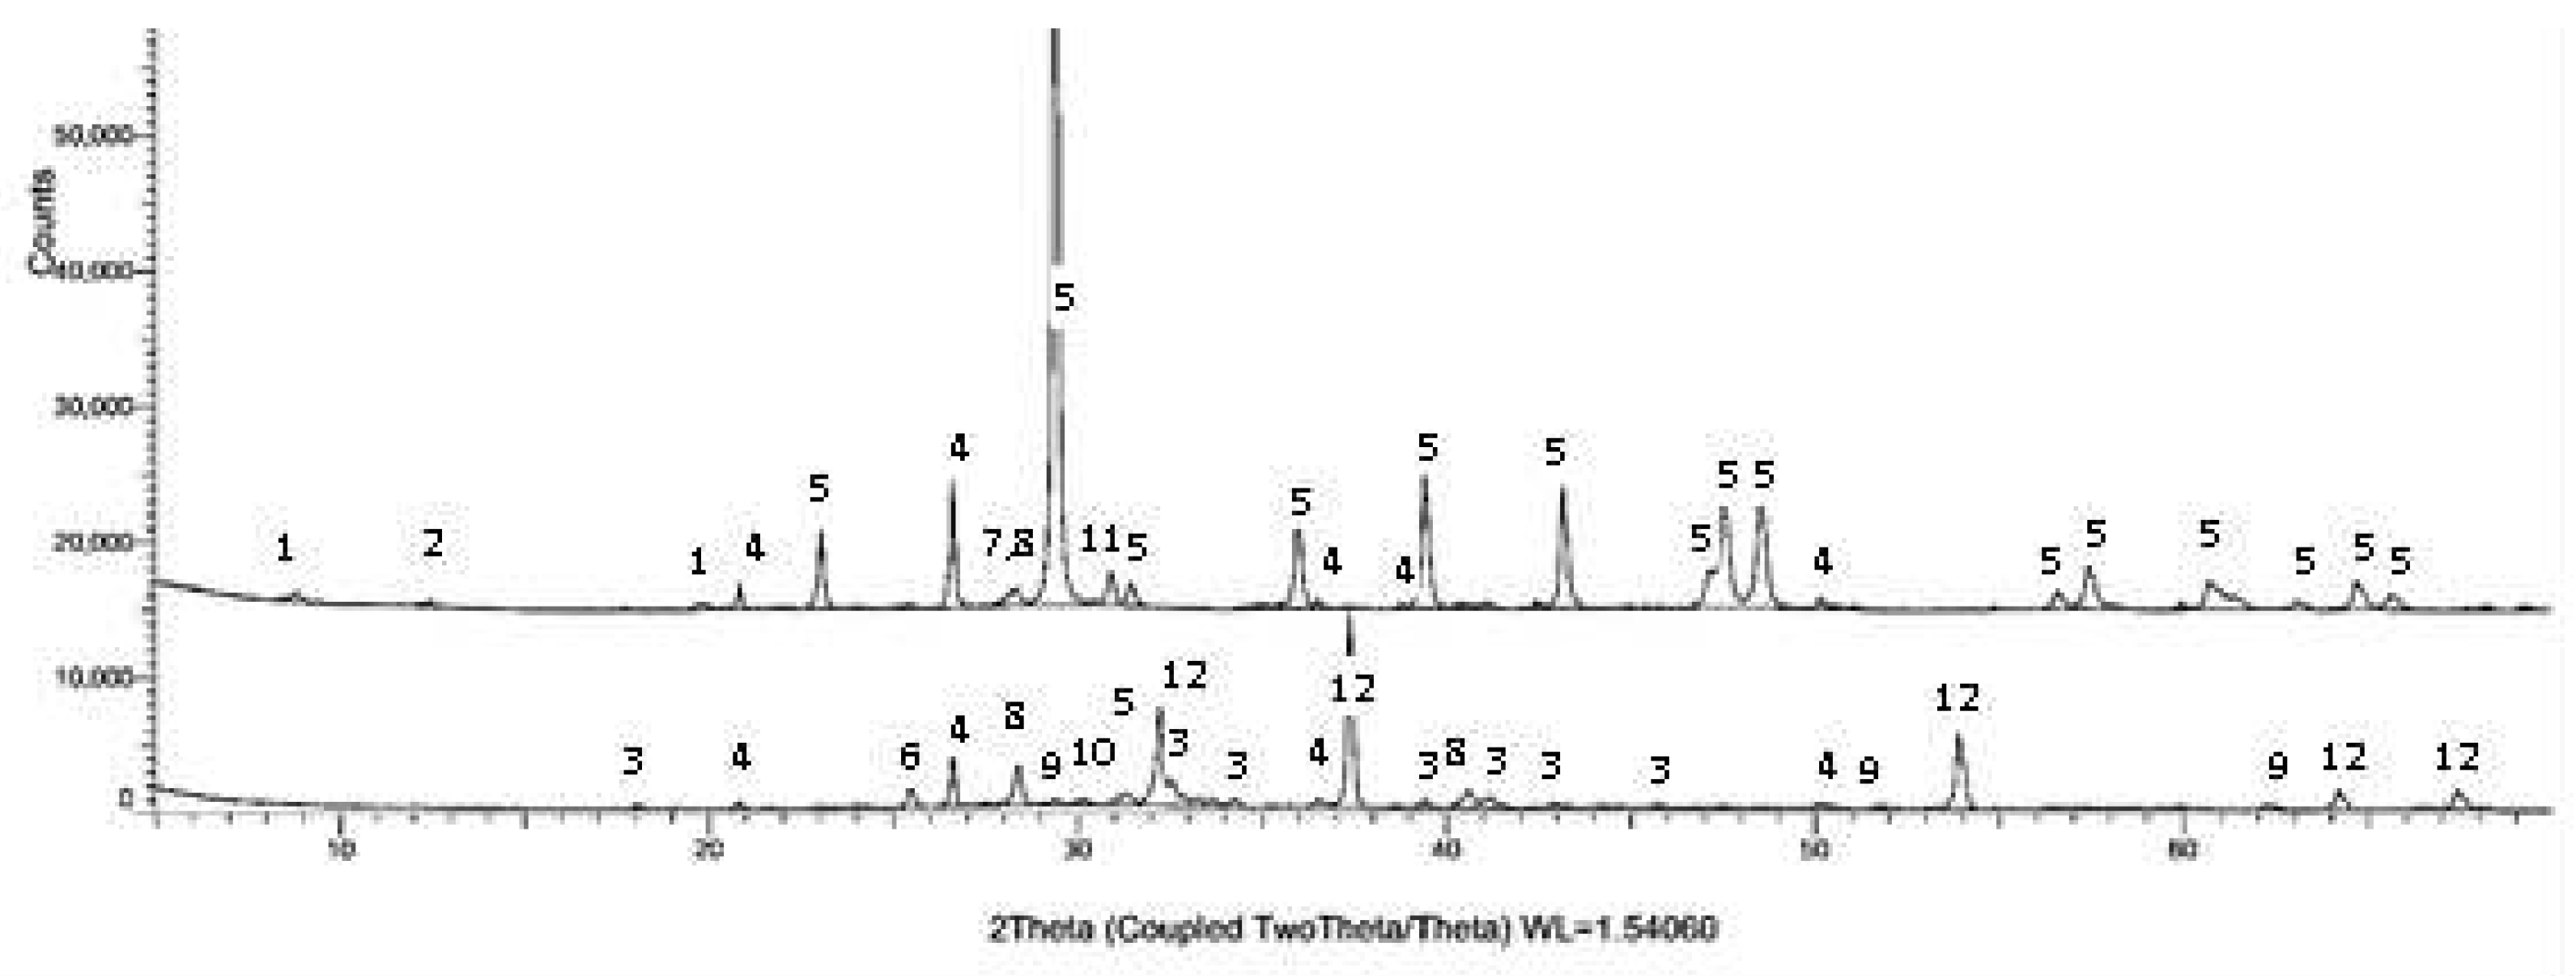
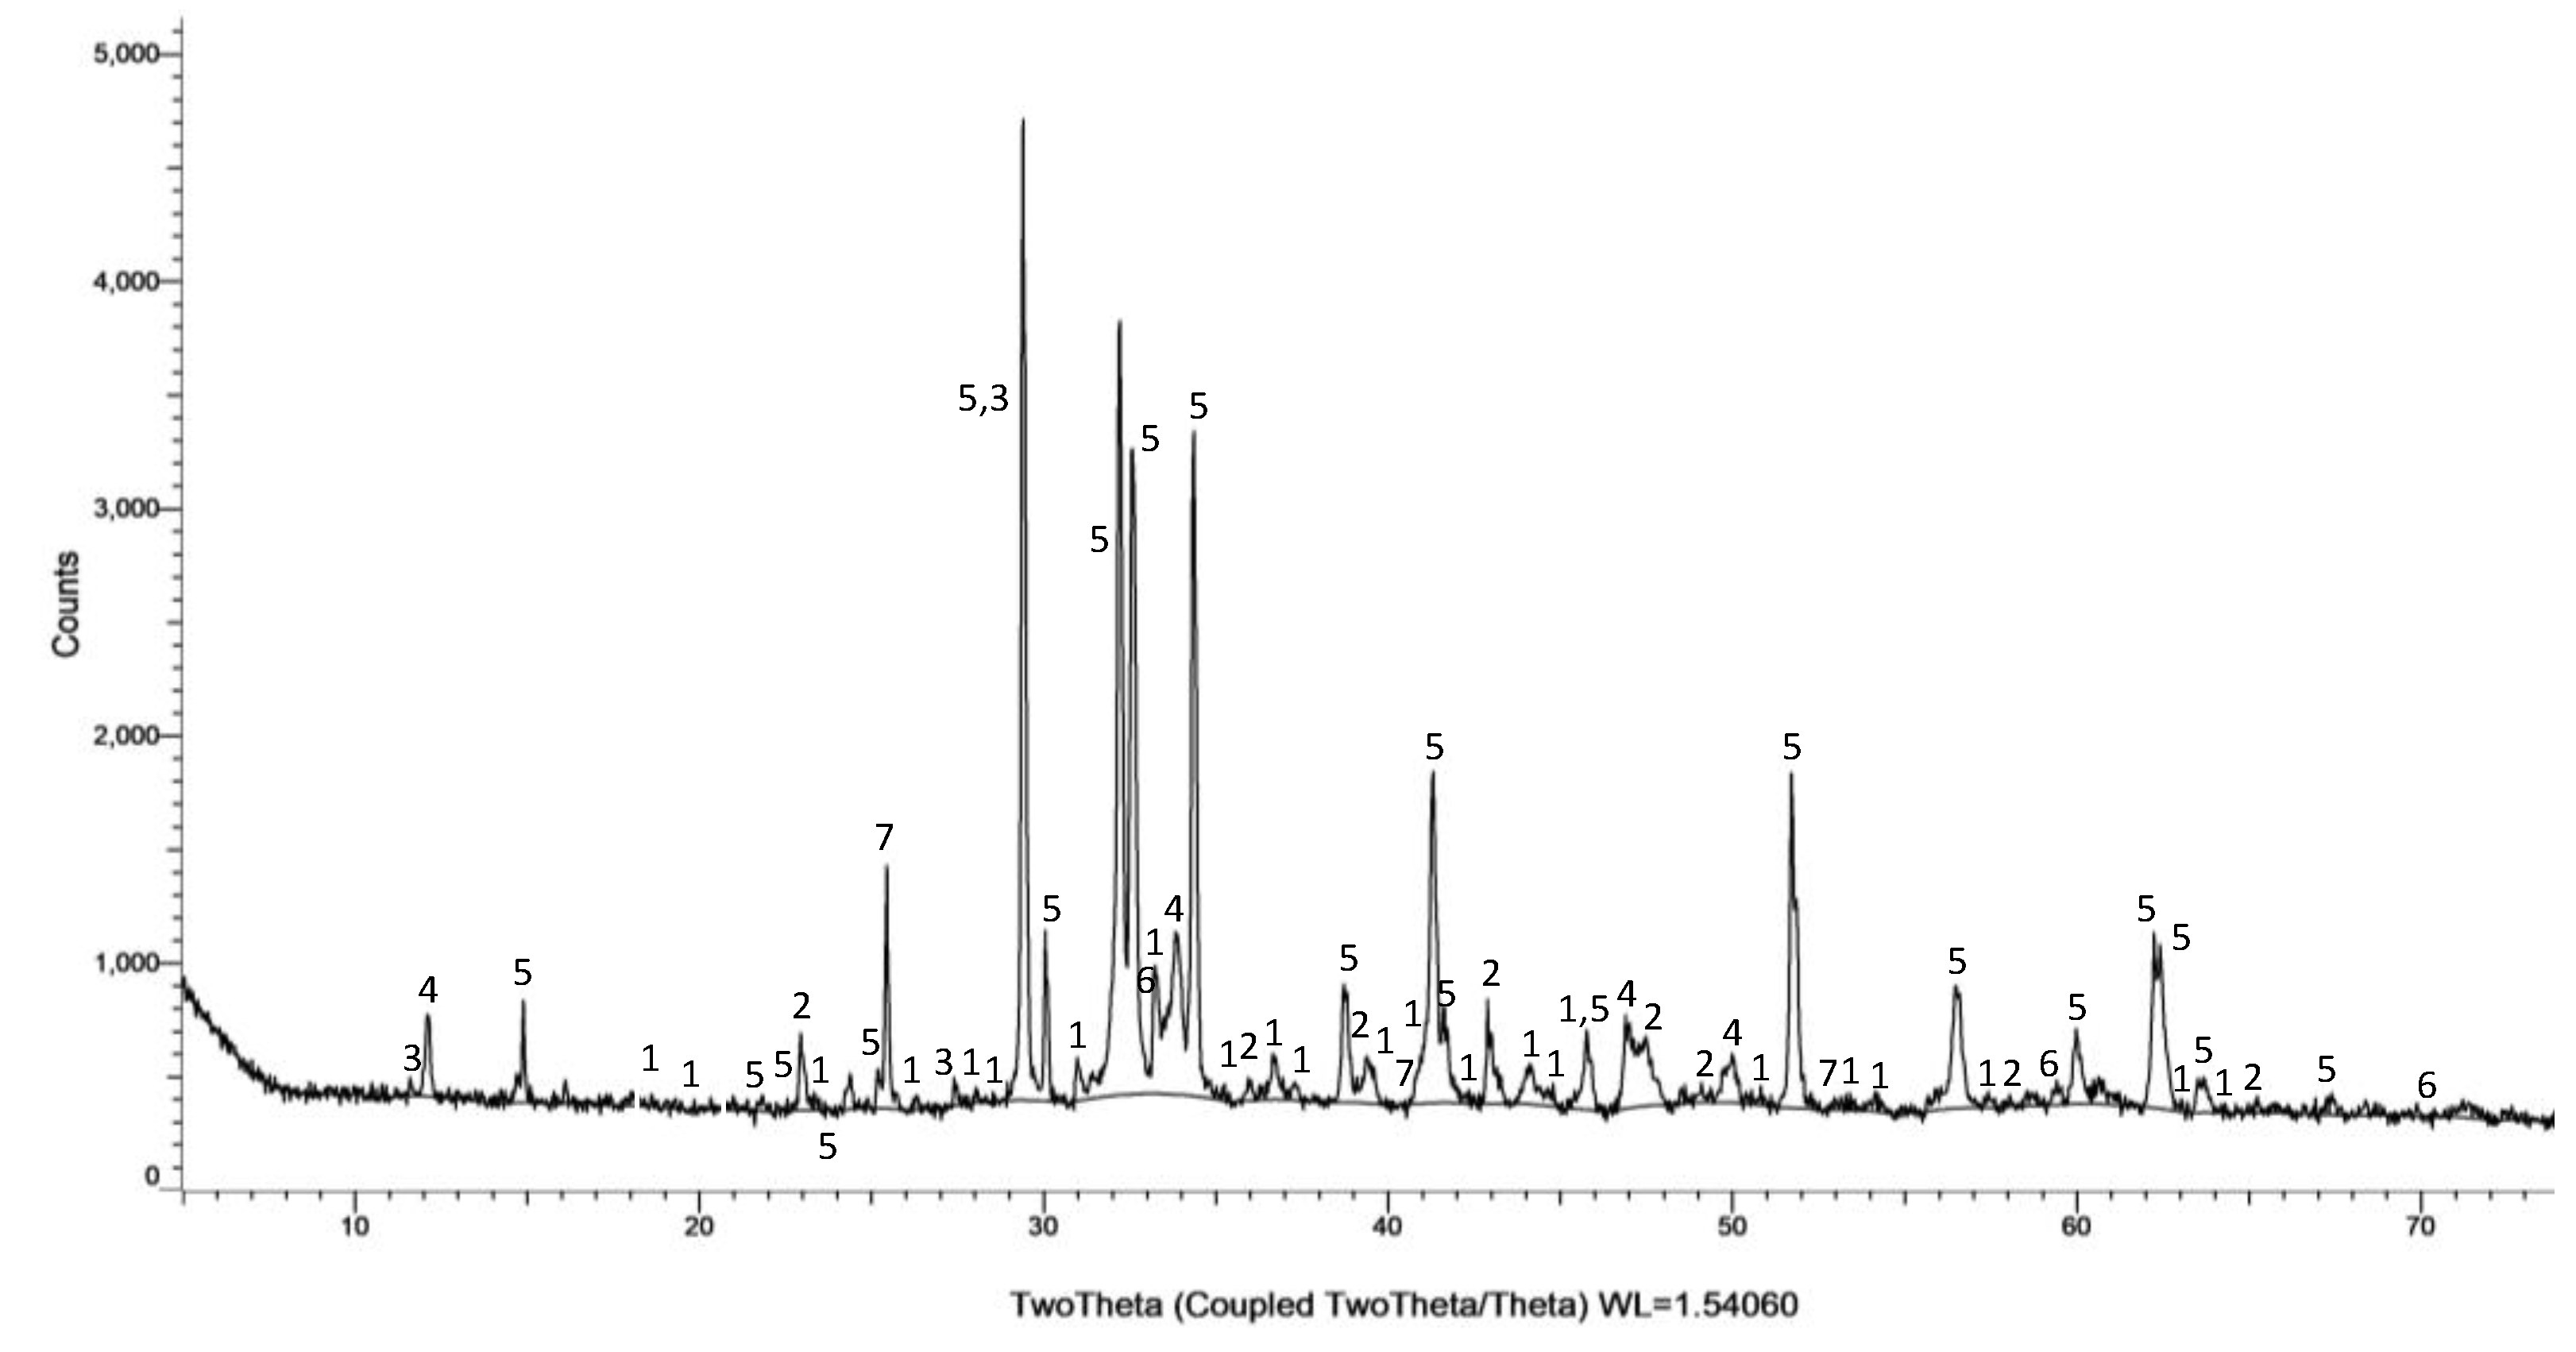
Details about physical and chemical properties, as well as particle size distribution are presented in Table 1, Table 2 and Figure 1, respectively, and have been experimentally defined and presented by the authors in earlier studies [23]. The X-Ray diffraction method (XRD) was employed to determine the mineralogical characteristics of the used filler materials. As MP primarily contains calcite, only the results for CKD and BPD are illustrated in Figure 2. In more detail, CKD contains calcite, quartz, dolomite, albite, kaolinite, illite, sylvite as well as a high value of LOI that is attributed to the CaCO3 decomposition. BPD contains lime, and a mineral phase that encompasses SO42-, alkalis and Cl-, like anhydrite, sanidine and sylvite. Traces of clinkers’ mineral phases, mainly C2S, are also present. XRD of cement powder is also presented in Figure 3.

2.2. Mix Design and Mixing Procedure

Three SCC mixtures were prepared with a constant active water-to-cement and water-to-powder ratios of 0.60 and 0.36, respectively. The reference mixture contained 200 kg/m3 MP of which 50% by weight was replaced by CKD and BPD correspondingly in the other compositions. All other SCC ingredients (cement, water, fine and coarse aggregates) remained the same as shown in Table 3. The marginally acceptable or even unacceptable in some cases, rheological results led to an additional series of compositions with a higher cement paste–to–total aggregate ratio. Specifically, the reference composition of the new series contained 50 kg/m3 more MP and additional water, to retain the ratio of water-to-powder at 0.36 while the amount of cement content remained the same. Of the total 250 kg/m3 of filler material, 150 kg/m3 were replaced by BPD and CKD in the other two compositions. These compositions are also presented in detail in Table 3 In both composition series, the water-to-powder ratio was kept constant for comparison.
A fixed-pan planetary type concrete mixer with rotating blades of 100 l capacity was used for the appropriate mixing and the production of all batches. For each SCC composition a mixture of 40 l was prepared, described in the following. All dry ingredients (cement, filler material, fine and coarse aggregate) were introduced in the mixer and were mixed for 60 s. Then, 80% of the total water was introduced and the mixture was mixed for an additional 180 s. Finally, the remaining 20% of the total water mixed with the initial SP dosage was added and 60 s of mixing followed. For each extra dose of the chemical admixture (SP or VMA) an additional 60 s of mixing was conducted.
Steel moulds were used for the casting of the concrete specimens, in the appropriate dimensions for each test. The specimens were demoulded after 24 h and were cured in water at 20°C afterwards, until the testing age, which varied according to each test’s specifications.

2.3. Testing

The rheological behavior of each mixture was investigated via slump flow test and T500, V-funnel test, U-box and L-box tests and sieve segregation test, in accordance with EN 12350-8, EN 12350-9, EN12350-11, EN12350-10 and UNI 11044, respectively [24,25,26,27,28]. In addition, the wet density of SCC and the entrapped air content (pressure gauge method) were measured according to EN 12350-6 and EN 12350-7, respectively [29,30]. The SP dosage for each mixture was calculated to reach a slump flow of 690-710 mm, while VMA was added whenever segregation signs were observed.
The compressive strength was measured according to EN 12390-3 at the ages of 7, 28 and 90 days (loading rate: 4.50 kN/s) [31]. At each testing age, three cubes of 100x100x100 mm3 were tested. Tensile splitting test and modulus of elasticity measurement conforming to the testing procedure of EN 12390-6 and ASTM C 469, respectively, were conducted [32,33]. Specifically, cylindrical specimens of radius of 100 mm and height of 200 mm were tested at the age of 90 days after casting. Four loading cycles were performed for each specimen for the measurement of the modulus of elasticity, the first of which was used for the stress redistribution procedure.
After splitting, the visual stability index (VSI) was determined by observing any signs of paste or mortar layer at the top of the specimens, or non-normal distribution of the aggregate sizes. Specifically, if no paste or mortar is observed on top of the cylinder, and there is no difference in the size and area percentage of coarse aggregates lengthwise, the stability of the SCC is ranked at 0 and the specimen is considered stable. If, however, there is a slight difference in the size or area percentage of the coarse aggregates lengthwise, yet still without any paste or mortar layer on top of the specimen, the SCC is categorized as 1 and stable. In cases where there is cement paste or mortar layer on top of the specimen, despite the difference in the size distribution of the aggregates, the stability of SCC is evaluated as 2 or 3 depending on the intensity of the phenomenon [34].
Prisms of 100x100x500 mm3 were used for the measurement of drying shrinkage and mass loss at the age of 7, 14, 28 and 90 days in accordance with EN 12390-16, while for the same prisms a flexural test was carried out at the age of 90 days, according to EN 12390-5 [35,36].

3. Results and Discussion

3.1. Rheological Properties

All measured properties of the fresh SCC are presented in Table 4. Given that all compositions were of SF2 class and of a specific slump flow range of 690-710 mm, the SP dosage could be a critical factor to assess the rheological behavior of each mixture and the way each filler affects the SCC’s yield stress. On the other hand, VMA was added only to mixtures that showed a segregation tendency. BPD1 was the only composition where a VMA dosage of 0.3% was added, while this composition also demanded the highest percentage of SP (3.1% - approximately 80% higher than REF1) to achieve the desired slump flow range. On the contrary, REF1 had the lowest SP demand of 1.7% and is also characterized by the lowest viscosity, regarding the series 1 compositions, which is indirectly shown by the correspondingly low V-funnel time of 12.7 s. BPD1 was the only mixture that exceeded the 25 s limit, while CKD1 could also be characterized by a high viscosity, as the evacuation time was measured at 22.8 s although remaining within the acceptable range. The increase in viscosity due to the addition of BPD compared to the other fillers is also confirmed with the highest time reaching a flow of 500 mm (T500) which accounts for 5.6 s. Nevertheless, in terms of T500 values all mixtures of the series 1 are classified in the VS2 viscosity class. The adverse effect of BPD on the rheology of concrete could be explained by the low roundness of BPD particles, which increases intergranular friction, as shown in images obtained by SEM [23]. Moreover, the high content of anhydrite and lime in conjunction with alkalies and sulfates also affected the rheology of the mixtures. They decreased the setting time of SCC and subsequently degraded workability indices, such as the yield stress and plastic viscosity, demanding higher SP doses [37,38]. What also contributes to the above in the cases of BPD and CKD, is the high content of K2O (higher than Na2O) which causes a significant acceleration in the hydration process [38]. To offset the rapid loss in workability due to a rapid hydration, a slower reacting cement type or retarding chemical admixtures could be used [3].
As far as the sieve segregation test results are concerned, all SCC mixtures of both series lie in the allowable range. The series 2 compositions show a slightly higher segregation vulnerability compared to the corresponding compositions of the series 1, but are not even approaching the 20% limit. This upward trend is clearly related to the higher water-to-powder and lower plastic viscosity as indirectly determined by measuring the V-Funnel evacuation time (Table 4). The different types of filler and demand in chemical admixture did not affect significantly the air content or fresh density of series 1, and in all mixtures these values fluctuated between 1.8% and 2.5%, and 2365 and 2411 kg/m3 respectively [5]. Low deviations in unit weights despite the difference in filler density can be explained by the relatively low filler content. At the same time, when it comes to series 2 compositions the lower unit weight could be attributed to the higher water content. The higher content of entrapped air in REF2 and CKD2 mixtures, which amounts to 2.9% and 3.3% respectively, also contributes to the slightly reduced fresh density. Moreover, in series 2 mixtures, none of the compositions required a VMA dosage, while the BPD2 mixture required the highest amount of SP (2.7%) to achieve the desired slump flow value. BPD2 showed the highest viscosity in terms of V-funnel time (15.3 s) and T500 (2.82 s) being, however, within the acceptable limits. Most SCCs of both series achieved acceptable results regarding U-box and L-box with the exception of the two compositions that contained BPD, which demonstrated a slightly low L-Box performance, with ratios of 0.50 and 0.71 for the two series respectively. This could be due to the high plastic viscosity [3], as no signs of aggregate blockage were observed.
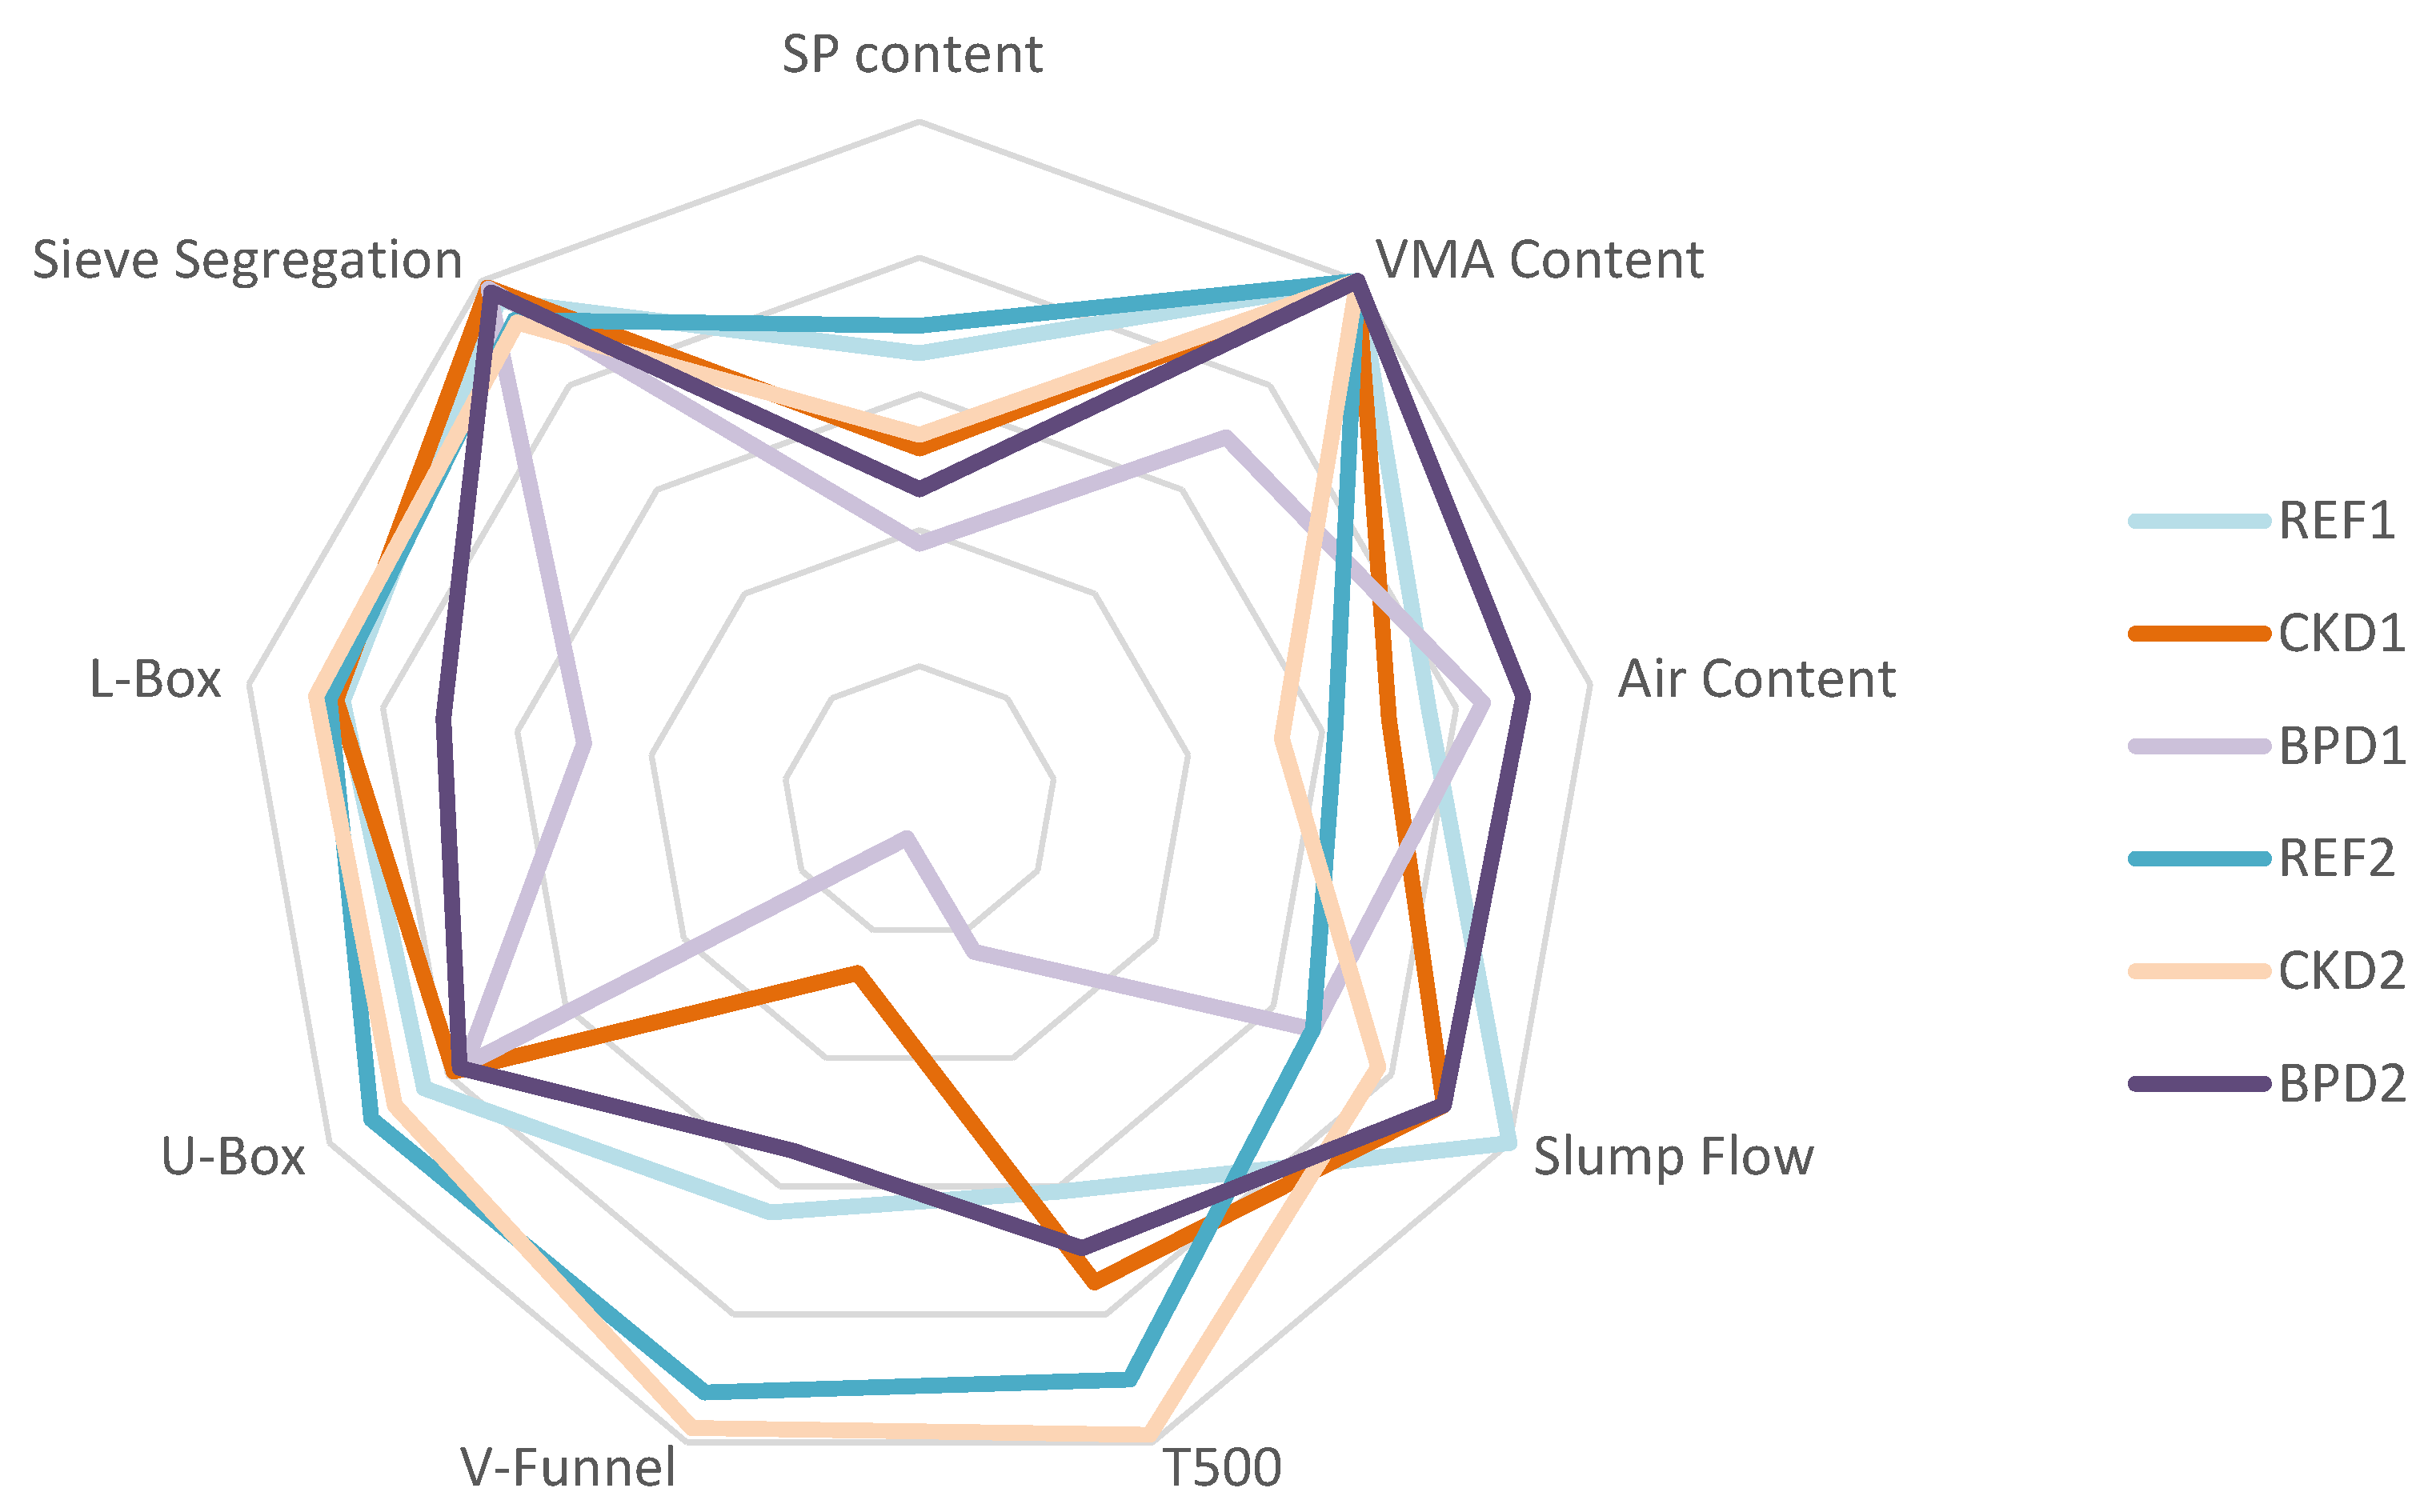
To analyze the rheological performance of the different mixtures, the values on Table 4 were normalized using the min-max normalization technique, by setting minimum and maximum values for each rheology parameter. In more detail, when the boundary limits of a property were available, they were applied (for instance, min value for Slump flow, 660). Otherwise, specific limits have been defined for other indices (for instance, the limits of 0-5% w/w cement for the SP content). With this technique the evaluation base was common for all the rheological indices and, therefore, the rheological performance of the mixtures is compared by plotting a summary radar chart shown in Figure 4. The highest values (exterior polygon vertices) indicate an optimum rheological behavior. According to the results in Figure 4, REF2 and CKD2 have almost equally the best behavior. On the contrary, BPD2 is the composition with the poorest performance in terms of fresh concrete properties making its use restrictive for certain applications with high fluidity requirements.

3.2. Compressive Strength

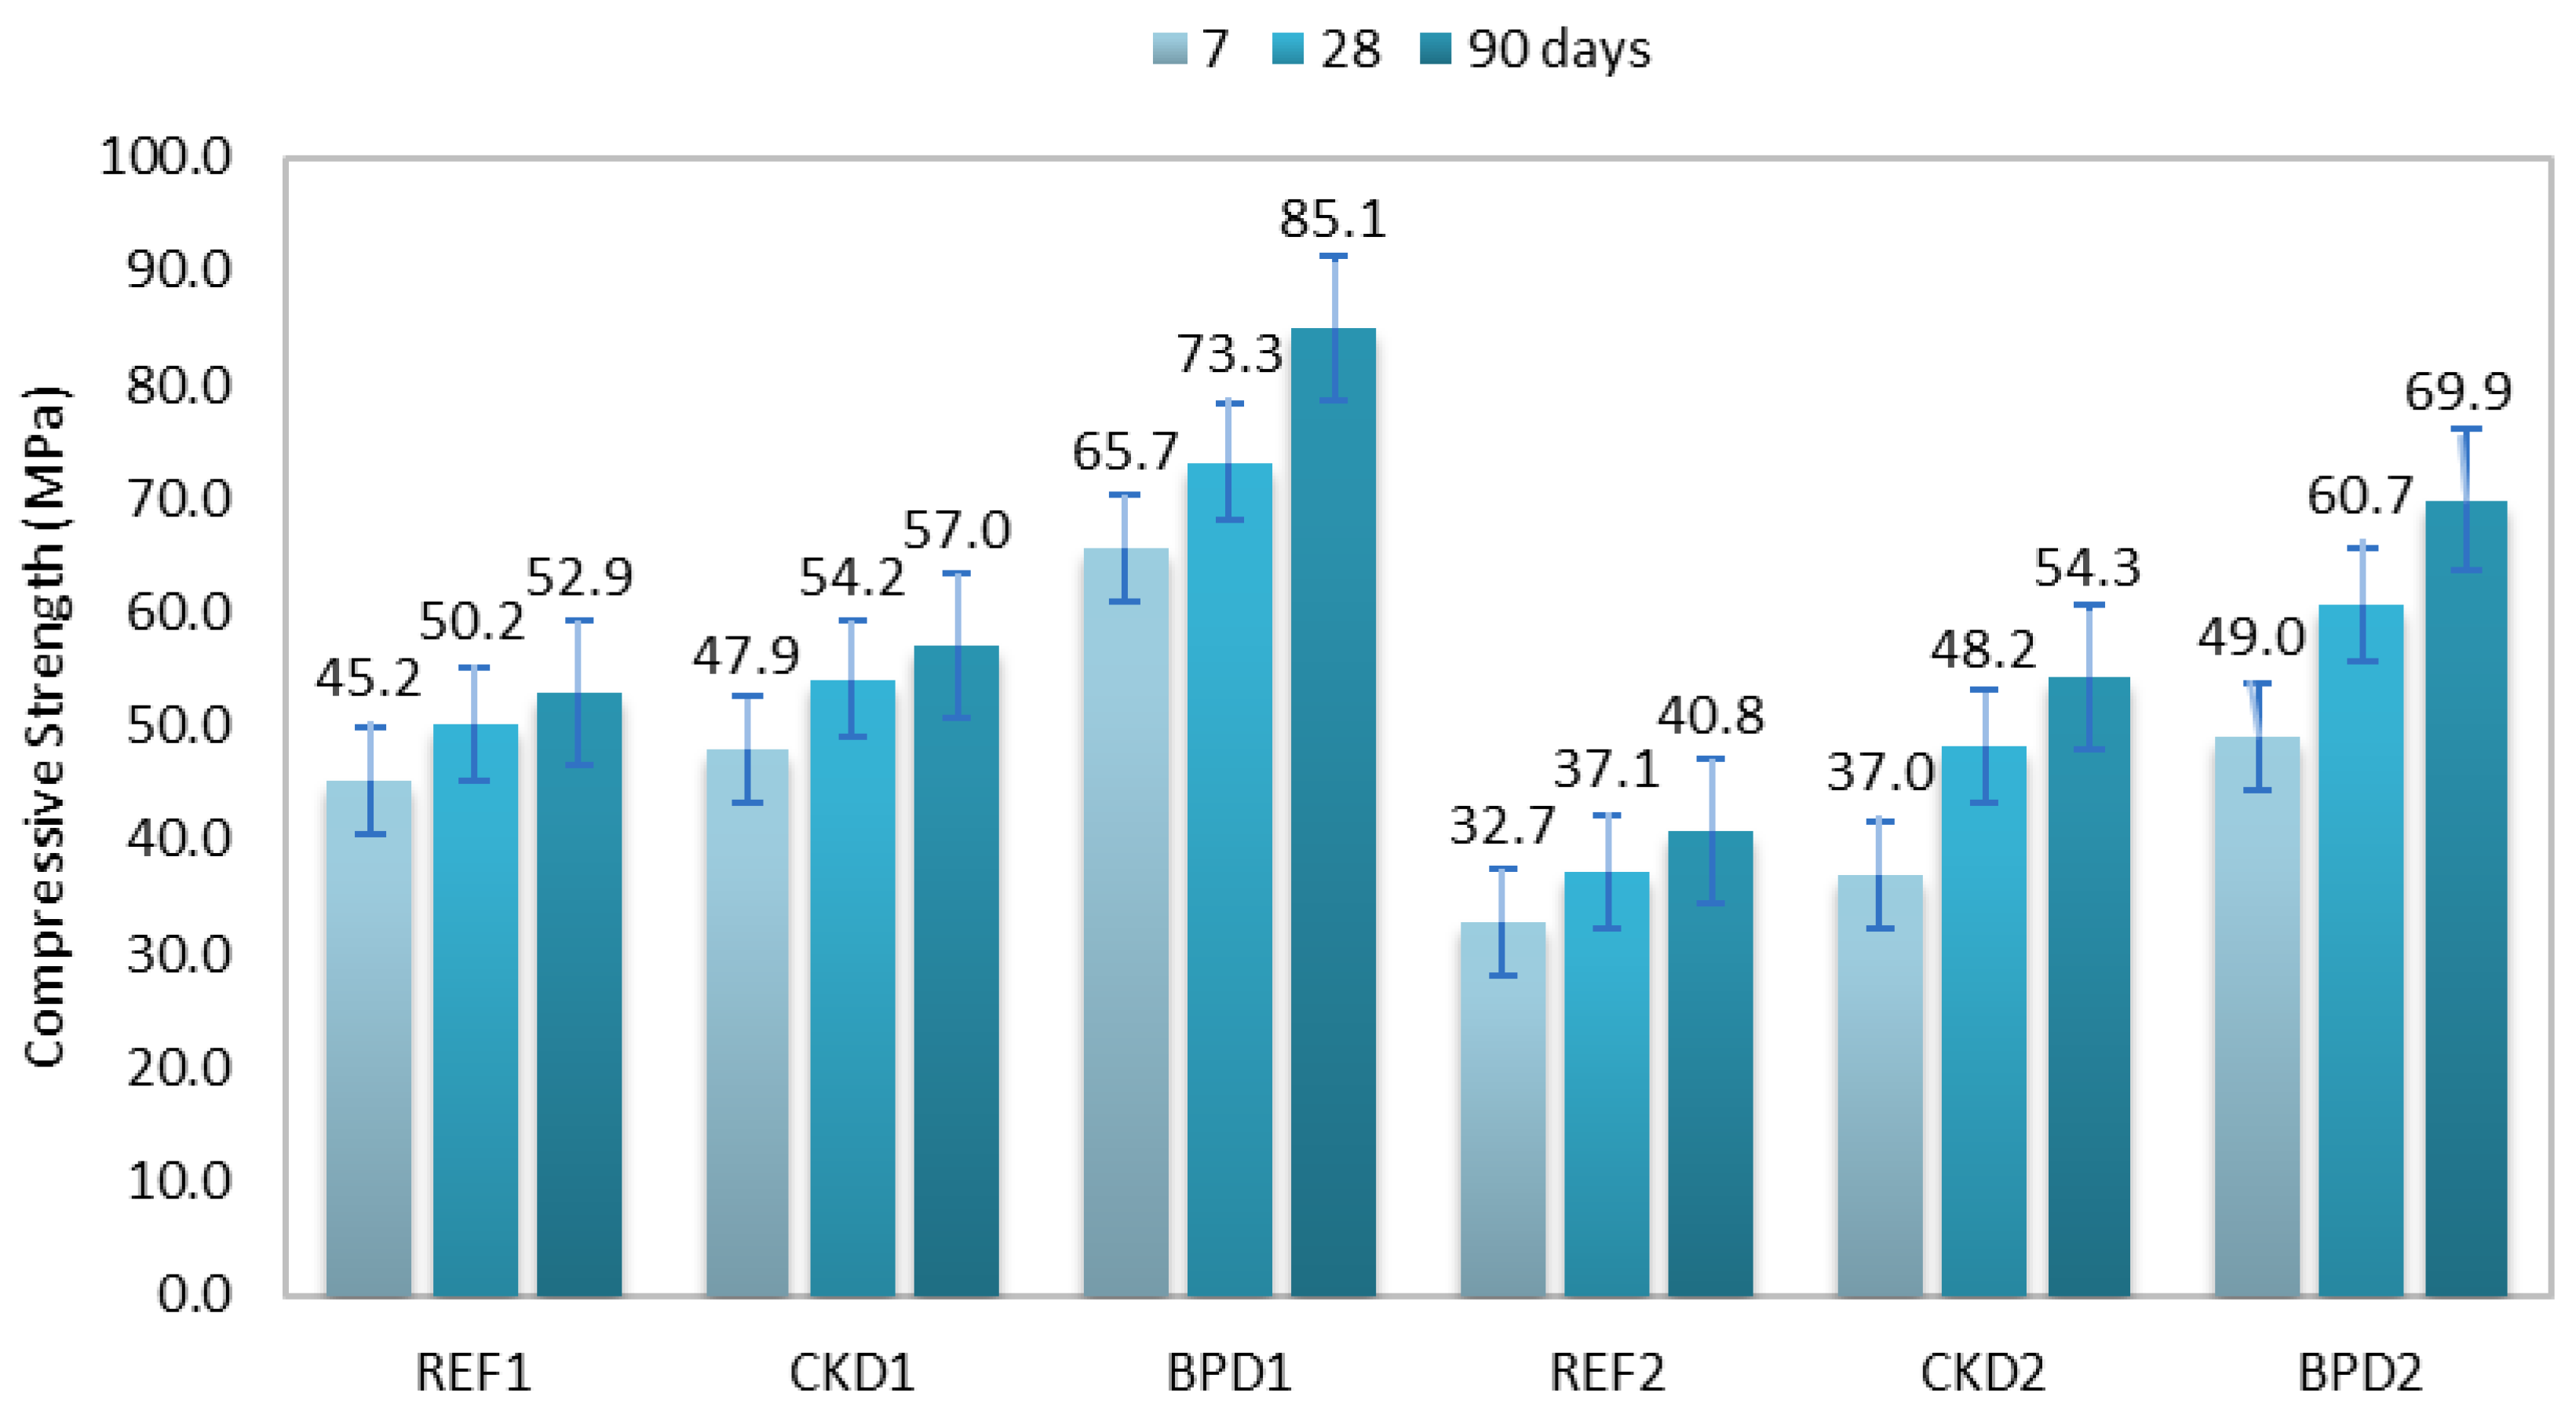
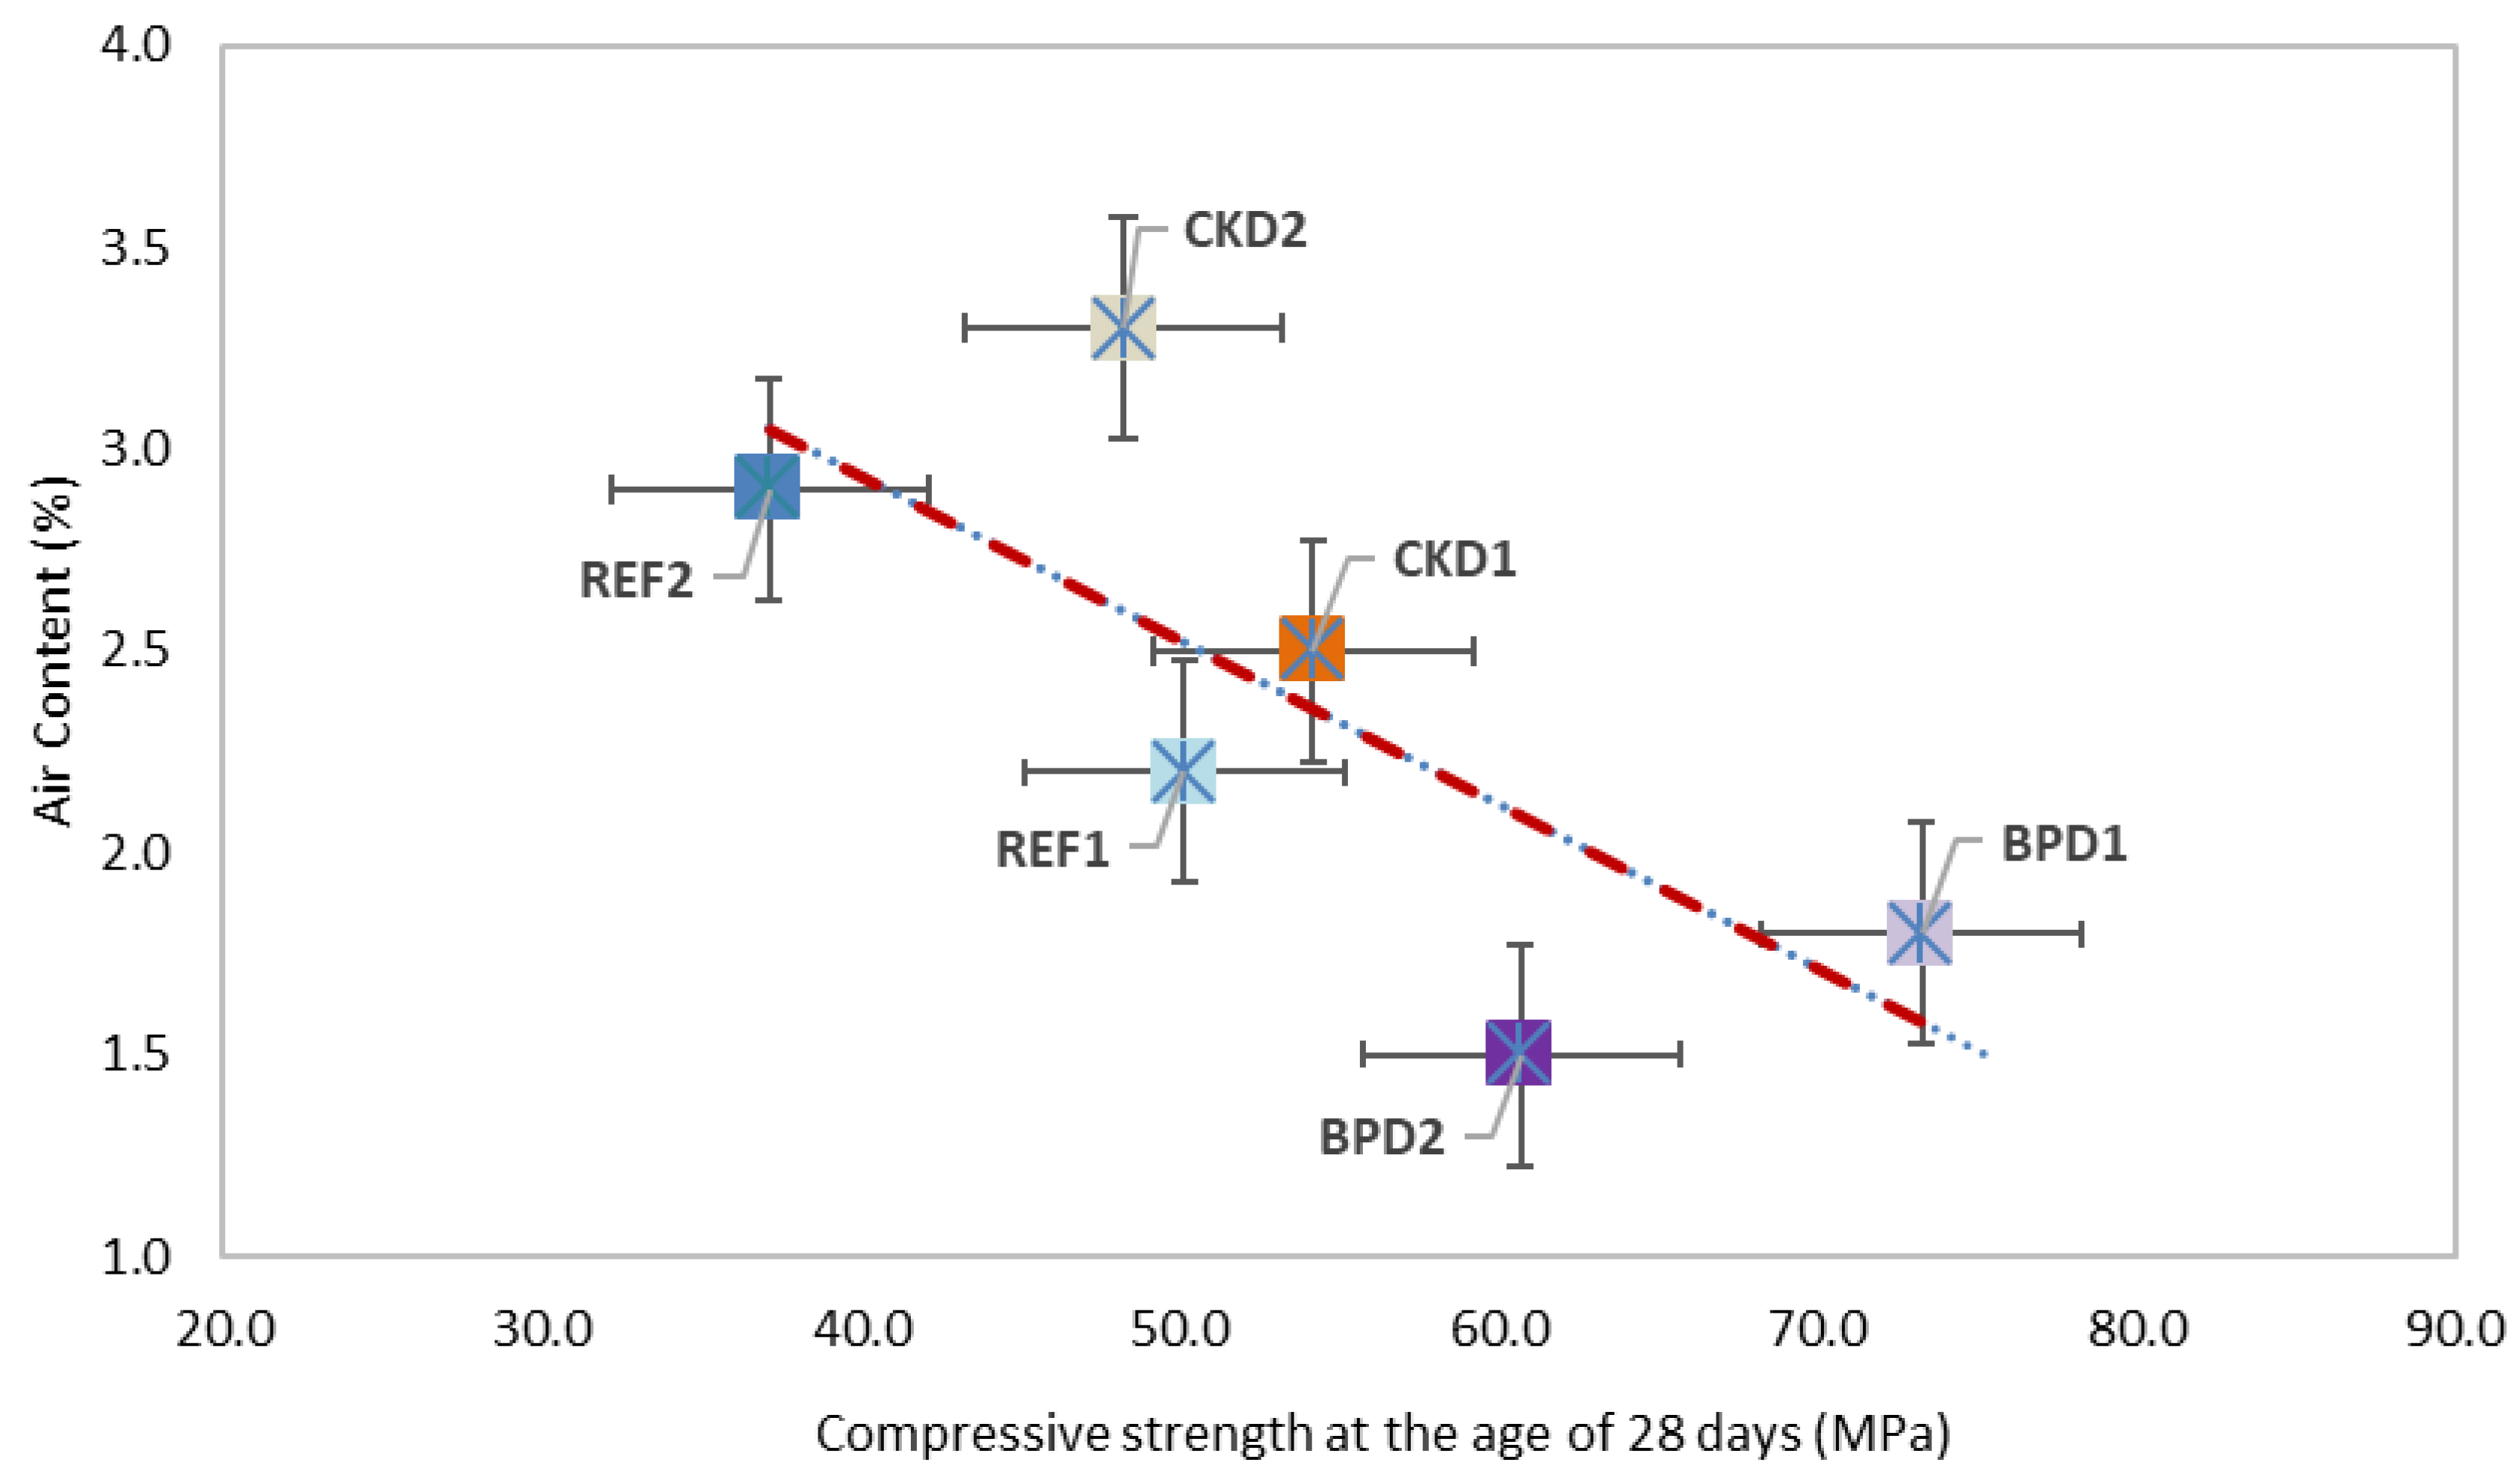
In Figure 5 the compressive strength at 7, 28 and 90 days is illustrated for all six SCC compositions. Comparing the reference mixtures of the two series, it is observed that the compressive strength of REF1 at the age of 28 days is 26% higher than the corresponding strength of REF2. This is explained by the increase of the water-to-cement ratio (0.66 instead of 0.60). The high MP content (200 kg/m3 and 250 kg/m3 respectively) in conjunction with the low cement content of both reference compositions led to a slightly decreased compressive strength due to the dilution effect [39,40]. The BPD1 mixture at the ages of 7 and 28 days developed the highest strength (65.7 MPa and 73.3 MPa, respectively), while BPD2 was the composition with the highest compressive strength among the series 2 mixtures (49.0 and 60.7, respectively). The acceleration of the early age strength could be partially explained by the presence of Cl- (Table 2) which constitute a well-known accelerator for the hydration of alite [41]. The high performance of SCC containing BPD can also be attributed to the presence of gypsum and anhydrate that led to a faster hydration of C3S and to the clinker mineral phases found in BPD (Figure 2) [37]. In addition, the high peak of hydration heat mainly due to SO3 presence and the accelerated hydration process due to the presence of anhydrite, are also related to the development of higher compressive strength [23]. The high compressive strength is further enhanced by the low content of entrapped air in the BPD1 and BPD2 mixtures (1.8% and 1.5%, respectively) as shown in Table 4 and Figure 6. Moreover, according to Shoaib et al., 2000 [38], the high content in dust chlorides and sulphates yield chloro-aluminate and sulpho-aluminate hydrates, while the high alkalies content of CKD tends to crystallize some hydration products. Both phenomena resulted in a hardened concrete matrix with a wider pore system. Nevertheless, in the studied SCC mixtures an increase in compressive strength was observed, which is attributed to the physical action of CKD fine particles in conjunction with the relatively low content of SO3, Cl- and alkalies as shown in Table 2. In other words, the physical action (filler effect) of CKD fine particles counteracts the negative effect of alkalies on the compressive strength due to C3S consumption [41].
At the age of 90 days the compressive strength of the REF1 and REF2 compositions increased slightly compared to that of 28 days, which indicates that MP is expectedly inactive in terms of pozzolanicity. Similarly, CKD, illustrating a compressive strength increase from 28 to 90 days as low as 5% and 12.5% for series 1 and series 2, respectively, and therefore it could also be considered as a material of low reactivity (inert or semi-inert) [3,18]. On the contrary, BPD contributed to late hydration reactions, resulting in a high ratio of approximately 15% of 90-to-28 days compressive strength for both series. The pozzolanic reactivity of BPD has also been confirmed by Singh et al., 1995 [42], after examining the consumption of calcium hydroxide obtained from the hydration of the cement paste. Moreover, according to the XRD analysis, BPD contains a comparatively higher amount of amorphous phases than what is expected to react with calcium hydroxide at late ages, and probably this amount was totally consumed by the CH surplus at the late age of hydration [23].
Specifically, in Figure 6, the effect of the air content on compressive strength is in depth understood with the aim of graphic illustration. As the void content increases the compressive strength tends to decrease while the above tendency deviates from the linearity given by the trendline depicted due to factors related to the specific properties of the different fine filler materials (chemical, physical, mechanical properties, videlicet), as well as differences in the mix design of concrete [5].

3.3. Modulus of Elasticity

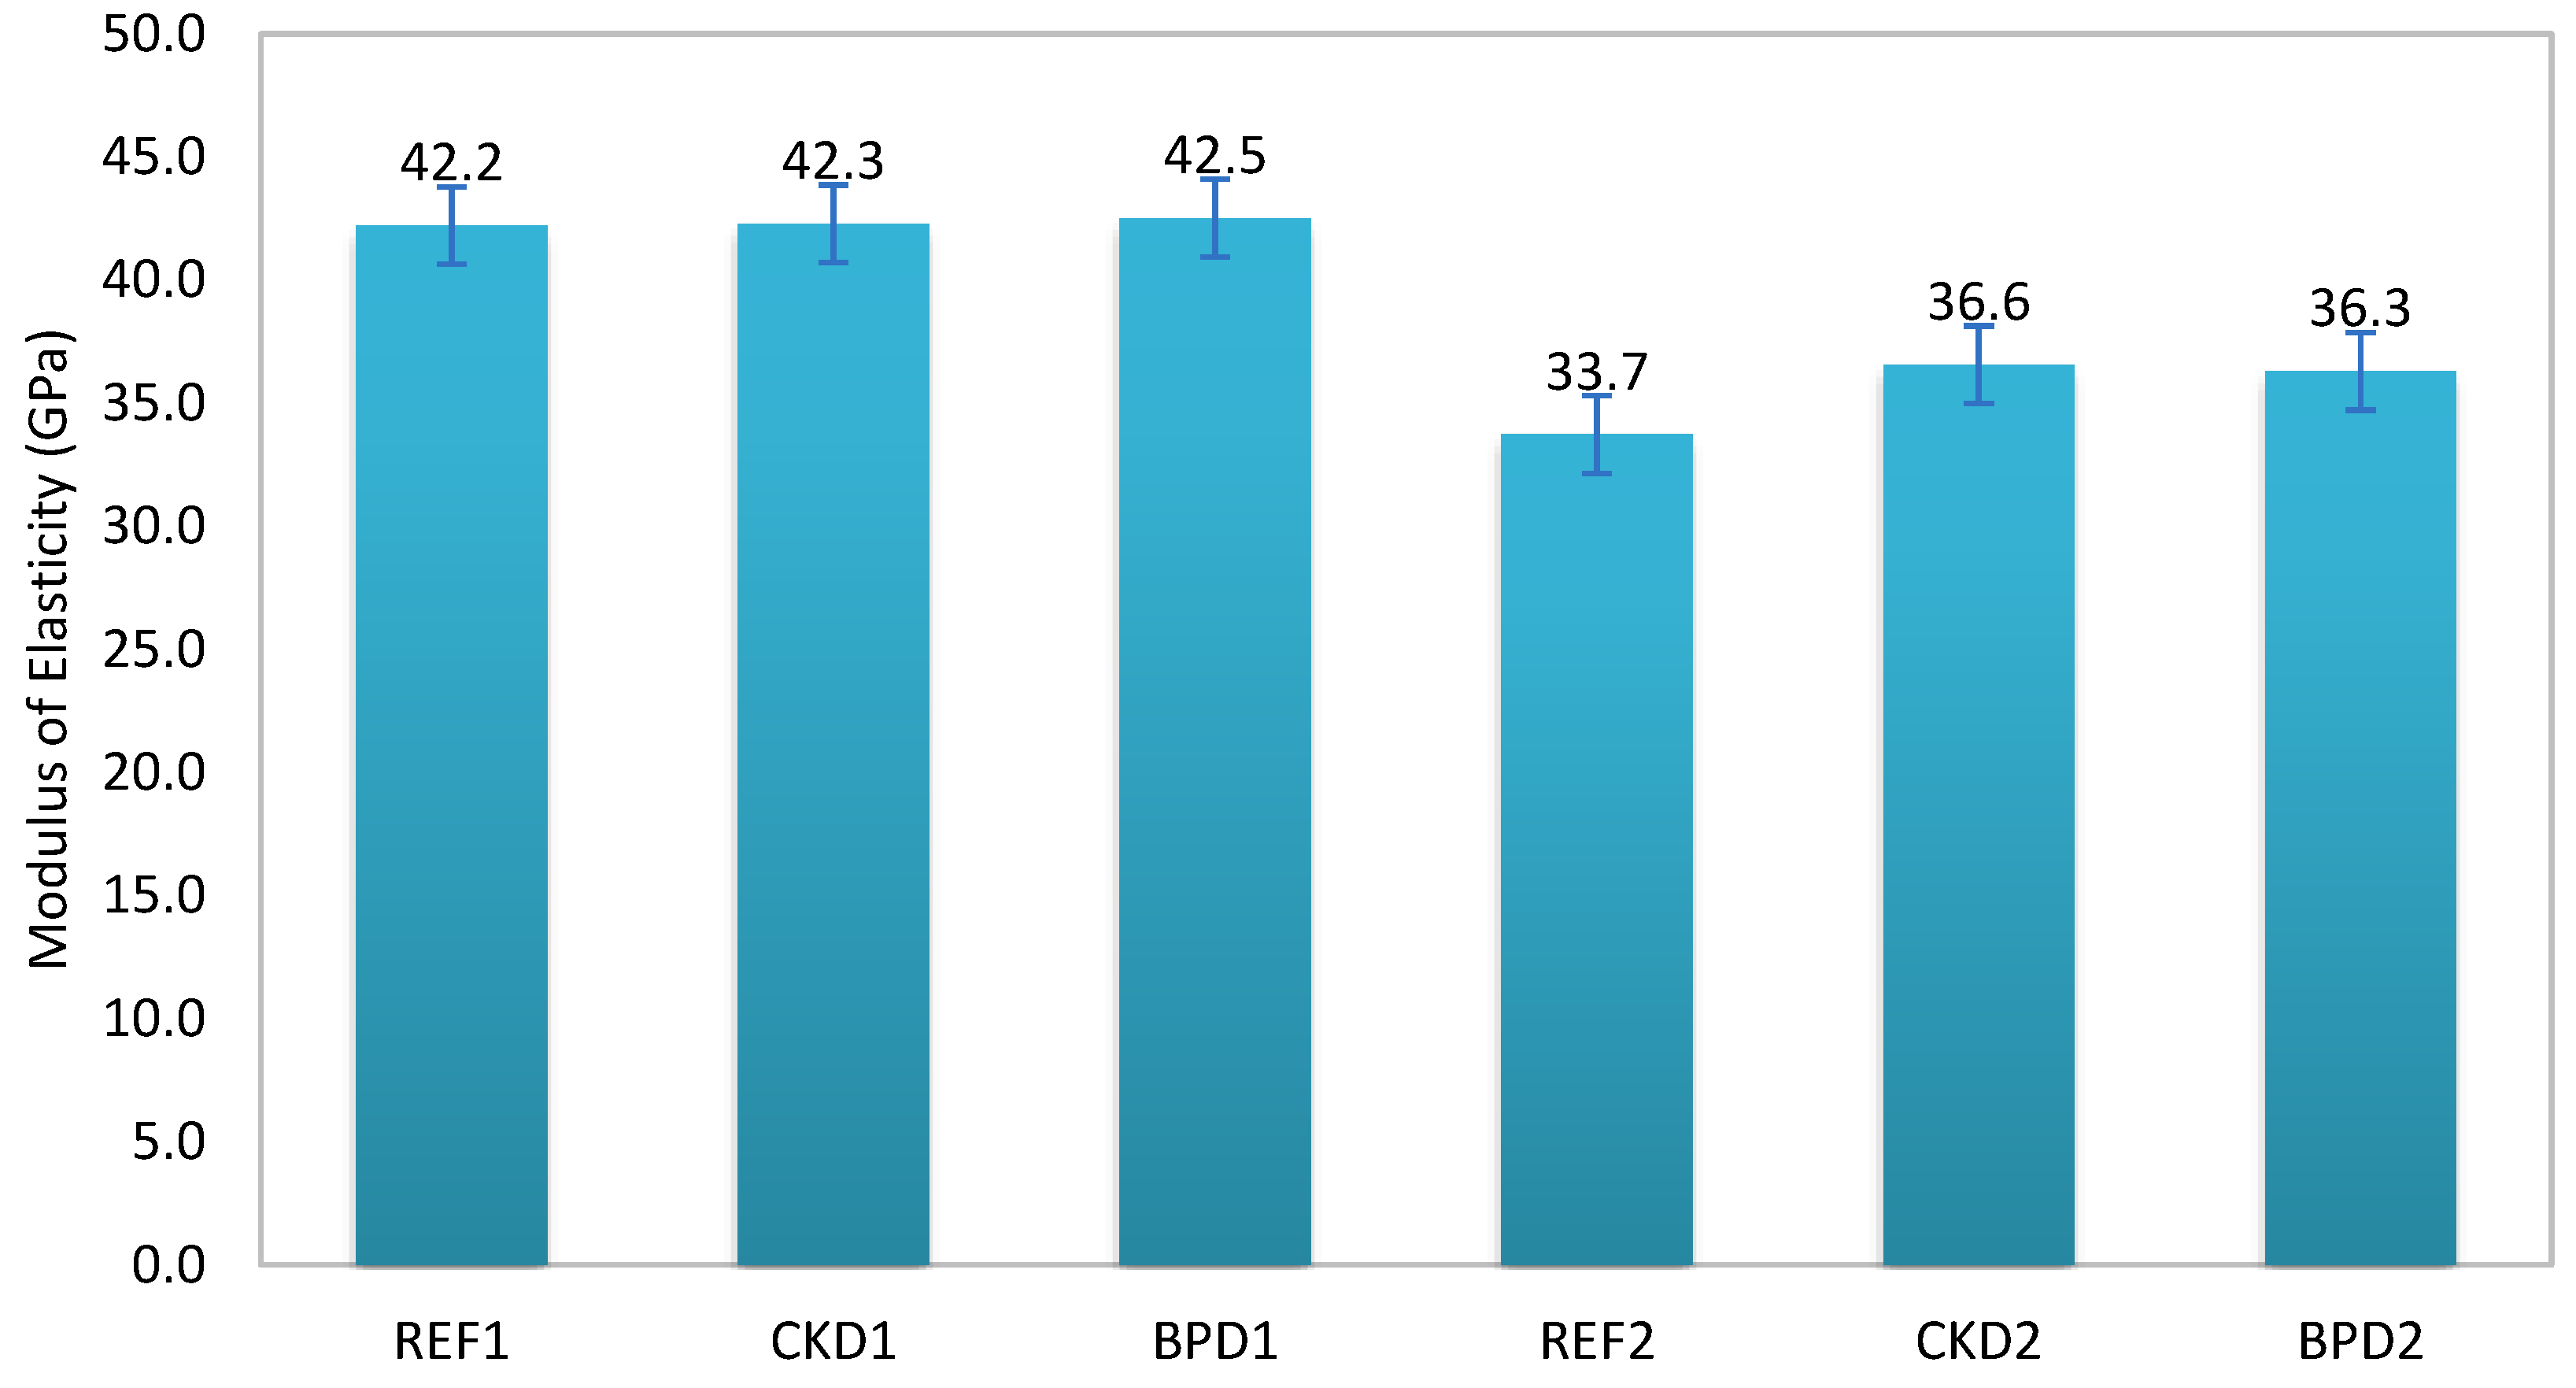
The moduli of elasticity for SCC compositions as calculated from the stress - strain diagrams are illustrated in Figure 7. All compositions were characterized by high values of the modulus of elasticity possibly due to the high degree of MP content, an inert powder of higher hardness than that of cement paste, which fills the voids between the coarser aggregates and optimizes the packing density of the granular skeleton [11]. For the REF1, CKD1 and BPD1 compositions the moduli of elasticity were calculated between 42.2 - 42.5 GPa at the age of 28 days with negligible deviations observed among them. The moduli of elasticity of the CKD2 and BPD2 compositions were similar (36.6 GPa and 36.3 GPa, respectively), while the REF2 had the lower modulus of elasticity (33.7 GPa), following a similar trend to that observed for the compressive strength. The lower moduli of elasticity of the series 2 specimens in comparison with the corresponding ones of series 1 are attributed to the highest paste-to-aggregate and water-to-binder ratios. It should be mentioned that the measurements of the elastic moduli were taken on water-saturated specimens, resulting in an approximately 15% increase in the results compared to dry specimens [43].

3.4. Tensile Splitting and Flexural Strength

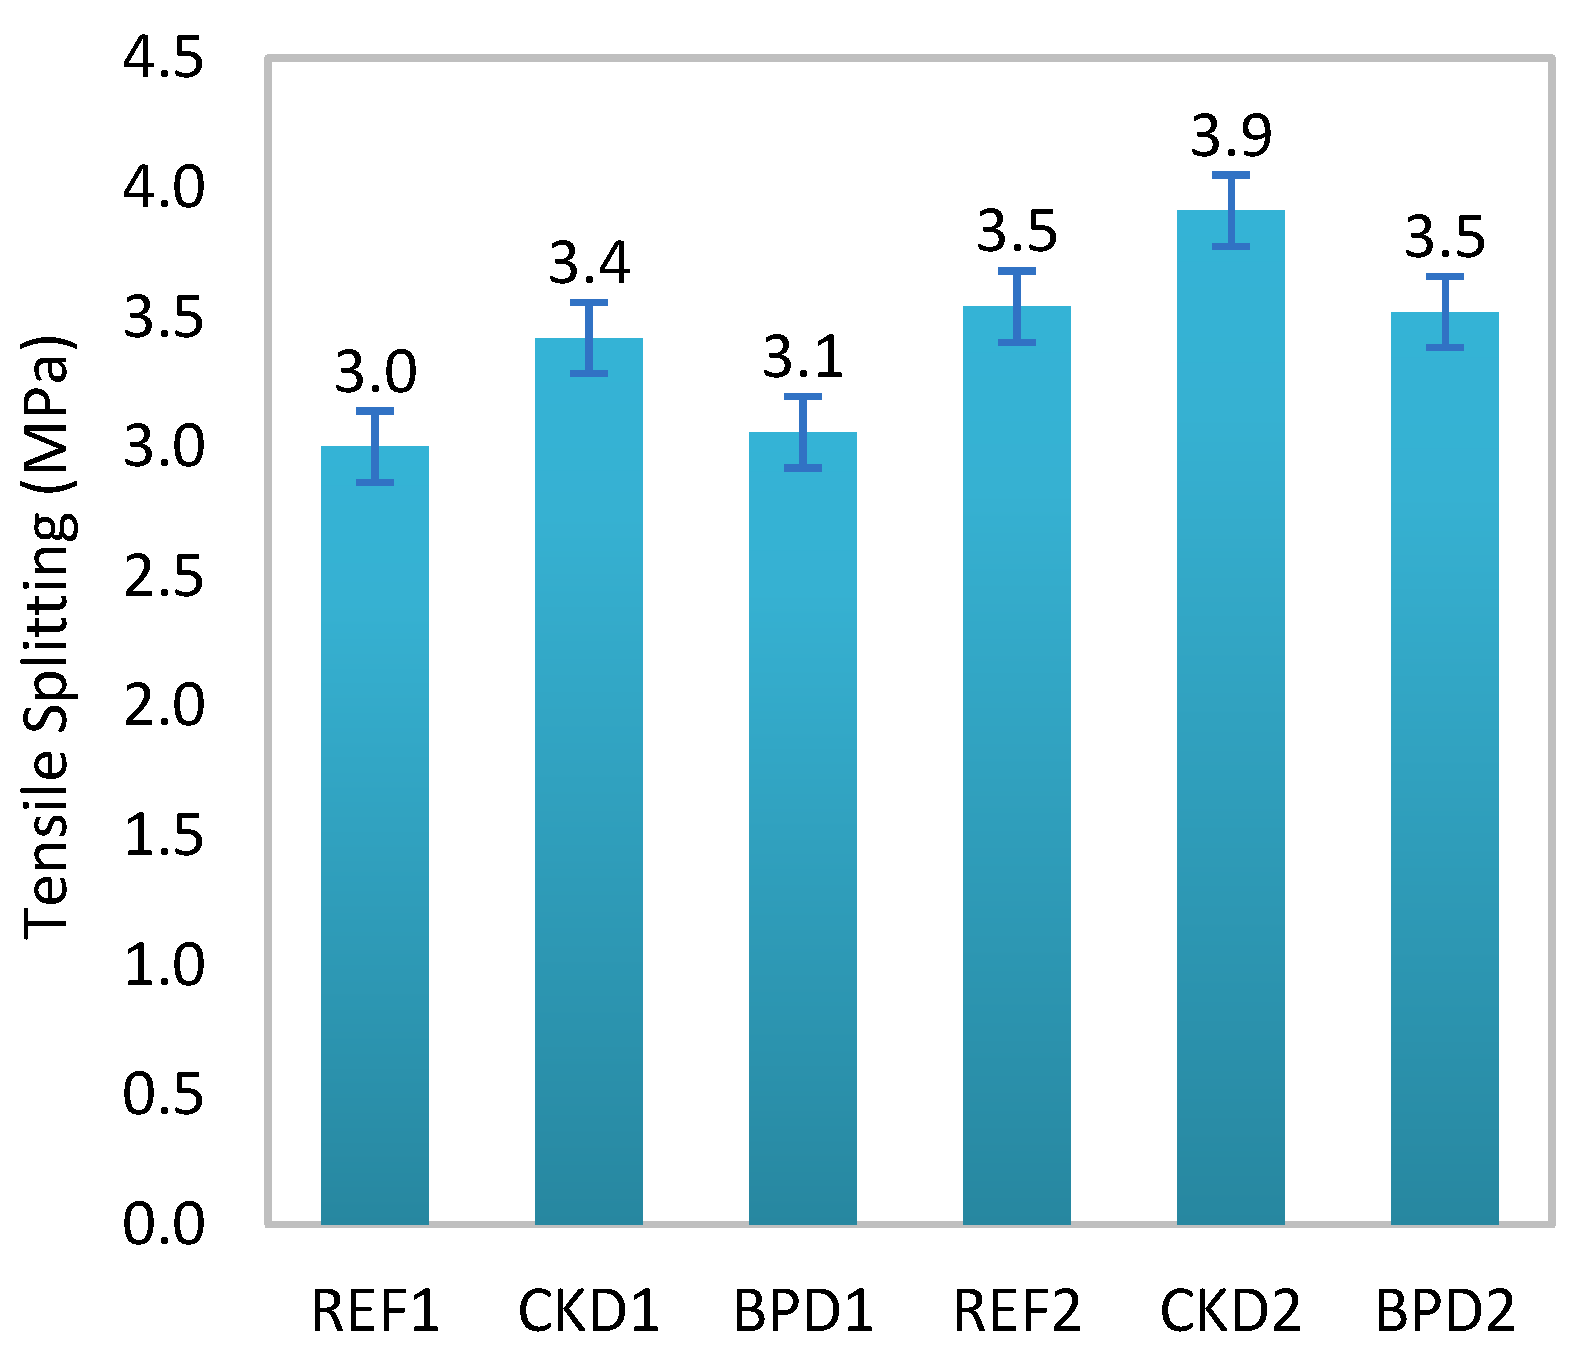
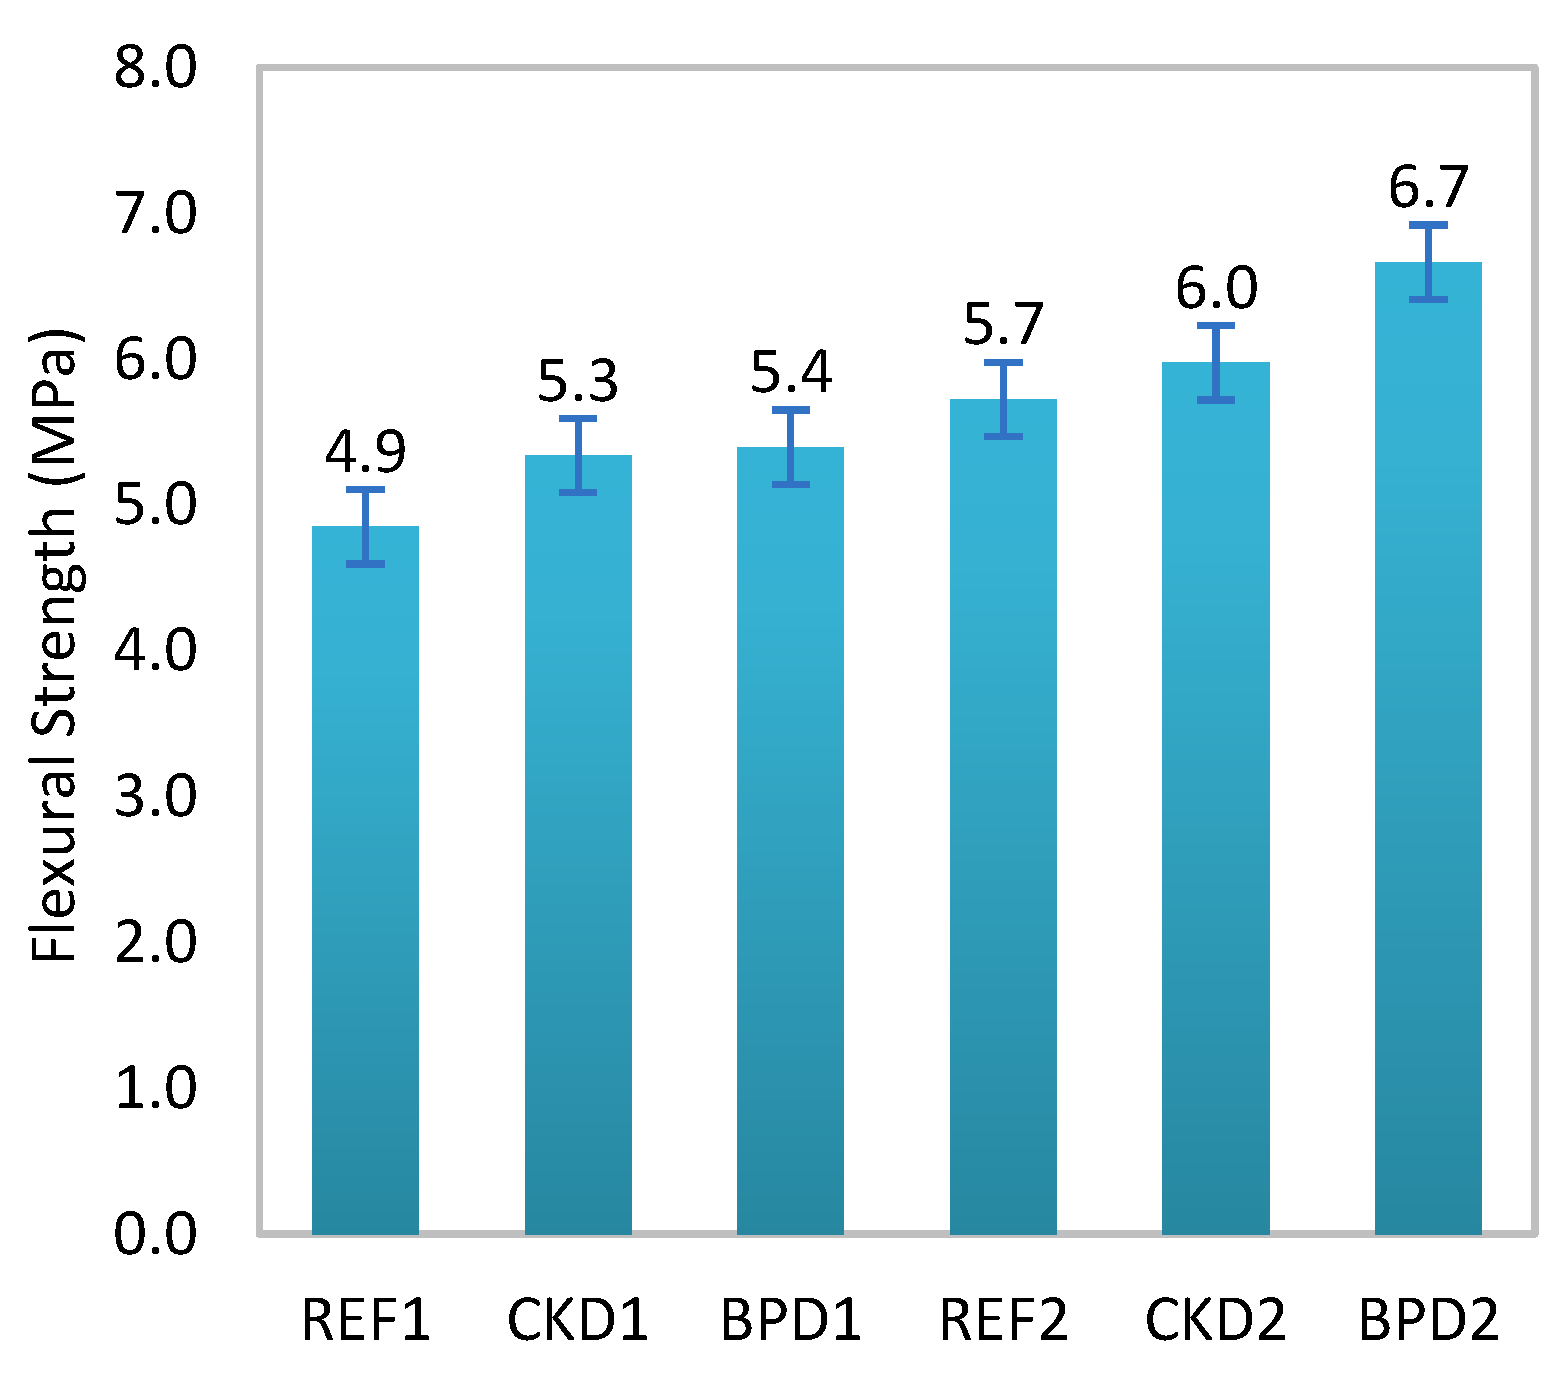
Figure 8 and Figure 9 provide useful information about the tensile splitting and the flexural strengths. The tensile splitting test results of REF1 and BPD1 were almost identical ranging between 3.0 – 3.1 MPa. The CKD1 composition had a slightly higher strength (3.4 MPa) a rather unexpected result due to the high compressive strength of BPD concrete, as well as the common upward trend between the compressive and the tensile strengths. This trend was confirmed, however, with the specimens of series 2 as the compositions REF2 and BPD2 reached the same tensile splitting strength (3.5 MPa), which again was lower than the corresponding strength of the CKD2 composition (3.9 MPa). This unusual trend could be attributed to the fineness of CKD particles in comparison with that of the BPD particles, which forms an interfacial transitional zone of lower porosity and of denser microstructure [43]. The BPD1 and REF1 compositions achieved the highest and lowest flexural strengths of 5.4 MPa and 4.9 MPa respectively among the compositions of series 1, while the CKD1 mixture failed approximately at the same load as BPD1. Among the mixtures of series 2, REF2 also had the lowest flexural strength of 4.9 MPa, while BPD2 achieved the highest flexural strength of 6.7 MPa, following the compressive strength trend given in Figure 5. What should be noted is that the flexural strength would probably have higher values, however, the specimens were not water-cured but air-cured instead, in a curing chamber with constant conditions (24°C, 65% RH), due to the drying shrinkage monitoring test. However, useful conclusions can be drawn about the effect of each filler on the SCC bonding strength.
The results of both the flexural and the tensile tests are very interesting as the series 2 compositions in both cases achieved higher strengths despite their lower compressive strength. This is attributed to the higher powder content (550 kg/m3 instead of 500 kg/m3) has a substantially beneficial effect on the microstructure of the interfacial transition zone and the intrinsic quality of the matrix affecting the tensile strength of concrete [43].

3.5. Hardened Visual Stability Index

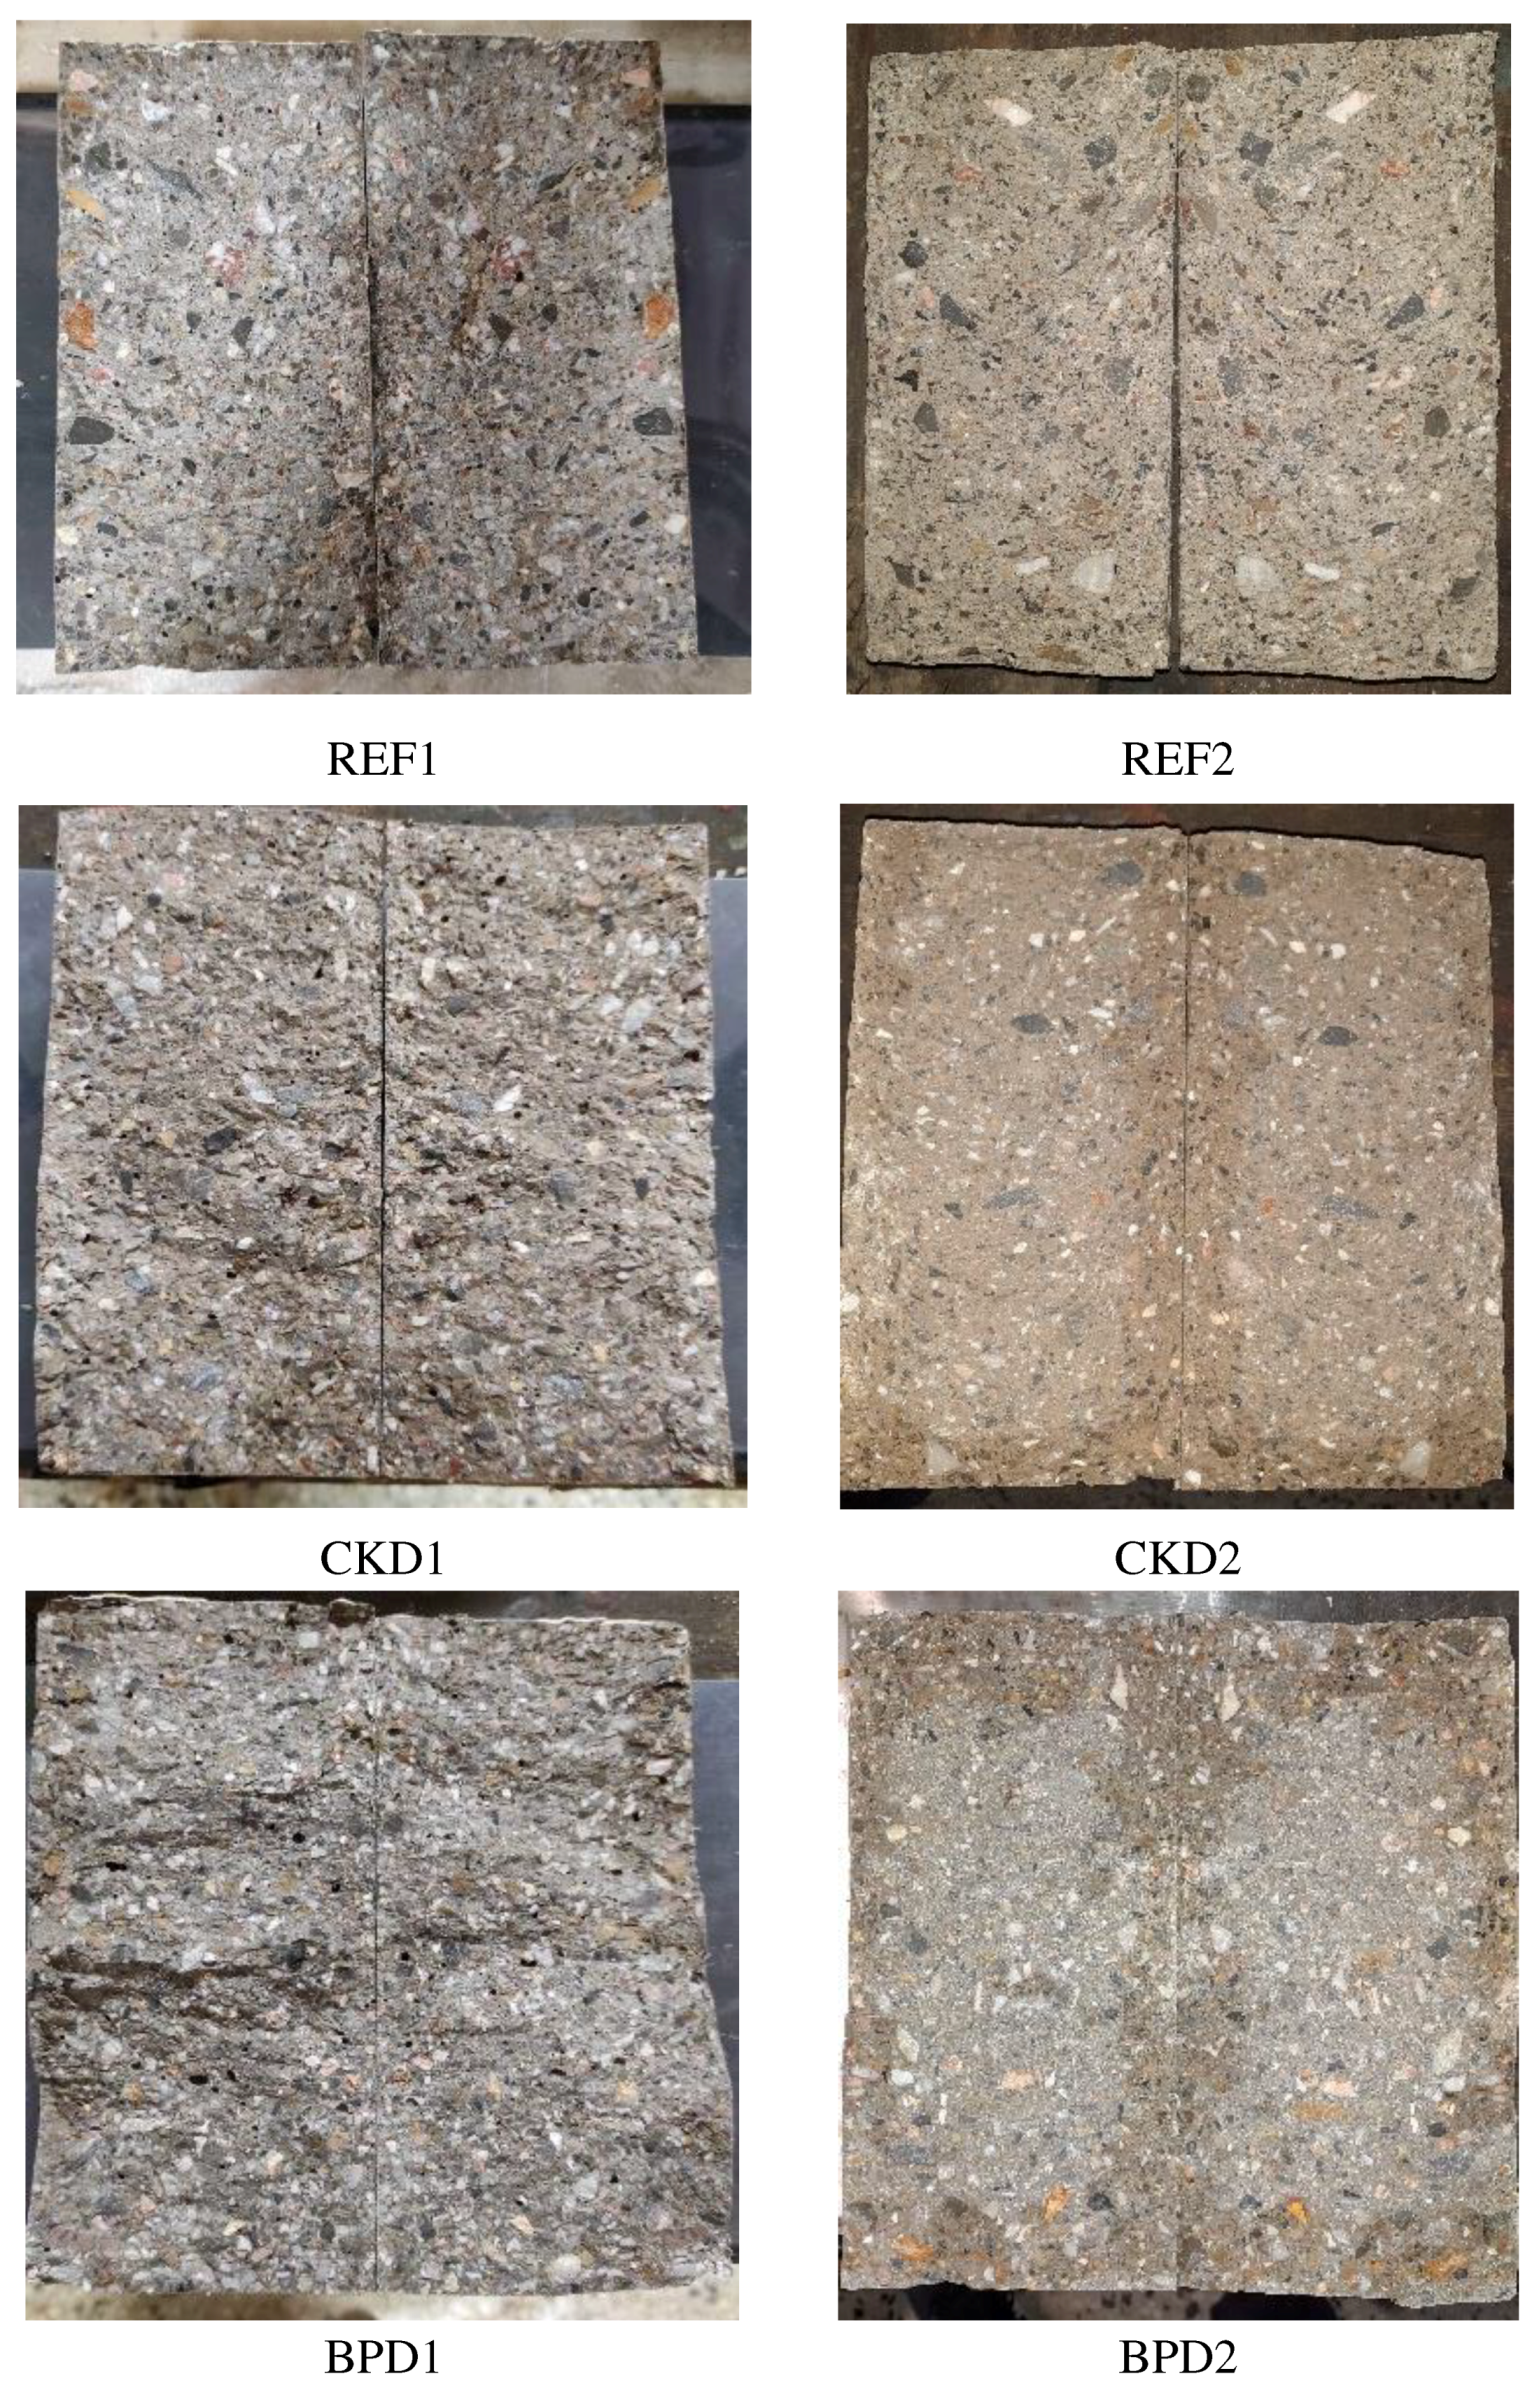
In Figure 10 some representative photos of the specimens (one for each SCC composition) after splitting are presented. The hardened visual stability indices (HVSI) for all SCC bisected cylinders are equal to 0, confirming an SCC production of high stability without any signs of static segregation or bleeding. A visual observation of the cross-sections of Figure 10 confirms the aforementioned clear by the absence of any mortar or paste layer on the top of the specimens or any lengthwise difference in the distribution of the coarse aggregates, despite the action of the gravitational forces. These results are even more impressive for the specimens of series 2 considering that they contain more water, and they are closer to the upper limit of the EFNARC Guidelines (210 kg/m3) [3]. On the other hand, the high paste volume and high percentage of fine powder content have a positive effect on the elimination of segregation phenomena [3]. Combining the HVSI with the sieve segregation test results (Table 4), it is concluded that the specific SCC mixtures designed for the present study constitute stable mixtures of high cohesion without showing any tendency of segregation or bleeding.

3.6. Drying Shrinkage

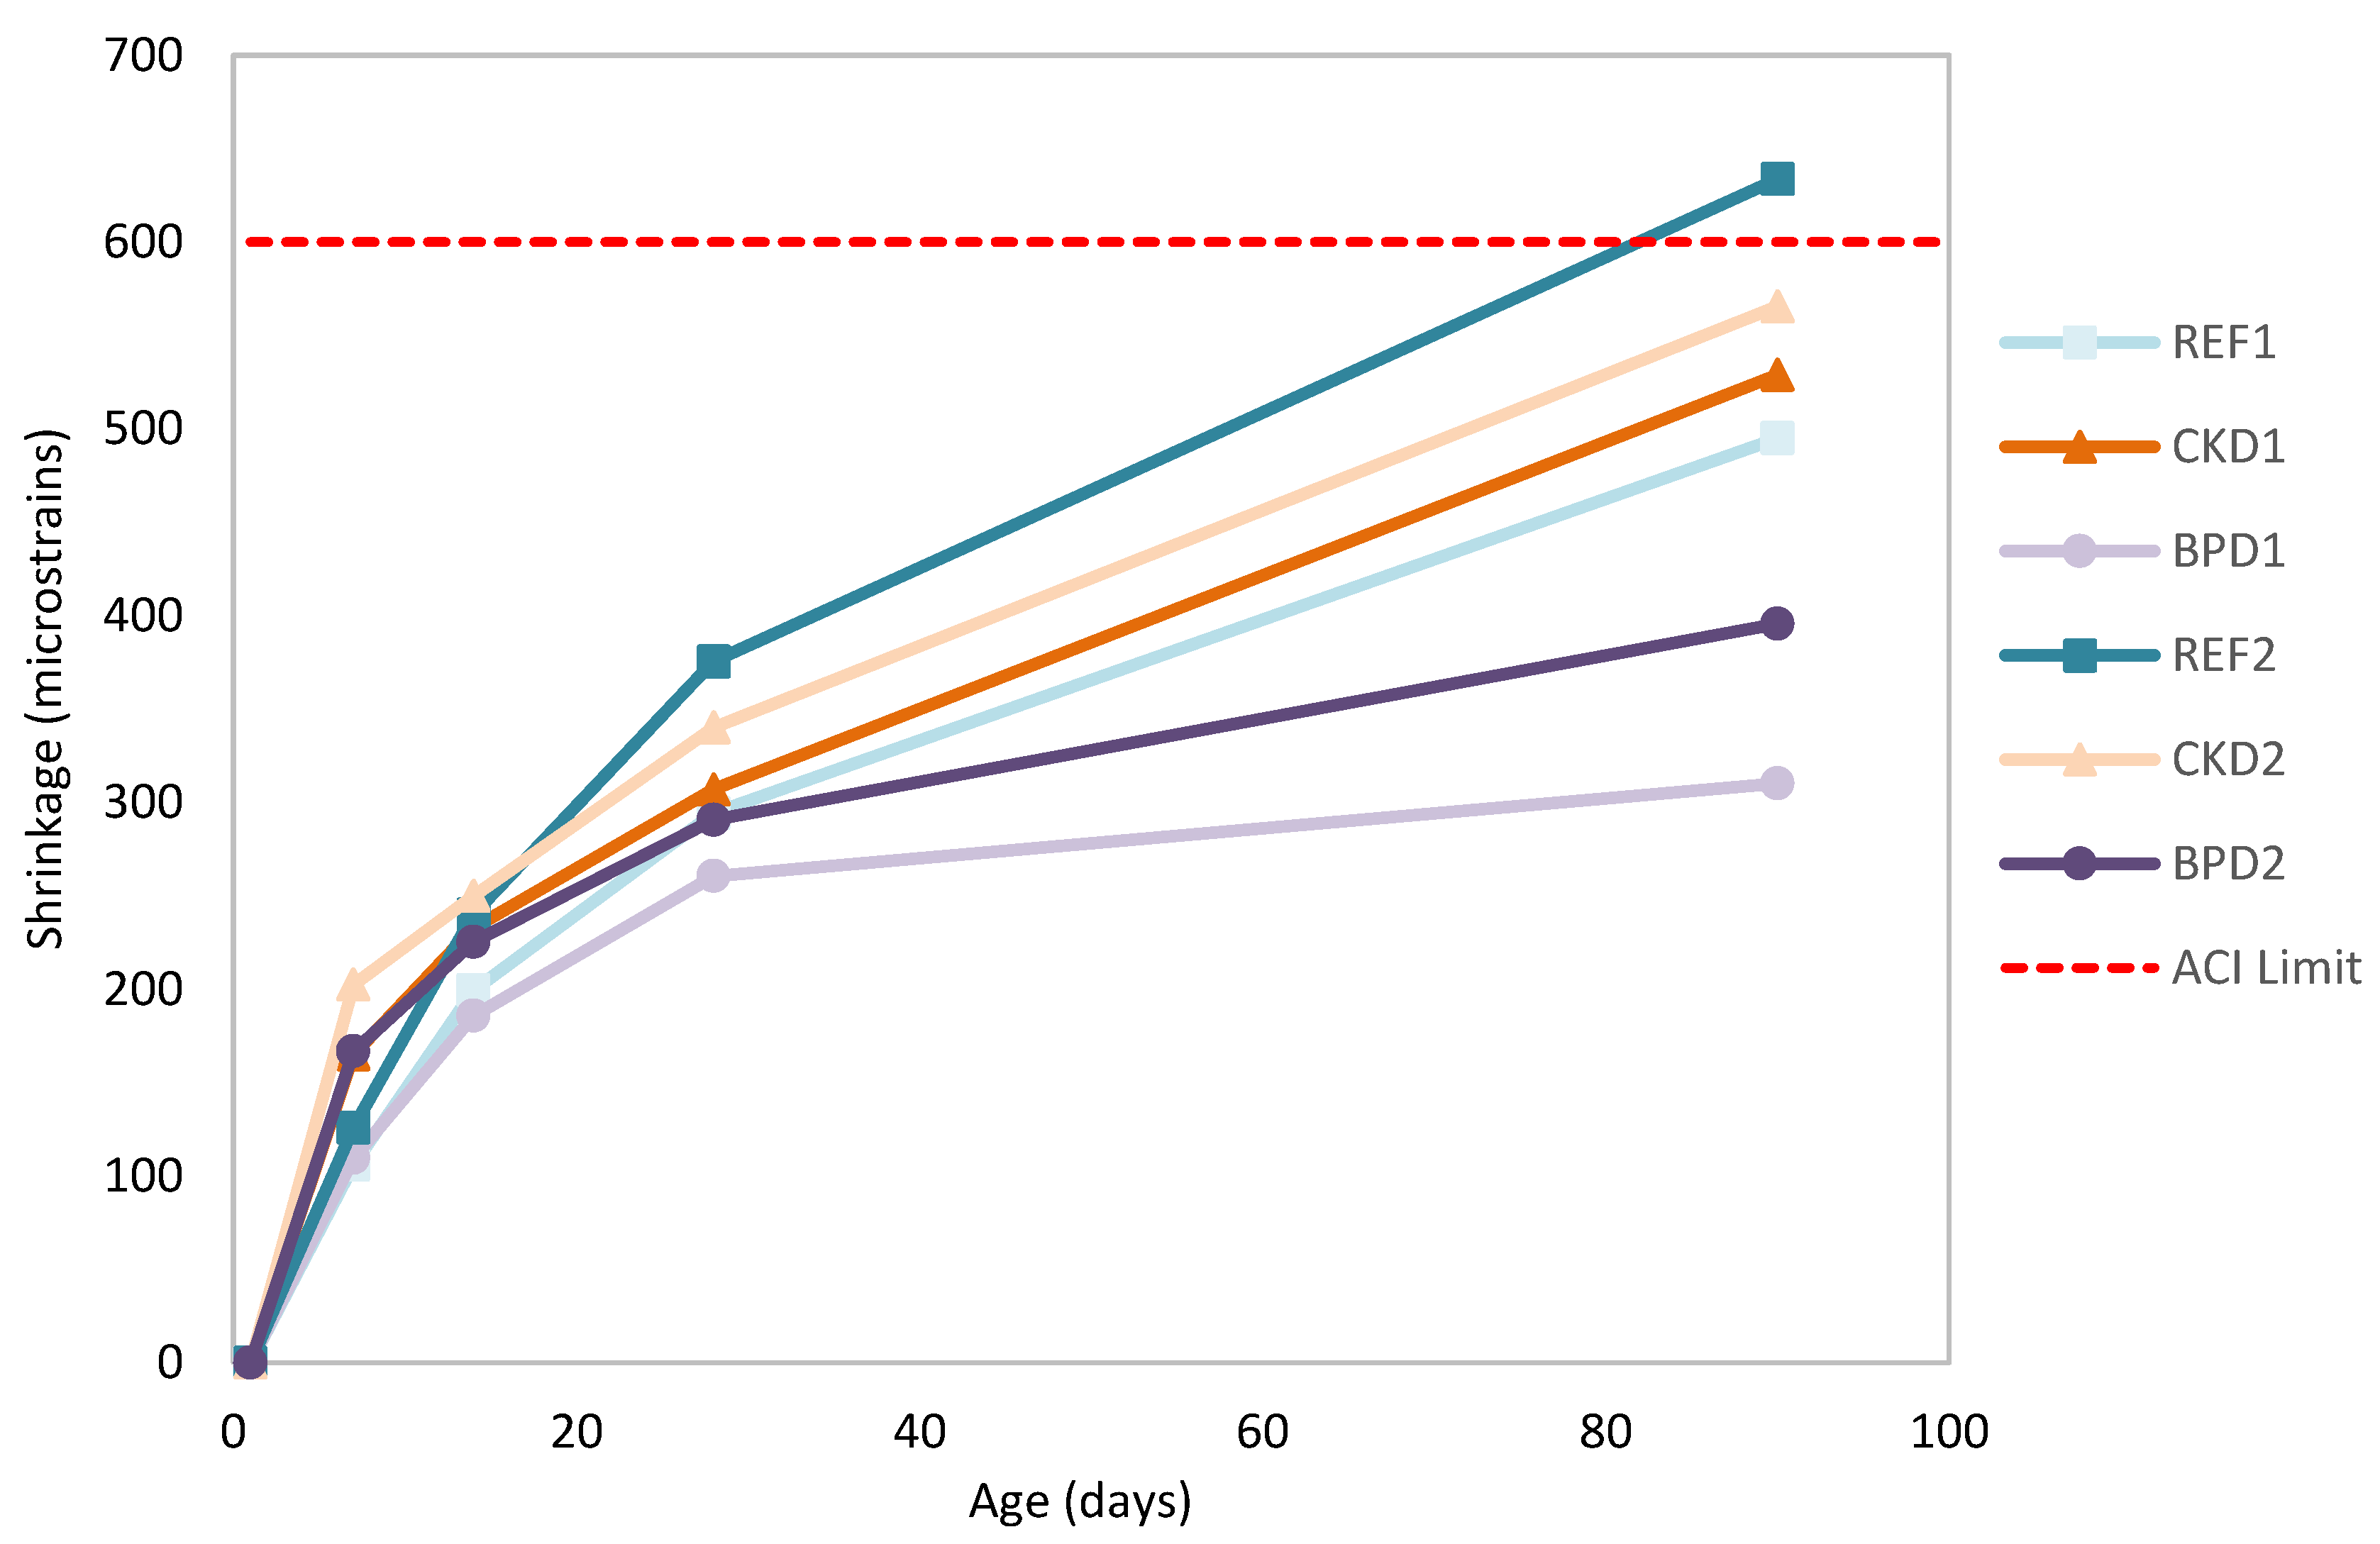
Figure 11 shows the evolution of the drying shrinkage of each composition at ages of 7, 14, 28 and 90 days, with respect to the corresponding limit for the drying shrinkage as defined by the ACI 224R-01 [44]. REF2 is the only composition that its shrinkage marginally exceeded the above limit, registered by 28% greater values than REF1 after 90 days. This could be attributed to the increased w/c ratio and to the finer particles of the MP. It is known that by increasing the w/c ratio, the shrinkage increases due to higher interconnected permeable voids and the lower values of modulus of elasticity [43], as shown in the Figure 7. Additionally, according to the literature [17] the fine particles of MP could act as a nucleation sites advancing the hydration degree and enhancing the formation of the hydration products, which leads to a higher autogenous shrinkage, as well [11]. Nevertheless, the results of both the hydration heat [23] and the compressive strength (Figure 5) didn’t imply any significant differences between the samples as far as the hydration rate is concerned. Thus, only the higher w/c ratio could be considered that affected the recorded shrinkage level.
On the other hand, the mixtures containing CKD and BPD in replacement of MP, showed a clearly lower level of drying shrinkage. This improvement is attributed to the higher rate of compressive strength development (Figure 5) and the higher values of the modulus of elasticity (Figure 7) that both limit the deformation of the material. Furthermore, the high CaO content in BPD (Table 2), contributed into reduced shrinkage of SCC, due to the carbonation associated with high contents of magnesium and calcium oxides [19,43,45,46]. The better performance of the mixture containing BPD in comparison with CKD could be also attributed to its coarser granulometry (Table 1). More specifically, the coarser granulometry (D90: 12.27 μm, 14.66 μm and 115.63 μm for MP, CKD and BPD respectively) leads to lower capillary pressures due to the coarser porous structure and the larger total specific surface area [11,19,47]. In addition, the VMA incorporation in SCC mixtures with BPD1 (Table 4), contributed to its volume stability and therefore, to the lowest shrinkage (37% lower than REF1, after 90 days). VMA limits the water migration by bonding with water hydrogen and reduces evaporation [47]. Finally, the highest SP dosage in compositions containing BPD (BPD1 and BPD2) compared to the other SCC mixtures could also slightly contribute to the reduced drying shrinkage [48].
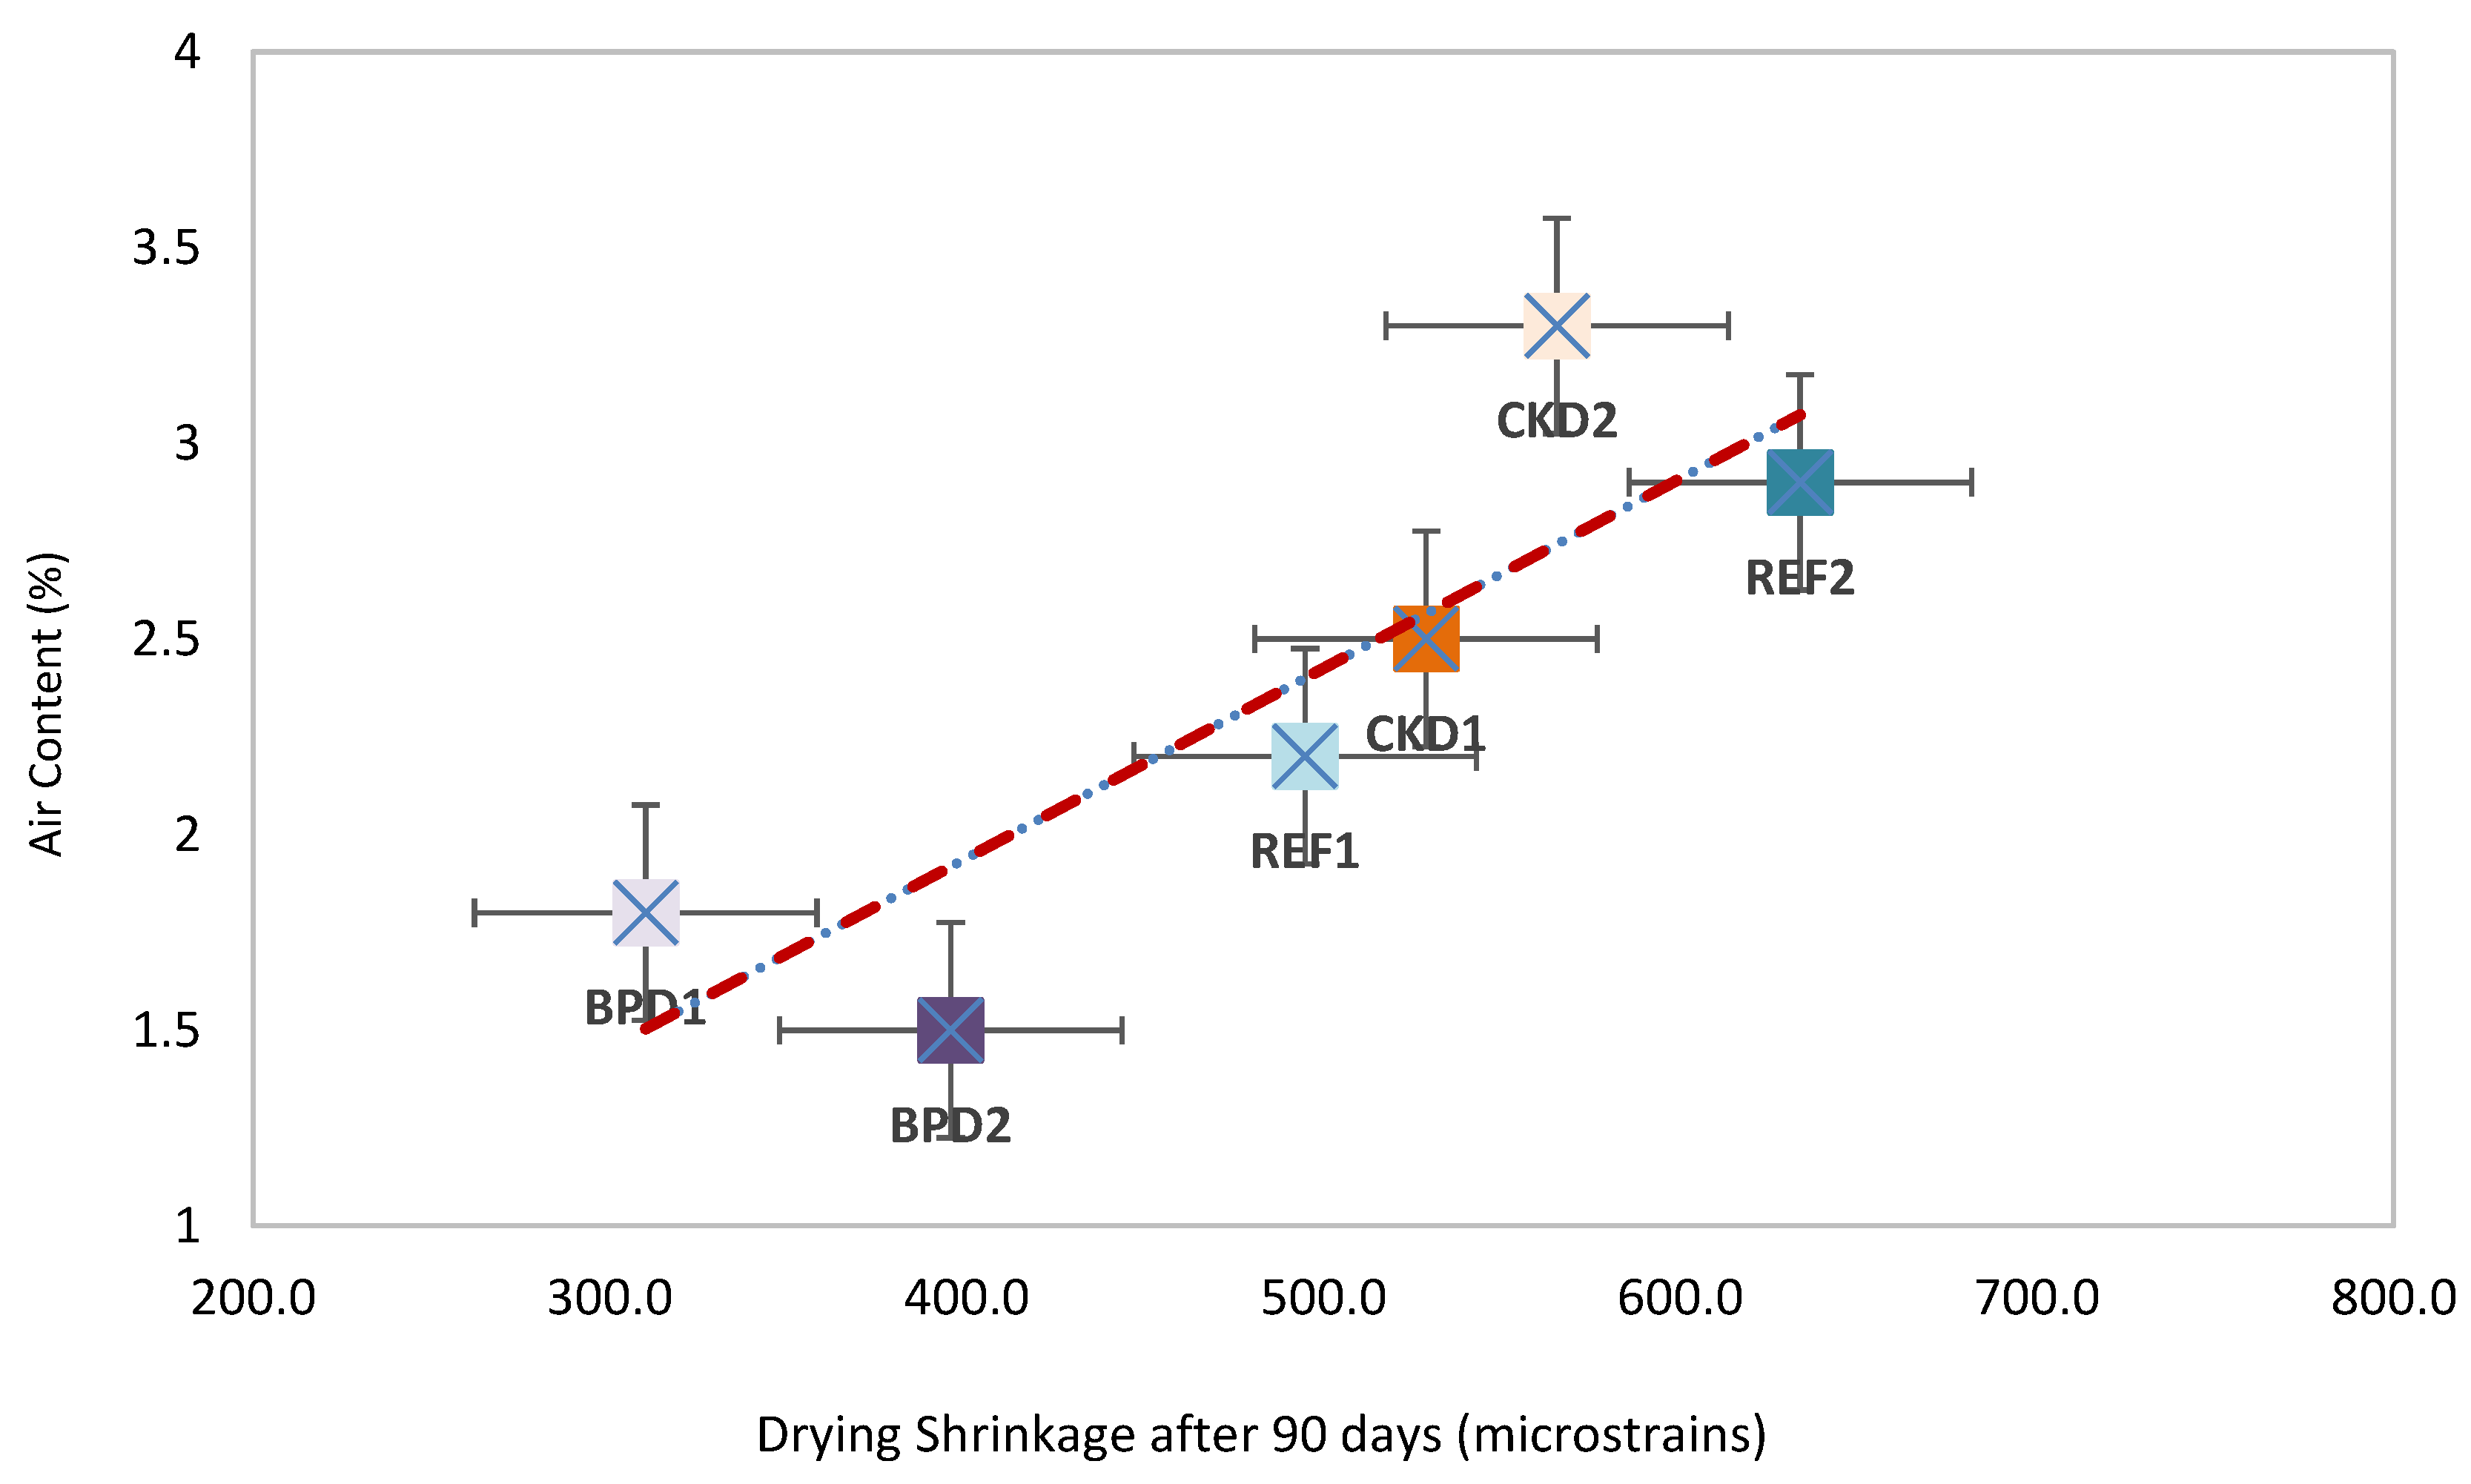
Figure 12 summarizes the correlation between air content, measured in fresh concrete mixtures and shrinkage, measured after 90 days of drying, showing a positive correlation between these properties. This tendency is caused by the porous microstructure of the air void – cement paste interfacial transition zone and the overlapping or interconnection between pores created by the entrapped air. Moreover, the increased air content and the permeable voids lead to an increase of the vapor diffusion in SCC, which accelerates the water loss and ultimately the drying shrinkage [49].
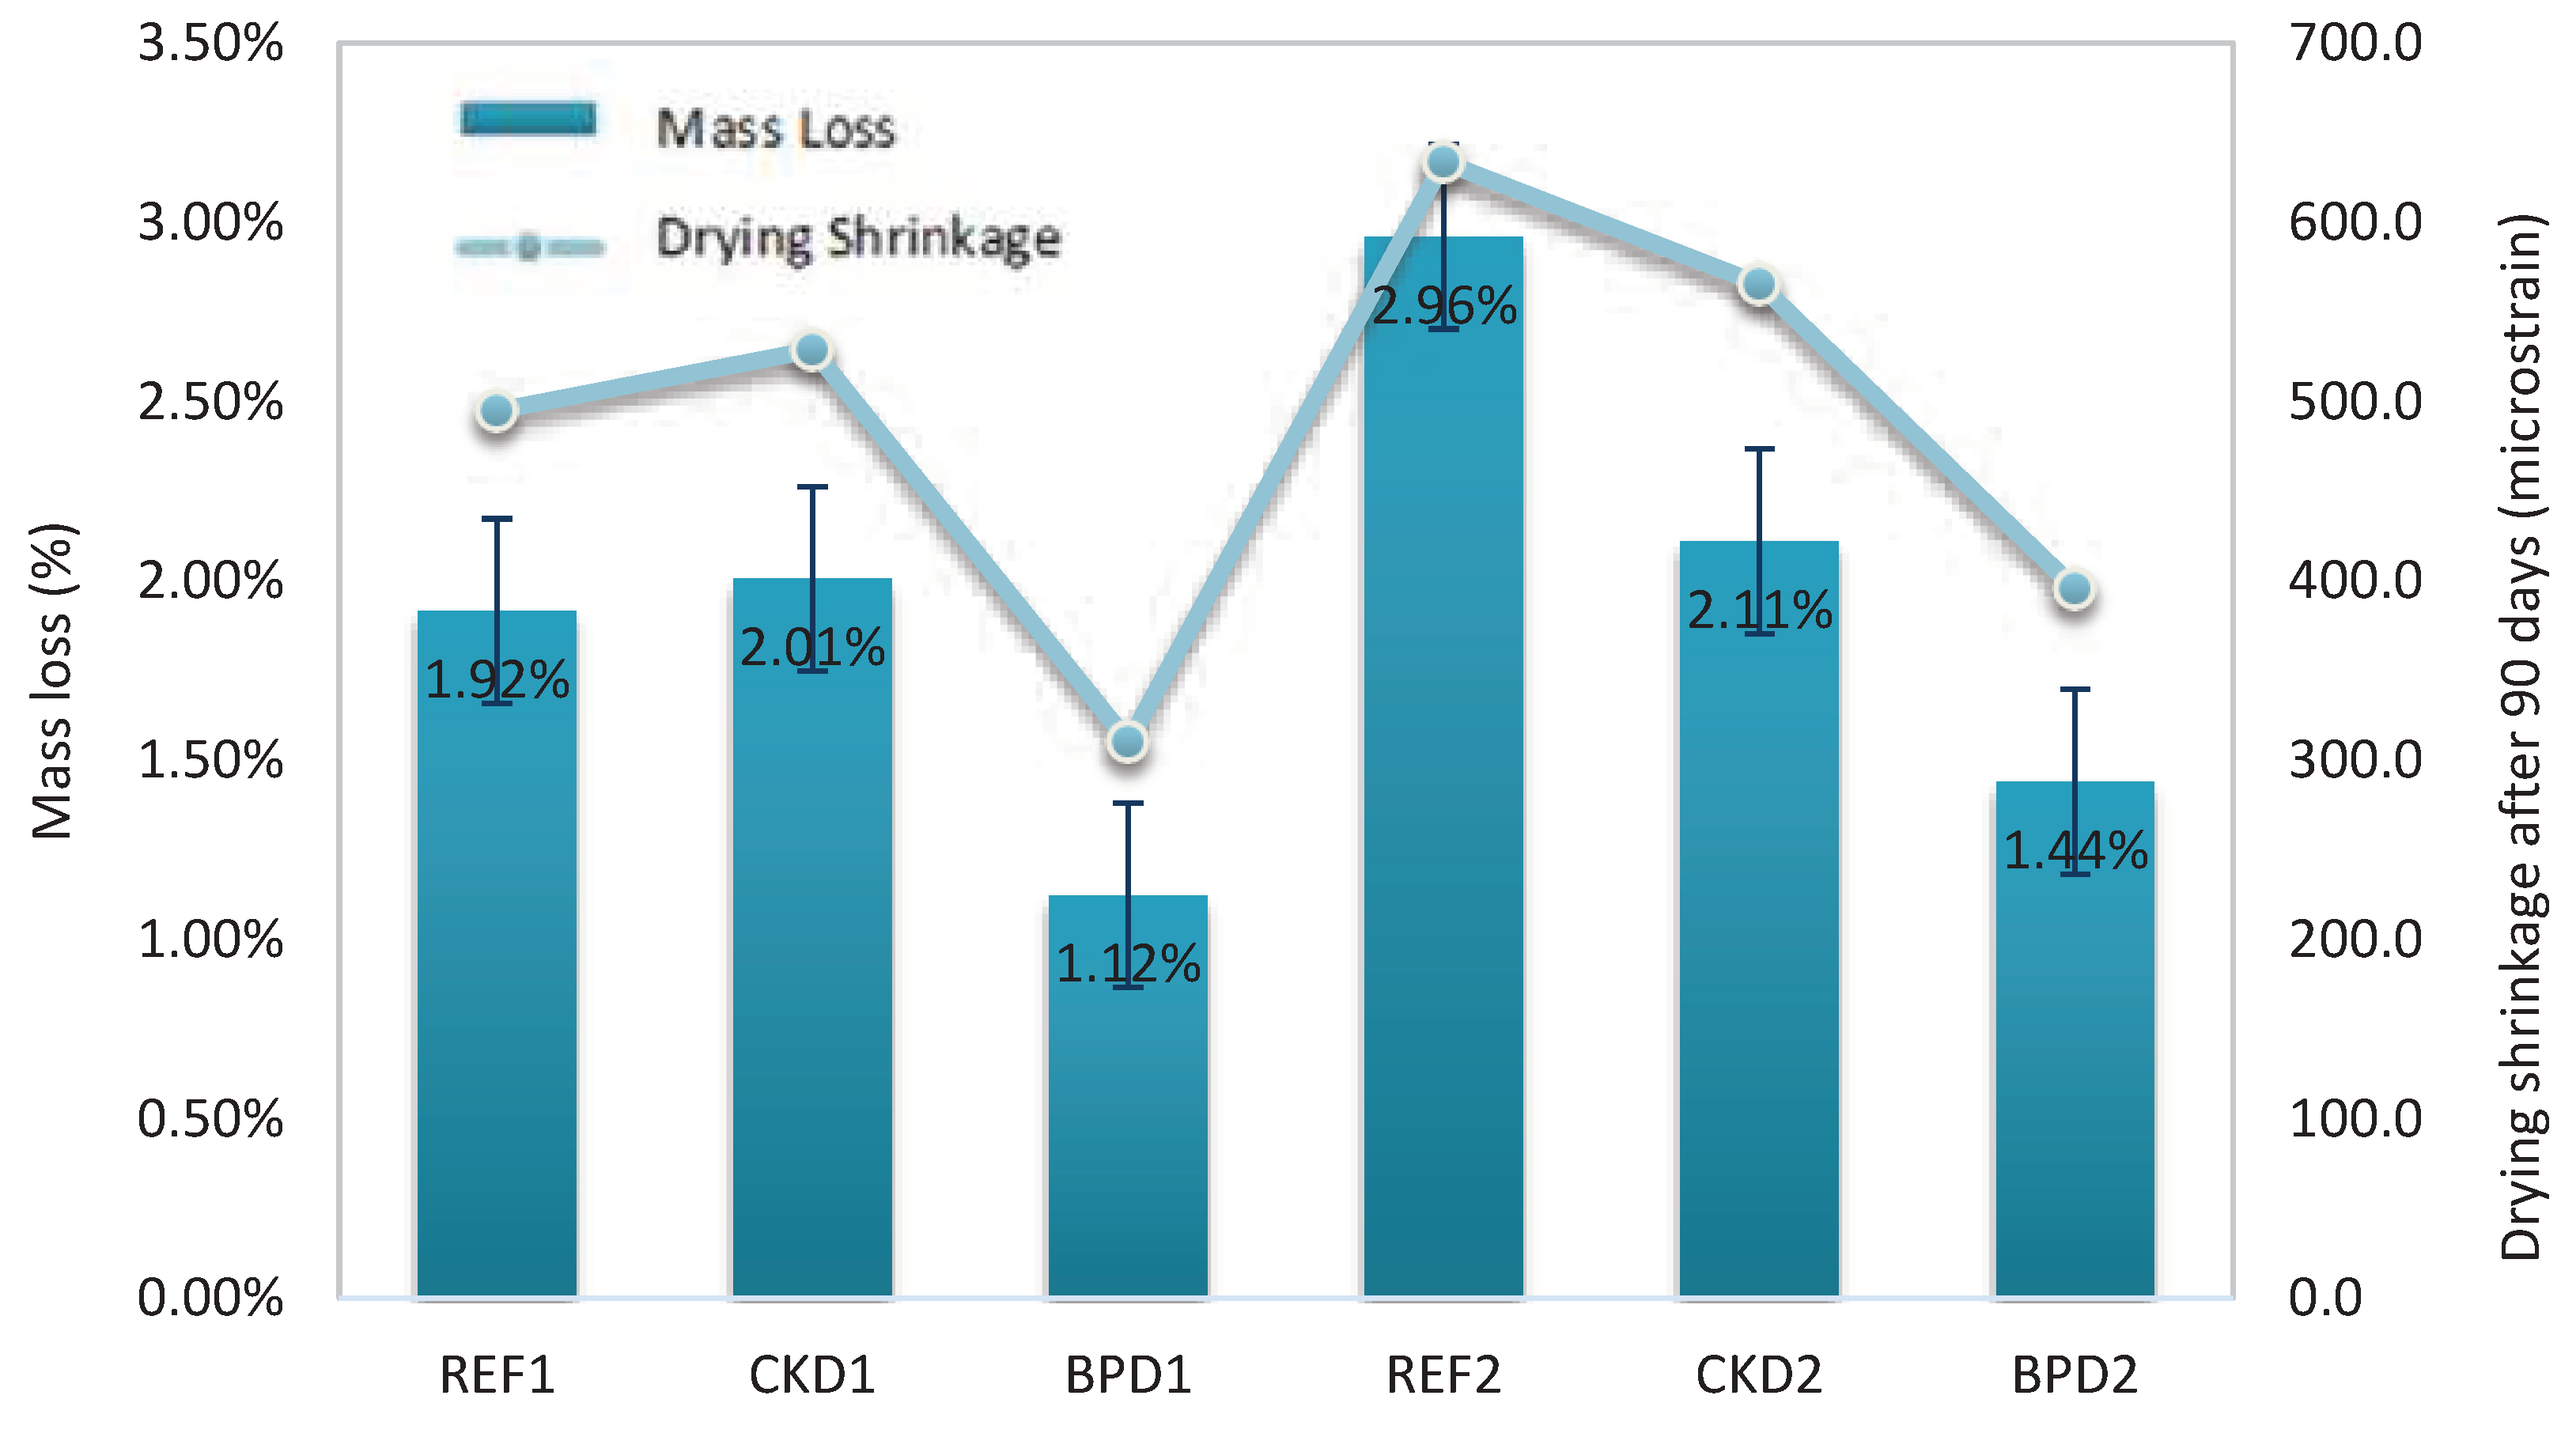
As presented in Figure 13, BPD1 underwent a 1.12% mass loss, by far the lowest compared to the other compositions that had almost double mass losses with percentages ranging from 1.92% for REF1 to 2.01% for CKD1. These results are directly related to the measured drying shrinkage (Figure 13). As expected, the prisms of series 2 showed higher percentages of mass loss as they have more water to lose in their composition. In these series also, the mixture containing BPD had the lowest mass loss (1.44%), while REF2 and CKD2 had the highest mass loss values with 2.96% and 2.11% respectively.

4. Conclusions

The incorporation of alternative fine filler materials as a partial replacement of common limestone fillers like MP, led to the production of SCC mixtures of low cement content with satisfactory rheological and mechanical properties. In conclusion:
  • BPD is appropriate as a reactive alternative waste material, as it contributes to the development of excellent mechanical properties at any testing age with a low drying shrinkage. The compressive strength was at least 50% higher than the corresponding strength of the reference compositions, and the drying shrinkage approximately 50% lower.
  • BPD incorporation in the designed proportion increases the viscosity, creating a potential barrier for those applications that require low-viscosity SCCs, while a higher SP dosage is also required to reach an equal yield stress to other compositions. Specific investigation and parametric analysis will disclose the effect of BPD on the rheological behaviour of SCC and define its finest content for optimal performance.
  • The addition of CKD to the SCC constitutes a potential sustainable solution as it improves the compressive strength, drying shrinkage, and substantially improves the tensile strength by almost 15%.
  • At the same time, by partially replacing MP with CKD, more than acceptable rheological properties are acquired, achieving the desirable slump flow with 20-30% less SP than BPD.
  • Testing the durability (e.g., chloride diffusion, water permeability carbonation resistance, corrosion resistance, etc.) of SCCs containing the alternative fillers that were studied in this work, is a critical topic of high interest for future research due to the presence of alkalies, sulphates and chlorides in their chemical composition.

Author Contributions

Conceptualization, A.K., E.B. and I.M.; methodology, A.K., E.B. and K.S.; validation, A.K., and E.B.; formal analysis, A.K.; investigation, A.K.; writing–original draft, A.K.; writing–review and editing, A.K., E.B., K.S., S.A.; visualization, A.K.; supervision, E.B.; project administration A.K. and E.B.; All authors have read and agreed to the published version of the manuscript.

Funding

This research received no external funding.

Institutional Review Board Statement

Not applicable.

Informed Consent Statement

Not applicable.

Data Availability Statement

The data presented in this study are available on request from the corresponding author.

Acknowledgments

The authors would like to thank sincerely the technical staff of all the involved NTUA laboratories (Civil Engineering, Mining & Metallurgical Engineering and Chemical Engineering). Special thanks are also due to Titan S.A. and Dionyssomarble S.A. that kindly provided the necessary materials.

Conflicts of Interest

The authors declare no conflict of interest.

References

  1. Khayat, K.; Schutter, G. De. State-of-the-Art Report on the Mechanical Properties of Self-Compacting Concrete (SCC); 2014.
  2. Shi, C.; Wu, Z.; Lv, K.; Wu, L. A Review on Mixture Design Methods for Self-Compacting Concrete. Constr. Build. Mater. 2015, 84, 387–398. [Google Scholar] [CrossRef]
  3. The European Project Group. The European Guidelines for Self-Compacting Concrete. Eur. Guidel. Self Compact. Concr. 2005, No. May, 63.
  4. Ting, T.Z.H.; Rahman, M.E.; Lau, H.H.; Ting, M.Z.Y. Recent Development and Perspective of Lightweight Aggregates Based Self-Compacting Concrete. Constr. Build. Mater. 2019, 201, 763–777. [Google Scholar] [CrossRef]
  5. Łaźniewska-Piekarczyk, B. The Influence of Admixtures Type on the Air-Voids Parameters of Non-Air-Entrained and Air-Entrained High Performance SCC. Constr. Build. Mater. 2013, 41, 109–124. [Google Scholar] [CrossRef]
  6. Elyamany, H.E.; Abd Elmoaty, A.E.M.; Mohamed, B. Effect of Filler Types on Physical, Mechanical and Microstructure of Self Compacting Concrete and Flow-Able Concrete. Alexandria Eng. J. 2014, 53(2), 295–307. [Google Scholar] [CrossRef]
  7. Gupta, N.; Siddique, R.; Belarbi, R. Sustainable and Greener Self-Compacting Concrete Incorporating Industrial By-Products: A Review. J. Clean. Prod. 2021, 284. [Google Scholar] [CrossRef]
  8. Meko, B.; Ighalo, J.O.; Ofuyatan, O.M. Enhancement of Self-Compactability of Fresh Self-Compacting Concrete: A Review. Clean. Mater. 2021, 1, 100019. [Google Scholar] [CrossRef]
  9. Benjeddou, O.; Soussi, C.; Jedidi, M.; Benali, M. Experimental and Theoretical Study of the Effect of the Particle Size of Limestone Fillers on the Rheology of Self-Compacting Concrete. J. Build. Eng. 2017, 10, 32–41. [Google Scholar] [CrossRef]
  10. Siddique, R.; Kunal; Mehta, A. Utilization of Industrial By-Products and Natural Ashes in Mortar and Concrete Development of Sustainable Construction Materials; Elsevier Ltd, 2019. [CrossRef]
  11. Wang, D.; Shi, C.; Farzadnia, N.; Shi, Z.; Jia, H. A Review on Effects of Limestone Powder on the Properties of Concrete. Constr. Build. Mater. 2018, 192, 153–166. [Google Scholar] [CrossRef]
  12. Sfikas, I.P.; Badogiannis, E.G.; Trezos, K.G. Rheology and Mechanical Characteristics of Self-Compacting Concrete Mixtures Containing Metakaolin. Constr. Build. Mater. 2014, 64, 121–129. [Google Scholar] [CrossRef]
  13. Abukhashaba, M.I.; Mostafa, M.A.; Adam, I.A. Behavior of Self-Compacting Fiber Reinforced Concrete Containing Cement Kiln Dust. Alexandria Eng. J. 2014, 53(2), 341–354. [Google Scholar] [CrossRef]
  14. Siddique, R. Utilization of Cement Kiln Dust (CKD) in Cement Mortar and Concrete-an Overview. Resour. Conserv. Recycl. 2006, 48(4), 315–338. [Google Scholar] [CrossRef]
  15. Bagheri, S.M.; Koushkbaghi, M.; Mohseni, E.; Koushkbaghi, S.; Tahmouresi, B. Evaluation of Environment and Economy Viable Recycling Cement Kiln Dust for Use in Green Concrete. J. Build. Eng. 2020, 32, 101809. [Google Scholar] [CrossRef]
  16. Maslehuddin, M.; Al-Amoudi, O.S.B.; Rahman, M.K.; Ali, M.R.; Barry, M.S. Properties of Cement Kiln Dust Concrete. Constr. Build. Mater. 2009, 23(6), 2357–2361. [Google Scholar] [CrossRef]
  17. Najim, K.B.; Mahmod, Z.S.; Atea, A.K.M. Experimental Investigation on Using Cement Kiln Dust (CKD) as a Cement Replacement Material in Producing Modified Cement Mortar. Constr. Build. Mater. 2014, 55, 5–12. [Google Scholar] [CrossRef]
  18. Rodríguez Viacava, I.; Aguado De Cea, A.; Rodríguez De Sensale, G. Self-Compacting Concrete of Medium Characteristic Strength. Constr. Build. Mater. 2012, 30, 776–782. [Google Scholar] [CrossRef]
  19. Ashteyat, A.M.; Haddad, R.H.; Obaidat, Y.T. Case Study on Production of Self Compacting Concrete Using White Cement by Pass Dust. Case Stud. Constr. Mater. 2018, 9, e00190. [Google Scholar] [CrossRef]
  20. EN 12620:2013, “Aggregates for Concrete”, 2013.
  21. EN 197-1:2011, “Cement. Composition, Specifications and Conformity Criteria for Common Cements”, 2011.
  22. ΕΝ 934-2:2009, “Admixtures for Concrete, Mortar and Grout - Concrete Admixtures. Definitions, Requirements, Conformity, Marking and Labelling”, 2009.
  23. Kounadis, A.; Badogiannis, E.G.; Retsa, N.; Angelopoulos, P.M.; Marinos, I. Hydration Heat, Rheology and Strength of Self-Compacting Sustainable Mortars Containing Alternative Filler Materials. J. Mater. Civ. Eng. 2022, 34(2021), 1–10. [Google Scholar] [CrossRef]
  24. EN 12350-8:2010, “Testing Fresh Concrete – Part 8: Slump-Flow Test”, 2010.
  25. EN 12350-9:2010, “Testing Fresh Concrete – Part 9: V-Funnel Test”, 2010.
  26. EN 12350-11:2010, “Testing Fresh Concrete – Part 11: Sieve Segregation Test”, 2010.
  27. EN 12350-10:2010, “Testing Fresh Concrete – Part 10: L Box Test”, 2010.
  28. UNI 11044:2003, “Testing Fresh Self Compacting Concrete - Determination of Confined Flowability in U-Shape Box”, 2003.
  29. EN 12350-6:2009, “Testing Fresh Concrete – Part 6: Density”, 2009.
  30. EN 12350-7:2009, “Testing Fresh Concrete – Part 7: Air Content – Pressure Methods”, 2009.
  31. EN 12390-3:2009, “Testing Hardened Concrete – Part 3: Compressive Strength of Test Specimens”, 2009.
  32. EN 12390-6:2010, “Testing Hardened Concrete - Part 6: Tensile Splitting Strength of Test Specimens”, 2010.
  33. ASTM C469 / C469M-14e1, Standard Test Method for Static Modulus of Elasticity and Poisson’s Ratio of Concrete in Compression, ASTM International, West Conshohocken, PA, 2014, Www.Astm.Org.
  34. Illinois Test Procedure SCC-6, Standard Test Method for Static Segregation of Hardened Self-Consolidating Concrete Cylinders.
  35. EN 12390-16:2019, “Testing Hardened Concrete - Part 16: Determination of the Shrinkage of Concrete”, 2019.
  36. EN 12390-5:2009, “Testing Hardened Concrete - Part 5: Flexural Strength of Test Specimens”, 2009.
  37. Tzouvalas, G.; Dermatas, N.; Tsimas, S. Alternative Calcium Sulfate-Bearing Materials as Cement Retarders: Part I. Anhydrite. Cem. Concr. Res. 2004, 34(11), 2113–2118. [Google Scholar] [CrossRef]
  38. Shoaib, M.M.; Balaha, M.M.; Abdel-Rahman, A.G. Influence of Cement Kiln Dust Substitution on the Mechanical Properties of Concrete. Cem. Concr. Res. 2000, 30(3), 371–377. [Google Scholar] [CrossRef]
  39. Elgalhud, A.A.; Dhir, R.K.; Ghataora, G. Limestone Addition Effects on Concrete Porosity. Cem. Concr. Compos. 2016, 72, 222–234. [Google Scholar] [CrossRef]
  40. Siddique, R.; Gupta, N. Limestone Dust; 2021. [CrossRef]
  41. Lea, F.M. The Chemistry of Cement and Concrete. Edward Arnold Ltd: London 1970, p 1092.
  42. Singh, N.B.; Bhattacharjee, K.N.; Shukla, A.K. Effect of Alkali Bypass Dust on the Hydration of Granulated Blast Furnace Slag Blended Cement. Cem. Concr. Res. 1995, 25(4), 883–892. [Google Scholar] [CrossRef]
  43. Mehta; Kumar, P.; and Monteiro P.J.M. Concrete: Microstructure, Properties, and Materials. 4th Ed. New York: McGraw-Hill Education. 2014.
  44. ACI 224R-01, “Control of Cracking in Concrete Structures”, 2001.
  45. Abdalhmid, J.M.; Ashour, A.F.; Sheehan, T. Long-Term Drying Shrinkage of Self-Compacting Concrete: Experimental and Analytical Investigations. Constr. Build. Mater. 2019, 202, 825–837. [Google Scholar] [CrossRef]
  46. Choudhary, R.; Gupta, R.; Alomayri, T.; Jain, A.; Nagar, R. Permeation, Corrosion, and Drying Shrinkage Assessment of Self-Compacting High Strength Concrete Comprising Waste Marble Slurry and Fly Ash, with Silica Fume. Structures 2021, 33, 971–985. [Google Scholar] [CrossRef]
  47. Valcuende, M.; Marco, E.; Parra, C.; Serna, P. Influence of Limestone Filler and Viscosity-Modifying Admixture on the Shrinkage of Self-Compacting Concrete. Cem. Concr. Res. 2012, 42(4), 583–592. [Google Scholar] [CrossRef]
  48. Sardinha, M.; de Brito, J.; Rodrigues, R. Durability Properties of Structural Concrete Containing Very Fine Aggregates of Marble Sludge. Constr. Build. Mater. 2016, 119, 45–52. [Google Scholar] [CrossRef]
  49. Piasta, W.; Sikora, H. Effect of Air Entrainment on Shrinkage of Blended Cements Concretes. Constr. Build. Mater. 2015, 99, 298–307. [Google Scholar] [CrossRef]
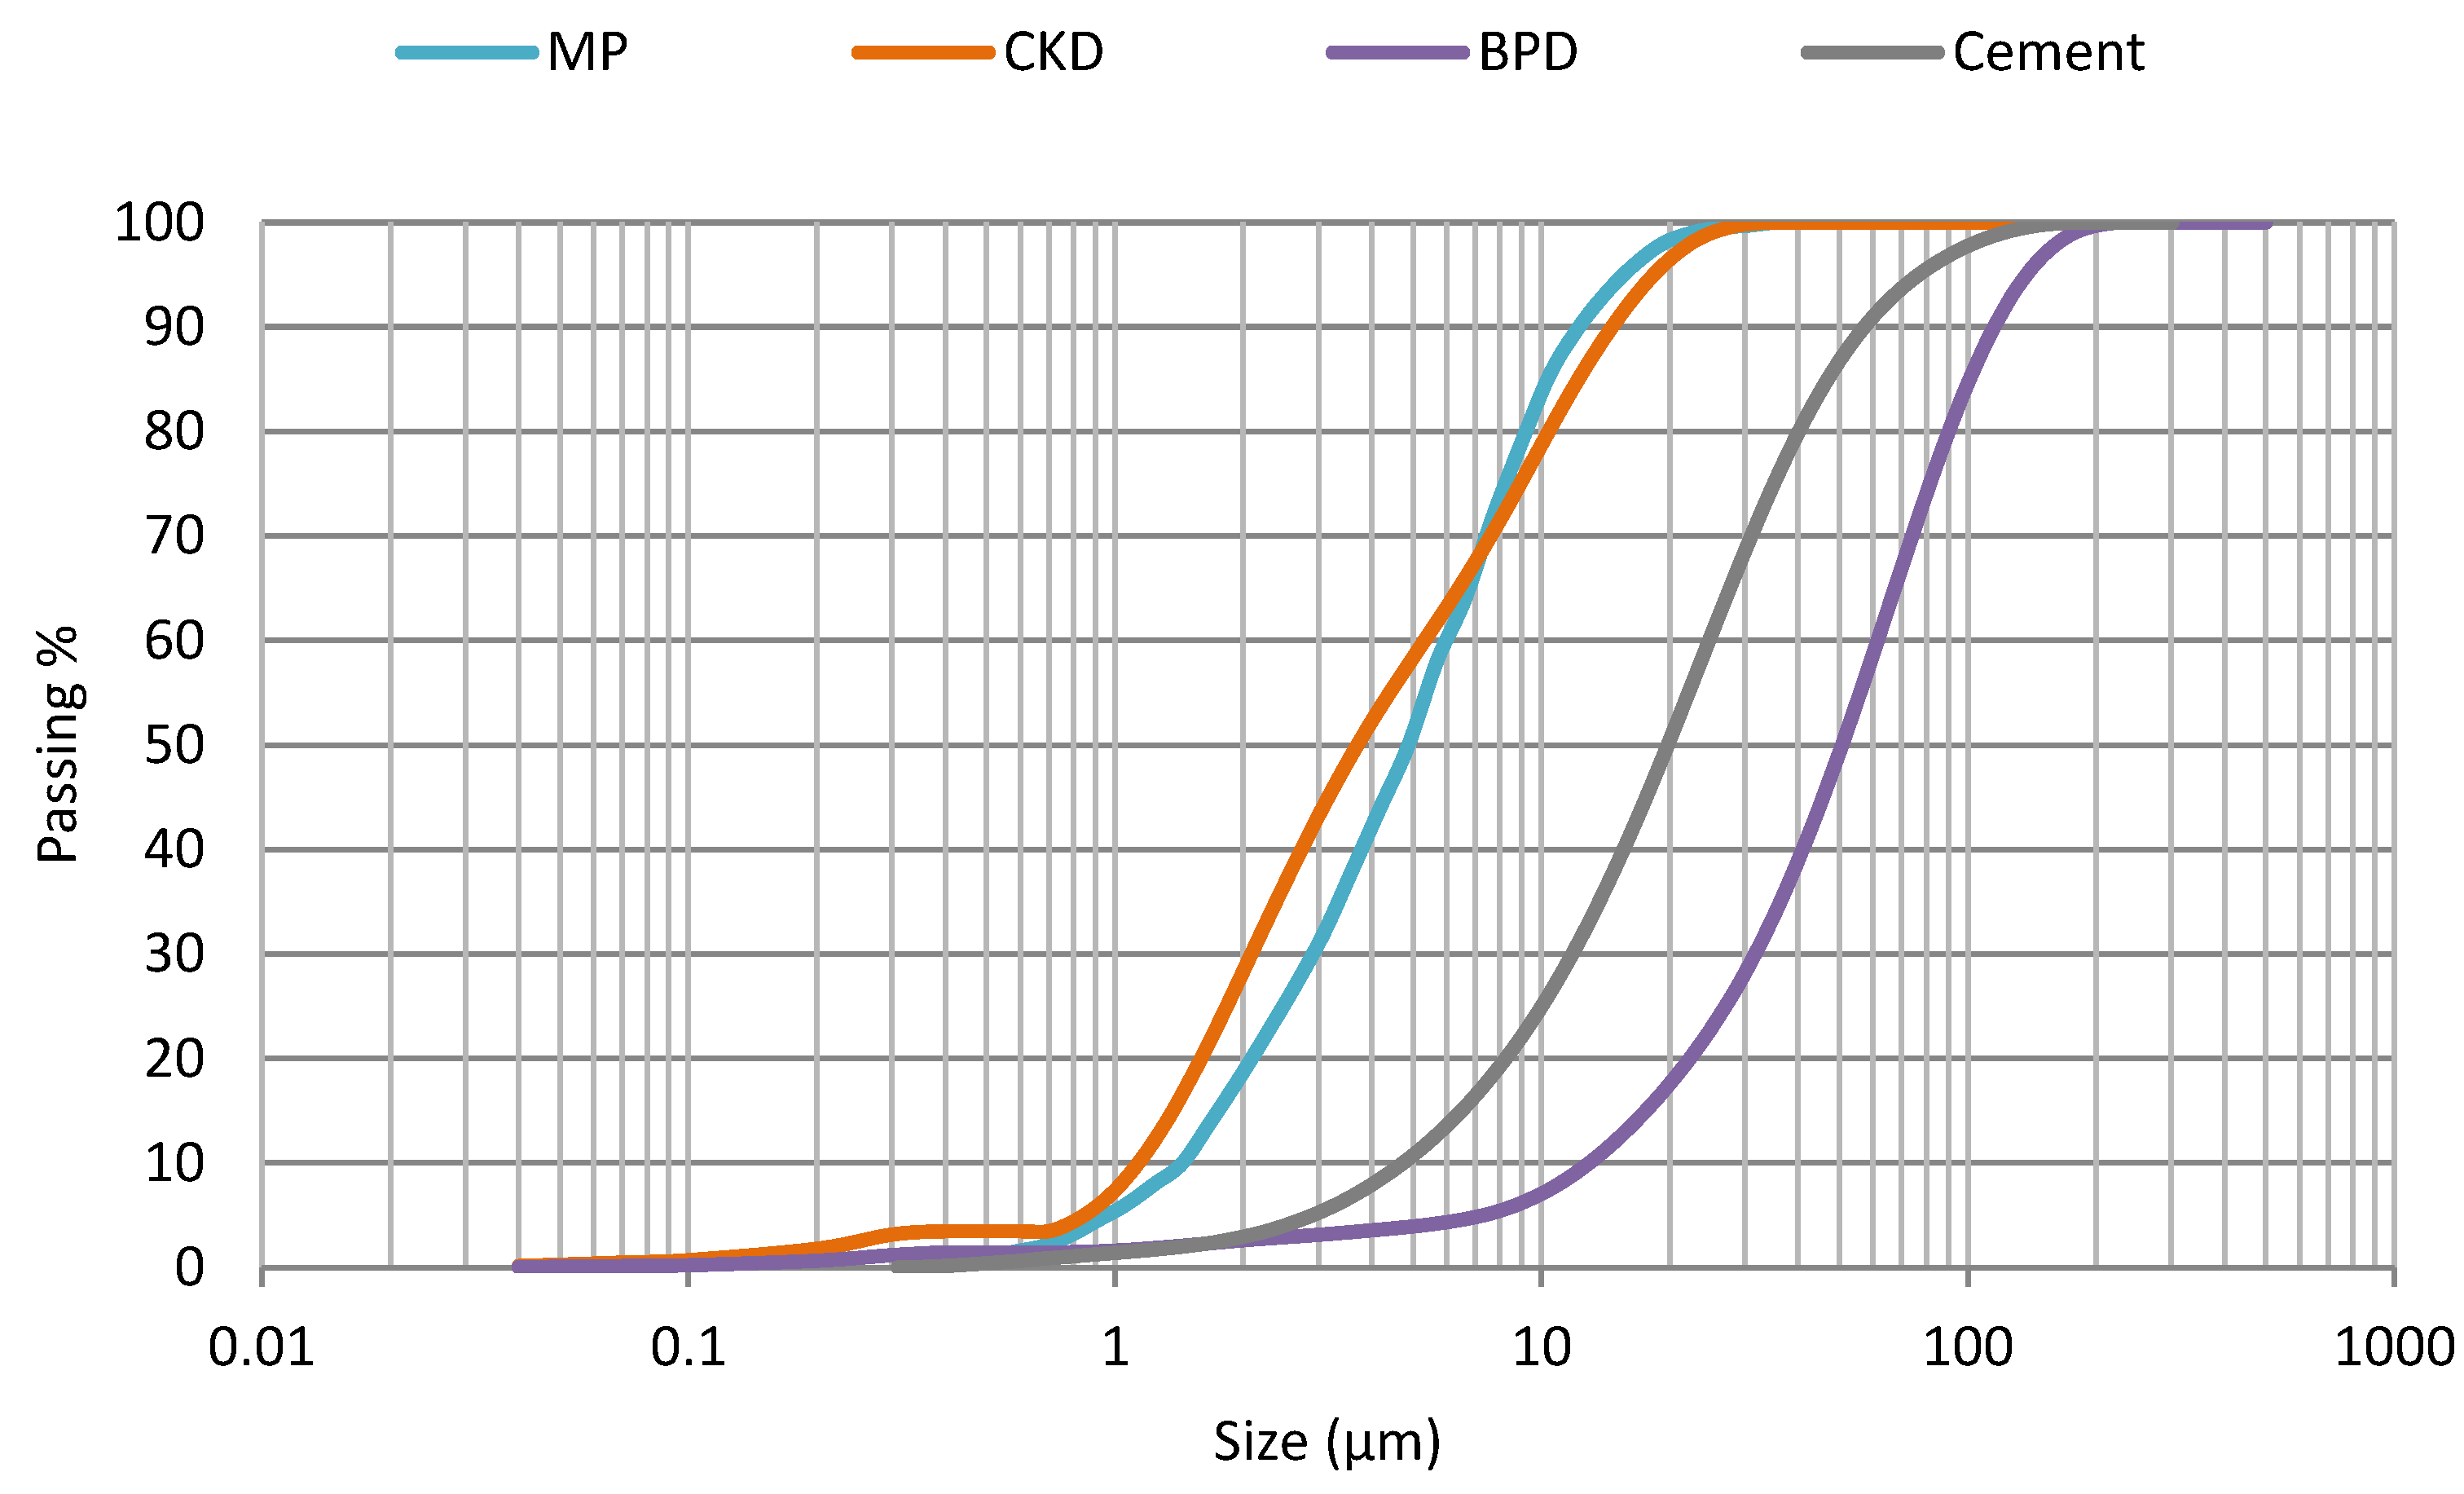
Figure 1. Particle size distribution of fine materials used.
Preprints 90882 g001
Figure 2. XRD patterns of CKD (top) and BPD (bottom): 1. Illite, 2. Kaolinite, 3. Larnite, 4. Quartz, 5. Calcite, 6. Anhydrite, 7. Albite, 8. Sylvite, 9. C3S 10. Wollastonite, 11. Dolomite, 12. Lime.
Preprints 90882 g002
Figure 3. XRD patterns of cement: 1. C¬2S, 2. Calcite, 3. Gypsum, 4. C4AF, 5. C3S, 6. C3A, 7. Anhydrite.
Preprints 90882 g003
Figure 4. Chemical admixtures consumption in relation with rheological performance indices of each SCC mixture.
Preprints 90882 g004
Figure 5. Compressive strength of each SCC composition at 7, 28 and 90 days.
Preprints 90882 g005
Figure 6. Correlation between the compressive strength (28 days) and the air content of the SCC mixtures.
Preprints 90882 g006
Figure 7. Modulus of Elasticity values of each SCC composition.
Preprints 90882 g007
Figure 8. Tensile splitting strength of each SCC composition at the age of 90 days.
Preprints 90882 g008
Figure 9. Flexural strength of each SCC composition at the age of 90 days.
Preprints 90882 g009
Figure 10. Indicative longitudinal sections of SCC cylindrical specimens.
Preprints 90882 g010
Figure 11. Free shrinkage for each SCC composition measured at 7, 14, 28 and 90 days.
Preprints 90882 g011
Figure 12. Correlation between drying shrinkage after 90 days and air content in the fresh SCC mixtures.
Preprints 90882 g012
Figure 13. Mass loss and drying shrinkage for each SCC composition after 90 days of drying at 65% RH and 23°C.
Preprints 90882 g013
Table 1. Physical properties of the fine materials used.
Properties and size characteristics Cement MP CKD BPD
Specific Gravity (kg/m3) 3150 2700 2700 2800
Specific Surface Area (cm2/g) 3470 12700 25000 5000
d10 (μm) 4.74 1.44 1.13 12.95
d50 (μm) 19.82 4.88 3.71 50.72
d90 (μm) 57.41 12.27 14.66 115.63
Table 2. Chemical analysis (w/w %) of the fine materials used.
Compound (%) Cement MP CKD BPD
SiO2 19.02 0.35 10.18 19.39
Al2O3 4.59 - 3.64 5.13
Fe2O3 3.63 0.07 2.06 3.46
CaO 63.43 55.41 43.53 52.73
MgO 2.02 0.76 1.31 2.22
MnO - 0.01 - -
SO3 3.48 - 1.18 6.73
K2O 0.47 - 1.71 4.84
Na2O 0.28 - 0.37 0.46
P2O5 0.17 - - -
TiO2 0.28 - - -
Cl - - 0.35 2.16
Loss of Ignition (LOI) 2.62 43.4 35.65 2.88
Table 3. Ingredients’ content (kg/m3) in SCC compositions produced.
Mixture Water Cement MP CKD BPD Sand g1 g2 w/c w/p
REF1 180 300 200 0 0 900 560 240 0.60 0.36
CKD1 180 300 100 100 0 900 560 240 0.60 0.36
BPD1 180 300 100 0 100 900 560 240 0.60 0.36
REF2 198 300 250 0 0 900 525 225 0.66 0.36
CKD2 198 300 100 150 0 900 525 225 0.66 0.36
BPD2 198 300 100 0 150 900 525 225 0.66 0.36
Table 4. Fresh SCC test results and chemical admixtures needed for each SCC composition.
SP/
Cement
VMA/
Cement
Unit Weight Air
Content
Slump Flow T500 V-Funnel U-Box L-Box Sieve
Segregation
Mixture (%) (%) (kg/m3) (%) (mm) (s) (s) - - (%)
REF1 1.7 - 2411 2.2 705 3.35 12.7 0.84 0.86 3.8
CKD1 2.4 - 2365 2.5 700 2.50 22.8 0.79 0.87 1.3
BPD1 3.1 0.3 2403 1.8 690 5.60 28.5 0.77 0.50 1.5
REF2 1.5 - 2256 2.9 690 1.59 5.1 0.93 0.88 7.5
CKD2 2.3 - 2264 3.3 695 1.07 3.6 0.89 0.90 8.0
BPD2 2.7 - 2358 1.5 700 2.82 15.3 0.78 0.71 2.2
Disclaimer/Publisher’s Note: The statements, opinions and data contained in all publications are solely those of the individual author(s) and contributor(s) and not of MDPI and/or the editor(s). MDPI and/or the editor(s) disclaim responsibility for any injury to people or property resulting from any ideas, methods, instructions or products referred to in the content.
Copyright: This open access article is published under a Creative Commons CC BY 4.0 license, which permit the free download, distribution, and reuse, provided that the author and preprint are cited in any reuse.
Prerpints.org logo

Preprints.org is a free preprint server supported by MDPI in Basel, Switzerland.

Subscribe

© 2024 MDPI (Basel, Switzerland) unless otherwise stated