Submitted:
19 November 2023
Posted:
20 November 2023
You are already at the latest version
Abstract
Keywords:
1. Introduction
2. Initial Data and Methods
3. Results
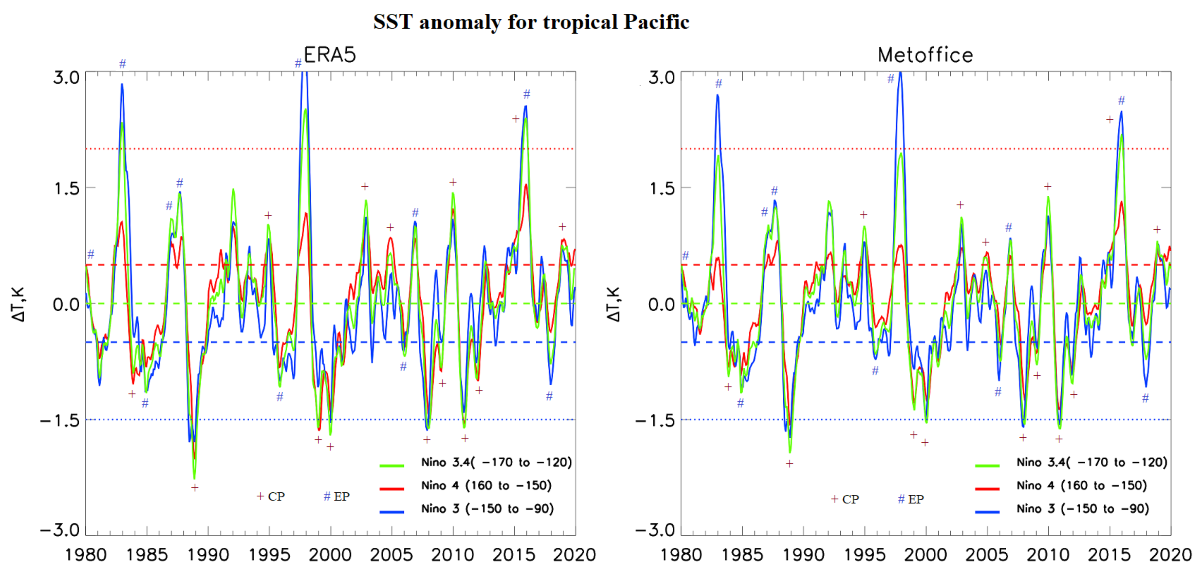
3.1. Analysis of Interannual Variability of Sea Surface Temperature in the Tropical Pacific, and Total Column Ozone and Air Temperature in the Arctic Stratosphere
3.2. Analysis of Telecommunications and ENSO Impacts on the Stratosphere and Ozone Layer
4. Discussion
5. Conclusion
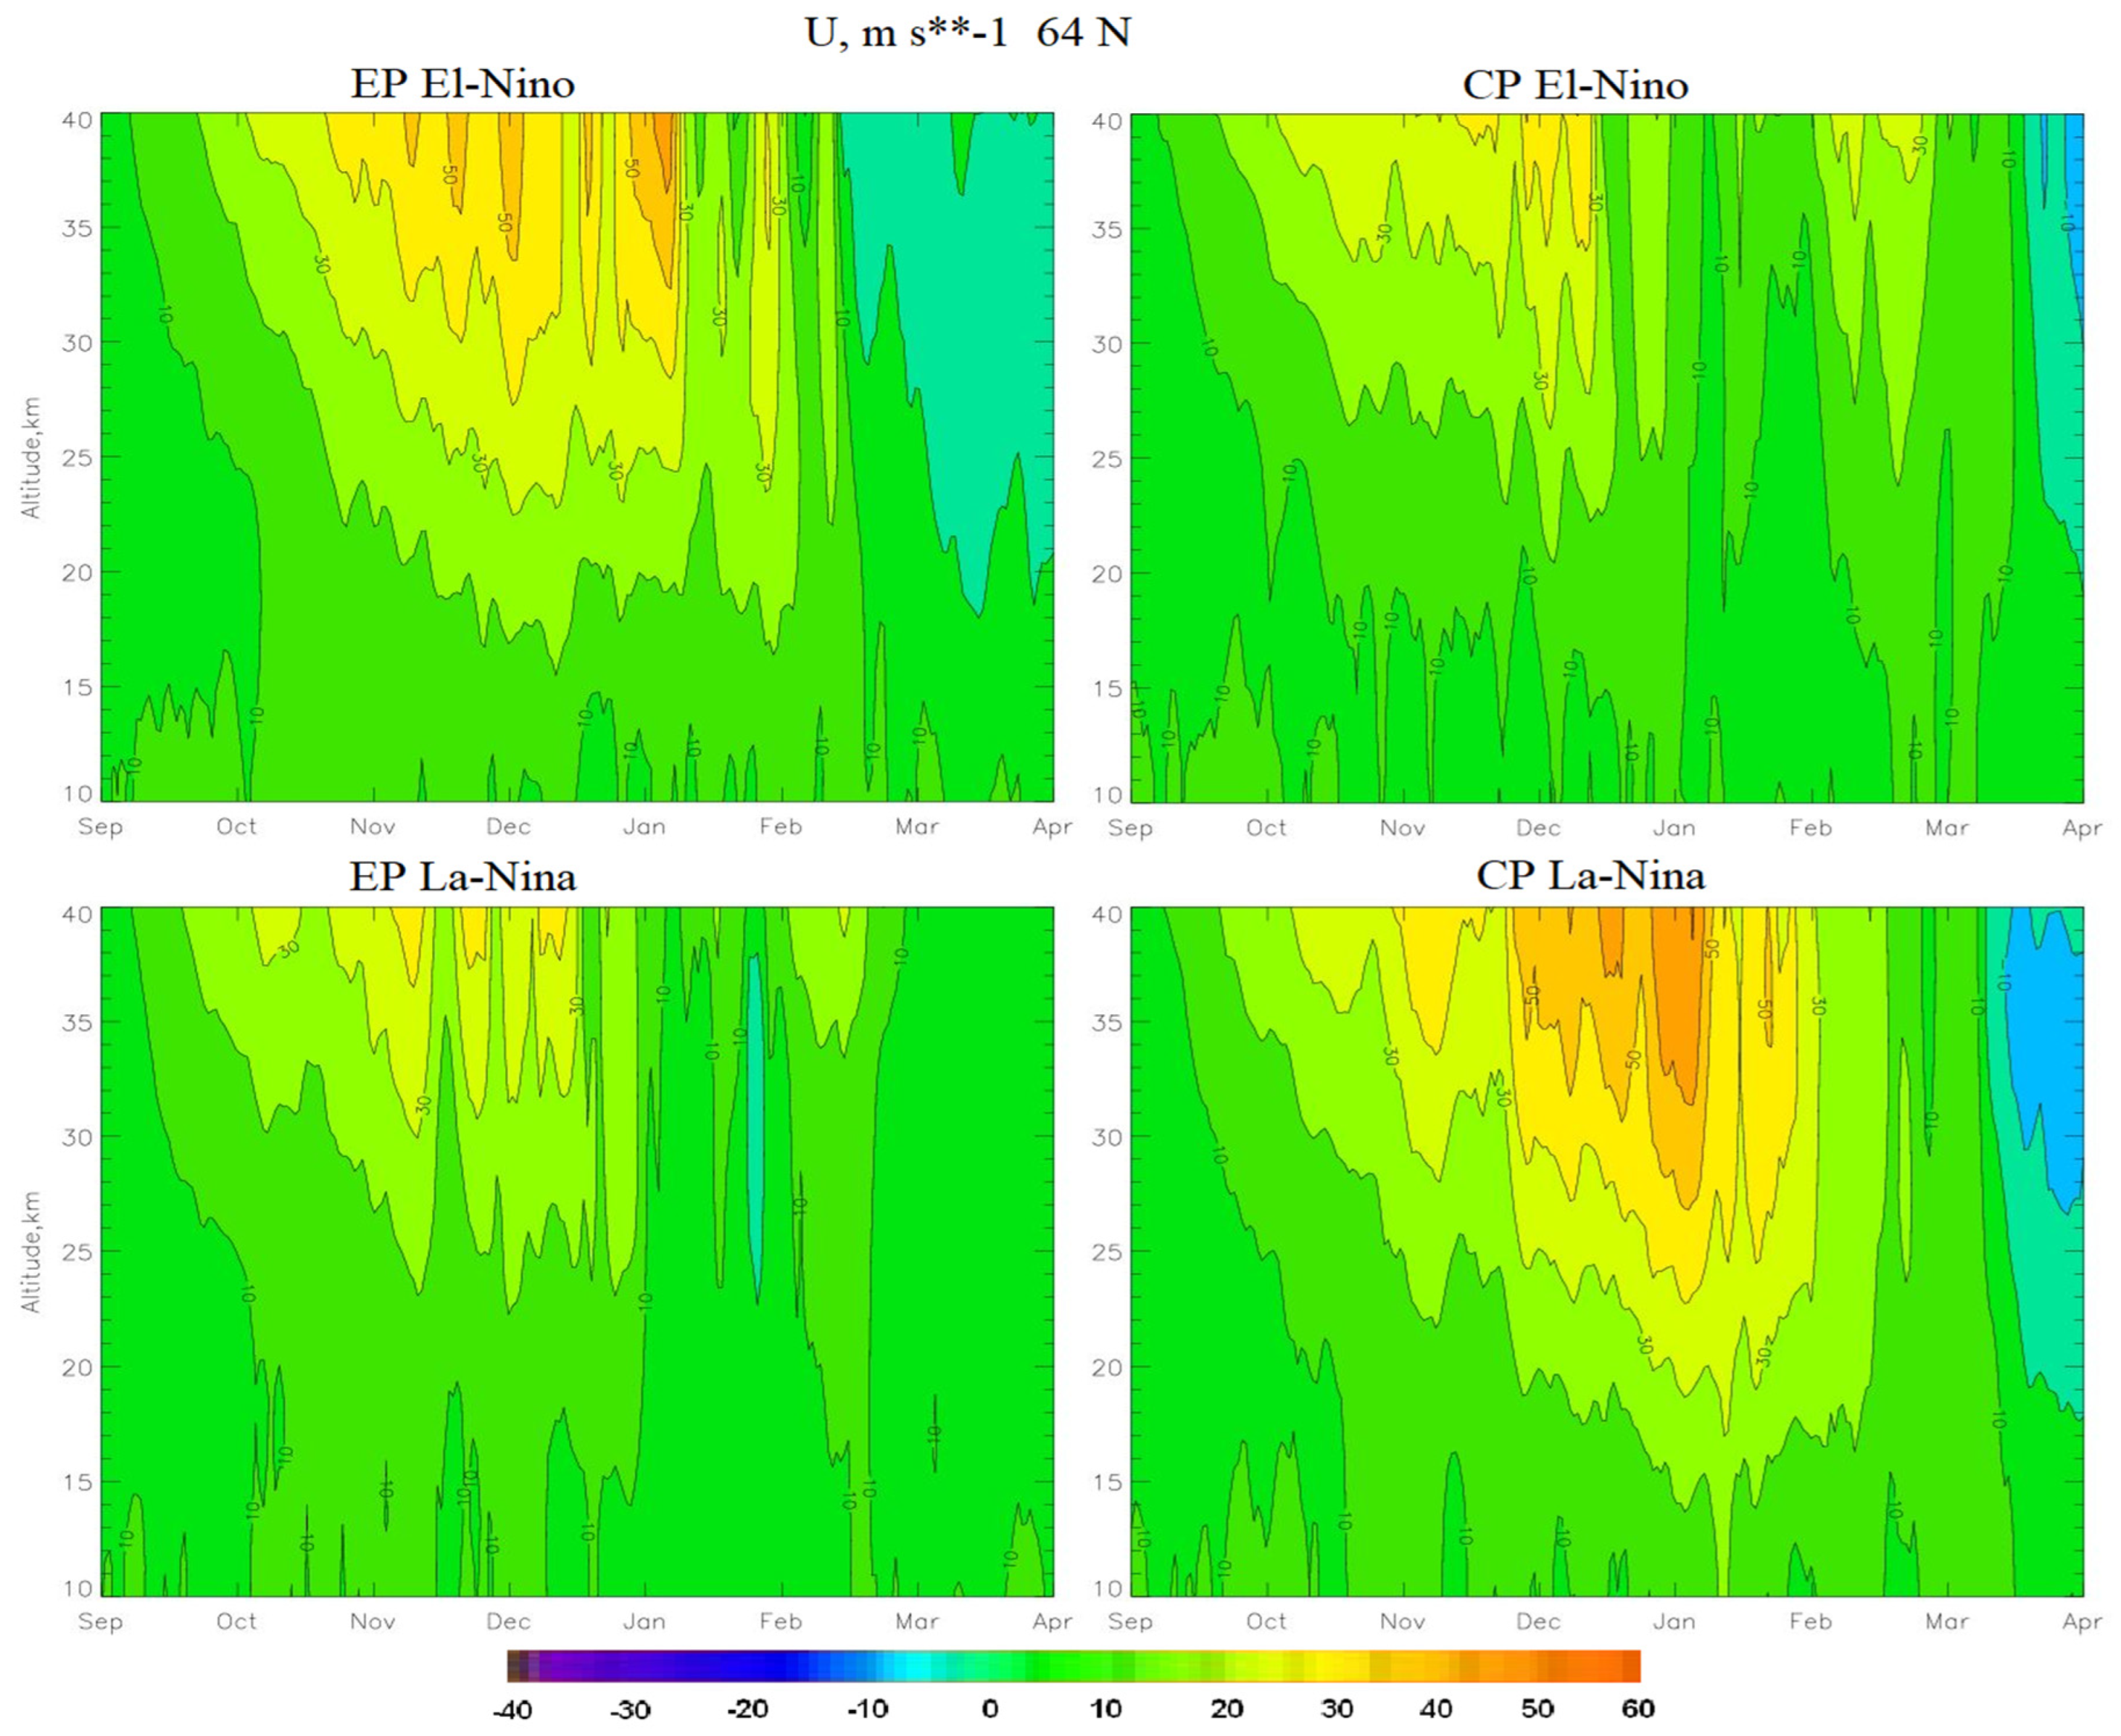
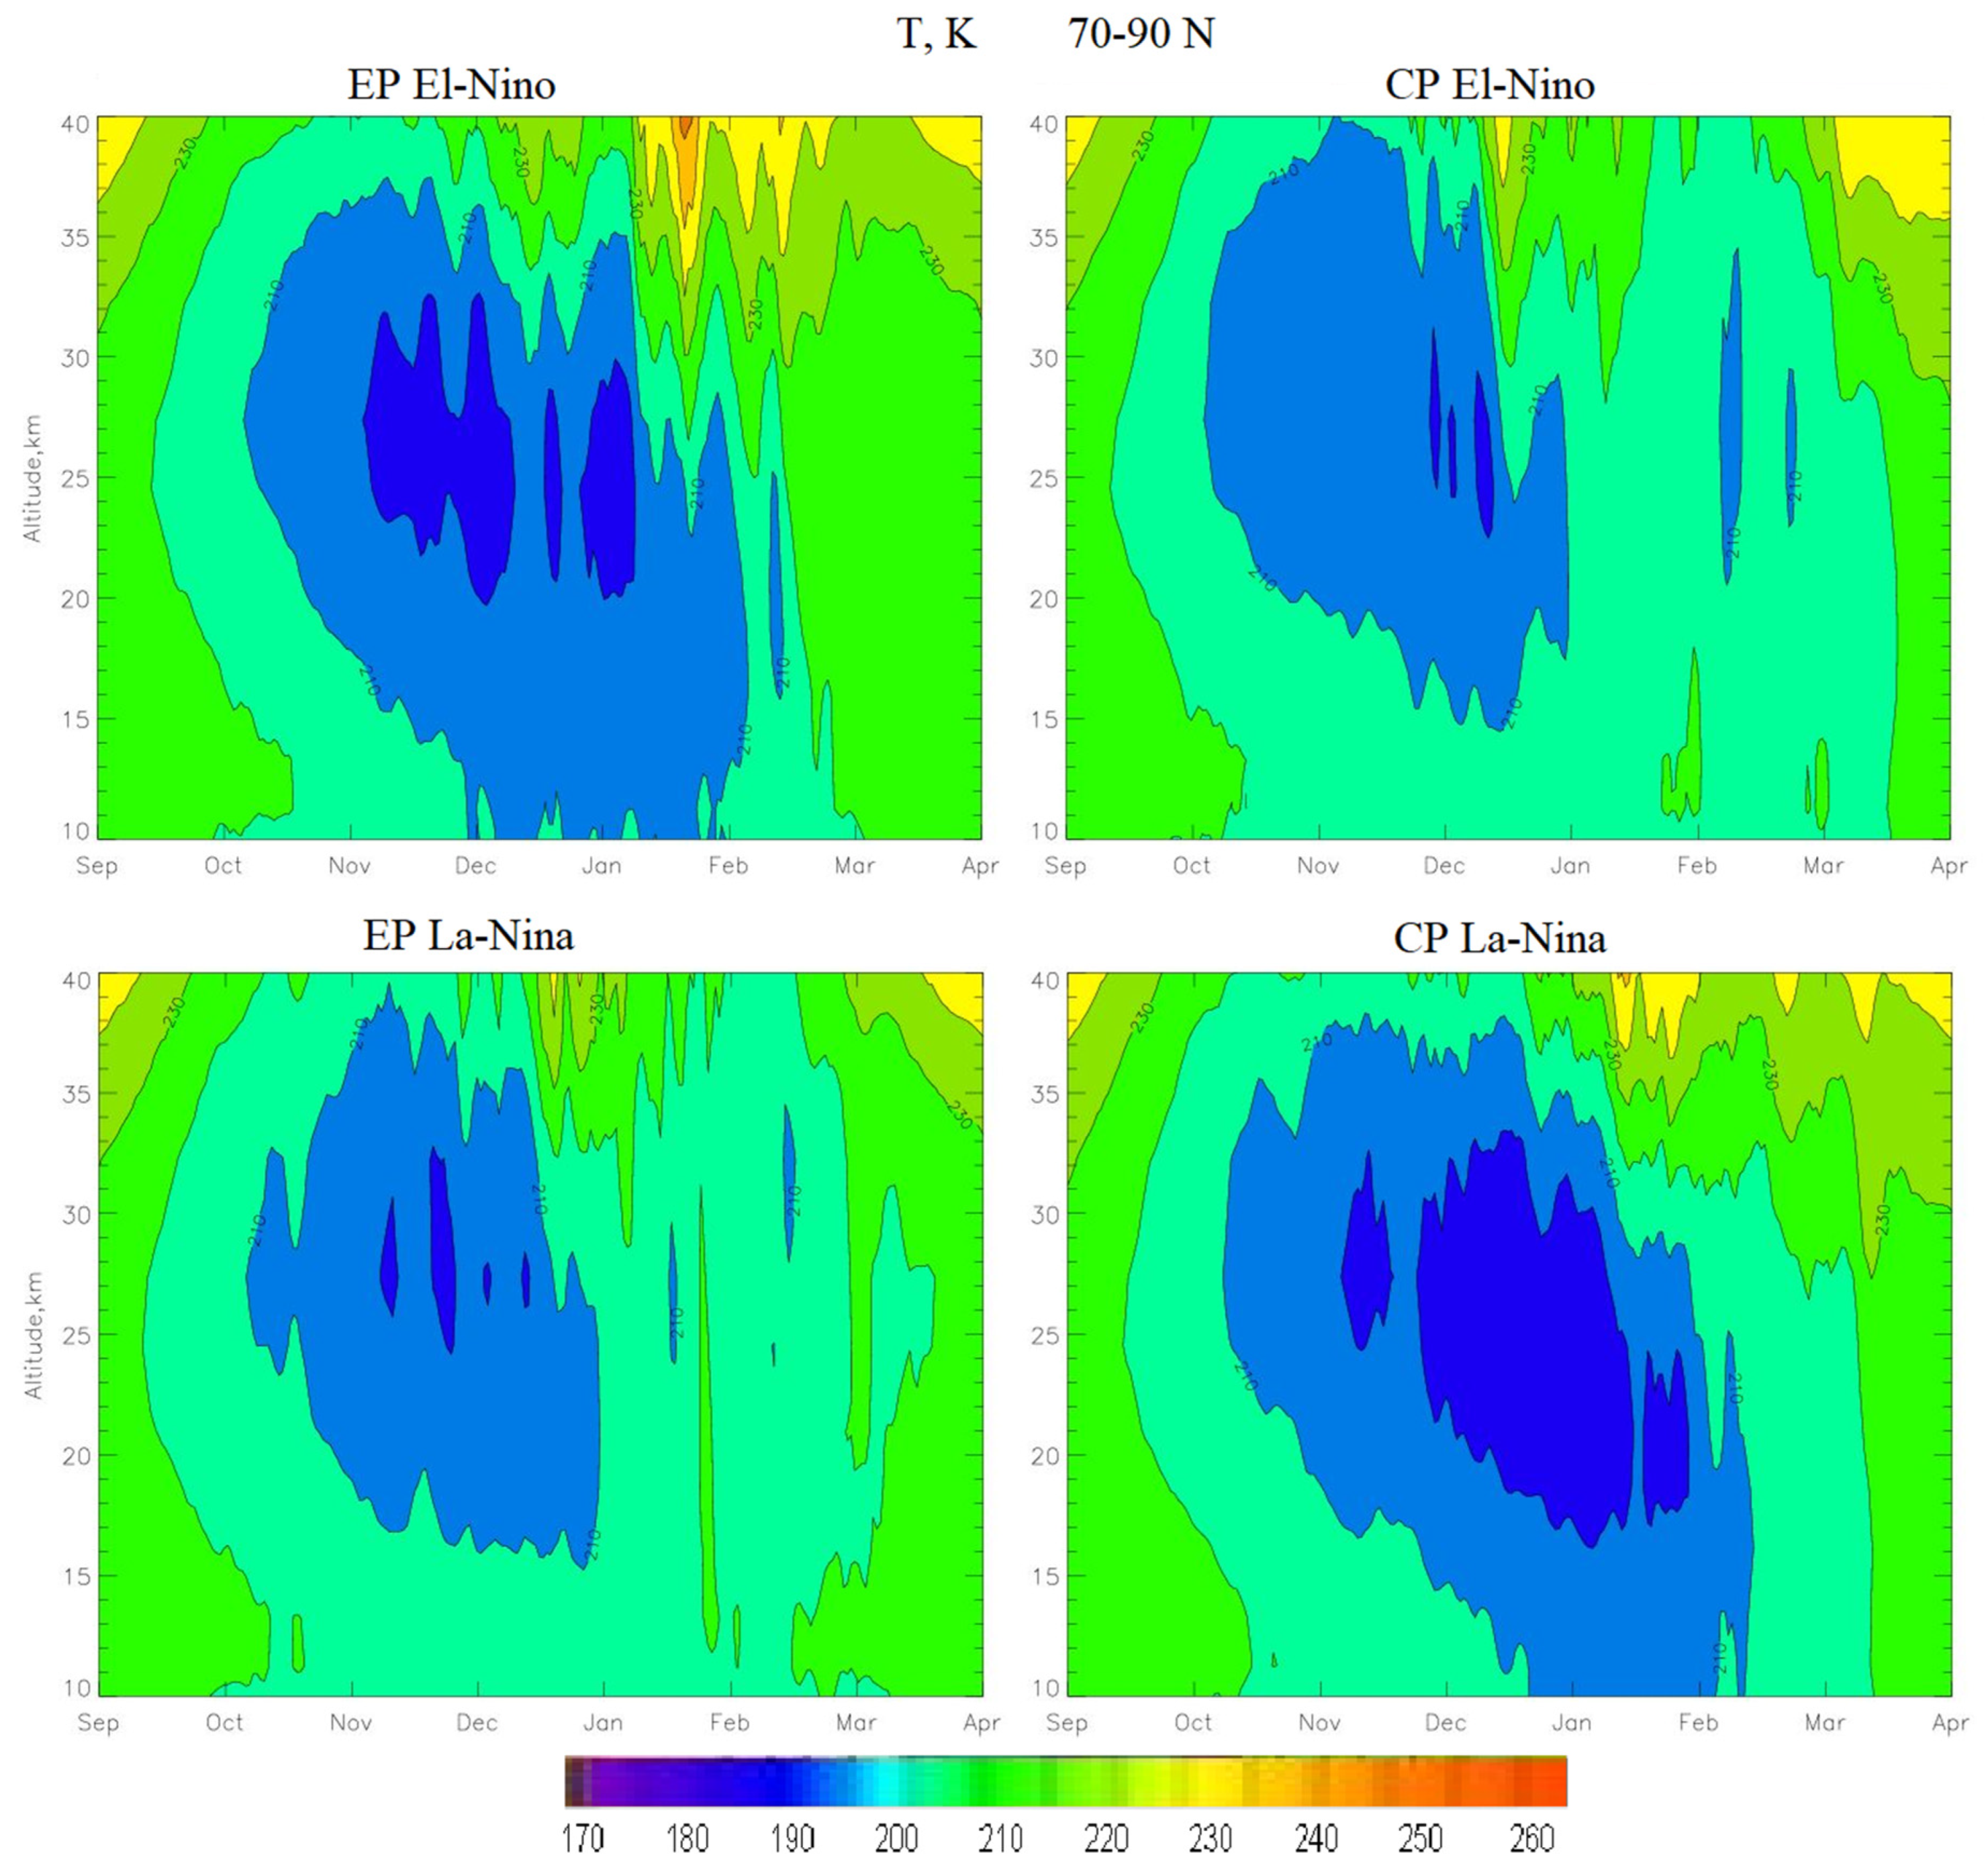
- The El Niño phase leads to an increase in heat and mass fluxes into the stratosphere, which contributes to an increase in the SSW and a weakening of the PV. At the same time, it has been shown that during the CP El Niño, the SSW is stronger and occurs earlier than during the EP El Niño. As a result, the PV in the CP El Niño is weaker than in the EP El Niño.
- The circulation processes during the La Niña phase depend on the type of La Niña. With CP La Niña, there is no SSW, as a result of which the PV is stable. During the EP La Niña, powerful SSWs are observed, which lead to a weakening of the PV.
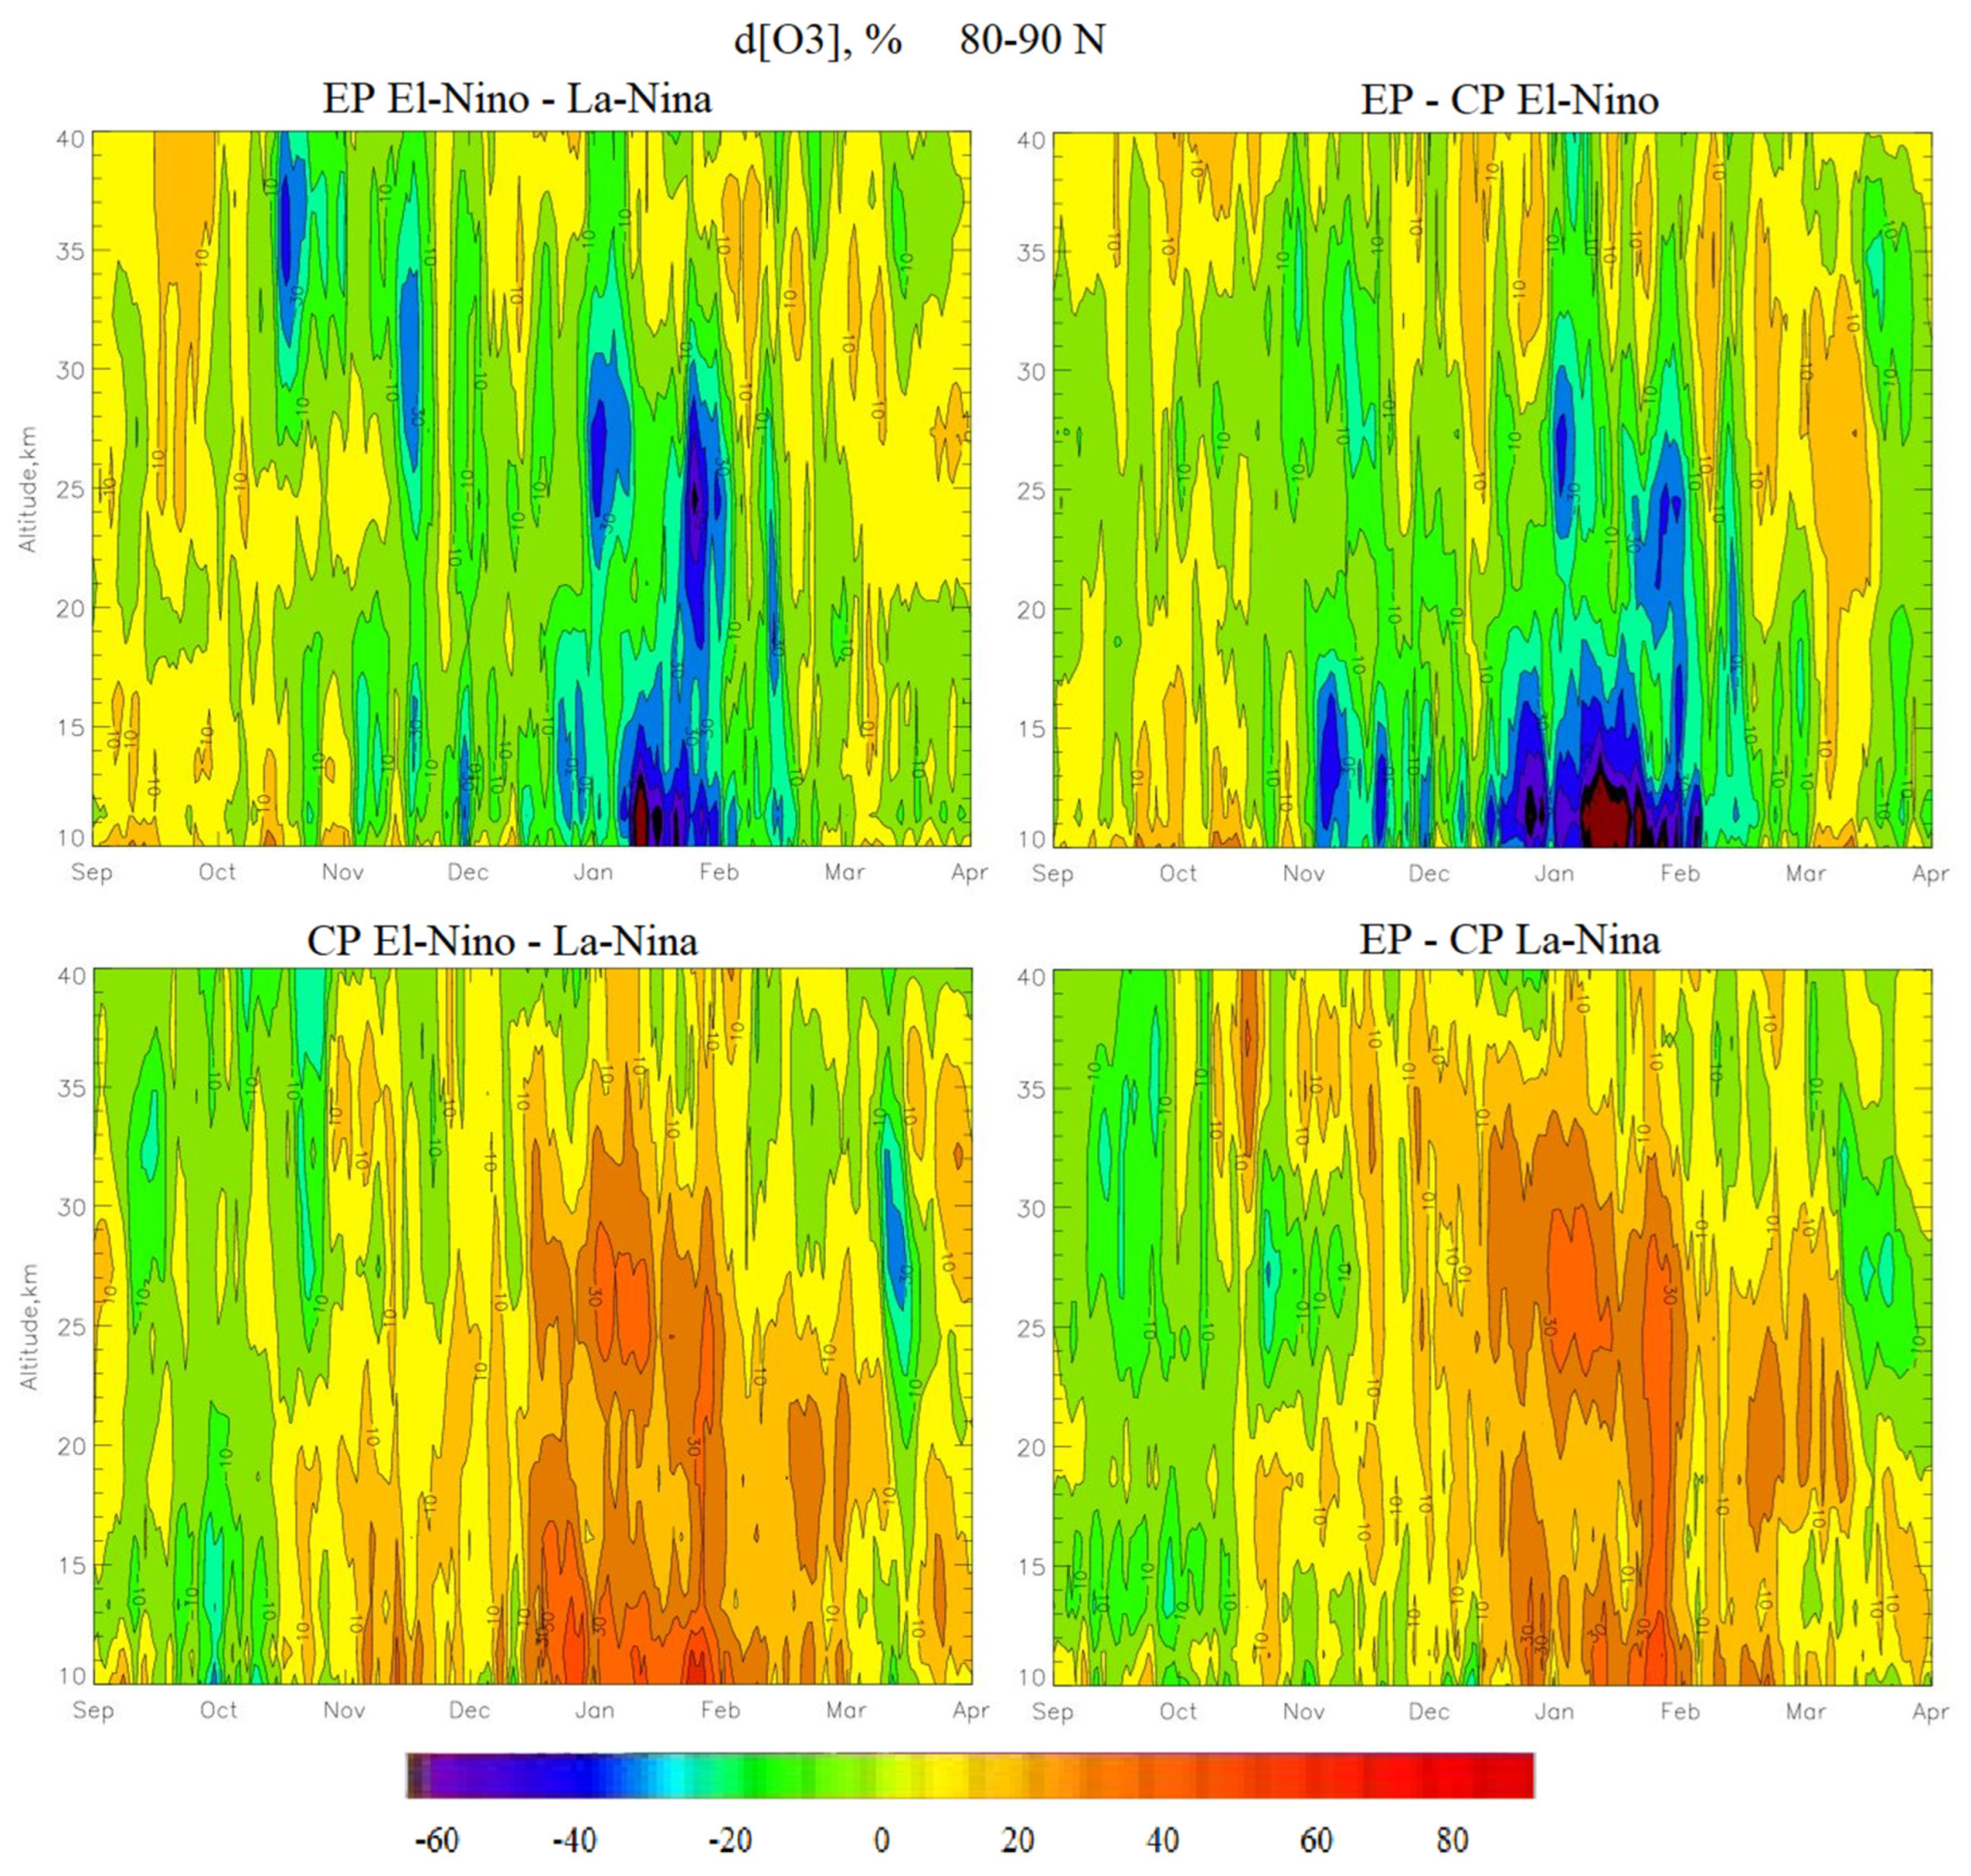
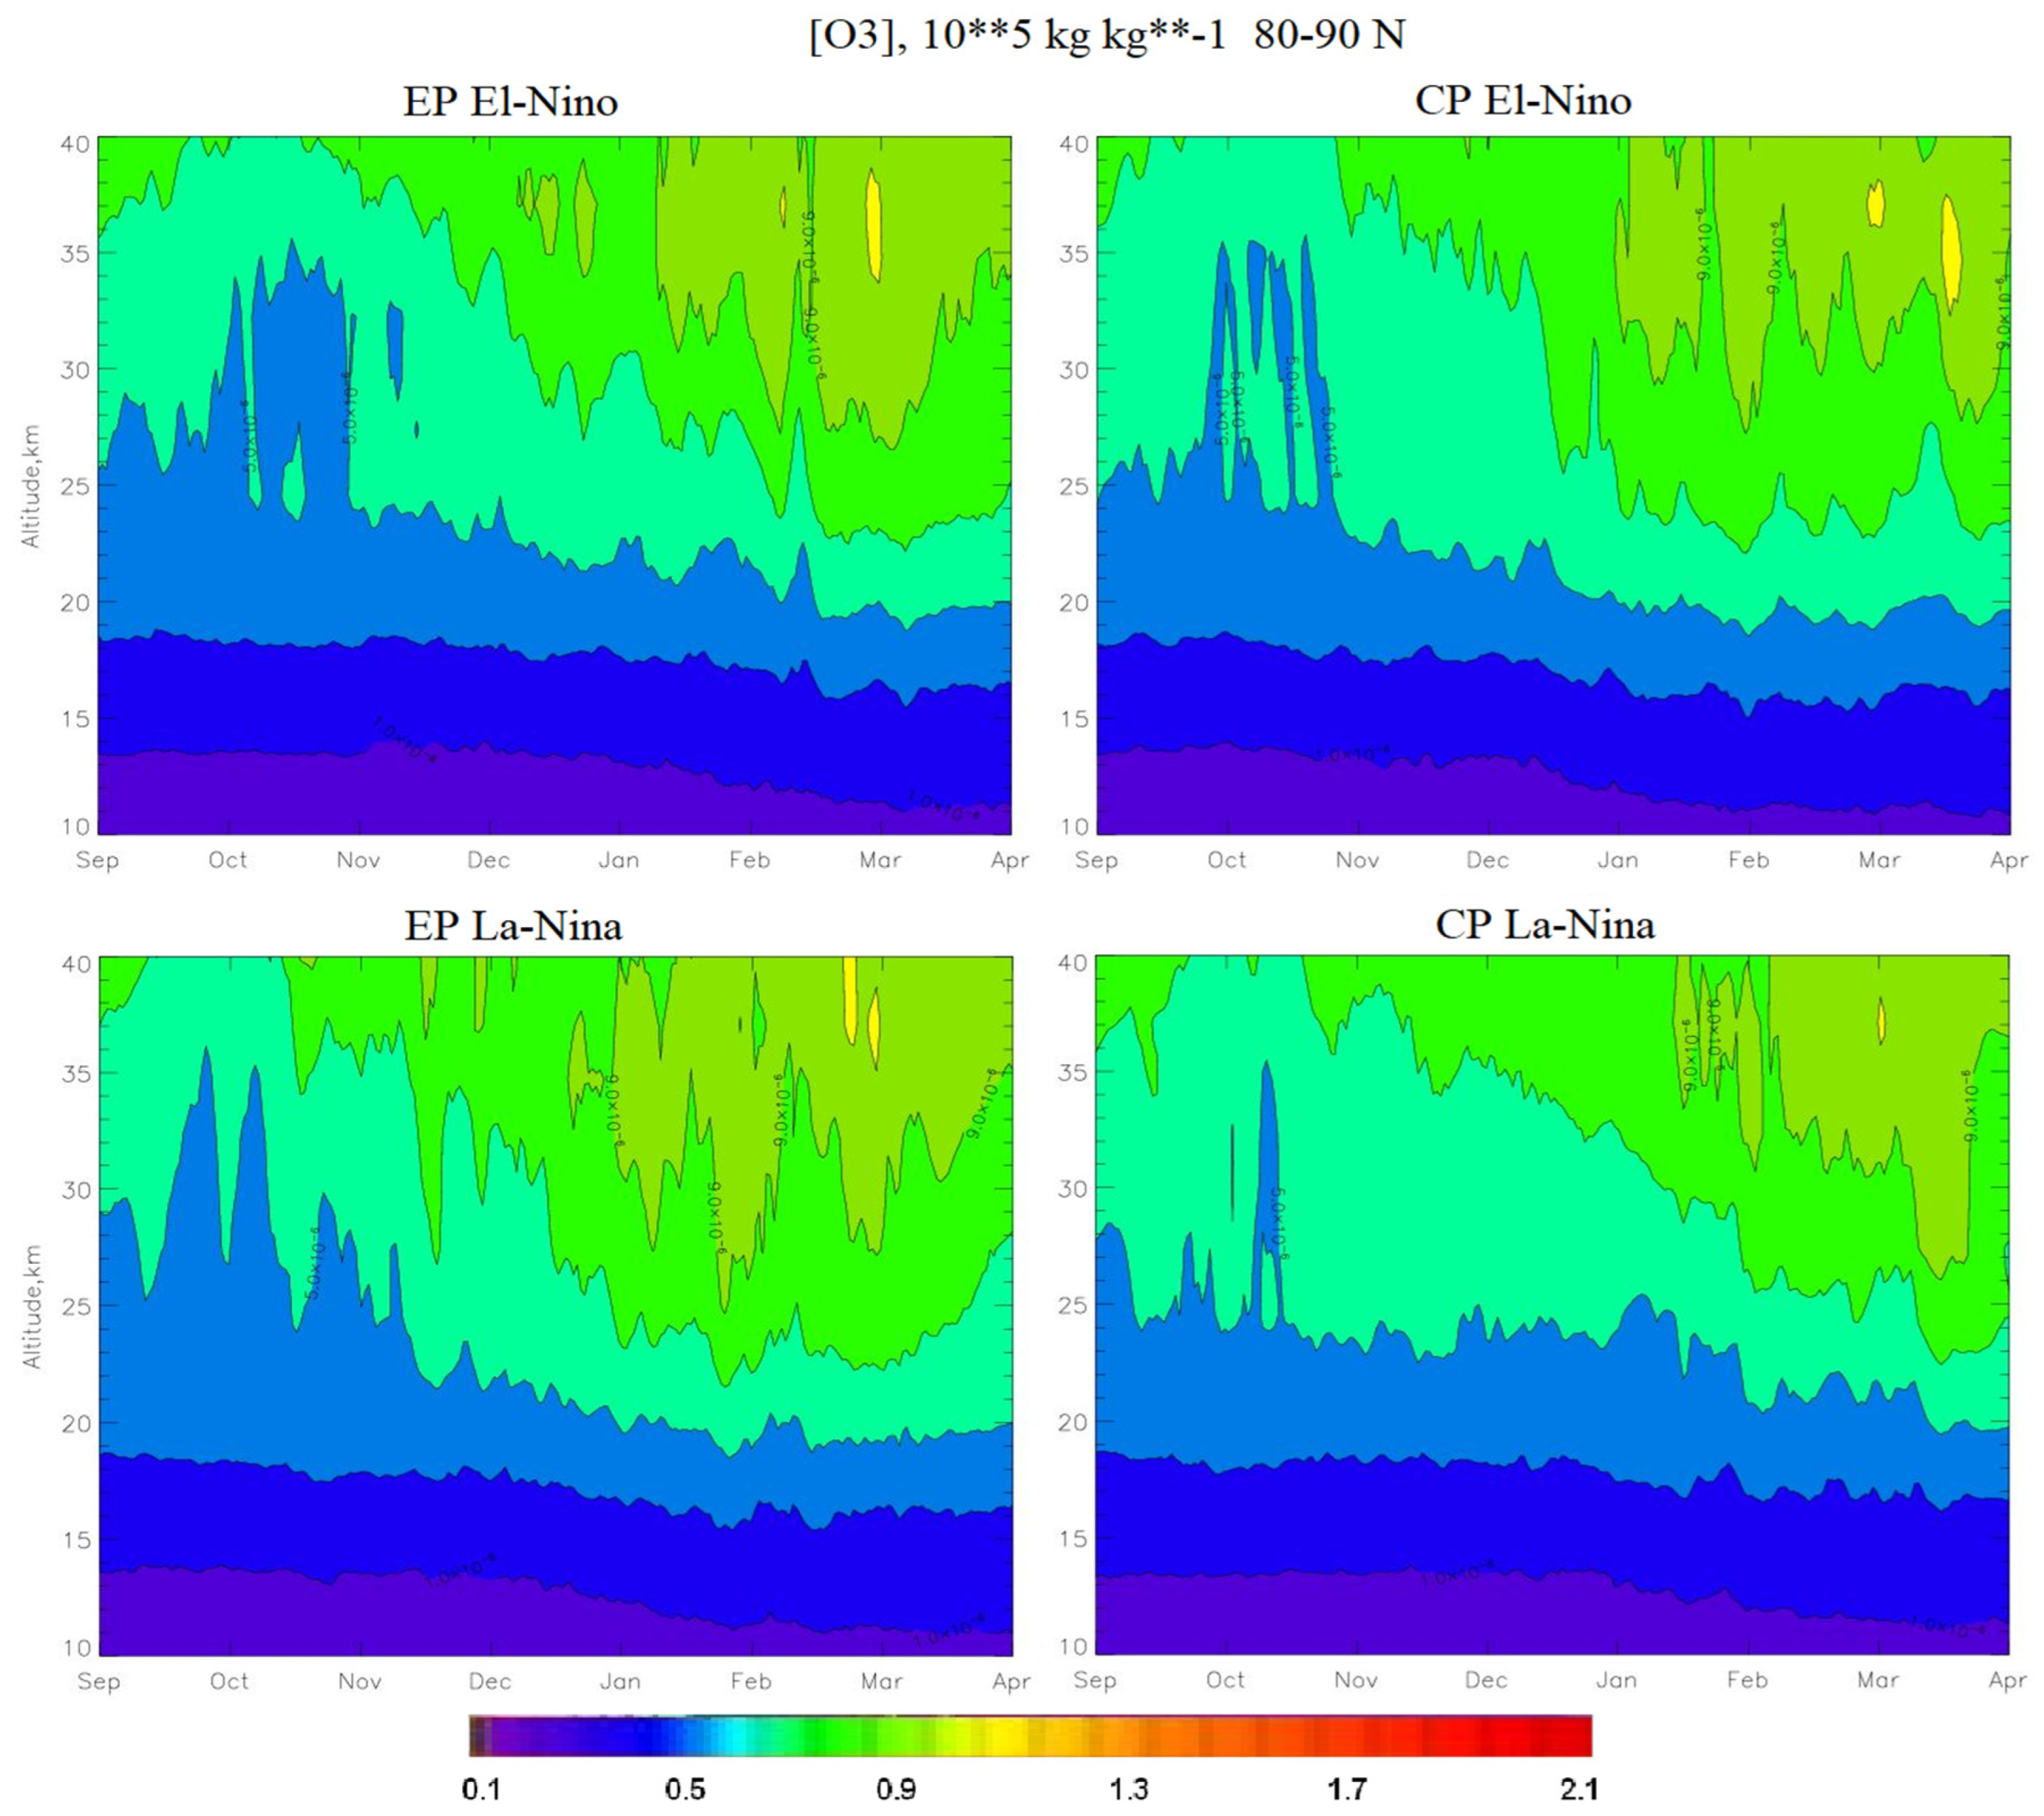
- The largest increase in ozone occurs during CP El Niño and EP La Niña. During these phases, the SSWs are the most powerful and occur in January, leading to the destruction of the PV, which leads to an increase in the BD circulation. During EP El Niño, the SSW occurs in February, so the PV is more stable than during CP El Niño and EP La Niña, and the ozone concentration increases later and not as much as during CP El Niño and EP La Niña. At CP La Niña, there are no SSWs, the PV is stable, so the BD circulation is weak, and the ozone concentration decreases to the state of the ozone hole.
Author Contributions
Funding
Acknowledgments
Conflicts of Interest
References
- Arnaud Czaja Ocean-atmosphere coupling in midlatitudes: does it invigorate or damp the storm track?//ECMWF Seminar on Seasonal Prediction, 3-7 September 2012. P. 35-46.
- Bjerknes, J. (1969). Atmospheric teleconnections from the equatorial Pacific. Monthly Weather Review, 97(3), 163–172.
- Liu, Z., & Alexander, M. (2007). Atmospheric bridge, oceanic tunnel, and global climatic teleconnections. Reviews of Geophysics, 45, RG2005. [CrossRef]
- Graf, H.-F.; Zanchettin, D. Central Pacific El Niño, the “subtropical bridge,” and Eurasian climate. J. Geophys. Res. 2012, 117, D01102.
- Frauen, C.; Dommenget, D.; Tyrrell, N.; Rezny, M.; Wales, S. Analysis of the Nonlinearity of El Niño–Southern Oscillation Teleconnections. J. Clim. 2014, 27, 6225–6244.
- Zheleznova, I.V.; Gushchina, D.Y. The response of global atmospheric circulation to two types of El Niño. Russ. Meteorol. Hydrol. 2015, 40, 170–179.
- Zheleznova, I.V.; Gushchina, D.Y. Circulation anomalies in the atmospheric centers of action during the Eastern Pacific and Central Pacific El Niño. Russ. Meteorol. Hydrol. 2016, 41, 760–769.
- Zhou, X.; Li, J.P.; Xie, F.; Chen, Q.L.; Ding, R.Q.; Zhang, W.X.; Li, Y. Does Extreme El Nino Have a Different Effect on the Stratosphere in Boreal Winter Than Its Moderate Counterpart? J. Geophys. Res. 2018, 123, 3071–3086.
- Zhou, X.; Chen, Q.; Wang, Z.; Xu, M.; Zhao, S.; Cheng, Z.; Feng, F. Longer duration of the weak stratospheric vortex during extreme El Niño events linked to spring Eurasian coldness. J. Geophys. Res. Atmos. 2020, 125, e2019JD032331.
- Ashok, K.; Behera, S.K.; Rao, S.A.; Weng, H.; Yamagata, T. El Niño Modoki and its possible teleconnection. J. Geophys. Res. 2007, 112, C11007.
- Capotondi, A.; Wittenberg, A.T.; Newman, M.; Di Lorenzo, E.; Yu, J.-Y.; Braconnot, P.; Cole, J.; Dewitte, B.; Giese, B.; Guilyardi, E.; et al. Understanding ENSO diversity. Bull. Am. Meteorol. Soc. 2015, 96, 921–938.
- Timmermann, A.; An, S.-I.; Kug, J.-S.; Jin, F.-F.; Cai, W.; Capotondi, A.; Cobb, K.M.; Lengaigne, M.; McPhaden, M.J.; Stuecker, M.F.; et al. El Niño–Southern Oscillation complexity. Nature 2018, 559, 535–545.
- Takahashi, K.; Dewitte, B. Strong and moderate nonlinear El Niño regimes. Clim. Dyn. 2016, 46, 1627–1645.
- Yeh, S.-W.; Cai, W.; Min, S.-K.; McPhaden, M.J.; Dommenget, D.; Dewitte, B.; Collins, M.; Ashok, K.; An, S.I.; Yim, B.Y.; et al. ENSO atmospheric teleconnections and their response to greenhouse gas forcing. Rev. Geophys. 2018, 56, 185–206.
- Taschetto, S.A.; Ummenhofer, C.C.; Stuecker, M.F.; Dommenget, D.; Ashok, K.; Rodrigues, R.R.; Yeh, S.-W. ENSO atmospheric teleconnections. In El Niño Southern Oscillation in a Changing Climate; McPhaden, M.J., Santoso, A., Cai,W., Eds.; AGU Monograph; American Geophysical Union: Washington, DC, USA, 2020.
- Calvo, N., García-Herrera, R., & Garcia, R. R. (2008). The ENSO signal in the stratosphere. Annals of the New York Academy of Sciences, 1146, 16–31. https://doi.org10.1196/annals.1446.008.
- Manzini, E. (2009). Atmospheric science: ENSO and the stratosphere. Nature Geoscience, 2(11), 749–750.
- Domeisen, D.I., Garfinkel, C.I., and Butler, A.H. (2019) The Teleconnection of El Niño Southern Oscillation to the Stratosphere. Reviews of Geophysics, 57, 5–47. https://doi.org/10.1029/2018RG000596.
- Jakovlev, A.R., Smyshlyaev, S.P., 2019a. Impact of the Southern Oscillation on Arctic Stratospheric Dynamics and Ozone Layer. Izvestiya, Atmospheric and Oceanic Physics. 55 (1), 86-99.
- Pogoreltsev, A.I., Savenkova, E.N., Pertsev, N.N., 2014. Sudden Stratospheric Warmings: the Role of Normal Atmospheric Modes. Geomagnetism and Aeronomy. 54 (3), 387–403.
- Polvani, L. M., Sun, L., Butler, A. H., Richter, J. H., & Deser, C. (2017). Distinguishing stratospheric sudden warmings from ENSO as key drivers of wintertime climate variability over the North Atlantic and Eurasia. Journal of Climate, 30(6), 1959–1969. https://doi.org10.1175/JCLI-D-16-0277.1.
- Baldwin, M. P., & Dunkerton, T. J. (1999). Propagation of the Arctic Oscillation from the stratosphere to the troposphere. Journal of Geophysical Research, 104, 430–937.
- Thompson, D.; Wallace, J. Observed linkages between Eurasian surface air temperature, the North Atlantic Oscillation, Arctic Sea level pressure and the stratospheric polar vortex. Geophys. Res. Lett. 1998, 25, 1297–1300.
- Baldwin, M.P.; Dunkerton, T.J. Stratospheric harbingers of anomalous weather regimes. Science 2001, 294, 581–584.
- Kuroda, K. Relationship between the Polar-Night Jet Oscillation and the Annular Mode. Geophys. Res. Lett. 2002, 29, 1240.
- Li, Y.; Lau, N.-C. Influences of ENSO on stratospheric variability, and the descent of stratospheric perturbations into the lower troposphere. J. Clim. 2013, 26, 4725–4748.
- Cheung, H.N.; Zhou, W.; Leung, M.Y.T.; Shun, C.M.; Lee, S.M.; Tong, H.W. A strong phase reversal of the Arctic Oscillation in midwinter 2015/2016: Role of the stratospheric polar vortex and tropospheric blocking. J. Geophys. Res. Atmos. 2016, 121, 13443–13457.
- Manney, G.L.; Santee, M.L.; Rex, M.; Livesey, N.J.; Pitts, M.C.; Veefkind, P.; Nash, E.R.; Wohltmann, I.; Lehmann, R.; Froidevaux, L.; et al. Unprecedented Arctic ozone loss in 2011. Nature 2011, 478, 469.
- Rao, J.; Garfinkel, C.I. Arctic Ozone Loss in March 2020 and Its Seasonal Prediction in CFSv2: A Comparative Study with the 1997 and 2011 Cases. J. Geophys. Res. Atmos. 2020, 125, e2020JD033524.
- Garfinkel C I and Hartmann D L 2008 Different ENSO teleconnections and their effects on the stratospheric polar vortex J. Geophys. Res. 113 D18114.
- Baldwin, M.P.; O’Sullivan, D. Stratospheric effects of ENSO related tropospheric circulation anomalies. J. Clim. 1995, 8, 649–667.
- Hoskins, B.J.; Karoly, D.J. The Steady Linear Response of a Spherical Atmosphere to Thermal and Orographic Forcing. J. Atmos. Sci. 1981, 38, 1179–1196.
- Trenberth, K.E.; Branstator, G.W.; Karoly, D.; Kumar, A.; Lau, N.-C.; Ropelewski, C. Progress during TOGA in unferstanding and modeling global teleconnections associated with tropical sea surface temperatures. J. Geophys. Res. 1998, 103, 14291–14324.
- Calvo, N.; Iza, M.; Hurwitz, M.M.; Manzini, E.; Peña-Ortiz, C.; Butler, A.H.; Cagnazzo, C.; Ineson, S.; Garfinkel, C.I. Northern Hemisphere stratospheric pathway of different El Niño flavors in CMIP5 models. J. Clim. 2017, 30, 4351–4371.
- Garfinkel, C.I.; Hartmann, D.L. Effects of the El Niño Southern Oscillation and Quasi-Biennial Oscillation on polar temperatures in the stratosphere. J. Geophys. Res. 2007, 112, D19112.
- Free, M.; Seidel, D.J. Observed El Niño—Southern Oscillation temperature signal in the stratosphere. J. Geophys. Res. 2009, 114, D23108.
- Iza, M.; Calvo, N.; Manzini, E. The stratospheric pathway of La Niña. J. Clim. 2016, 29, 8899–8914.
- Hurwitz, M.; Calvo, N.; Garfinkel, C.; Butler, A.; Ineson, S.; Cagnazzo, C.; Manzini, E.; Pena-Ortiz, C. Extra-tropical atmospheric response to ENSO in CMIP5 models. Clim. Dyn. 2014, 43, 3367–3375.
- Xie, F.; Li, J.; Tian, W.; Feng, J.; Huo, Y. Signals of El Niño Modoki in the tropical tropopause layer and stratosphere. Atmos. Chem. Phys. 2012, 12, 5259–5273.
- Garfinkel, C.I.; Hurwitz, M.M.;Waugh, D.W.; Butler, A.H. Are the teleconnections of central Pacific and eastern Pacific El Niño distinct in boreal wintertime? Clim. Dyn. 2012, 41, 1835–1852.
- Weinberger, I.C.; White, I.; Oman, L. The Salience of Nonlinearities in the Boreal Winter Response to ENSO: Arctic Stratosphere and Europe. Clim. Dyn. 2019, 53, 4591–4610.
- Kolennikova, M.; Gushchina, D. Revisiting the Contrasting Response of Polar Stratosphere to the Eastern and Central Pacific El Niños. Atmosphere 2022, 13, 682. [CrossRef]
- Xie, F et al. The relative impacts of El Nino Modoki, canonical El Nino, and QBO on tropical ozone changes since the 1980s. Environmental Research Letters 9(6) (2014).
- Chandra, S., J. R. Ziemke, W. Min, and W. G. Read, 1998: Effects of 1997–1998 El Niño on tropospheric ozone and water vapor. Geophys. Res. Lett., 25, 3867–3870, doi:10.1029/98GL02695.
- Cagnazzo, C., and Coauthors, 2009: Northern winter stratospheric temperature and ozone responses to ENSO inferred from an ensemble of chemistry climate models. Atmos. Chem. Phys., 9, 8935–8948, doi:10.5194/acp-9-8935-2009.
- Rieder, H. E., and Coauthors, 2013: On the relationship between total ozone and atmospheric dynamics and chemistry at midlatitudes—Part 2: The effects of the El Niño/Southern Oscillation, volcanic eruptions and contributions of atmospheric dynamics and chemistry to long-term total ozone changes. Atmos. Chem. Phys., 13, 165–179, doi:10.5194/acp-13-165-2013.
- Camp C, Roulston M and Yung L 2003 Temporal and spatial patterns of the interannual variability of total ozone in the tropicsJ. Geophys. Res. 108 4643.
- Bonnimann, S., Luterbacher, J., Staehelin, J., Svendby, T. M., Hansen, G., Svenøe, T., 2004. Extreme climate of the global troposphere and stratosphere 1940–1942 related to El Niño. Nature. 431, 971–4.
- Zhang J, Tian W, Wang Z, Xie F and Wang F 2015 The influence of ENSO on Northern mid-latitude ozone during the winter to spring transition J. Clim. 28 4774–93.
- Gettelman A, Randel W, Massie S and Wu F 2001 El Niño as a natural experiment for studying the tropical tropopause region J. Clim. 14 3375–92.
- Garfinkel C I and Hartmann D L 2008 Different ENSO teleconnections and their effects on the stratospheric polar vortex J. Geophys. Res. 113 D18114.
- Fusco, A. C. and Salby, M. L.: Interannual variations of total ozone and their relationship to variations of planetary wave activity, J. Climate, 12, 1619–1629, 1999.
- Randel, W. J., Wu, F., and Stolarski, R.: Changes in column ozone correlated with the stratospheric EP fux, J. Meteorol. Soc. Japan, 80, 849–862, 2002.
- Weber, M., Dhomse, S., Wittrock, F., Richter, A., Sinnhuber, B.-M., and Burrows, J. P.: Dynamical control of NH and SH winter/spring total ozone from GOME observations in 1995–2002, Geophys. Res. Lett., 30(11), 1583, doi:10.1029/2002GL016799, 2003.
- Xie F., Li J., Tian W., Zhang J. A connection from Arctic stratospheric ozone to El Niño-Southern oscillation//Environ. Res. Lett. 11 (2016) 124026.
- Koval, A.V., 2019. Calculation of the Residual Mean Meridional Circulation According to the Middle and Upper Atmosphere Model (In Russia). Uchonie zapiski RSHU. 55, 25-32.
- Brewer, A. W., 1949: Evidence for a world circulation provided by the measurements of helium and water vapor distribution in the stratosphere. Quart. J. Roy. Meteor. Soc., 75, 351-363.
- Dobson, G. M. B., 1956: Origin and distribution of the polyatomic molecules in the atmosphere. Proc. R. Soc. London, Ser. A 236, 187-193.
- Shepherd, T. G., 2007: Transport in the middle atmosphere. J. Meteor. Soc. Japan, 85B, 165-191.
- Weather and Climate Change/Met Office. Available online: http://https://www.metoffice.gov.uk/hadobs/hadgem_sst/data/download.html (accessed on 20 March 2021).
- Kennedy, J. Uncertainties in sea-surface temperature measurements [Electronic resource]. Met Office Hadley Centre, FitzRoy Road, Exeter, Devon, EX1 3PB United Kingdom.—Mode of access: https://icoads.noaa.gov/climar3/c3poster-pdfs/S1P1-Kennedy.pdf.
- Donlon, C.J., Martin, M.J., et al. The Operational Sea Surface Temperature and Sea Ice Analysis (OSTIA) system//Remote Sensing of Environment, January 2011, 116:140-158. DOI: 10.1016/j.rse.2010.10.017.
- Smyshlyaev S.P., Pogoreltsev A.I., Drobashevskaya E.A., Galin V.Y. Influence of wave activity on the conposition of the polar stratosphere//Geomagnetism and Aeronomy. 2016. T. 56. № 1. C. 95-109.
- Dee, D. P., and Coauthors, 2011: The ERA-Interim reanalysis: Configuration and performance of the data assimilation system. Quart. J. Roy. Meteor. Soc., 137, 553–597, https://doi.org/10.1002/qj.828.
- Gelaro, R.; McCarty, W.; Suarez, M.J.; Todling, R.; Molod, A.; Takacs, L.; Randles, C.; Darmenov, A.; Bosilovich, M.; Reichle, R.; et al. The Modern-Era Retrospective Analysis for Research and Applications, Version 2 (MERRA-2). J. Clim. 2017, 30, 5419–5454.
- Jakovlev, A.R., Smyshlyaev, S.P., 2017. The numerical simulations of global influence of ocean and El-Nino—La-Nina on structure and composition of atmosphere (In Russia). Uchonie zapiski RSHU. 49, 58-72.
- Jakovlev A.R., Smyshlyaev S.P. Simulation of influence of ocean and El-Nino—Southern oscillation phenomenon on the structure and composition of the atmosphere//IOP Conference Series: Earth and Environmental Science (EES), CITES-2019, 386 (2019) 012021.
- Jakovlev, A.R., Smyshlyaev, S.P., 2019c. Numerical Simulation of World Ocean Effects on Temperature and Ozone in the Lower and Middle Atmosphere. Russian Meteorology and Hydrology. 44(9), 594–602.
- A.R. Jakovlev, S.P. Smyshlyaev, V.Y. Galin Interannual Variability and Trends in Sea Surface Temperature, Lower and Middle Atmosphere Temperature at Different Latitudes for 1980–2019//MDPI Atmosphere 2021, 12, 454, pp. 1-24.
- Garcia-Herrera R, Calvo N, Garcia RR, Giorgetta MA (2006) Propagation of ENSO temperature signals into the middle atmosphere: a comparison of two general circulation models and ERA-40 reanalysis data. J Geophys Res. https://doi.org/10.1029/2005J D0060 61.
- Sassi F, Kinnison D, Bolville BA, Garcia RR, Roble R (2004) Effect of El-Nino Southern Oscillation on the dynamical, thermal, and chemical structure of the middle atmosphere. J Geophys Res. https://doi.org/10.1029/2003J D0044 34.
- Scott R., Polvani L. Internal variability of the winter stratosphere//J. Atmos. Sci. 2006. V. 63. P. 2758–2778.
- Karpechko A., Perlwitz J., Manzini E. A model study of tropospheric impacts of the Arctic ozone depletion 2011//J. Geophys. Res. V. 119. № D13. P. 7999–8014.
- Pogoreltsev A.I., Savenkova E.N., Aniskina O.G., Ermakova T.S., Chen W., Wei K. Interannual and intraseasonal variability of stratospheric dynamics and stratosphere-troposphere coupling during northern winter//Journal of Atmospheric and Solar-Terrestrial Physics, 136 (2015), pp. 187–200.
- Gushchina, D.; Kolennikova, M.; Dewitte, B.; Yeh, S.-W. On the relationship between ENSO diversity and the ENSO atmospheric teleconnection to high-latitudes. Int. J. Climatol. 2021, 42, 1303–1325.
- Plumb, R.A. On the seasonal cycle of stratospheric planetary waves. Pure Appl. Geophys. 1989, 130, 233–242.
- Rao, J.; Ren, R. Modeling study of the destructive interference between the tropical Indian Ocean and eastern Pacific in their forcing in the southern winter extratropical stratosphere during ENSO. Clim Dyn. 2020, 54, 2249–2266.
- Karoly, D.J. Southern Hemisphere circulation features associated with El Ni-ño-Southern Oscillation events. J. Clim. 1989, 2, 1239–1252.
- Smith, K.L.; Kushner, P.J. Linear interference and the initiation of extratropical stratosphere-troposphere interactions. J. Geophys. Res. 2012, 117, D13107.
- Rao, J.; Ren, R. A decomposition of ENSO’s impacts on the northern winter stratosphere: Competing effect of SST forcing in the tropical Indian Ocean. Clim. Dyn. 2016, 46, 3689–3707.
- Rao, J.; Garfinkel, C.I.; Ren, R. Modulation of the northern winter stratospheric El Niño-Southern Oscillation teleconnection by the PDO. J. Clim. 2019, 32, 5761–5783.
- Ayarzagüena, B.; Ineson, S.; Dunstone, N.; Baldwin, M.; Scaife, A. Intraseasonal Effects of El Niño–Southern Oscillation on North Atlantic Climate. J. Clim. 2018, 31, 8861–8873.
- Palmeiro, F., Iza, M., Barriopedro, D., Calvo, N., & Garcнa-Herrera, R. (2017). The complex behavior of El Nico winter 2015–2016. Geophysical Research Letters, 44, 2902–2910. https://doi.org/10.1002/2017GL072920.
- Bell, C. J., Gray, L. J., Charlton-Perez, A. J., Joshi, M. M., & Scaife, A. A. (2009). Stratospheric communication of El Nico teleconnections to European winter. Journal of Climate, 22(15), 4083–4096.
- Domeisen, D. I. V., Butler, A. H., Frцhlich, K., Bittner, M., Mьller, W., & Baehr, J. (2015). Seasonal predictability over Europe arising from El Nico and stratospheric variability in the MPI-ESM Seasonal Prediction System. Journal of Climate, 28(1), 256–271.
- Garfinkel, C. I., Butler, A. H., Waugh, D. W., Hurwitz, M. M., & Polvani, L. M. (2012). Why might stratospheric sudden warmings occur with similar frequency in El Nino and La Nina winters. Journal of Geophysical Research, 117, D19106. [CrossRef]
- Taguchi, M., & Hartmann, D. L. (2006). Increased occurrence of stratospheric sudden warmings during El Nico as simulated by WACCM Journal of Climate, 19(3240), 332.
- Polvani, L. M., Sun, L., Butler, A. H., Richter, J. H., & Deser, C. (2017). Distinguishing stratospheric sudden warmings from ENSO as key drivers of wintertime climate variability over the North Atlantic and Eurasia. Journal of Climate, 30(6), 1959–1969. https://doi.org10.1175/JCLI-D-16-0277.1.
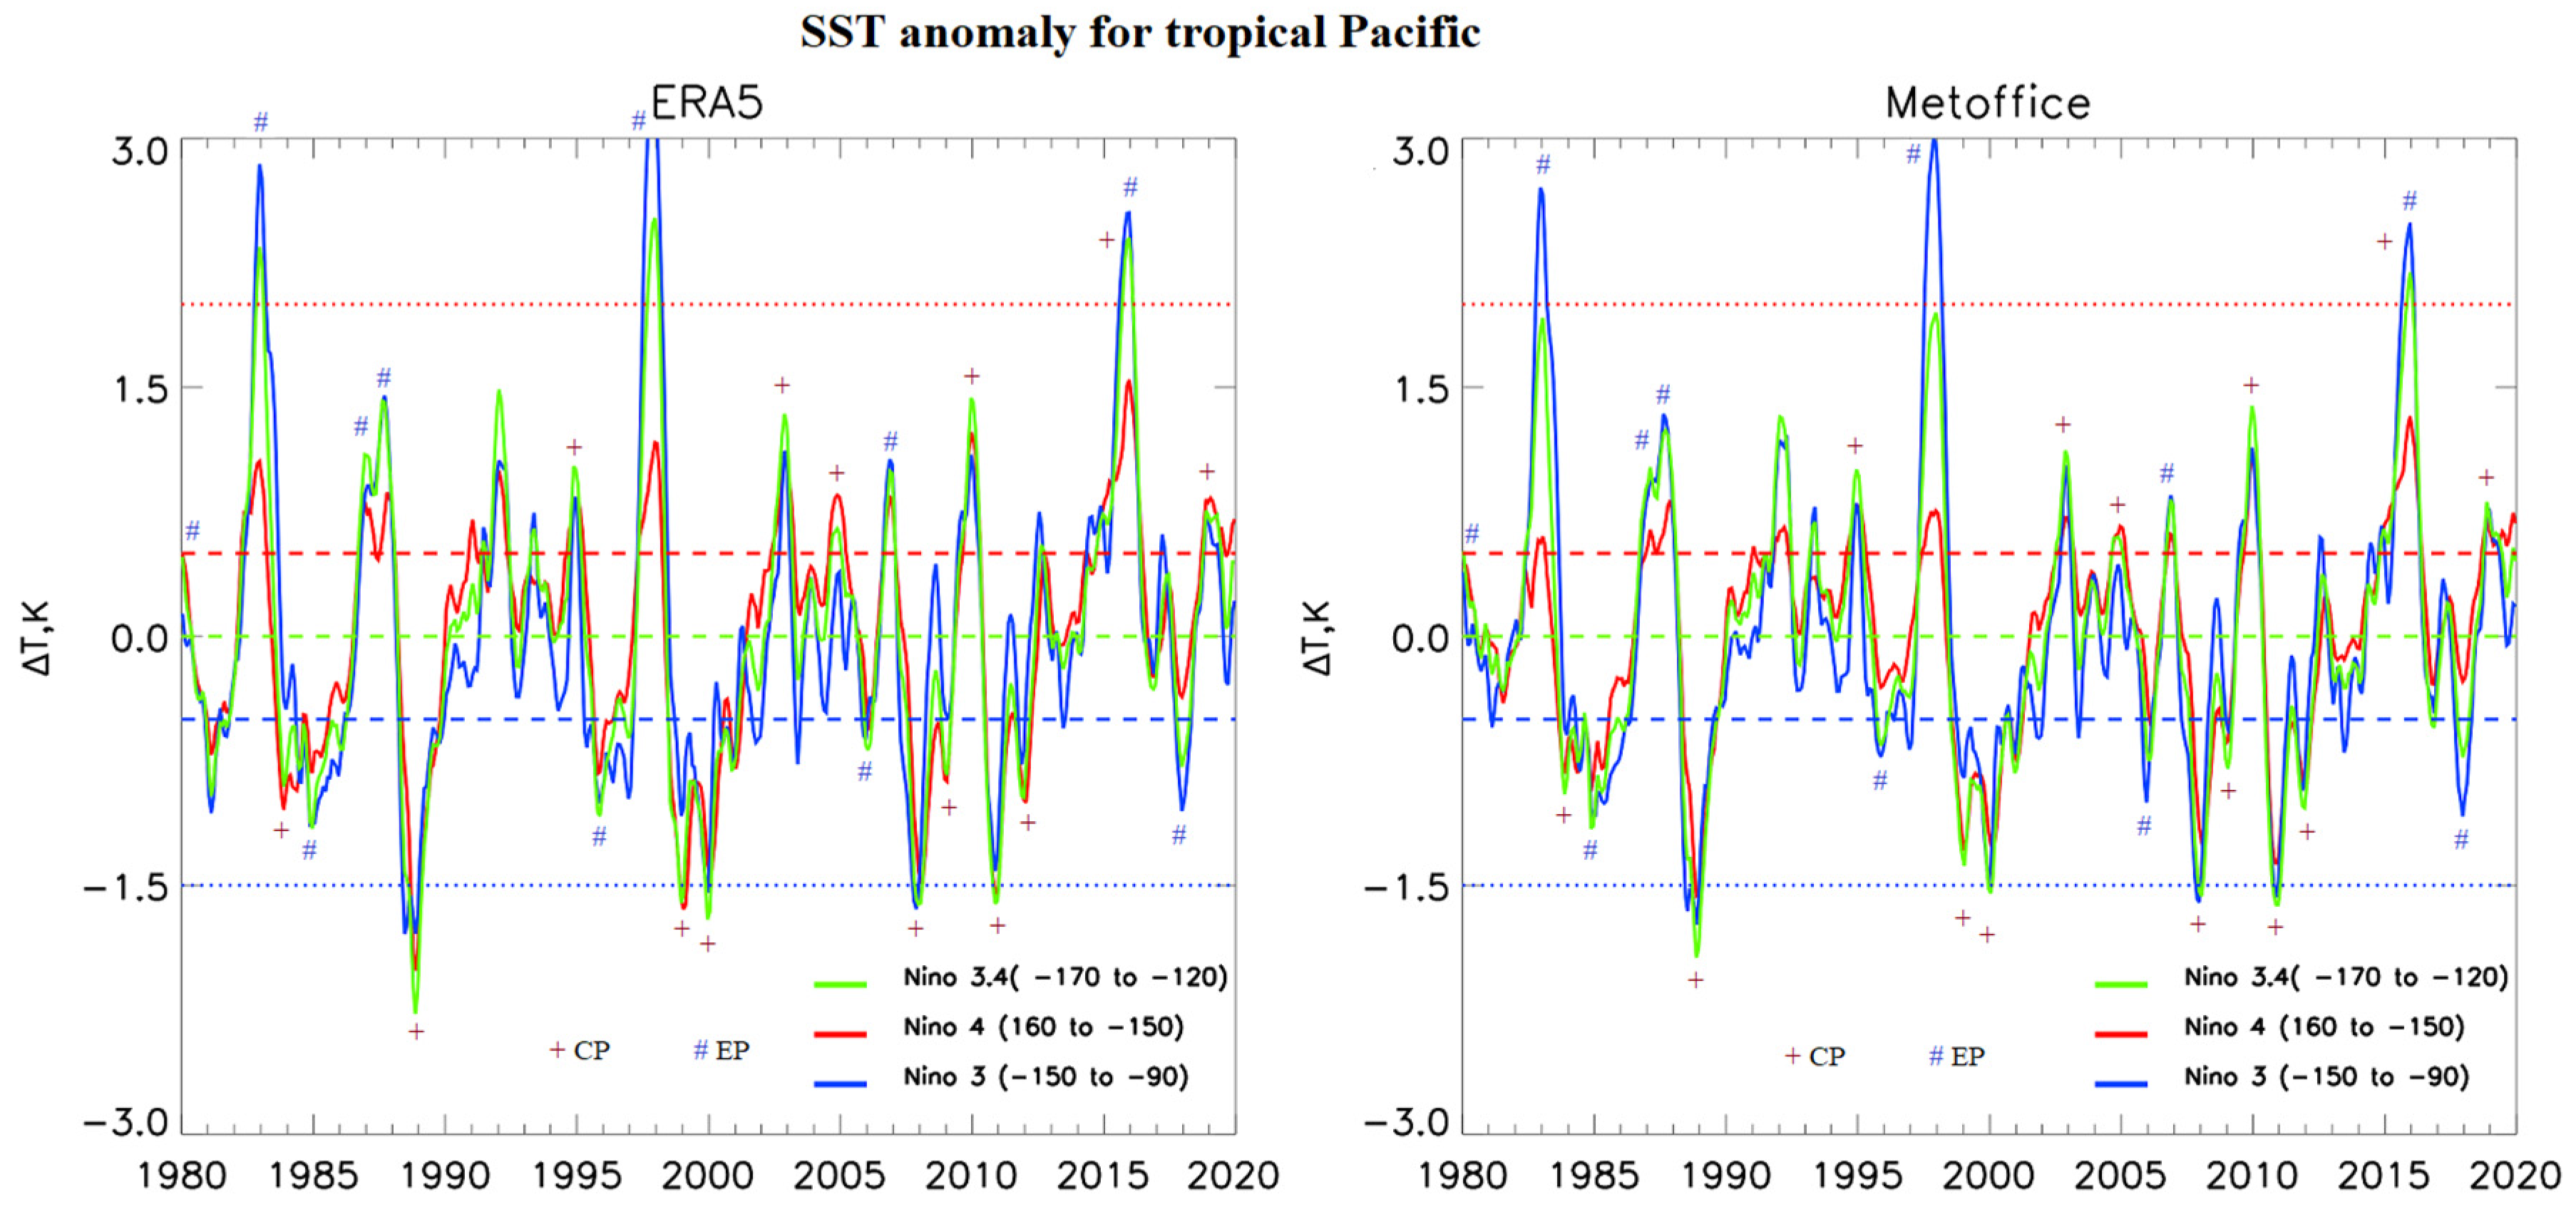
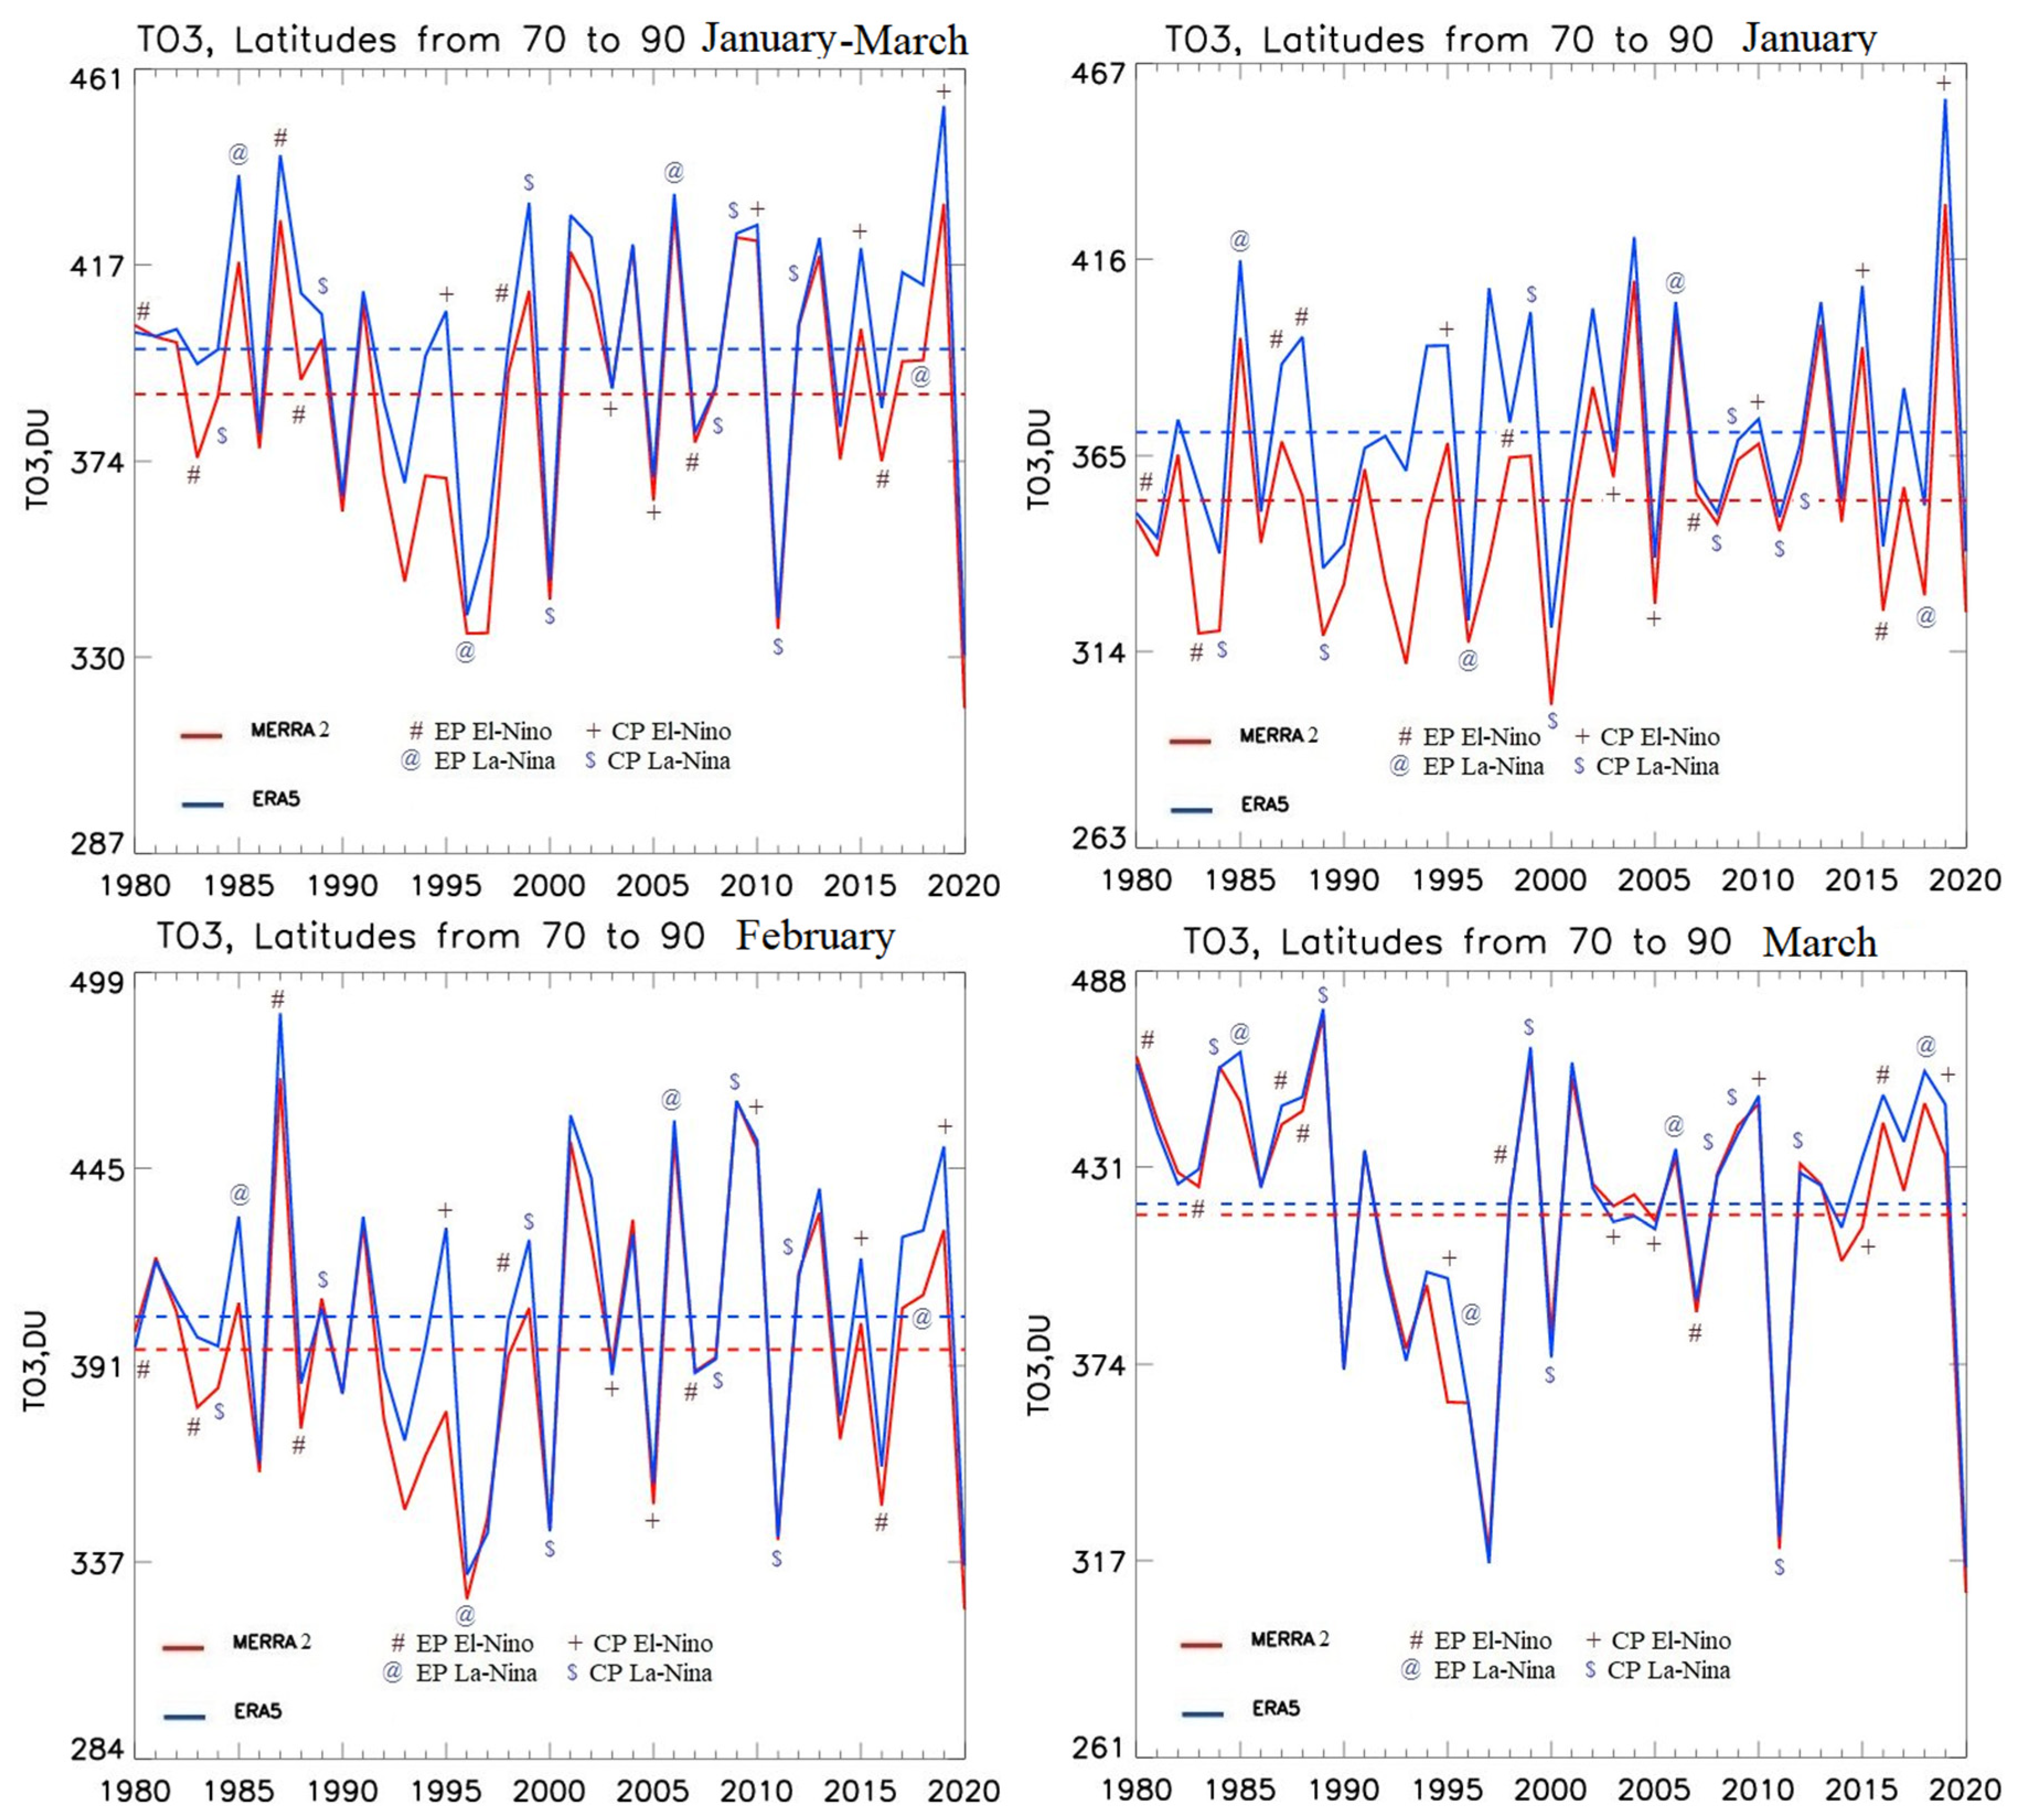
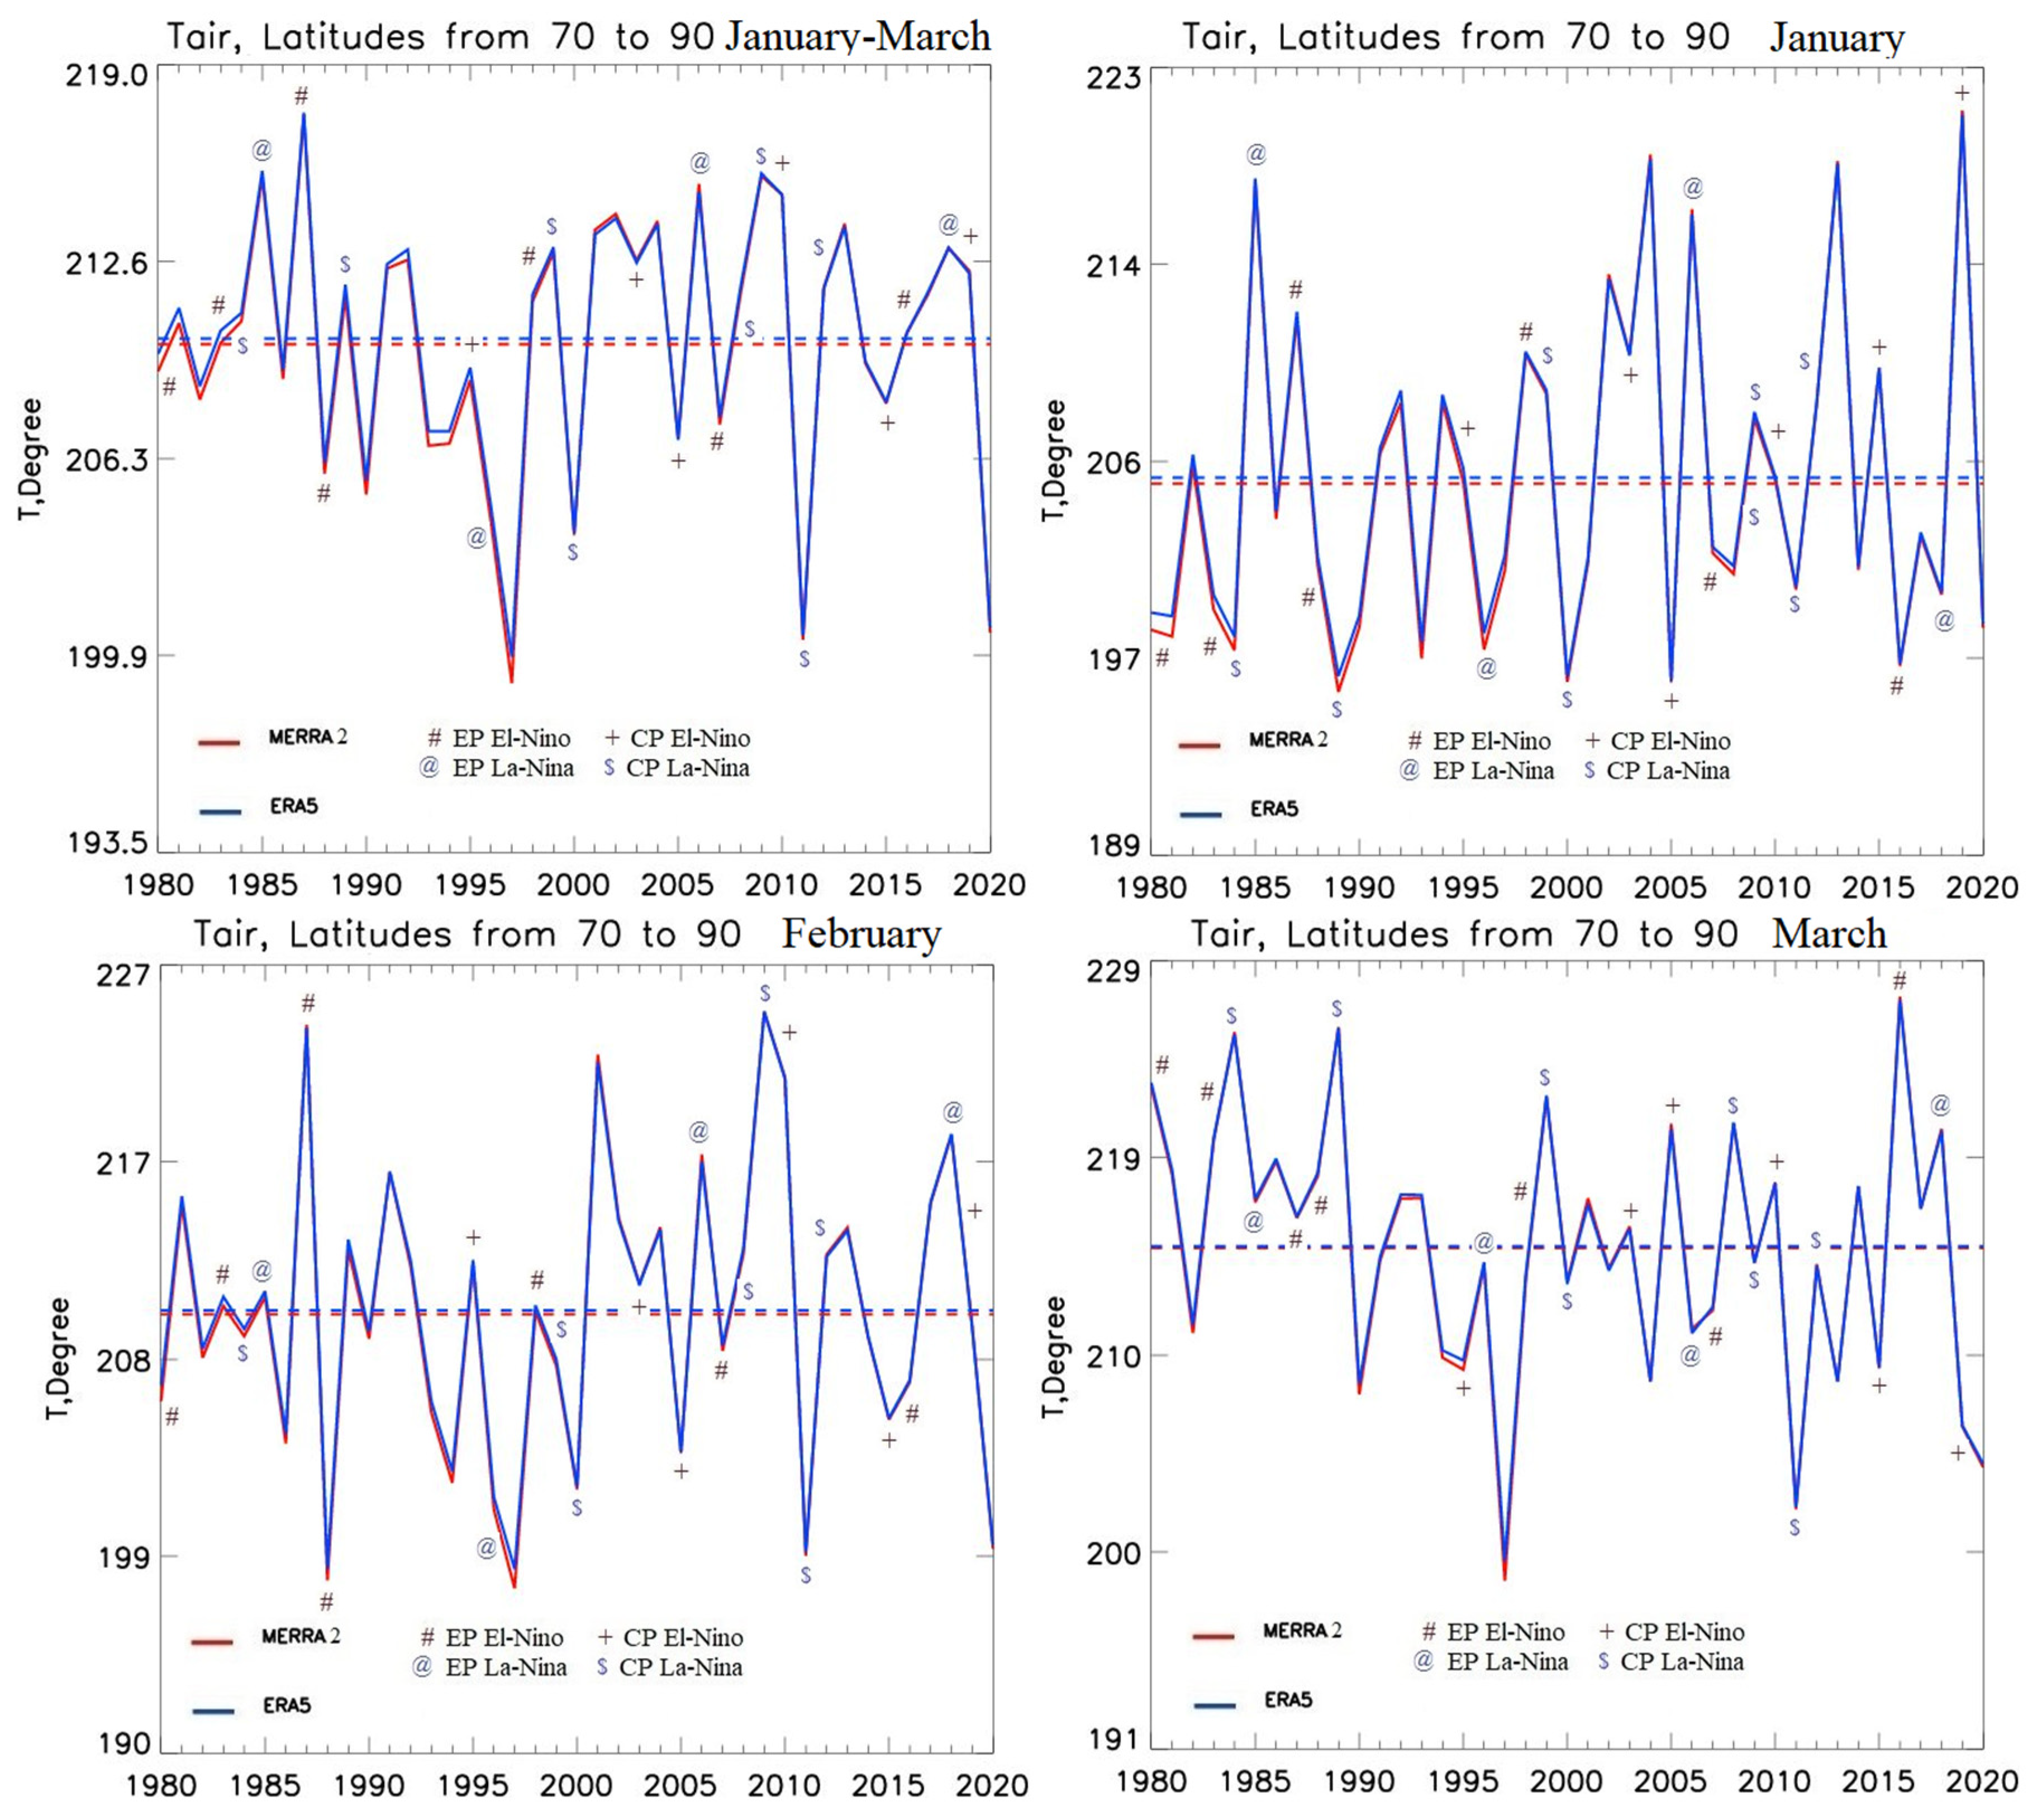
| Year | ENSO phase | CP/EP | SST Anomaly (Duration of the Period with an SST Anomaly of More than 0.5 or -0.5, Months) | TO3 Anomaly 70-90 N Jan-Mar | T Anomaly 70-90 N 15-30 km Jan-Mar | ||||
|---|---|---|---|---|---|---|---|---|---|
| 160E-150W | 170W-120W | 150W-90W | MERRA2 | ERA5 | MERRA2 | ERA5 | |||
| 1980 | El-Nino | EP | 0.3 | 0.5 (4) | 0.5 (4) | 15 | 4 | -0.9 | -0.5 |
| 1981 | Neutral | 0.1 | -0.3 | -0.1 | 13 | 3 | 0.7 | 1.0 | |
| 1982 | Neutral | -0.3 | -0.2 | -0.1 | 11 | 4 | -1.8 | -1.5 | |
| 1983 | El-Nino | EP | 0.5 (5) | 2.0 (13) | 2.2 (16) | -14 | -3 | 0.0 | 0.3 |
| 1984 | La-Nina | CP | -0.7 (12) | -0.5 (12) | -0.7 (3) | -1 | 0 | 0.7 | 0.8 |
| 1985 | La-Nina | EP | -0.7 (17) | -1.0 (14) | -1.0 (9) | 29 | 39 | 5.4 | 5.4 |
| 1986 | Neutral | -0.7 (3) | -0.4 | -0.4 | -12 | -19 | -1.1 | -1.0 | |
| 1987 | El-Nino | EP | 0.5 (5) | 1.1 (17) | 0.9 (16) | 39 | 43 | 7.4 | 7.3 |
| 1988 | El-Nino | EP | 0.7 (8) | 0.9 (17) | 1.1 (16) | 3 | 12 | -4.1 | -4.0 |
| 1989 | La-Nina | CP | -1.5 (16) | -1.5 (16) | -1.6 (15) | 12 | 8 | 1.6 | 1.7 |
| 1990 | Neutral | -0.3 | -0.3 | -0.3 | -26 | -33 | -4.9 | -4.6 | |
| 1991 | Neutral | 0.4 | -0.1 | 0.2 | 20 | 13 | 2.5 | 2.4 | |
| 1992 | El-Nino | CP/EP | 0.5 (7) | 1.0 (8) | 0.8 (9) | -18 | -12 | 2.7 | 2.9 |
| 1993 | Neutral | 0.1 | -0.2 | 0.0 | -42 | -30 | -3.3 | -3.0 | |
| 1994 | Neutral | 0.3 | 0.1 | 0.2 | -18 | -2 | -3.2 | -3.0 | |
| 1995 | El-Nino | CP | 0.7 (6) | 0.7 (6) | 0.8 (5) | -19 | 8 | -1.2 | -0.9 |
| 1996 | La-Nina | EP | -0.2 | -0.6 (6) | -0.6 (7) | -53 | -59 | -5.8 | -5.5 |
| 1997 | Neutral | -0.1 | -0.4 | -0.5 (4) | -53 | -42 | -11.0 | -10.3 | |
| 1998 | El-Nino | EP | 0.7 (8) | 2.0 (11) | 2.2 (13) | 5 | 1 | 1.4 | 1.4 |
| 1999 | La-Nina | CP | -1.0 (24) | -0.6 (25) | -0.7 (5) | 23 | 32 | 3.0 | 3.0 |
| 2000 | La-Nina | CP | -1.1 (24) | -1.1 (25) | -1.2 (12) | -46 | -51 | -6.2 | -6.3 |
| 2001 | La-Nina | EP/CP | -0.6 (6) | -0.7 (6) | -0.6 (4) | 32 | 30 | 3.7 | 3.4 |
| 2002 | Neutral | 0.1 | -0.3 | -0.5 (5) | 22 | 24 | 4.2 | 3.9 | |
| 2003 | El-Nino | CP | 0.7 (10) | 0.8 (10) | 0.9 (5) | 2 | -9 | 2.7 | 2.5 |
| 2004 | Neutral | 0.3 | 0.2 | 0.3 | 33 | 23 | 4.0 | 3.7 | |
| 2005 | El-Nino | CP | 0.6 (7) | 0.5 (6) | 0.4 | -24 | -28 | -3.0 | -3.3 |
| 2006 | La-Nina | EP | -0.1 | -0.7 (5) | -0.7 (6) | 41 | 34 | 5.2 | 4.8 |
| 2007 | El-Nino | EP | 0.5 (4) | 0.6 (5) | 0.7 (5) | -11 | -18 | -2.6 | -2.5 |
| 2008 | La-Nina | CP | -1.1 (11) | -1.1 (11) | -1.1 (12) | 1 | -8 | 1.6 | 1.7 |
| 2009 | La-Nina | CP | -0.6 (4) | -0.5 (5) | -0.5 (4) | 35 | 26 | 5.4 | 5.3 |
| 2010 | El-Nino | CP | 1.0 (9) | 1.0 (10) | 1.0 (11) | 34 | 28 | 4.8 | 4.7 |
| 2011 | La-Nina | CP | -1.4 (21) | -1.5 (12) | -1.5 (10) | -52 | -59 | -9.6 | -9.6 |
| 2012 | La-Nina | CP | -0.8 (21) | -0.8 (8) | -0.9 (5) | 15 | 6 | 1.8 | 1.6 |
| 2013 | Neutral | 0.2 | -0.1 | -0.6 (4) | 31 | 25 | 3.9 | 3.6 | |
| 2014 | Neutral | -0.1 | -0.2 | -0.2 | -14 | -17 | -0.6 | -0.7 | |
| 2015 | El-Nino | CP | 0.5 (19) | 0.5 (19) | 0.5 (3) | 14 | 22 | -1.9 | -2.0 |
| 2016 | El-Nino | EP | 1.2 (19) | 2.1 (19) | 2.0 (13) | -15 | -13 | 0.4 | 0.2 |
| 2017 | Neutral | -0.2 | -0.3 | -0.4 | 7 | 17 | 1.6 | 1.5 | |
| 2018 | La-Nina | EP | -0.2 | -0.7 (7) | -0.7 (8) | 8 | 14 | 3.1 | 2.9 |
| 2019 | El-Nino | CP | 0.6 (16) | 0.5 (9) | 0.6 (7) | 42 | 54 | 2.4 | 2.1 |
| 2020 | Neutral | 0.5 (16) | 0.1 | 0.3 | -70 | -68 | -9.3 | -9.3 | |
| Year | ENSO phase | CP/EP | TO3 anomaly 70-90 N Jan-Mar | T anomaly 70-90 N 15-30 km Jan-Mar | |||||||
|---|---|---|---|---|---|---|---|---|---|---|---|
| Jan | Feb | Mar | Jan | Feb | Mar | ||||||
| MERRA2 | ERA5 | MERRA2 | ERA5 | MERRA2 | ERA5 | ||||||
| 1980 | El-Nino | EP | -5 | -21 | 5 | -8 | 46 | 41 | -6.4 | -4.0 | 7.9 |
| 1981 | Neutral | -14 | -27 | 25 | 15 | 28 | 21 | -6.7 | 5.2 | 3.6 | |
| 1982 | Neutral | 12 | 3 | 10 | 4 | 12 | 6 | 0.8 | -2.0 | -4.1 | |
| 1983 | El-Nino | EP | -35 | -14 | -16 | -6 | 8 | 10 | -5.6 | 0.4 | 5.3 |
| 1984 | La-Nina | CP | -34 | -32 | -11 | -8 | 43 | 39 | -7.2 | -1.0 | 10.6 |
| 1985 | La-Nina | EP | 42 | 45 | 13 | 27 | 33 | 44 | 13.2 | 0.8 | 2.3 |
| 1986 | Neutral | -11 | -21 | -34 | -40 | 8 | 5 | -1.5 | -6.1 | 4.2 | |
| 1987 | El-Nino | EP | 15 | 18 | 74 | 83 | 26 | 28 | 7.3 | 13.6 | 1.5 |
| 1988 | El-Nino | EP | 1 | 25 | -22 | -18 | 30 | 31 | -3.6 | -12.5 | 3.5 |
| 1989 | La-Nina | CP | -35 | -35 | 14 | 2 | 58 | 56 | -9.1 | 3.0 | 10.8 |
| 1990 | Neutral | -22 | -29 | -12 | -21 | -44 | -48 | -6.3 | -1.1 | -7.1 | |
| 1991 | Neutral | 8 | -4 | 34 | 27 | 18 | 16 | 1.3 | 6.7 | -0.6 | |
| 1992 | El-Nino | CP/EP | -21 | -1 | -19 | -14 | -14 | -20 | 3.5 | 2.2 | 2.4 |
| 1993 | Neutral | -42 | -10 | -44 | -34 | -39 | -45 | -7.8 | -4.6 | 2.4 | |
| 1994 | Neutral | -5 | 22 | -29 | -8 | -20 | -19 | 3.6 | -7.9 | -5.3 | |
| 1995 | El-Nino | CP | 15 | 23 | -17 | 24 | -54 | -21 | 0.1 | 2.3 | -5.9 |
| 1996 | La-Nina | EP | -37 | -49 | -68 | -71 | -54 | -57 | -7.3 | -9.2 | -0.8 |
| 1997 | Neutral | -16 | 37 | -46 | -59 | -98 | -104 | -3.8 | -12.9 | -16.2 | |
| 1998 | El-Nino | EP | 11 | 3 | -2 | -1 | 5 | 0 | 5.7 | 0.1 | -1.6 |
| 1999 | La-Nina | CP | 12 | 31 | 11 | 21 | 46 | 45 | 3.9 | -2.4 | 7.4 |
| 2000 | La-Nina | CP | -53 | -51 | -49 | -59 | -34 | -44 | -8.7 | -8.2 | -1.6 |
| 2001 | La-Nina | EP/CP | -2 | -7 | 57 | 55 | 40 | 41 | -3.5 | 12.2 | 2.4 |
| 2002 | Neutral | 30 | 32 | 29 | 38 | 9 | 5 | 9.2 | 4.5 | -1.0 | |
| 2003 | El-Nino | CP | 6 | -5 | -4 | -16 | 2 | -5 | 5.7 | 1.4 | 1.1 |
| 2004 | Neutral | 57 | 51 | 35 | 22 | 6 | -3 | 14.4 | 4.1 | -6.5 | |
| 2005 | El-Nino | CP | -27 | -33 | -42 | -46 | -2 | -7 | -8.7 | -6.5 | 6.1 |
| 2006 | La-Nina | EP | 48 | 34 | 58 | 54 | 16 | 16 | 12.0 | 7.5 | -3.9 |
| 2007 | El-Nino | EP | 2 | -12 | -6 | -15 | -28 | -28 | -3.0 | -1.7 | -3.0 |
| 2008 | La-Nina | CP | -6 | -21 | -2 | -12 | 12 | 8 | -4.0 | 2.8 | 6.1 |
| 2009 | La-Nina | CP | 11 | -2 | 68 | 59 | 26 | 20 | 2.9 | 14.2 | -0.7 |
| 2010 | El-Nino | CP | 15 | 3 | 55 | 48 | 32 | 31 | 0.2 | 11.1 | 3.2 |
| 2011 | La-Nina | CP | -8 | -22 | -52 | -60 | -96 | -96 | -4.6 | -11.3 | -12.7 |
| 2012 | La-Nina | CP | 10 | -3 | 21 | 11 | 15 | 9 | 3.5 | 2.8 | -0.8 |
| 2013 | Neutral | 46 | 34 | 37 | 35 | 9 | 5 | 14.1 | 4.0 | -6.5 | |
| 2014 | Neutral | -6 | -18 | -24 | -27 | -13 | -7 | -3.8 | -1.1 | 3.0 | |
| 2015 | El-Nino | CP | 40 | 38 | 7 | 16 | -4 | 13 | 5.1 | -4.9 | -5.8 |
| 2016 | El-Nino | EP | -29 | -30 | -43 | -41 | 27 | 32 | -8.0 | -3.2 | 12.2 |
| 2017 | Neutral | 3 | 11 | 11 | 22 | 7 | 18 | -2.3 | 5.2 | 1.9 | |
| 2018 | La-Nina | EP | -25 | -19 | 15 | 23 | 32 | 38 | -4.9 | 8.4 | 5.8 |
| 2019 | El-Nino | CP | 77 | 87 | 32 | 46 | 17 | 29 | 16.3 | -0.5 | -8.7 |
| 2020 | Neutral | -29 | -31 | -71 | -68 | -109 | -105 | -6.3 | -11.0 | -10.7 | |
| Month | Total Ozone Column Anomaly on 70-90 N | Neutral | EP El-Nino | CP El-Nino | EP La-Nina | CP La-Nina |
|---|---|---|---|---|---|---|
| Jan-Mar | <-25 DU | 1990, 1993, 1997, 2020 4 years |
0 years | 2005 1 year |
1996 1 year |
2000, 2011 2 years |
| >25 DU | 2004, 2013 2 years |
1987 1 year |
2010, 2019 2 years |
1985, 2006 2 years |
1999, 2009 2 years |
|
| Jan | <-25 DU | 1981 (ERA5), 1990 (ERA5), 1993 (MERRA2), 2020 4 Years |
1983 (MERRA2), 2016 2 years |
2005 1 year |
1996, 2018 (MERRA2) 2 years |
1984, 1989, 2000 3 years |
| >25 DU | 1997 (ERA5), 2002, 2004, 2013 4 years |
1988 (ERA5) 1 year |
2015, 2019 2 years |
1985, 2006 2 years |
1999 (ERA5) 1 year |
|
| Feb | <-25 DU | 1986, 1993, 1994 (MERRA2), 1997, 2014, 2020 6 years |
2016 1 year |
2005 1 year |
1996 1 year |
2000, 2011 2 years |
| >25 DU | 1981 (MERRA2), 1991, 2002, 2004 (MERRA2), 2013 5 years |
1987 1 year |
2010, 2019 2 years |
1985 (ERA5), 2006 2 years |
2009 1 year |
|
| Mar | <-25 DU | 1990, 1993, 1997, 2020 4 years |
2007 1 year |
1995 (MERRA2) 1 year |
1996 1 year |
2000, 2011 2 years |
| >25 DU | 1981 (MERRA2) 1 year |
1980, 1987, 1988, 2016 4 years |
2010, 2019 (ERA5) 2 years |
1985, 2018 2 years |
1984, 1999, 2009 (MERRA2) 3 years |
Disclaimer/Publisher’s Note: The statements, opinions and data contained in all publications are solely those of the individual author(s) and contributor(s) and not of MDPI and/or the editor(s). MDPI and/or the editor(s) disclaim responsibility for any injury to people or property resulting from any ideas, methods, instructions or products referred to in the content. |
© 2024 by the authors. Licensee MDPI, Basel, Switzerland. This article is an open access article distributed under the terms and conditions of the Creative Commons Attribution (CC BY) license (https://creativecommons.org/licenses/by/4.0/).


