1. Research Background
Nondestructive techniques for inspecting trees have been developed to improve the convenience and cost-effectiveness of such inspections. Techniques such as those involving the use of stress wave timing and ultrasonic methods yield unique advantages and disadvantages and enable data to be obtained with only a minimal level of damage being done to the surface of the inspected tree. In the present study, data were obtained using the ground-penetrating radar (GPR) method, which does not damage trees and does nearly no harm to tree trunks. Furthermore, this method enables the long-range investigation of damage to the trunks of standing trees. A review of the relevant literature is presented in this section.
Mattheck [
1] investigated potential tree hazards and explained and assessed the symptoms of trees from a mechanical perspective to achieve greater understanding of the conditions of trees and to evaluate tree safety.
Daniels [
2] modified the band-pass Butterworth filter in the time domain by removing frequencies higher than twice the frequency at the center of the antenna and lower than one-third of this frequency while retaining all other frequencies. They coupled this filtering method with background removal to effectively enhance underground reflection, particularly when the antenna was located far from the target.
The most major problem associated with taking measurements for on-site standing trees is determining the time at which a signal exits a trunk. Lorenzo et al. [
3] reported that the GPR-based measurement of cylindrical targets involves determining the timing of signal exit, which can be achieved by placing a metallic sheet opposite the antenna. Because metallic sheets are conductors, they effectively reflect radar signals. Metallic sheets can therefore be used to detect differences between radar signals and to determine the time of propagation of such signals within a trunk.
Ježová et al. [
4] simulated hole-shaped damage by using polyvinyl chloride cylinders. Their results revealed that the closer a GPR antenna is to a hole, the shorter is the signal propagation time. Furthermore, the signal propagation time increases with the distance between the antenna and the hole. Radargrams obtained by the aforementioned authors were characterized by wave-shaped curves rather than the double curves typical of GPR images.
Benedetto et al. [
5] used time-varied gain to compensate for the rapid attenuation of GPR signals, to equalize the amplitude of these signals, and to increase the visibility of the responses of deep targets. In addition, they compensated for energy loss by using linear time gain and exponential gain. The automatic-gain function enables amplitude equalization, and the compensation is a function of the difference between the average amplitude in a selected time window and the maximum recorded amplitude.
Jian et al. [
6] conducted GPR-based detection for living standing trees and found different reflection waveforms in the electromagnetic waves transmitted within trees with cavities or decay and healthy trees. The signals in the GPR images of perfectly smooth concentric cavities and irregular cavities appeared as horizontal layers and irregular fluctuations, respectively. Chen et al. [
7] inspected
Pinus massoniana by using a tree radar unit with an antenna frequency of 900 MHz and identified holes of various sizes on the basis of their radargrams.
Chen et al. [
8] conducted a GPR-based investigation of 15
Cinnamomum camphora trees. The GPR images of trees with eccentric crevices were characterized by waves. The results were analyzed through stress wave methods to determine the feasibility of using GPR to detect internal damage in the trunks of the aforementioned trees.
2. Research Methods
2.1. Filtering
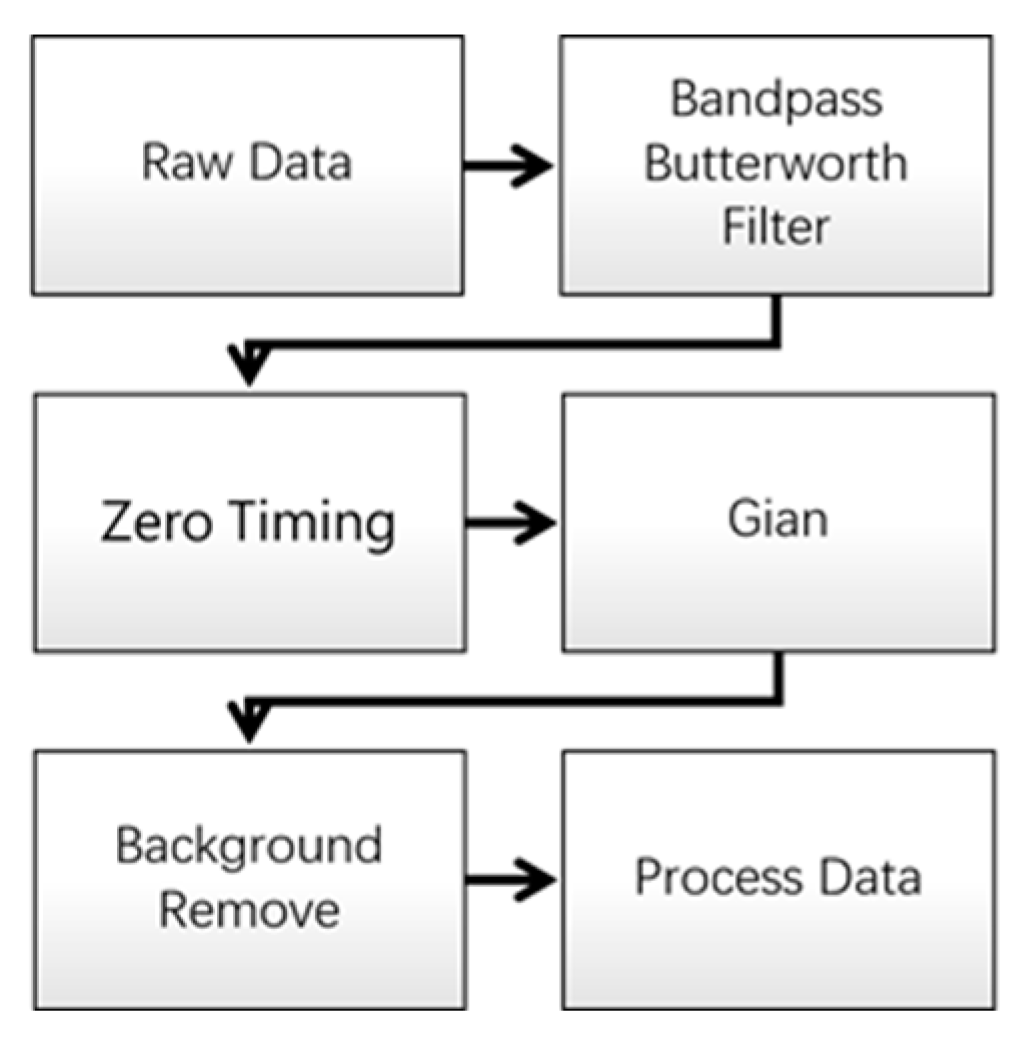
In the present study, GPR-based measurement data regarding damage in hoop pine (Araucaria cunninghamii) timber were processed through four filtering steps conducted in Reflexw software (Karlsruhe Germany). Subsequently, any damage identified in the processed images was compared with the actual damage. The four filtering steps are described as follows:
A band-pass Butterworth filter was used in the time domain to remove frequencies higher than twice the central frequency of the antenna (i.e., ˃1600 MHz) and lower than one-third of this frequency (i.e., ˂266 MHz).
Time-zero correction of GPR reflection signals was performed.
The gain exponents and linear parameters were modified to obtain high-contrast radargram signals (to prevent radargram distortion, which impedes the subsequent analysis of tree damage, parameters were not set to high values).
Background equalization was performed to eliminate coherent noise and enhance the quality of data signals (notably, repeated filtering might have resulted in image distortion).
Figure 1 displays the filtering process used in this study.
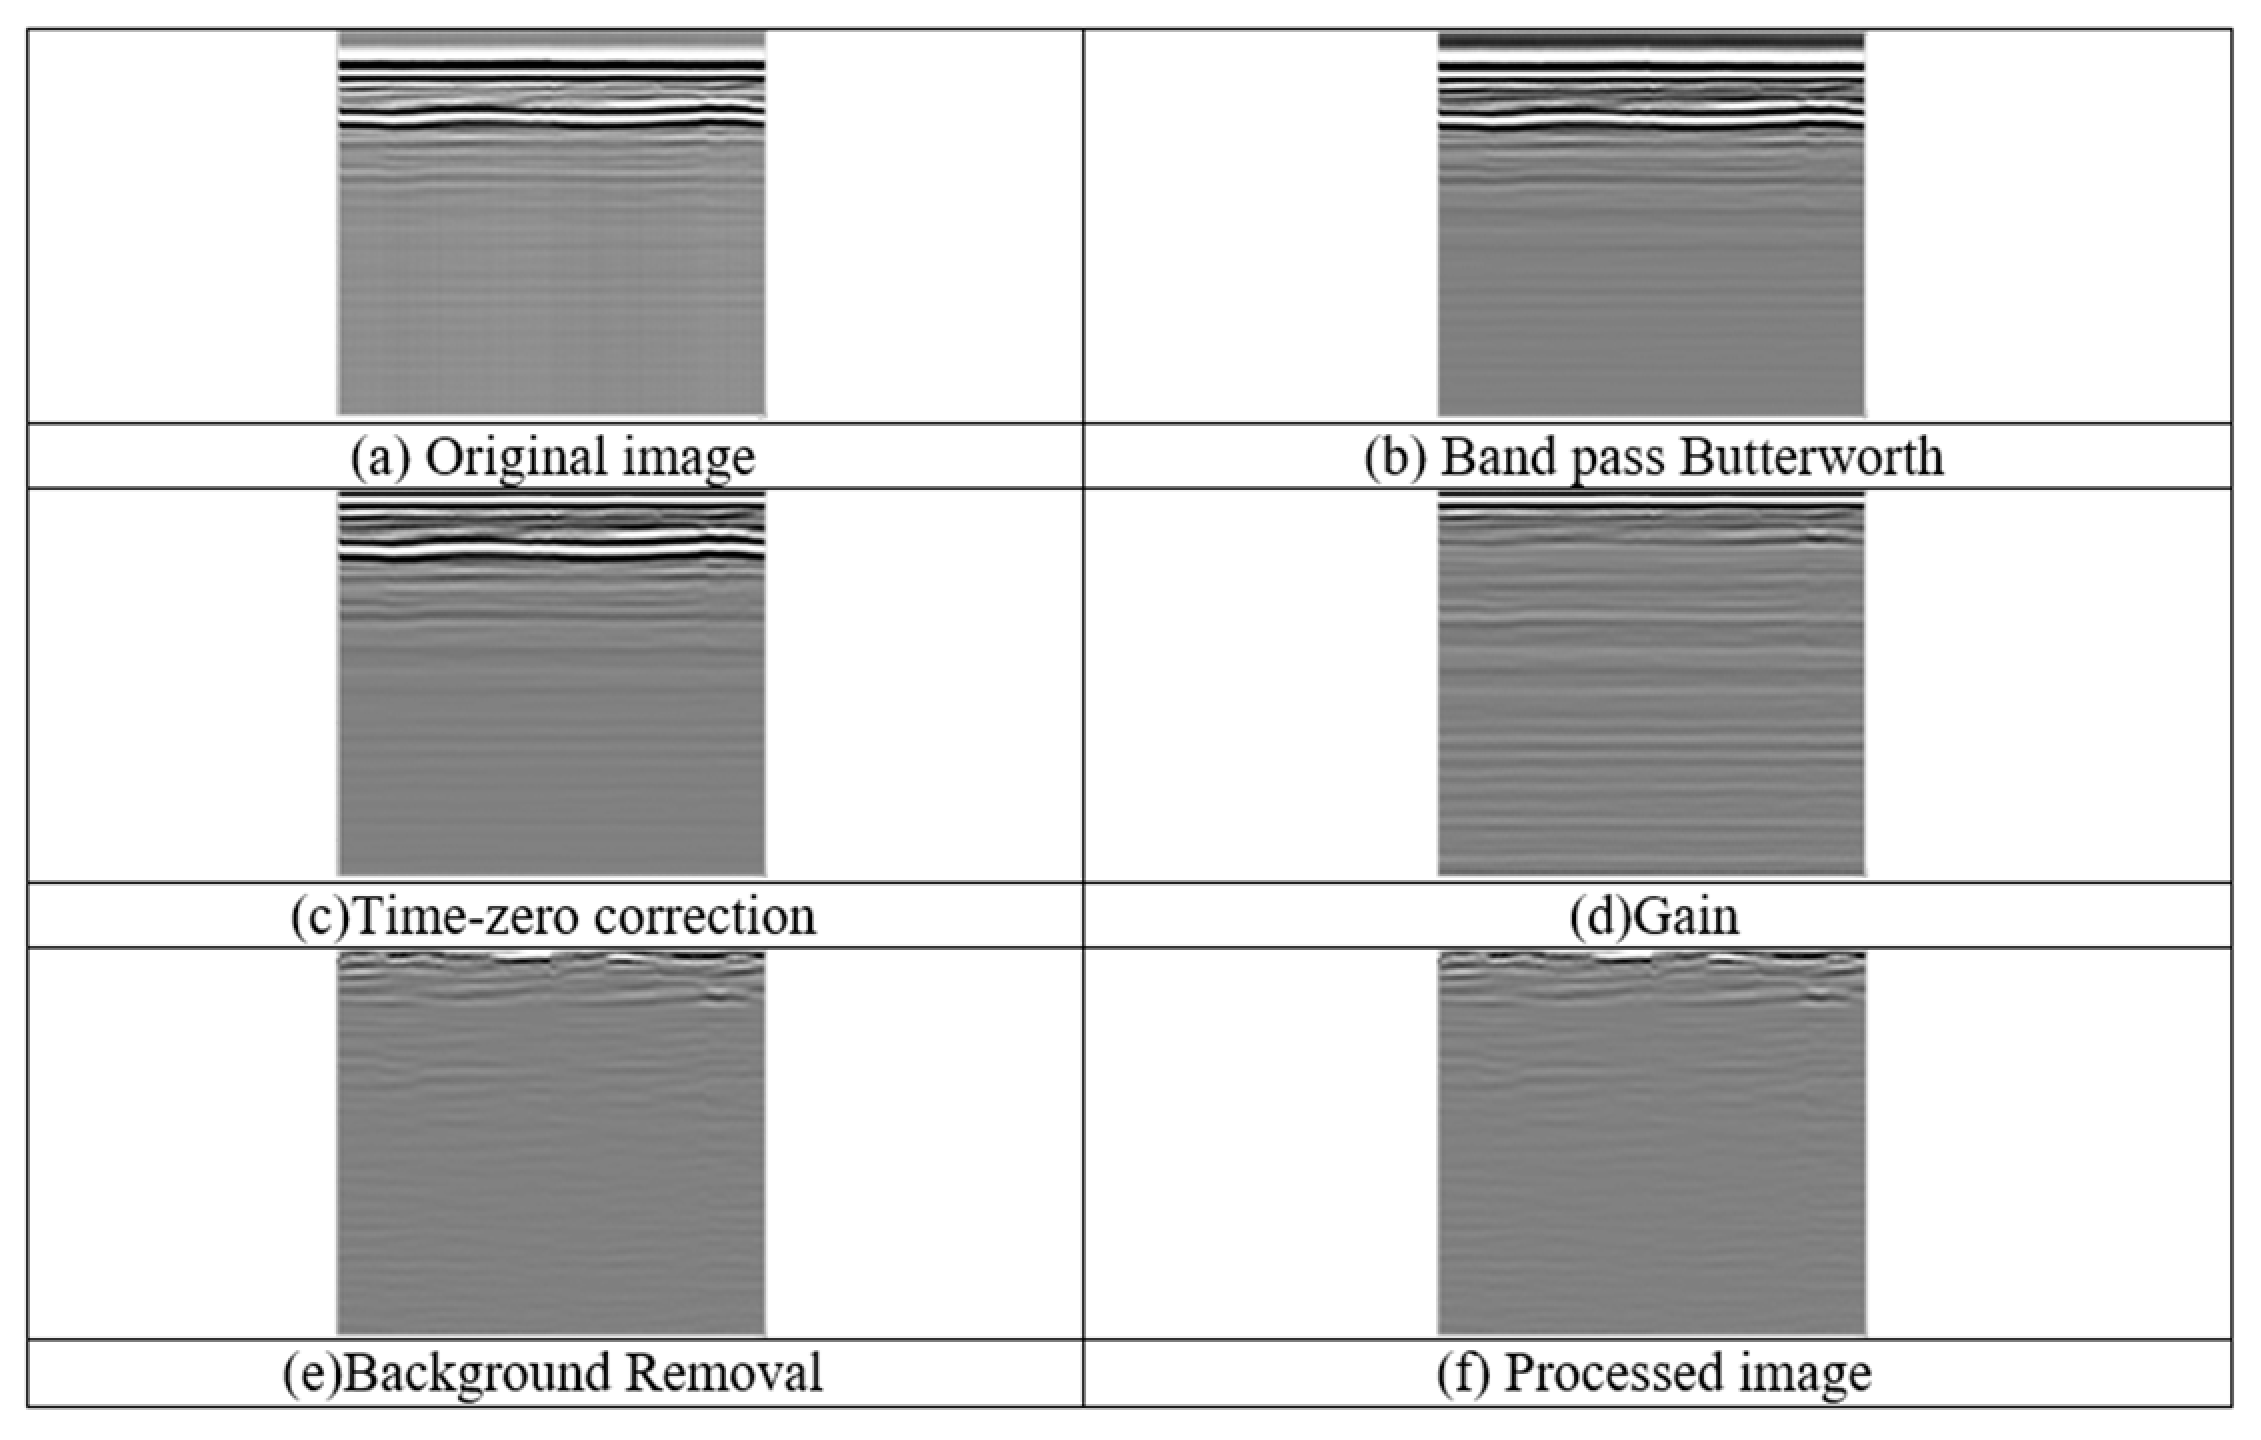
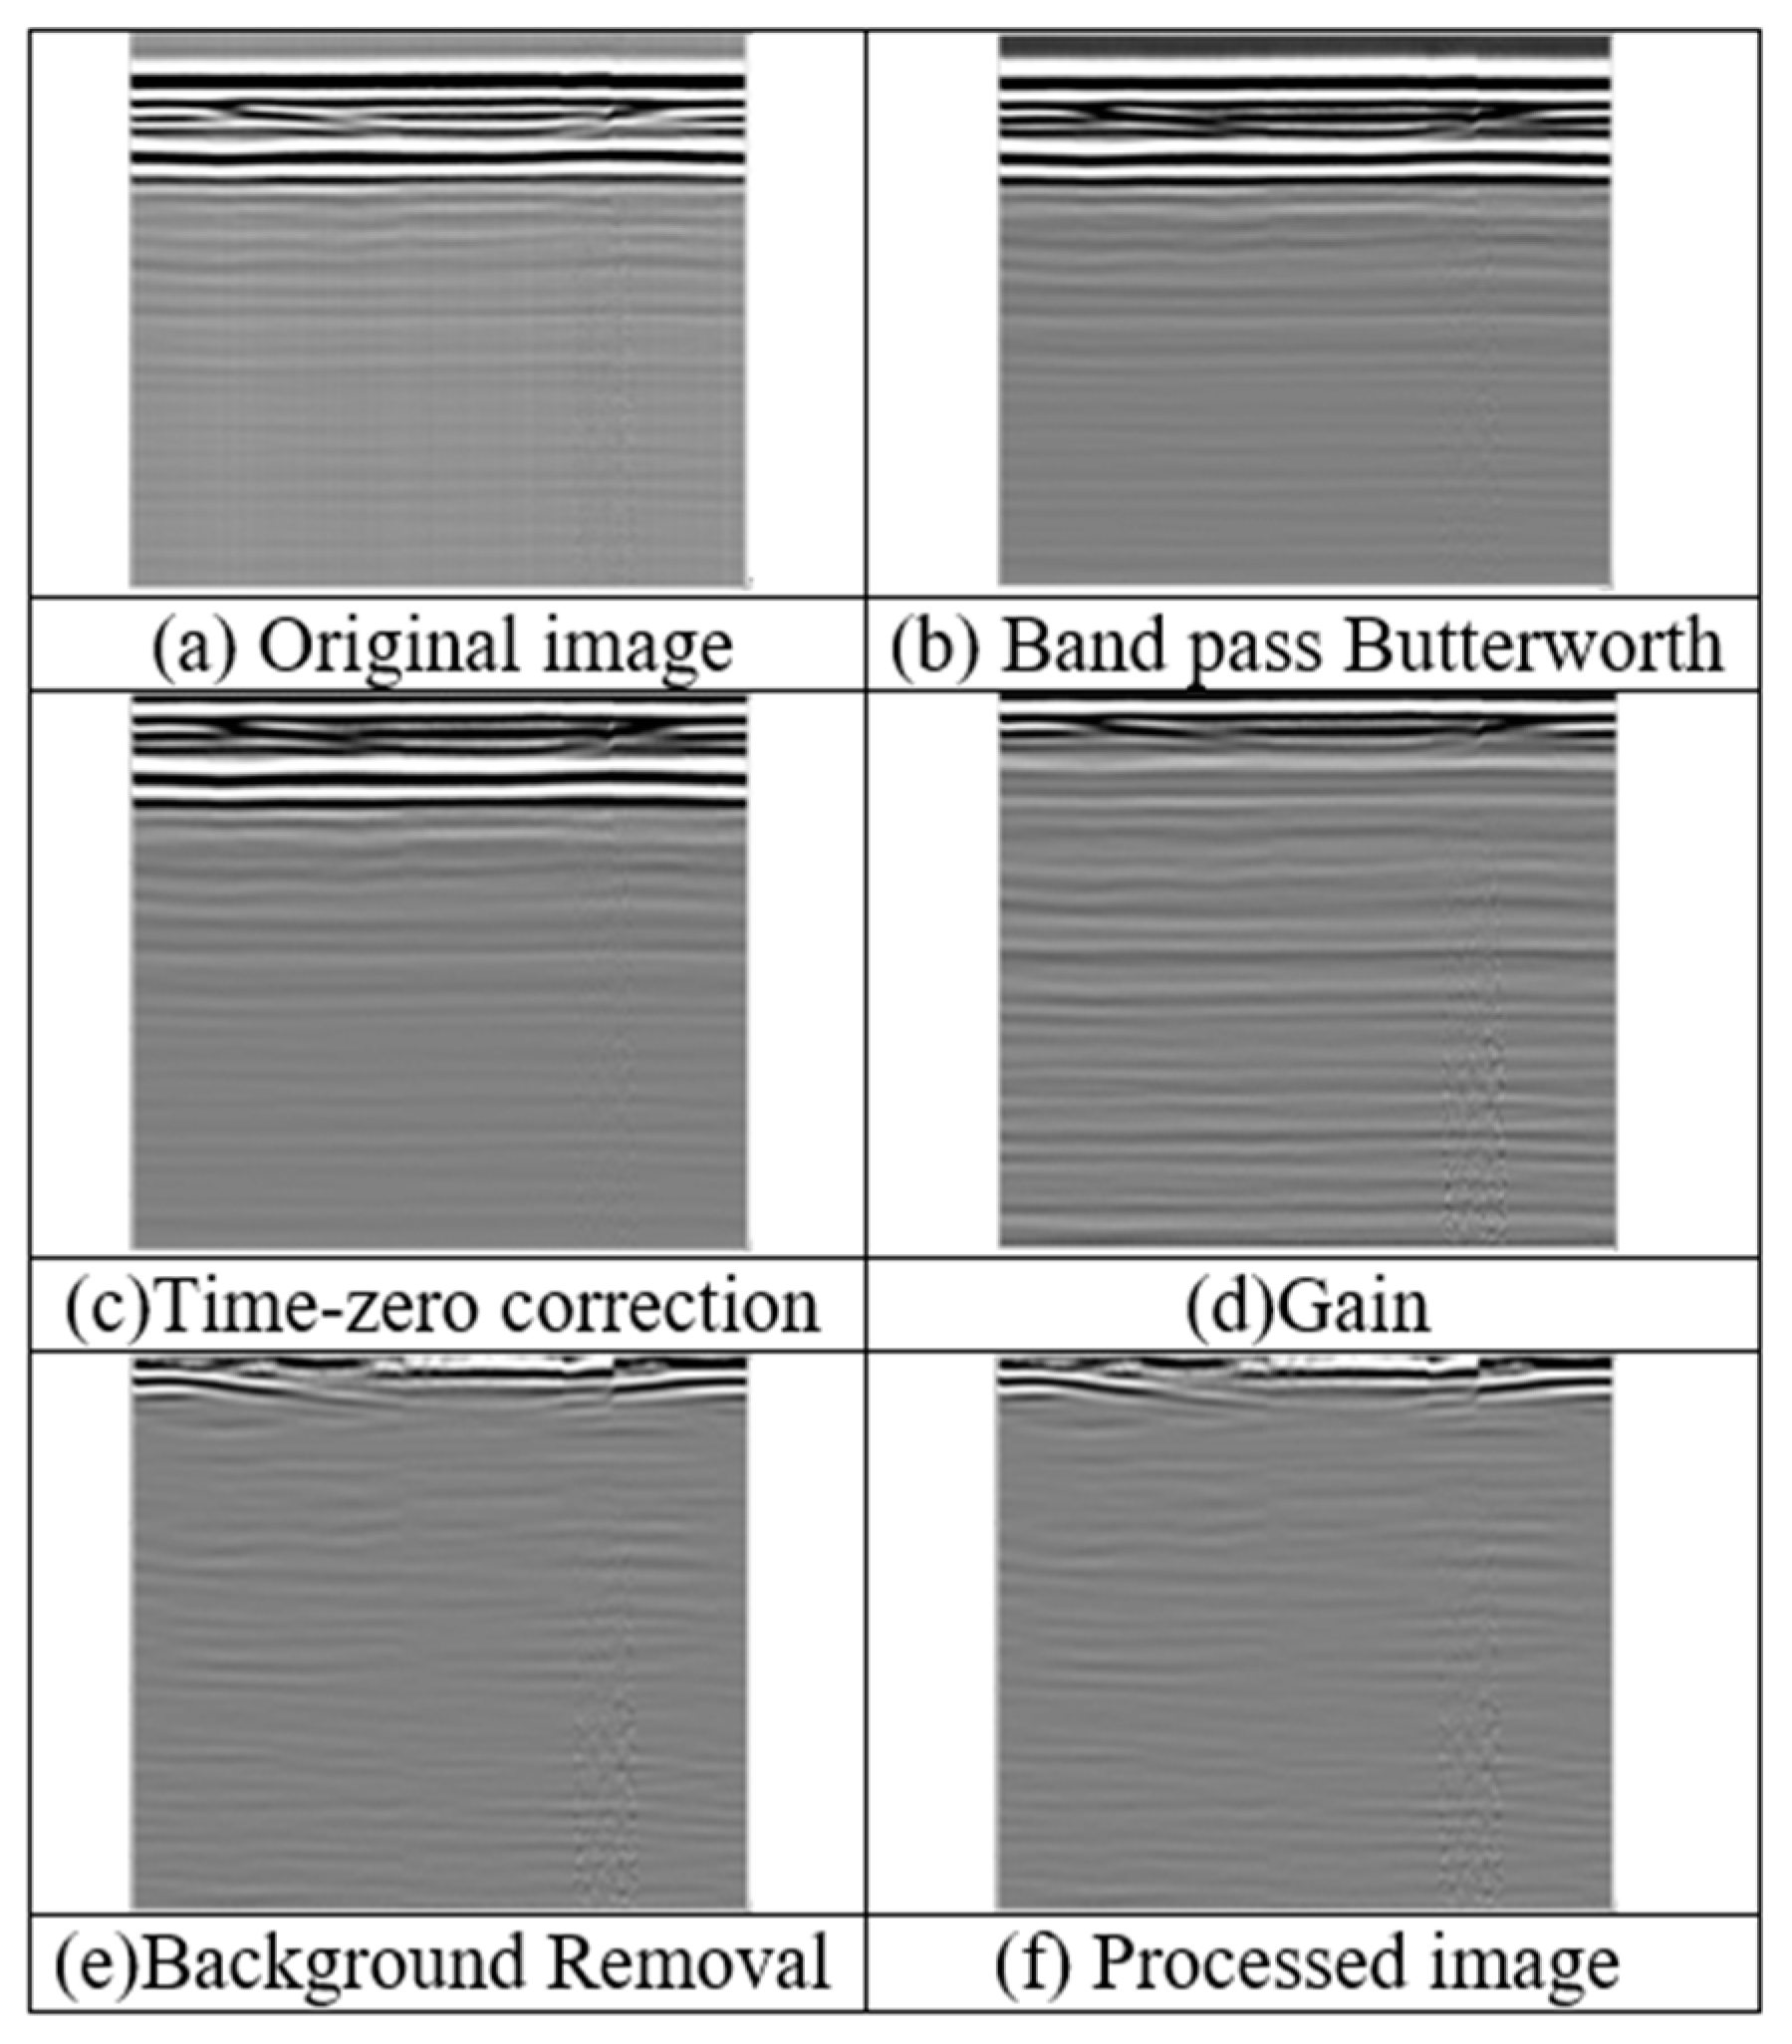
GPR reflection profiles of the examined hoop pine timber were processed using the aforementioned filtering process.
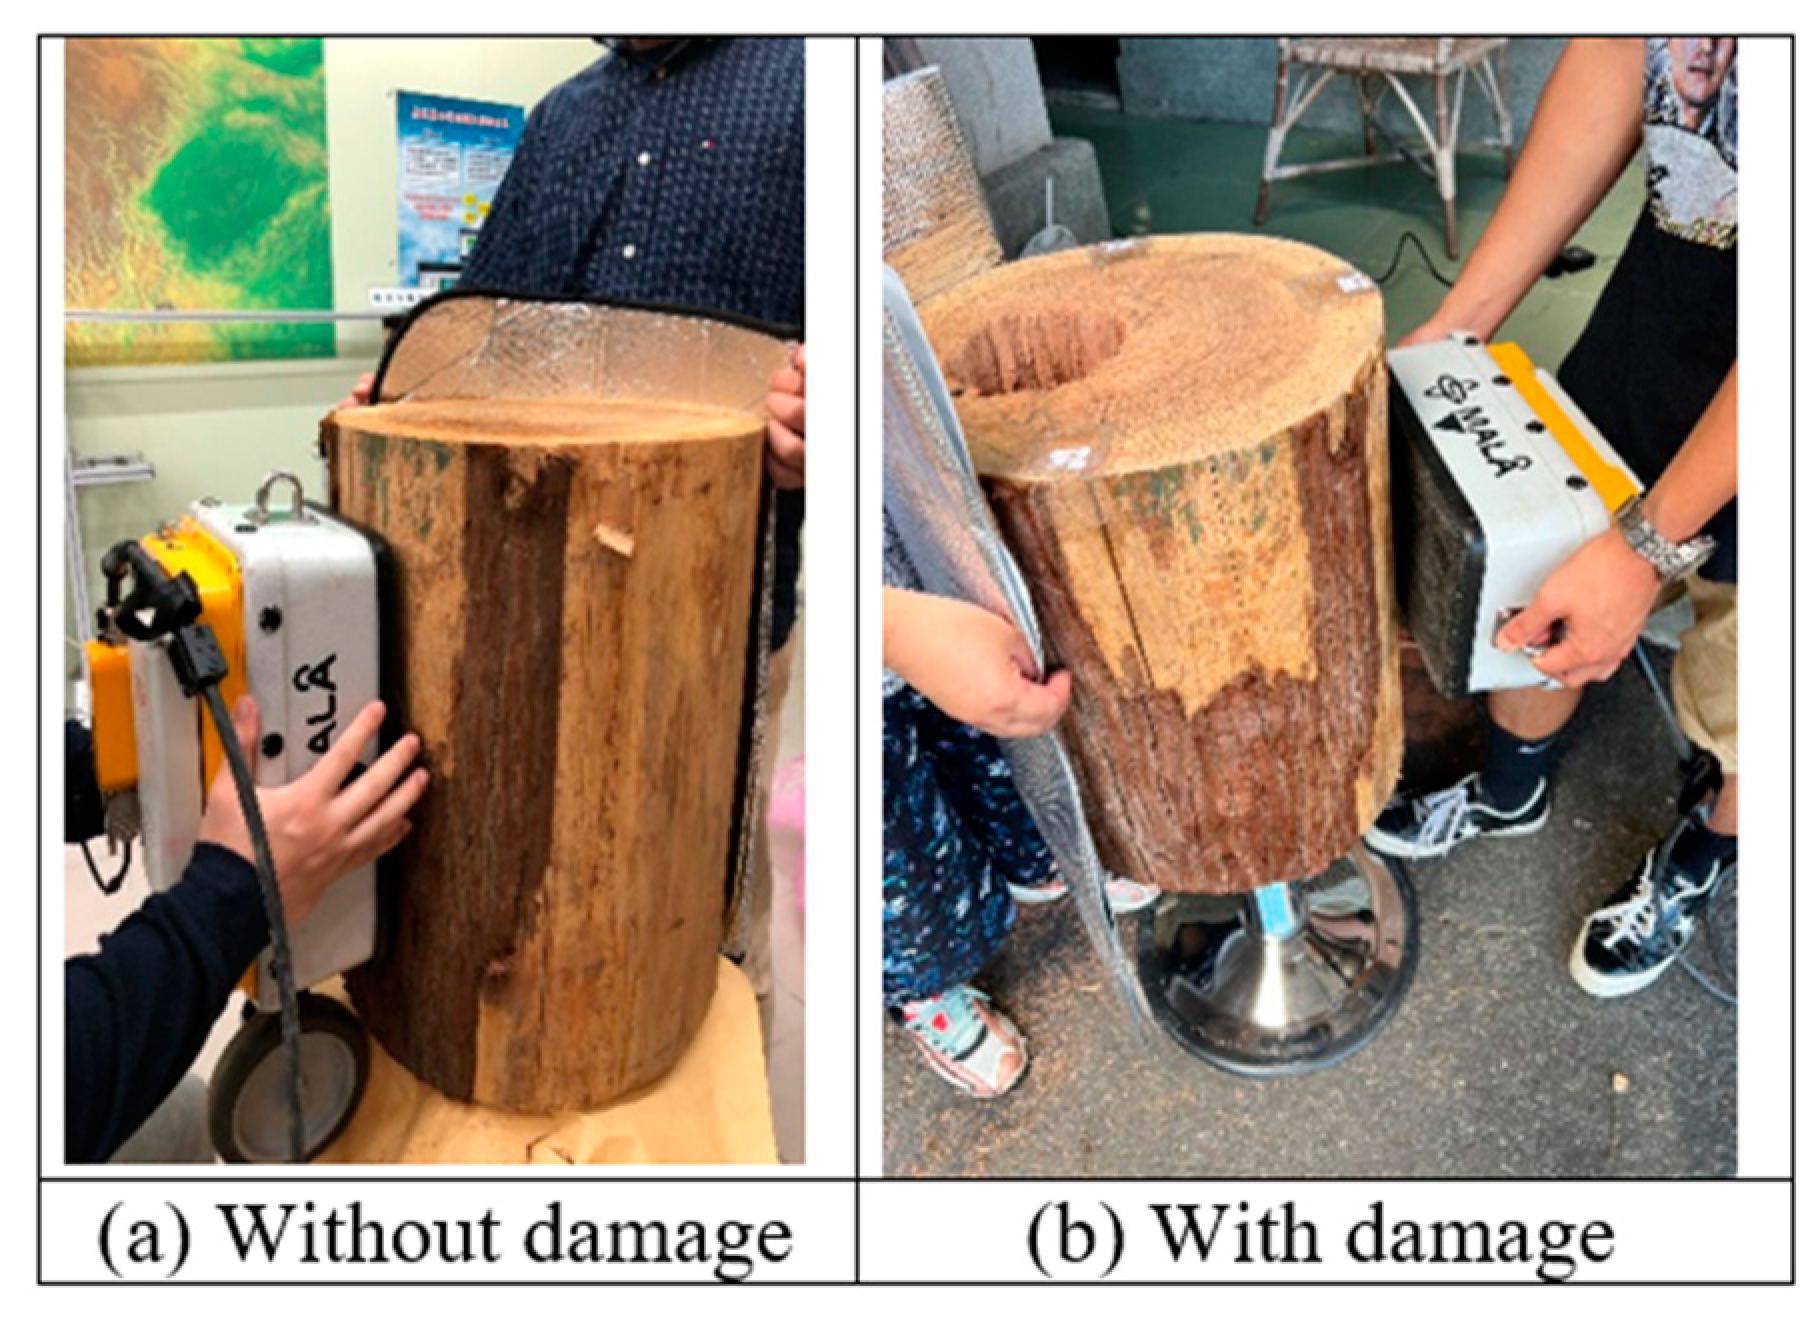
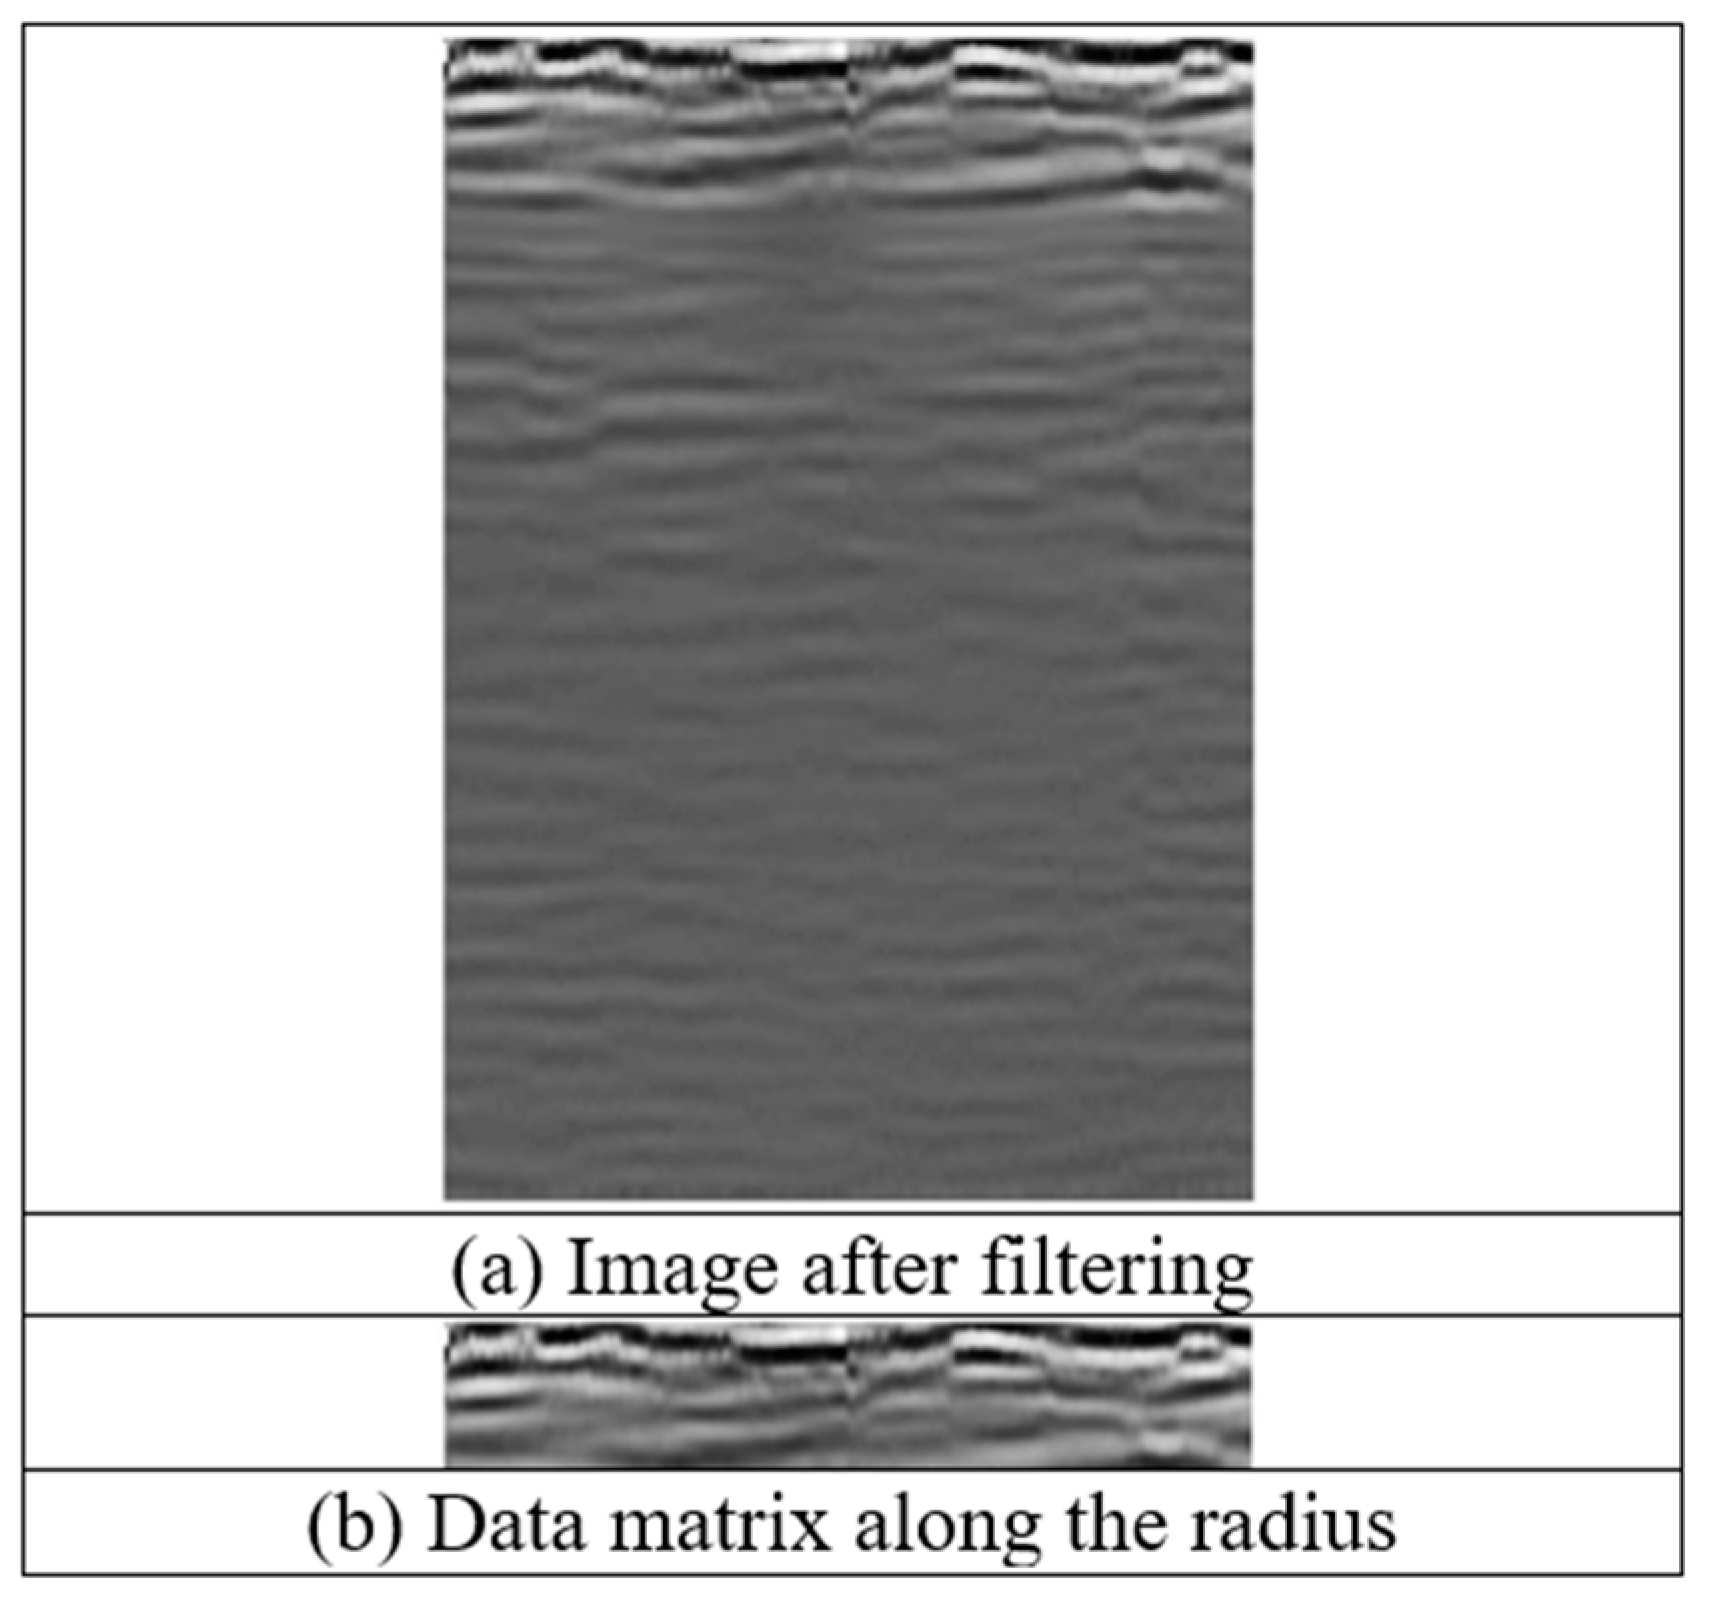
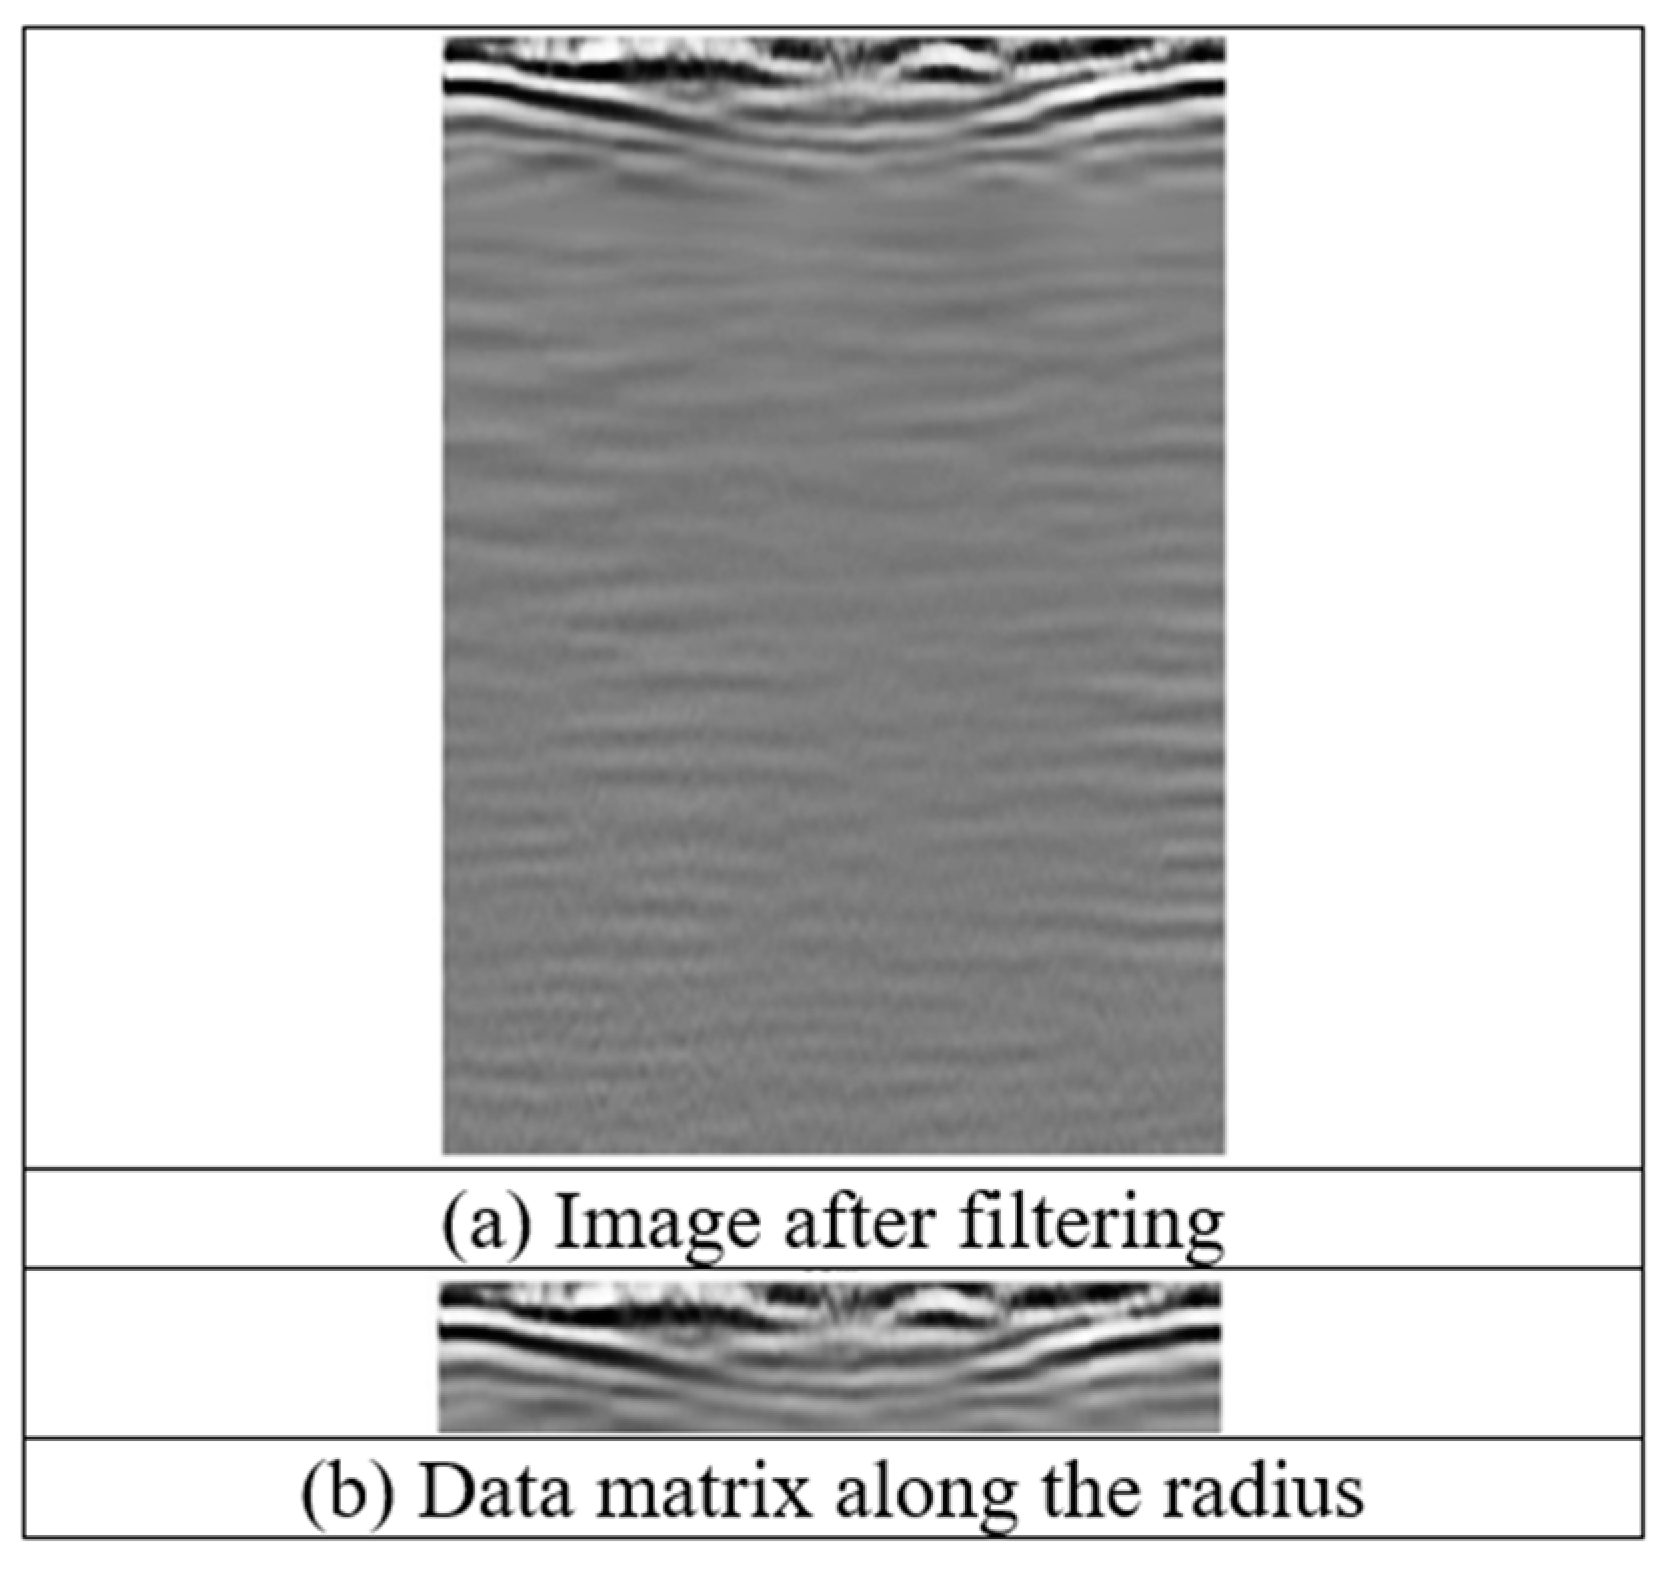
Figure 2 and
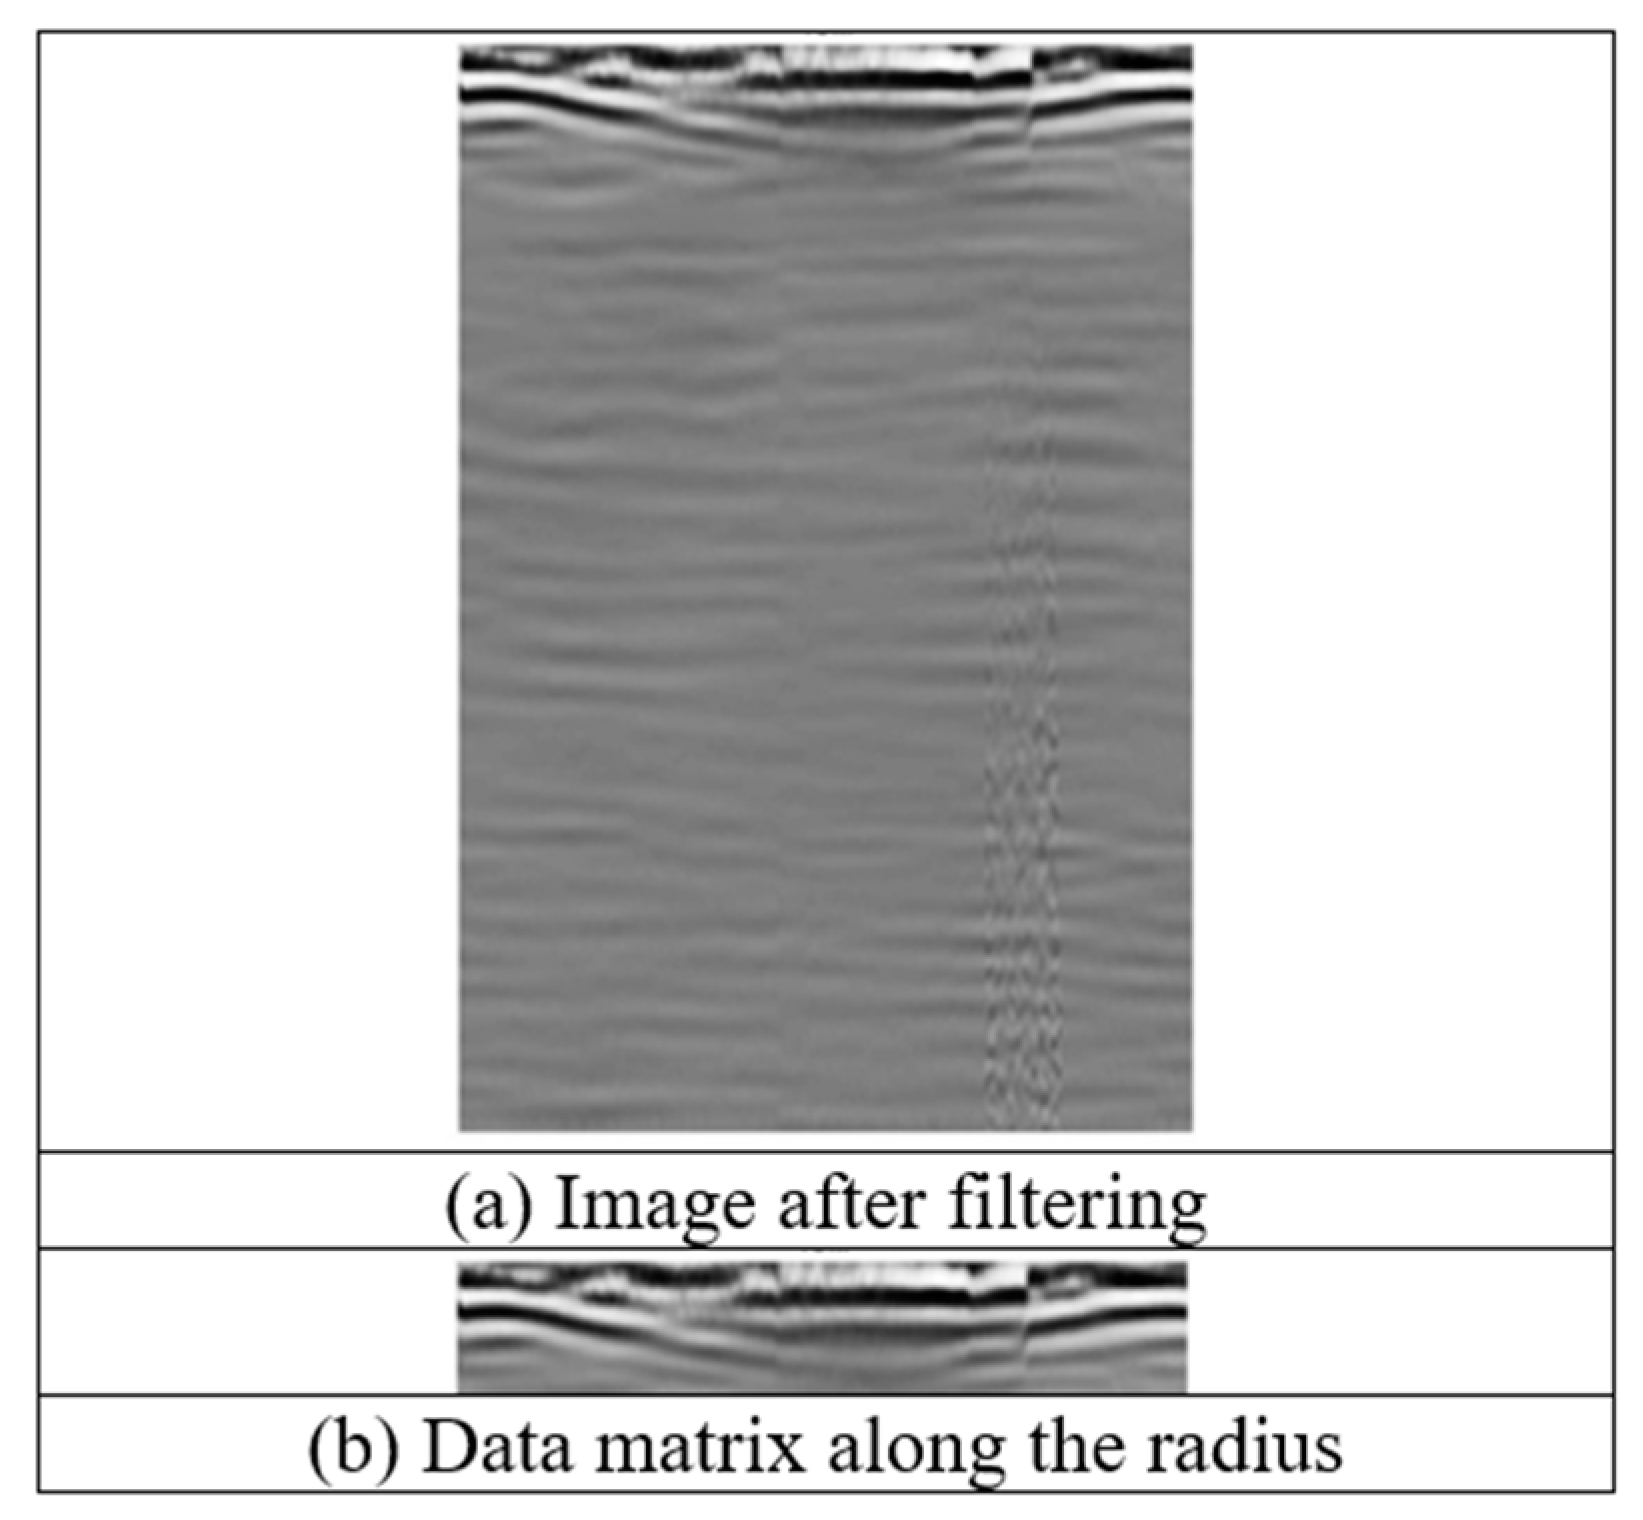
Figure 3 display the image characteristics of the hoop pine trees with and without damage, respectively.
2.2. Transformation of Image Coordinates into Polar Coordinates
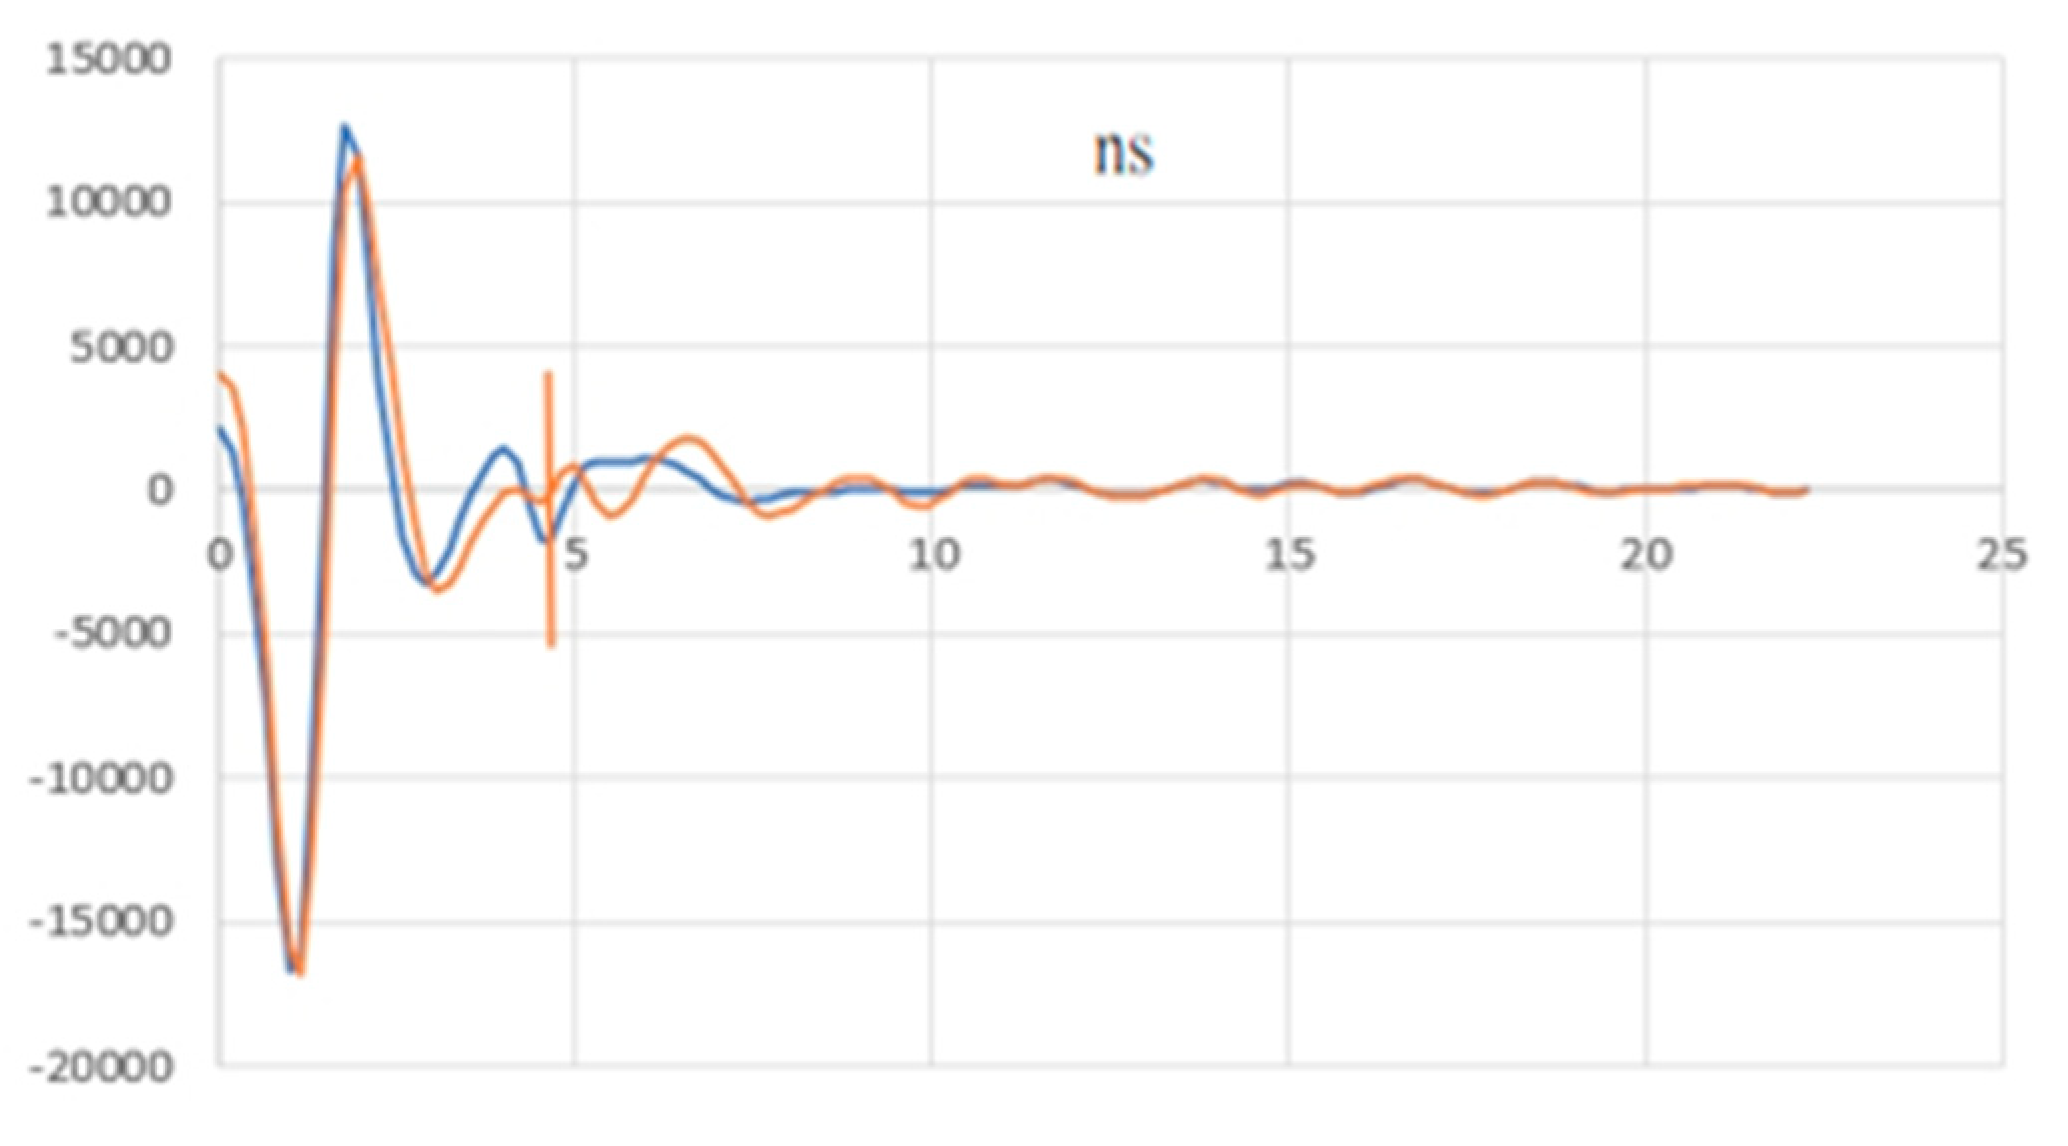
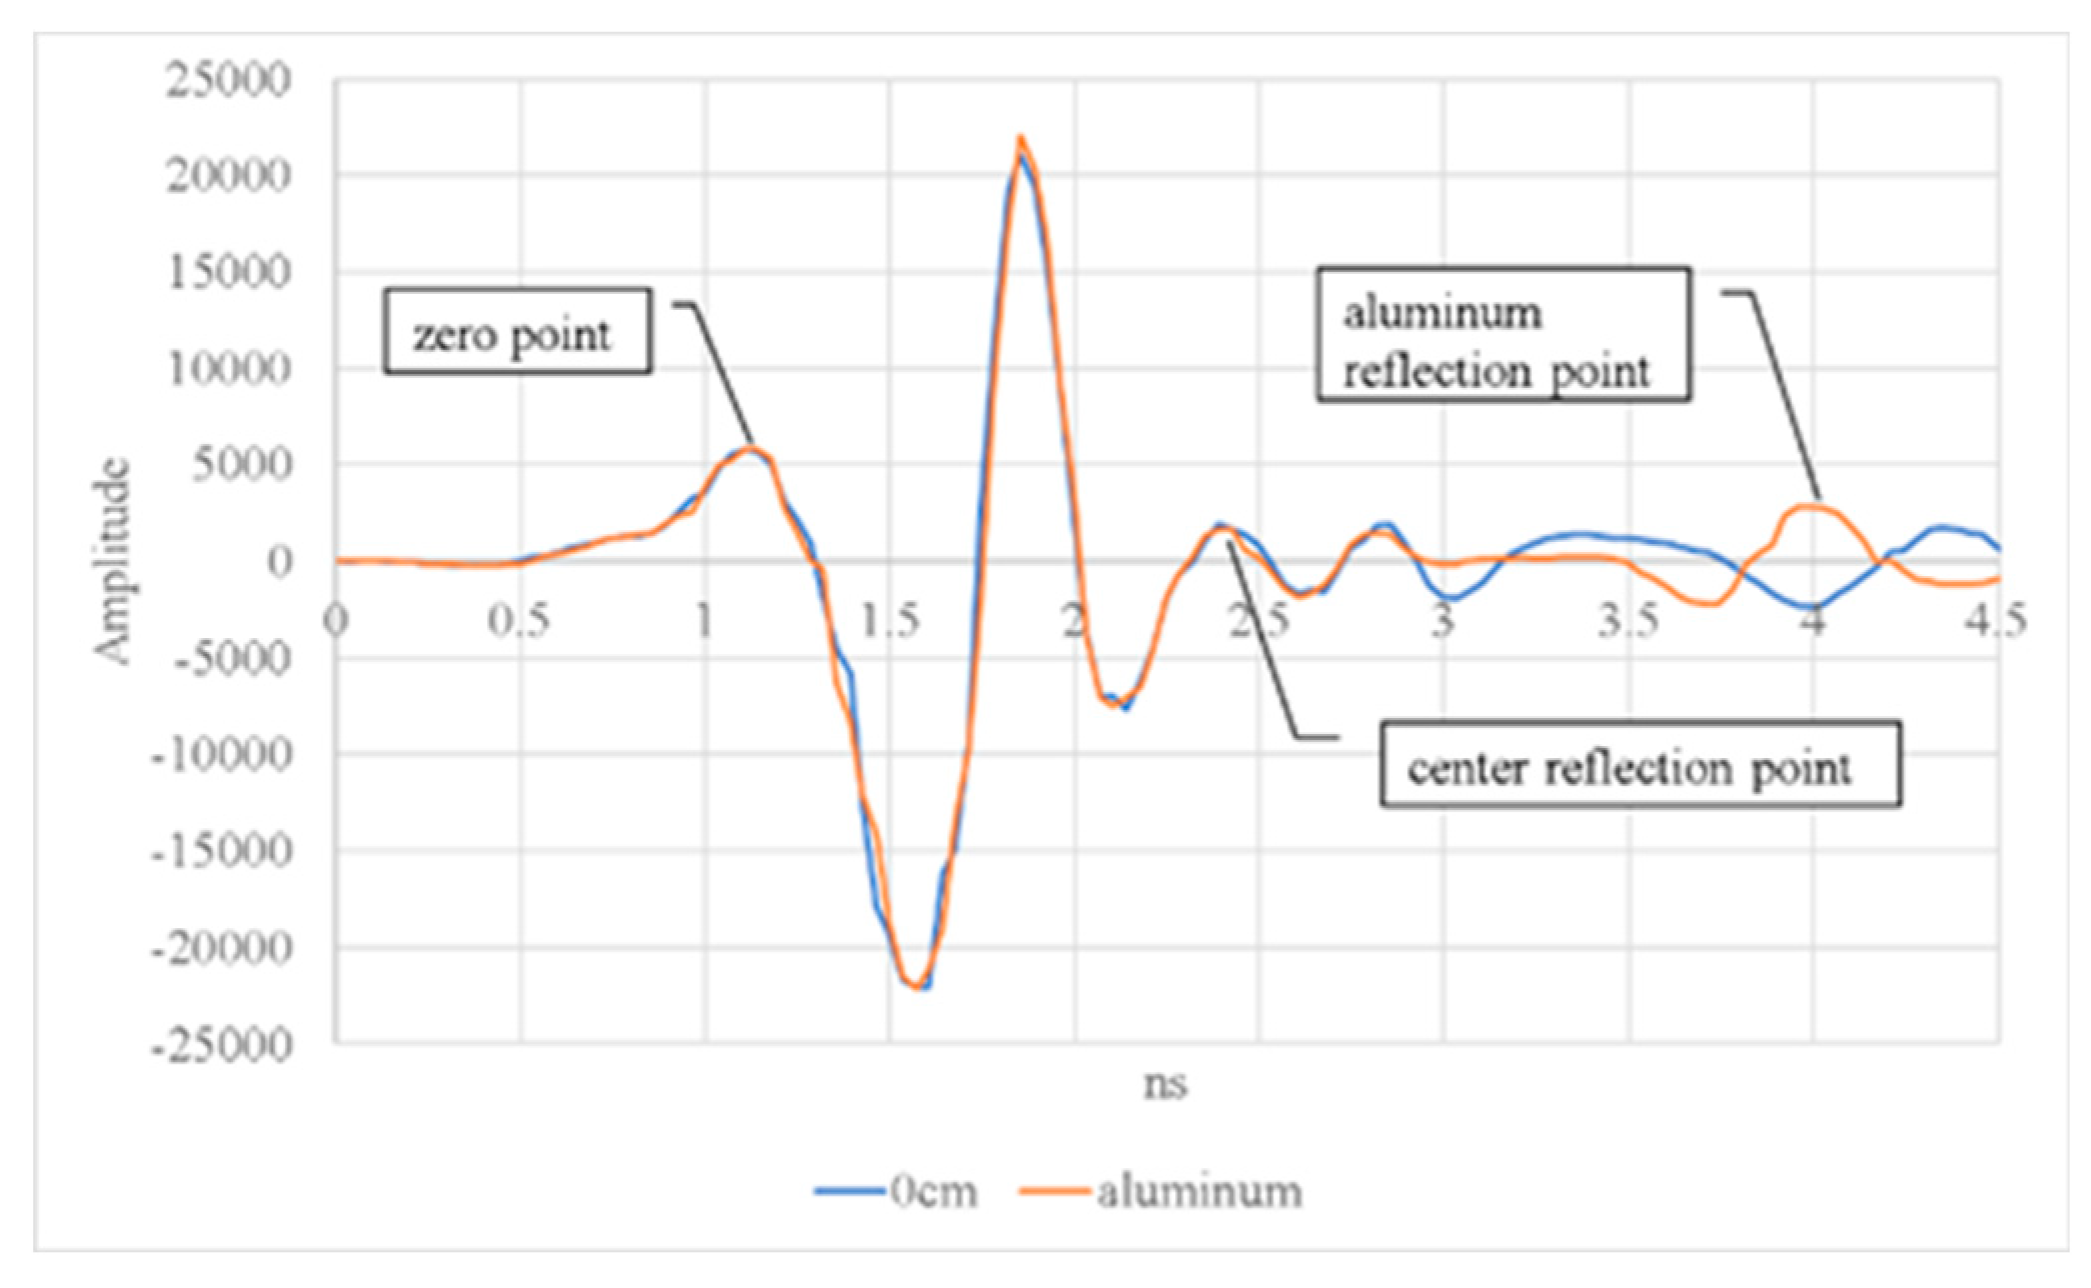
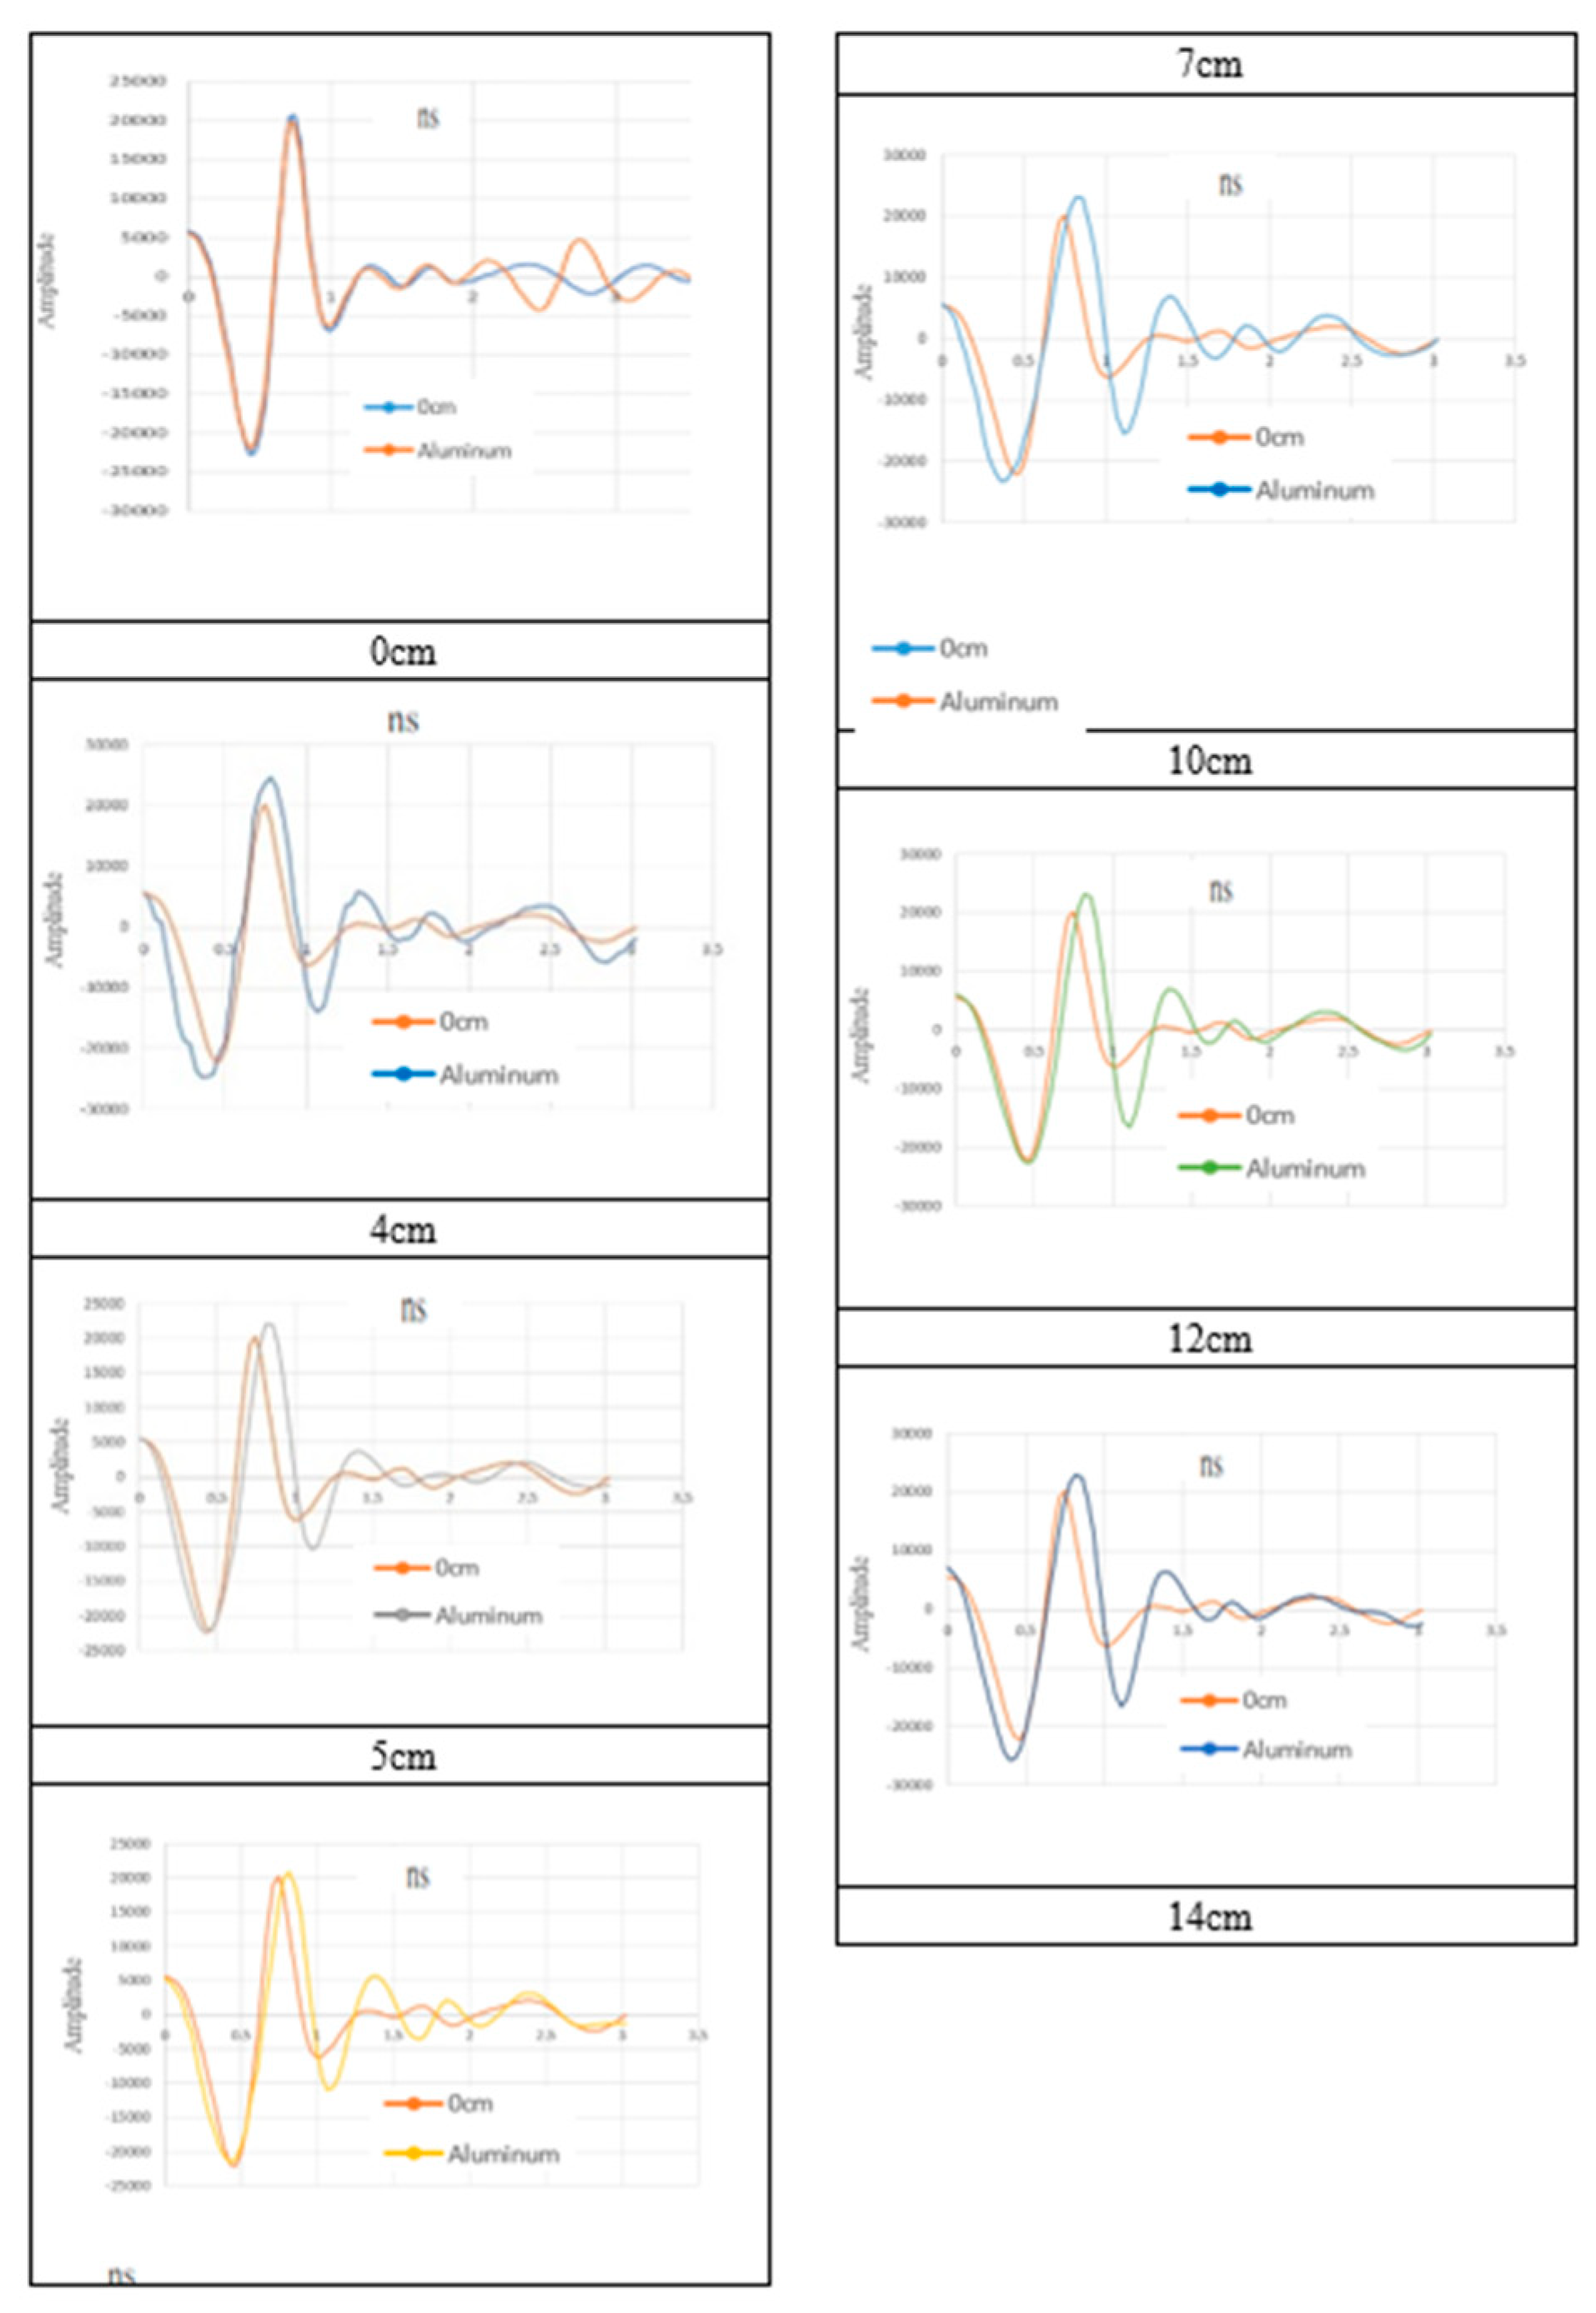
The reflection signals recorded with and without an aluminum sheet positioned at the reflection point were compared. This comparison enabled the incidence and reflection points in the GPR reflection signals to be located and the two-way signal travel time to be identified. The results revealed that in the timber without damage, the two-way signal travel time was 2.853 ns, the velocity of the electromagnetic waves was 0.1367 m/ns, and the dielectric constant was 4.8, as displayed in
Figure 4, in which 0 cm indicates the reflection signals for the timber without damage. The reflection signals obtained with an aluminum sheet are presented in orange in
Figure 4.
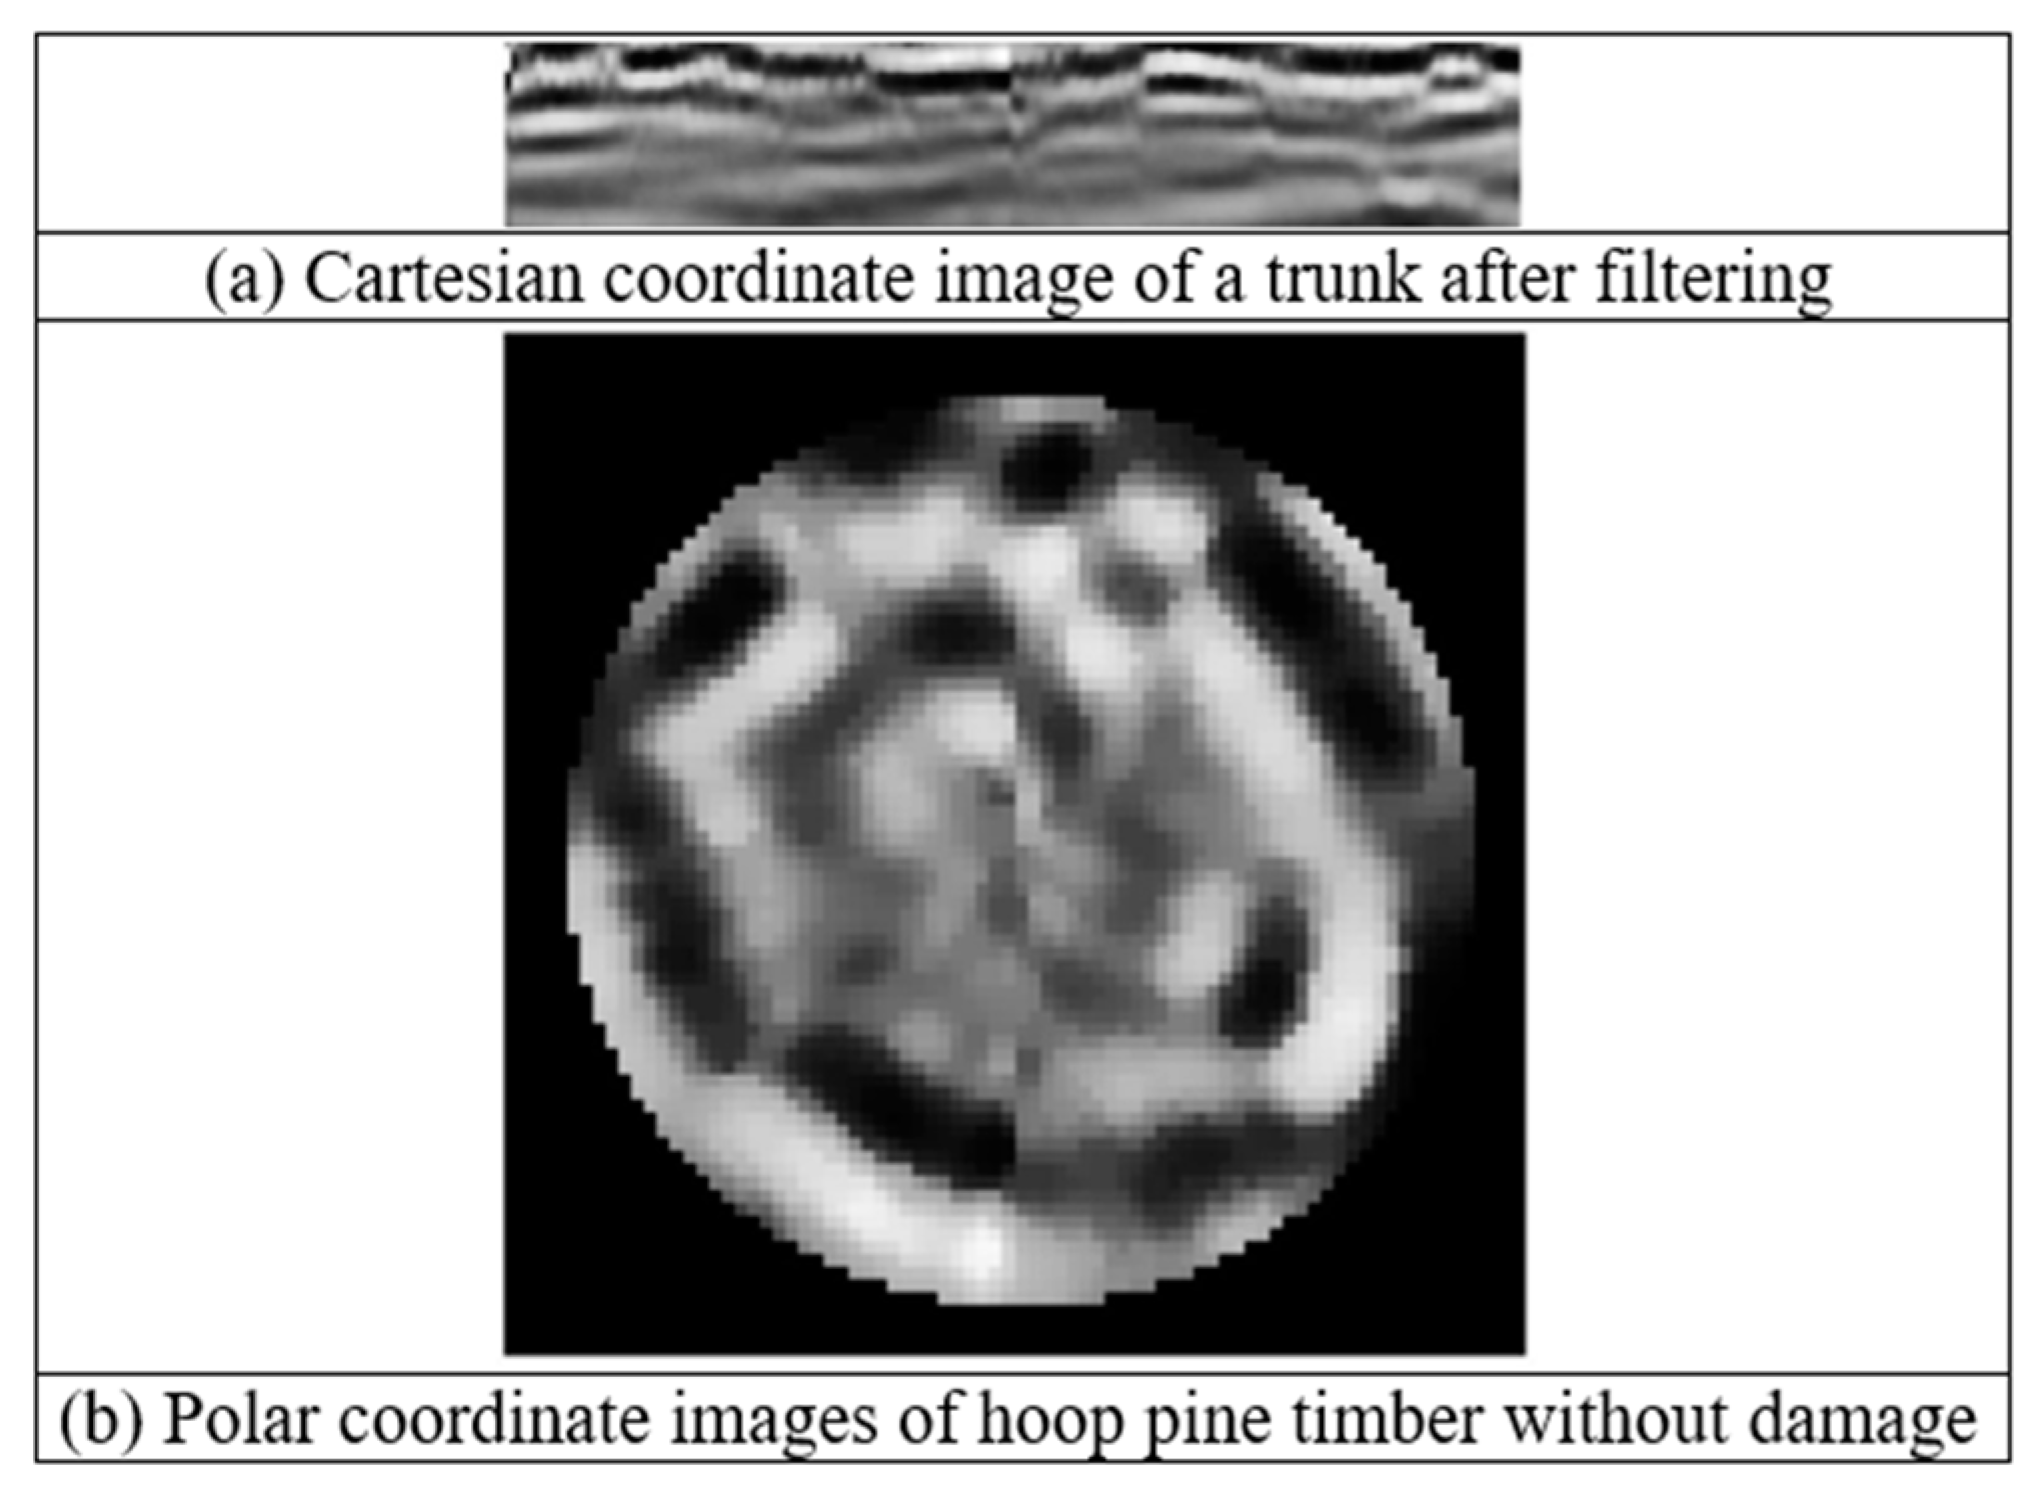
The coordinates of the obtained GPR images were transformed into polar coordinates by using MATLAB. The GPR-detected total length (i.e., the circumference) was divided into 360 equal parts to establish a polar coordinate system that could facilitate the determination and analysis of the image characteristics of the reflection curves. A data matrix representing the half travel time of the trunk radius (i.e. the center) was extracted, subjected to filtering, and imported into MATLAB, where the Cartesian coordinates were converted to polar coordinates (
Figure 5). This conversion enabled the analysis of the differences between the image characteristics and area ratios of holes with varying diameters.
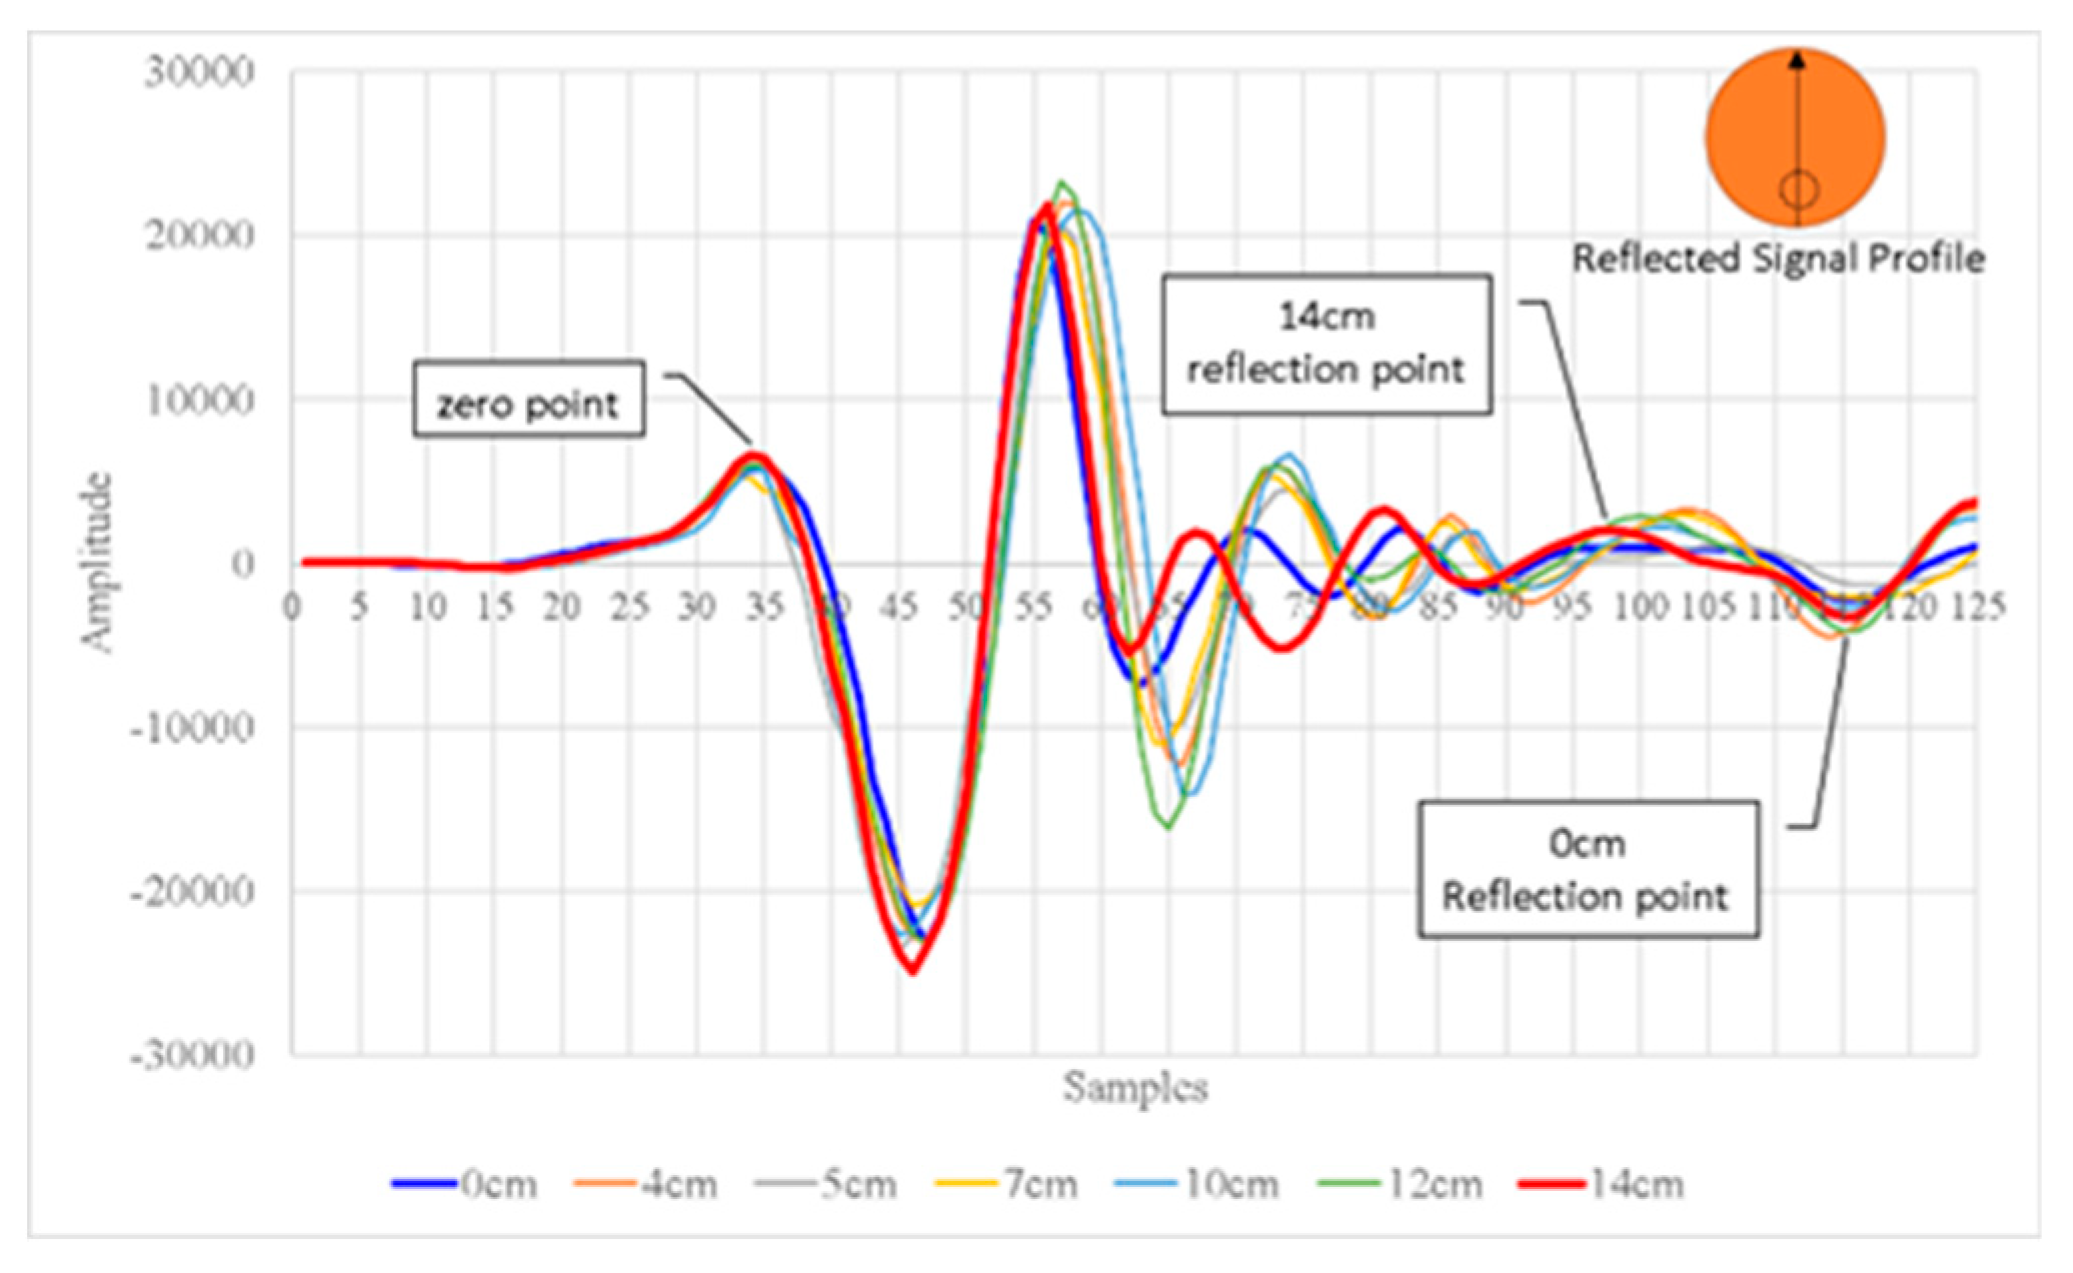
The incidence and reflection signals extracted from the GPR profiles of holes with various diameters (i.e., 0, 4, 5, 7, 10, 12, and 14 cm) revealed that as the hole diameter increased, the reflection time decreased (i.e., the velocity of the electromagnetic waves increased) (
Figure 6).
2.3. Ranking of the Trunk Risk Level and Calculation of the Hole Area Ratio
The holes in the polar coordinate images were characterized by clear reflection curves, and the changes in each reflection curve represented the circumference of the damage. The trunks were ranked according to their risk levels, which were determined on the basis of their
t/
R values and hole area ratios, as presented in
Table 1. In
Table 1,
t is the minimum normal wall thickness of the cross-section of a trunk, and
R is the radius of the trunk. The hole area ratio was calculated as follows:
3. Experimental Planning
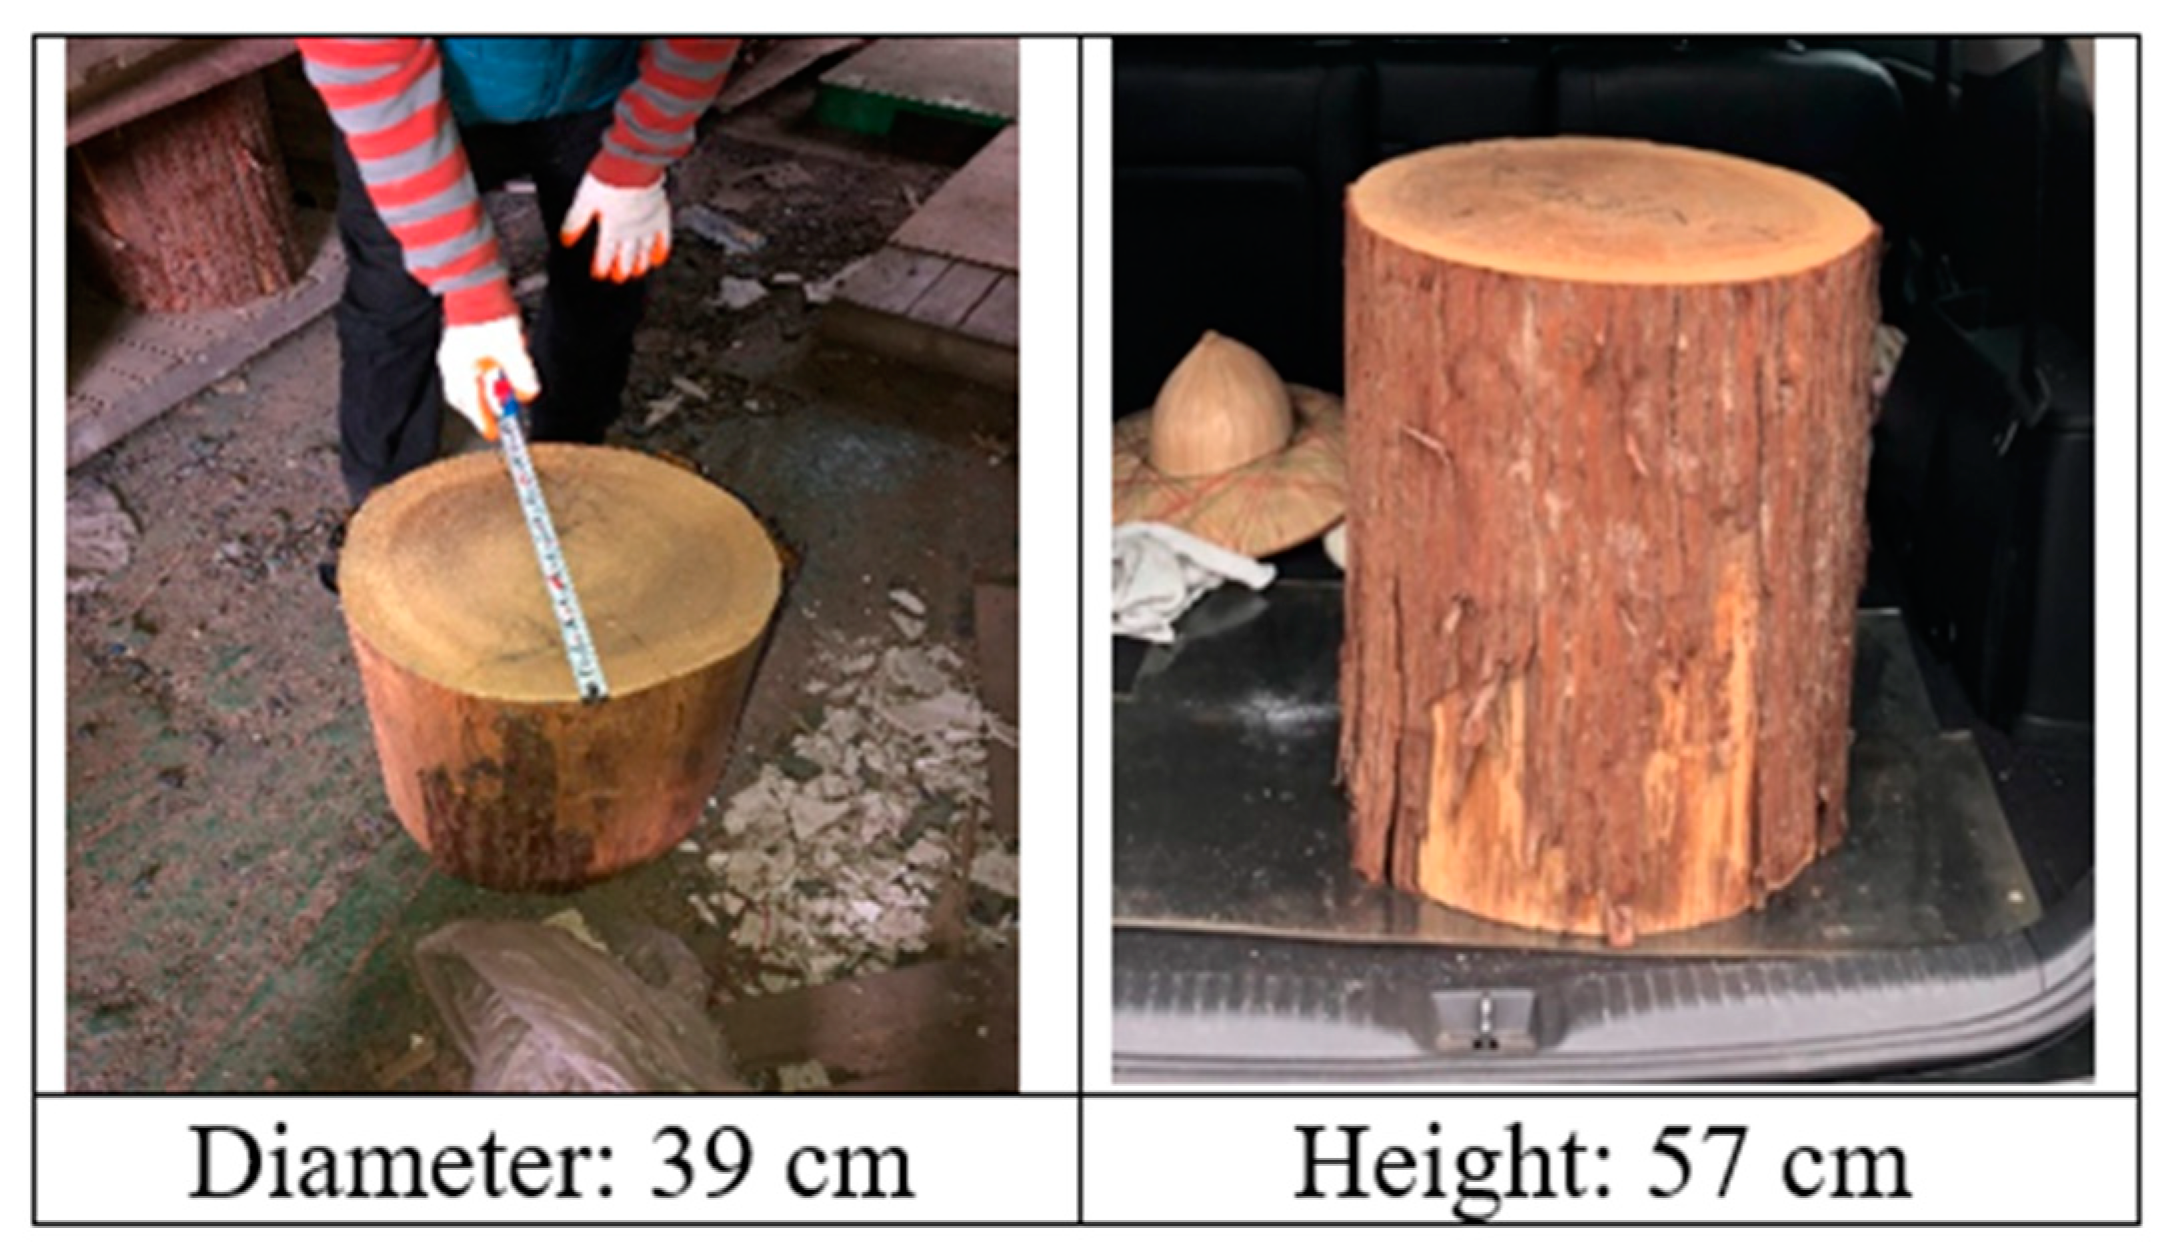
Hoop pine trees in Taiwan generally have diameters between 50 and 100 cm. Whether these trees can be treated or must be cut down is assessed on the basis of data regarding their risk level. In the present study, experiments were conducted on dry hoop pine timber by using the Mala CX system and an 800-MHz antenna (
Figure 7).
As displayed in
Figure 8, a hoop pine timber specimen was fixed on a rotating plate, and the central axis of the trunk was fixed at an angle of 90° to the GPR antenna. Holes of varying size were inspected and measured by turning the rotation plate. Holes with diameters of 4, 5, 7, 10, 12, and 14 cm were drilled below the center. GPR data were obtained for each hole through the following steps:
Fix a piece of timber to a rotating plate.
Attach an 800-MHz antenna.
Measure the size of each hole by turning the rotating plate.
Repeat steps (1)–(3).
Reflection signals were obtained for holes with various diameters in hoop pine timber with and without damage.
4. Results
4.1. Analysis of the Characteristics of Damage in Hoop Pine Timber
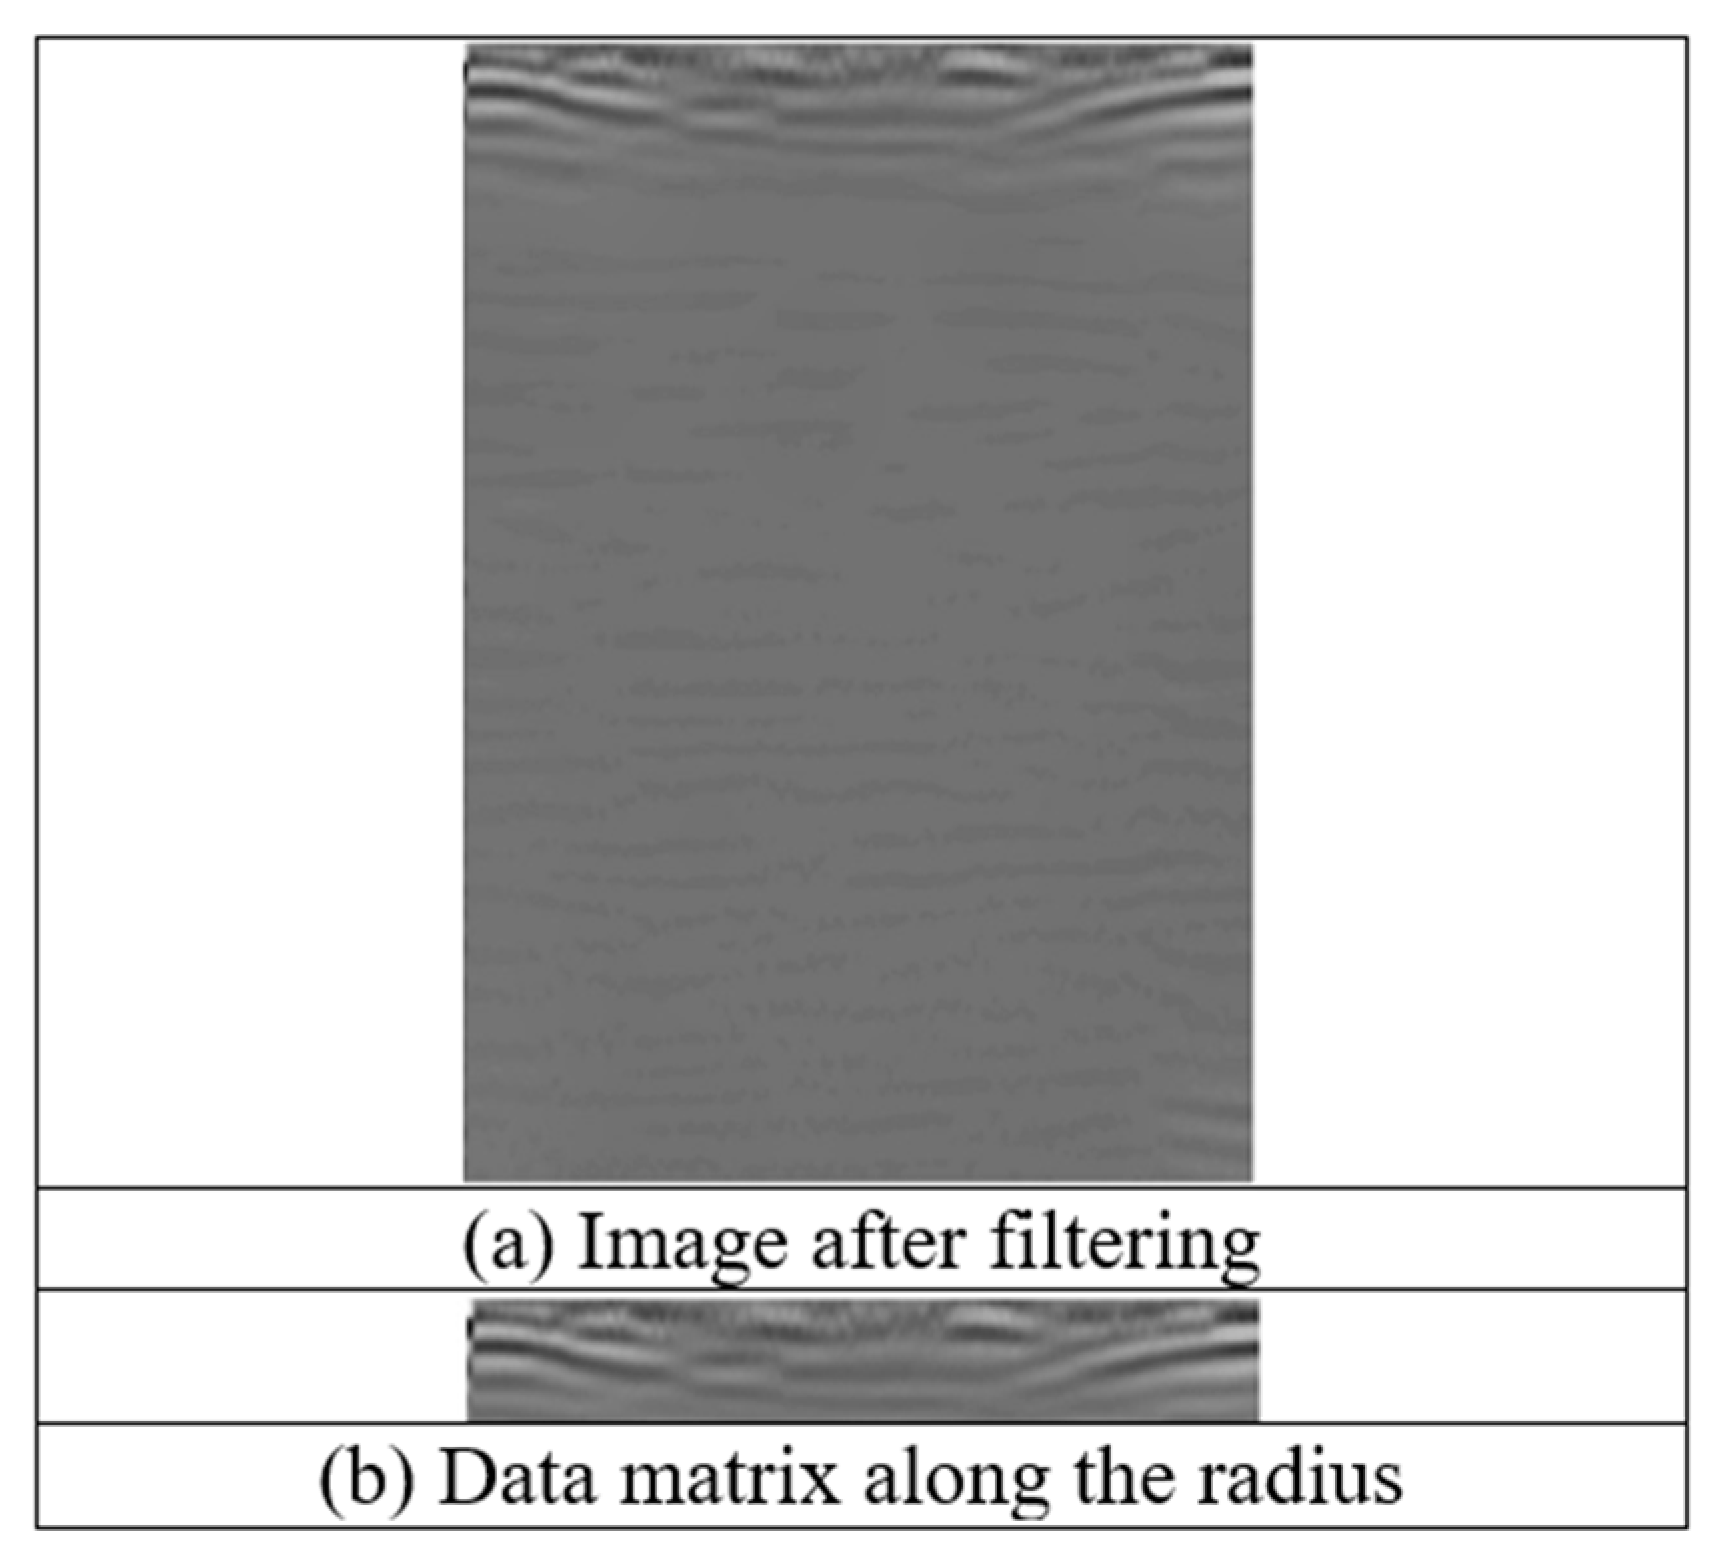
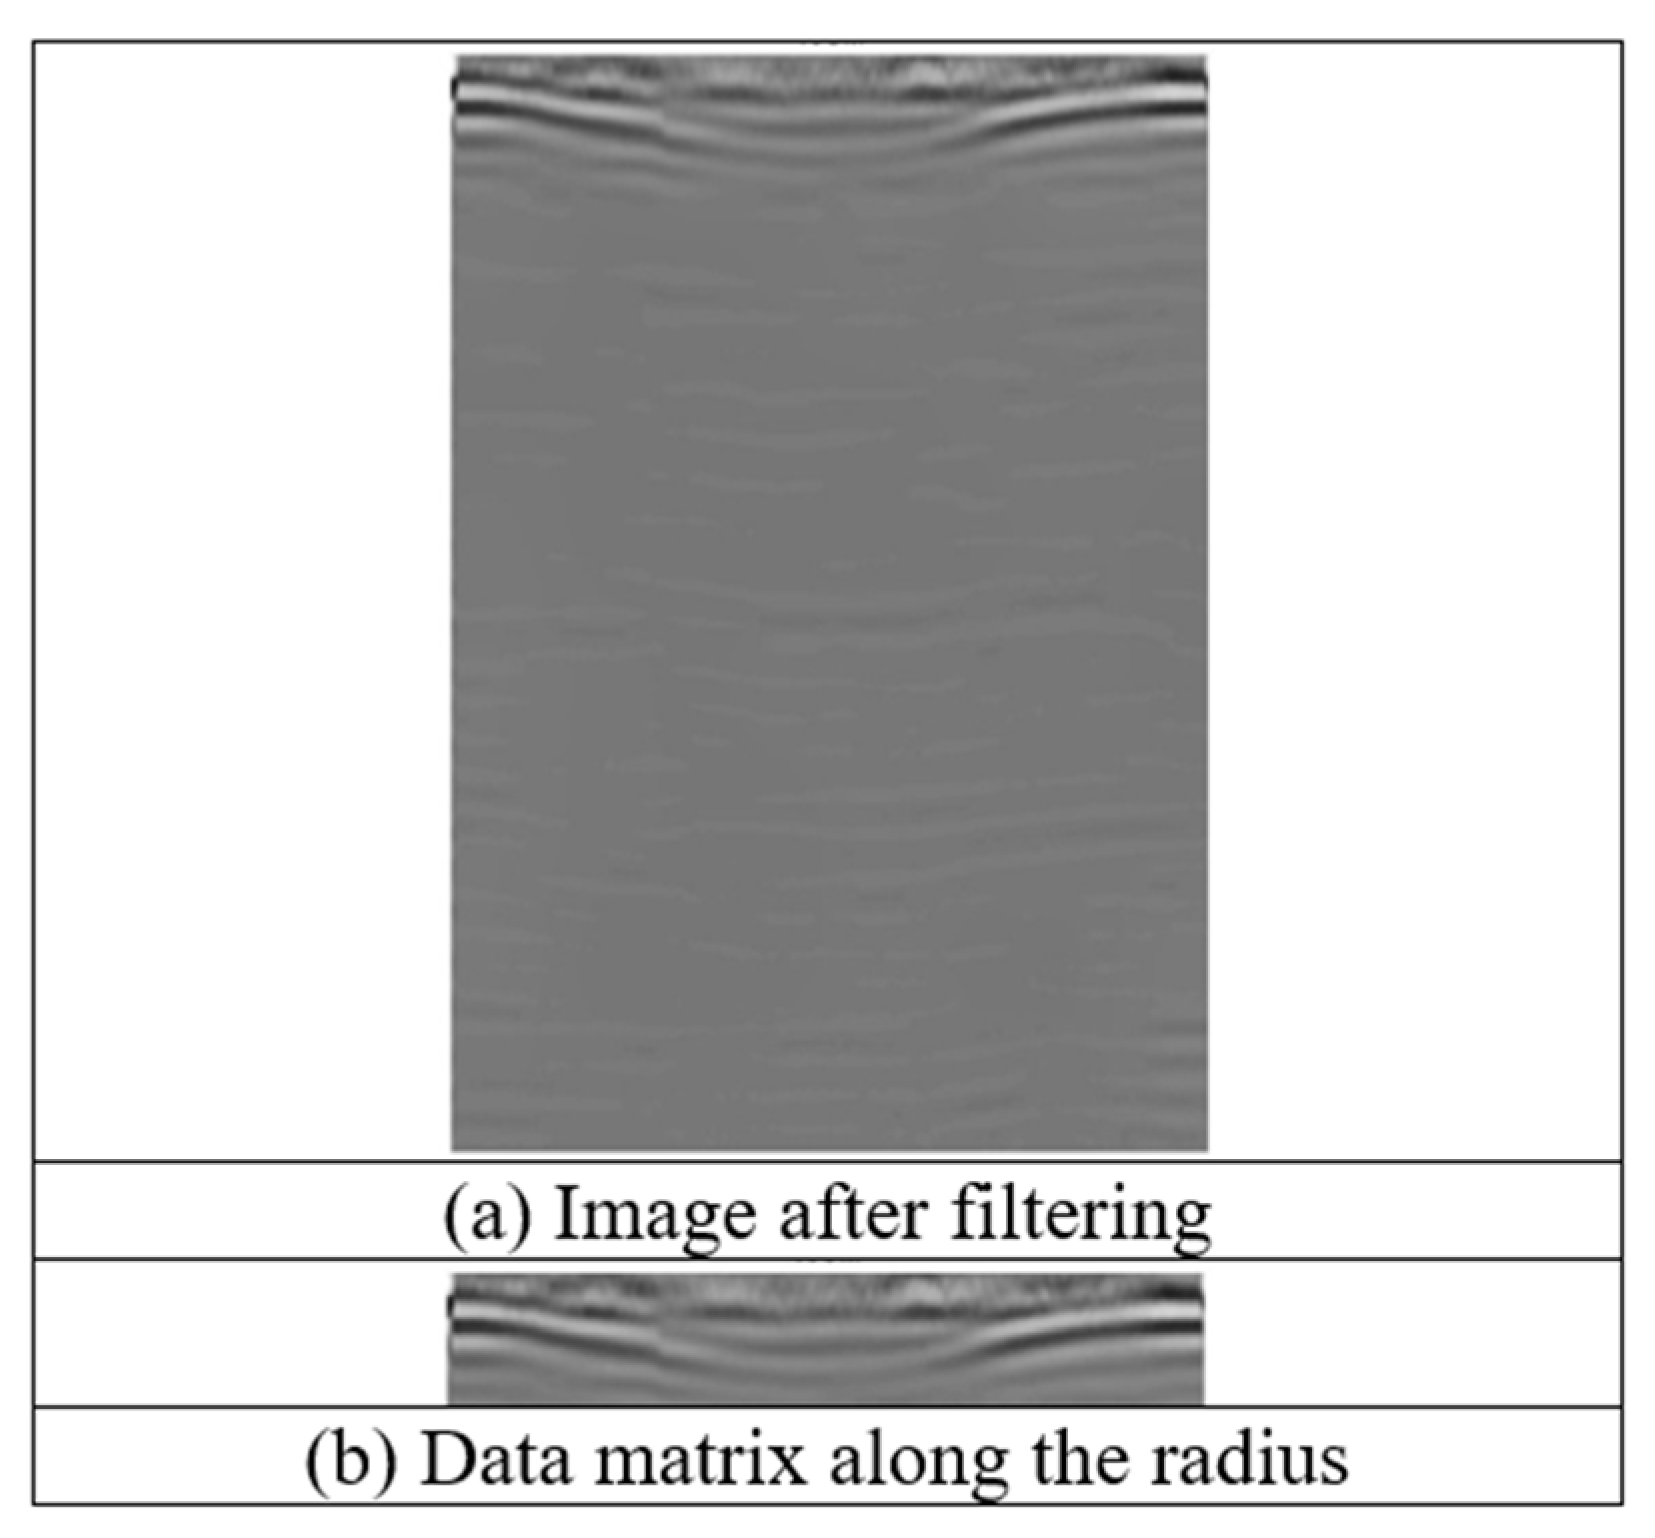
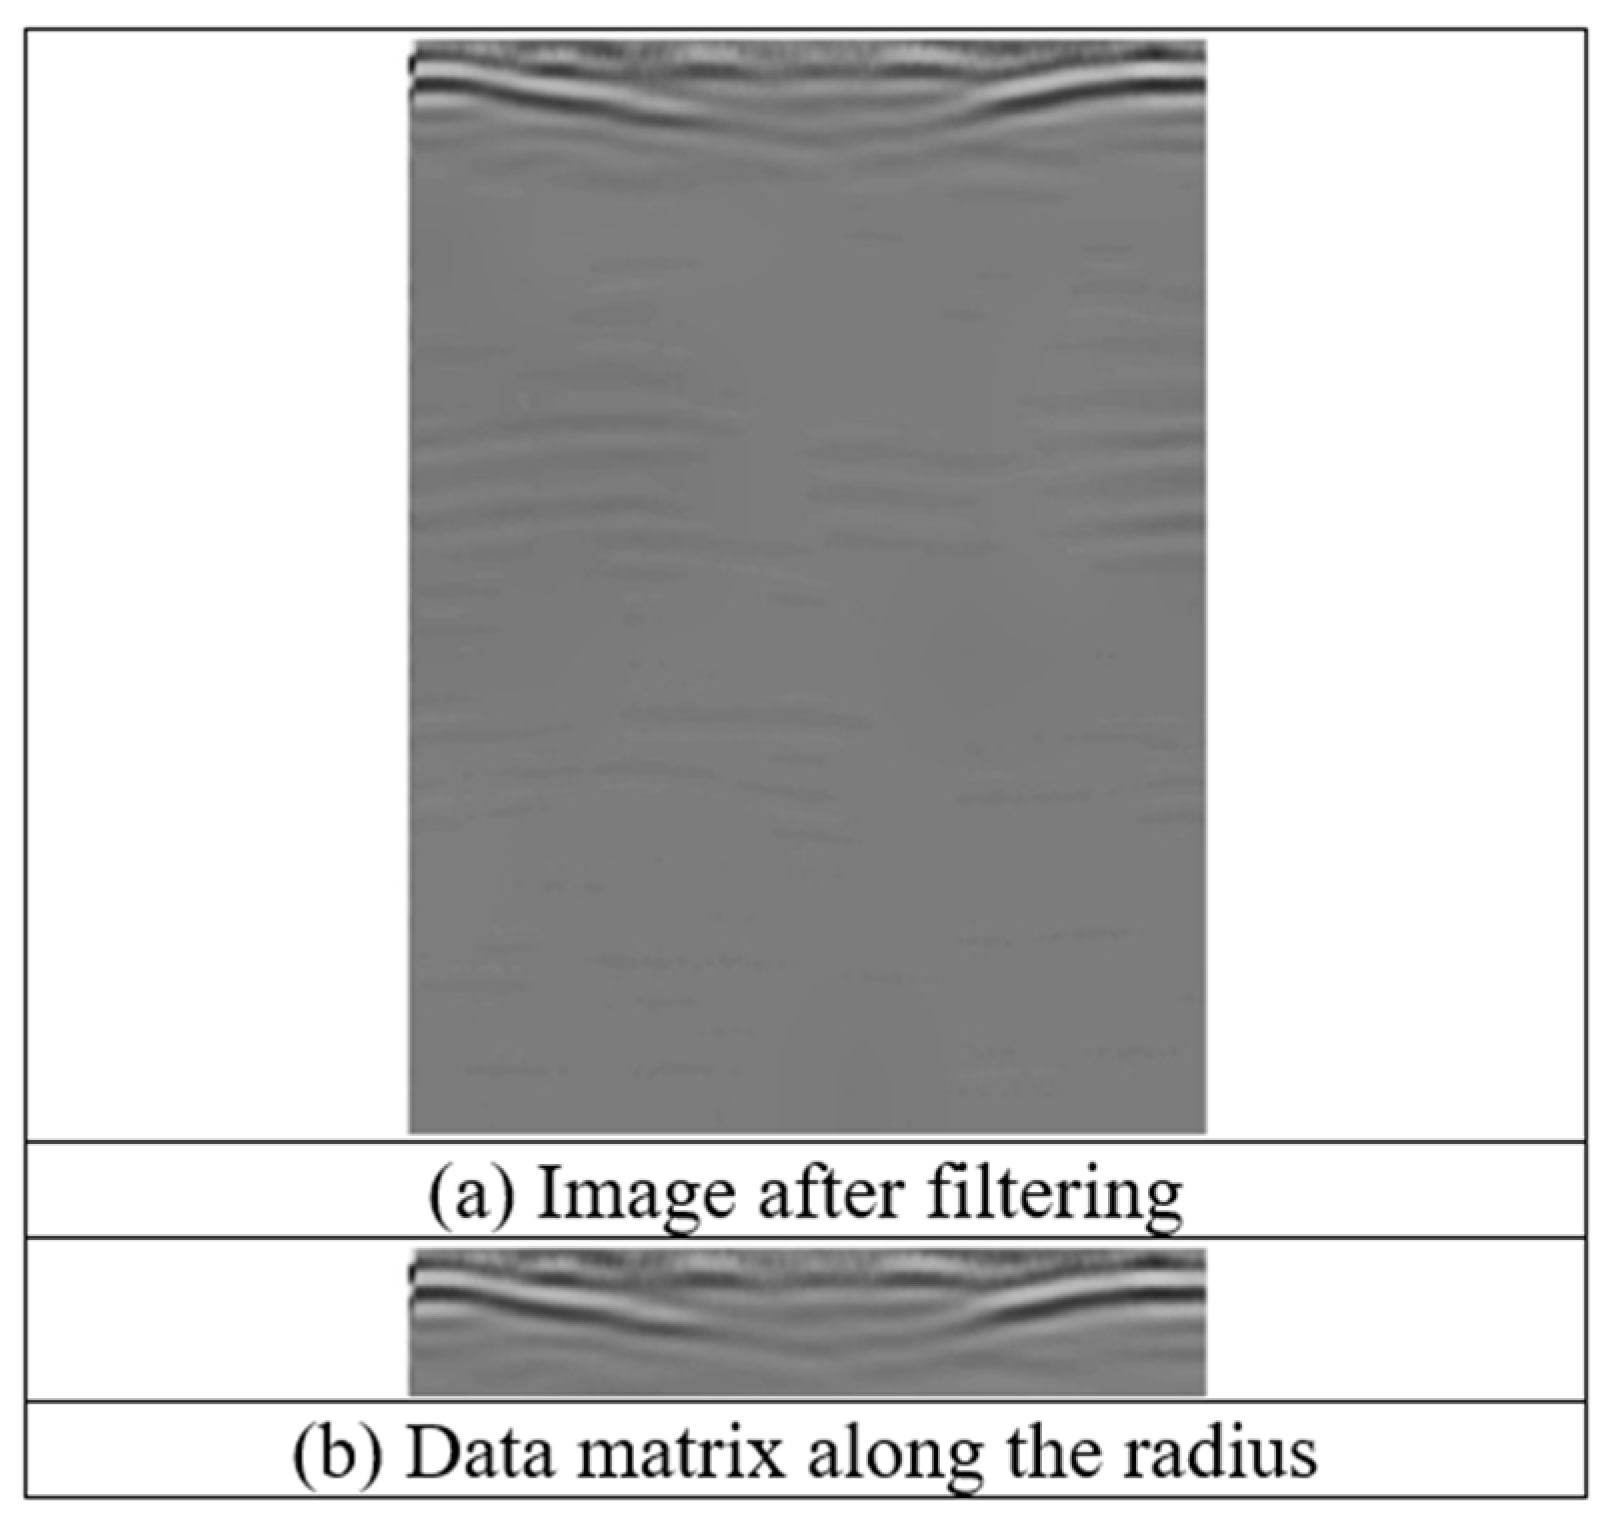
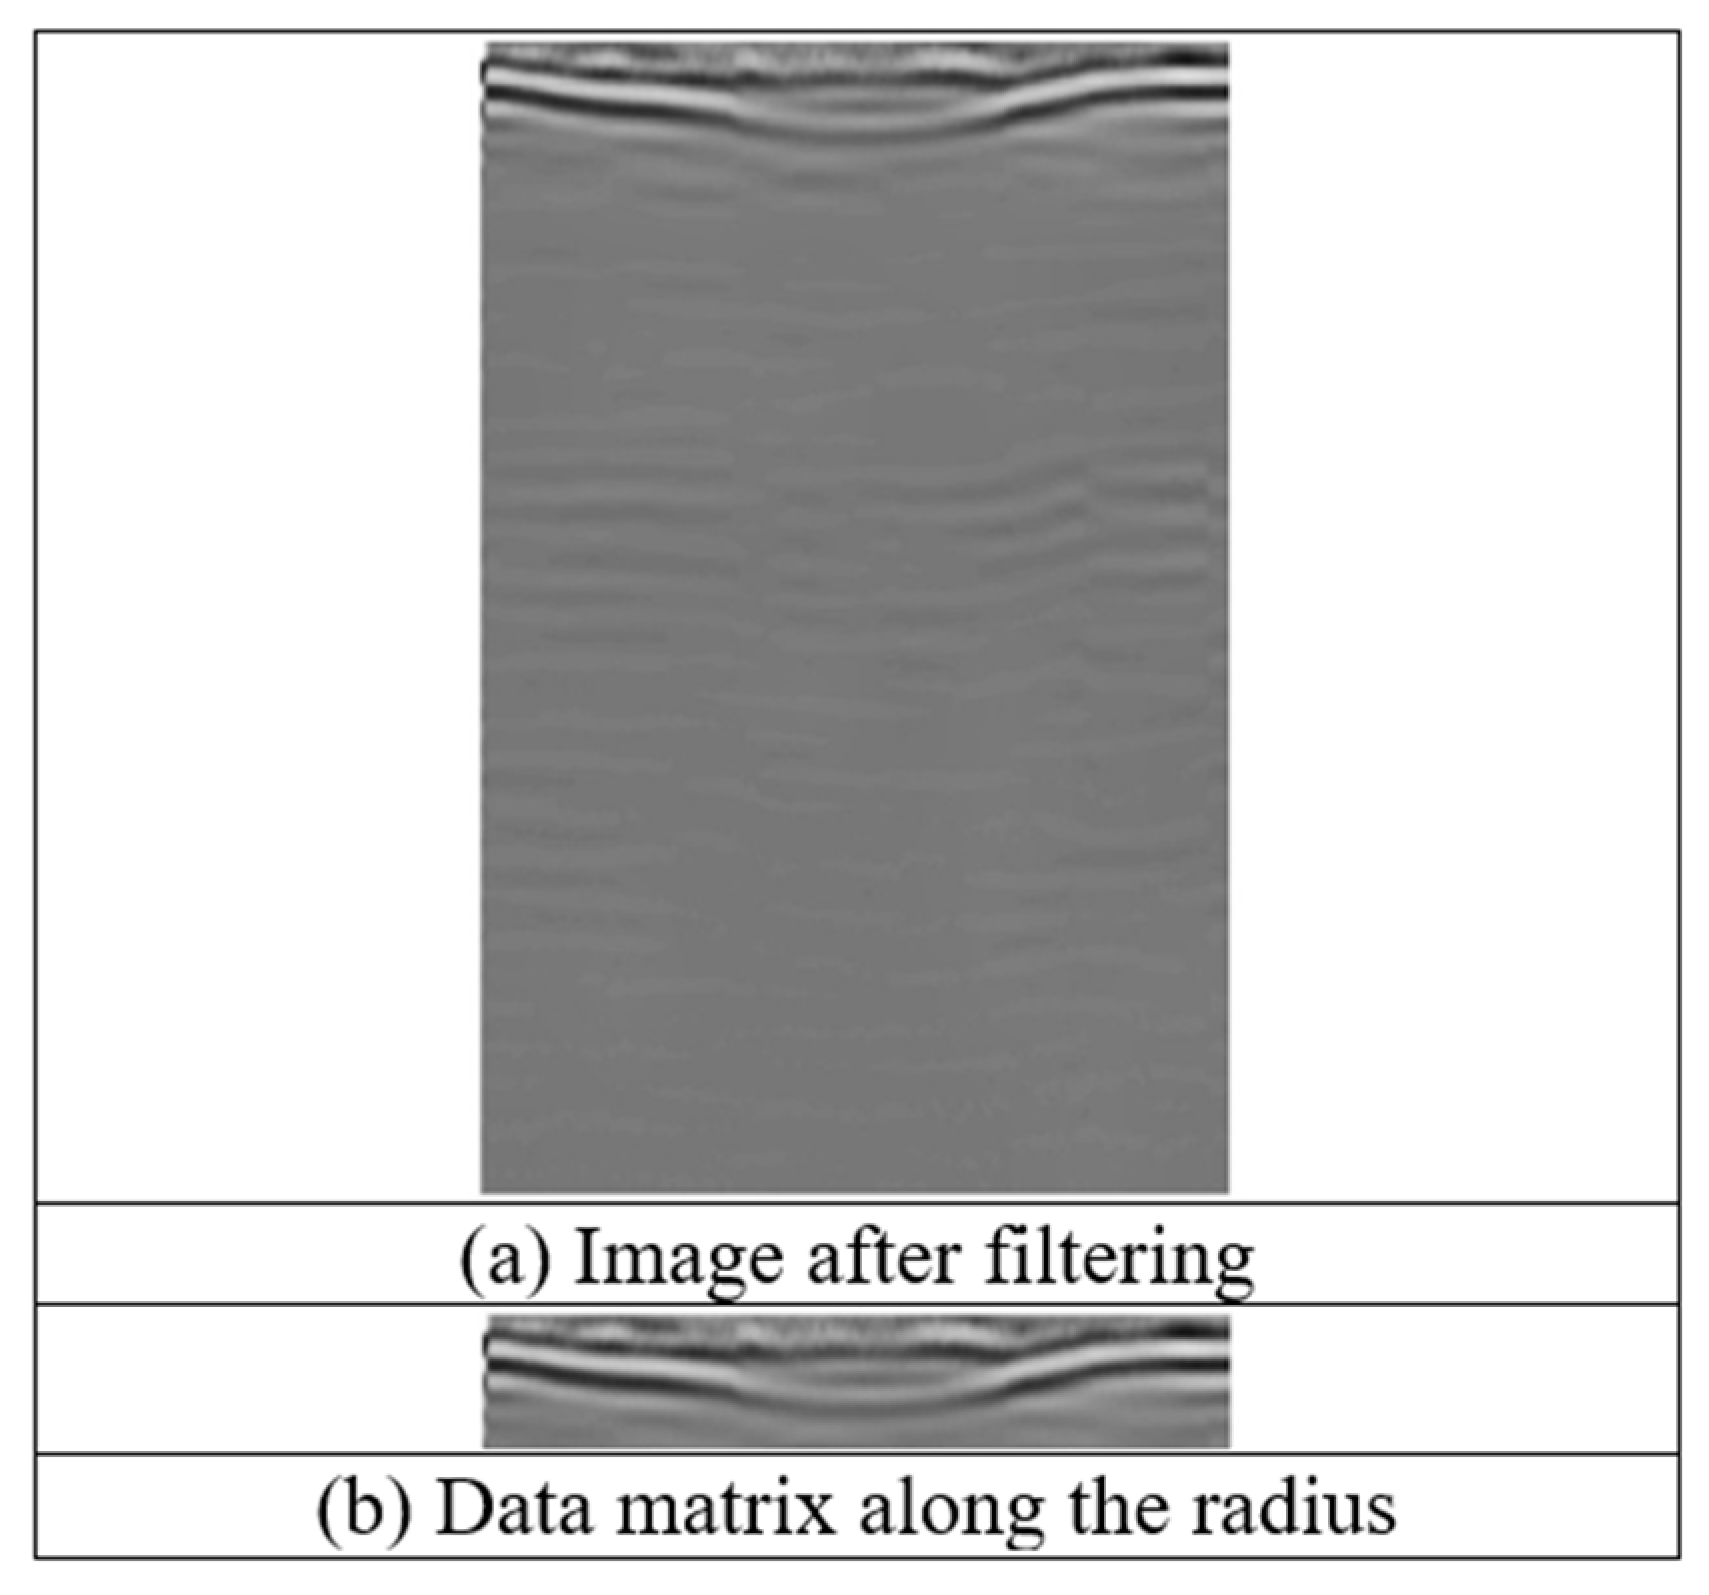
After the filtering process was completed and the radius data were transformed into polar coordinates, the image characteristics of the reflection curves of hoop pine timber with and without holes with diameters of 0, 4, 5, 7, 10, 12, and 14 cm were determined (
Figure 9,
Figure 10,
Figure 11,
Figure 12,
Figure 13,
Figure 14 and
Figure 15).
The risk level of the trunk was determined on the basis of the hole diameter.
Table 2 lists the
t/
R values and hole area ratios for holes with diameters of 4, 5, 7, 10, 12, and 14 cm.
4.2. Quantitative Analysis of Damage in Hoop Pine Timber
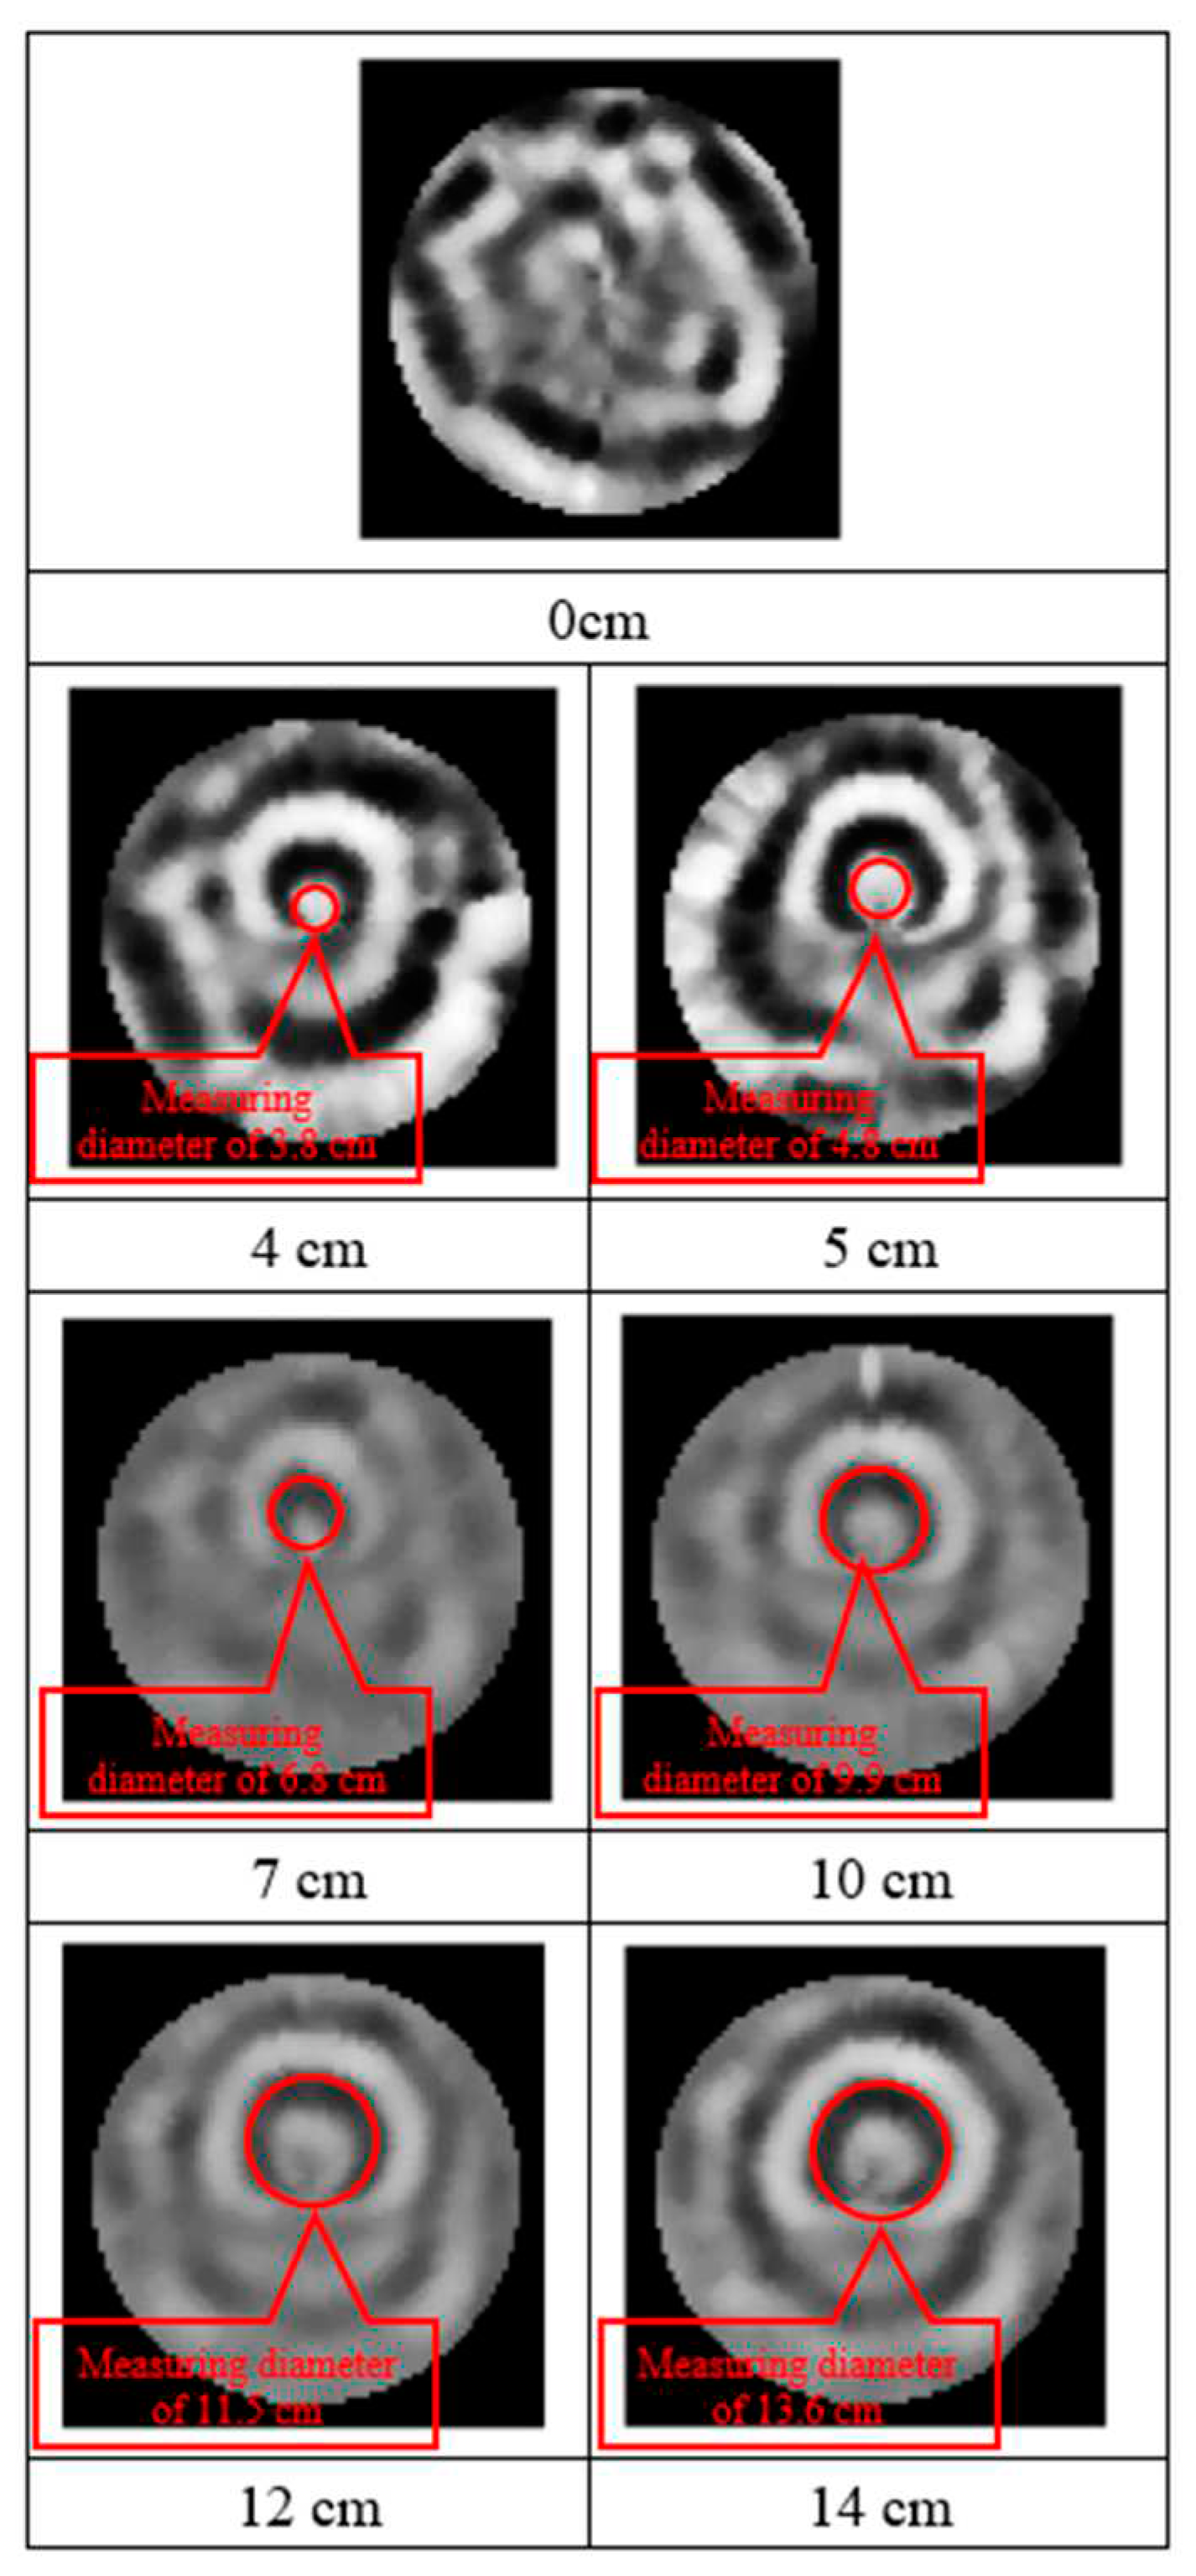
Reflection curves for multiple levels of damage were obtained from the collected GPR profiles. The Cartesian coordinates of the image profiles were converted into polar coordinates by using MATLAB to obtain images of holes with diameters of 0, 4, 5, 7, 10, 12, and 14 cm. These images are displayed in
Figure 16, in which the red circles indicate the hole locations.
The accuracy of each hole diameter displayed in the polar coordinate images in relation to the actual diameters of the drilled holes was determined on the basis of the characteristics of and changes in the reflection curves of the images. The results obtained through GPR image interpretation were compared with the actual damage to the timber, and these comparisons revealed that the error rate ranged from 2.1% to 5.9% (
Table 3), with the average error rate being ≤4%.
4.3. Wave Velocity Analysis for Hoop Pine Timber
The wave velocity was calculated by dividing the trunk diameter by the radar signal’s travel time within the trunk (
Figure 17). The signal travel time was determined on the basis of the difference between signals obtained with and without an aluminum sheet. The signal travel time revealed the time that the signal exited the timber.
4.4. Analysis of Hoop Pine Timber
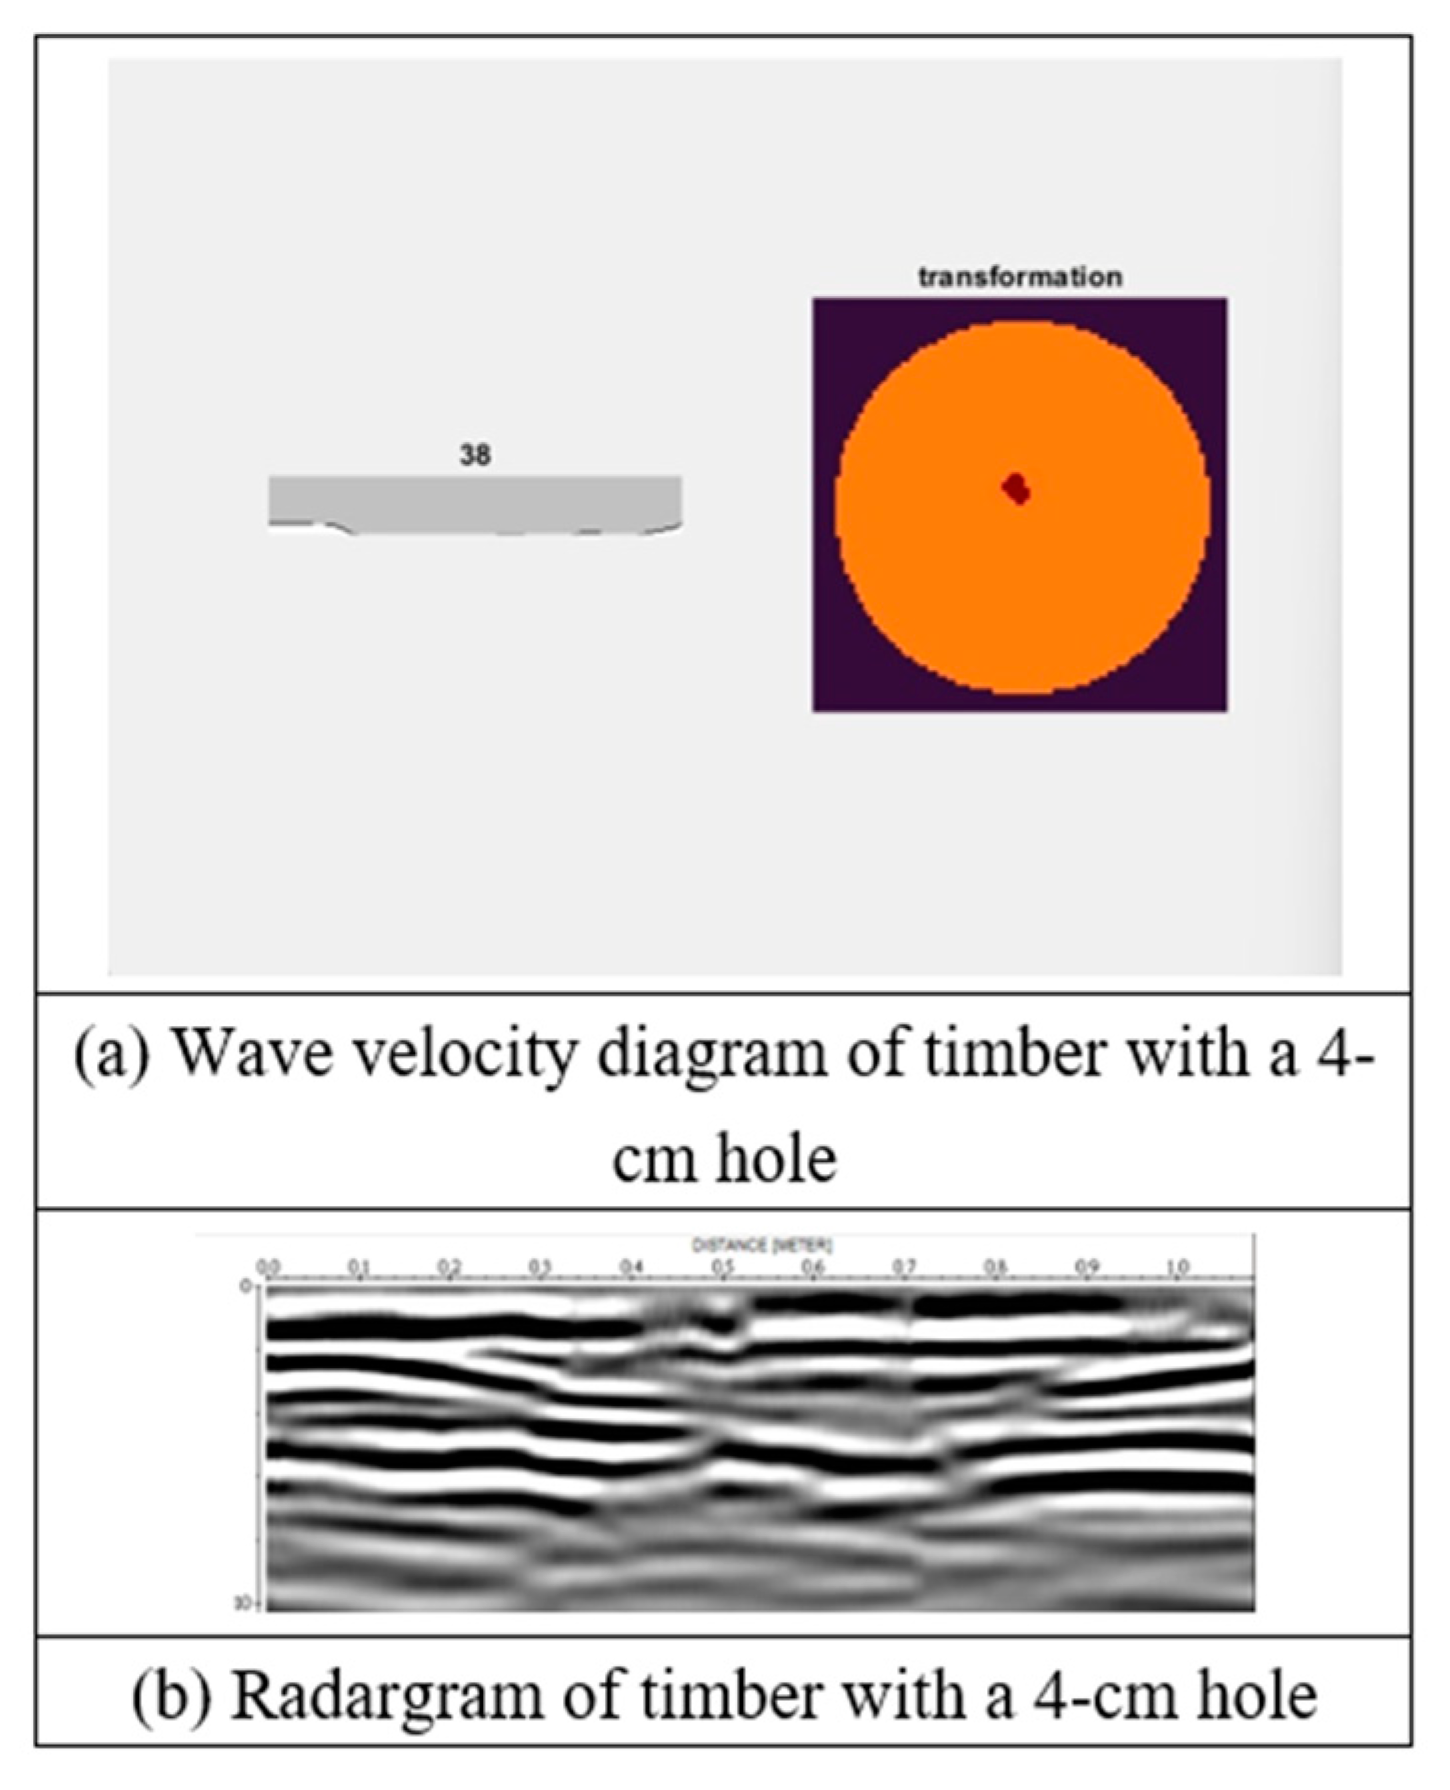
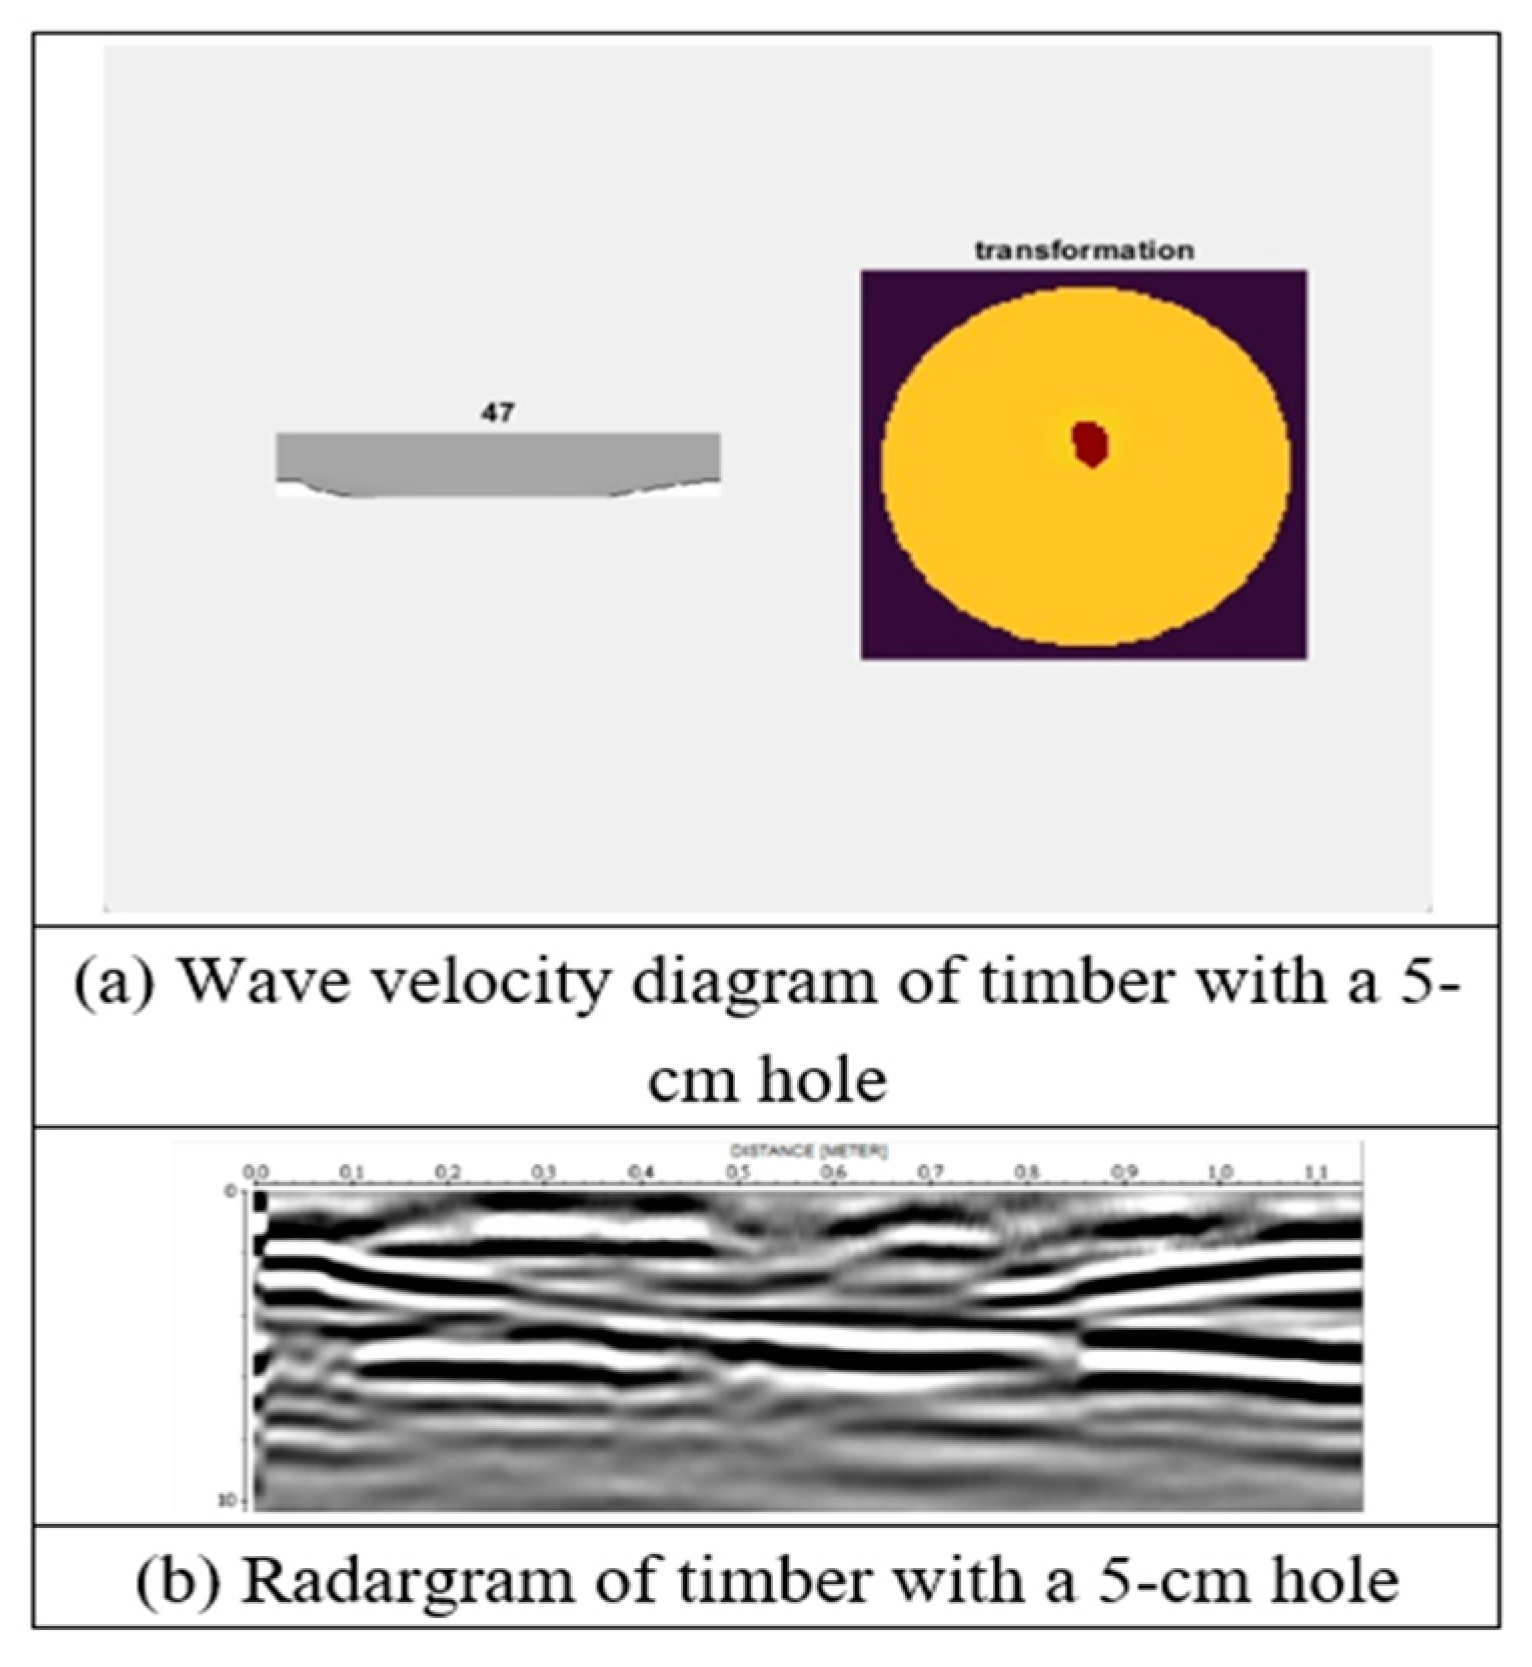
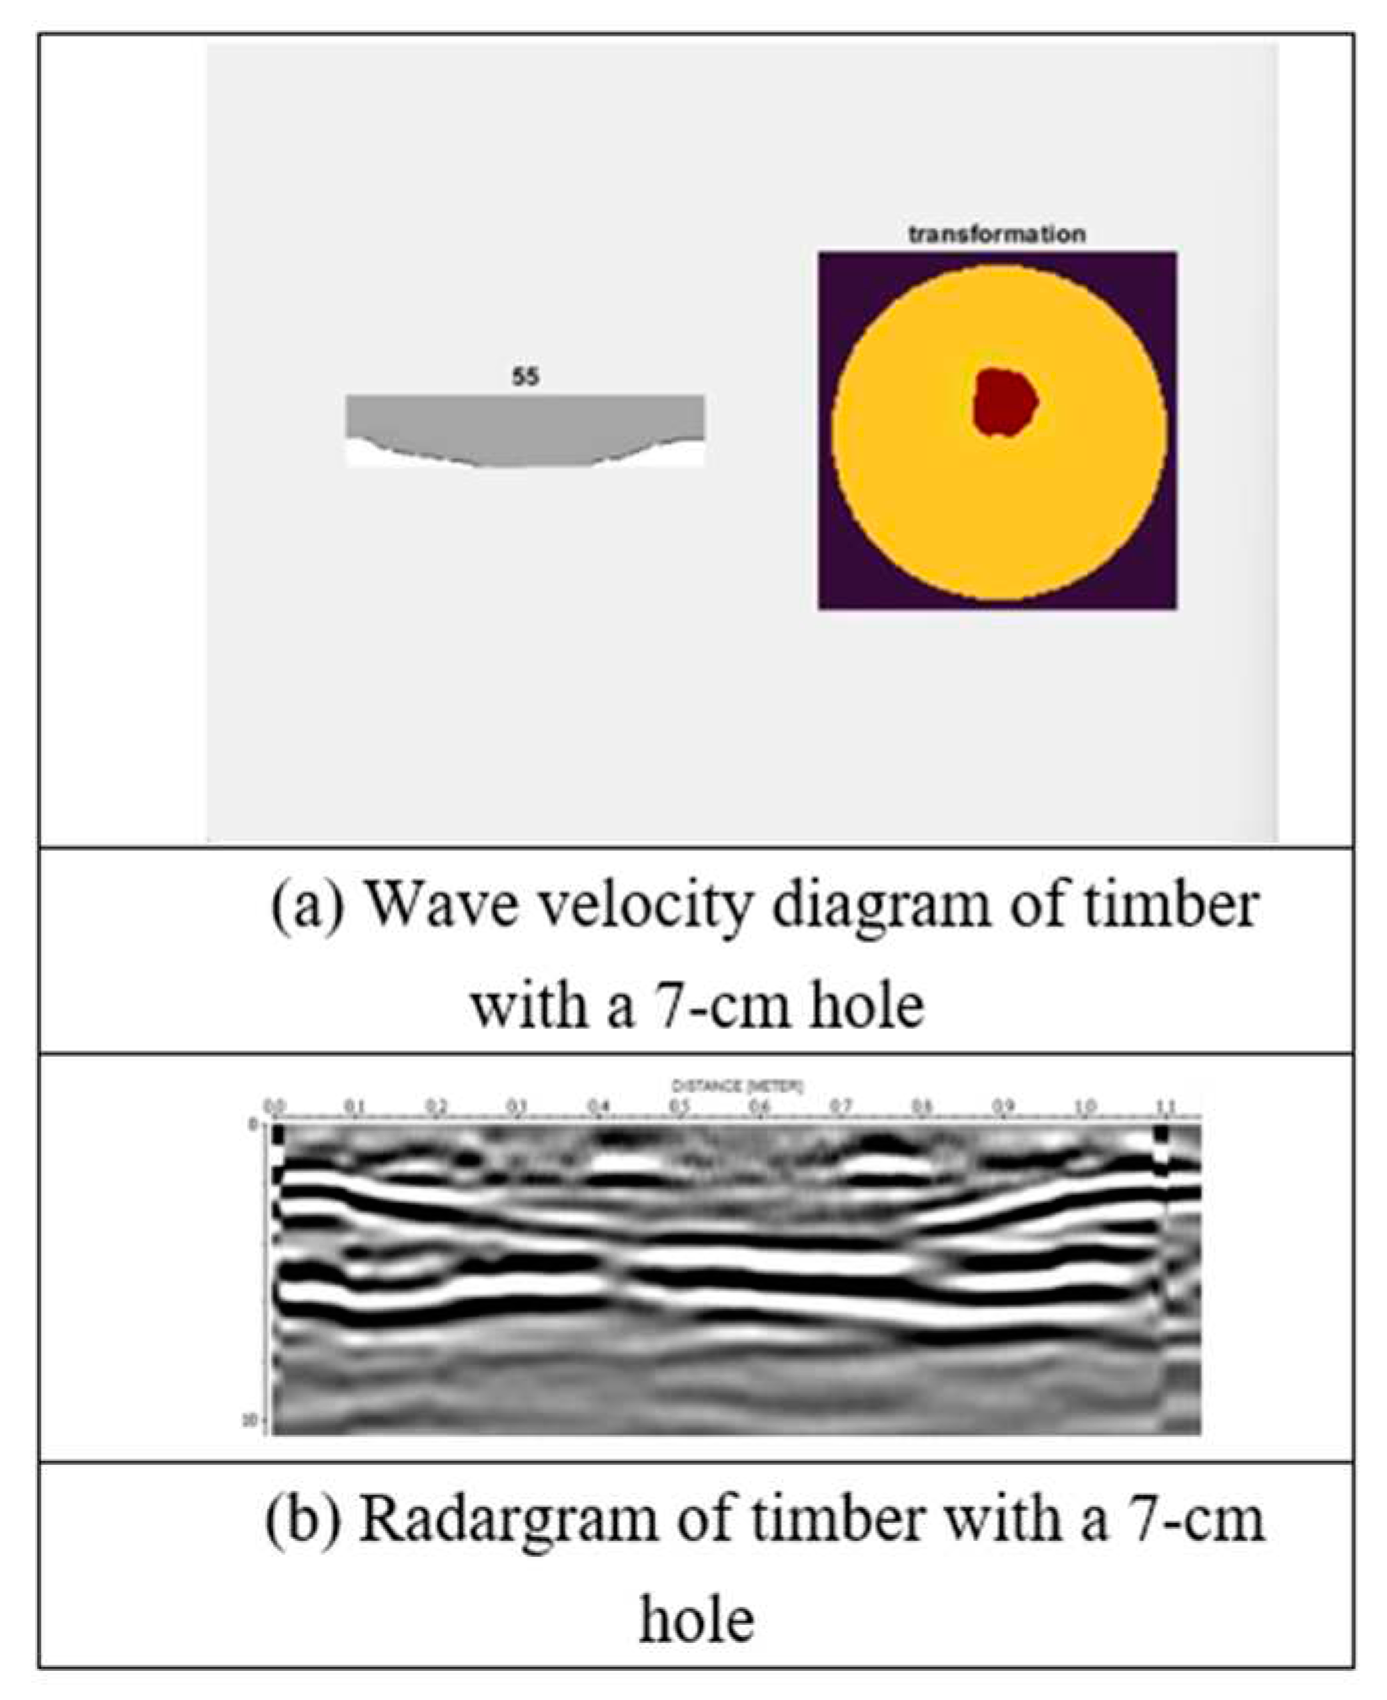
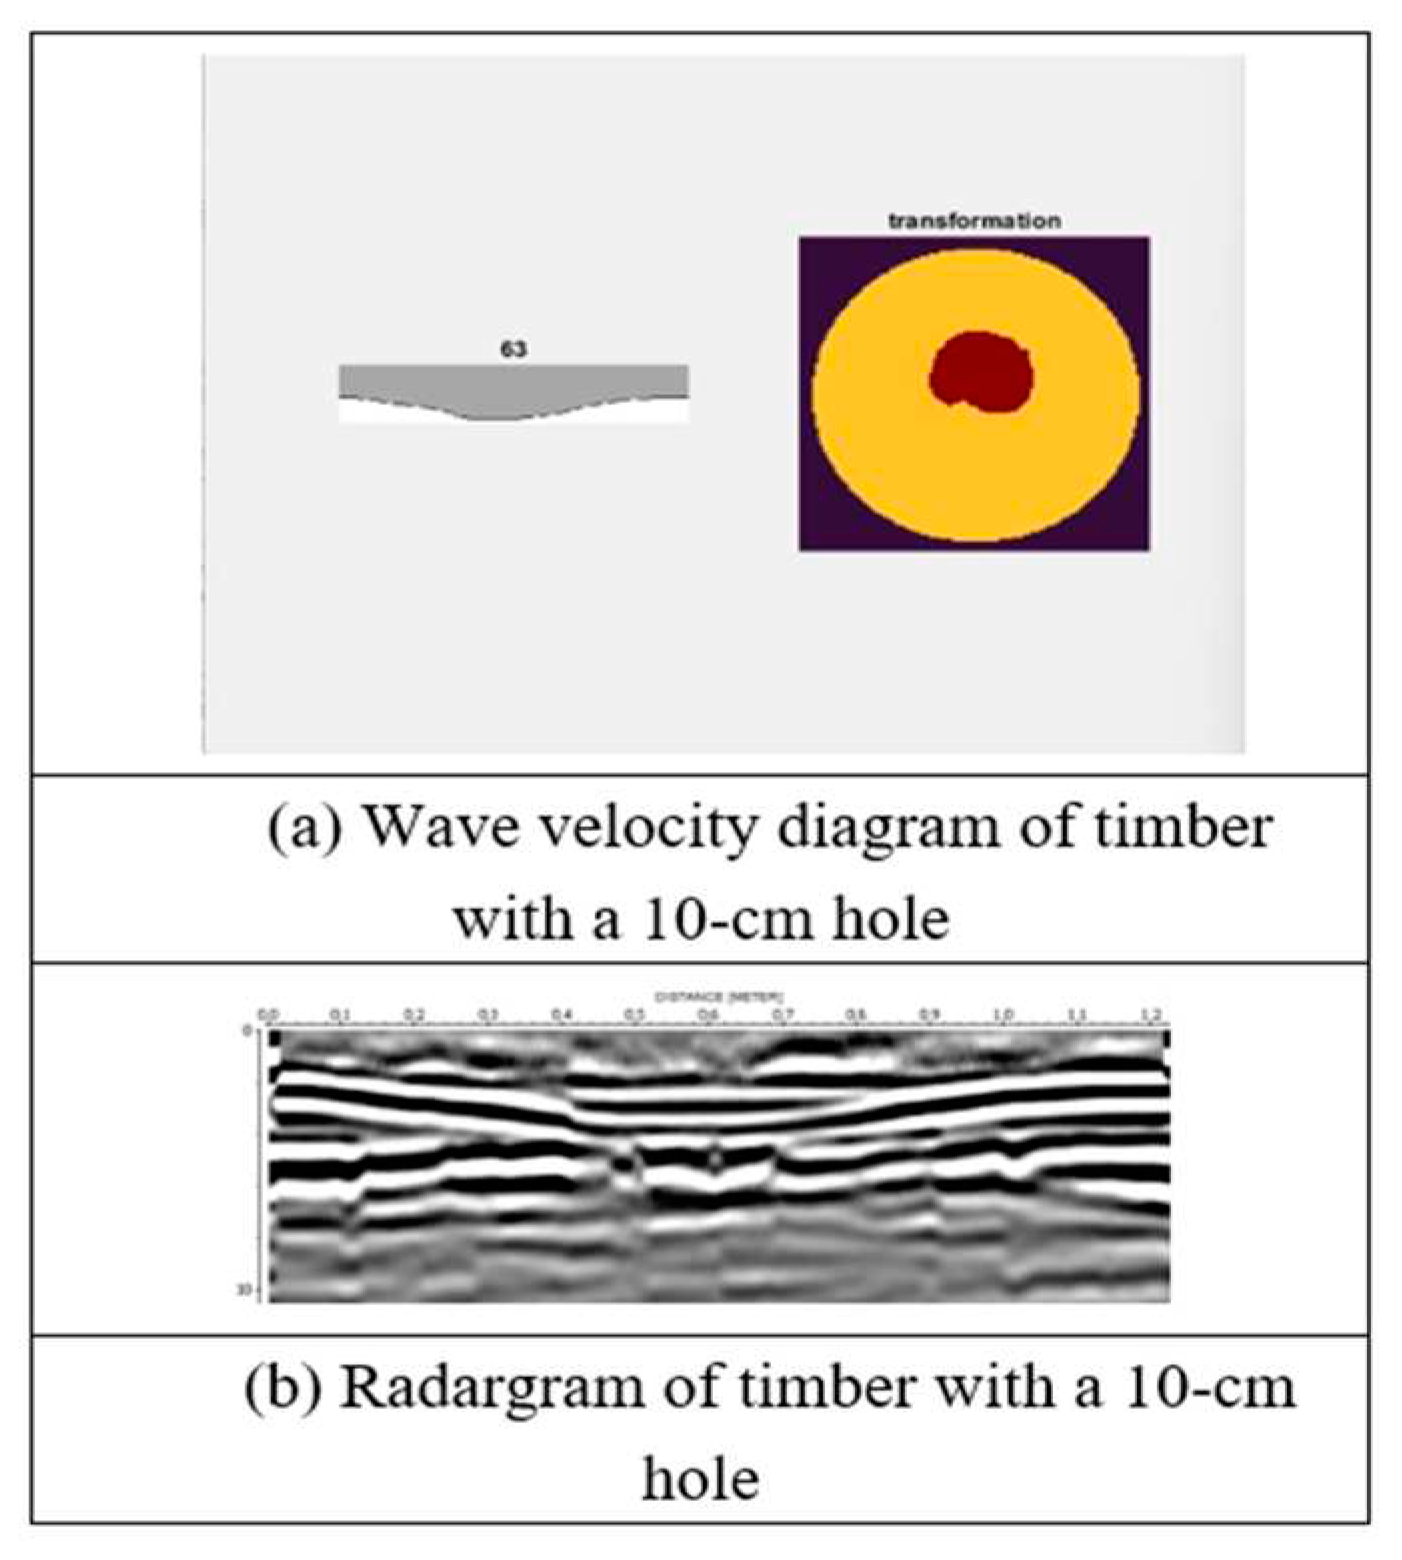
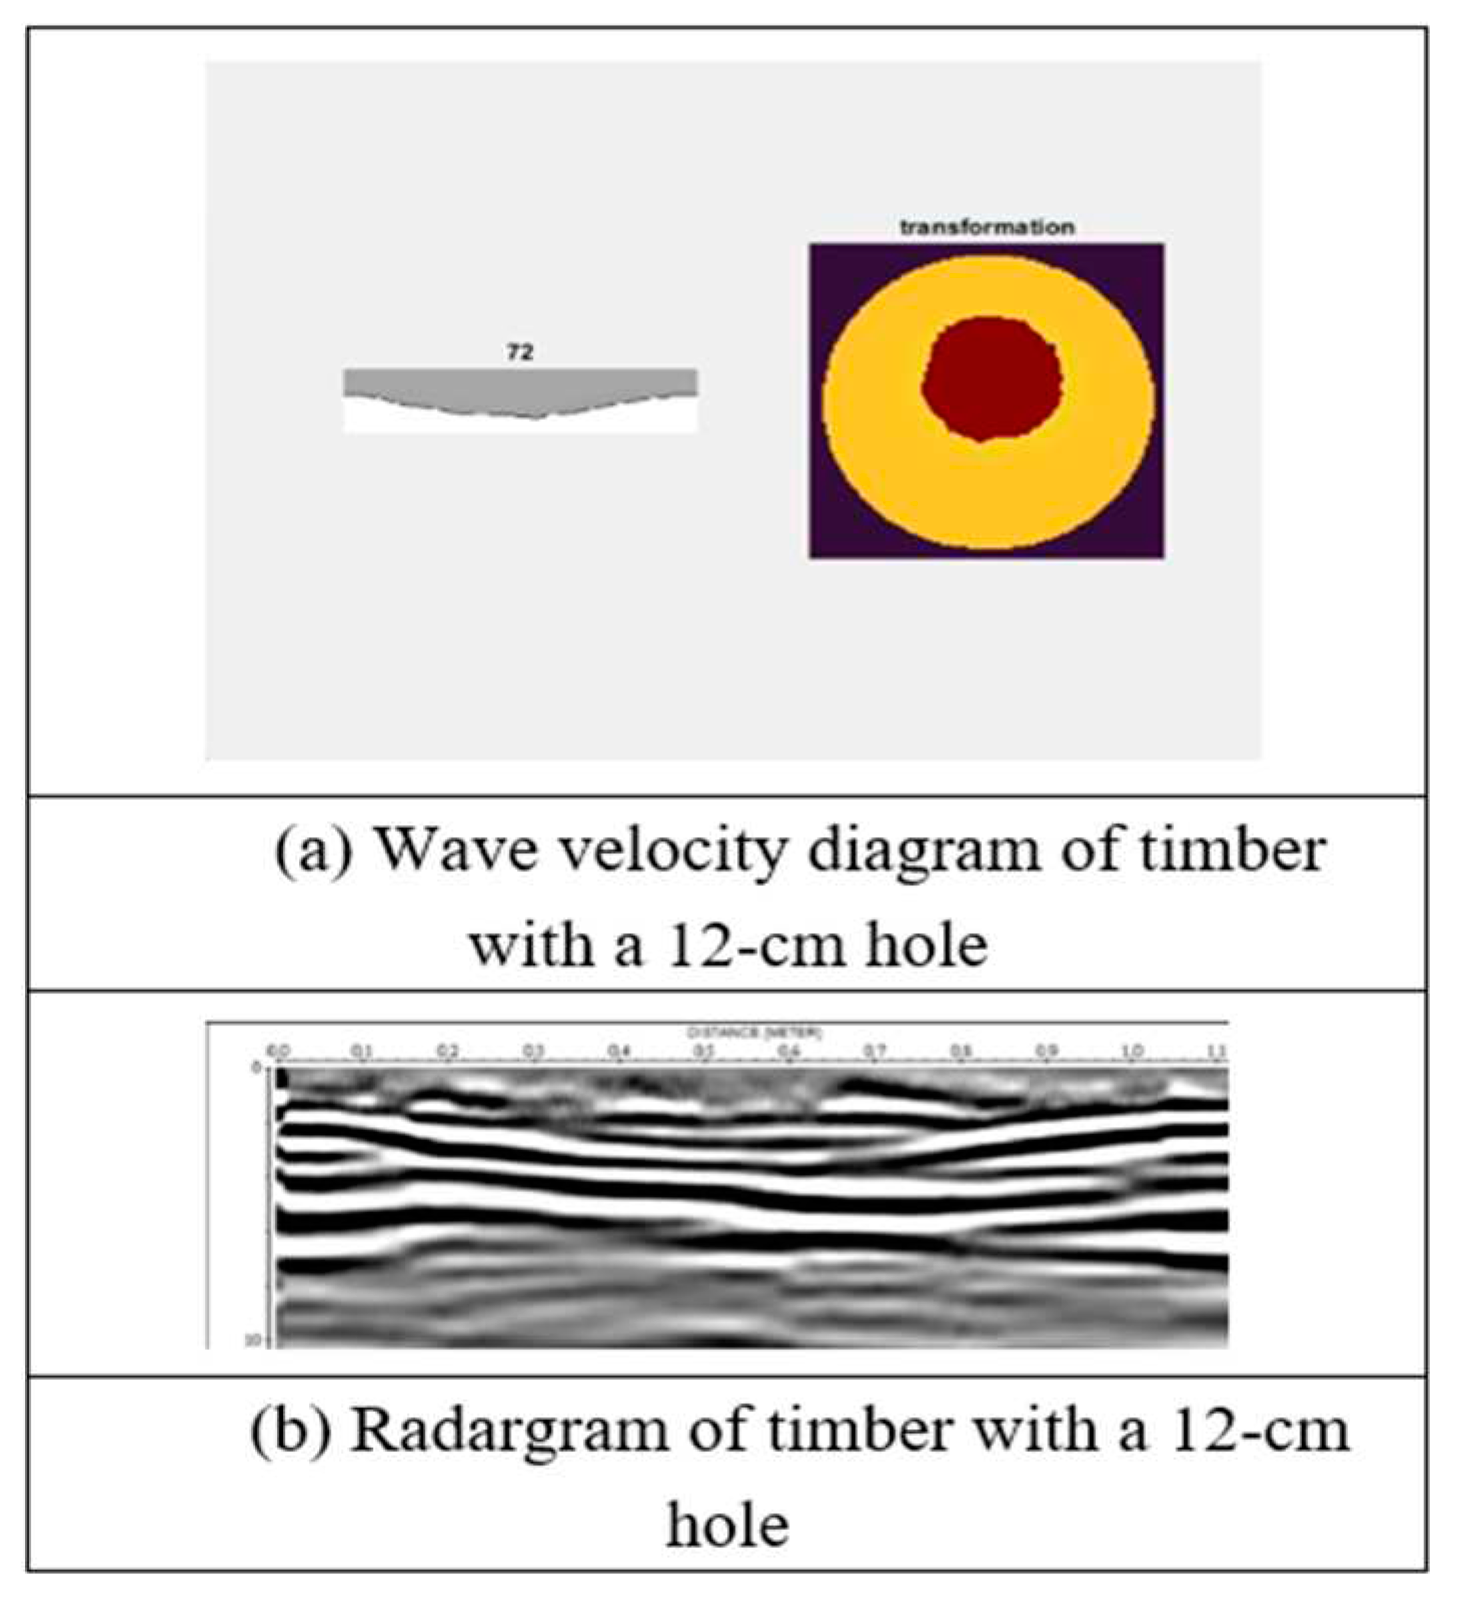
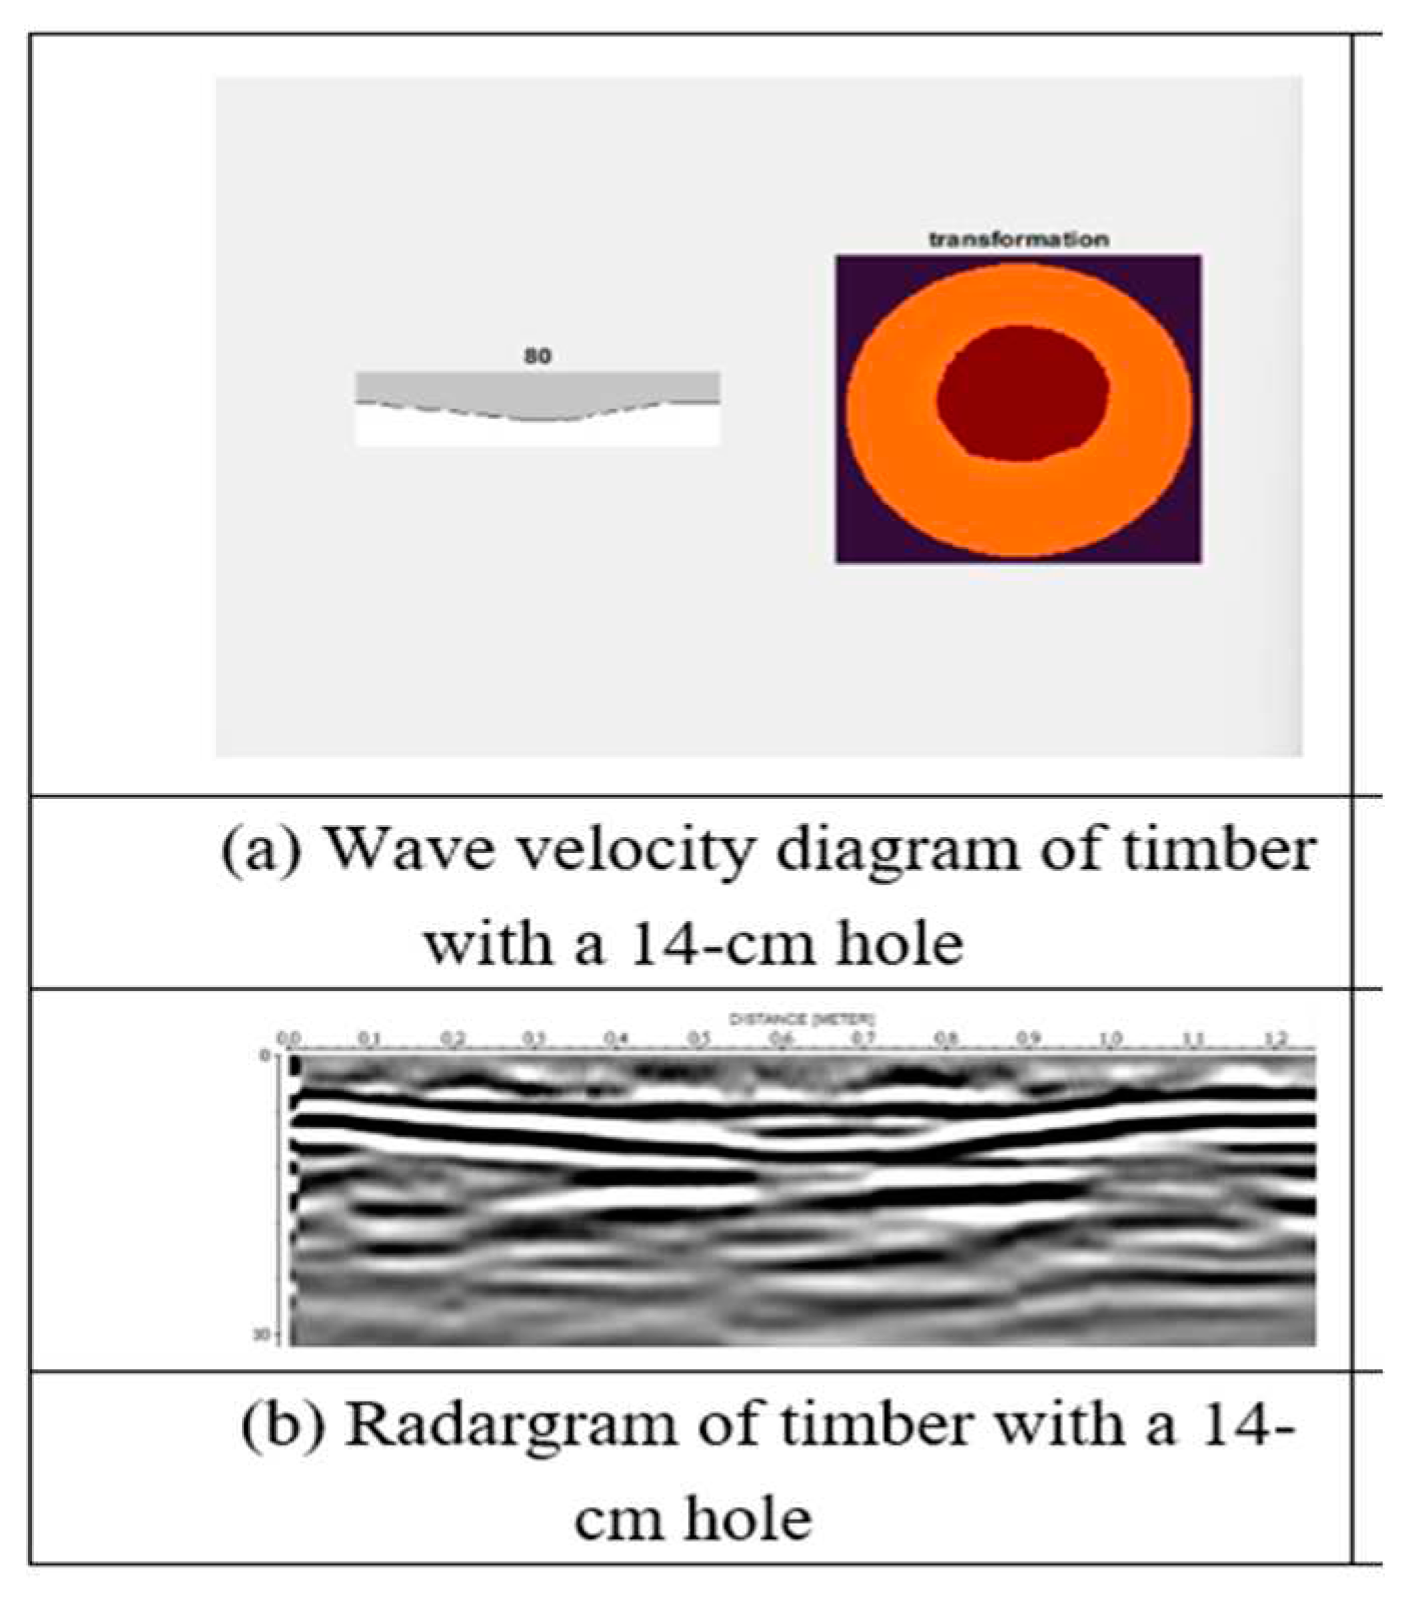
Analysis was performed using the determined wave velocity in hoop pine timber. Damage was considered to be present at a location in the timber when the wave velocity was greater than the material velocity (the dielectric constants of air and wood are 1 and 4–5, respectively). The analysis result was then used to produce wave velocity diagrams to represent potential damage in the timber (
Figure 18,
Figure 19,
Figure 20,
Figure 21,
Figure 22 and
Figure 23).
5. Tests on Live Trees
Comparison of the reflection time between a tree trunk and an aluminium sheet, the signal travel time shows the time at which the signal left the wood in the wood (Figures 24).
Figure 24.
Example of tree pole and aluminium sheet reflection signal and time comparison chart.
Figure 24.
Example of tree pole and aluminium sheet reflection signal and time comparison chart.
Tests were conducted on live hoop pine trees and royal poinciana (Delonix regia) trees, with each tree being divided into a top section, middle section, and bottom section for separate testing. Test results with favorable radargrams were selected and filtered for subsequent analysis.
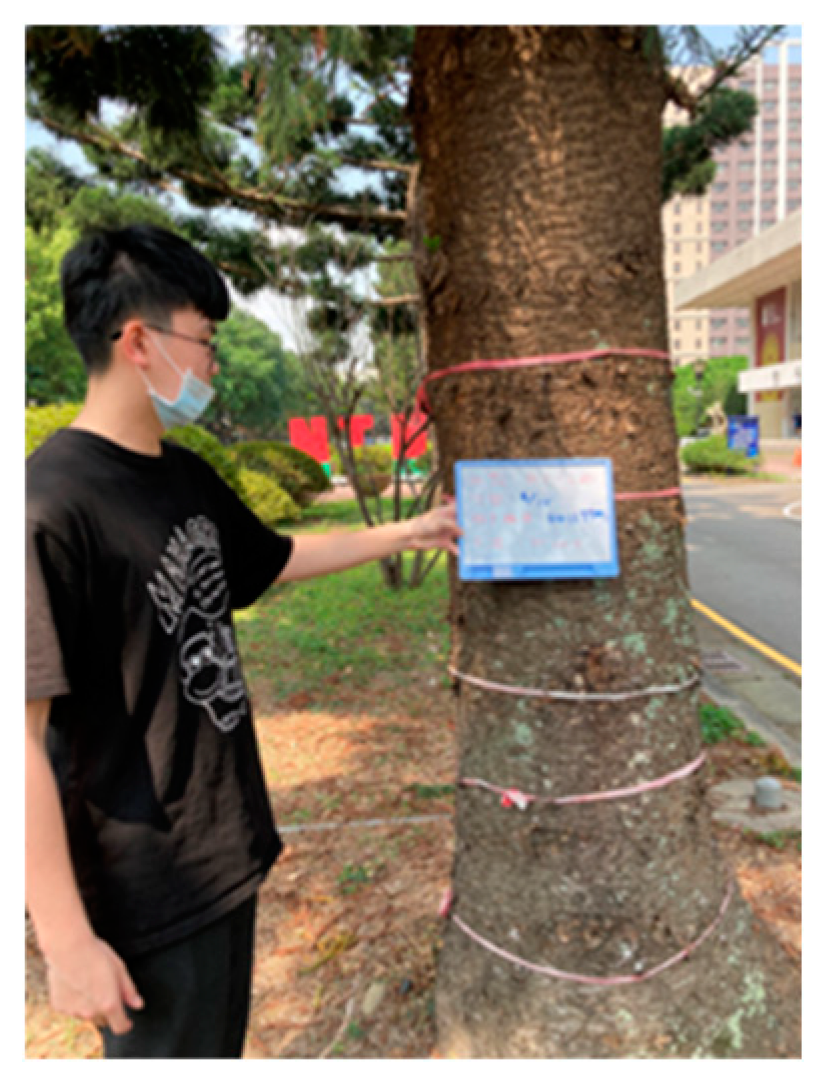
Tree No. 34, which had a circumference of 18 m and a diameter of 0.57 m, was tested using an 800-MHz antenna. Measurements were taken counterclockwise starting from the north.
Figure 25 displays a photograph of Tree No. 34, which reveals that no plant was growing on the tree bark.
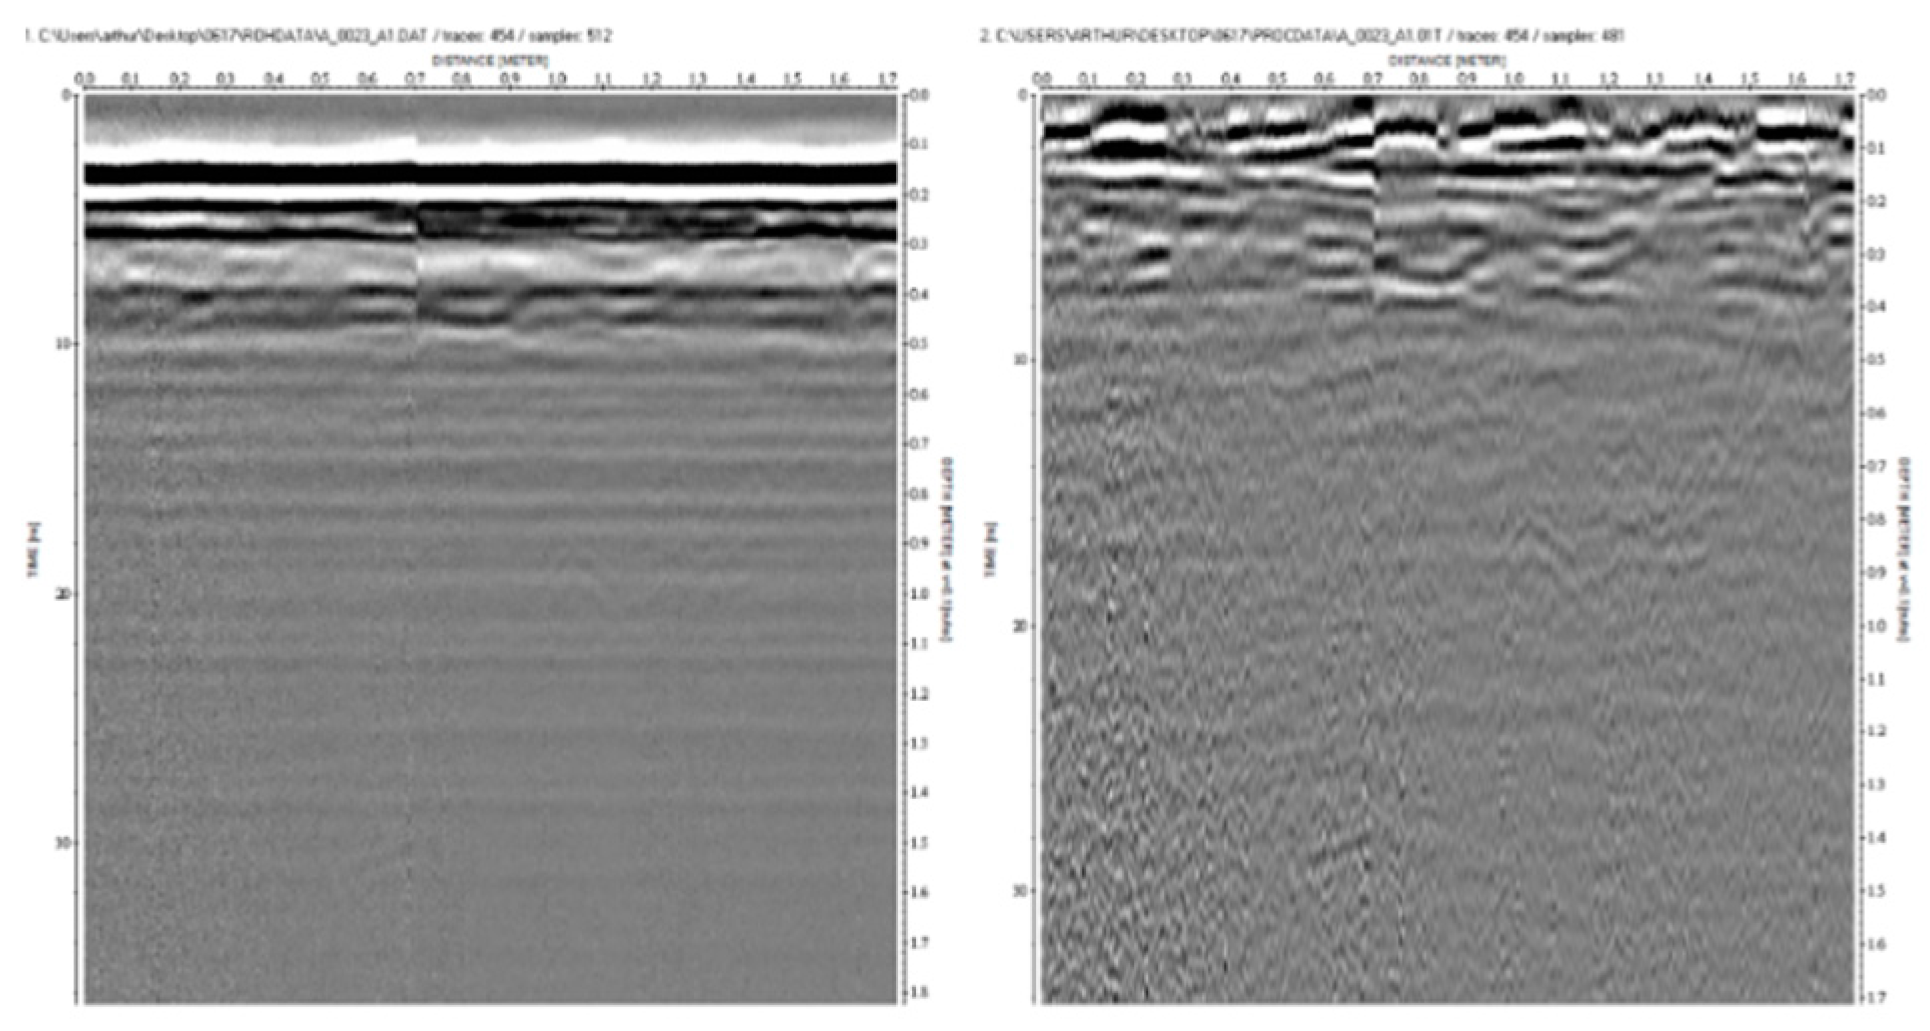
Figure 26 depicts the radargrams of Tree No. 34.
To determine the precise time that the signal exited the tree, signals were transmitted by the antenna from the same location with and without an aluminum sheet attached to the opposite side of the tree to calculate the difference between the signal travel times with and without this sheet.
Figure 24 displays A-scan images of signals obtained with (blue line) and without (orange line) the aluminum sheet. On the basis of the difference between these two signals, the signal exit time was determined to be 4.85 ns, as indicated by the red line in
Figure 24.
Figure 27 A-scan image of signals with and without a metallic sheet on Tree No. 34
The wave velocity was calculated by dividing the signal travel distance by the travel time as follows: v = 0.57/4.485 = 0.127 m/ns. This value was within the range of electromagnetic wave velocities in solids (0.1–0.3 m/ns). The dielectric constant of the tree was calculated to be 5.58 by using the following equation:
This constant falls within the typical range of dielectric constants for live trees (i.e., 5–13).
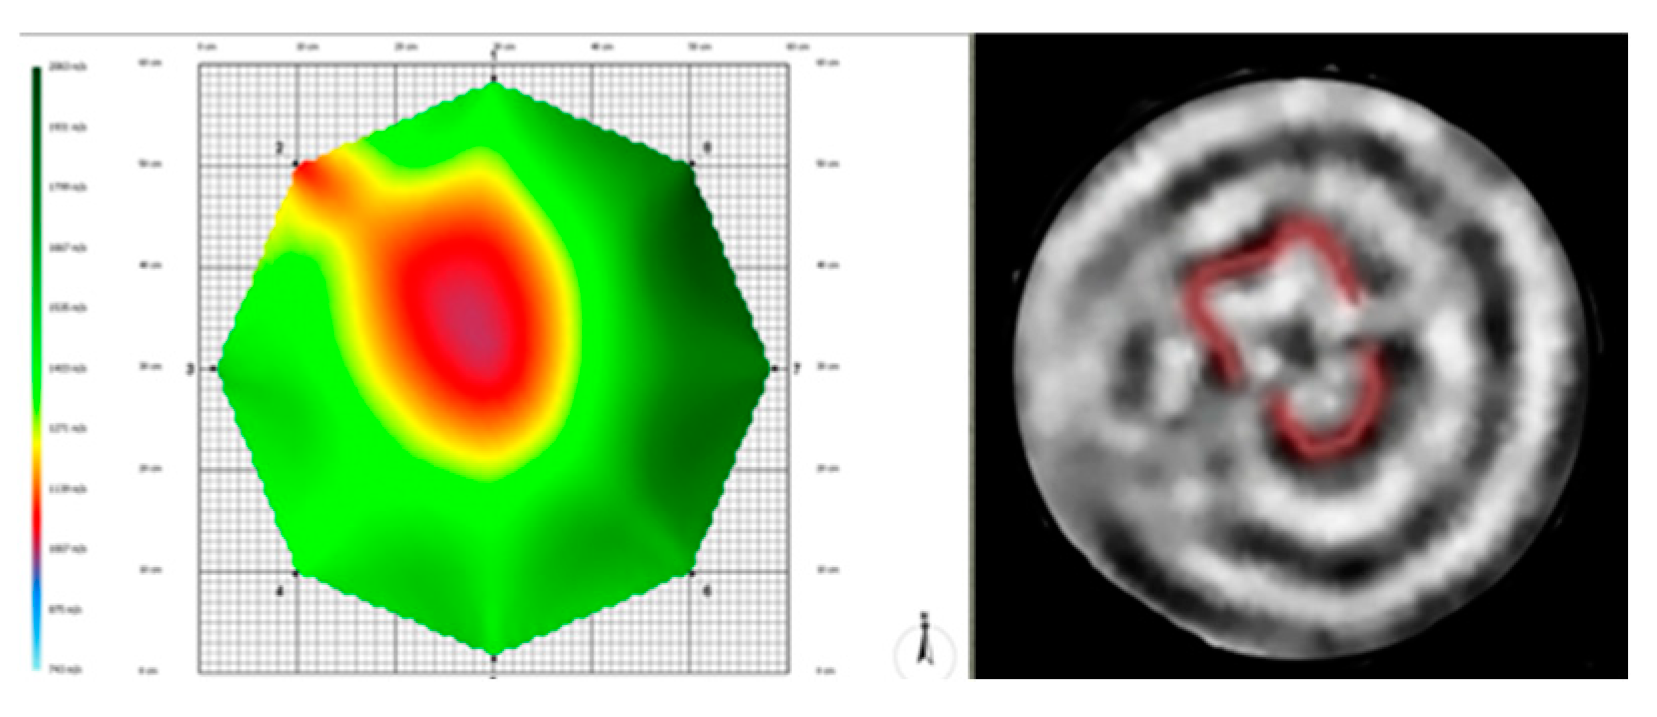
A stress wave diagram of Tree No. 34 (provided by the Taiwan Forestry Research Institute) revealed that a hole was located on the left side of the trunk of Tree No. 34. Moreover, the polar coordinates of the radargram yielded results that were consistent with those revealed by the aforementioned stress wave diagram. Measurement revealed that the aforementioned hole occupied 19.2% of the cross-sectional area of Tree No. 34; thus, the risk level was classified as risk level low.
6. Conclusion
The results obtained through a filtering process, the data matrices along the radii of holes with different diameters and the results of the coordinate transformation showed that an antenna with a frequency of 800 MHz could be used to analyse holes with a diameter of ≥40 mm.
By analysing the area between the entry and exit points of a tree trunk to which an aluminium sheet was attached, it was possible to effectively measure the two-way travel time of reflection signals and changes in the velocity of electromagnetic waves in the wood. In addition, the results indicated that the larger the hole diameter, the shorter was the signal travel time and the higher was the velocity of the electromagnetic waves in the timber.
In this study, GPR images of holes in wood were processed by filtering and coordinate transformation, and data related to the hole radius were converted; these steps allowed the relationships between signal reflections and the characteristics of the reflection curves of the obtained GPR images to be effectively assessed. The occurrence of damage to tree trunks and the risk level of each damaged tree trunk were identified on the basis of the image characteristics.
Stress waves are generally used to assess cross-sections of damage to a tree trunk, the risk level of said trunk, and hole area ratios. GPR can be used as an alternative to stress waves to conduct a comprehensive assessment of the damage status and risk level of a tree without harming the tree’s health. Finally, the velocity, waveform, and image characteristics of GPR reflections can be used to effectively and accurately estimate the distribution and form of damage within a timber specimen.
Author Contributions
The following statements should be used “Conceptualization, C.H.L. and S.L.C.; methodology, C.H.L. and S.L.C.; validation, C.H.L., S.T.L. and S.L.C.; formal analysis, C.H.L. and S.T.L.; investigation, C.H.L., S.T.L. and S.L.C.; resources, C.H.L., S.T.L. and S.L.C.; data curation, C.H.L. and S.T.L.; writing—original draft preparation, C.H.L.; writing—review and editing, C.H.L. and S.L.C.; All authors have read and agreed to the published version of the manuscript.”
Funding
This research did not receive any specific grant from funding agencies in the public, commercial, or not-for-profit sectors.
Institutional Review Board Statement
Not applicable.
Informed Consent Statement
Not applicable.
Data Availability Statement
The data that support the findings of this study are available from the corresponding author upon reasonable request.
Acknowledgments
This research did not receive any specific grant from funding agencies in the public, commercial, or not-for-profit sectors.
Conflicts of Interest
The author(s) declared no potential conflicts of interest with respect to the research, author- ship, and/or publication of this article. All authors disclosed no relevant relationships.
References
- Mattheck, C.; Breloer, H. The body language of trees. A Handbook for Failure Analysis, Office of the Deputy Prime Minister, Stationery Office Books: London, UK, 1996. [Google Scholar]
- Daniels, D. Ground Penetrating Radar, 2nd ed.; The Institute of Engineering and Technology: London, UK, 2004. [Google Scholar]
- Lorenzo, H.; Pérez-Gracia, V.; Novo, A.; Armesto, J. Forestry applications of ground-penetrating radar. For. Syst. 2019, 19, 5–17. [Google Scholar] [CrossRef]
- Ježová, J.; Mertens, L.; Lambot, S. Ground-penetrating radar for observing tree trunks and other cylindrical objects. Constr. Build. Mater. 2016, 123, 214–225. [Google Scholar] [CrossRef]
- Benedetto, A.; Tosti, F.; Ciampoli, L.B.; D’amico, F. An overview of ground penetrating radar signal processing techniques for road inspections. Signal Process. 2017, 132, 201–209. [Google Scholar] [CrossRef]
- Wen, J.; Li, W.; Xiao, Z.; Zhang, J.; Han, H. Radar wave detection of standing trees internal defect. Nongye Jixie Xuebao 2017, 48, 180–188. [Google Scholar]
- Chen, Y.; Gao, T.; Li, D.; Guo, W. Detection and quantitative evaluation of internal cavity of pinus massoniana wood by radar testing technology. Sci. Silvae Sin. 2017, 53, 139–145. [Google Scholar]
- Chen, S.L.; Liu, S.T.; Lin, C.H.; Liu, C.C. Application of ground-penetrating radar for living trees detection. IOP Conf. Series Earth Environ. Sci. 2021, 706, 012008. [Google Scholar] [CrossRef]
Figure 1.
Filtering process used in this study.
Figure 1.
Filtering process used in this study.
Figure 2.
GPR images of hoop pine timber without damage.
Figure 2.
GPR images of hoop pine timber without damage.
Figure 3.
GPR images of hoop pine timber with damage.
Figure 3.
GPR images of hoop pine timber with damage.
Figure 4.
Comparison of the reflection signals obtained with and without the use of an aluminum sheet.
Figure 4.
Comparison of the reflection signals obtained with and without the use of an aluminum sheet.
Figure 5.
Conversion from Cartesian coordinates into polar coordinates.
Figure 5.
Conversion from Cartesian coordinates into polar coordinates.
Figure 6.
Signal travel time from the incidence point to the reflection point for holes with various diameters (0–14 cm).
Figure 6.
Signal travel time from the incidence point to the reflection point for holes with various diameters (0–14 cm).
Figure 7.
Dimensions of hoop pine timber.
Figure 7.
Dimensions of hoop pine timber.
Figure 8.
Measurement of the hoop pine timber specimens.
Figure 8.
Measurement of the hoop pine timber specimens.
Figure 9.
Cross-section of hoop pine timber without damage (hole diameter = 0 cm).
Figure 9.
Cross-section of hoop pine timber without damage (hole diameter = 0 cm).
Figure 10.
Cross-section image of hoop pine timber with a hole diameter of 4 cm.
Figure 10.
Cross-section image of hoop pine timber with a hole diameter of 4 cm.
Figure 11.
Cross-section image of hoop pine timber with a hole diameter of 5 cm.
Figure 11.
Cross-section image of hoop pine timber with a hole diameter of 5 cm.
Figure 12.
Cross-section image of hoop pine timber with a hole diameter of 7 cm.
Figure 12.
Cross-section image of hoop pine timber with a hole diameter of 7 cm.
Figure 13.
Cross-section image of hoop pine timber with a hole diameter of 10 cm.
Figure 13.
Cross-section image of hoop pine timber with a hole diameter of 10 cm.
Figure 14.
Cross-section image of hoop pine timber with a hole diameter of 12 cm.
Figure 14.
Cross-section image of hoop pine timber with a hole diameter of 12 cm.
Figure 15.
Cross-section image of hoop pine timber with a hole diameter of 14 cm.
Figure 15.
Cross-section image of hoop pine timber with a hole diameter of 14 cm.
Figure 16.
Polar coordinate images of hoop pine timber containing holes with various diameters.
Figure 16.
Polar coordinate images of hoop pine timber containing holes with various diameters.
Figure 17.
Signal amplitude over time in holes with diameters of 0–14 cm in hoop pine timber.
Figure 17.
Signal amplitude over time in holes with diameters of 0–14 cm in hoop pine timber.
Figure 18.
Wave velocity diagram and radargram of timber with a 4-cm hole.
Figure 18.
Wave velocity diagram and radargram of timber with a 4-cm hole.
Figure 19.
Wave velocity diagram and radargram of timber with a 5-cm hole.
Figure 19.
Wave velocity diagram and radargram of timber with a 5-cm hole.
Figure 20.
Wave velocity diagram and radargram of timber with a 7-cm hole.
Figure 20.
Wave velocity diagram and radargram of timber with a 7-cm hole.
Figure 21.
Wave velocity diagram and radargram of timber with a 10-cm hole.
Figure 21.
Wave velocity diagram and radargram of timber with a 10-cm hole.
Figure 22.
Wave velocity diagram and radargram of timber with a 12-cm hole.
Figure 22.
Wave velocity diagram and radargram of timber with a 12-cm hole.
Figure 23.
Wave velocity diagram and radargram of timber with a 14-cm hole.
Figure 23.
Wave velocity diagram and radargram of timber with a 14-cm hole.
Figure 25.
Photograph of Tree No. 34.
Figure 25.
Photograph of Tree No. 34.
Figure 26.
Radargrams of Tree No. 34 (left: original radargram; right: filtered radargram).
Figure 26.
Radargrams of Tree No. 34 (left: original radargram; right: filtered radargram).
Figure 27.
Stress wave diagram and polar coordinate radargram of Tree No. 34.
Figure 27.
Stress wave diagram and polar coordinate radargram of Tree No. 34.
Table 1.
Risk levels of trunks with various t/R (minimum normal wall thickness of the cross-section of the trunk/radius of the trunk) values and hole area ratios.
Table 1.
Risk levels of trunks with various t/R (minimum normal wall thickness of the cross-section of the trunk/radius of the trunk) values and hole area ratios.
| Hole area ratio (H) |
>64% |
65~50% |
50~30% |
<30% |
| t / R |
<0.2 |
0.2~0.3 |
0.3~0.45 |
>0.45 |
| Risk level |
High |
Moderate |
Noteworthy |
Low |
Table 2.
Values of t/R and H (%) for holes with various diameters
Table 2.
Values of t/R and H (%) for holes with various diameters
| Hole diameter |
4cm |
5cm |
7cm |
10cm |
12cm |
14cm |
| H(%) |
1.1 |
1.6 |
3.2 |
6.6 |
9.5 |
12.9 |
| t / R |
0.74 |
0.69 |
0.59 |
0.44 |
0.33 |
0.23 |
| Risk level |
Low |
Low |
Low |
Noteworthy |
Noteworthy |
Risky |
Table 3.
Error rates for imaged holes with various diameters.
Table 3.
Error rates for imaged holes with various diameters.
| Hole diameter |
4cm |
5cm |
7cm |
10cm |
12cm |
14cm |
| H(%) |
1.1 |
1.6 |
3.2 |
6.6 |
9.5 |
12.9 |
| t / R |
0.74 |
0.69 |
0.59 |
0.44 |
0.33 |
0.23 |
| Hole diameter in the image |
3.8 |
4.8 |
6.8 |
9.9 |
11.5 |
13.6 |
| Error rate (%) |
3.9 |
3.7 |
2.9 |
0.9 |
4.1 |
2.6 |
Author Biography
Chen-Hua Lin I am a teacher in the Department of Civil Engineering, with teaching and research capabilities in civil engineering, structural engineering and non-destructive testing. In recent years, he has mainly used ground-penetrating radar detection to conduct application research on the development and practice of intelligent detection related to deterioration, leakage, corrosion, dimensions and deep learning of civil structures. Education: Ph.D. University of Chung Hua, 2010, Civil and Information Engineering. Experience: 2016~present, Assistant Professor, Department of Civil Engineering, Chung Hua University. 2023~present, Deputy Director of the Non-destructive Testing Center of the Department of Civil Engineering. 2012~2014. Postdoctoral researcher in the Department of Civil Engineering. 2010~2020. Research Specialist, Non-destructive Detection and Safety Assessment Center. 2011~2016. Department of Civil Engineering, Chung Hua University, adjunct assistant professor. SKILLS: Non-destructive testing, Digital image processing, Structural static / dynamic analysis, Electro-magnetic Wave analysis and evaluation, Finite Element Analysis.
|
Disclaimer/Publisher’s Note: The statements, opinions and data contained in all publications are solely those of the individual author(s) and contributor(s) and not of MDPI and/or the editor(s). MDPI and/or the editor(s) disclaim responsibility for any injury to people or property resulting from any ideas, methods, instructions or products referred to in the content. |
© 2023 by the authors. Licensee MDPI, Basel, Switzerland. This article is an open access article distributed under the terms and conditions of the Creative Commons Attribution (CC BY) license (http://creativecommons.org/licenses/by/4.0/).
