Introduction
Most unwanted fires are fuelled by combustible materials based on some form of organic polymeric material that decomposes to form gas phase fuel upon heating. When sufficient heat is applied to a material, the bonds within the polymer chain begin to break, eventually producing volatile molecules [
1]. This will occur at the points where the bonds are weakest. This will happen progressively, with the fragmented chains becoming smaller and smaller [
2]. This is a free radical reaction process. When the temperature is sufficient, small molecular fragments such as hydrocarbons will evolve.
The chemical composition of the polymer dictates the volatile fragments produced during thermal decomposition [
3]. The fragments produced must be small if they are to be volatile at the temperatures of decomposition. Larger fragments will typically remain in the condensed phase before being further decomposed into smaller fragments when higher temperatures are reached [
4].
Upon ignition, the combustion process will result in flaming where visible and infrared radiation is emitted [
5]. This will transfer some of the heat back to the polymer's surface, aiding the production of more volatile fragments and sustaining the burning of the material. When the heat required to cause volatilisation of the solid is exceeded by the heat, feedback from the flame combustion will stabilize [
6].
The point on a material at which flaming combustion occurs is one of the chemical reaction zones within a fire [
7]. Changes in air flow across the flame can alter the shape and thickness of the reaction zone, causing changes in the chemical reactions that occur. For example, the addition of excess gas flow over the flame can cause the flame to become thinner, reducing the time at which gaseous species spend in the reaction zone [
8]. In the case of flaming combustion, the gaseous species spend less time in the reaction zone, ultimately yielding more products of incomplete combustion as the molecules have less time to react and hence more incomplete combustion occurs [
9]. Excess gas flow over the flaming surface of a material can cause the reaction zone to become so thin and cooled that it reaches a point where flaming combustion can not be sustained.
This relationship can be interpreted in terms of Damkholer number [
10] (D), a dimensionless value expressing the ratio of the time spent within a reaction zone to the time needed for chemical reactions to occur, shown in Equation (1).
Where is the residence time (the length of time the fuel vapours remain in the reaction zone), is the chemical reaction time which is the effective duration of the reaction at the temperature of the flame. In the reaction vessel, the residence time is defined by the total volume of the vessel and the volume flow passing through, or in this instance passing over the reaction.
The effects of altering residence time was studied to assess the affects this had on smoke toxicity. This is valuable knowledge when designing fire tests that use supplementary nitrogen to simulate low oxygen environments, as the measured toxicity is not guaranteed to be from the burning material, or as a result of the reaction conditions occurring during the test. While on a much smaller scale, this study simulates what might happen during an external façade fire in wind, and how this would affect the toxicity of the smoke during a larger fire [
11].
Results and Discussion
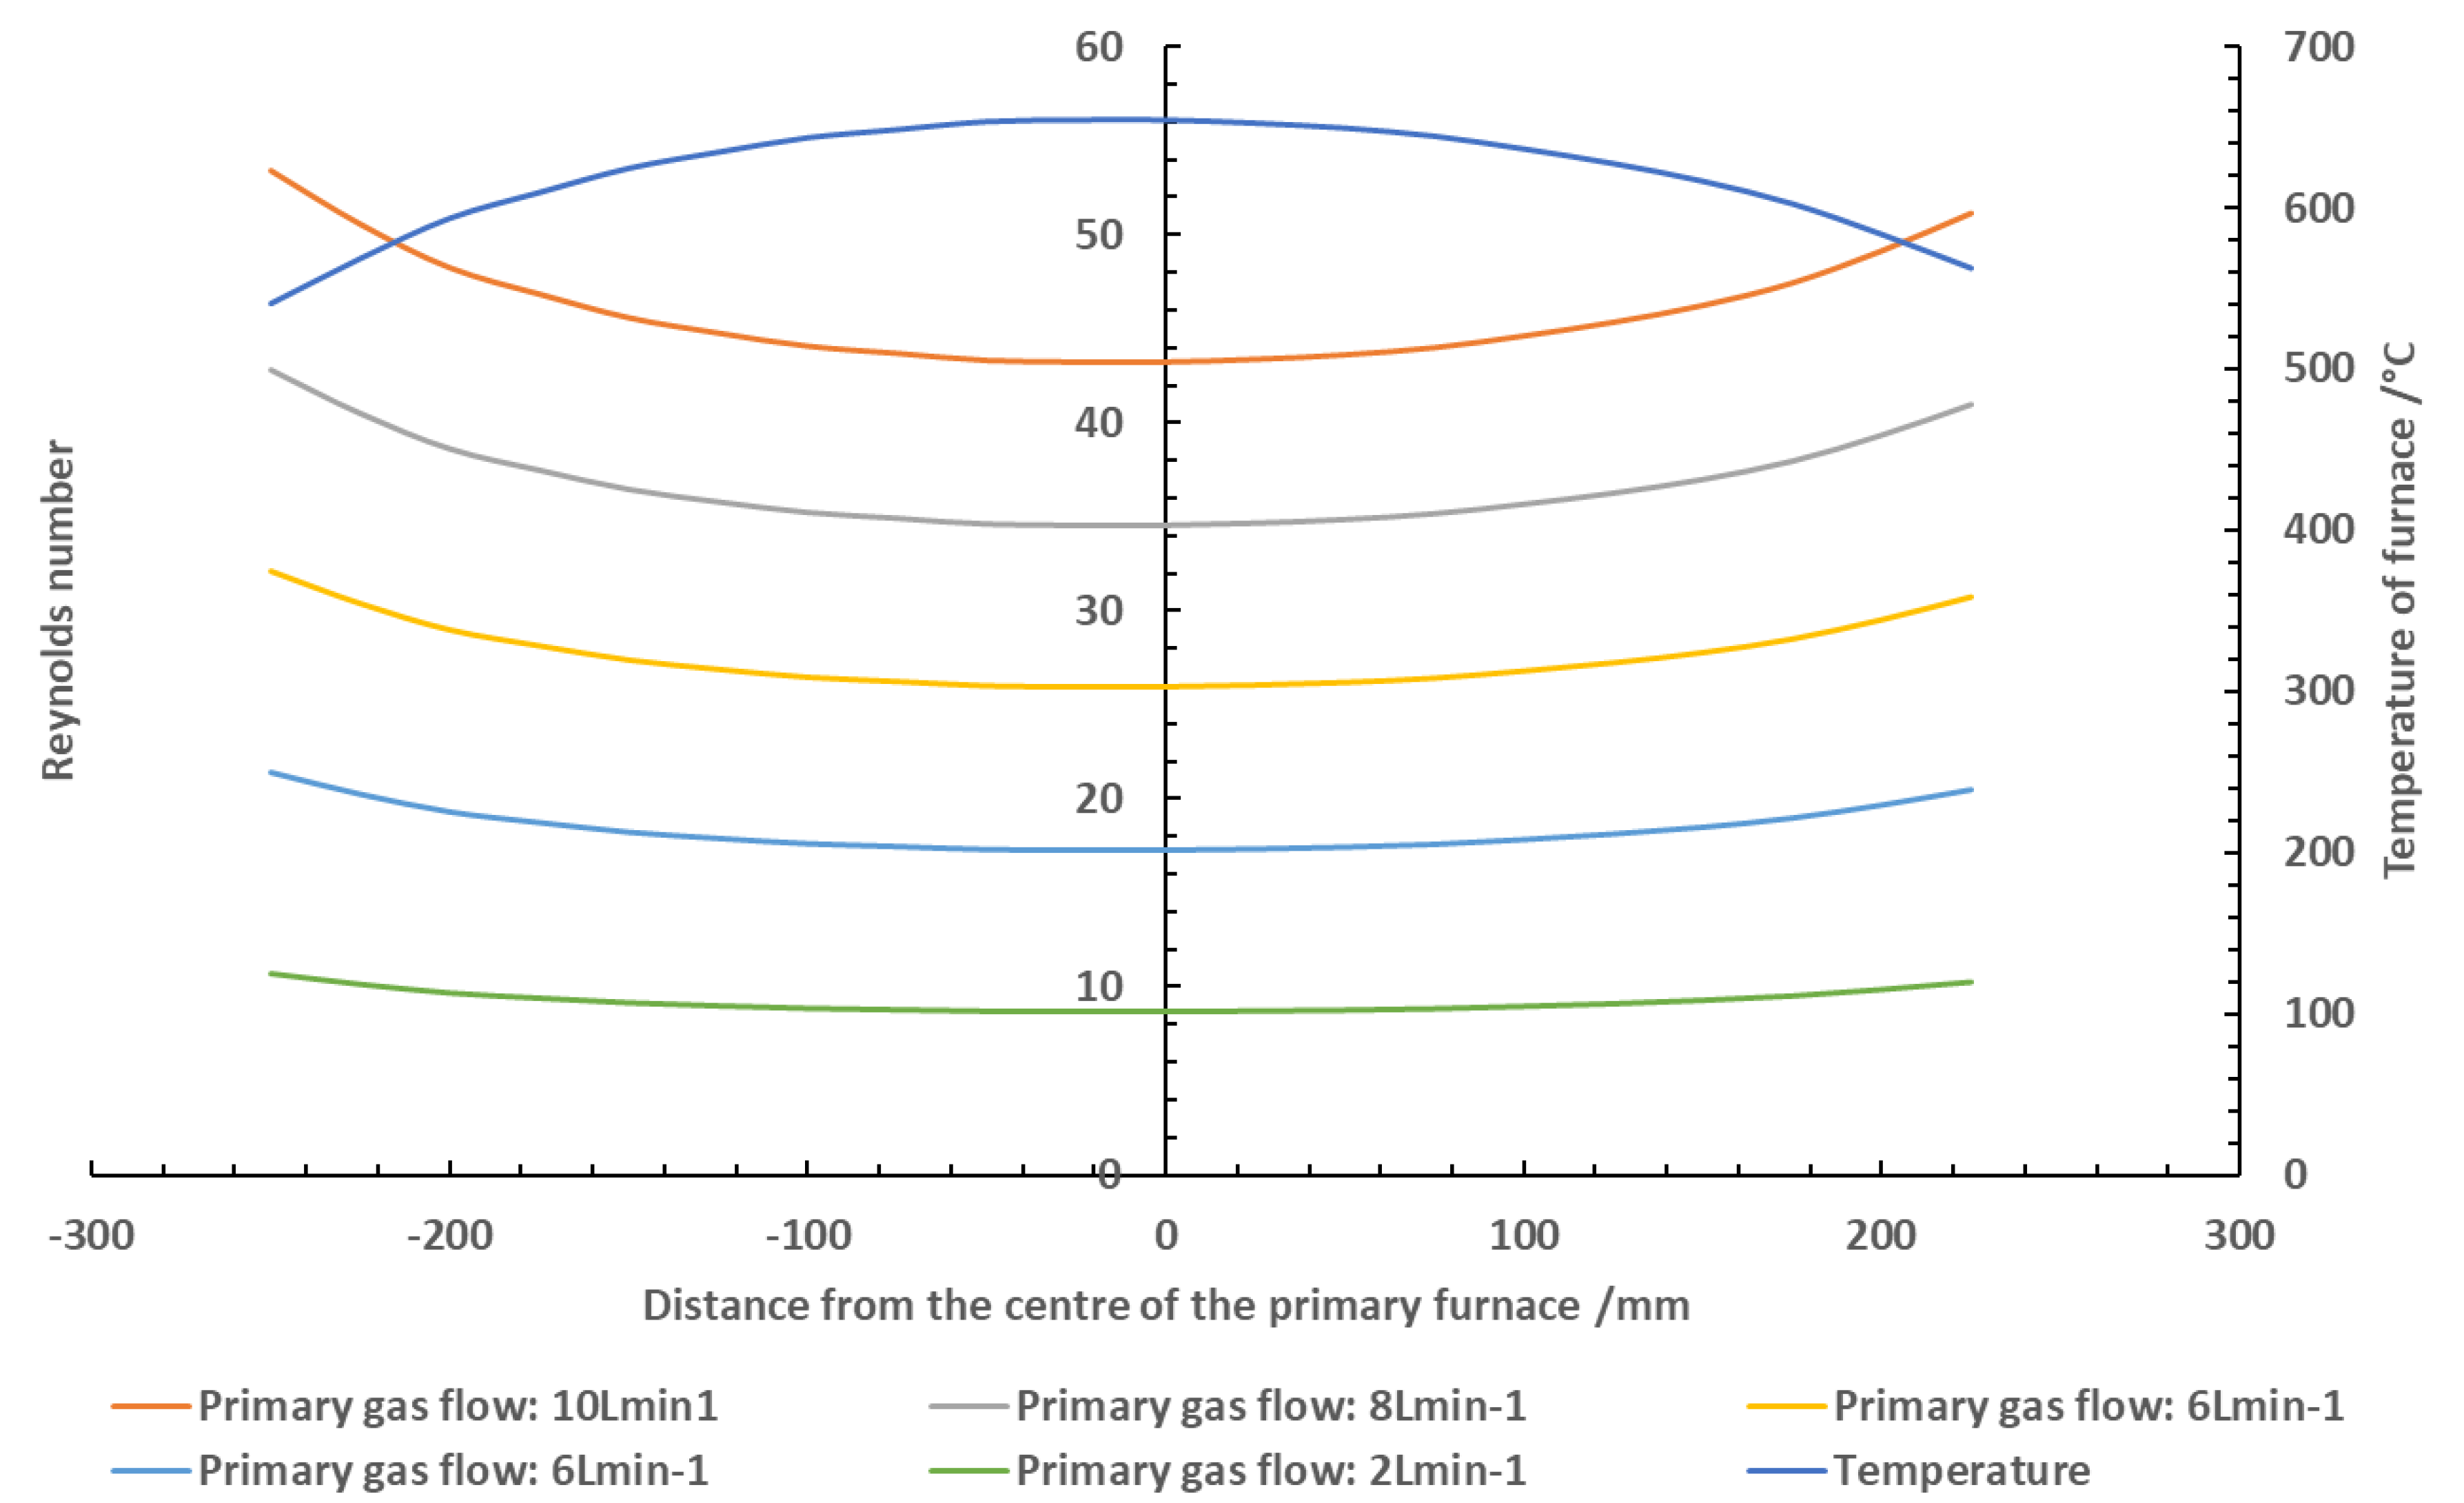
To ensure any observations were a result of the chemical reactions occurring in the combustion environment and not a direct result of changes in fluid flow through furnace, the Reynolds number for each air flow used was calculated based on the calibrated temperature profile of the furnace. If the effluent were to transition from laminar to turbulent, this would have a direct effect on the mixing of the fire effluent, resulting in changes to the measured toxicity. The Reynolds number was calculated using Equation (2).
Where
ρ is the density of the gas,
is the velocity, d is diameter of the pipe and
is the viscosity of the gas. The calculated Reynolds number for each airflow based on the furnace temperature profile is shown in
Figure 1. While the fluidity of the gas is not entirely constant throughout the furnace (due to the slight changes in gas density and viscosity based on the temperature gradient), the flow through the tube furnace was consistently laminar at all gas flows used. From this, observations were deemed to be a result of chemical reactions as opposed to a result of changes in effluent mixing.
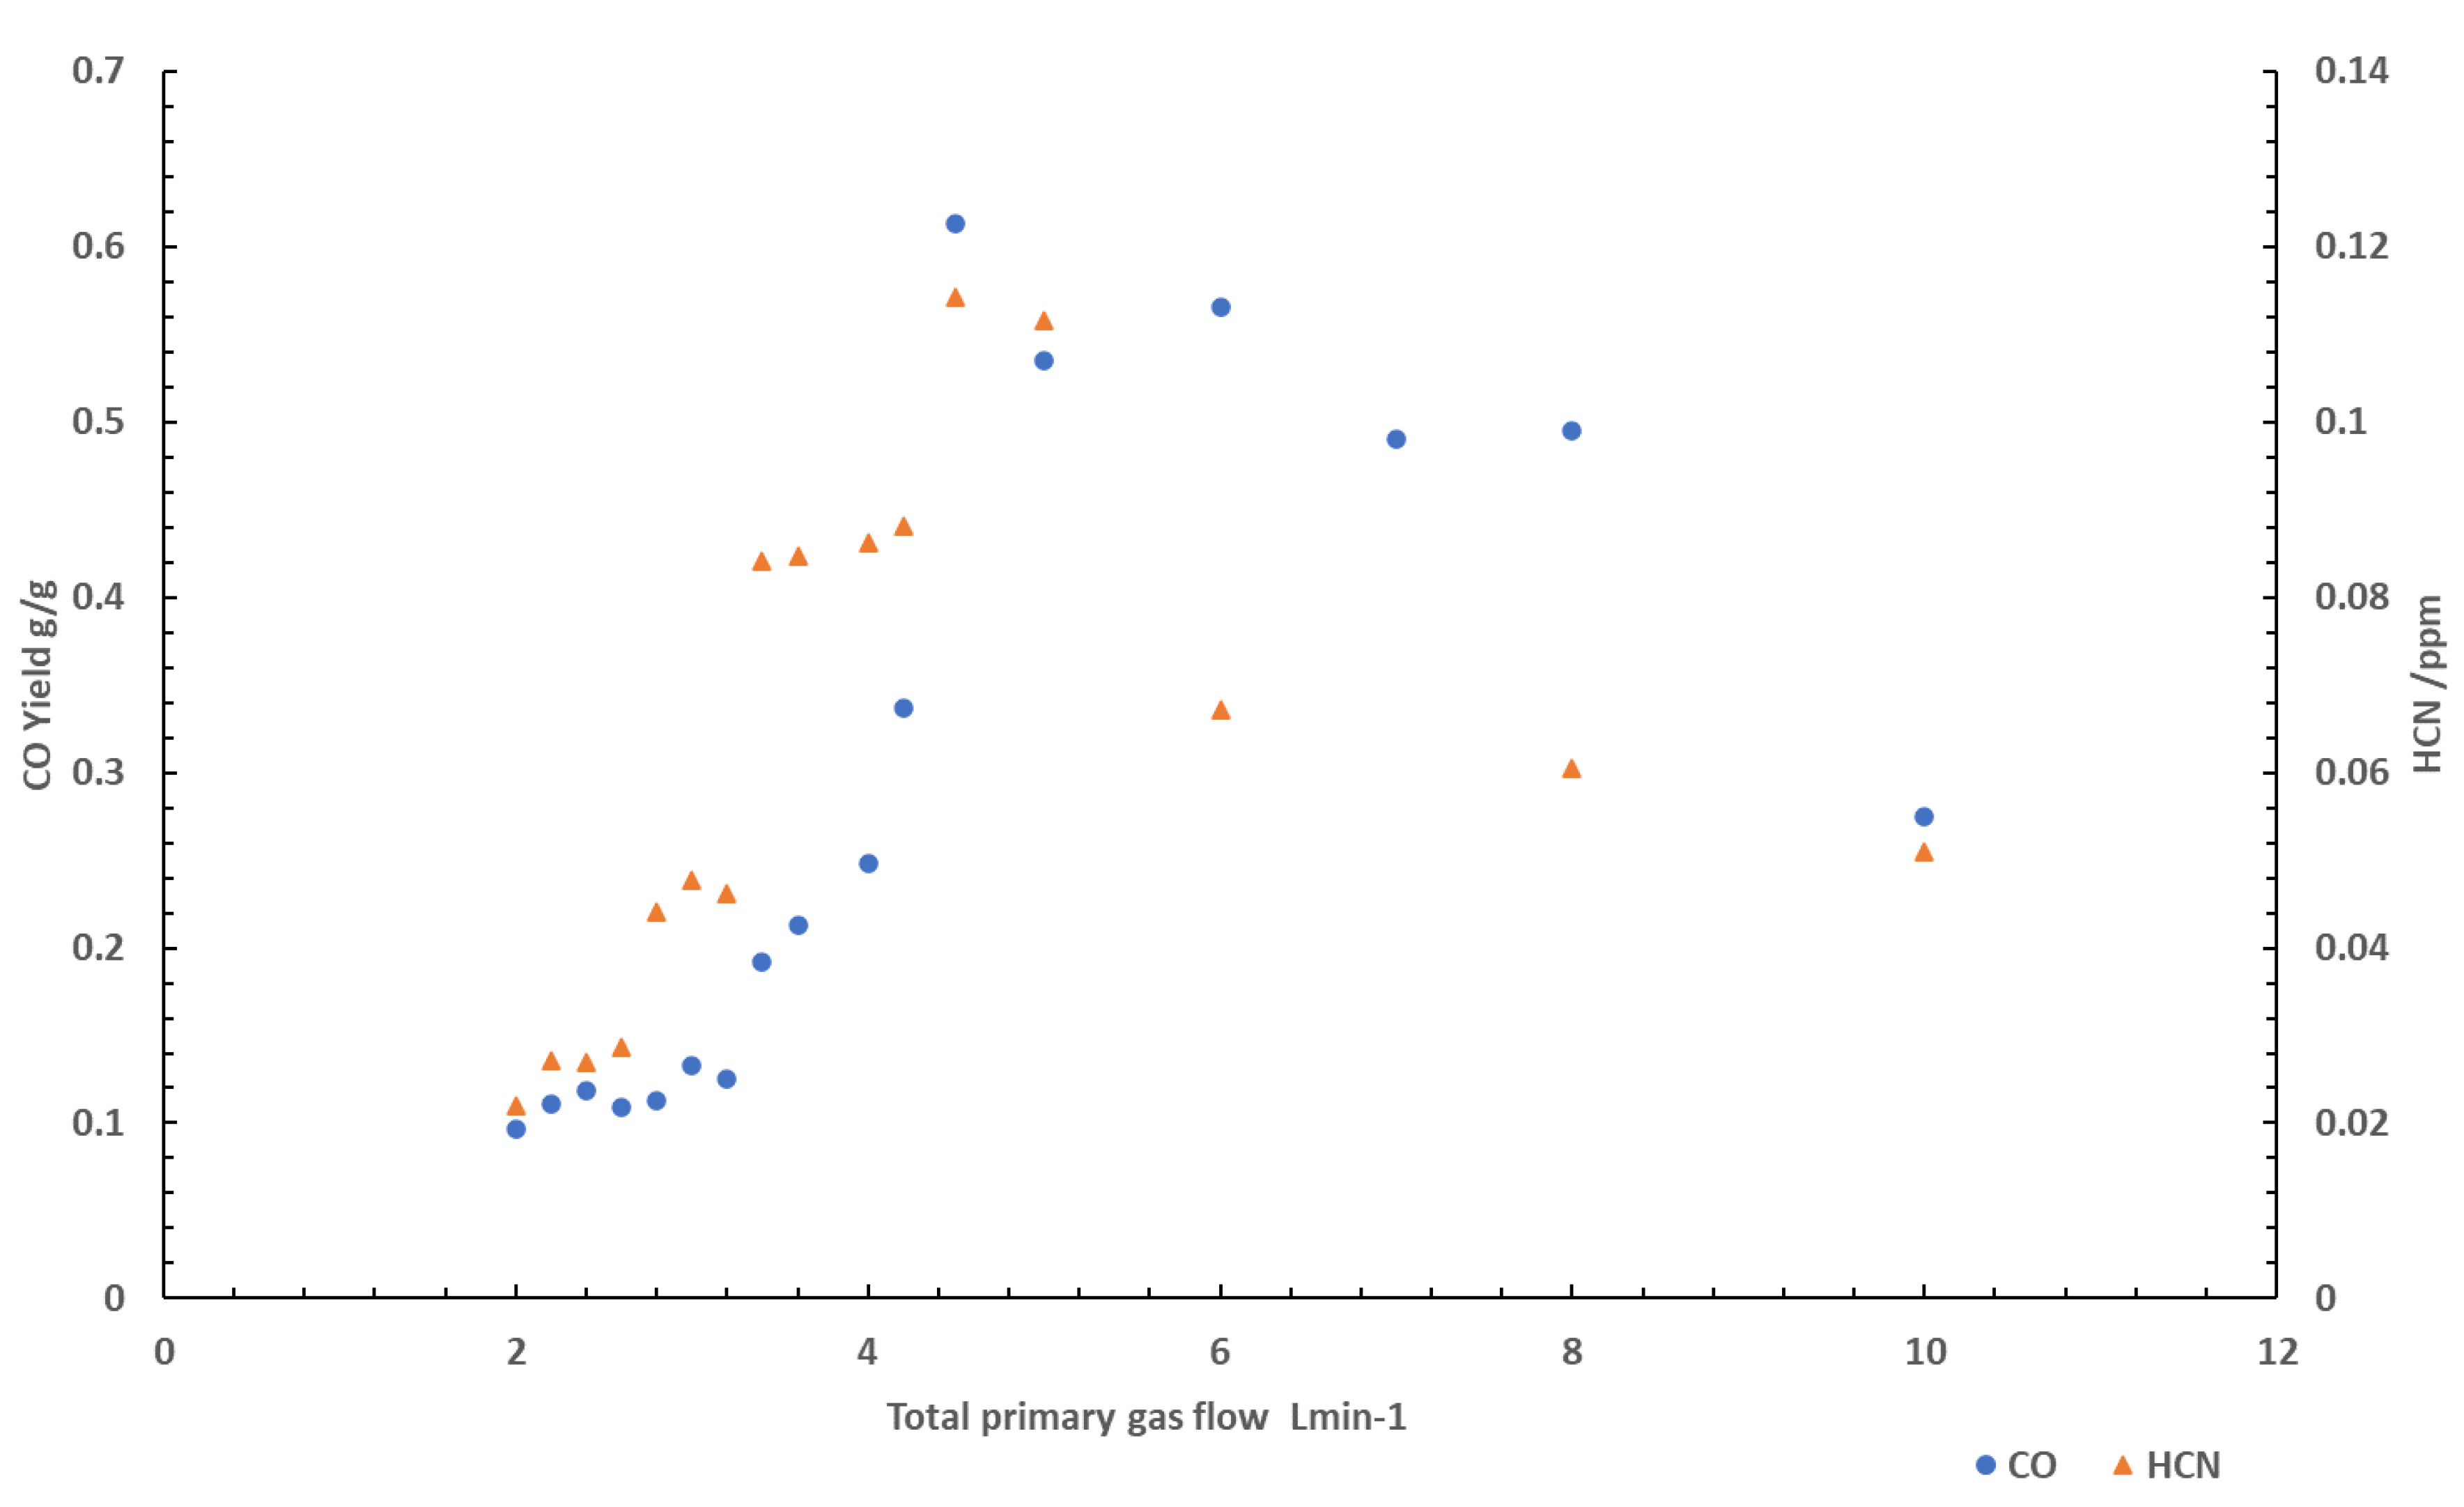
Figure 2 shows CO and HCN yields obtained from tests conducted using PA6 at varying total gas flow rates. The addition of nitrogen into the combustion environment had very little effect on the CO yield at flow rates above 6 L min
-1. Below this point, a sharp increase in CO yields after the addition of nitrogen. Significant increases in CO were observed between 3 L min
-1 until 5 L min
-1, suggesting the addition of nitrogen at lower volumes was enough to slightly decrease the residence time of the flaming reaction, resulting in large increases in CO yields.
The HCN yields are also shown in
Figure 2. As the volume flow is increased there is an increase in the yield of HCN, similar to CO. This is particularly prominent again from 3 L min
-1 to 5 L min
-1, with a sharp increase in yields occurring.
At volume flows above 3 L min-1 the reaction zone within the flame seemingly distortions to such an extent it reduces the flames thickness. This was a visible effect that occurred in the tube furnace as the flame became smaller and wispy, coinciding with the point at which carbon monoxide yields significantly increased, suggesting the fuel vapours are no longer remaining in the reaction zone long enough for effective chemical reactions to occur due to the increased flow of gas over the sample, resulting in higher yields of products of incomplete combustion. At this point, that fuel vapours have a much shorter period to react. As the reaction zone becomes thinner, the combustion becomes more incomplete, providing an explanation for the increase in products of incomplete combustion (CO and HCN) at this point.
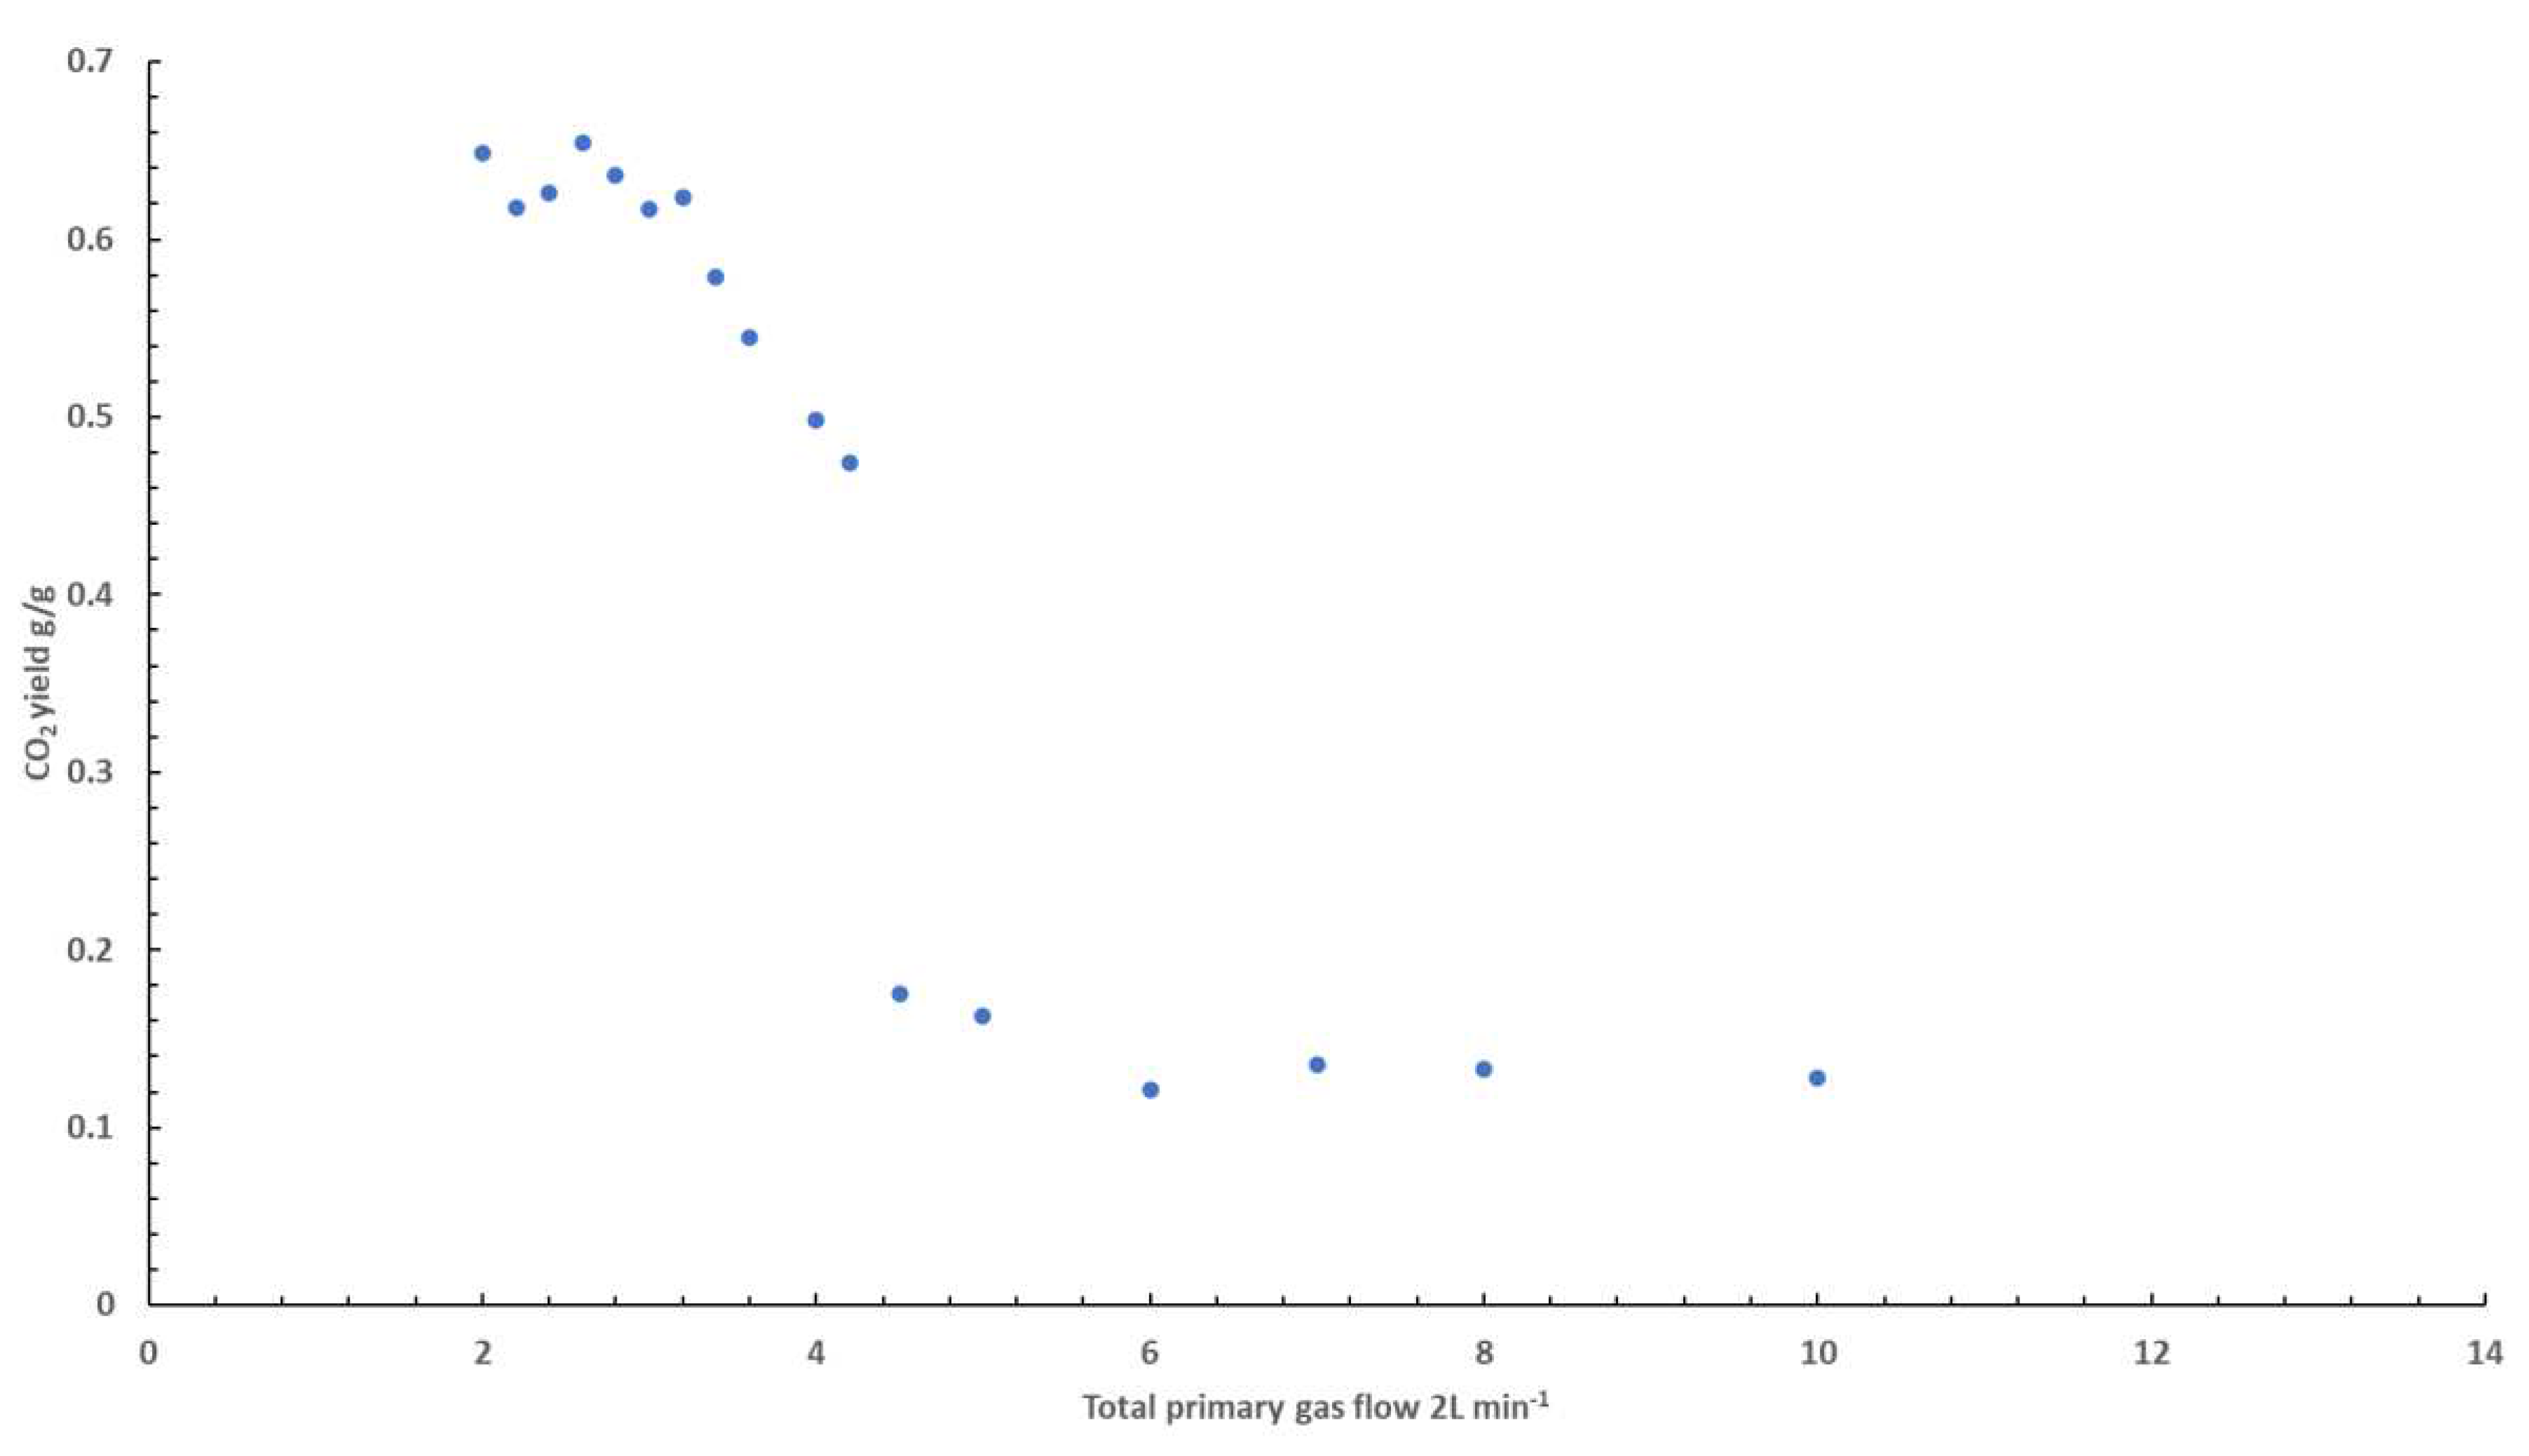
This explanation is supported by the CO
2 data obtained from these experiments, shown in
Figure 3. Similar to the trend observed in the CO yields, there is little change in the CO
2 yield at volume flows below 3 L min
-1. Above this point, there is a significant decrease in CO
2 yield, with the sharpest decrease being observed between 3 to 5 L min
-1. A decrease in the yields of product of complete combustion suggests the burning behaviour becomes much less complete beyond this point, validating the aforementioned discussion.
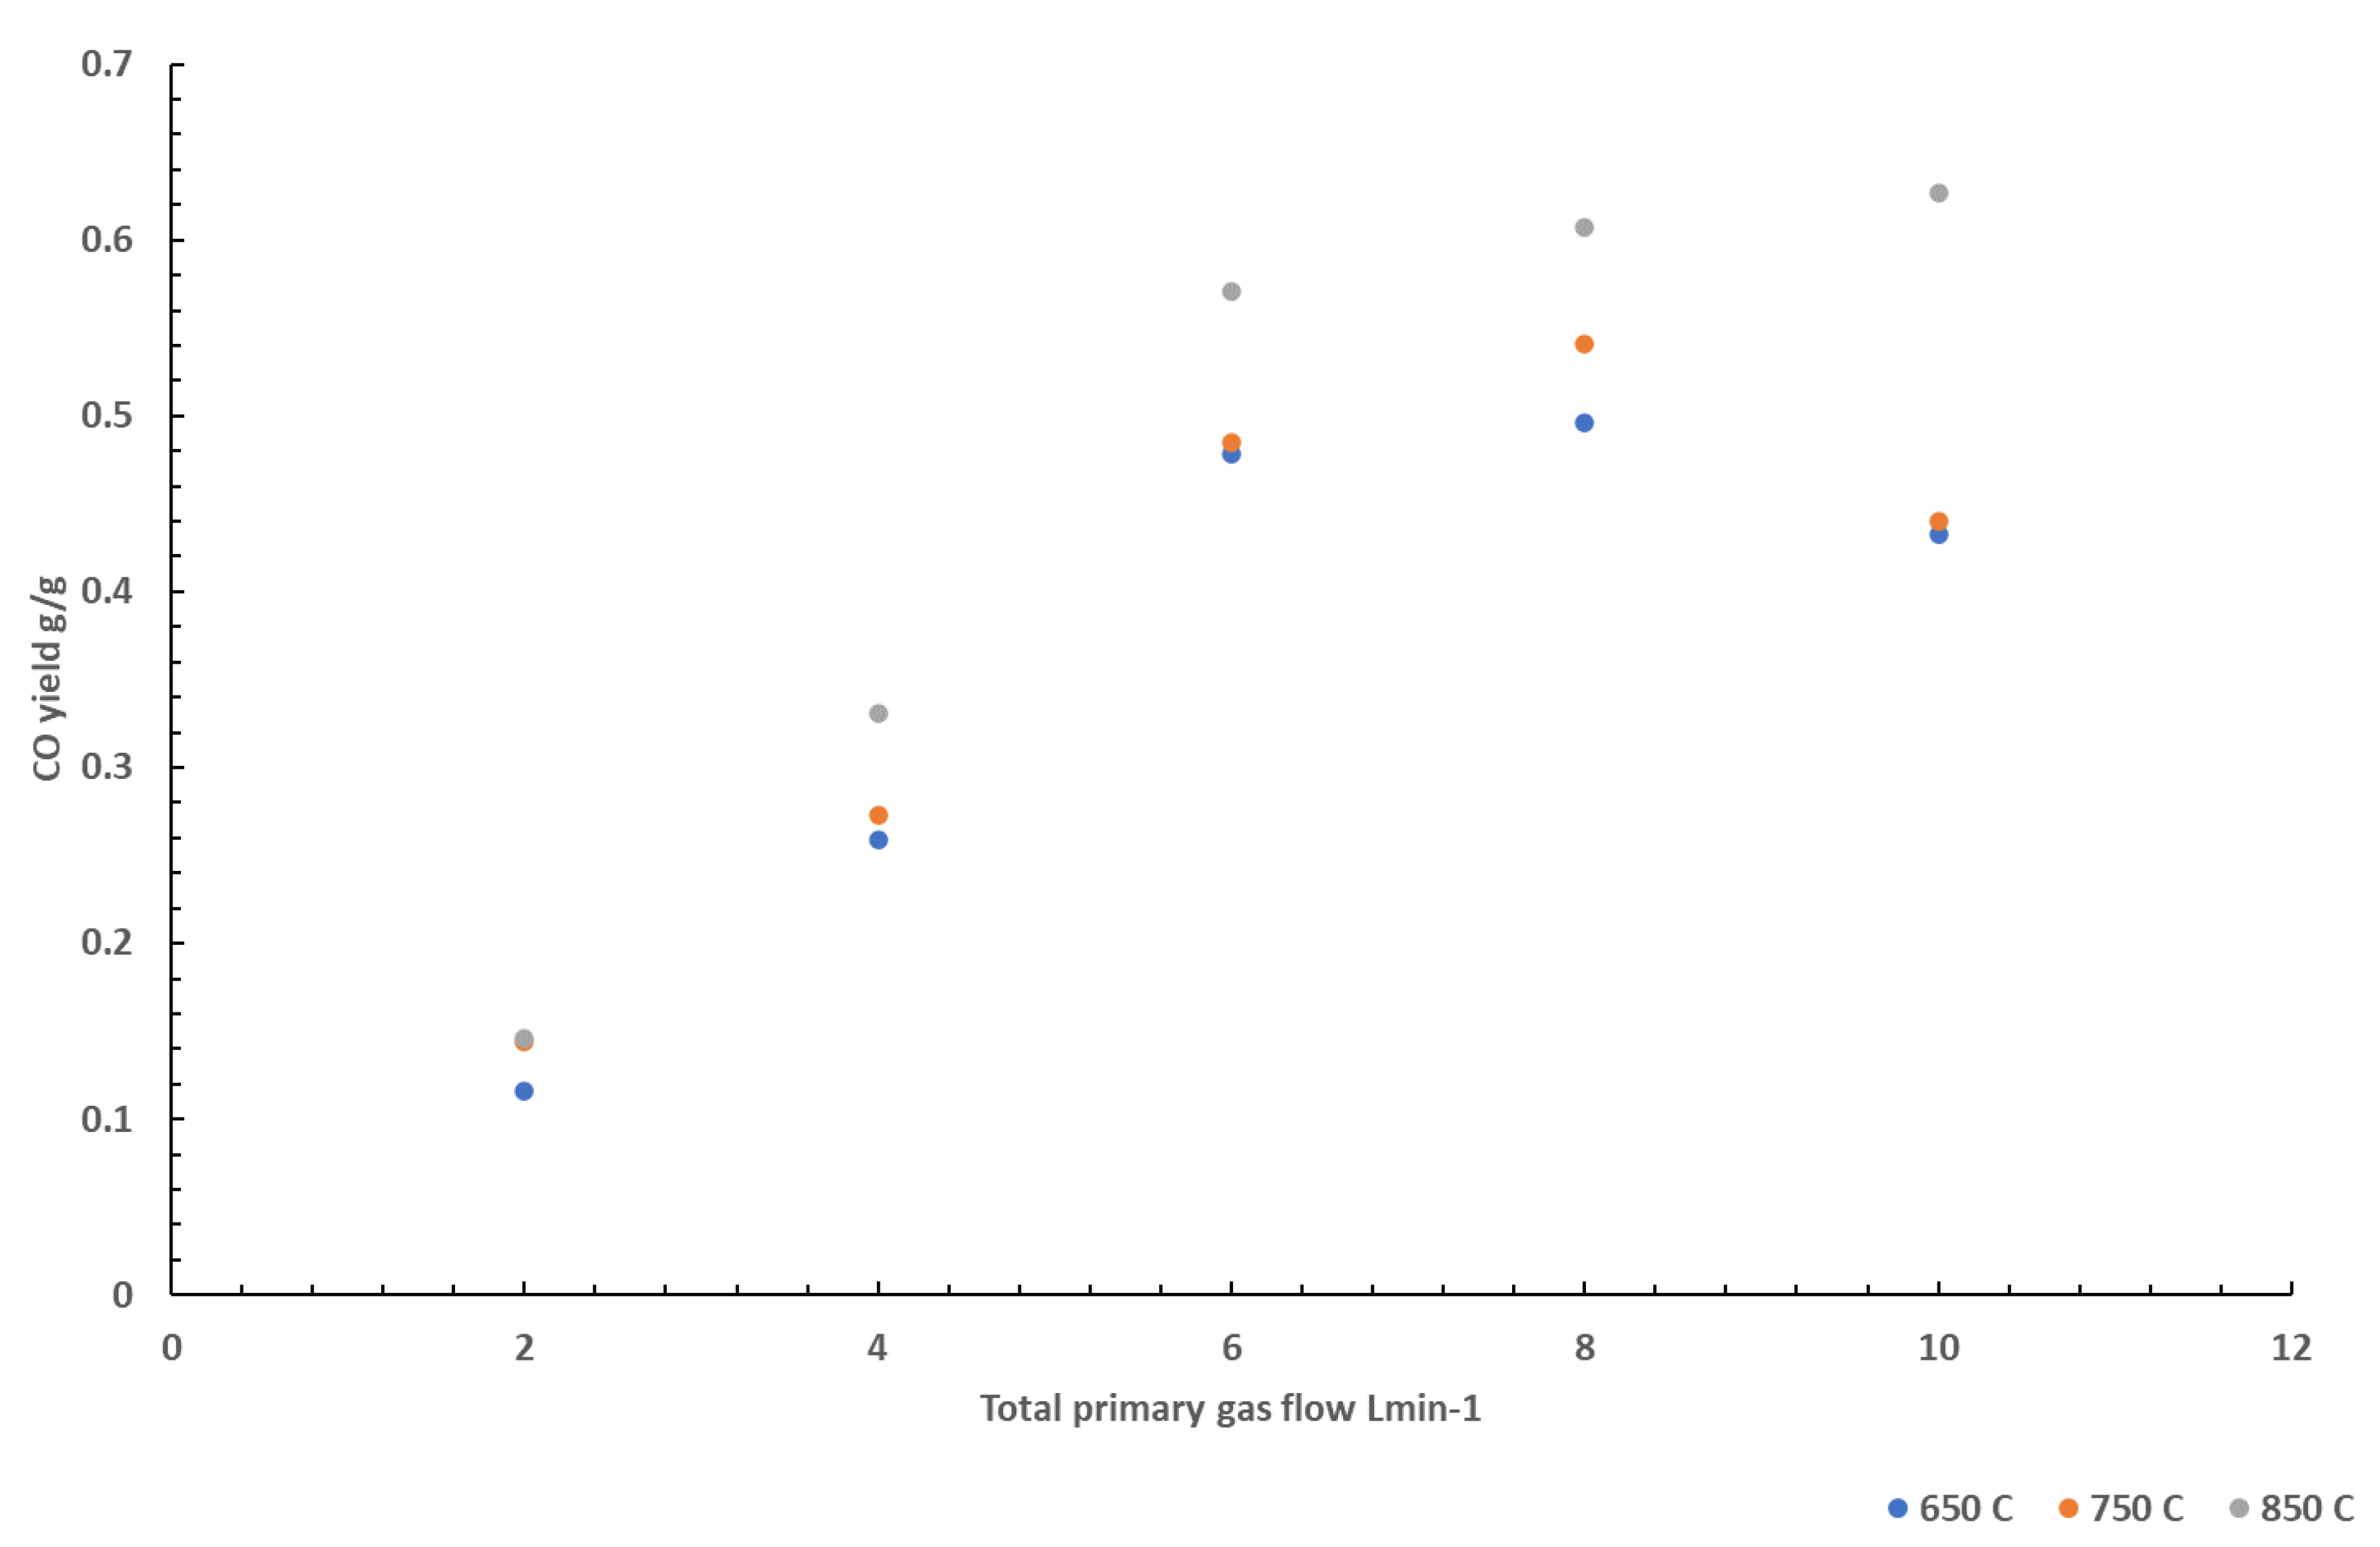
The effects of nitrogen on CO formation was also studied at 3 different temperatures using PA6.6. This is shown in
Figure 4. Similar to tests conducted on PA6, the CO yields increase as the volume flow increases. A sharper increase in CO yield is observed at 850 °C than at lower temperatures, suggesting the effects are more prominent at higher temperatures. This is evident at volume flows above 4 L min
-1 at 850 °C where the yield of CO continued to rise, unlike the CO yield measured at 750 and 650 °C. At higher temperatures, the formation of more radical species in the gas phase would be expected to be greater than that at lower temperatures. With little oxygen being available for the radical species to form products of complete combustion (CO
2), there would be an increase in CO yield. At higher temperatures, there would be more radical species present, and so it would be expected that more CO is formed than at lower temperatures resulting in the sharper increase observed.
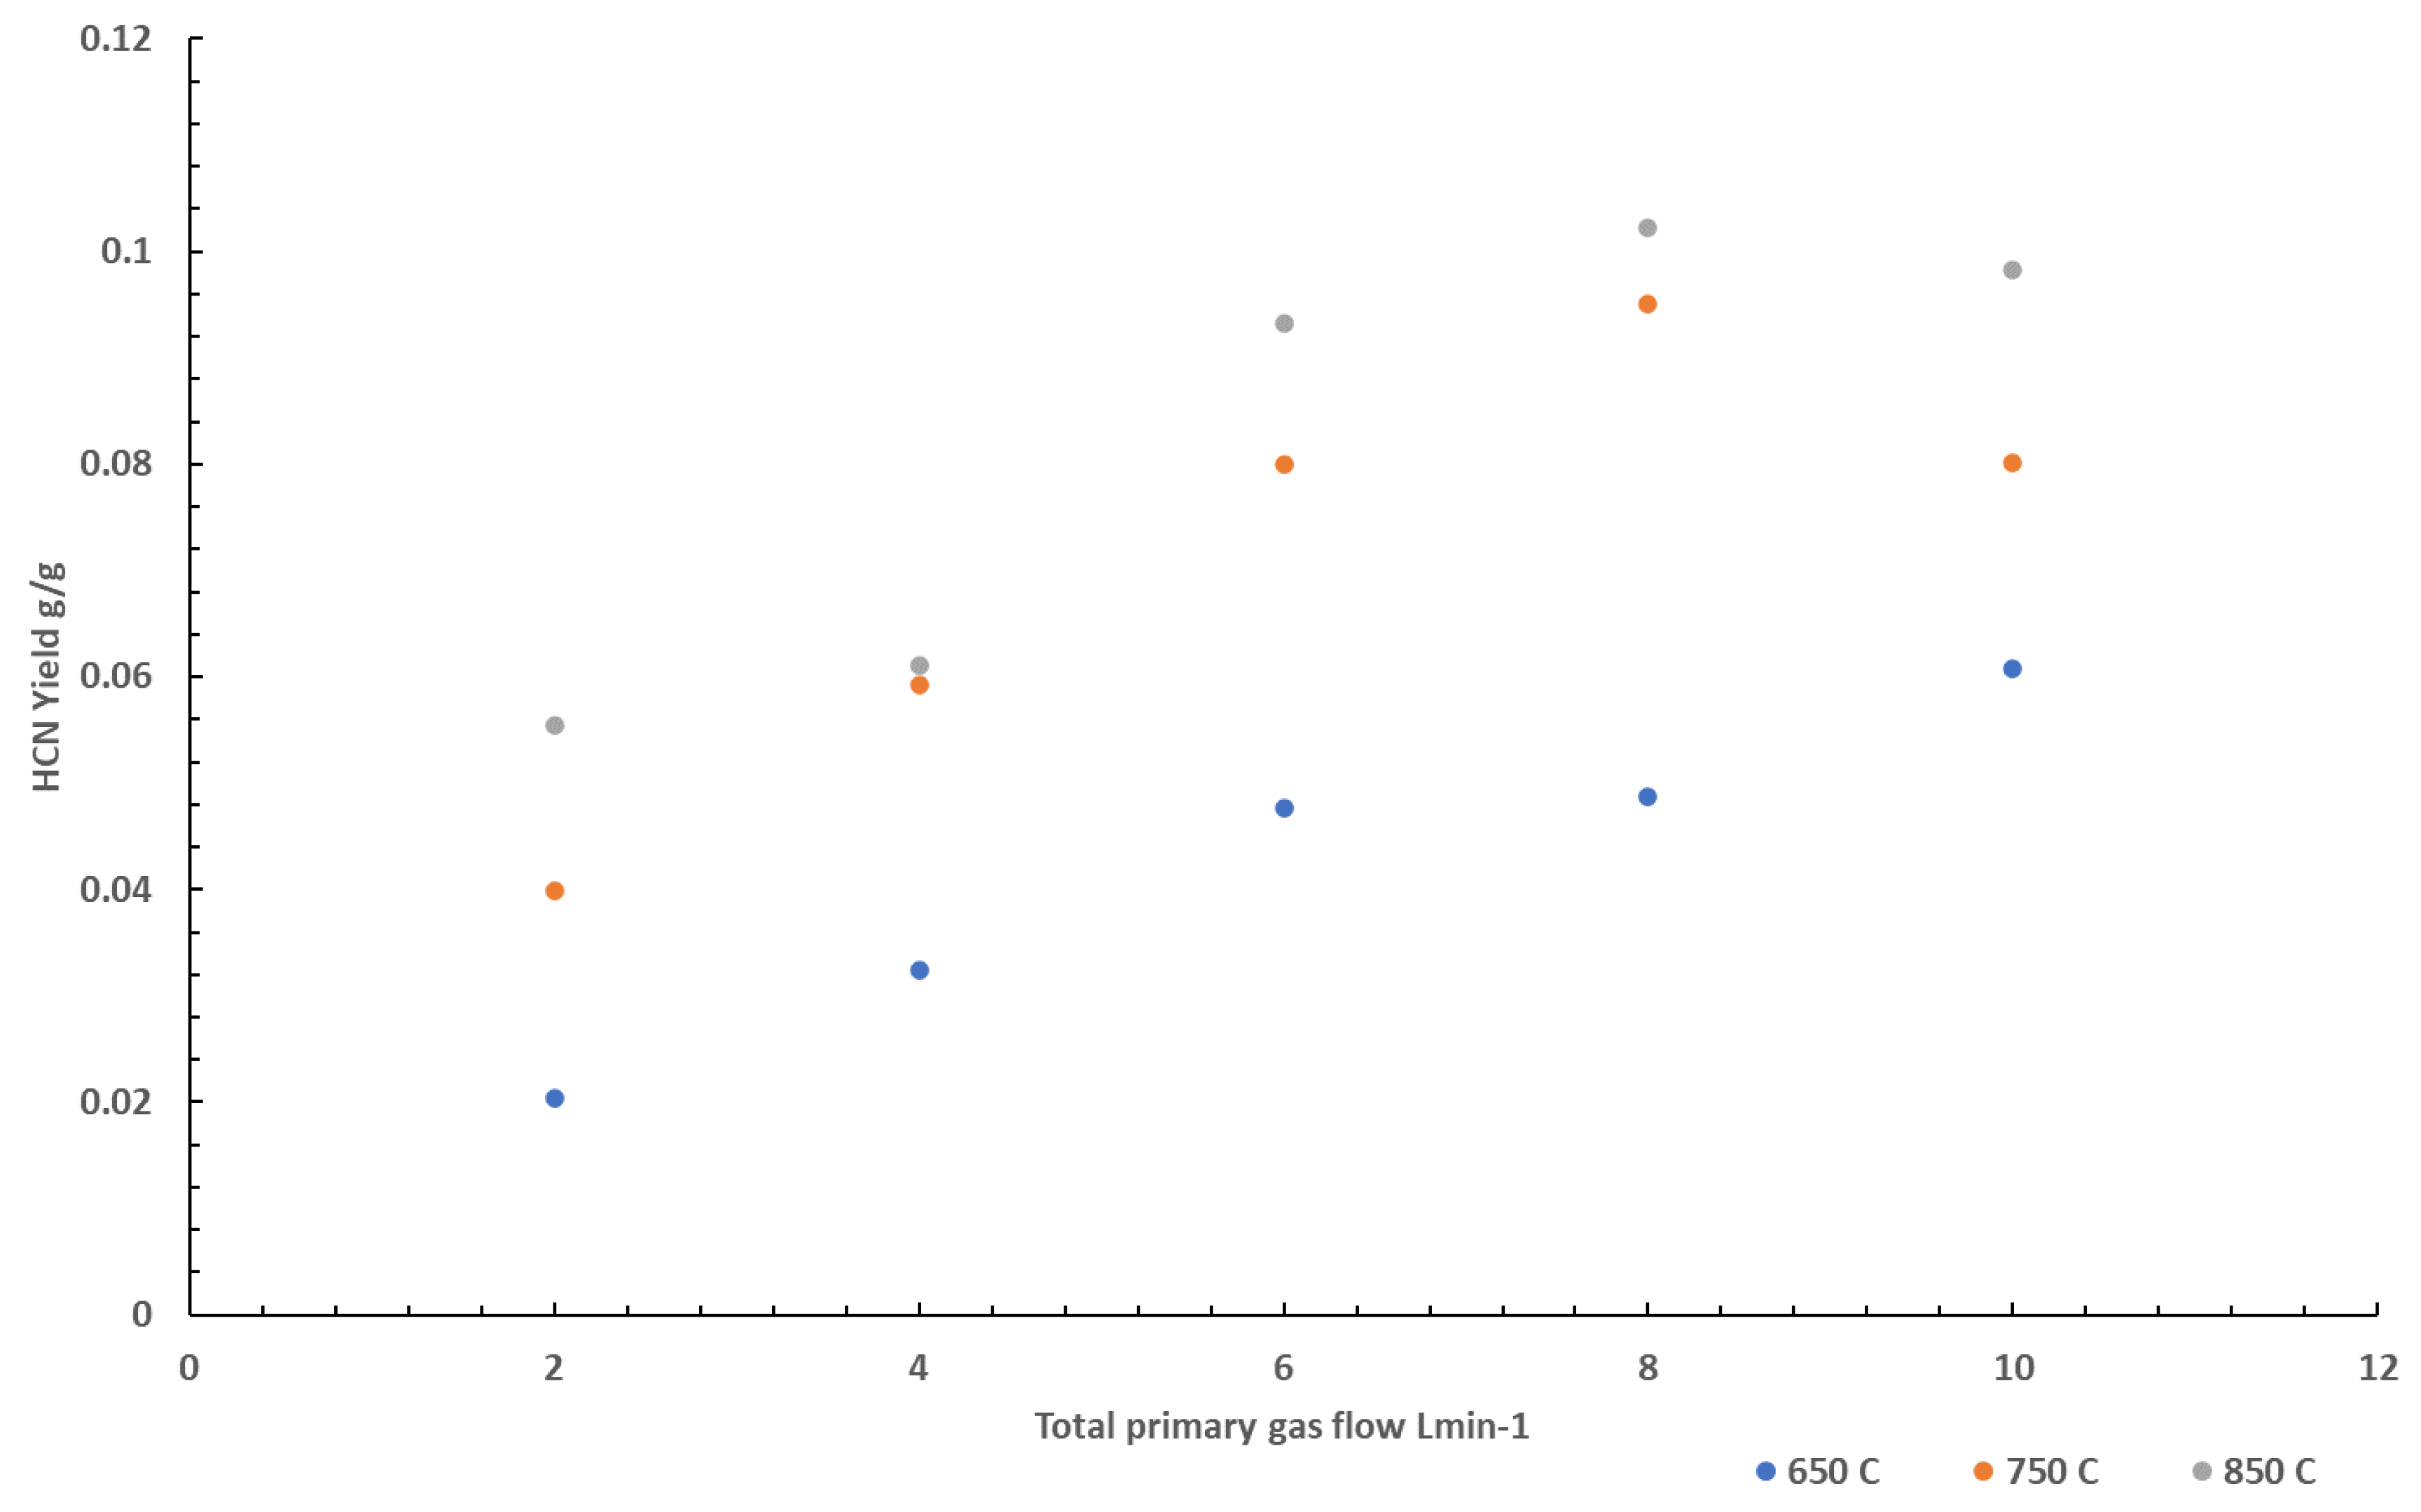
The effects of nitrogen on HCN formation was also studied at 3 different temperatures using PA 6.6. This is shown in
Figure 5. HCN yields varied with temperature, with higher temperatures yielding more HCN, similar to CO yields. The HCN yield was also found to vary with varying total gas flows, showing an increase in HCN as the oxygen concentration decreases, also similar to the experiments conducted using PA6 and observations to CO yields.
Although most HCN is formed through combustion of nitrogen containing molecules where there is a pre-existing C-N bond, the addition of nitrogen has been reported to have the potential to create new C-N bonds in the case where nitrogen radicals are present [
14]. At high temperatures, such as those tested in these experiments, atmospheric nitrogen is considered to be able to react with carbon contianing radicals (such as CH) to directly form HCN, as shown in reaction scheme (1) through (3)
5.
To identify whether the presence of atmospheric nitrogen in the combustion environment impacted the yields of HCN, tests were conducted using strips of PMMA. PMMA was chosen as a validation material as the material contains no nitrogen in its chemical structure, meaning any HCN formation and changes to HCN measurements would be a direct result of the nitrogen present in the combustion environment. All tests conducted were carried out using the calculated primary air-flow required to produce an equivalence ratio of 1.5, representative of under-ventilated combustion. Tests were conducted at 2 different temperatures using 4 different total flow rates.
All HCN measurements on the tests conducted were below the limits of detection. This suggests that while the addition of nitrogen can impact the combustion conditions resulting in less complete combustion, the presence of nitrogen is unable to impact the chemistry of the effluent. As the addition of nitrogen did not result in measurable yields of HCN in non-nitrogen containing materials, the results observed in these experiments are deemed to be a result of the additional gas flow causing alterations to the time gaseous species spend in the reaction zone during combustion, resulting in less-complete combustion occurring.
