Submitted:
18 November 2023
Posted:
20 November 2023
You are already at the latest version
Abstract
Keywords:
1. Introduction
2. Scenario of Interference Source Moving along the Satellite Trajectory
2.1. LEO Satellite Downlink Scenario and J/S Ratio Calculation
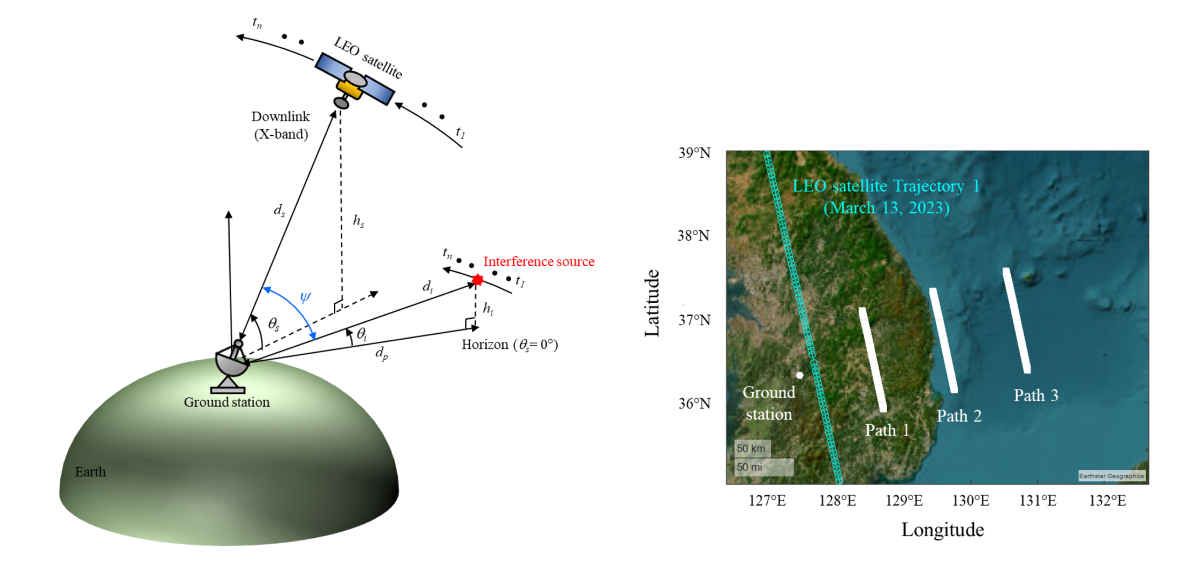
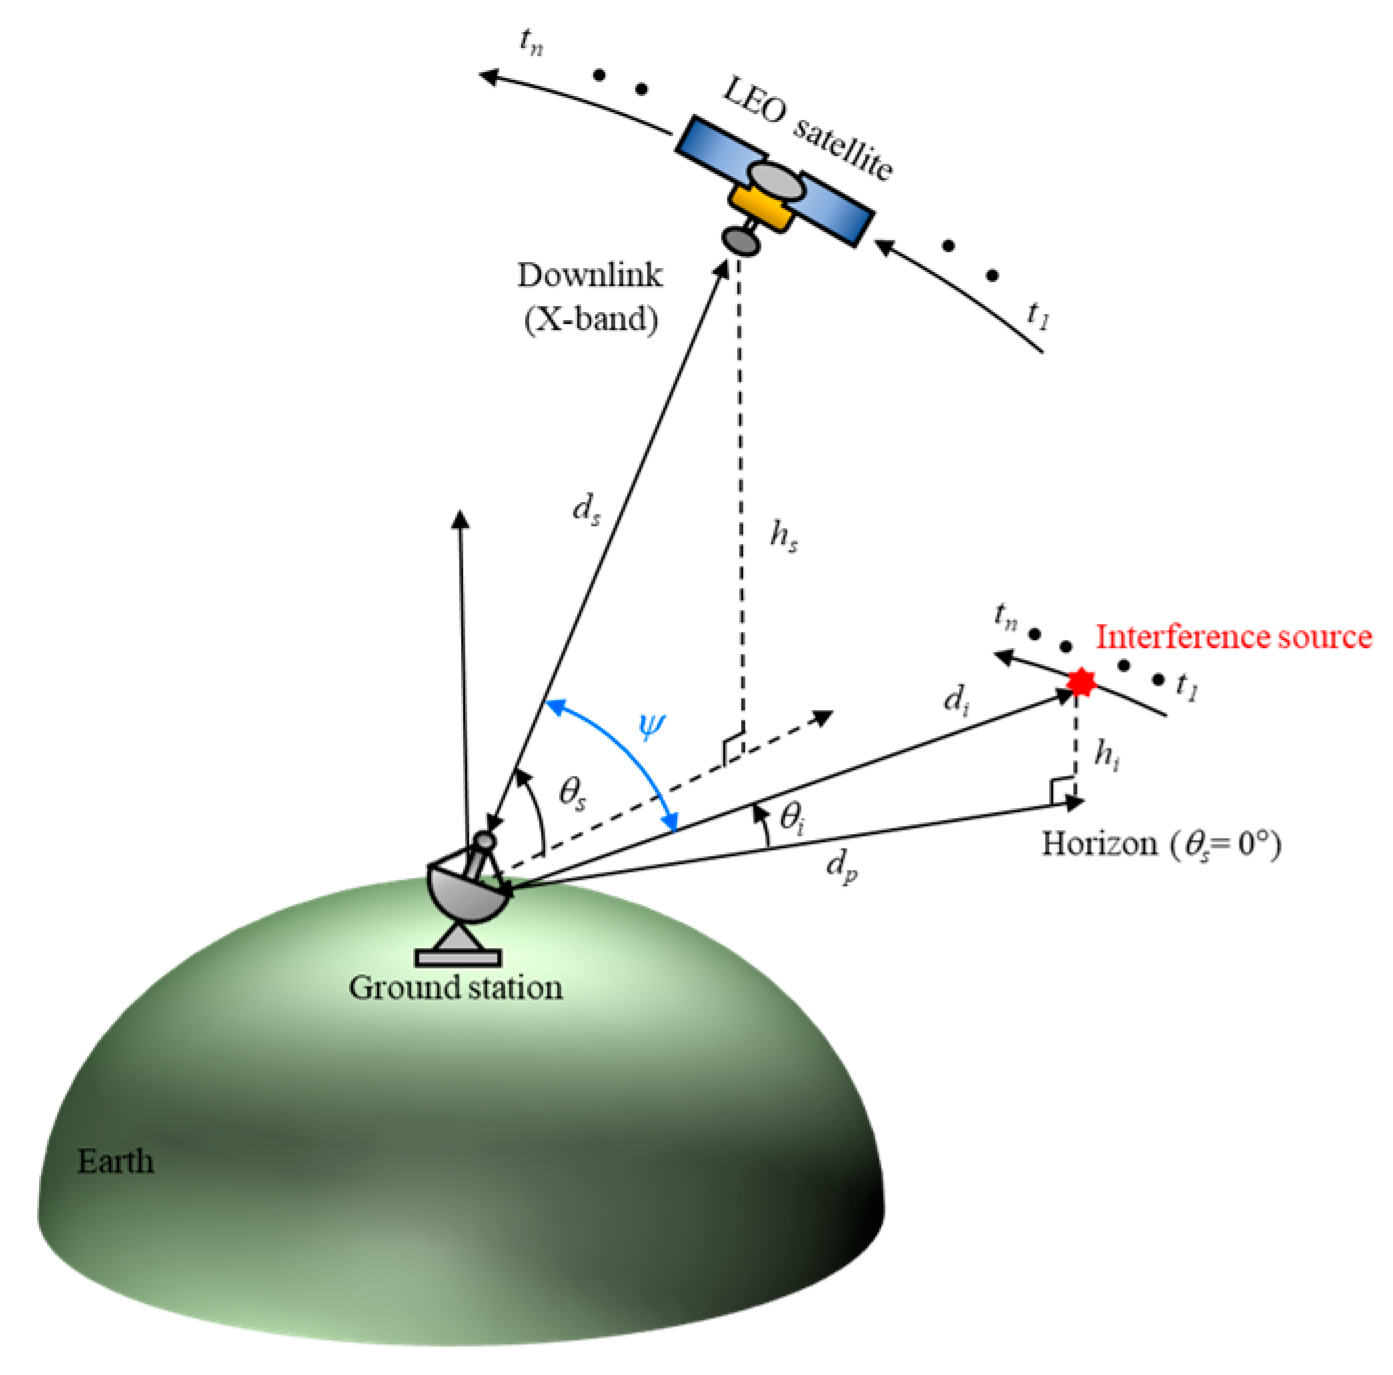
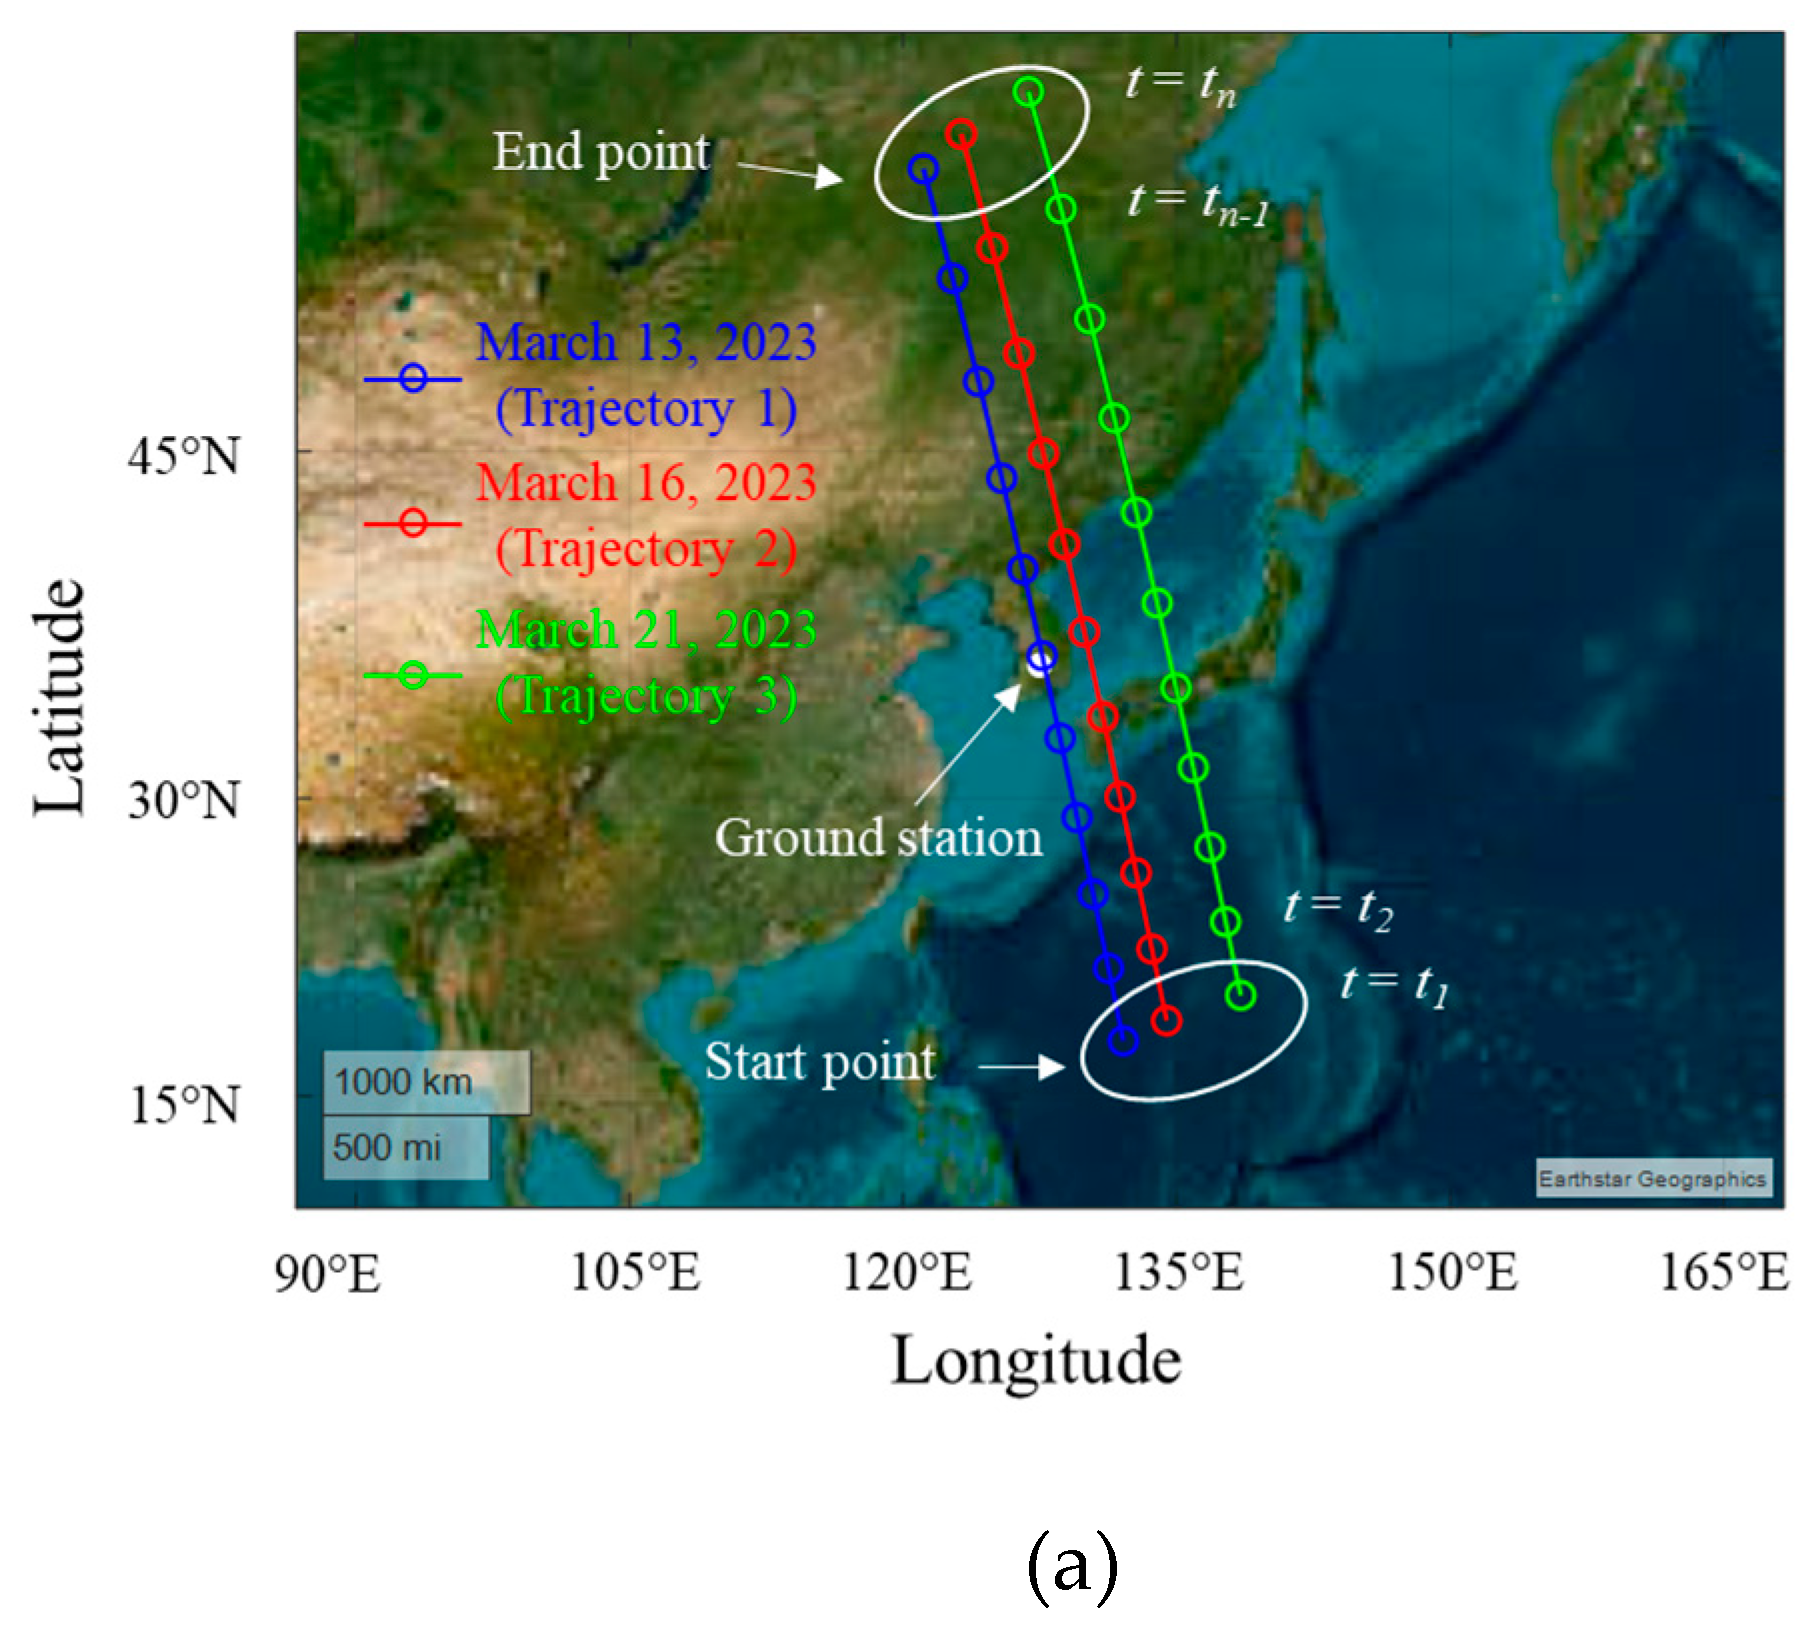
 s is the elevation angle between the LEO satellite and the Earth’s surface, and ds is the slant distance from the ground station to the satellite. As the satellite transmits image data to the ground station, the airborne interference source moves parallel to the trajectory of the LEO satellite at a distance dp from the ground station. The elevation angle between the interference source and the Earth’s surface is
  i, and the slant distance to the interference source is di. The satellite transmits image data between t1 and tn to the ground station located at a specific latitude and longitude on the Earth’ surface. The ideal data communication time is about 600 seconds, during which the relative angle difference between the LEO satellite and the airborne interference source is
  . To analyze the link budget under these conditions, the J/S ratio can be calculated using Equation (1)
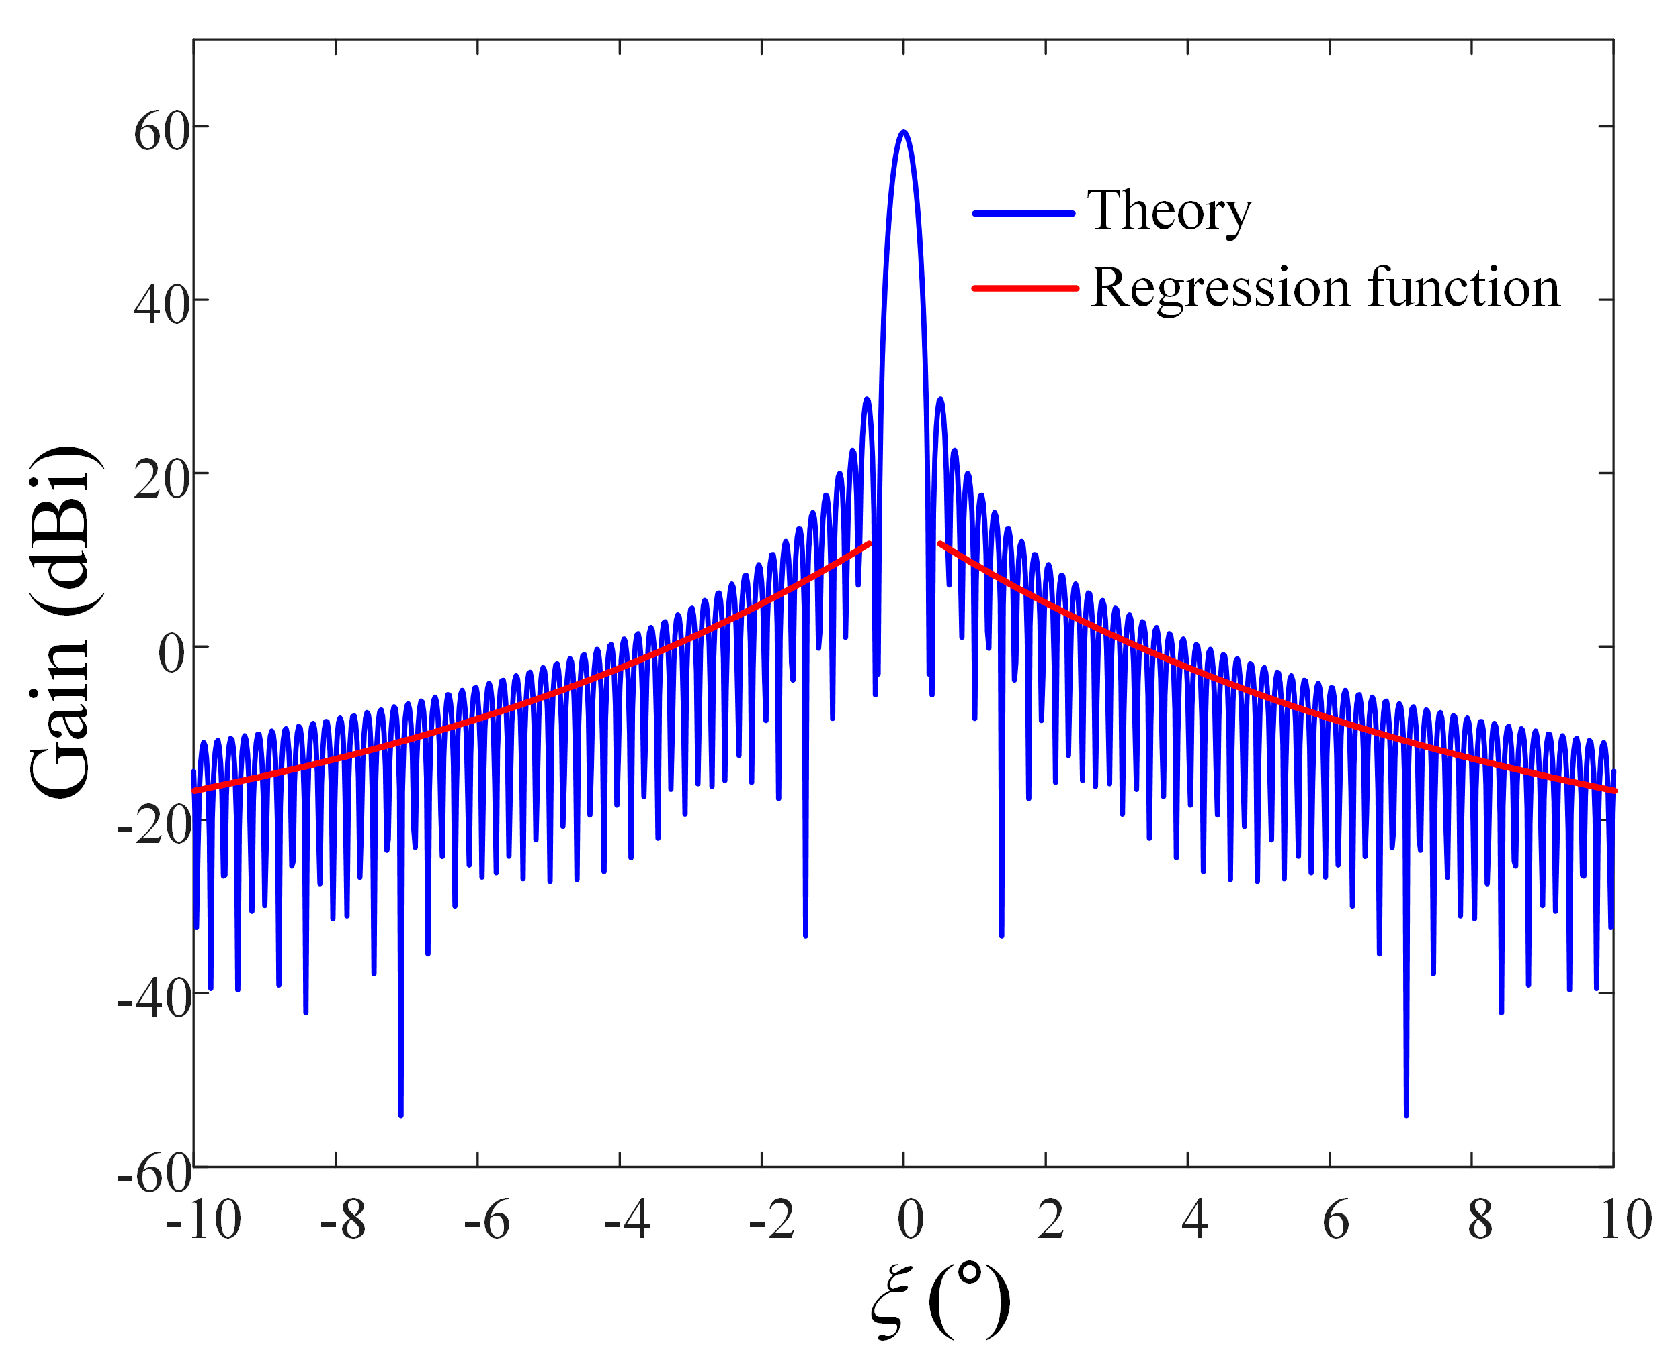
 ) is the sidelobe gain of the ground station antenna to the direction where the ground station is exposed to strong EM interference waves incoming. Li is the path loss from the airborne interference source to the ground station.
2.2. Derivation of Relative Angle Difference  with Sidelobe Gain
 is defined.
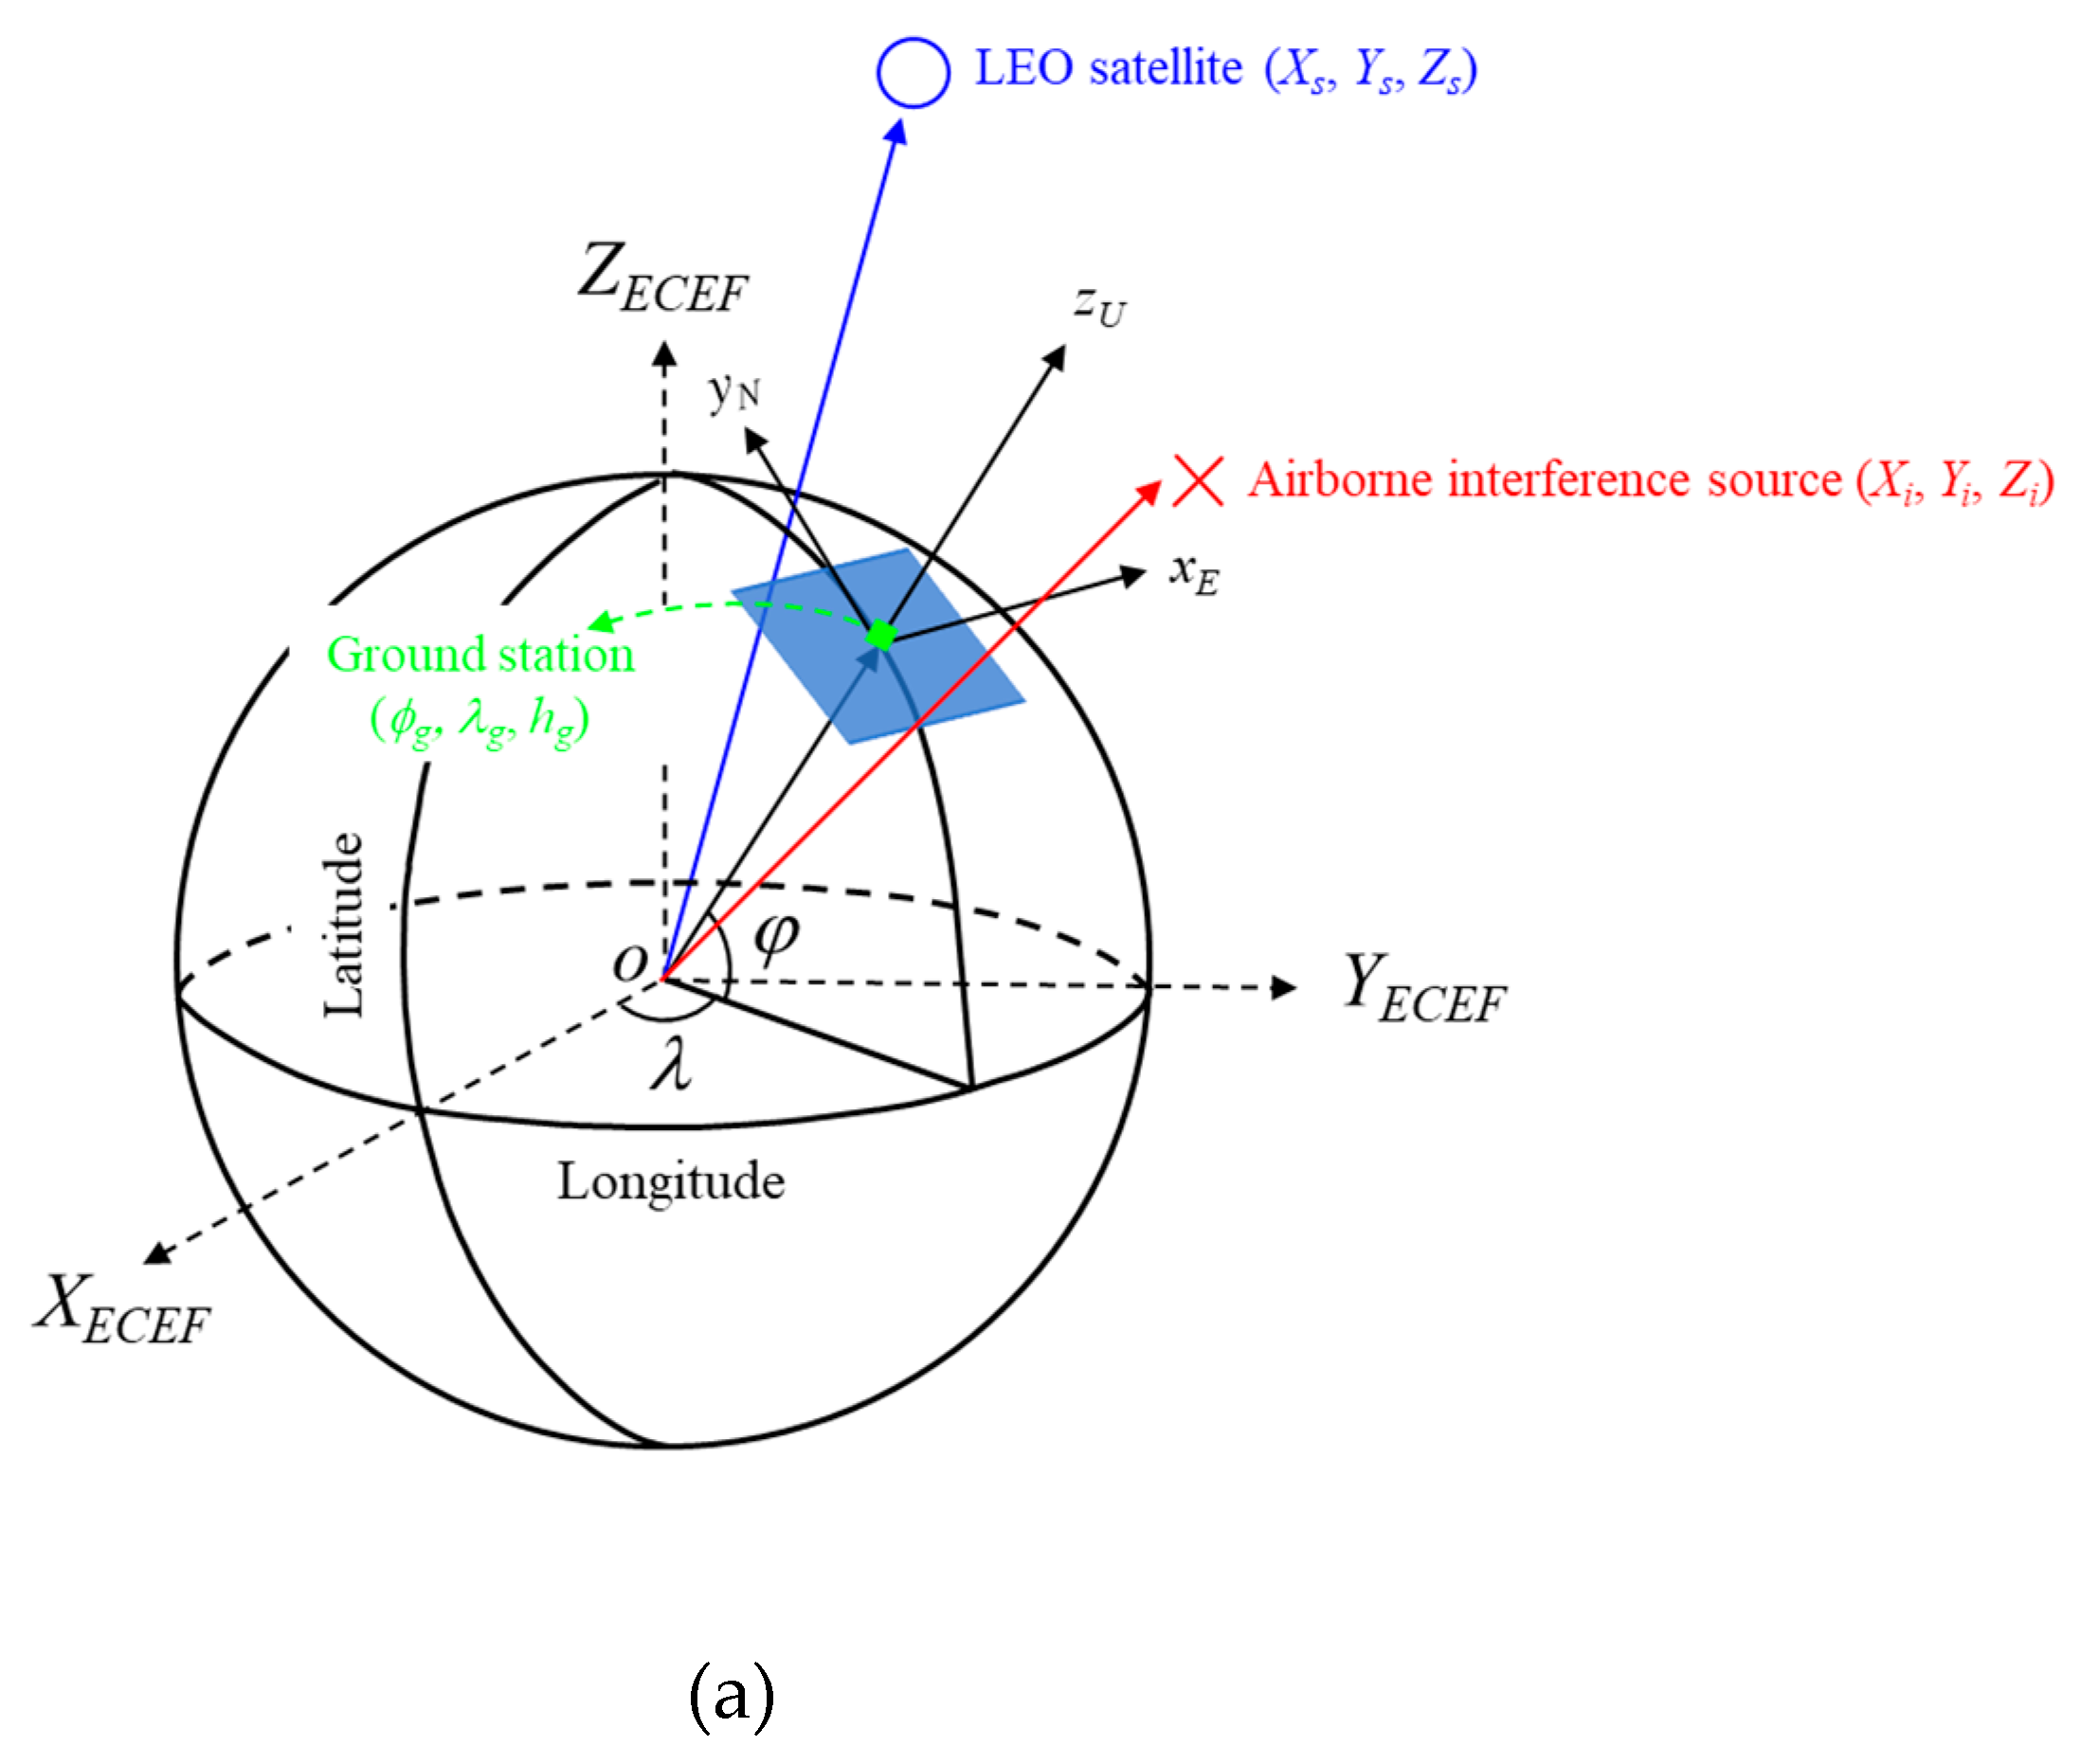
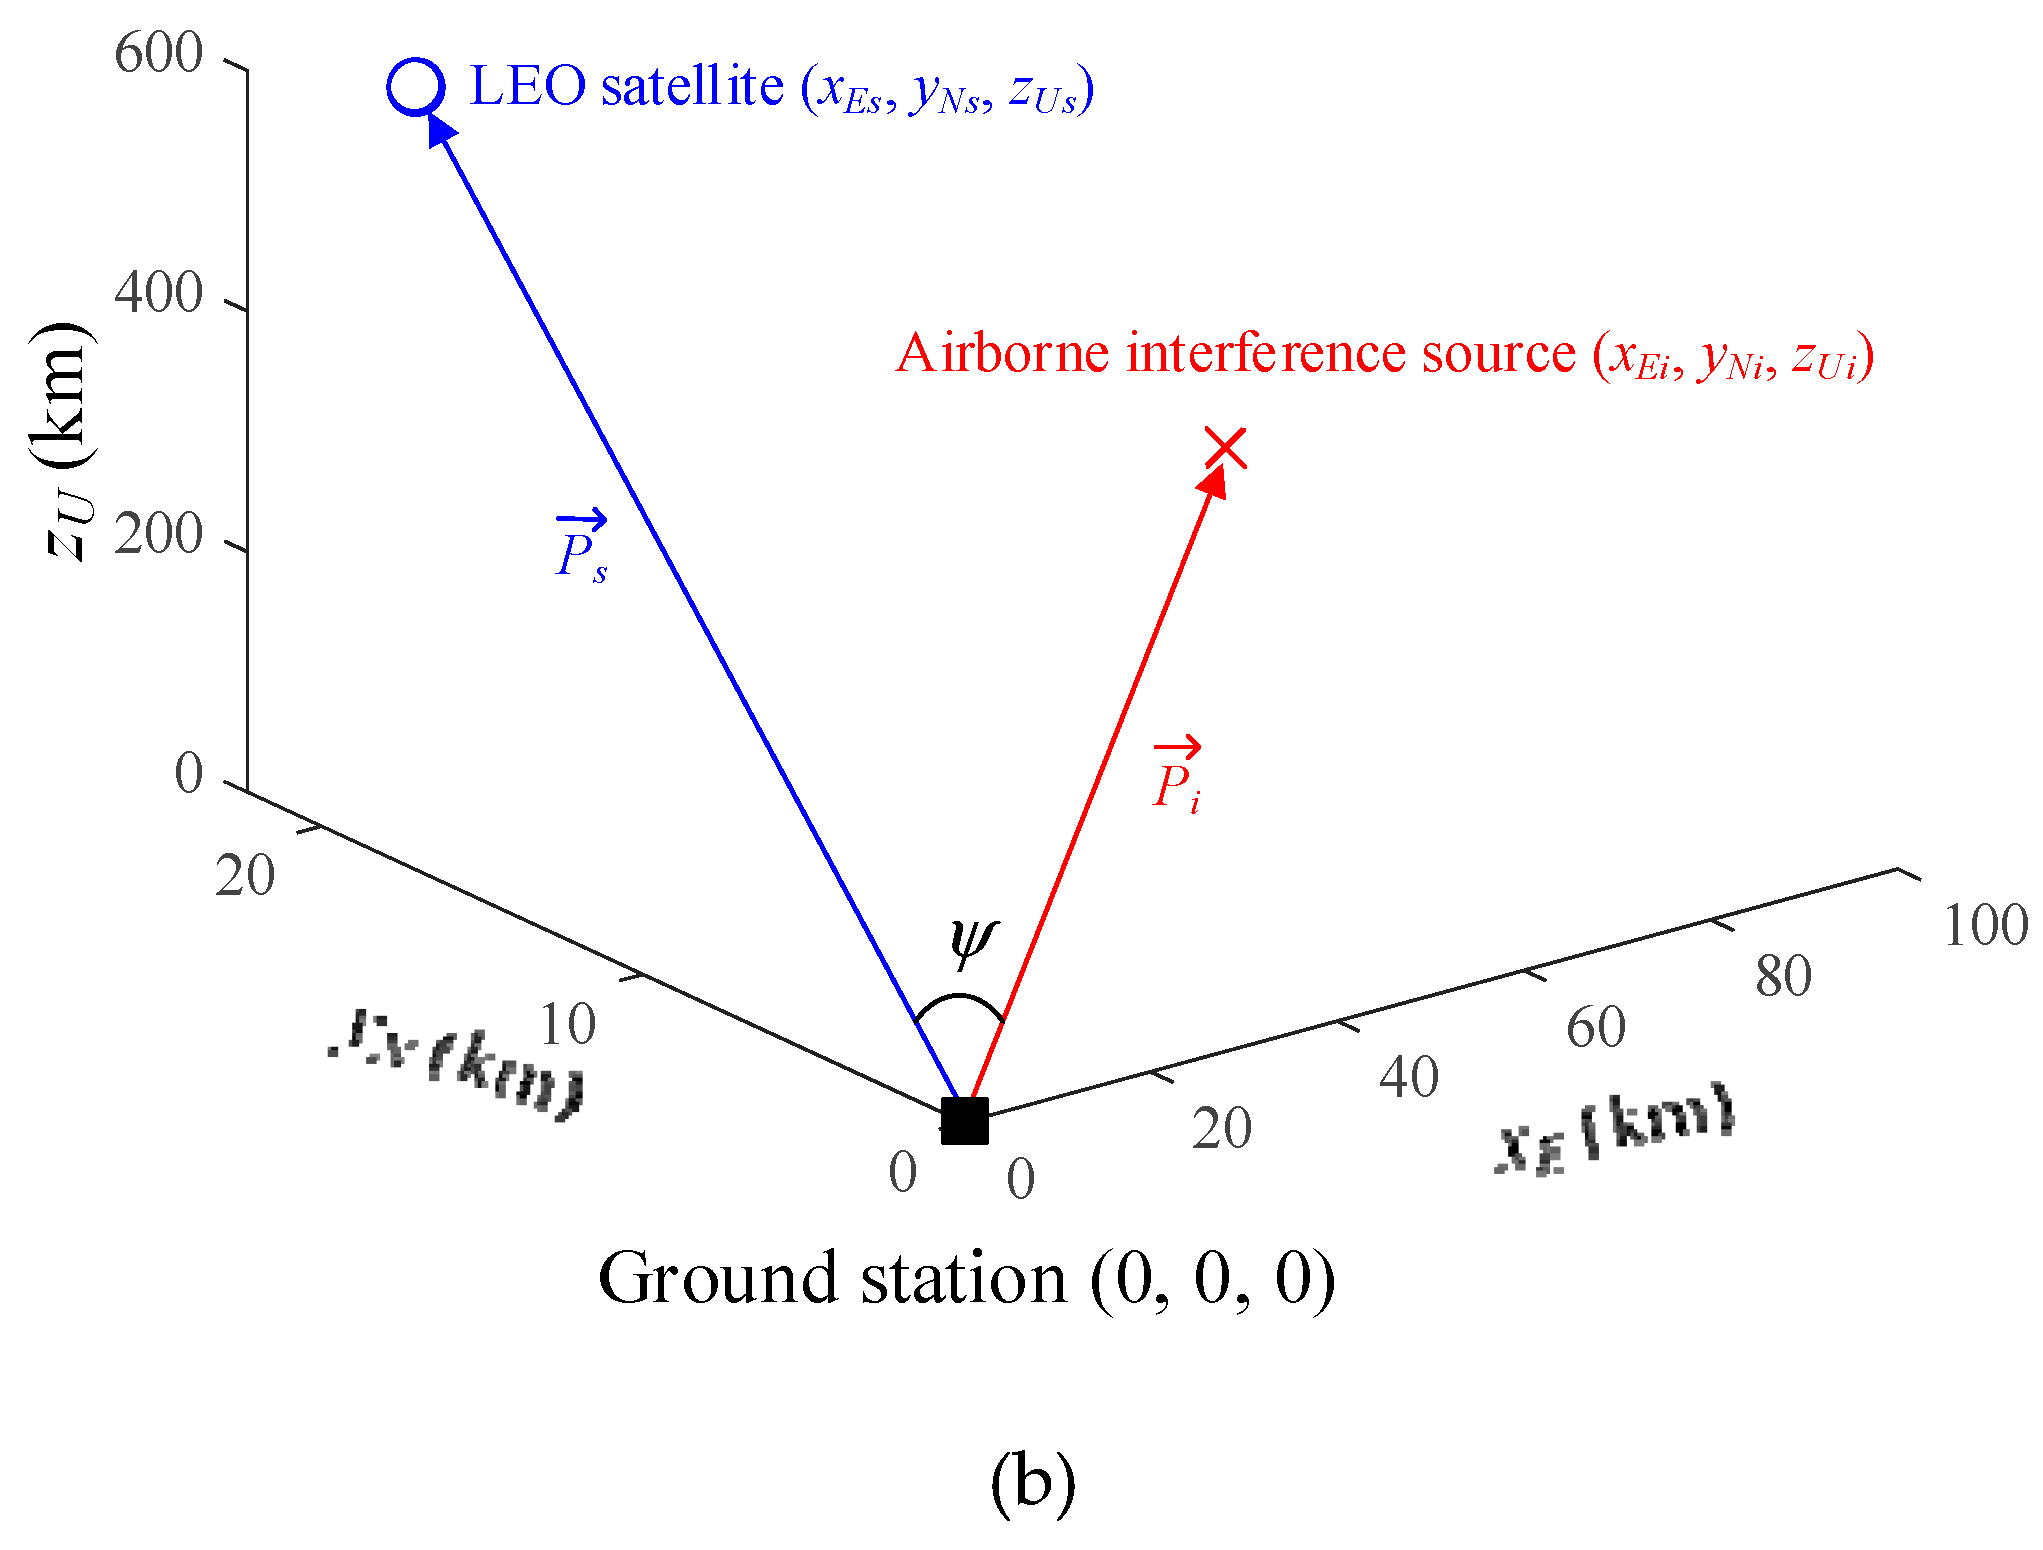
  is the angle between the LEO satellite and the airborne interference source when the ground station antenna is set as the origin of the coordinate system. Latitude, longitude, and altitude coordinates are generally referred to using WGS84. For example, the latitude
  g, longitude
  g, and altitude hg of the ground station according to WGS84 are indicated by the green square marker in Figure 2(a). To calculate the relative angle difference
  , the WGS84 coordinates of the LEO satellite, ground station, and airborne interference source are converted into ENU coordinates. The ENU system uses Cartesian coordinates relative to a specific Earth location as its origin. Here the location of the ground station is the origin for the ENU system. Converting coordinates from WGS84 to ENU requires two steps: conversion from WGS84 to Earth-centered Earth-fixed (ECEF) and then conversion from ECEF to ENU. To convert to the ECEF coordinate system, the Earth's radius R is calculated at latitude
  by Equation (3a), where a (= 6378.137 km for WGS84) is the ellipsoidal equatorial radius and e is the eccentricity of the ellipsoid (e2 = 0.00669437999 for WGS84). The ECEF system has the center of the Earth as the origin (0, 0, 0), which allows us to calculate XECEF, YECEF, and ZECEF from latitude
  , longitude
  , and altitude h using Equations (3b) to (3d):


 can be derived by calculating the dot product of the two vectors using equation (4c).


 obtained from Equation (4c) to Equation (5). Detailed parameters for the downlink interference scenarios are given in Table 1.
3. Analysis of the LEO Satellite Downlinks in Interference Situations
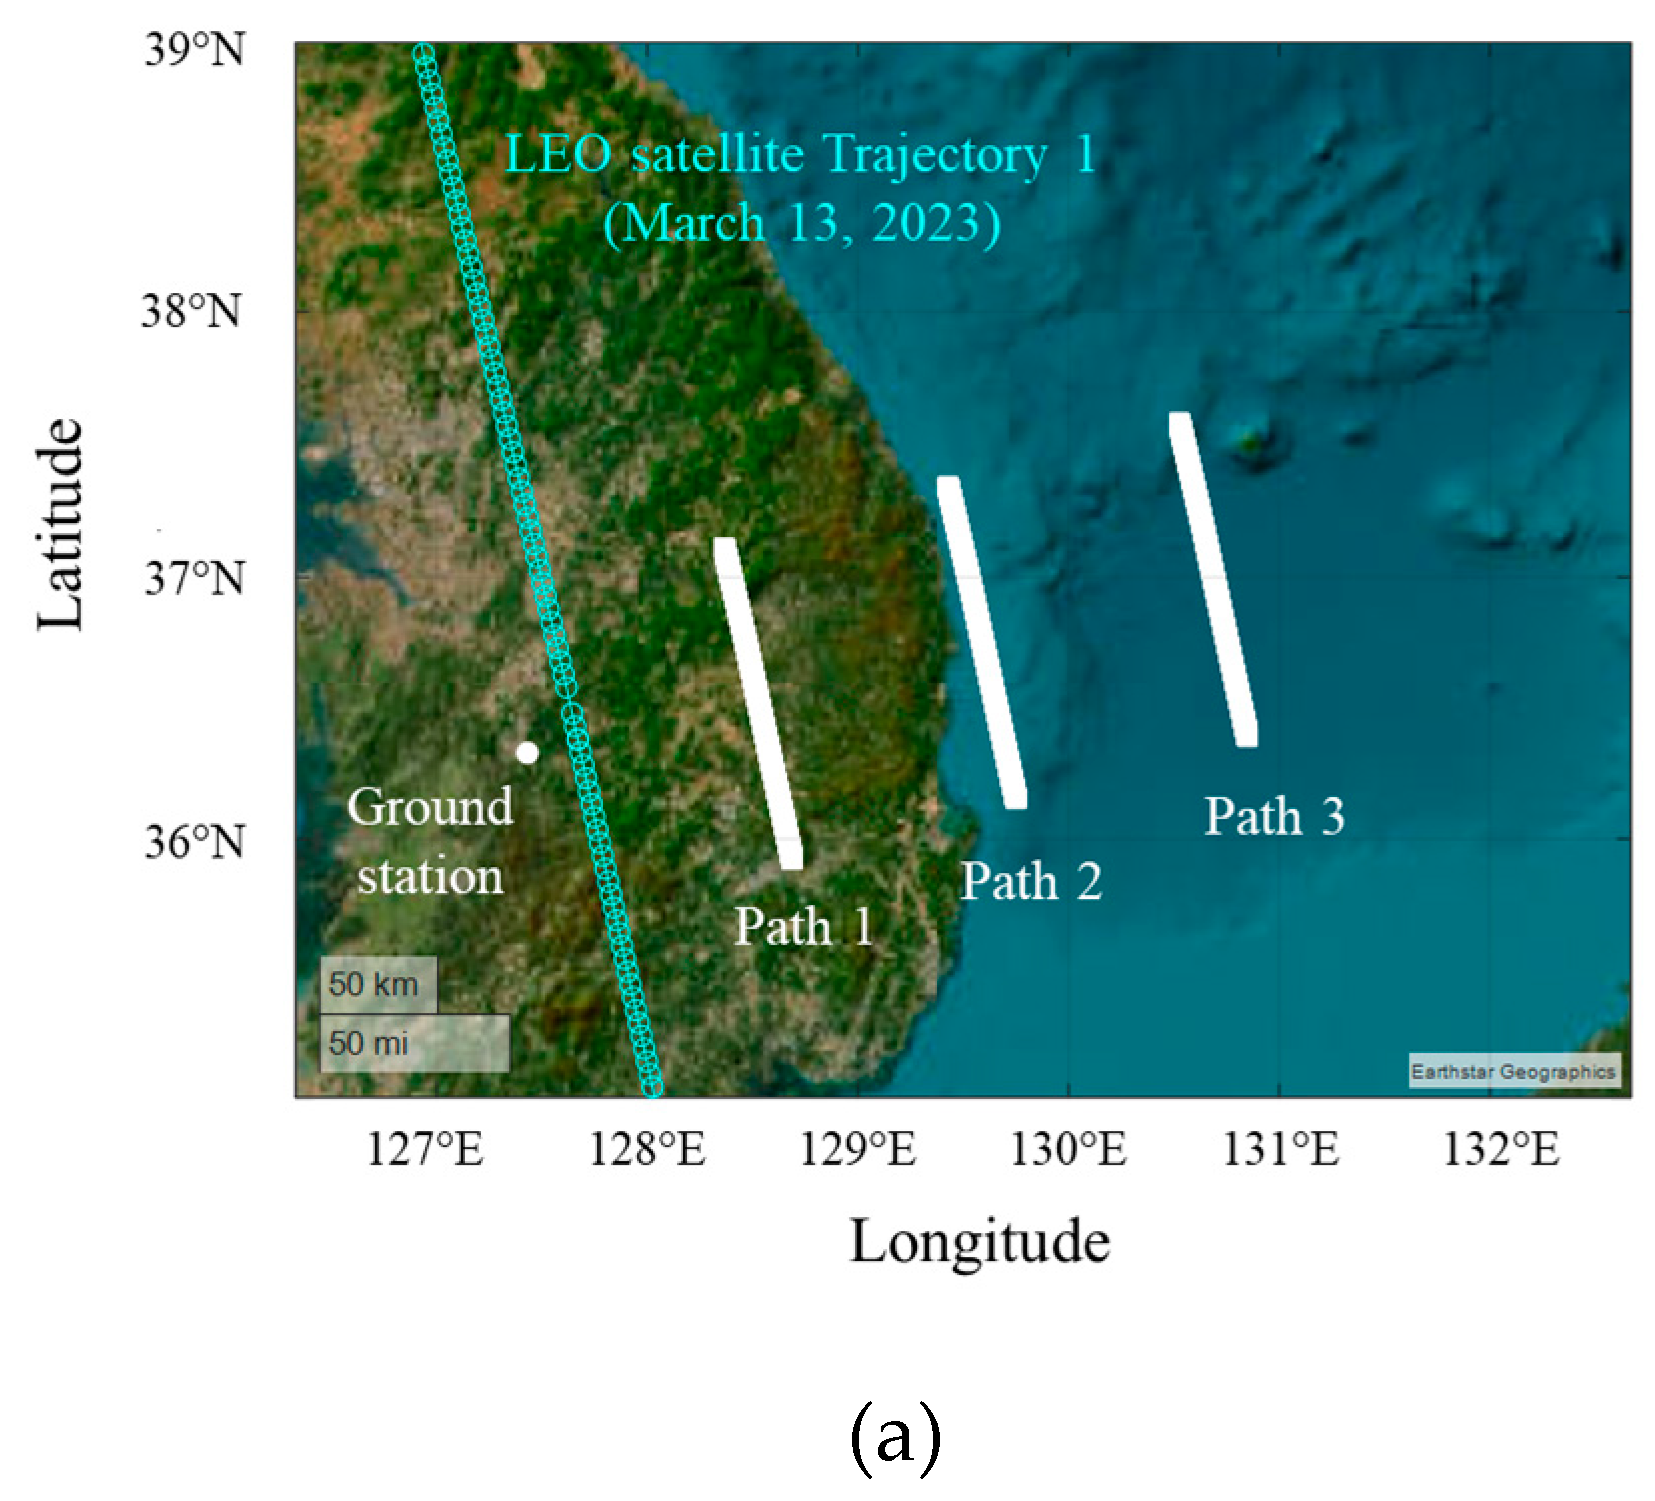
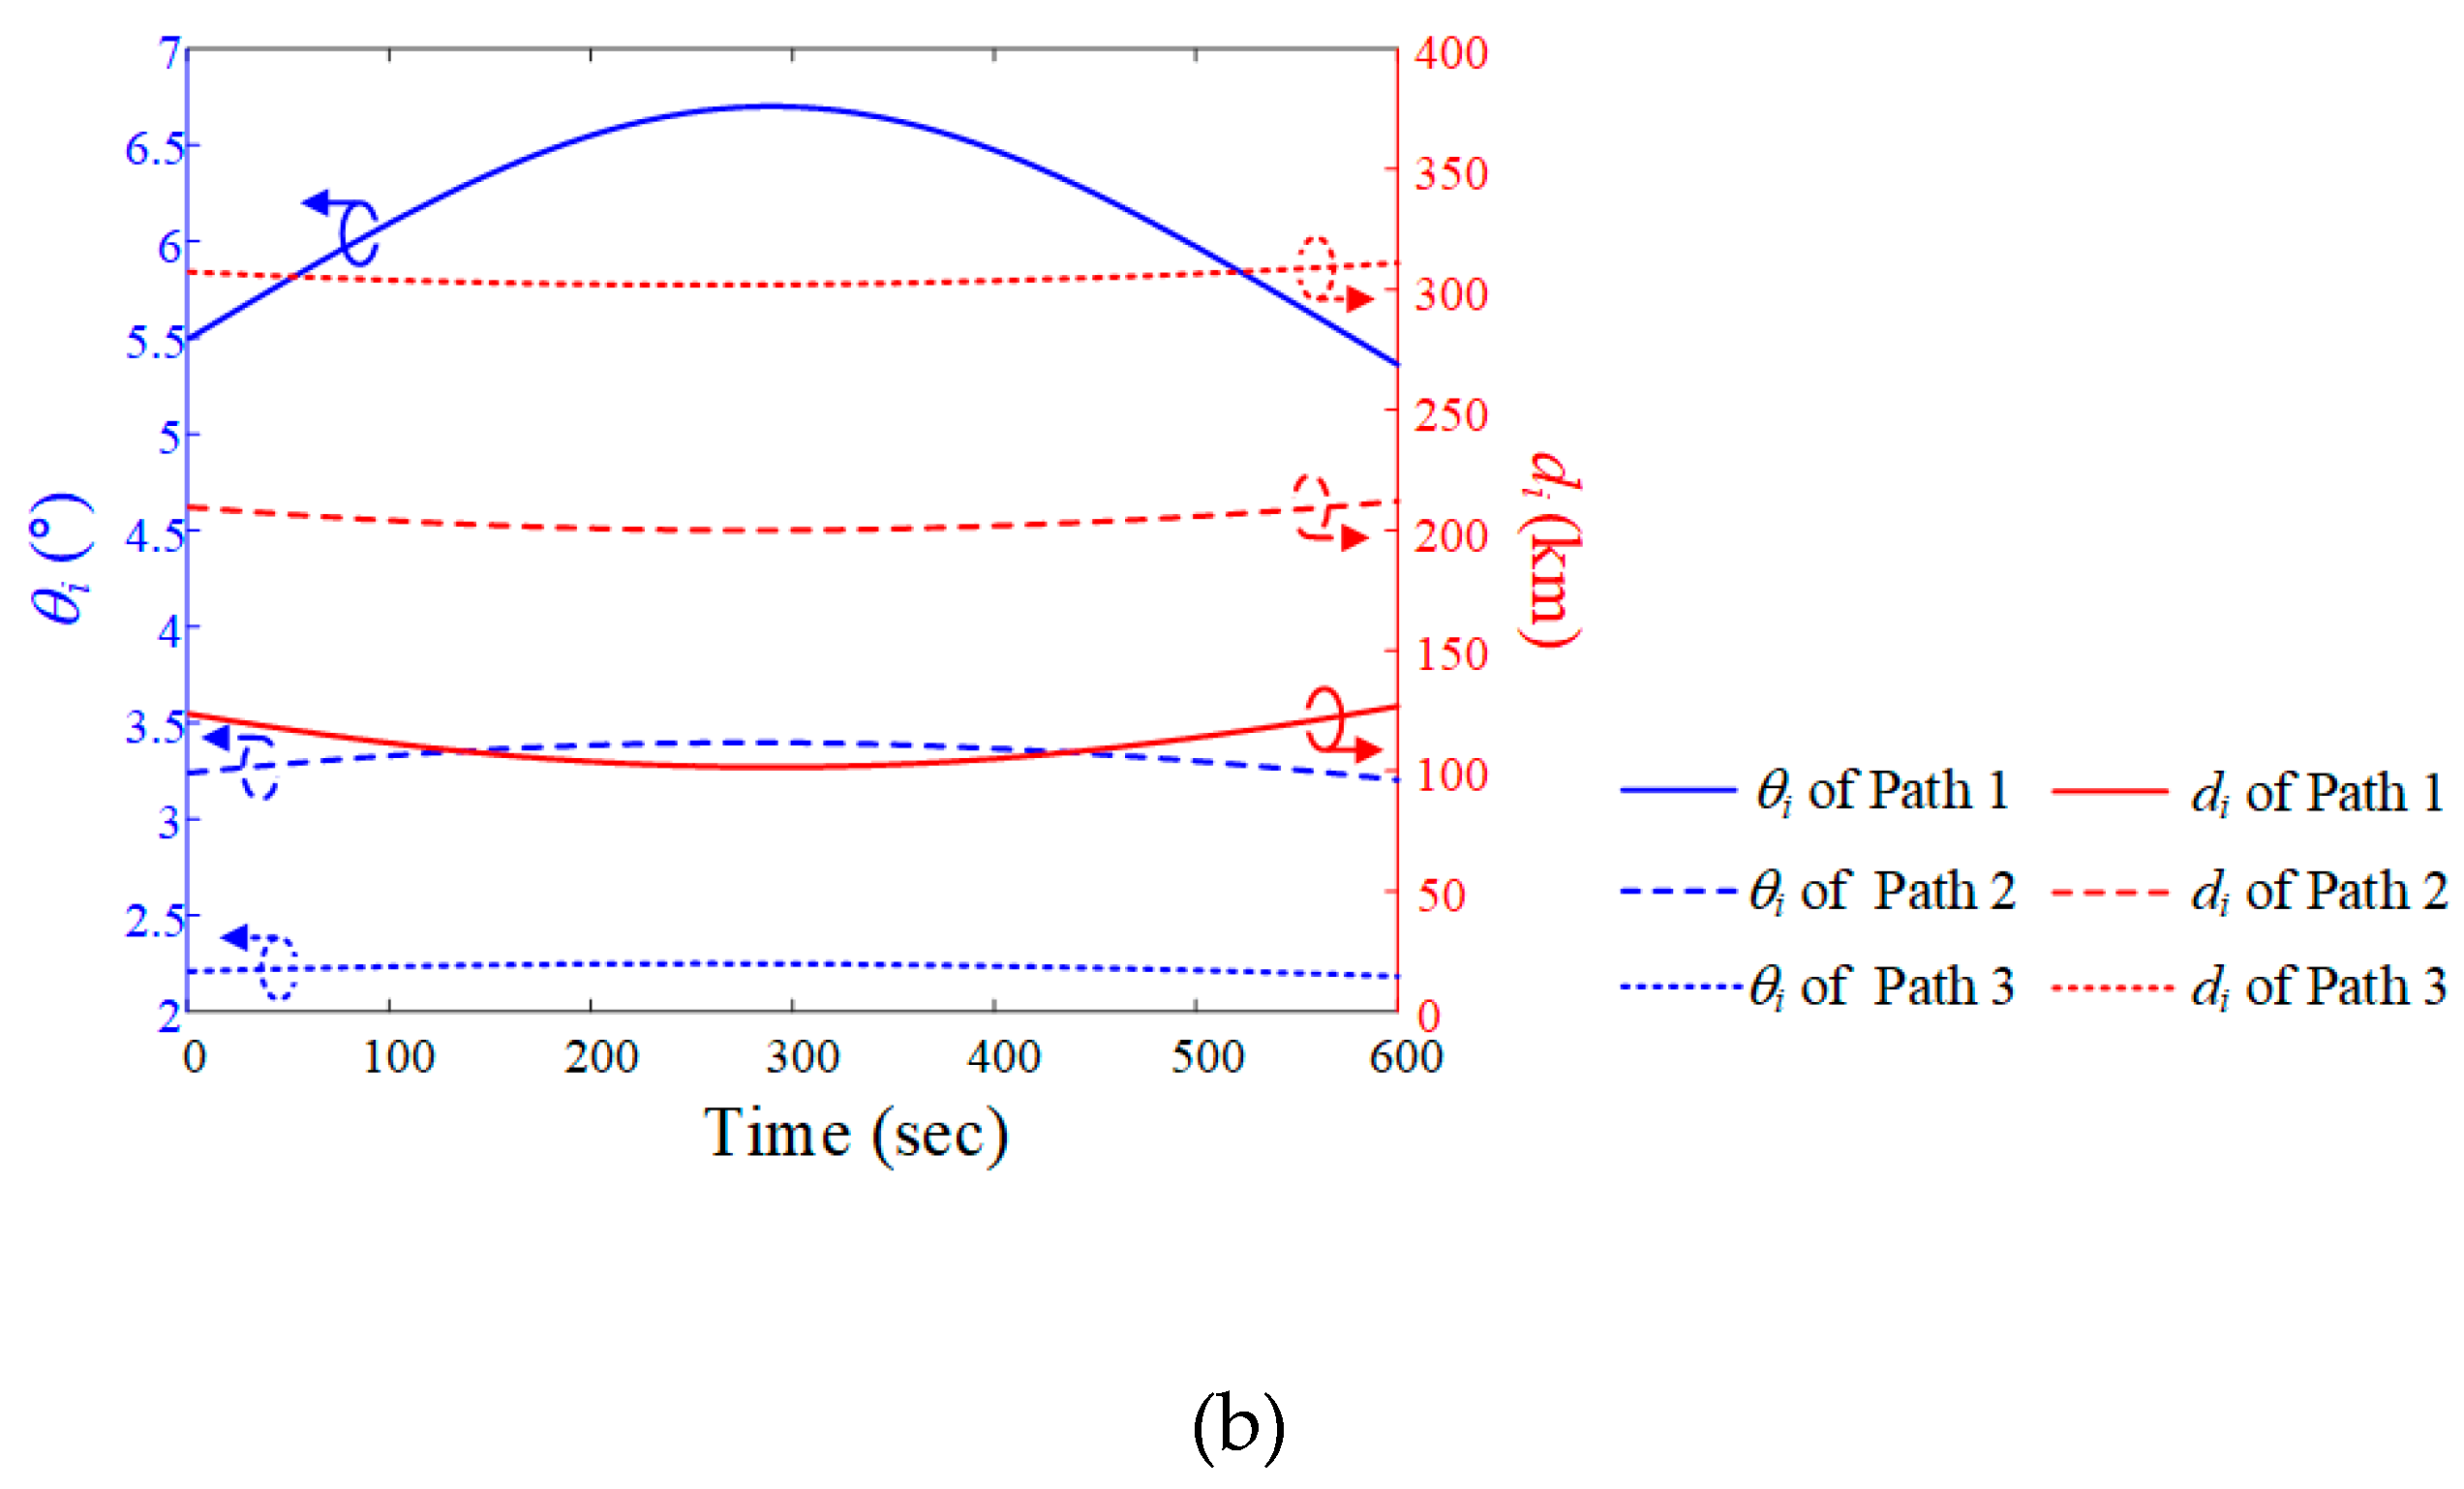
 i and slant distance di are derived using ENU coordinates, with the ground station as the origin location. When the altitude of the interference source is fixed at 12 km, the maximum elevation angles are 6.7° (Path 1), 3.4° (Path 2), and 2.2° (Path 3). The minimum slant distances are 101.6 km (Path 1), 201.7 km (Path 2), and 301.9 km (Path 3).
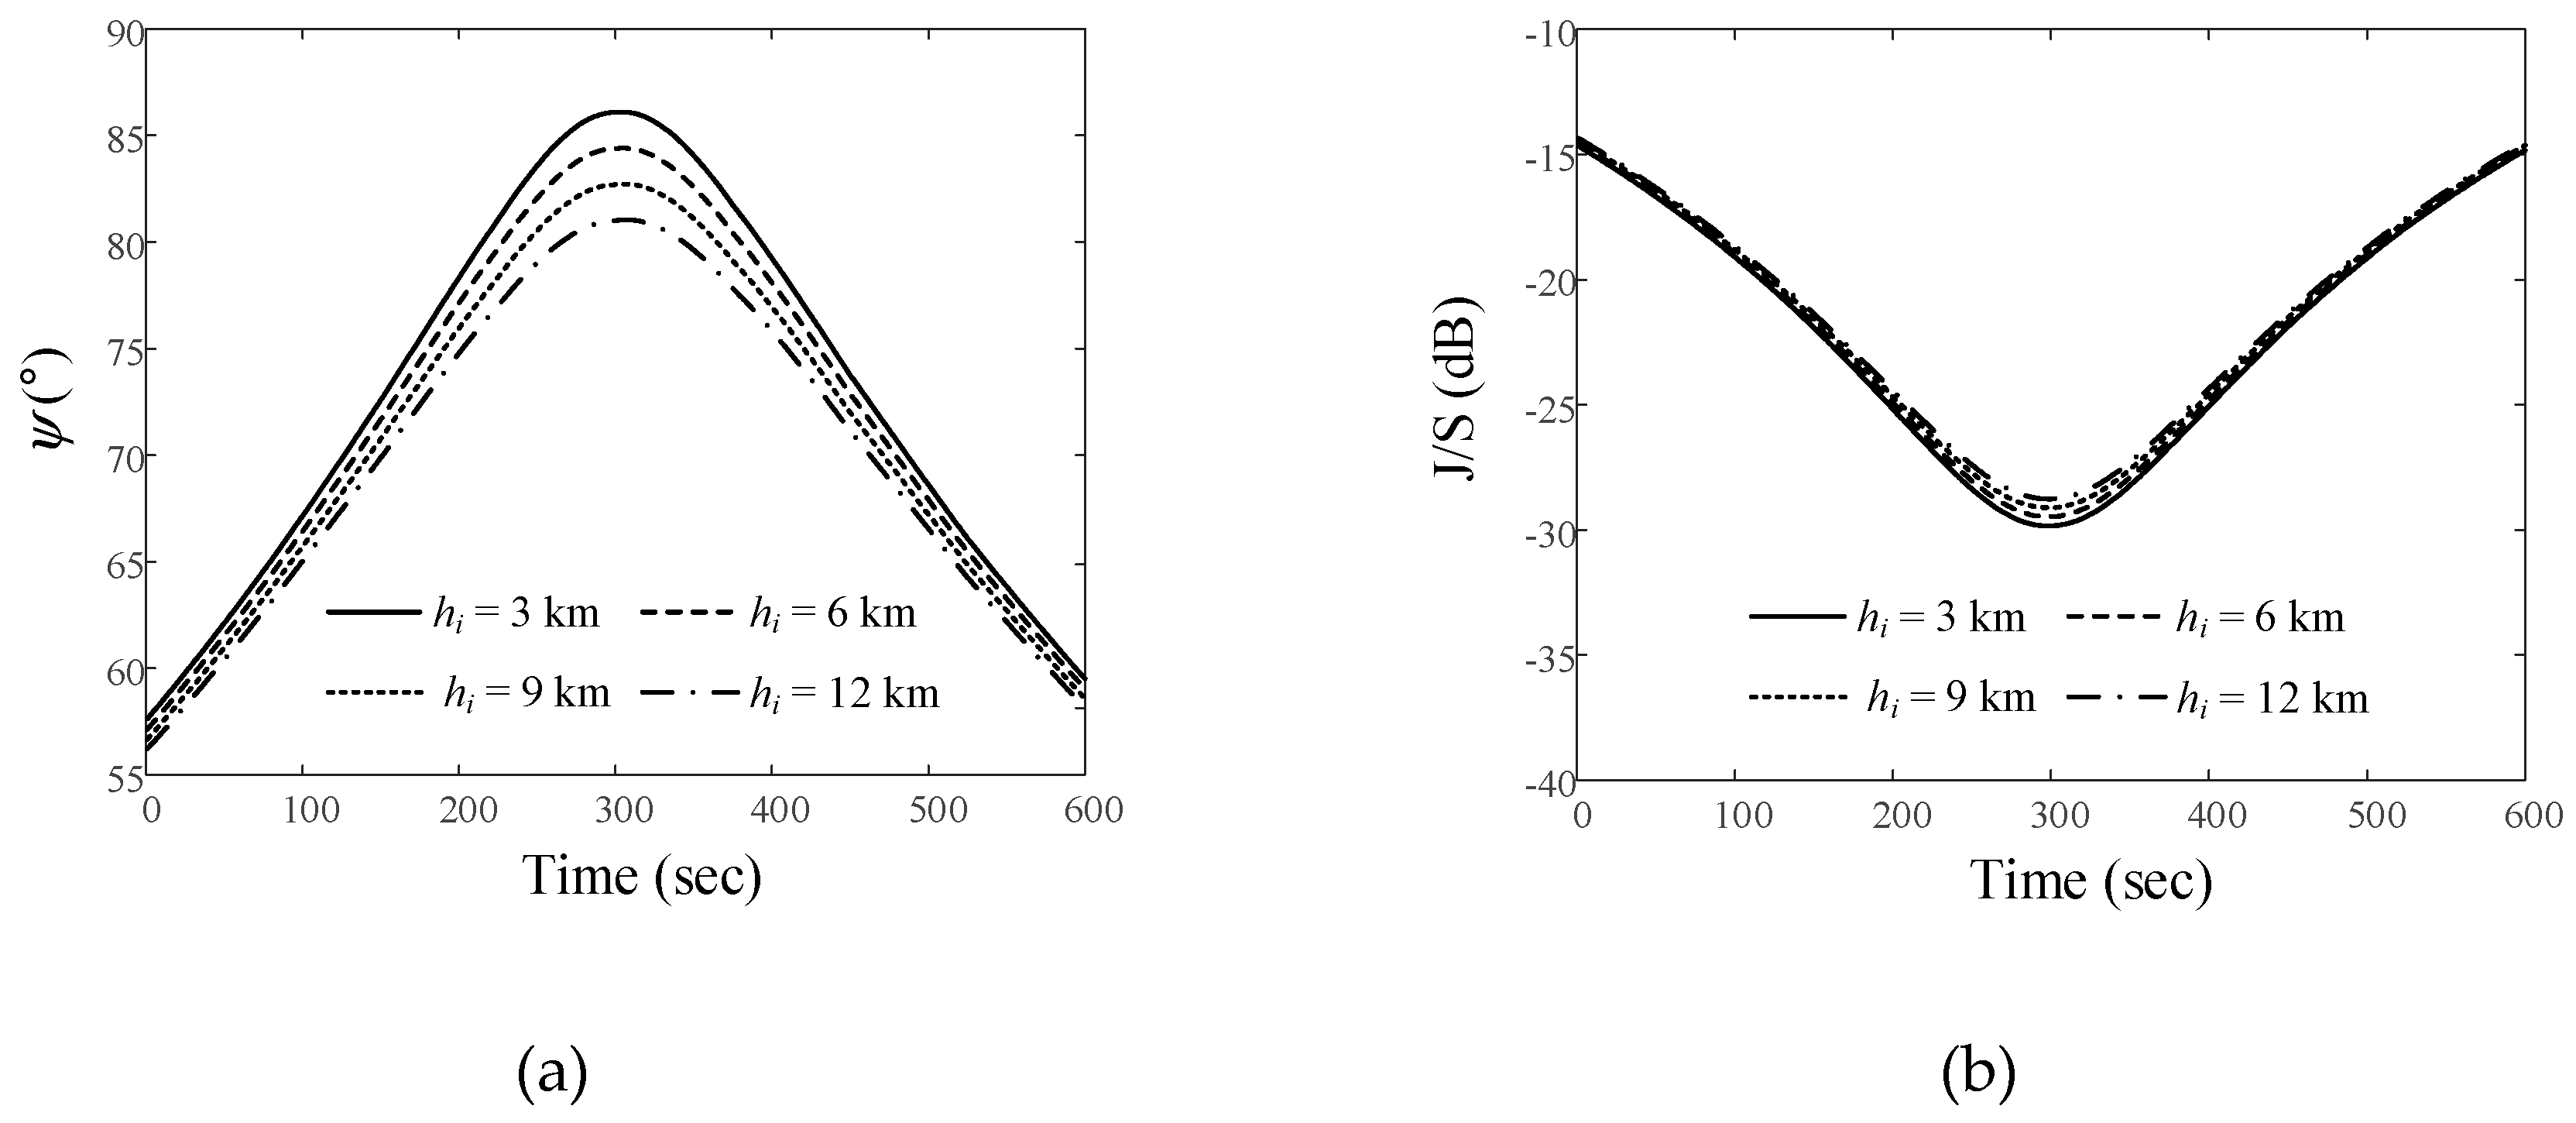
 and J/S ratio results obtained by varying the altitude of the airborne interference when the LEO satellite moves along Trajectory 1. In order to more easily observe the trends according to path and altitude during data communication time (n = 1, N = 600), the average
  and J/S ratio are obtained using Equations (6a) and (6b):

 and the J/S ratio when the altitudes of the interference source in Path 1 are 3 km, 6 km, 9 km, and 12 km. The
  ave values according to these altitudes are 73.2°, 72.2°, 71.2°, and 70.2°, respectively. The Jave/Save ratios for these altitudes are −22.3 dB, −22.1 dB, −21.9 dB, and −21.7 dB, respectively. Figures 6(c) and 6(d) present the
  and J/S ratio according to altitude when the interference source moves along Path 2. For each altitude, the
  ave values are 80.8°, 80.3°, 79.8°, and 79.3° , respectively. The Jave/Save ratios are –29.5 dB, –29.4 dB, –29.2 dB, and –29.1 dB, respectively. The
  and J/S ratio when the interference source moves along Path 3 are illustrated in Figures 6(e) and 6(f).
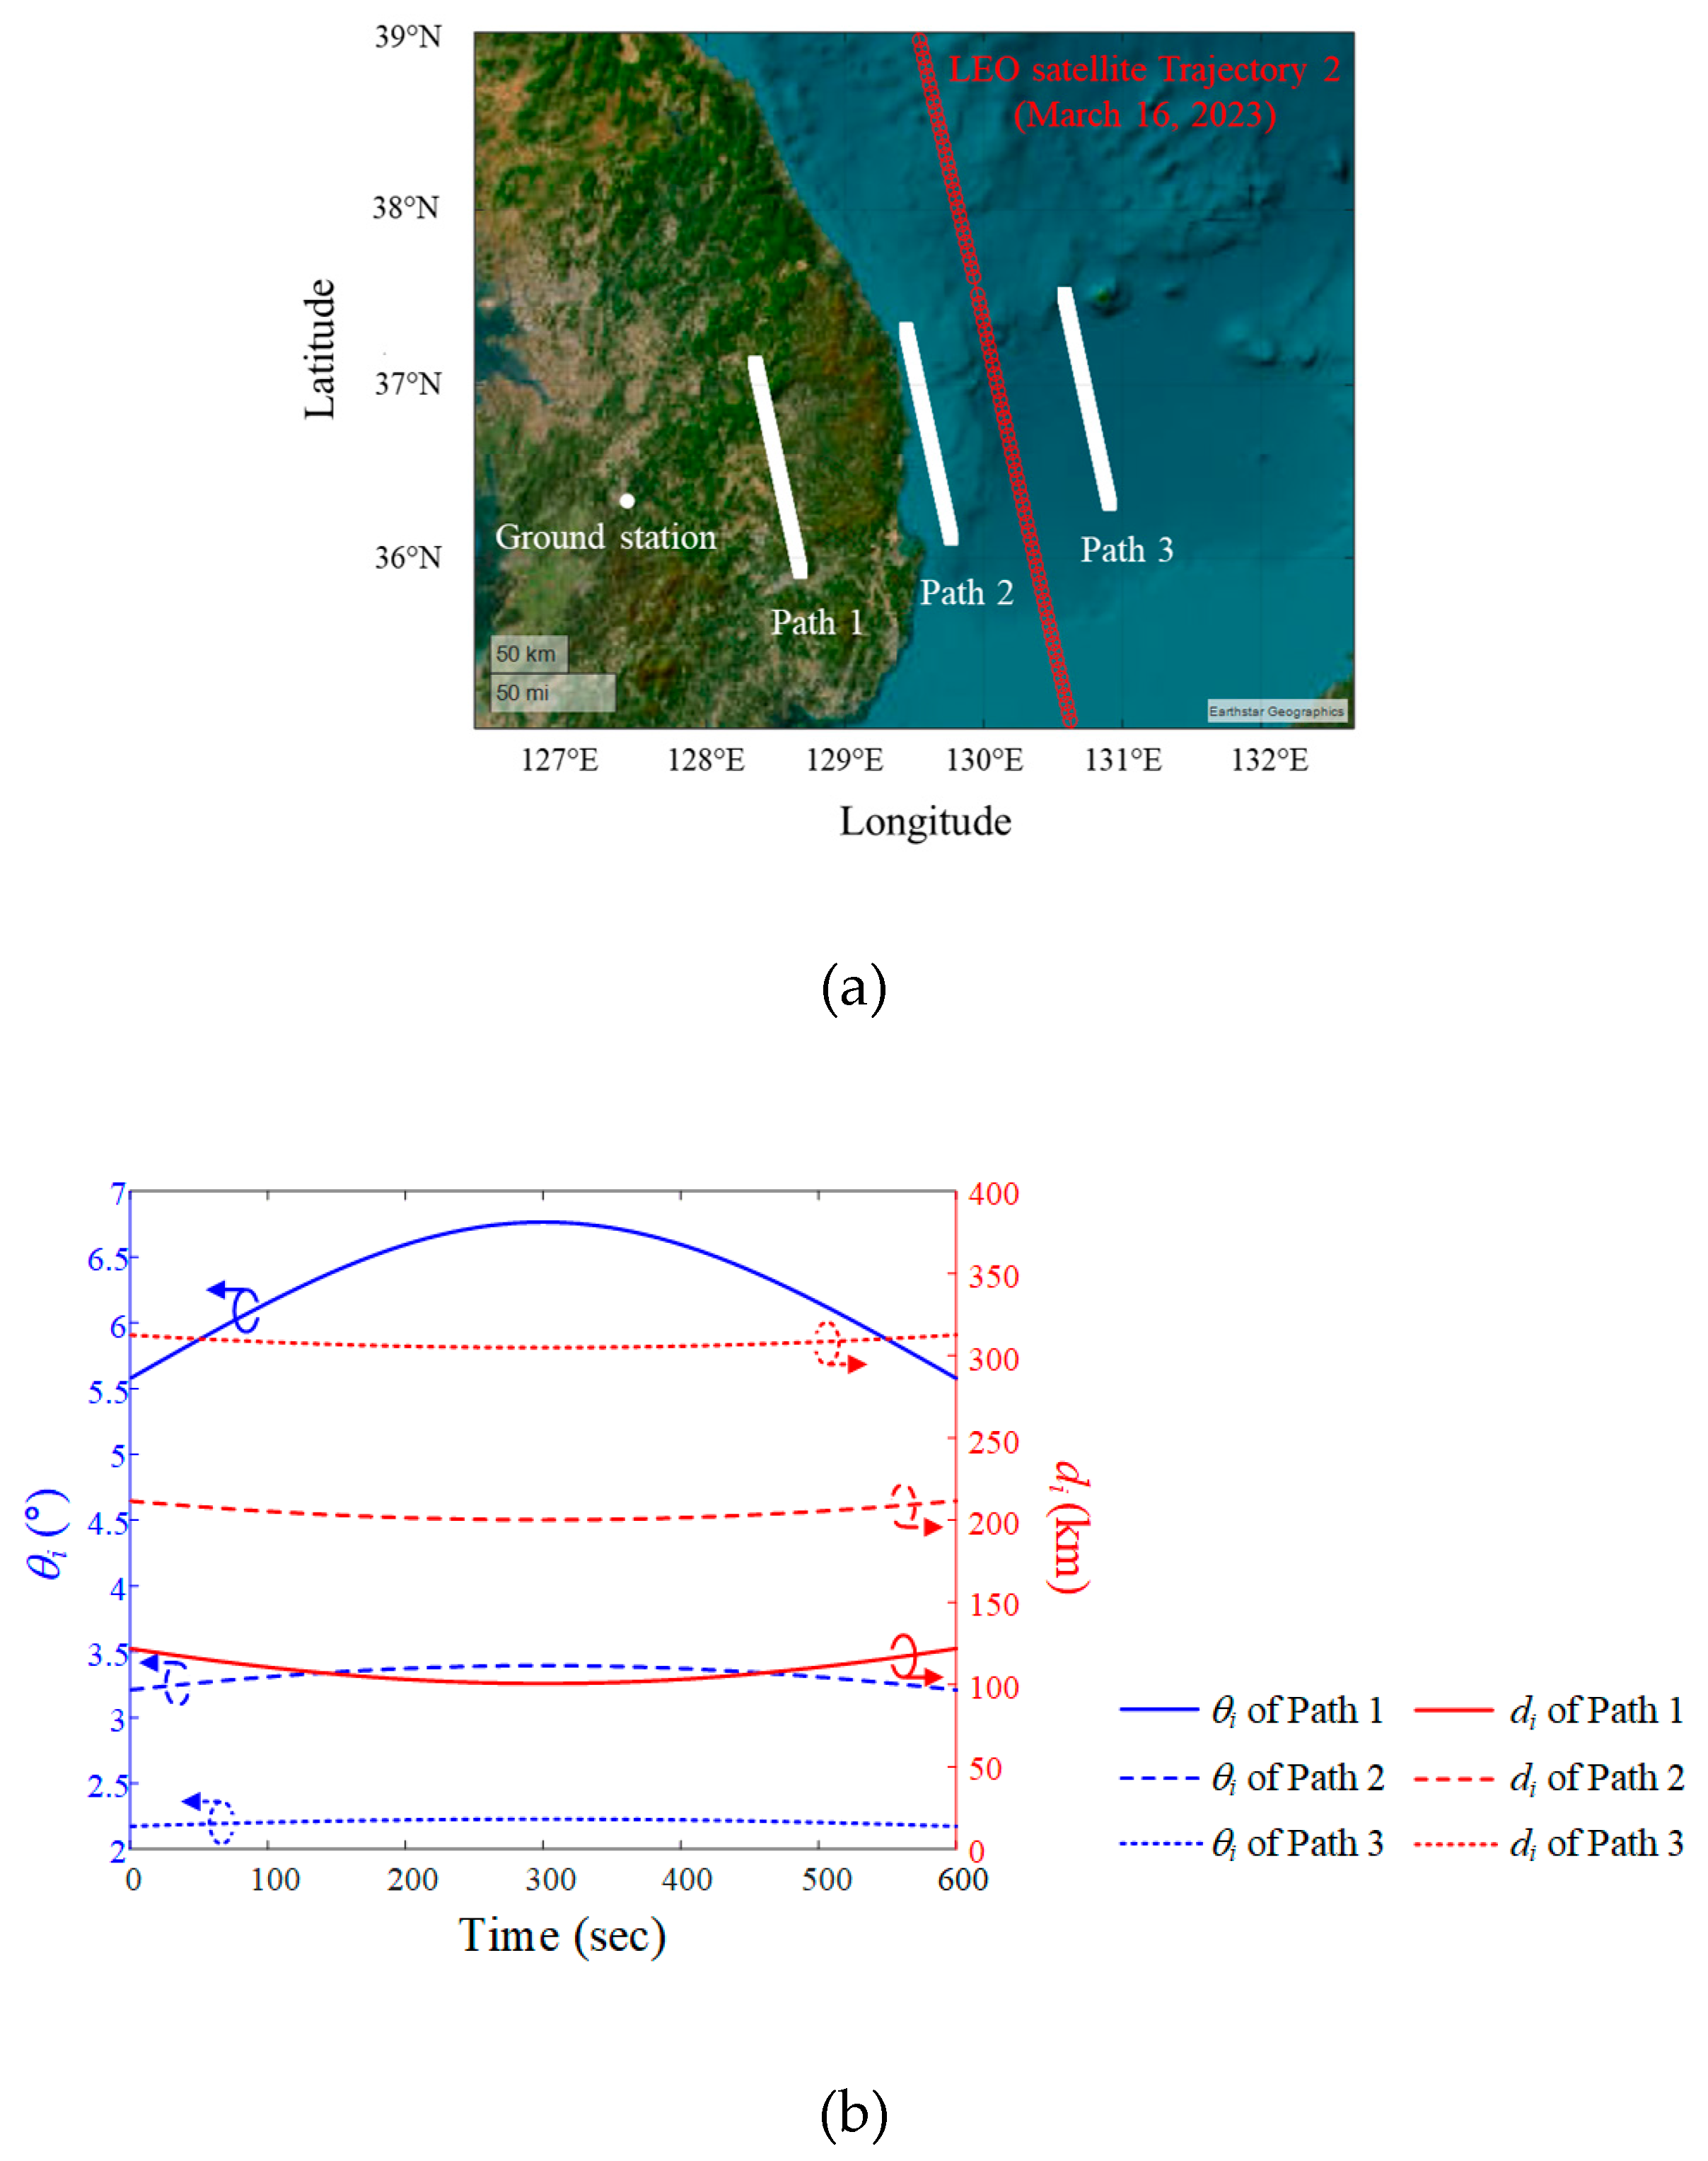
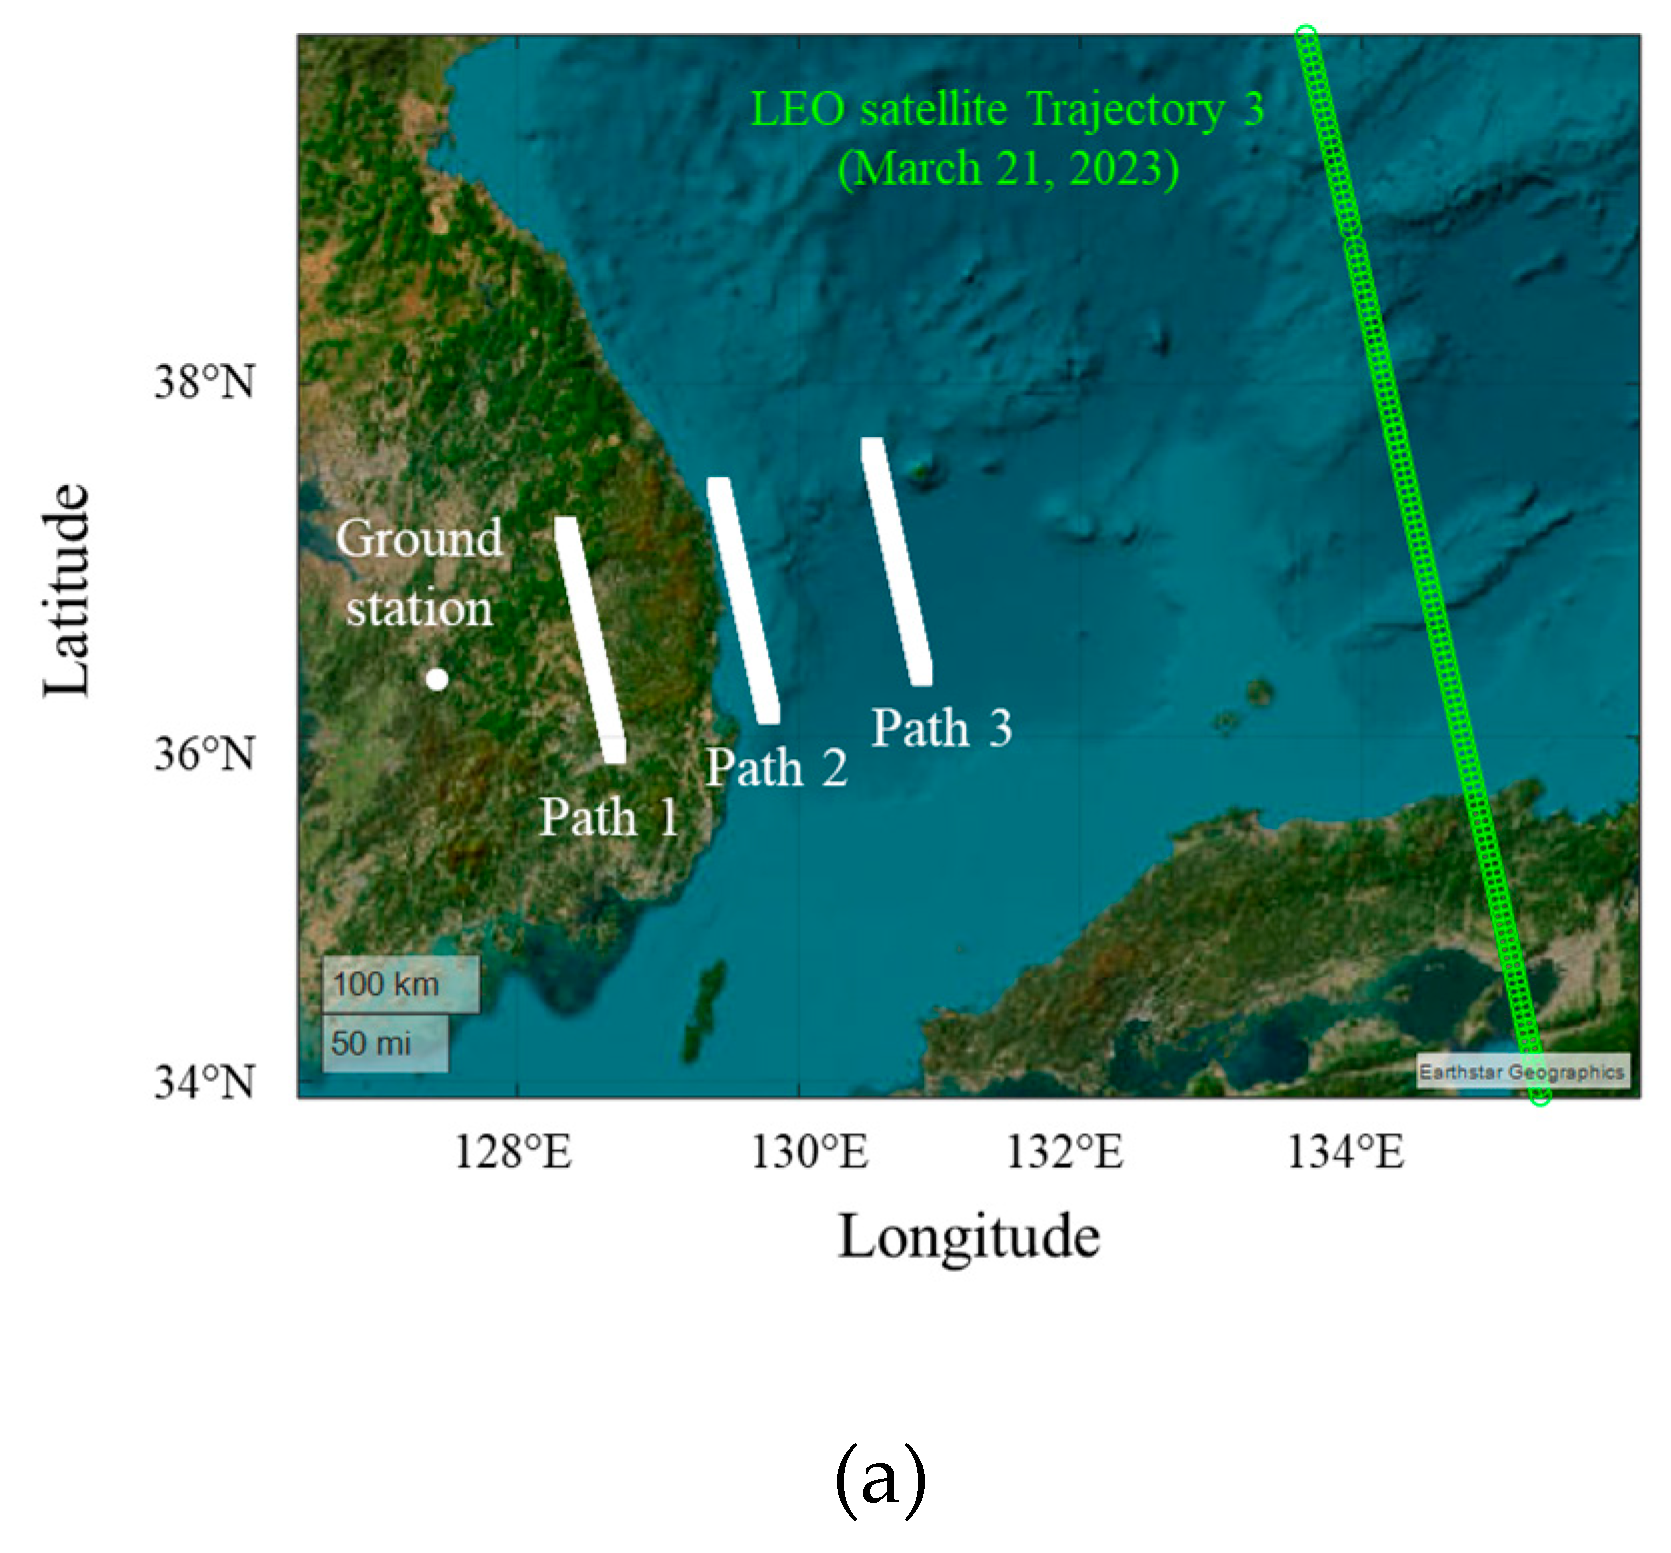
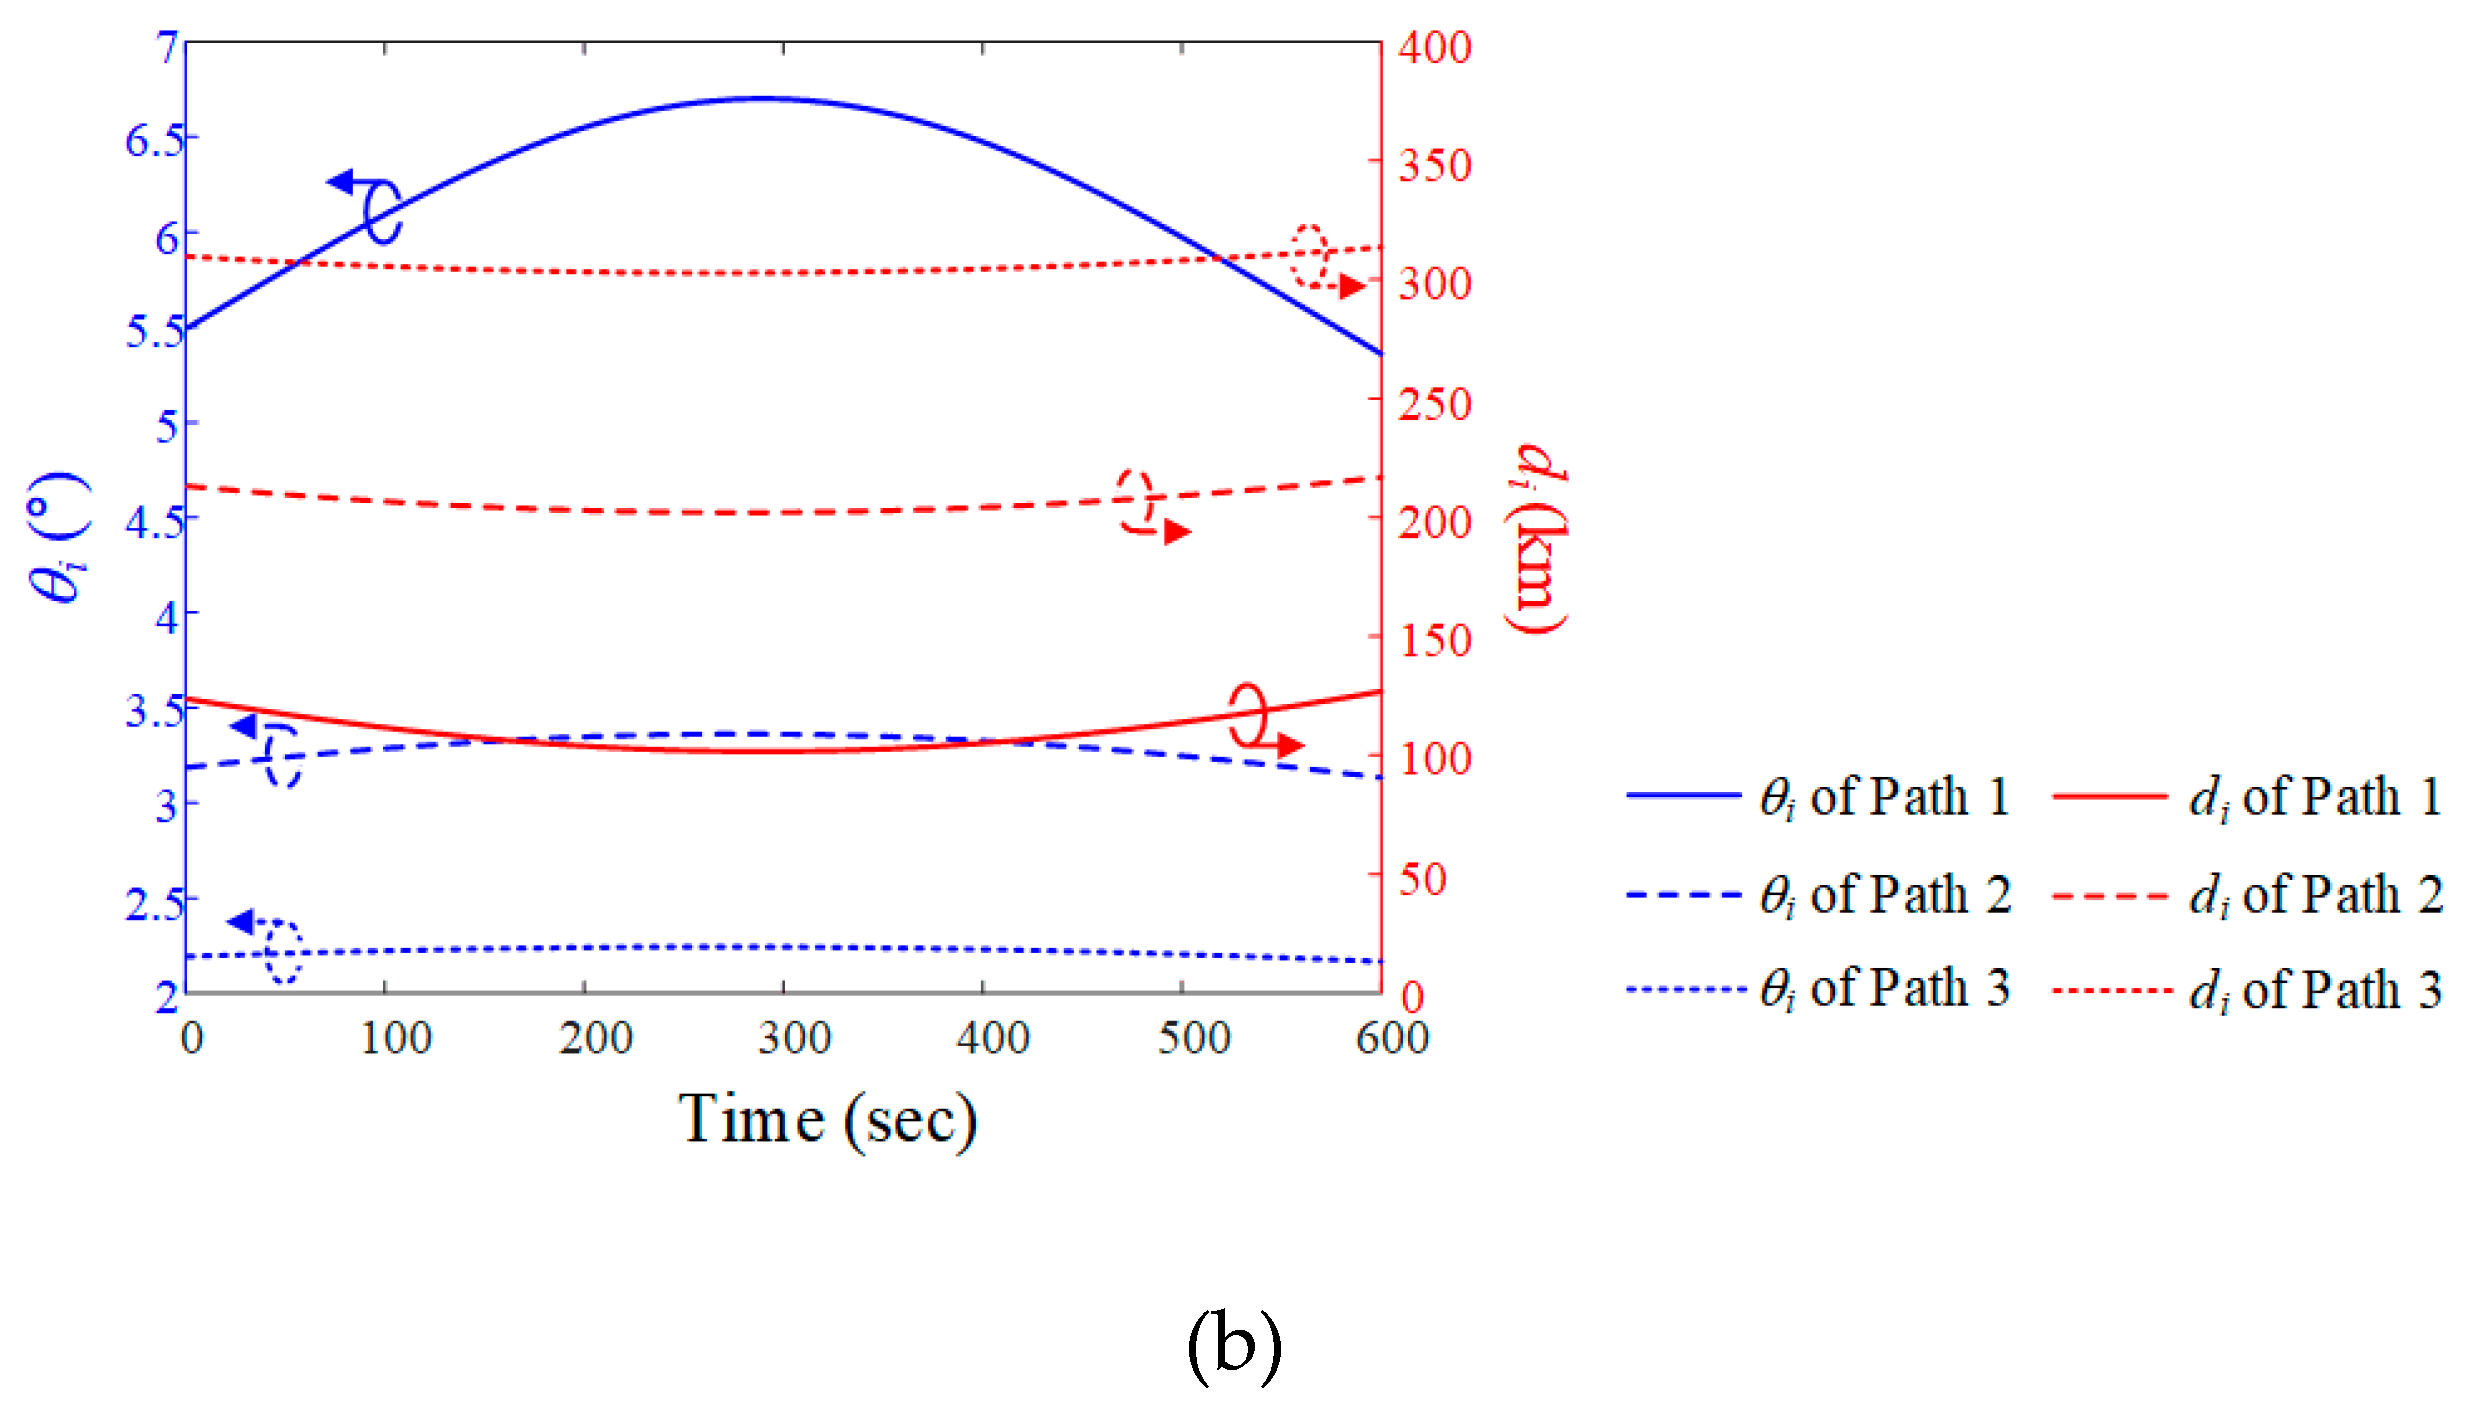
  i and slant distance di for when the interference source moves along path 1, 2, and 3 at an altitude of 12 km. The maximum elevation angles are 6.7° (Path 1), 3.4° (Path 2), and 2.2° (Path 3). When the interference source is located at the maximum elevation, the slant distances are 101.2 km (Path 1), 201.5 km (Path 2), and 301.2 km (Path 3).
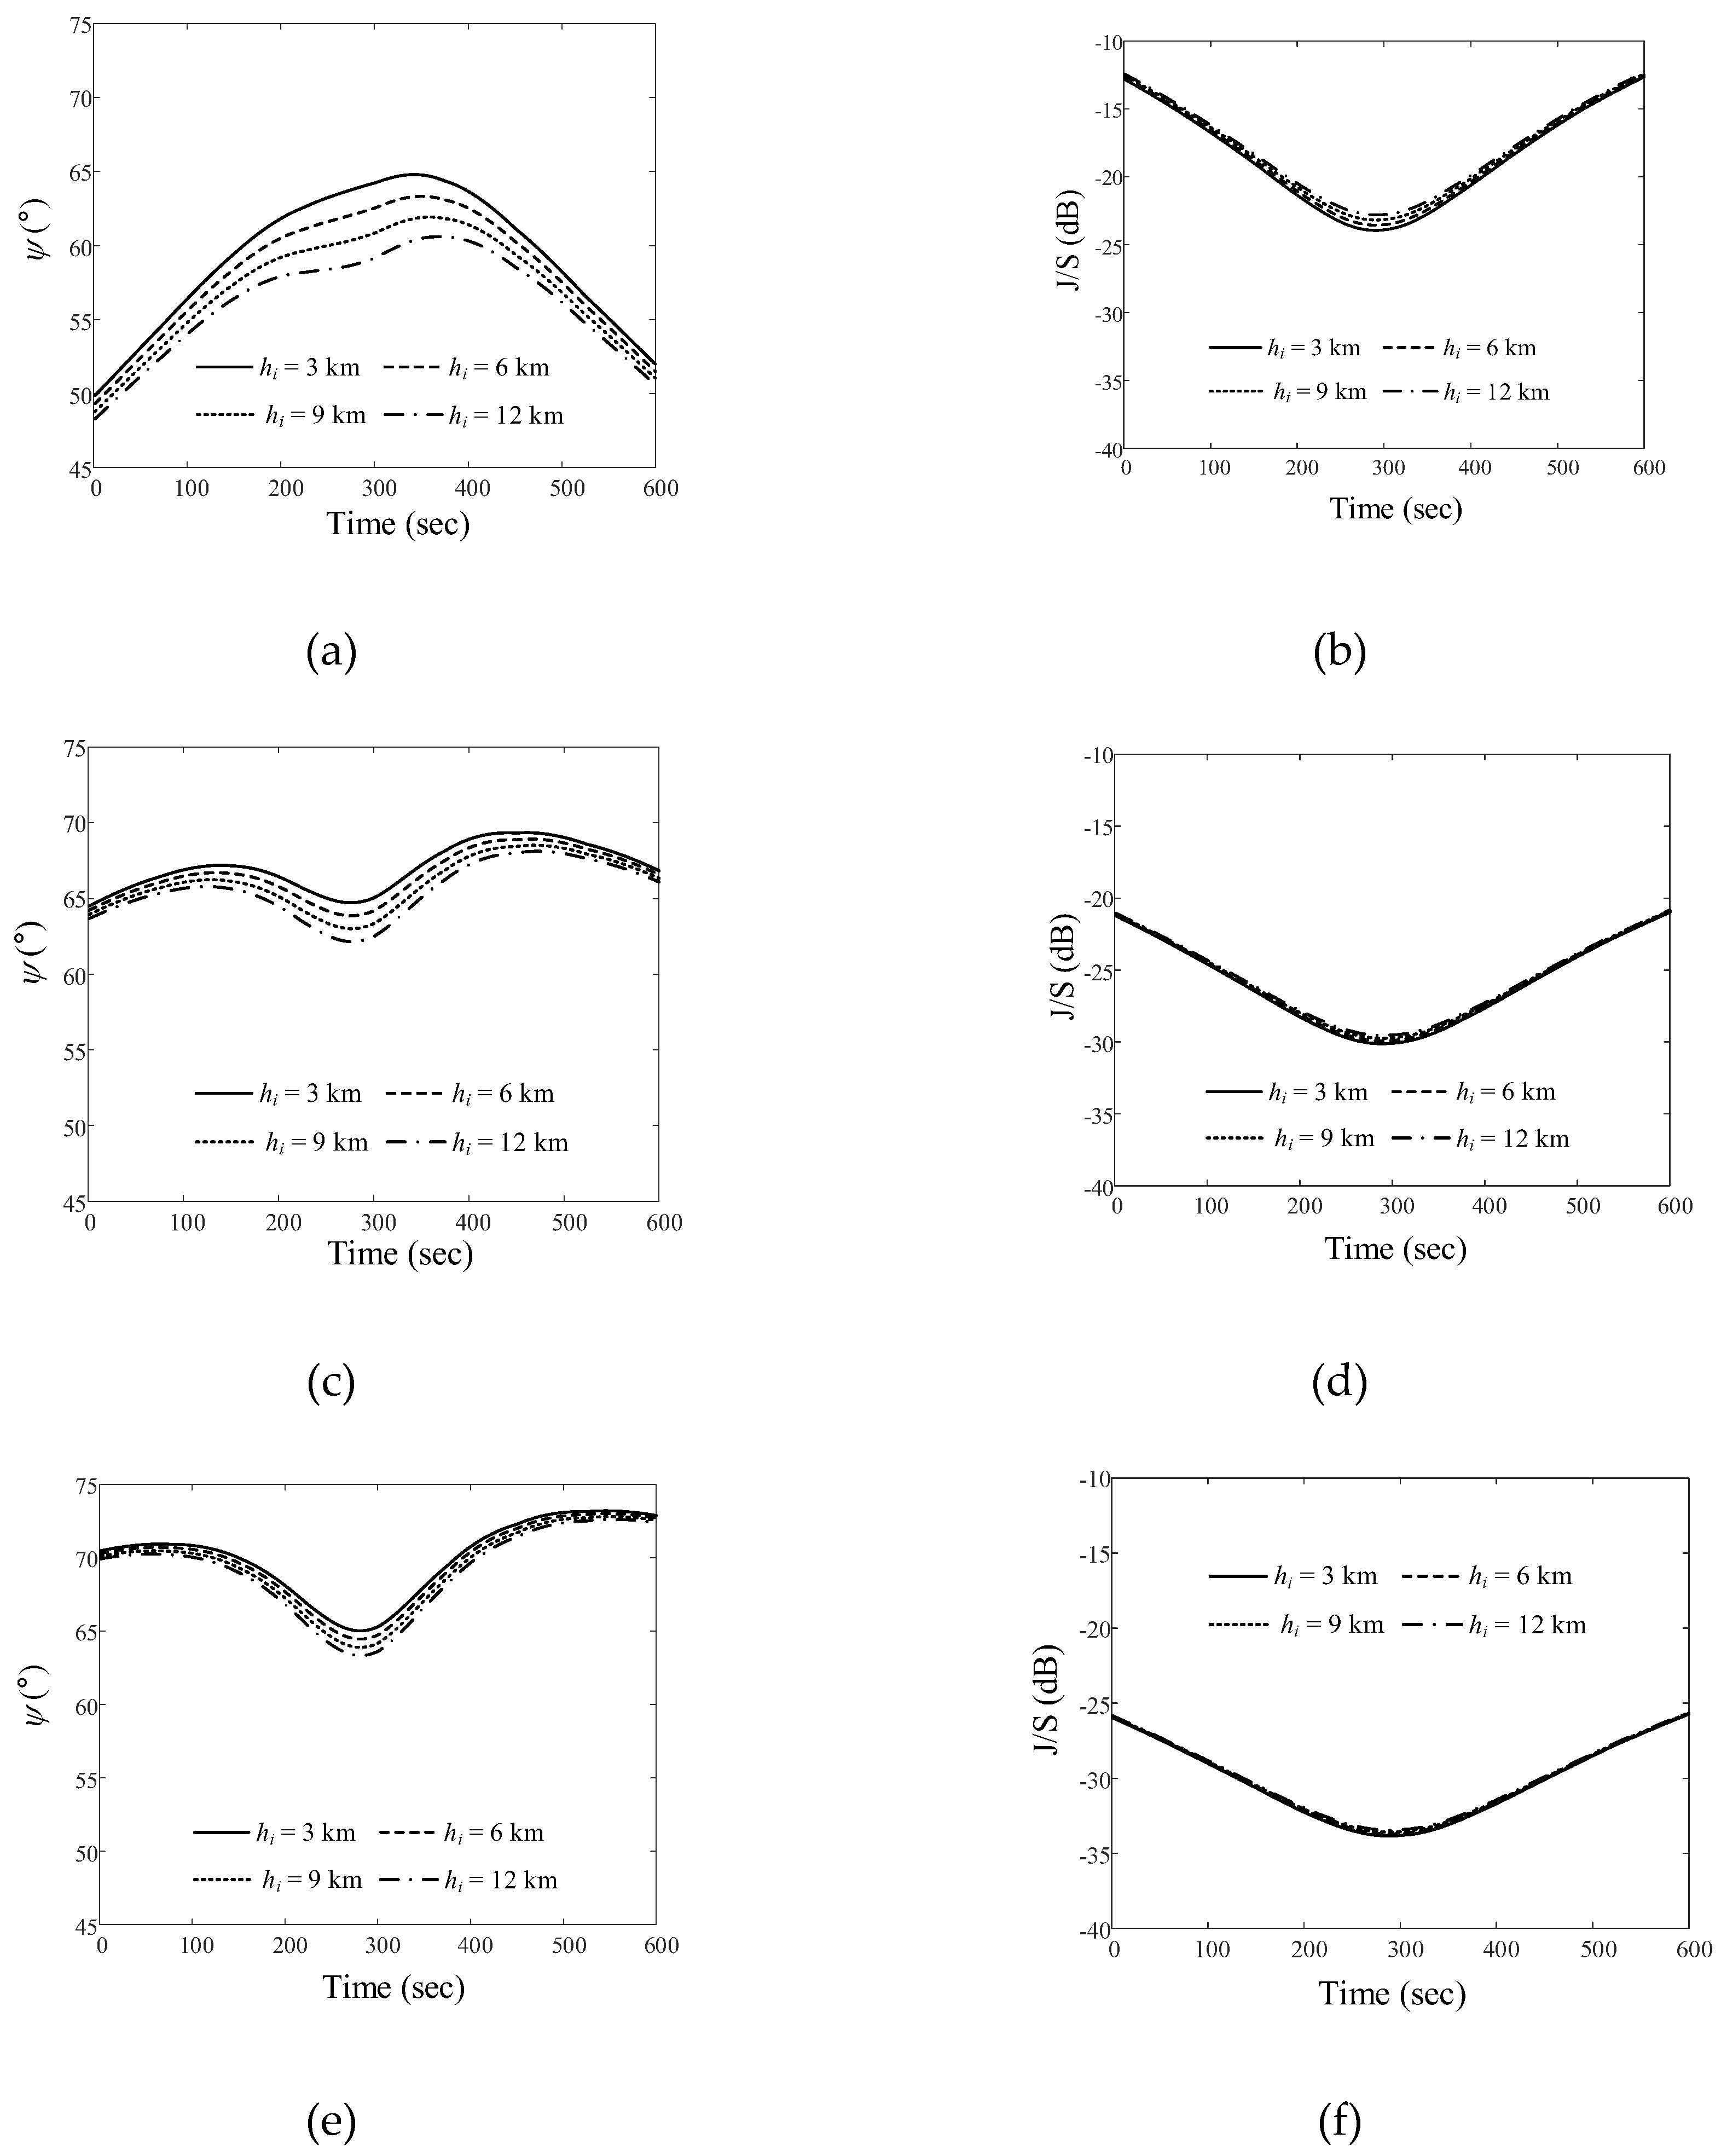
 and the J/S ratio according to the different altitudes of the airborne interference source. When the source moves along Path 1 at altitudes of 3 km, 6 km, 9 km, and 12 km, the
  ave values are 59.4°, 58.4°, 57.3°, and 56.3°, respectively, and the Jave/Save ratios are −18.7 dB, −18.4 dB, −18.2 dB, and −17.9 dB, respectively. Figures 8(c) and 8(d) show the results of
  and J/S depending on altitude when the interference source moves along Path 2. The
  avevalues at these altitudes are 67.1°, 66.6°, 66°,and 65.5°, respectively. The Jave/Save ratios are –26 dB, –25.9 dB, –25.8 dB, and –29.1 dB, respectively. Figures 8(e) and 8(f) present the
  and J/S ratios when the interference source moves along Path 3.
  ave values are 70°, 69.7°, 69.3°, and 68.9°, and Jave/Save ratios are −30.3 dB, −30.2 dB, −30.1 dB, and −30.1 dB, respectively.
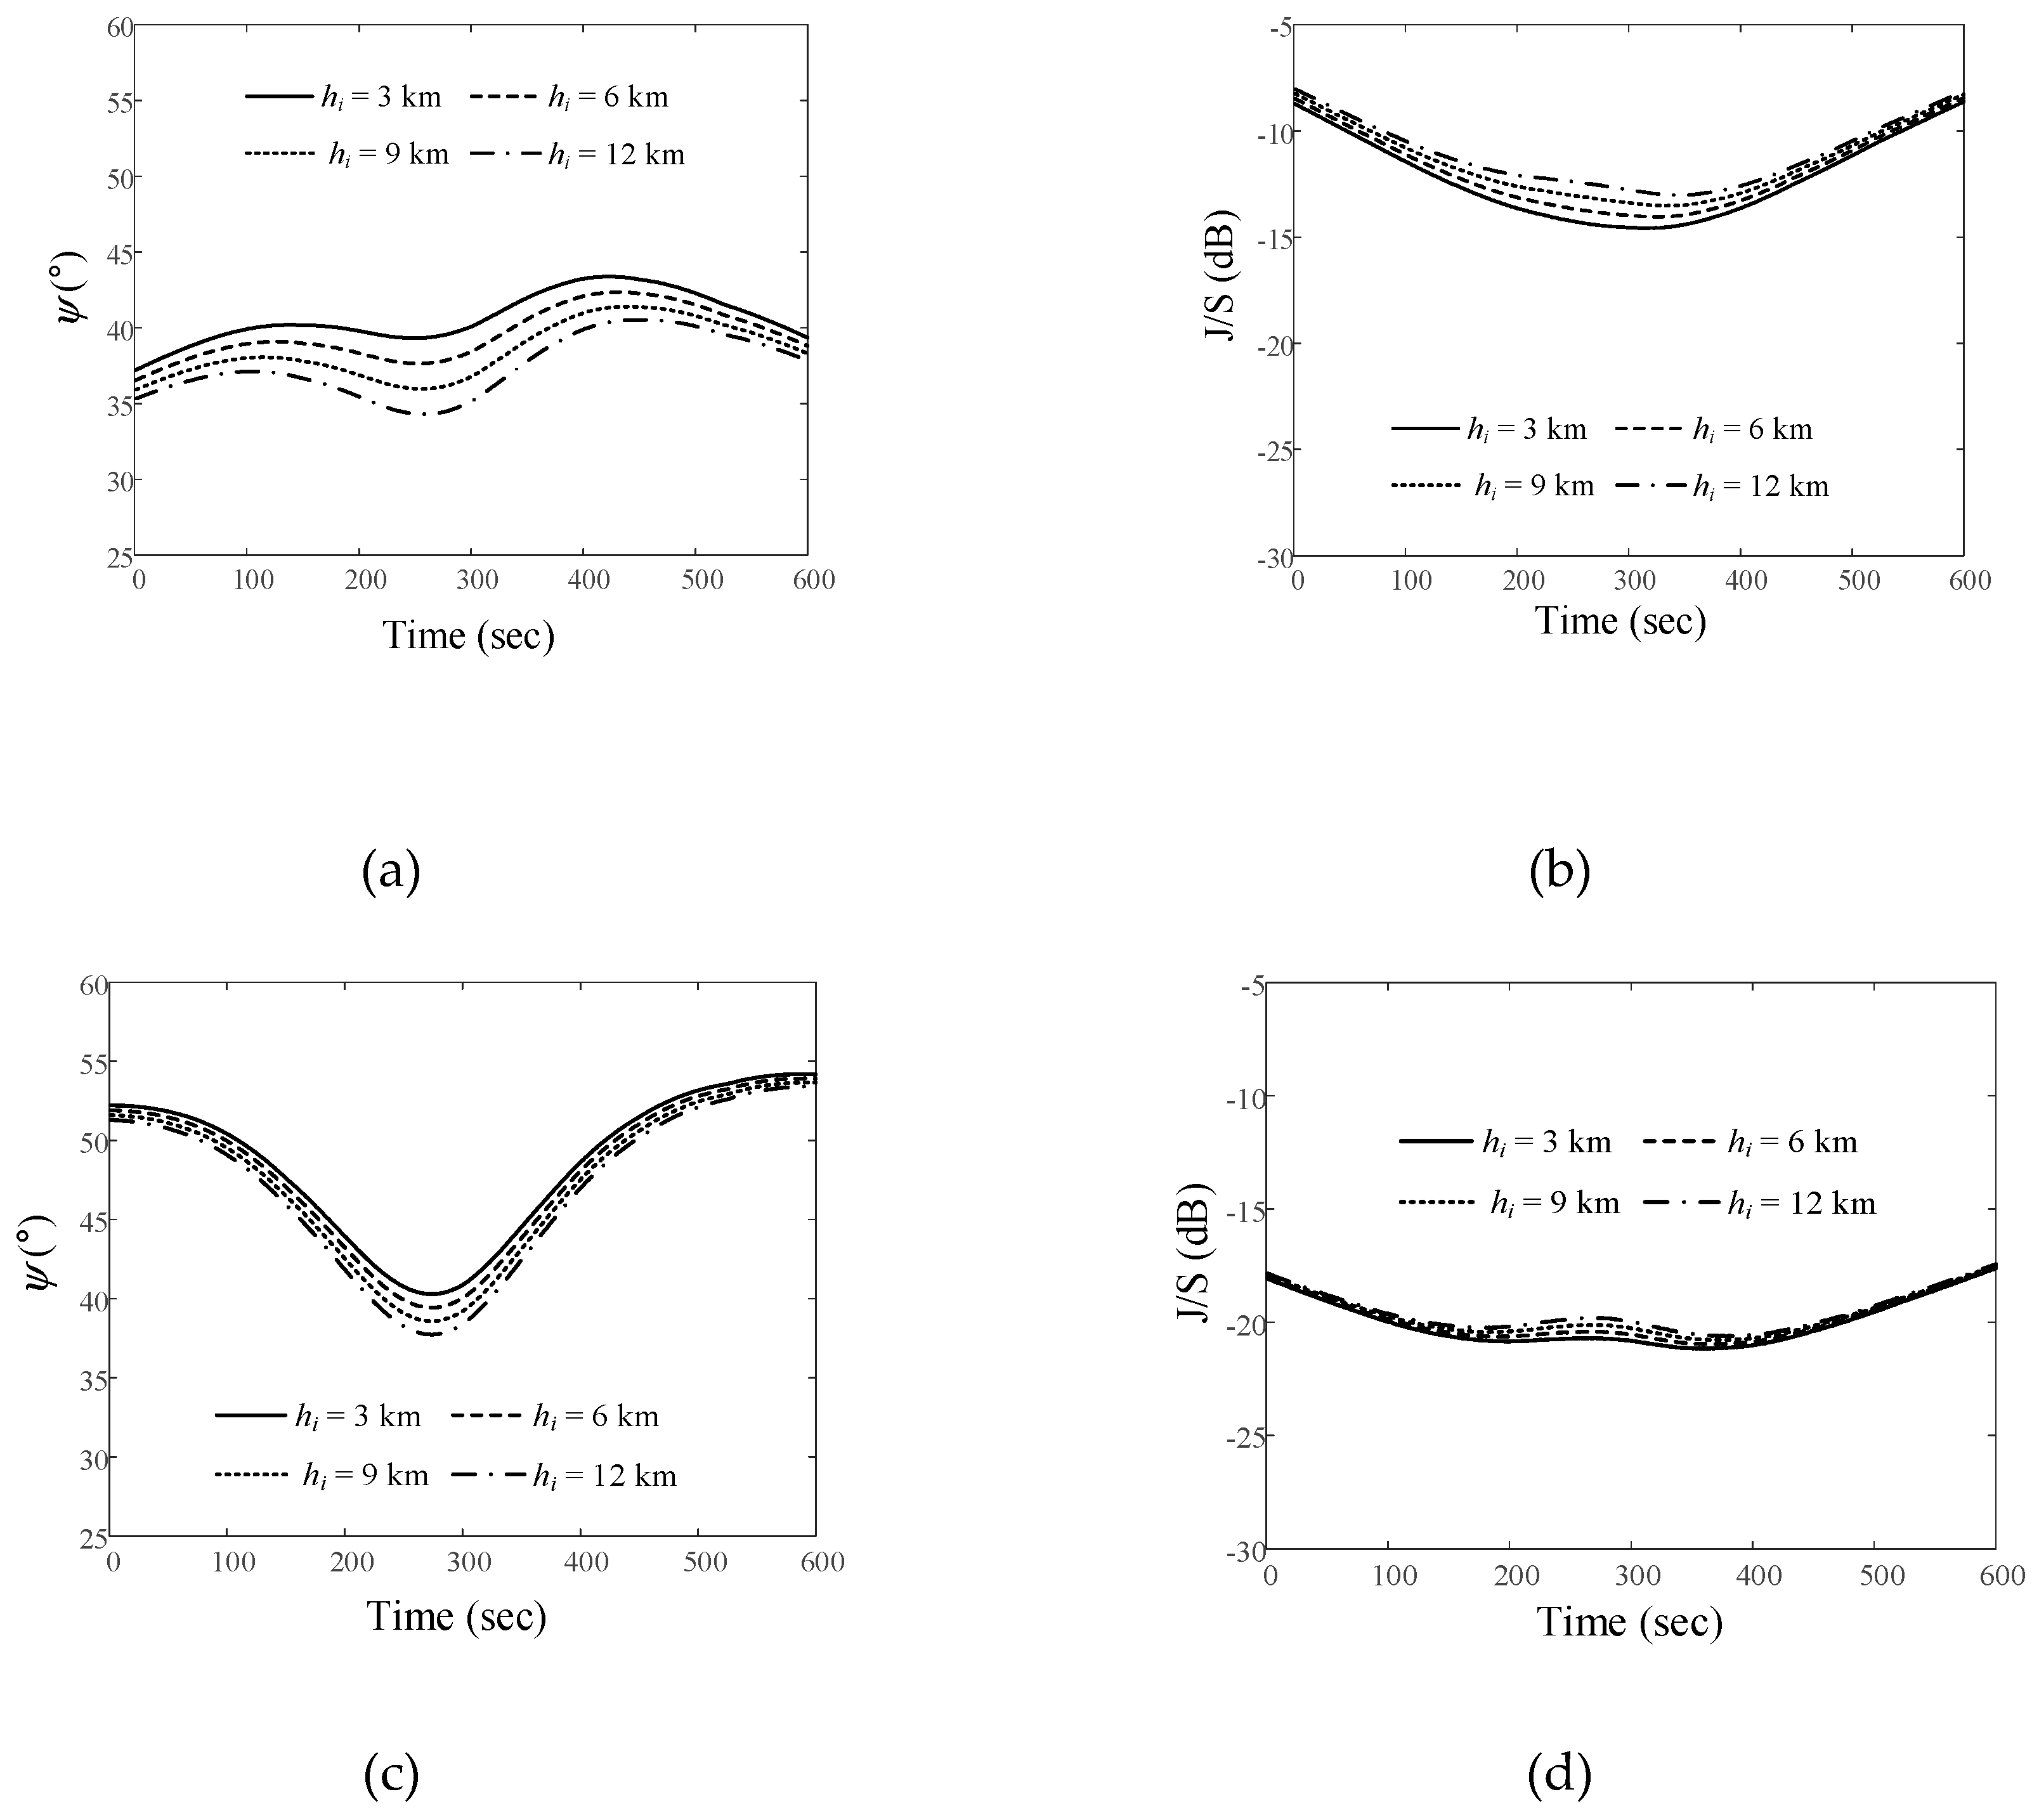
  and J/S ratios when the airborne interference source moves along Path 1. For altitudes of 3 km, 6 km, 9 km, and 12 km of the airborne interference source, the
  ave values are 40.7°, 39.6°, 38.5°, and 37.5°, respectively. The Jave/Save ratios are −12.2 dB, −11.9 dB, −11.5 dB, and −11.1 dB, respectively. Figures 10(c) and 10(d) present the
  and J/S ratios for Path 2. The
  ave values are 48.4°, 47.8°, 47.3°, and 46.8°, and the Jave/Save ratios are –20.1 dB, –19.9 dB, –19.7 dB, and –19.6 dB, respectively.
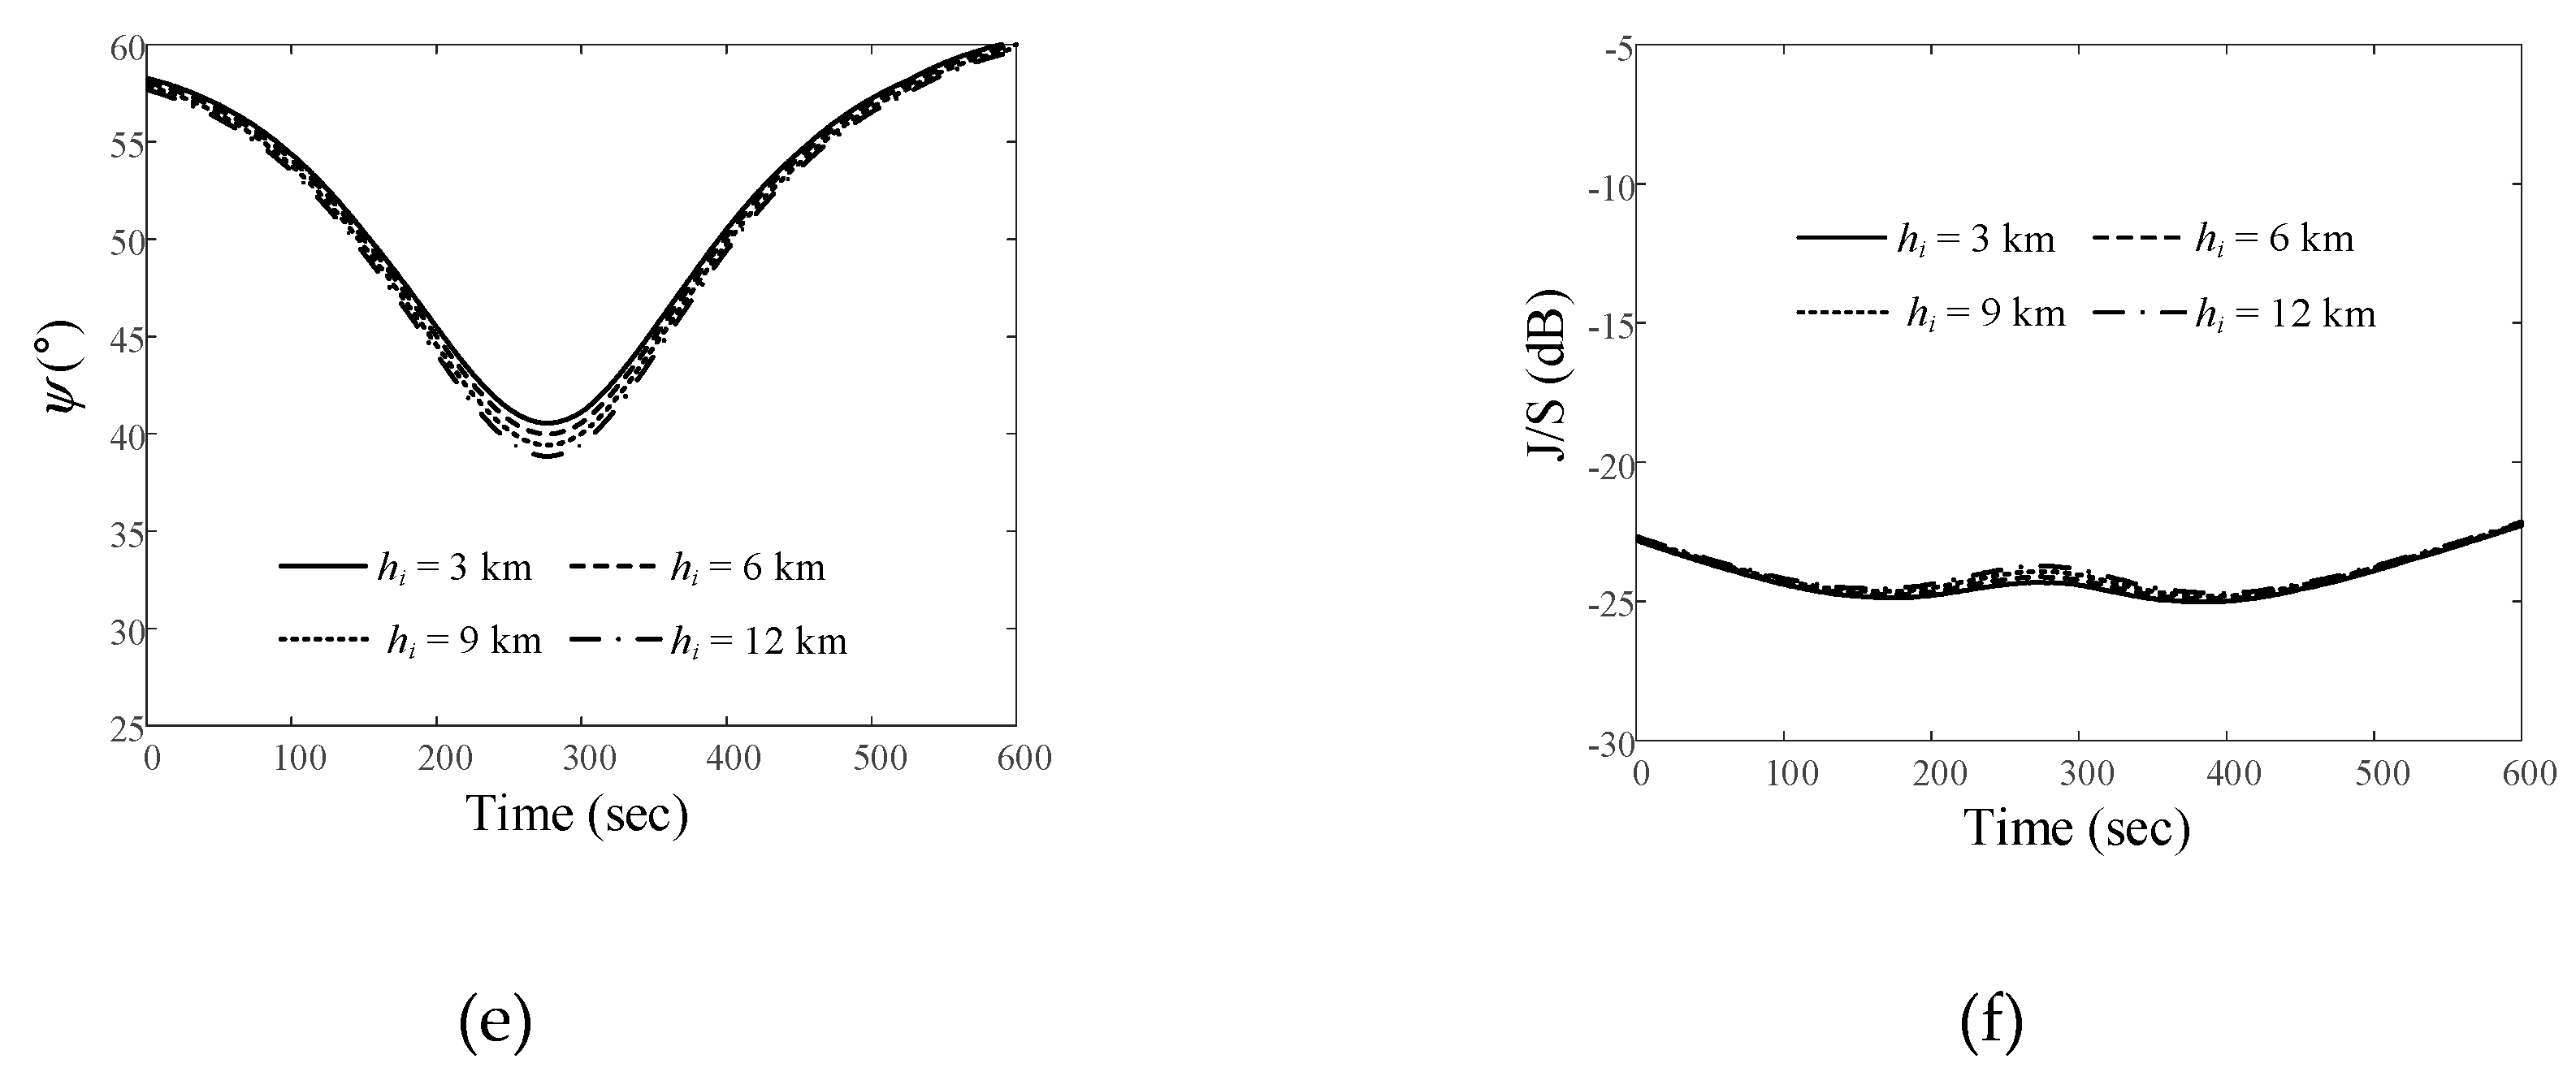
  and J/S ratios when the interference source moves along Path 3. The
  ave values are 51.3°, 69.7°, 69.3°, and 68.9°, with the Jave/Save ratios of –30.3 dB, –30.2 dB, –30.1 dB, and –30.1 dB, respectively.
  ave values and Jave/Save ratios are summarized. As can be seen from these results, for satellite Trajectory 1, the highest
  ave value (83.6°) is observed when the interference source moves on Path 3 at an altitude of 3 km. In this case, the Jave/Save ratio is also the lowest at −33.6 dB. When the satellite moves along Trajectory 3 with Path 1 (an altitude of 12 km), the lowest
  ave value (37.5°) and the highest Jave/Save ratio (−11.1 dB) are observed. For Trajectory 1 (with Path 1), the
  ave at an altitude of 12 km is about 3° lower than that at an altitude of 3 km. On the other hand, the Jave/Save ratio at 12 km is 0.6 dB higher than at 3 km. As altitude hi increases,
  ave decreases and the Jave/Save ratio increases slightly. These results show that the relative angle difference
  between LEO satellite and interference source is critical factor for J/S ratio.
 4. Conclusions
 , the satellite and interference source coordinates were converted from the WGS84 to the ENU coordinate system. By applying the relative angle difference
  , we obtained the sidelobe gain of the ground station antenna in the direction from which the interference comes from the ground station antenna. Through comprehensive link budget analysis, the J/S ratio was found to be 22.5 dB higher in Trajectory 3, where the relative angle difference
  was small compared to the other trajectories. These results showed that although the distances between ground station, LEO satellite, and interference source were important from the J/S ratio perspective, the relative angle difference
  between interference source and satellite is the even more critical factor.
 Author Contributions
Acknowledgments
Conflicts of Interest
References
- Kim, M. J.; Lim, S.; Shin, D. C. Analysis method for determining optimal synthetic aperture time using estimated range and doppler cone angle at the center of synthetic aperture length. J. Electromagn. Eng. Sci. 2023, 23, 3, 205−211. [CrossRef]
- Kang, Y. G.; Kim, C. K.; Park, S. O; Ocean image formation algorithm using altimeter data for next generation satellite SAR. J. Electromagn. Eng. Sci. 2022, 22, 85−94.
- Lewark, U. J.; Antes, J.; Walheim, J.; Timmermann, J.; Zwick, T.; Kallfass, I. Link budget analysis for future E-band gigabit satellite communication links (71–76 and 81–84 Ghz). CEAS Space J. 2013, 4, 41−46. [CrossRef]
- Cakaj, S.; Malarić, K. Rigorous analysis on performance of LEO satellite ground station in urban environment. Int. J. Satell. Commun. Netw. 2007, 25, 619−643. [CrossRef]
- Li, S. Y.; Liu, C. H. Modeling the effects of ionospheric scintillations on LEO satellite communications. Int. J. Satell. Commun. Netw. 2004, 8, 147−149. [CrossRef]
- Kilcoyne, D. K.; Rowe, S. A.; Headley, W. C.; Mortensen, D. J.; McGwier, R. W.; Leffke, Z. J.; Reinhart, R. C. Link adaptation for mitigating earth-to-space propagation effects on the NASA scan testbed. In Proceedings of the 2016 IEEE Aerospace Conference, Montana, USA, 1−9, March 2016.
- Barbarić, D.; Vuković, J.; Babic, D. Link budget analysis for a proposed Cubesat Earth observation mission. In Proceedings of the 2018 41st International Convention on Information and Communication Technology, 133−138, May 2018.
- Reiten, K.; Schlanbusch, R.; Kristiansen, R.; Vedal, F.; Nicklasson, P. J.; Berntsen, P. C. Link and doppler analysis for space-based AIS reception. In Proceedings of the 2007 3rd International Conference on Recent Advances in Space Technologies, Istanbul, Turkey, 556−561, June 2007.
- Xu, H.; Zhang, J.; Sun, Z.; Yang, H. Event-based wireless tracking control for a wheeled mobile robot against reactive jamming Attacks. IEEE Trans. Control Netw. Syst. 2023, Early Access. [CrossRef]
- Lineswala, P. L.; Shah, S. N.; Shah, R. Different categorization for jammer: The enemy of satellite navigation. In Proceedings of the 2017 2nd International Conference for Convergence in Technology (I2CT). Mumbai, India, 282−287, April 2017.
- Sathaye, H.; Noubir, G.; Ranganathan, A. On the implications of spoofing and jamming aviation datalink applications. In Proceedings of the 38th Annual Computer Security Applications Conference. Texas, USA, 548−560, December 2022.
- Senapati, M.; Anand, B., Barsaiyan, V.; Rajalakshmi, P. Geo-referencing system for locating objects globally in LiDAR point cloud. In Proceedings of the 2020 IEEE 6th World Forum on Internet of Things (WF-IoT). LA, USA, 1−5, June 2020.
- Wang, Y.; Huynh, G.; Williamson, C. Integration of Google Maps/Earth with microscale meteorology models and data visualization. Comput. Geosci. 2013, 61, 23−31. [CrossRef]
- Merabtine, N.; Boualleg, A.; Benslama, M. Analysis of radiation patterns and feed illumination of the reflector antenna using the physical and geometrical optics. Semicond. Phys. Quant. 2006, 9, 53−57.
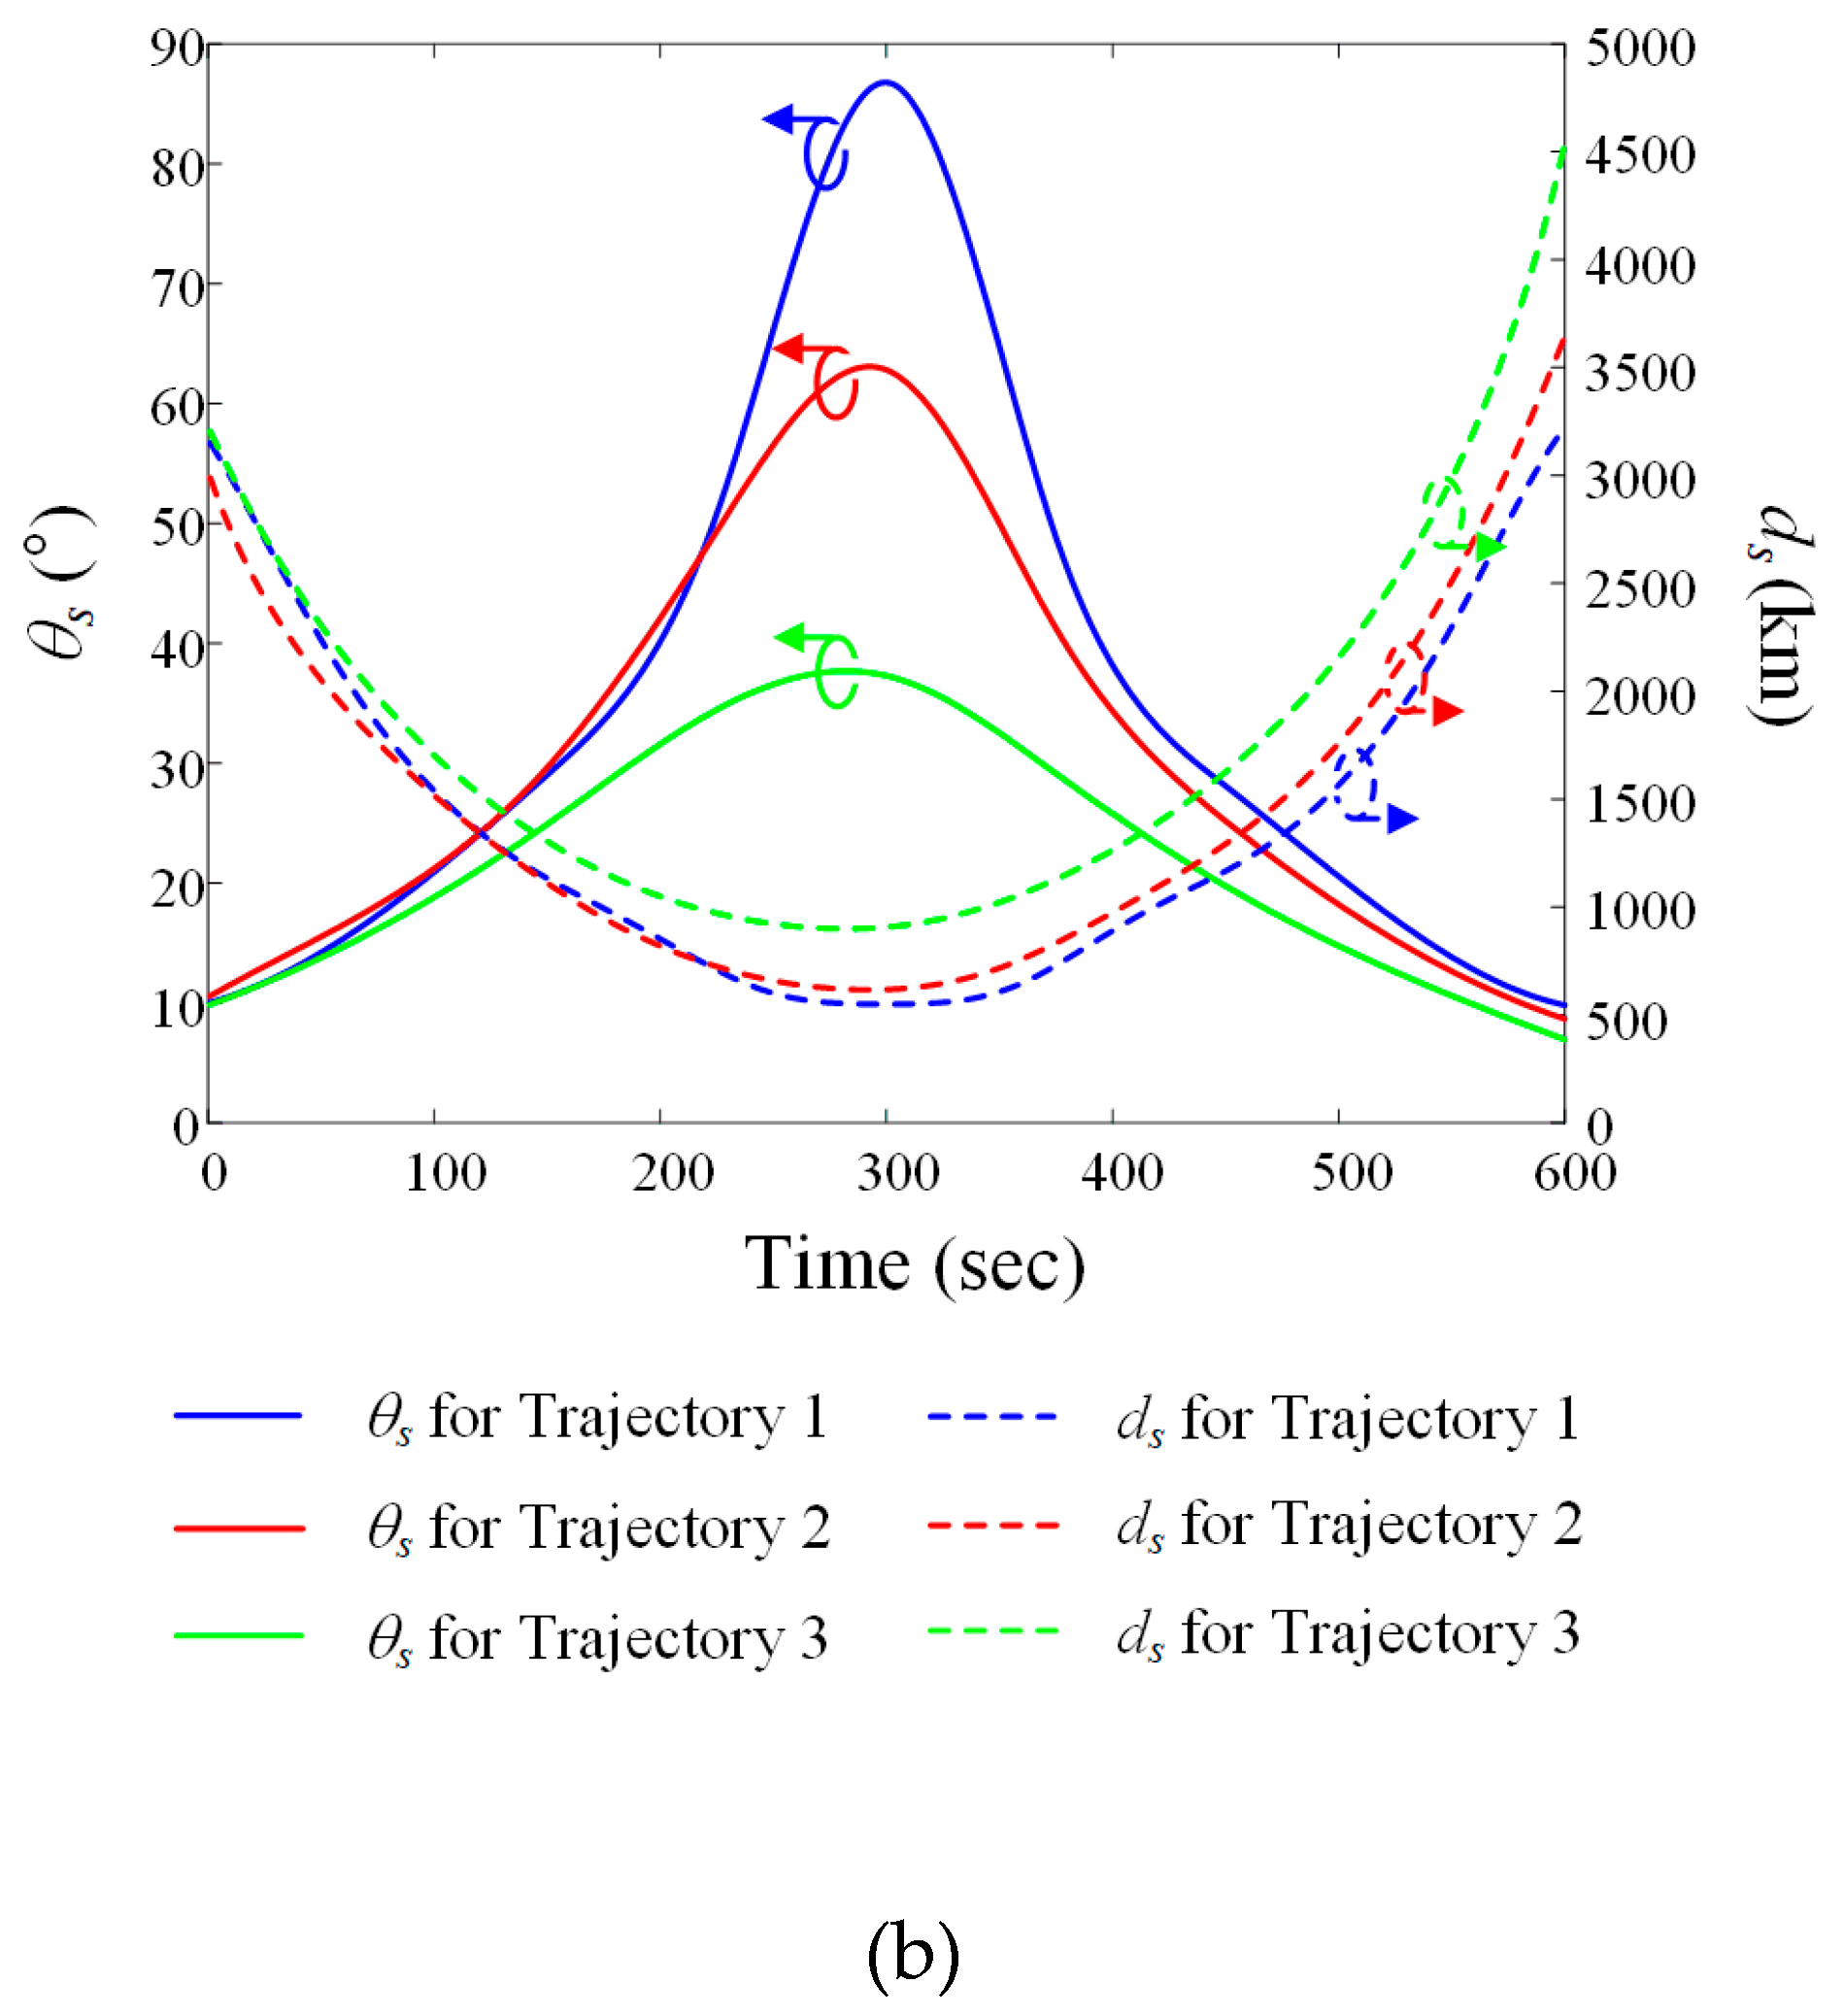
 s and slant distance ds for each trajectory using the ENU coordinate system.
 s and slant distance ds for each trajectory using the ENU coordinate system.
 i and slant distance di for each path.
 i and slant distance di for each path.
 and J/S ratios of the airborne interference source at different altitudes when the LEO satellite moves along Trajectory 1: (a)
  for Path 1; (b) J/S ratio for Path 1; (c)
  for Path 2; (d) J/S ratio for Path 2; (e)
  for Path 3; (f) J/S ratio for Path 3.
 and J/S ratios of the airborne interference source at different altitudes when the LEO satellite moves along Trajectory 1: (a)
  for Path 1; (b) J/S ratio for Path 1; (c)
  for Path 2; (d) J/S ratio for Path 2; (e)
  for Path 3; (f) J/S ratio for Path 3.

 i and slant distance di for each path.
 i and slant distance di for each path.
 and J/S ratios of the airborne interference source at different altitudes when the LEO satellite moves along Trajectory 2: (a)
  for Path 1; (b) J/S ratio for Path 1; (c)
  for Path 2; (d) J/S ratio for Path 2; (e)
  for Path 3; (f) J/S ratio for Path 3.
 and J/S ratios of the airborne interference source at different altitudes when the LEO satellite moves along Trajectory 2: (a)
  for Path 1; (b) J/S ratio for Path 1; (c)
  for Path 2; (d) J/S ratio for Path 2; (e)
  for Path 3; (f) J/S ratio for Path 3.
 i and slant distance di for each path.
 i and slant distance di for each path.
 and J/S ratio results obtained by varying the altitude of the airborne interference source when the LEO satellite moves along the Trajectory 3: (a)
  for Path 1; (b) J/S ratio for Path 1; (c)
  for Path 2; (d) J/S ratio for Path 2; (e)
  for Path 3; (f) J/S ratio for Path 3.
 and J/S ratio results obtained by varying the altitude of the airborne interference source when the LEO satellite moves along the Trajectory 3: (a)
  for Path 1; (b) J/S ratio for Path 1; (c)
  for Path 2; (d) J/S ratio for Path 2; (e)
  for Path 3; (f) J/S ratio for Path 3.
| Downlink Parameters | Values |
|---|---|
| Receiving antenna gain | 59 dBi |
| Satellite altitude | 550 km |
| Frequency range | 8025~8400 MHz |
| Transmitting power | 30 dBm |
| Transmitting antenna bore-sight gain | 4.4 dBi |
| Effective isotopic radiation power (EIRP), Gt + Pt | 34.4 dBm |
| Free-space path loss | Ls and Li (dB) |
| Interference source power | 70 dBm |
| Interference source antenna gain | 30 dBi |
| Interference velocity | 850 km/h |
| Interference source altitude | 3 km, 6 km, 9 km, and 12 km |
 ave and Jave/Save ratio results for all scenarios.
| Altitude h i (km) |
Path 1 | Path 2 | Path 3 | ||||
|---|---|---|---|---|---|---|---|
 ave ave(°) |
Jave/Save ratio (dB) |
 ave ave(°) |
Jave/Save ratio (dB) |
 ave ave(°) |
Jave/Save ratio (dB) |
||
| Trajectory 1 | 3 | 73.2 | −22.3 | 80.8 | −29.5 | 83.6 | −33.6 |
| 6 | 72.2 | −22.1 | 80.3 | −29.4 | 83.3 | −33.5 | |
| 9 | 71.1 | −21.9 | 79.8 | −29.2 | 82.9 | −33.4 | |
| 12 | 70.2 | −21.7 | 79.3 | −29.1 | 82.6 | −33.4 | |
| Trajectory 2 | 3 | 59.4 | −18.7 | 67.1 | −26 | 70 | −30.3 |
| 6 | 58.4 | −18.4 | 66.6 | −25.9 | 69.7 | −30.2 | |
| 9 | 57.3 | −18.2 | 66 | −25.8 | 69.3 | −30.1 | |
| 12 | 56.3 | −17.9 | 65.5 | −25.7 | 68.9 | −30.1 | |
| Trajectory 3 | 3 | 40.7 | −12.2 | 48.4 | −20.1 | 51.3 | −24.2 |
| 6 | 39.6 | −11.9 | 47.8 | −19.9 | 50.9 | −24.1 | |
| 9 | 38.5 | −11.5 | 47.3 | −19.7 | 50.6 | −24 | |
| 12 | 37.5 | −11.1 | 46.8 | −19.6 | 50.2 | −23.9 | |
Disclaimer/Publisher’s Note: The statements, opinions and data contained in all publications are solely those of the individual author(s) and contributor(s) and not of MDPI and/or the editor(s). MDPI and/or the editor(s) disclaim responsibility for any injury to people or property resulting from any ideas, methods, instructions or products referred to in the content. |
© 2023 by the authors. Licensee MDPI, Basel, Switzerland. This article is an open access article distributed under the terms and conditions of the Creative Commons Attribution (CC BY) license (http://creativecommons.org/licenses/by/4.0/).


