Preprint
Article

Hybrid Superconducting/Superconducting Mesoscopic Heterostructure Studied by Modified Ginzburg-Landau Equations

Altmetrics

Downloads

79

Views

24

Comments

0

A peer-reviewed article of this preprint also exists.

Submitted:

18 November 2023

Posted:

21 November 2023

You are already at the latest version

Alerts
Abstract
Studies involving vortex in hybrid superconducting devices and their interaction with different components inside the sample are an important issue to reach higher values of their critical parameters in superconducting materials. The vortex distribution on each side of sample with different fundamental parameters, such as temperature T, penetration depth λ, coherence length ξ, electron mass m and the order parameter Ψ, may help to improve the superconducting properties. Thus, in this work, we used the modified Ginzburg-Landau theory to investigate hybrid superconductor (HS), but also to provide a highly tunable and adjustable theoretical tool to theoretically explain the experimental results involving HS, in order to study the vortex behaviour in superconductors of mesoscopic dimensions with extremely differences among their fundamentals parameters. Therefore, we evaluated the influence of HS on vortex configuration and their effects in the field-dependent magnetization. The results show that the during the increment of applied magnetic field H the diamagnetic response of HS, Meissner effect, include additional jumps of magnetization while diamagnetism continues its increase in the sample. In addition, the differences among parameters, create an interface between both components, two different magnitudes of supercurrent and vortex sizes producing a lower degradation of local superconductivity, which increase the upper critical field. On the other hand, this type HS with differences of parameters on both sides can be used to control the vortex movement in the selected superconducting region sample with more accuracy.
Keywords: 
Subject: Physical Sciences  -   Condensed Matter Physics

0. Introduction

Usually, the interconnection of materials at the quantum level with superconducting condensates leads to a leakage of Cooper pairs through heterointerfaces, which is known as the proximity effect [1]. This procedure has become a route to the design of superconducting electronics and the engineering of new quantum states, including the development of hybrid quantum devices, which have opened an important area in research based on advances in fabricating nanostructures with highly controllable accuracy, thus allowing their physical and electronic properties, as well as their power consumption, to be manipulated and tailored. Research on hybrid superconducting structures, which are made up of a superconductor and non-superconducting material, takes the proximity effect into account, as this explains the correlations of adjacent non-superconducting layers [2,3,4,5,6,7,8]. The freedom in the design and fabrication of the heterostructures of emergent two-dimensional (2D) materials [9,10] has opened the possibility for research on the interactions of fundamental properties at the nanoscale. Such research results show that is possible to control the critical temperature, critical magnetic field, and energy gaps in selected regions as a result of the creation of tailored nanostructured superconductors with complex superconductor materials for applications in quantum technology. These developments have allowed new advances, including the superconducting proximity effect in epitaxial graphene induced by a graphene–superconductor interface [11]. Numerical calculations have shown many effects that are usually observed in nanostructured superconductors, and these result in complex vortex patterns when barriers or defects are included [12,13,14,15]. Additionally, the inclusion of anisotropies in superconducting samples through variations in T c in different layers of the sample leads to distinct vortex states and free-energy curves [16,17,18], as well as new possibilities for non-conventional vortex structures [19]. These kinds of systems exhibit a variety of new and interesting phenomena with no counterparts in conventional single-component superconductors [20]. Exotic vortex structures can emerge in a two-component superconductor because of the different length scales ξ i at which the Cooper-pair density varies in each component [21]. Two-dimensional superconductivity has been investigated to find insights into a variety of quantum phenomena; the thermal evaporation and sputtering of metallic films allow the study of most of the basic properties of 2D superconductors [21,22]. The methods for fabrication, such as quantum phase transitions, open new discussions and opportunities for the study of thin-film superconductors with thicknesses from 0.3 nm to 10 nm [23,24].
Previously, fabrication techniques such as molecular beam epitaxy accompanied by surface or interface reconstruction processes and methods for the production of field-effect devices and mechanical exfoliation were introduced into the field of 2D superconductors [25,26,27]; as a result, crystallinity has been greatly improved, even in atomically thick samples. The different phenomena associated with hybrid combinations with other superconductors have shown relevant effects, such as the magnetic field-driven quantum phase transition that takes place electrostatically in superconducting interfaces, among other effects [28,29]. In addition, combinations with low-dimensional semiconductors offer a versatile ground for novel device concepts, such as supercurrent transistors, sources of spin-entangled electrons, quantum computation, and nano-SQUIDS. When a superconductor is coupled with another superconductor, very interesting phenomena take place; both condensates interact with each other at the interface, and the supercurrent can be modulated in this region. In this context, the modulated domain–wall superconductivity offers the possibility of controlling the strength of superconductivity at will. The underlying physics behind such hybrid devices ultimately rely on the superconductors that are selected for coupling.
In the present contribution, we study the fundamental properties and vortex matter of hybrid superconducting samples made of two superconductors, in which each component is well known. The desired parameters of the components, as well as the geometry, type, and distribution of each superconductor, are chosen. In our work, we modified the G-L formalism in order to study hybrid superconducting samples; the interaction between the two densities of the superconductors and the order parameters that occurred in the interface between the soft and wall domains were modulated with high precision by using the fundamental parameters of each superconductor.
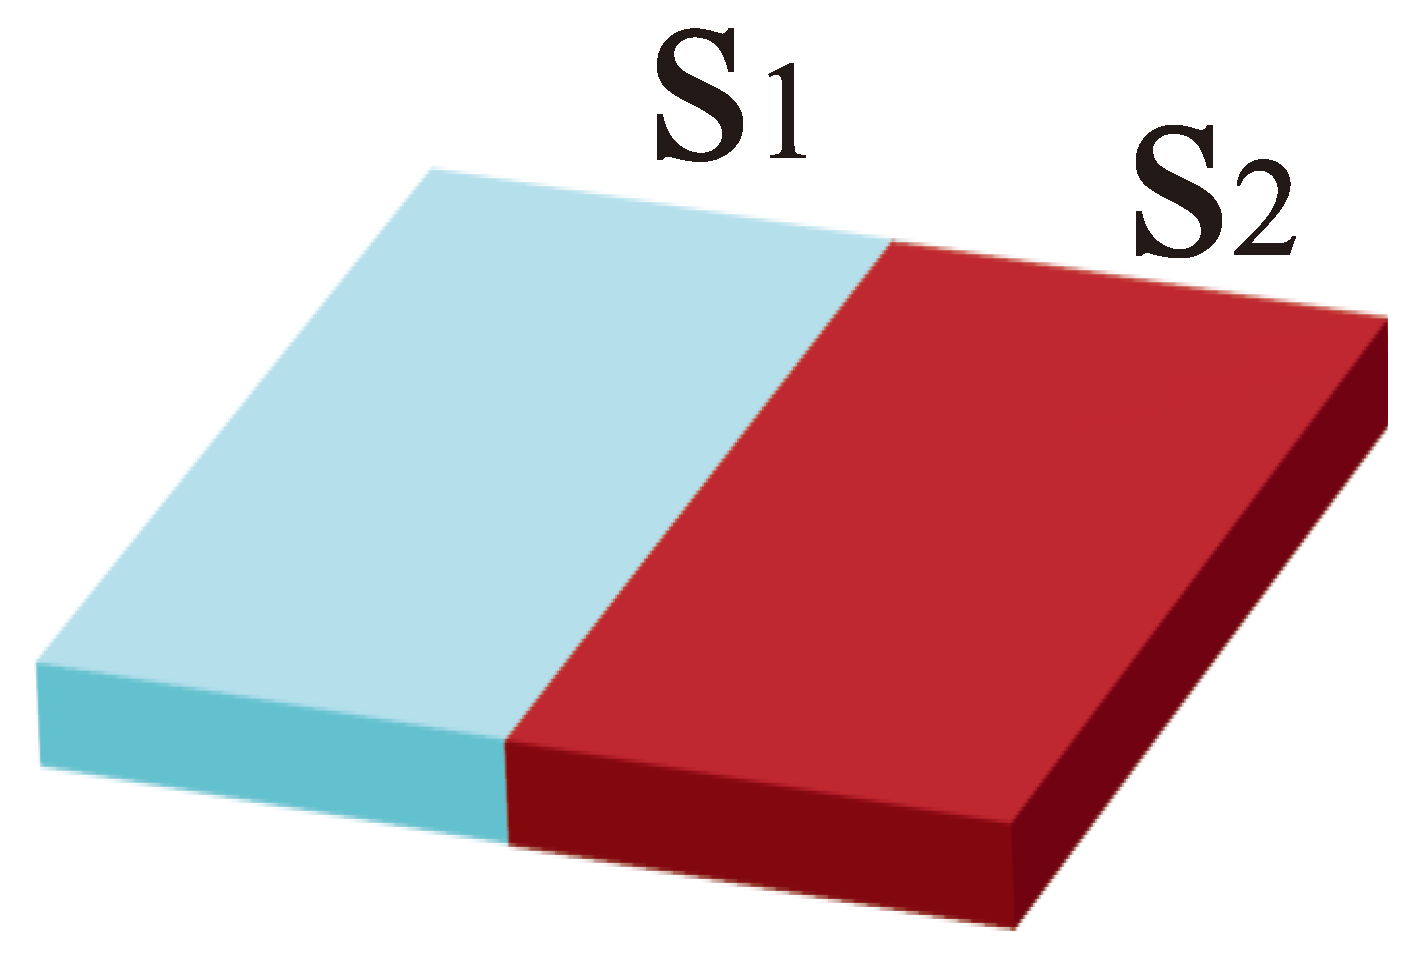
In Sec. 1, we show the derived G-L equations and the ratios of intrinsic parameters of superconductivity, and this procedure is used in the calculations. In Sec. 2, we analyze the results obtained for hybrid samples with two superconducting components divided into two halves (Figure 1). Further, we discuss the issues concerning the distribution and configuration of vortices in the sample, as well as the phase of the order parameter, the density of the supercurrent, and magnetization. The results are finally summarized in Sec. 3.

1. Materials and Methods

We consider an HS with a thickness d that is smaller than the two characteristic lengths for a superconductor system in such a way that the system is effectively two-dimensional. In this study, the two superconductors inside the sample are denoted as S 1 and S 2 ; the quantities are scaled to units that depend on the parameters of S 1 . The theoretical G-L equations were obtained by minimizing the following energy functional:
F = i = 1 , 2 d V [ α i ( 0 ) 1 T T c i | Ψ | 2 + β i 2 | Ψ | 4 + 1 2 m i * × i 2 e c A Ψ 2 + ( H H a ) 2 8 π ]
where H a denotes the applied magnetic field, H is the total local magnetic field, which includes the response of the superconductor, and the index i represents either S 1 or S 2 depending on the location inside the volume V. We include an additional component that scales the functional to the parameters of S 1 with the variables α 1 , β 1 , and m 1 * . Now, by minimizing Eq. 1, we obtain the following for the order parameter and vector potential:
( 1 c T t ) 1 c ξ ψ + c λ c m 2 c ξ | ψ | 2 ψ + ( i A ) 2 ψ = 0
j s = κ 1 2 ( × × ( A A 0 ) ) = c m ( ψ * ( i A ) ψ ) ,
with the following boundary condition:
n ( i A ) ψ | S s = 0 ,
where the parameters are defined as c T = T c , 1 / T c , 2 , c ξ = ξ 2 2 ( 0 ) / ξ 1 2 ( 0 ) , c λ = λ 2 2 ( 0 ) / λ 1 2 ( 0 ) , c m = m 1 * / m 2 * , and t = T / T c , 1 ; in addition, c m , c λ , c ξ , and c T are used. The above equations are given in dimensionless form; distances are measured in units of ξ 1 ( 0 ) = 2 / 2 m α 1 ( 0 ) , the temperature is measured in units of the critical temperature of S 1 ( T c , 1 ) , the order parameter Ψ is measured in units of Ψ , 1 = α 1 ( 0 ) / β 1 , the vector potential is measured in units of A 0 , 1 = c / 2 e ξ 1 2 ( 0 ) , the magnetic field is measured in units of the upper critical field of S 1 , H c 2 , 1 = c / 2 e ξ 1 2 ( 0 ) , and the free energy is measured in units of F 0 = α 1 2 ( 0 ) / β 1 . The region in the sample where an additional superconductor is included to obtain a two-component superconducting thin film, which can be directly modeled by changing the parameters c T , c ξ , c λ , and c m . In other words, many types of two-component superconducting systems can be studied by tuning the parameters with the desired precision. We solve the coupled GL equations self-consistently by using the link variable approach for a finite-difference representation of the order parameter and the vector on a uniform two-dimensional Cartesian grid ( x , y ). The order parameter is calculated by using the first GL equation. The second GL equation is then used to find the supercurrent, and by using the Fourier transform of the supercurrent, the vector potential is calculated; this, again, is used as an input for the first GL equation until a convergent solution for both ψ and A is found. The extended derivation of equations G-L can be detailed in Appendix A.

2. Results and discussion

The two superconductors inside of the sample ( S 1 and S 2 ) each denote half of the nanostructure; the quantities are scaled to units that depend on the parameters of S 1 . The lateral size of the considered square superconducting sample is a = 400 nm, and the width is d = 20 nm. This simulation includes two kinds of type II superconductors for the two halves; we chose the following parameters in superconductor 1 ( S 1 ) and superconductor 2 ( S 2 ): A coherence length of ξ 1 ( 0 ) = 39 nm and ξ 2 ( 0 ) = 20 nm; a penetration depth of λ 1 ( 0 ) = 52 nm and λ 2 ( 0 ) = 200 nm; a critical temperature of T c 1 = 9.25 K and T c 2 = 8.0 K. In addition, the temperature used in the system was T = 6 K, and the parameters were c ξ = 0.26, c λ = 14.79, c T = 1.15, τ = 0.65, and c m = 1.
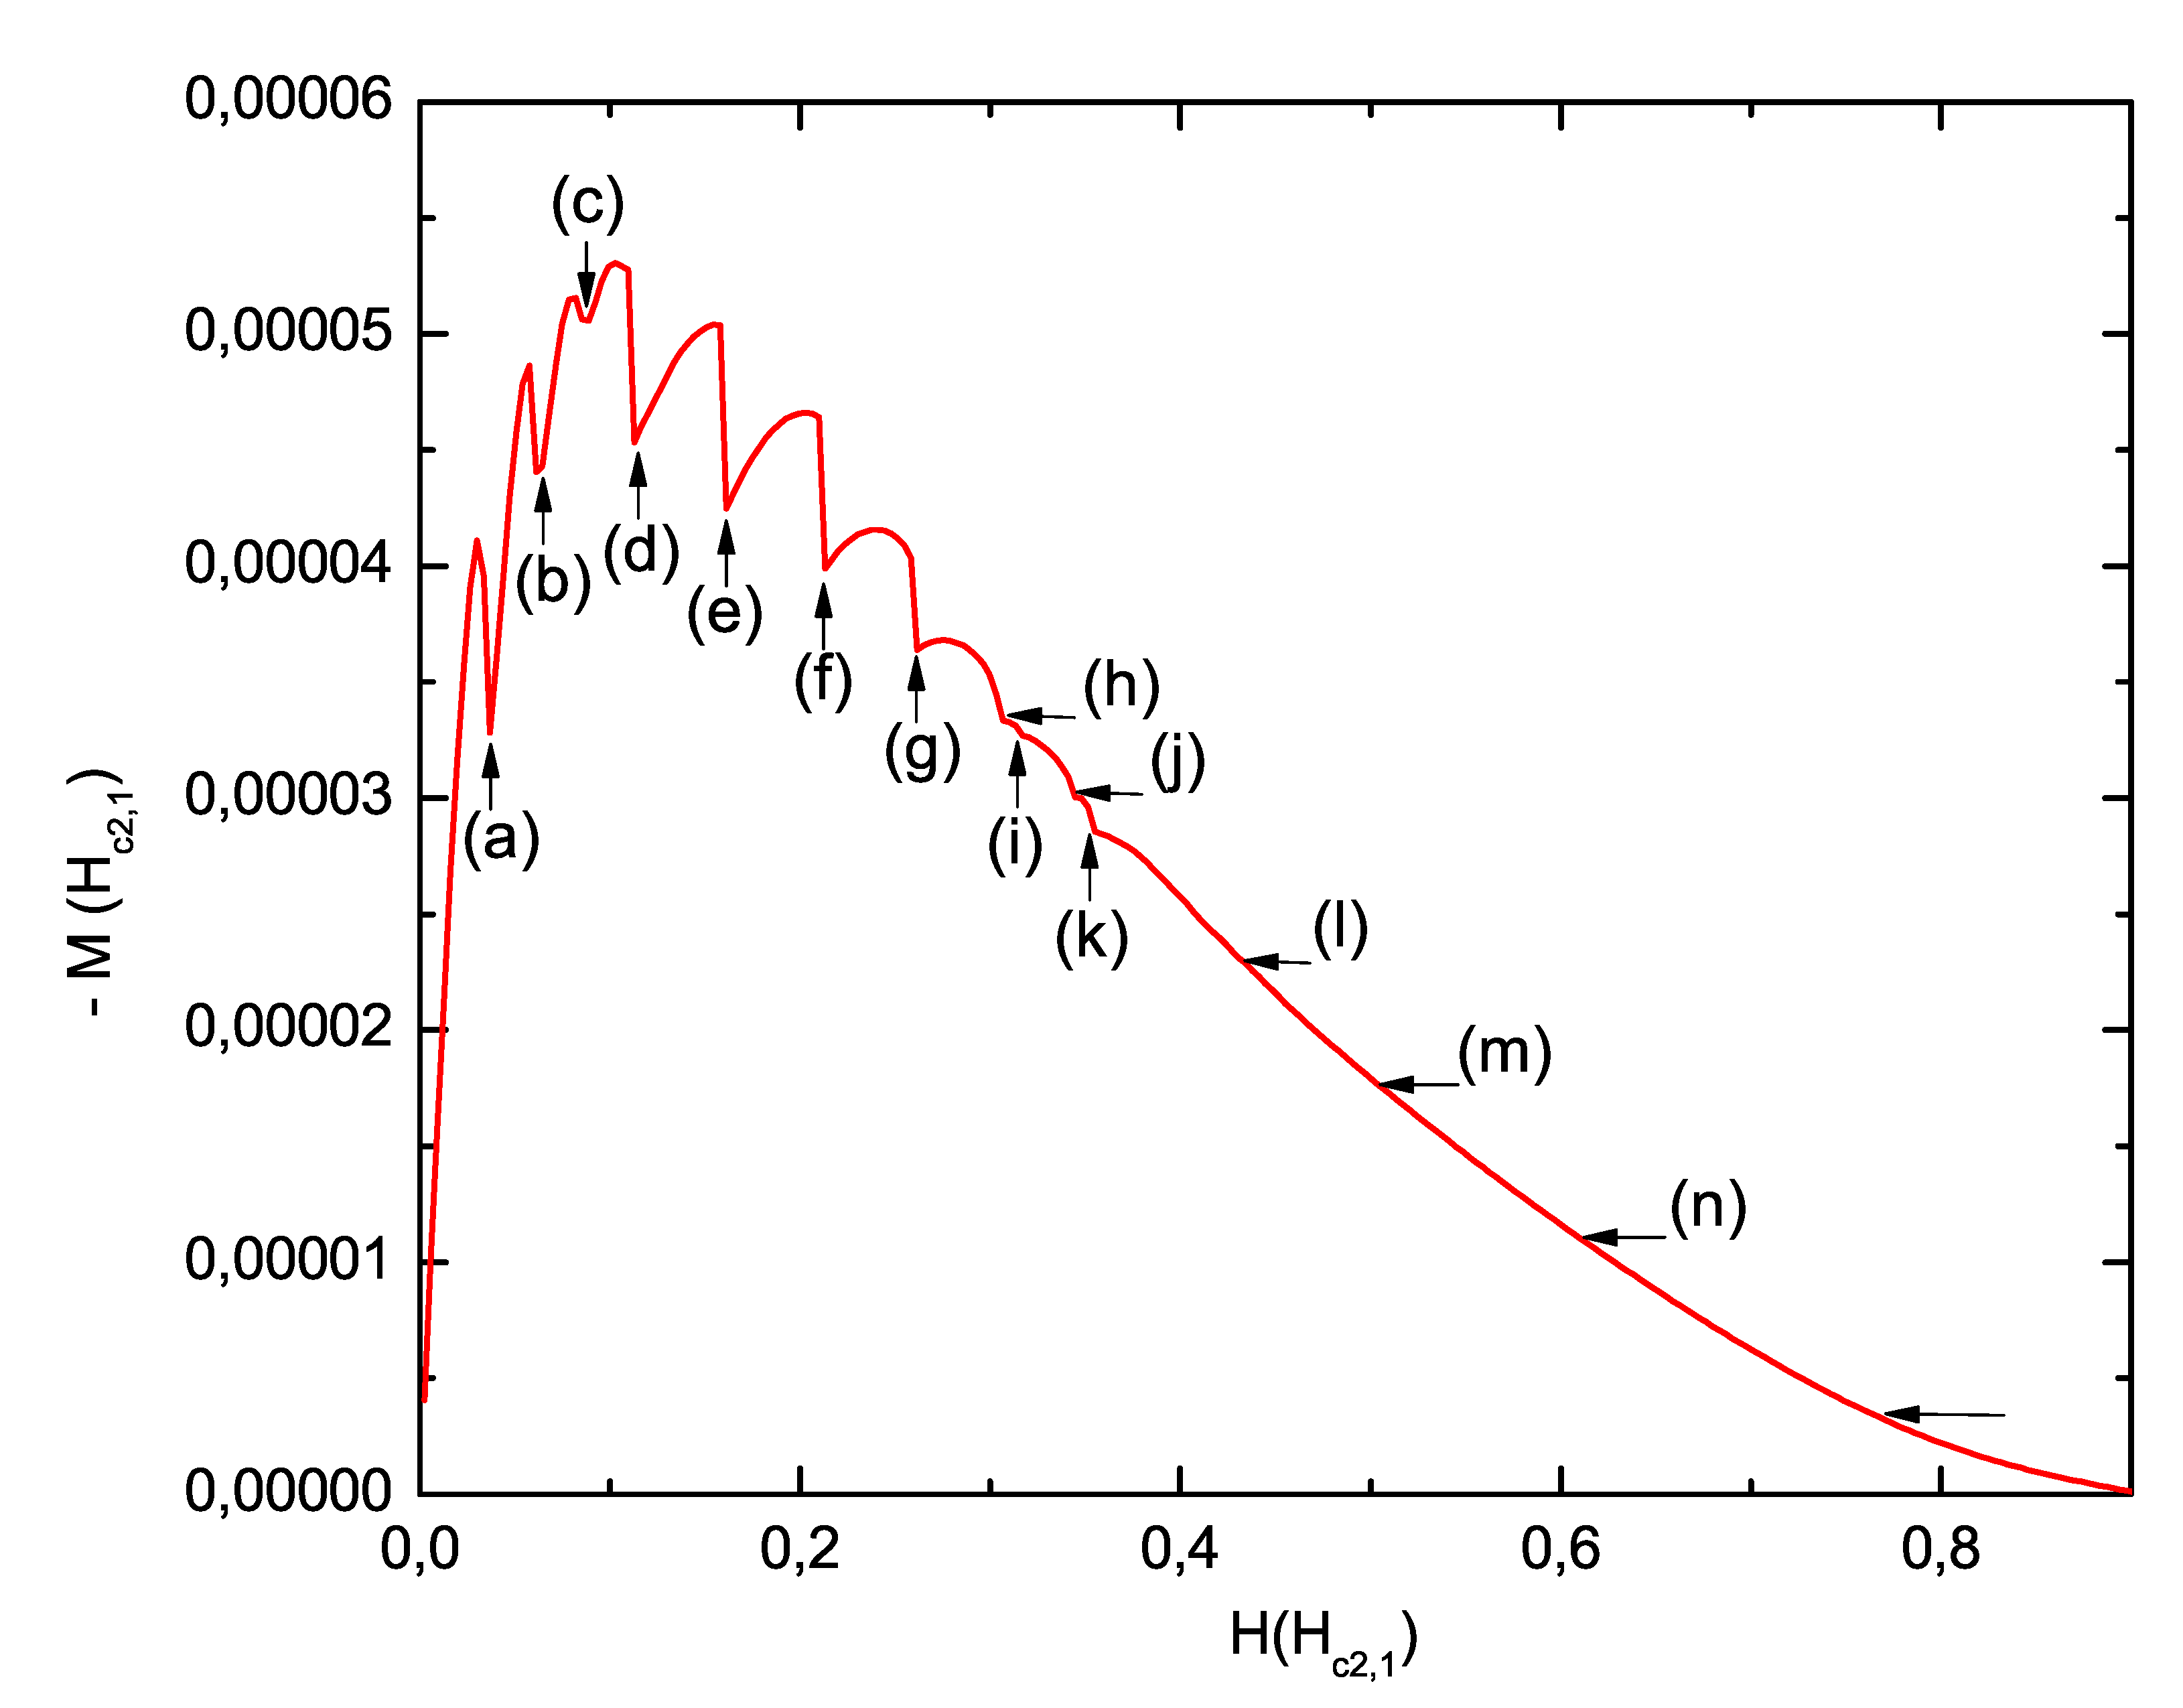
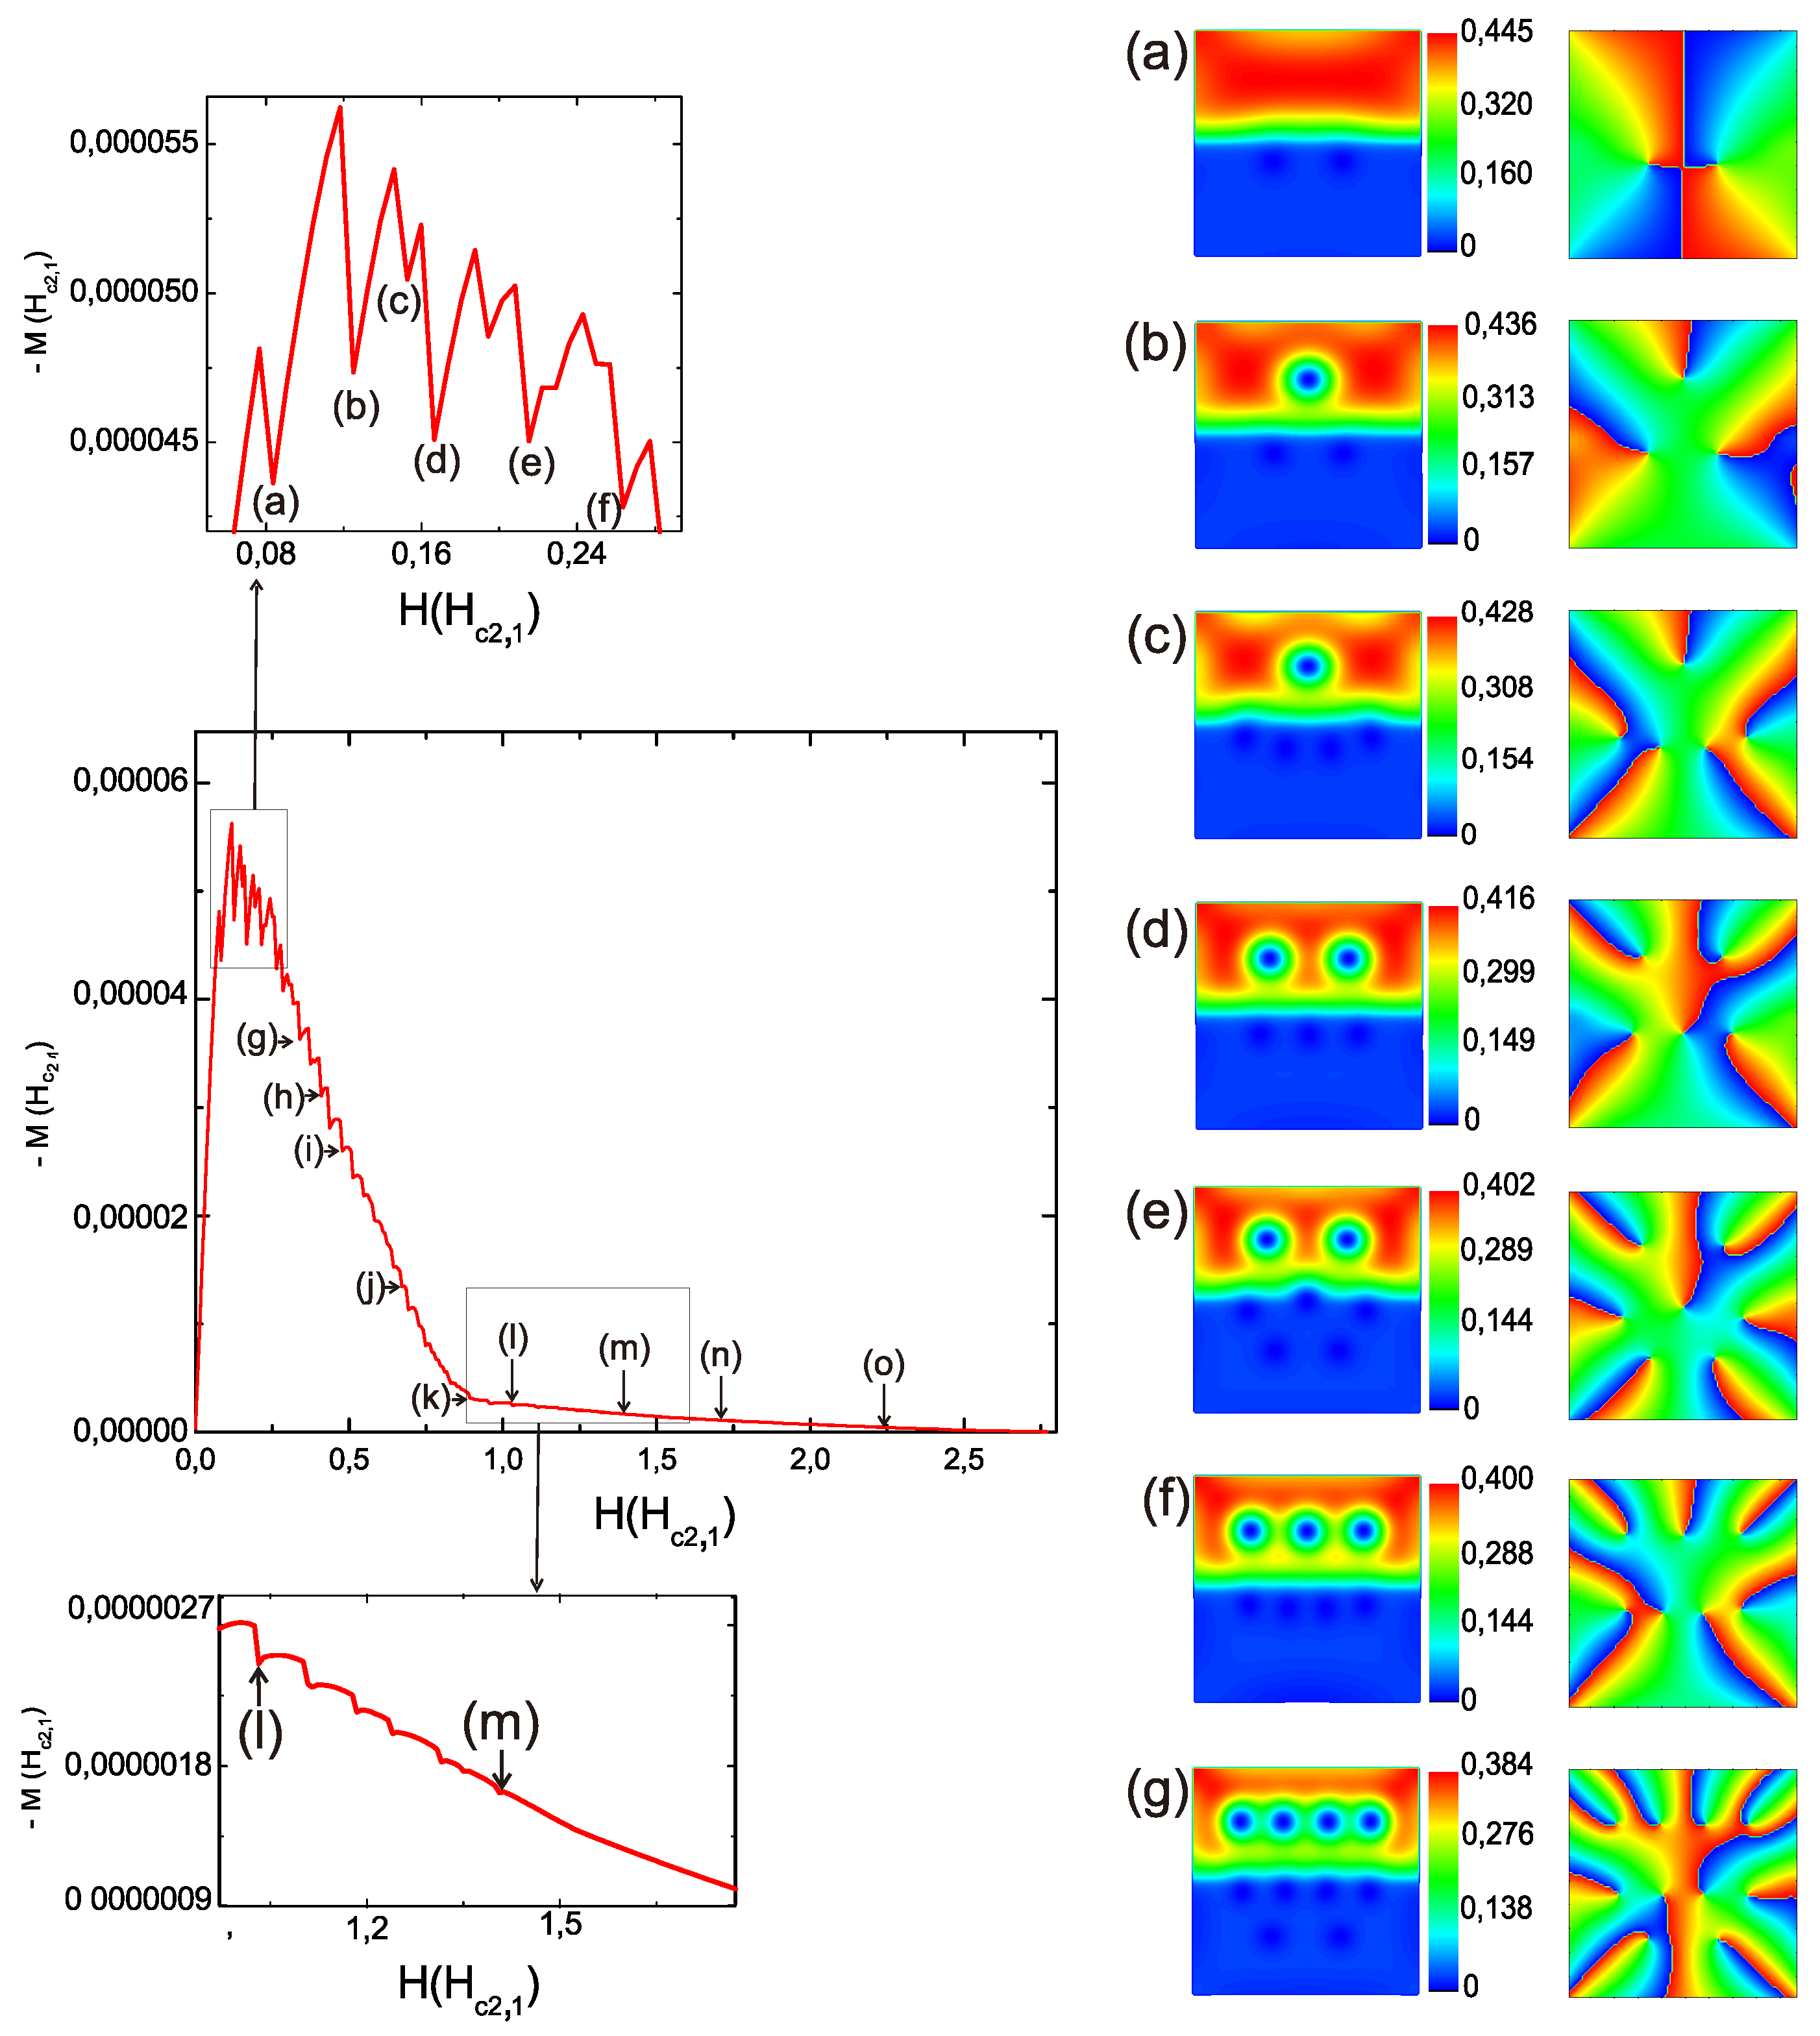
As an example, we chose the coherence length and penetration depth so that the difference between both Ginzburg–Landau (GL) parameters in the sample was large in order to establish a substantial difference between the components and appreciate the behavior of their physical quantities. To begin with, the variation in the magnetization was analyzed in the hybrid heterostructure due to the entrance of vortices into both superconducting components, as illustrated in Figure 2 (left). When the vortices entered into the sample made with one superconducting component, this routinely led to a decrease in the magnetization showing jumps, but the results in the HS showed that after one jump in which the magnetization should have decreased, the Meissner effect still grew with the increase in the applied magnetic field, and a new jump in magnetization took place. [See the snapshot of the magnetization curve in Figure 2 (up) point (a) and (b)].
Figure 2 (right) shows contour plots of the density of the superconducting order parameter for different selected vortex states (first column) and the corresponding phase of the order parameter (second column). The total angular momentum L through Ψ = ψ e x p ( i L ϕ ) was used to characterize the vortex state. The effective angular momentum was L = Δ ϕ / 2 π ; for each clockwise path going from red to blue, a vortex was found: L = 1 , 2 , 3 , . . . . Because L 1 represents the number of vortices in S 1 , we use L 2 for S 2 . After nucleation at the sample surface, the superconducting order parameter | Ψ | was trapped inside the hybrid sample, which had a flux of L ϕ 0 , where ϕ 0 is the quantum flux.
As seen in snapshot (a) of the first column of Figure 2 (right), which corresponds to the states L 1 = 0 and L 2 = 2 , the first vortex lines to enter penetrated the sample in S 2 . The increment in the jump in magnetization was modified by the entrance of magnetic flux into the sample, which was proportional to the size of the vortex. There was a large contribution to M due to the entrance of the vortex into S 1 ( L 1 = 1 and L 2 = 2 ) [see Figure 2(b)(right)]; this was also made clear by comparing points (a) and (b) in Figure 2 (left). This behavior was confirmed when the next two states were compared, as the state in S 1 remained L 1 = 1 while L 2 = 4 [see Figure 2 (right) and (left) point (c)]; then, L 1 = 2 and L 2 = 3 [see Figure 2 (right) and (left) point (d)].
For the six points (a–f) of the magnetization curve that were selected, the entry of the magnetic flux ( Φ ) and the variation in the magnetization ( Δ M ) are given in Table 1. The range of the applied magnetic field that was considered was from H = 0 to H = 0.268 H c 2 , 1 ( 0 ) , where the magnetization jumps were more pronounced [see the snapshot in Figure 2 (up)]. It was observed that points (b) and (d) showed larger variations in the magnetization ( M ); only one vortex penetrated into S 1 from S 2 , and the entry of flux ( Φ ) could represent this behavior [see Table 1]. Similar behaviors were observed in points (e) and (f), where a single vortex also penetrated into S 1 , but at the same time, two vortices penetrated S 2 , resulting in lower values of Φ than those of points (b) and (d). Although only one vortex penetrated S 1 in the transitions of (b)–(d) and (e)–(f), there were differences in the values of Δ M and Φ 0 due to the number of vortices that penetrated S 2 , which reduced the internal values of the superconducting condensate; therefore, the magnetization and magnetic flux were reduced [see Table 1].
One consequence of simulating a superconductor system with two superconducting samples is that it is necessary to obtain two upper-critical magnetic fields: H 2 , 1 ( 0 ) and H 2 , 2 ( 0 ) . These values are determined in a superconductor system by using the following equation:
H 2 ( 0 ) = H 2 , 2 ( 0 ) 2 κ 2 = ξ 1 2 ξ 2 2 H 2 , 1 ( 0 ) 2 κ 2
For S 1 , we obtained H 2 = 0.268 H 2 , 1 , while for S 2 , we obtained H 2 = 0.530 H 2 , 1 ; thus, S 1 would reach its normal state before S 2 , which implied that one half of the hybrid superconductor would behave as a metal in the normal bonded state, with the other half still being in the superconducting state. This is similar to the behavior of a superconductor sample with Newman boundary conditions. This was reflected in the behavior of the magnetization curve [Figure 2(left)], where from point (g) to approximately point (k) was the section in which the peaks corresponded to the magnetization for one superconductor. In addition, we calculated (third critical field) H 3 ( 0 ) = 0.8962 H 2 ( 0 ) , which was related to the surface superconductivity, from the relation H 3 ( 0 ) = 1.69 H 2 ( 0 ) . We noticed that the curve continued to decline beyond the value of H 3 from point (k) in the magnetization curve until it reached zero. This reflected the existence of regions in the superconducting state in the sample did not display the typical surface superconductivity. From point (k), one can expect that the magnetization curve [Figure 2(left)] would continue with the same inclination and reach the normal state at H 2 , which would be less than that reached in this case of H 2 2.5 H 2 ( 0 ) .
How do the vortex states look in a hybrid superconducting sample with a square geometry? High values of the order parameter | Ψ | 2 are indicated by red regions, whereas lower values are indicated by blue regions. It is known that the coherence length is the scale of the characteristic length over which | Ψ | 2 is normalized, and it is related to the size of the vortex core. Therefore, it is intuitive that the size of the vortices will change when they penetrate from one superconductor into another, as shown in the following figures depicting vortex states.
Figure 2 (right) (a–f) shows the density of the order parameter for vortex states with different values of L 1 and L 2 in each superconductor. For L 2 = 2 and L 1 = 0 , the entry of the first vortex took place in S 2 at H = 0.083 H c 2 , 1 , as shown in Figure 2 (right) (a). These vortices penetrated through the component with a lower value of | Ψ | 2 . In the next state [Figure 2 (right) (b)], L = 1 in S 1 and L = 1 in S 2 , which meant that one new vortex penetrated S 2 , and one vortex did the same in S 1 from S 2 at H = 0.125 H c 2 , 1 .
In this state, the biggest variations in the magnetization and entry of flux were reached [Table 1 (b)]. For L 2 = 4 and L 1 = 1 , there were two more vortices in S 2 that joined the others close to the boundary between the two components. Once the vortices penetrated S 2 , they moved away from the screening currents in its boundary, but the vortices could not reach the middle of the sample due to the screening currents of S 1 . Additionally, despite the vortex states of L 2 = 4 and L 1 = 1 [Figure 2(right)(c)], only two vortices penetrated S 2 , as in the states of L 2 = 2 and L 1 = 1 [Figure 2(right)(b)]; the variations in the magnetization and flux were minor in comparison with those of the states in [Figure 2(right)(b)] [see Table 1].
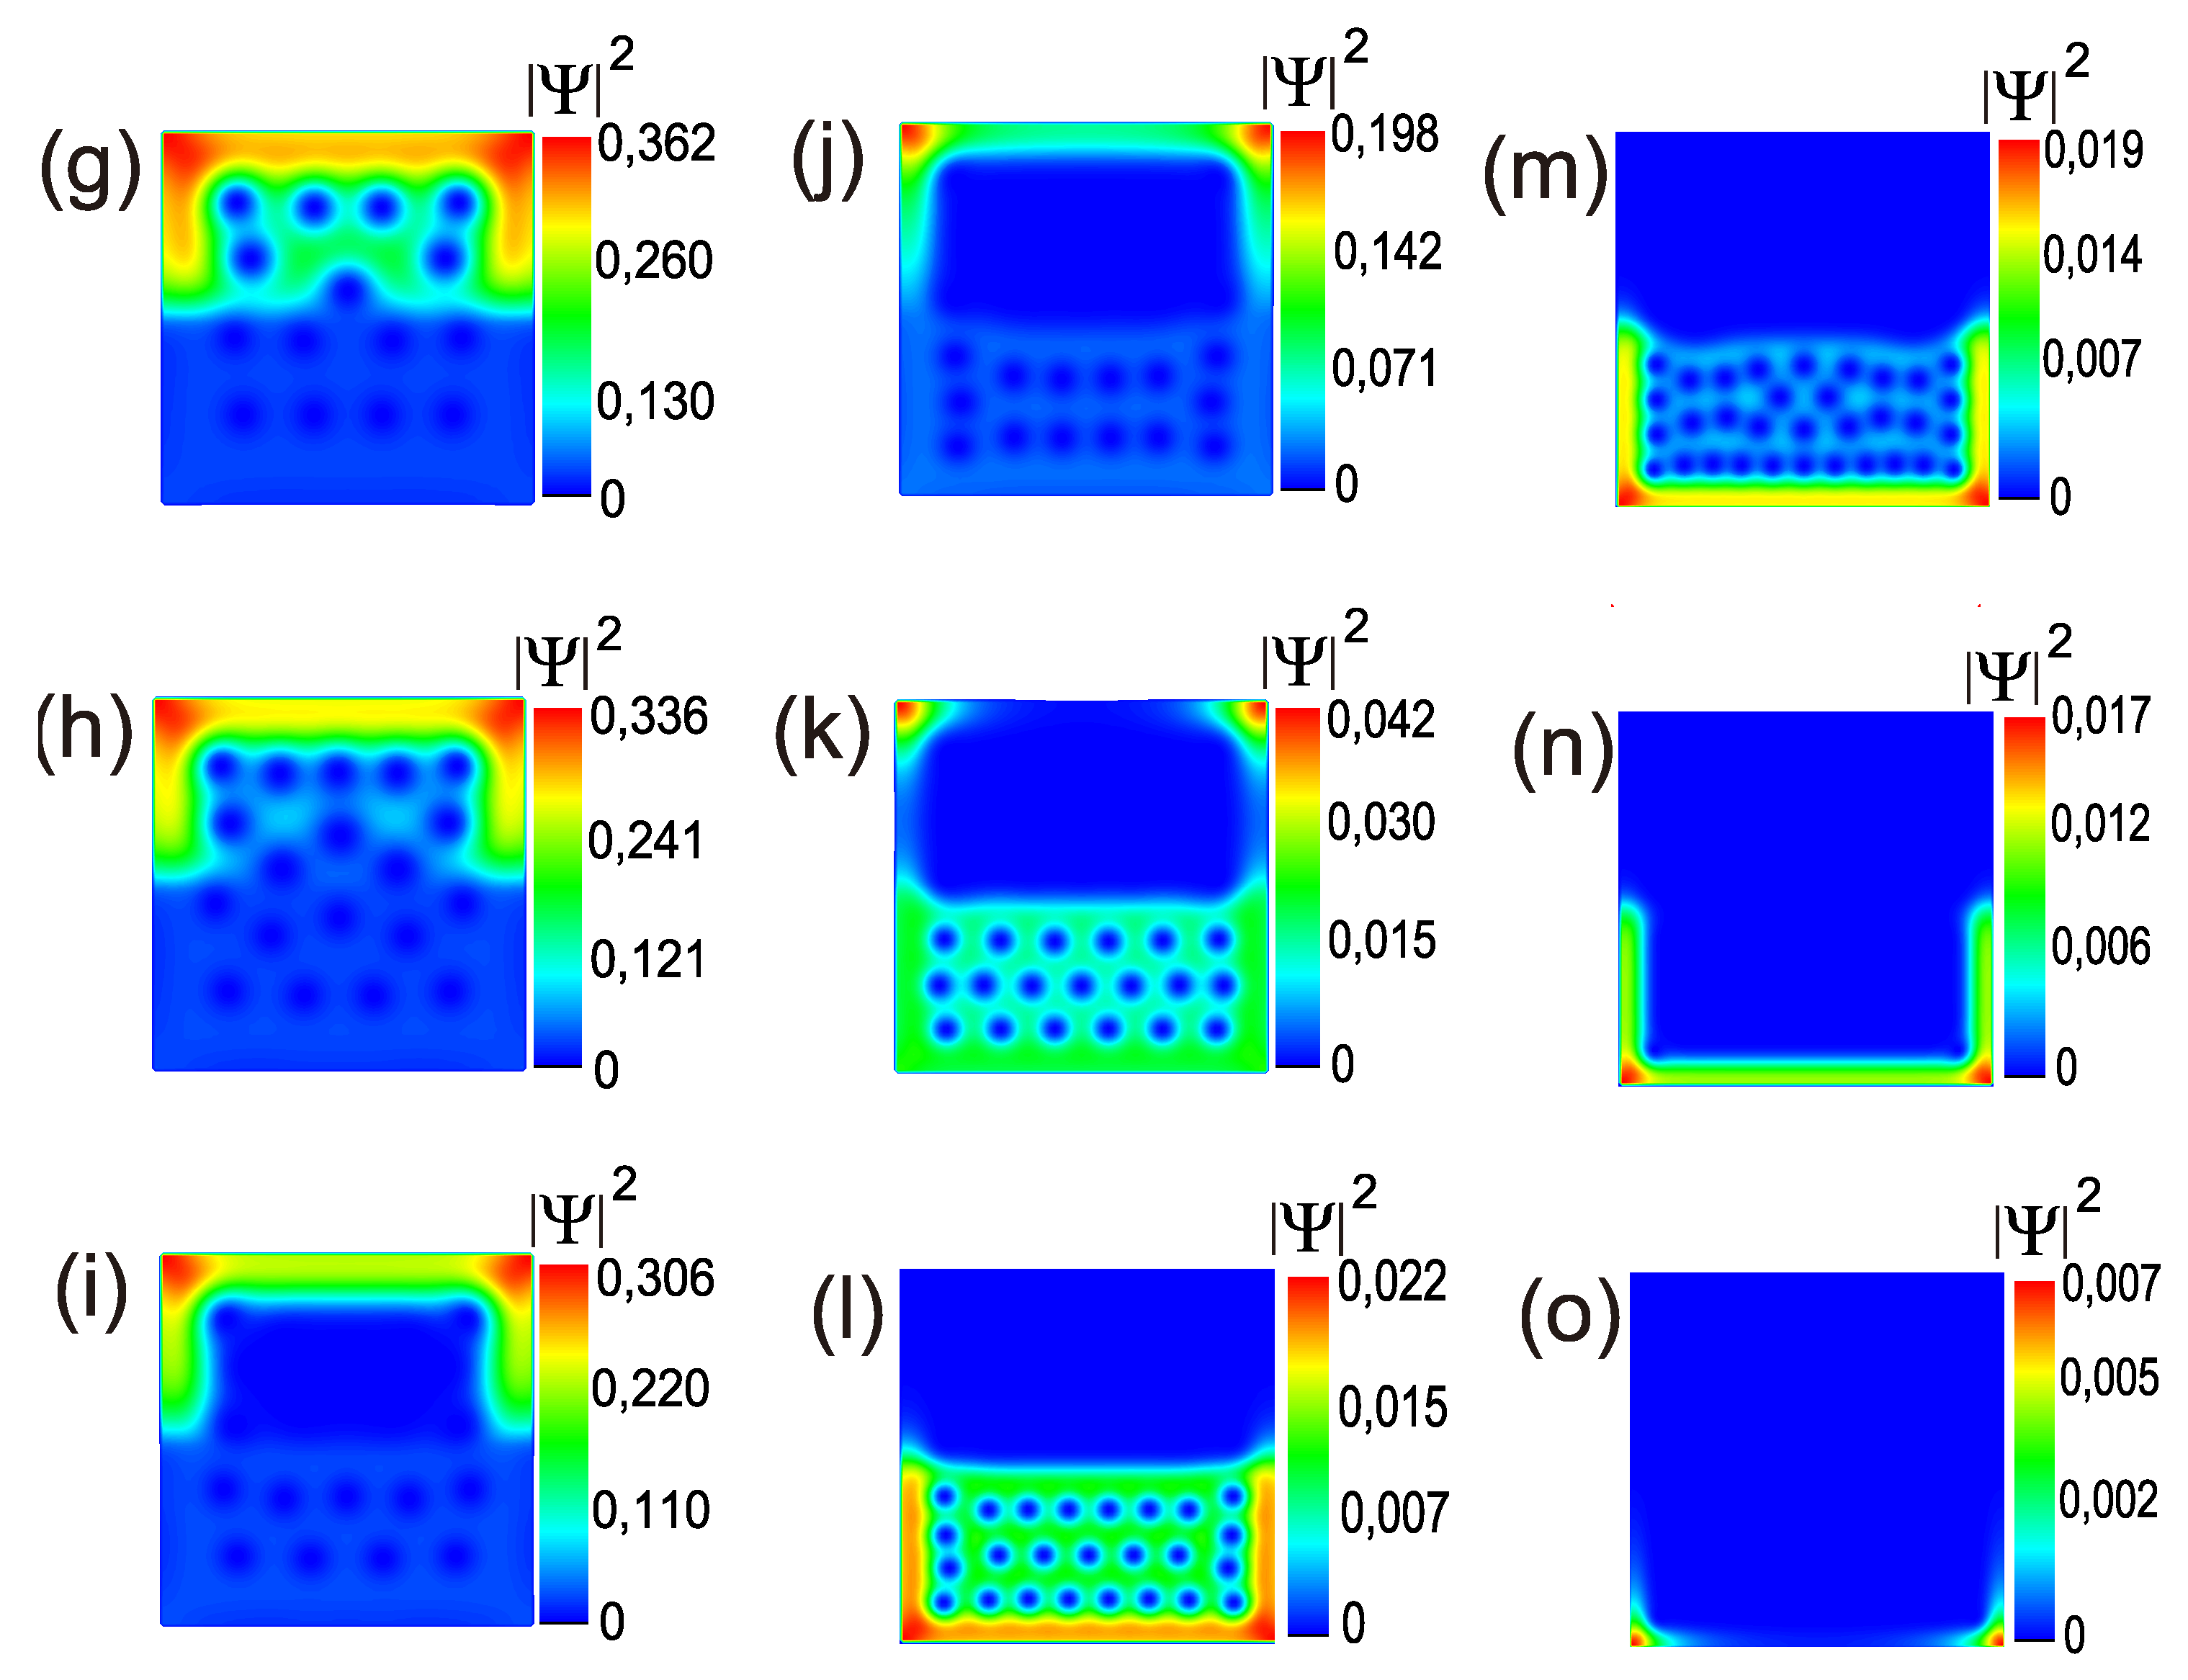
Figure 3 (g–k) displays the transitions from point (g) at H = 0.332 H c 2 , 1 to (k) at H = 0.875 H c 2 , 1 [Figure 2(up)]. Because the size of the vortices in S 1 was larger than that of the vortices in S 2 , taking into account that the vortex radii were dependent on the coherence length ( ξ 1 ( 0 ) = 39 nm and ξ 2 ( 0 ) = 20 nm), S 1 reached the normal state before S 2 did [see Figure 3 (l)]. Then, vortex entry from S 1 , which already achieved the normal state, into S 2 occurred; this increased the number of vortices inside it [see Figure 3(m)]. In contrast, a superficial condensate was obtained in S 1 [see Figure 3(n)], and finally, this was found only in the corners of S 2 [see Figure 3(o)] until the total normal state was reached.
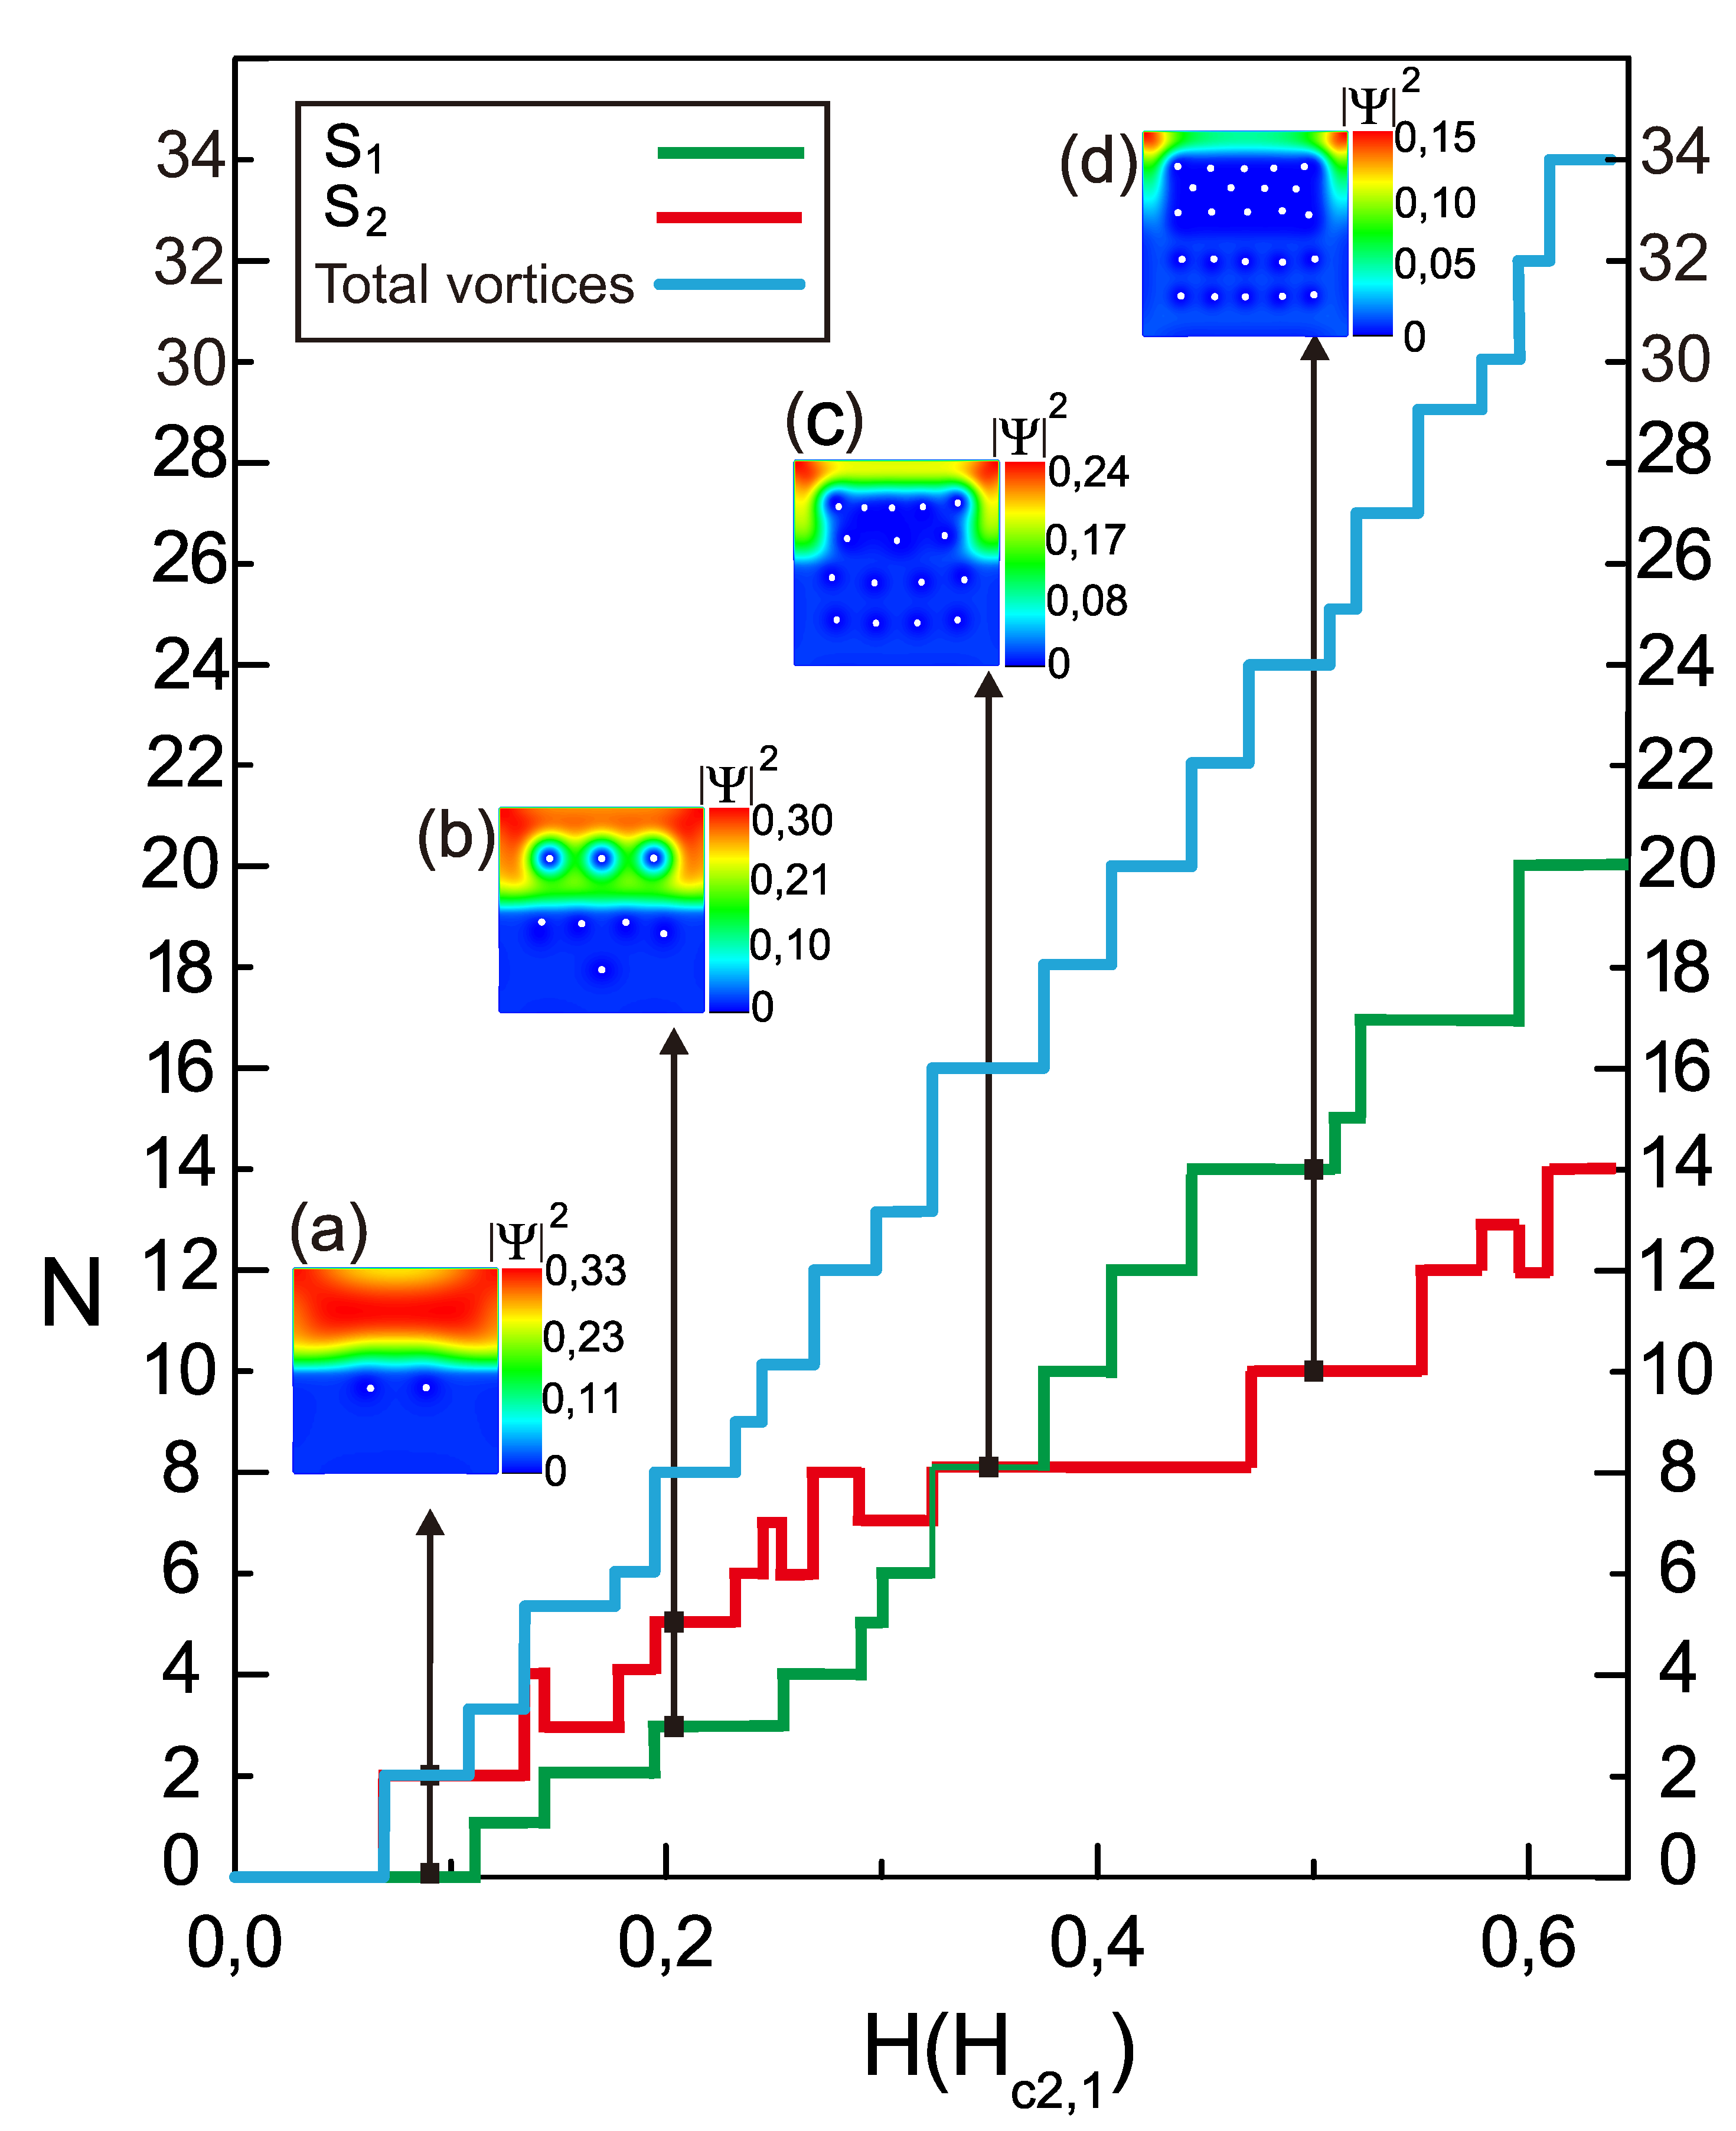
Figure 4 shows the characteristics curves of the vorticity as a function of the applied magnetic field. The numbers of vortices in each component of the hybrid superconducting sample were N 1 ( S 1 ) and N 2 ( S 2 ). As a result of the presence of two superconductors in the same sample, the vortex transitions followed distinct dynamics in each case, but when following the curves for each component, we found that the number of vortices in S 2 increased and decreased, while that in S 1 only increased. The number of vortices was the same in both components for several values of H [see Figure 4(c) (inset)] in the state where N 2 = 8 and N 1 = 8 . Therefore, the values of the order parameters in both components behaved similarly for a certain range of values of H. Finally, as is more clearly shown in the inset of Figure 4 (d), it is interesting to note the inversion of the curves and, with it, the variation in the number of vortices on each side of the hybrid superconductor, as evidenced in the state where N 2 = 10 and N 1 = 14 at H = 0.512 H c 2 , 1 . Here, the number of vortices was lower in S2 than in S1, and N 1 always grew. This result was because the superconducting condensate depreciated almost everywhere in S 1 ; the screening currents decreased, causing a greater increase in the number of vortices in S 1 that penetrated from S 2 .
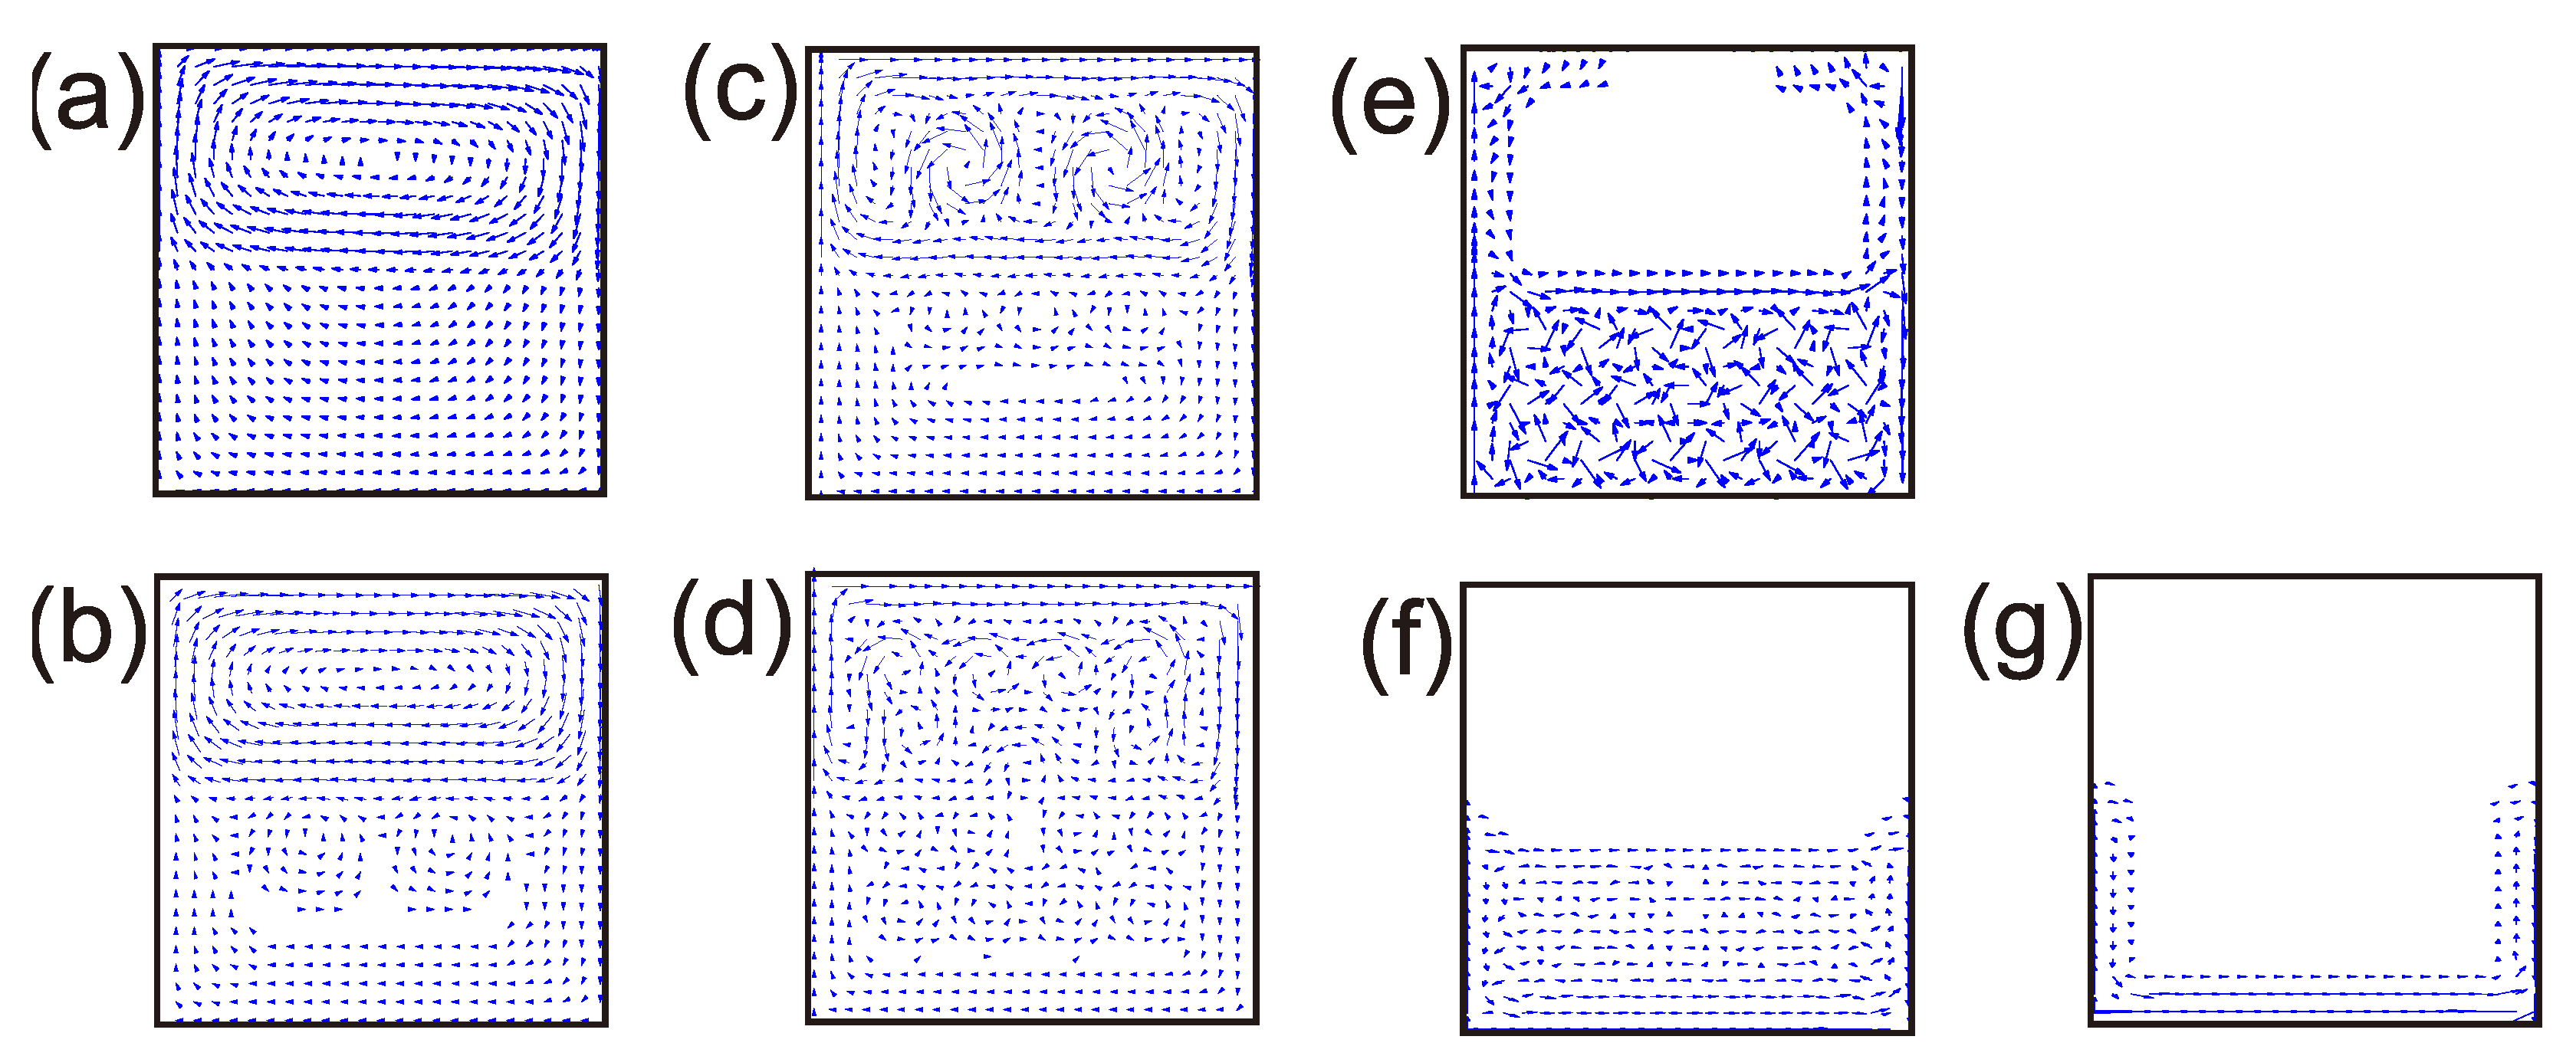
Figure 5 shows the behavior of the supercurrent density, and the size of the vortices in each component can be observed.
Figure 5 (a–g) shows the vector plots (blue arrows) of the supercurrent in the superconducting square with two components for the states at H = 0.02 H c 2 , 1 , H = 0.083 H c 2 , 1 , H = 0.167 H c 2 , 1 , H = 0.263 H c 2 , 1 , H = 0.688 H c 2 , 1 , H = 1.035 H c 2 , 1 , and H = 1.713 H c 2 , 1 , respectively. In Figure 5(a), it is clear that the supercurrent in the sample flowed clockwise, but it changed its magnitude in S 1 and S 2 , thus proving the existence of two kinds of components in the same sample under the same applied magnetic field. Therefore, it was possible to see that the current was larger in S 1 than in S 2 , and this explained why the vortex entry occurred in S 2 first. The size of the current is indicated by the length of the arrows flowing counterclockwise around the vortex in the center. Figure 5 (b) and (c) show the differences between the sizes of the currents around the vortices in S 1 and S 2 , which are directly related to the quantization flux in each component; they are also reflected in the variations in the measurement of the magnetization in the sample [see Figure 2] when the vortex penetrated into S 1 from S 2 .
Now, a hybrid system is considered in which the parameters were selected to simulate a type II superconductor and a type I superconductor; the size of the superconducting sample was a = 400 nm and d = 20 nm. The following parameters were chosen for S 1 and S 2 : a coherence length of ξ 1 ( 0 ) = 39 nm and ξ 2 ( 0 ) = 120 nm, a penetration depth of λ 1 ( 0 ) = 52 nm and λ 2 ( 0 ) = 72 nm, and a critical temperature of T c 1 = 9.25 K and T c 2 = 8.0 K. The temperature used in the system was T = 6 K, and the parameters were c ξ = 9.46, c λ = 1.91, c T = 1.15, τ = 0.65 and c m = 1. In this analysis, we are interested in the magnetization behavior of a hybrid superconductor when one of the halves ( S 2 ) is a type I superconductor, while S 1 retains the same parameters. In addition, in this case, the profile of the magnetization in response to the applied magnetic field variations is not typical.
In the present case, the first vortex state was obtained ( L 2 = 1 and L 1 = 0 ) [Figure 6 (a)] at H = 0.036 H c 2 , 1 , but as in the previous case, the magnetization did not decrease after reaching its first vortex entrance. For the two next vortex states— L 2 = 2 with L 1 = 0 at H = 0.063 H c 2 , 1 and L 2 = 2 with L 1 = 0 at H = 0.088 H c 2 , 1 —the curve showed an increase in the magnetization [Figure 6 (b-c)]. At the same time, the peaks shown in (a–c) displayed a decrease in magnetization until the top of the curve was reached. It is clear that the increase in magnetization was due to S 1 , while vortices that penetrated S 2 , which still increased with every step of H, as a consequence of the magnetization did not start to decay with the entry of the first vortex into S 2 , but following peaks were reduced because of every vortex that penetrated S 2 . As a result of this, it was shown that the thin hybrid superconductor made of type I/type II compounds displayed unconventional magnetic properties that have no counterparts in single-component systems.
In points (d–g) of Figure 6, the number of vortices entering S1 was L 1 + 1 , and a similar situation occurred in points (b,d–f) of Figure 2. However, in the case of the type II/type II sample, there were peaks between these points; therefore, the magnetization curve shows the changes due to the entry of vortices into S 2 . Nevertheless, this did not occur in our case with the type I/type II sample; the changes were not noticeable because the magnetization dropped off faster in S 2 than in S 1 , where a normal state was reached at H = 0.124 H c 2 , 1 and H = 0.530 H c 2 , 1 , respectively. Additionally, superficial superconductivity remained in the sample until the value of the applied magnetic field reached H = 0.896 H c 2 , 1 .
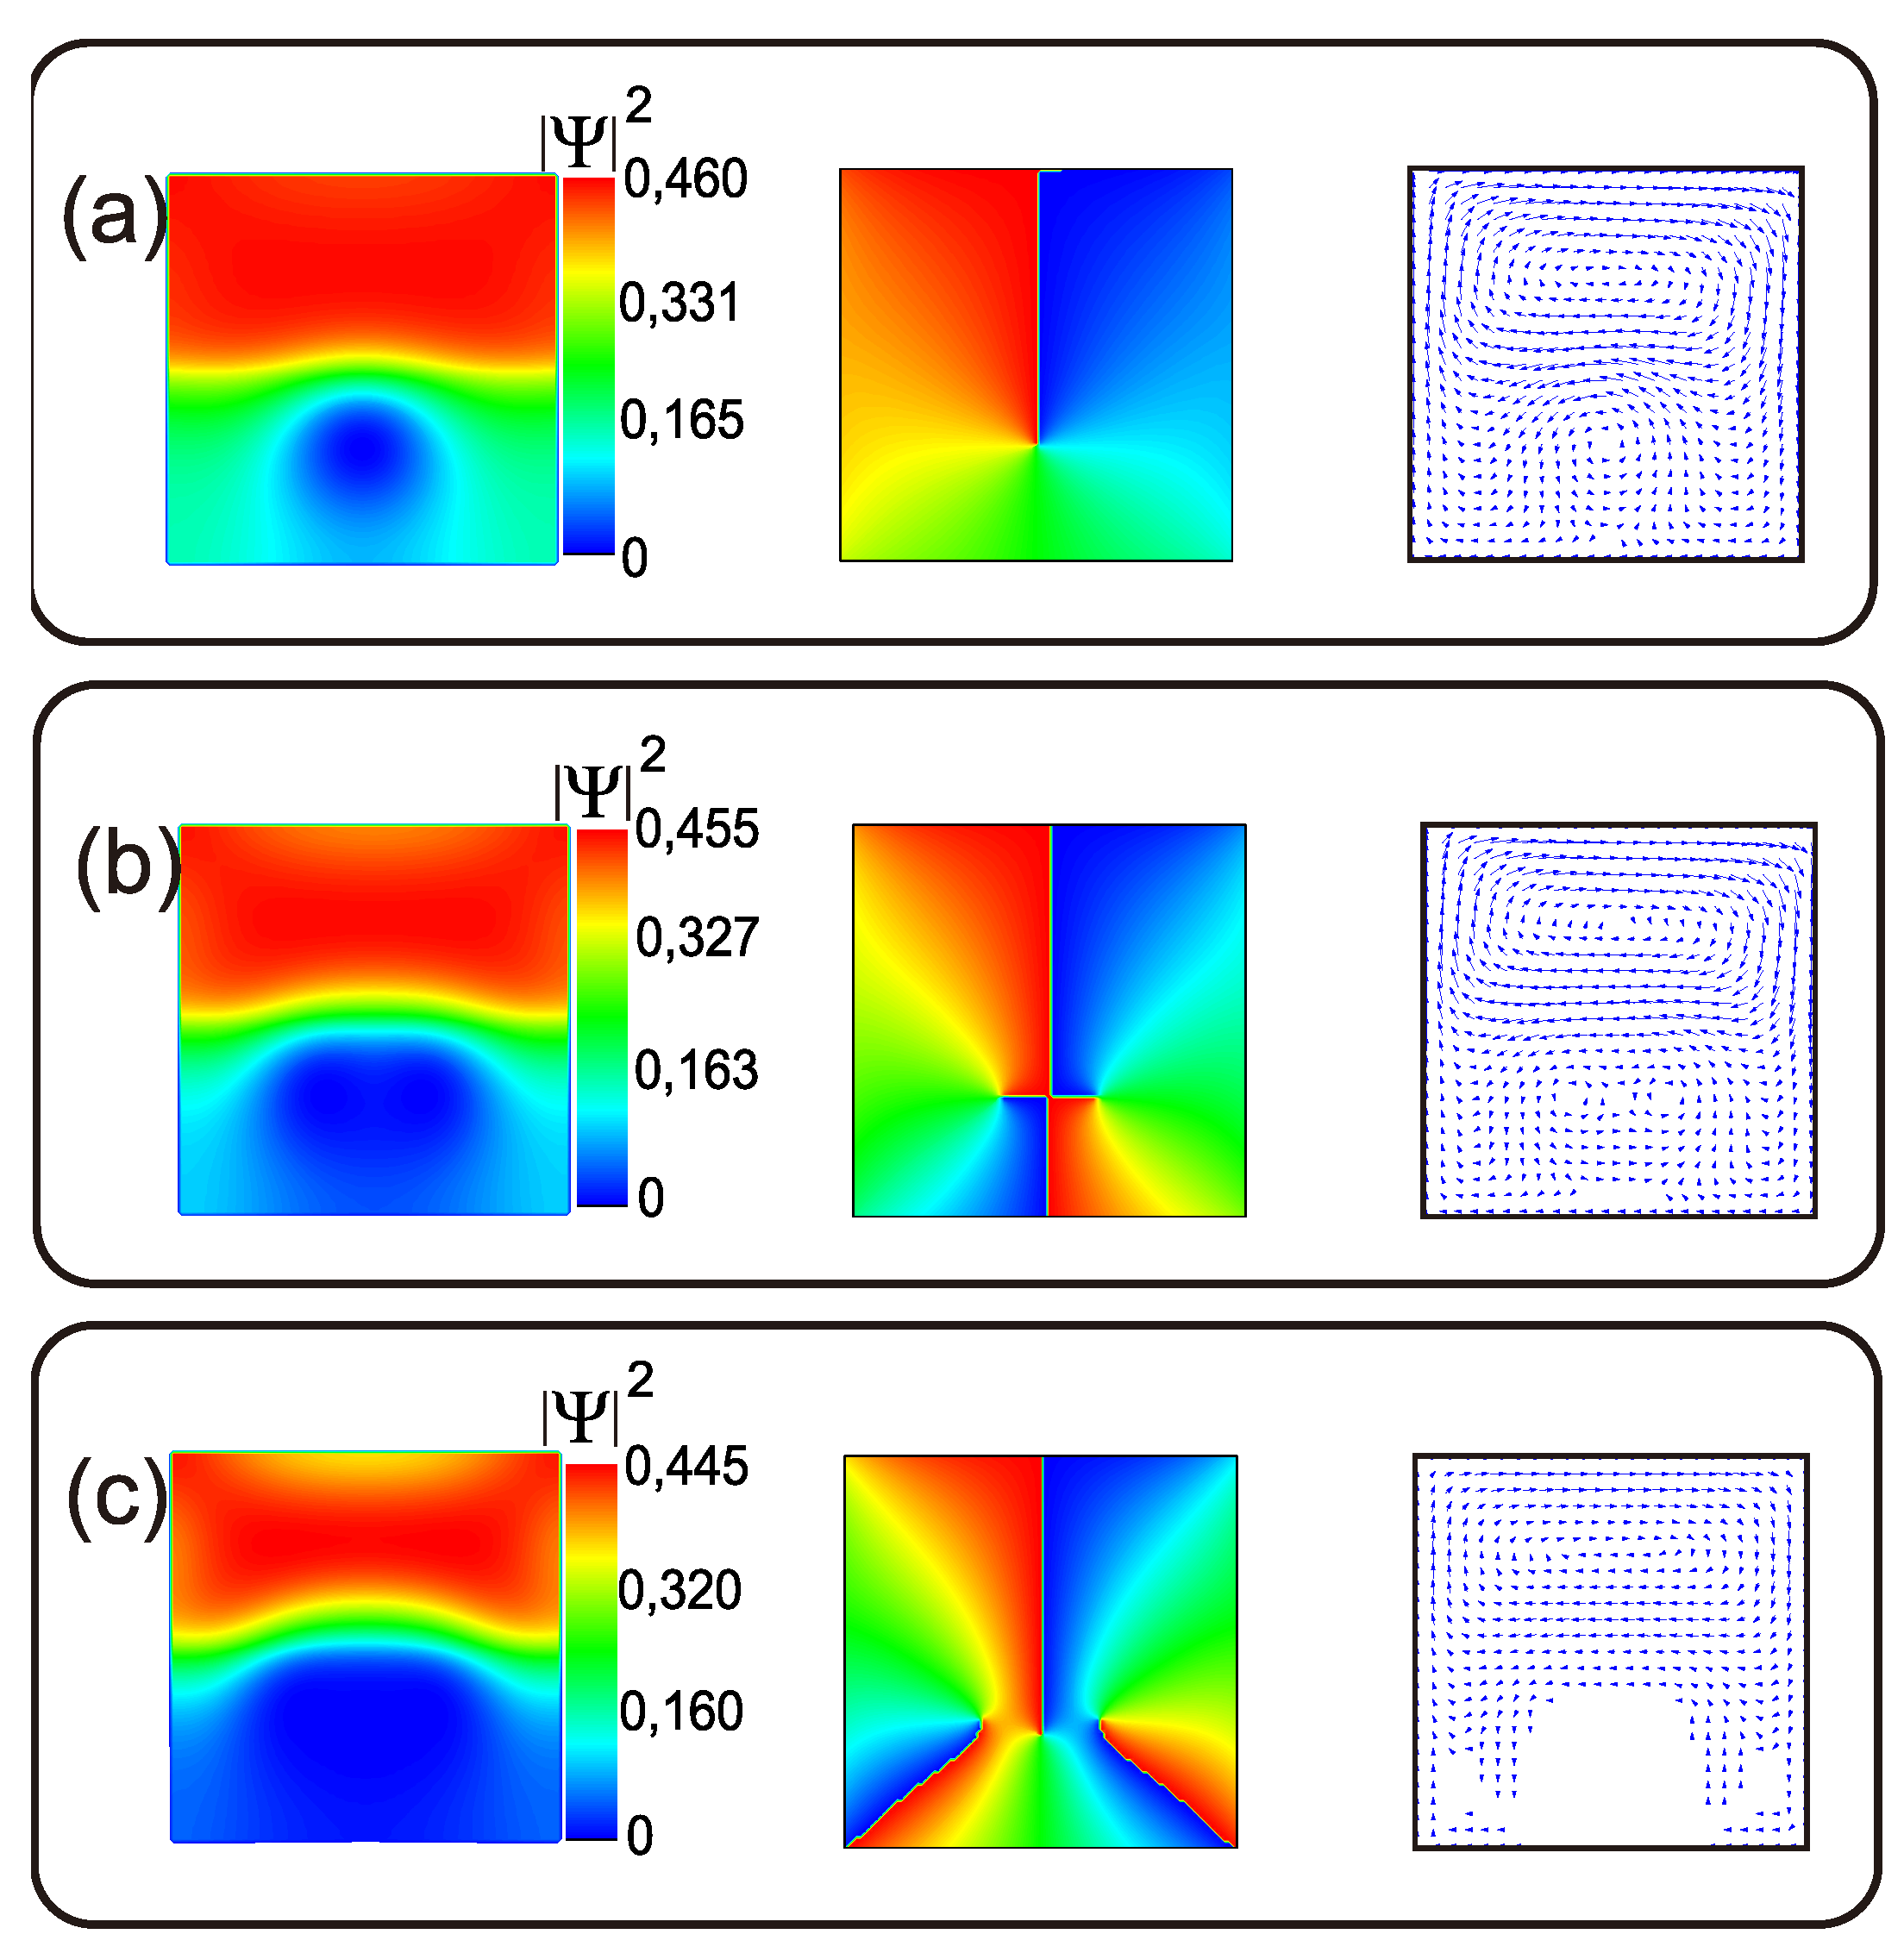
This behavior was related to the parameters that were selected to simulate S 1 and S 2 in the same sample; this can be explained with Eq. 2. In this case, 1 / c λ = 1.91 and 1 / c m = 1.0 , which meant that ψ , 2 2 was lower than ψ , 1 2 ; therefore, as in the previous section for the case of the type II/type II sample, transitions with large variations in the magnetization curve were produced in S 1 , whereas small variations were produced in S 2 . For the six selected points (a–g) on the magnetization curve, the vortex states in S 1 ( L 1 ) and S 2 ( L 2 ), the entry of magnetic flux, and the variations in the magnetization ( Δ M ) are given in Table 2. It is noticeable that the values of the entry of flux ( Φ 0 ) at points (a–c) in Figure 6 showed a reduction in the peaks of the magnetization curve, whereas at point (d), Δ M and Φ 0 grew again; then, these quantities decreased once again [see points (d–g) in Table 2]. Points (a–c) in Figure 7 show the vortex configuration that was obtained for a very strong type I superconductor ( S 2 ) in one half, whereas the other half was occupied by a type II superconductor ( S 1 ). With low fields, we observed a configuration of vortices in only S 2 , which was indicative that the value of the supercurrent was lower than that in S 1 [see Figure 7(a)]. A value of ξ 2 that was larger than that of λ 2 was selected for the simulation of the type I superconductor in this sample, and ξ 2 is why the size of vortices increased, thus allowing fewer vortices in S 2 in comparison with the case of the type II/type II sample. In consequence, the superconductivity quickly depreciated in S 2 , as can be seen in the first column in Figure 7(c), where there were only three vortices. The number of vortices can be noticed in the second column of the phase of the order parameter in the same figure. This depreciation could also be noticed in the diminution of the supercurrent in S 2 , which was represented by arrows in this simulation; these disappeared in some regions of the sample, which implied that these regions were in the normal state [see Figure 7, third column]. Moreover, in Figure 7, it is noticeable that the magnetization increased despite the entry of vortices into the sample, and the first three peaks decreased. This behavior of the magnetization curve can be explained by the snapshots of the supercurrent because, as the applied magnetic field increased, it significantly decreased in S 2 , while in S 1 , it still contributed to the increase in magnetization.
As shown in Figure 7, it was possible to approximate the position of the vortex in each component of the phase of the order parameter at the endpoint, which is shown by a change from blue to red in the figure. If the figures of the superconducting current density are overlaid with the corresponding phase of the order parameter, they must match the center of the vortex and the endpoint of the phase (see Figure 7, second column). The relevant results of the inclusion of a type I superconductor in the sample show that the value of H at which the first entry of a vortex into S 1 occurred could be modified by choosing the correct S 2 for the other half. This possibility offers multiple options for controlling the magnetization, as well as the inputs of vortices, in a hybrid superconductor for the specific design of superconducting electronic devices.
3. Conclusions

In summary, we presented a theoretical Ginzburg–Landau (GL) study of a hybrid heterostructure made of two superconducting components. Novel and rich magnetization curves, the density of the supercurrent, and the vortex configurations in a type II/type II sample and a type I/type II sample were discussed; both kinds of samples can be engineered with proper choices of the constituent components by tuning the type II and type I properties to influence the transitions of vortex matter. The proposed superconducting system is, in many ways, peculiar and different, as the competing interactions in each component are related to the choice of the ratio for their characteristic lengths ( c λ , c ξ ), critical temperatures ( c T ), and electron mass ( c m ). Our superconducting system is controllable and allows for convenient vortex imaging and the detection of transitions between phases by using experimental methods. Moreover, this system opens a further research direction involving the study of three- dimensional systems with novel two-component configurations by using weak links or magnetic materials between them, thus making our system a very interesting testbed for a plethora of new phenomena.

Author Contributions

J.D. González the G-L equations for the hybrid superconductor and performed the simulations; A. Melendez prepared the figures; software, J.D. González; formal analysis, J.D. González; writing—original draft preparation, L. L. Camargo and J.D. González.

Acknowledgments

This work was partially financed by the Universidad del Magdalena (Fonciencias)

Conflicts of Interest

The authors declare no conflicts of interest. The funding sponsors had no role in the design of the study, in the collection, analysis, or interpretation of data, in the writing of the manuscript, or in the decision to publish the results.

Appendix A. Theoretical Approach

In this section, we describe a numerical approach for solving the coupled Ginzburg-Landau (GL) equation. The numerical approach is based in the link variable for vector potential which are used to discretize the two GL equations on a rectangular latticeand solve them self-consistently. The second GL equation is solved using the Fast Fourier tansformation, being a Poisson-type equation.

Appendix A.1. Dimensionless formulas in Ginzburg-Landau theory

Appendix A.1.1. Dimensionless form of the free energy functional in a hybrid system

In order to make the GL equations dimensionless,scaling quantities will be chosen. Since our sample contains two types of superconducting material, one of component has to be chosen to base the units on. The component to be use as a base component can be arbitrary although later some aspects need to take into account with regard to making this choice. In this work we will denote the two superconductors as S 1 and S 2 , and all the the quantities will be in units depending solely on the parameters of S 1 .
F = i = 1 , 2 d V [ α i ( 0 ) 1 T T c i | Ψ | 2 + β i 2 | Ψ | 4 + 1 2 m i * × i 2 e c A Ψ 2 + ( H H a ) 2 8 π ]
With H the response of the superconductor on the applied magnetic field ( H a ), α ( 0 ) < 0 , where the index i represents either S 1 or S 2 depending on the location inside the volume V. The GL equations will be scaled to the parameters of S 1 , with variables α 1 , β and m 1 * . Distance will be in measured in units of ξ 1 ( 0 ) = 2 / 2 m 1 * α 1 ( 0 ) , the temperature in units of the critical temperature of S 1 ( T c , 1 ), the order parameter Ψ units of Ψ , 1 = α 1 ( 0 ) / β 1 ,the vector potential in units of A 0 , 1 = c / 2 e ξ 1 ( 0 ) , the magnetic field in units of the upper critical field of S 1 , H c 2 , 1 = c / 2 e ξ 1 2 ( 0 ) and the free energy in units of F 0 = α 1 2 ( 0 ) / β 1 . This is done by transforming the variables as follows:
r ξ 1 ( 0 ) r ,
1 ξ 1 ( 0 ) ,
Ψ ( r ) Ψ , 1 ψ ( r ) ,
A A 0 , 1 A ,
H H c 2 , 1 H ,
V ξ 1 3 ( 0 ) V ,
F F 0 ξ 1 3 ( 0 ) F ,
Working on A1 we obtain the expression for for free energy in the following form:
F = d V [ 1 T T c , i α i ( 0 α 1 ( 0 | Ψ | 2 + 1 2 β i β 1 Ψ | 4 2 2 m 1 * ξ 1 2 ( 0 ) α 1 ( 0 ) i A Ψ 2 + H c 2 , 1 2 F 0 ( H H a ) 2 8 π ]
By using the fact that ξ i ( 0 ) = 2 / 2 m i * α ( 0 ) and that κ 1 2 = H c 2 , 1 2 / 8 π F 0 = m 2 c 2 β 1 / 8 π 2 e 2 , we get the following form for free energy of our system:
F = d V [ 1 T c , 1 T c , i T T c , i m 1 * m i * ξ 1 2 ( 0 ) ξ i 2 ( 0 ) | Ψ | 2 1 2 m 1 2 m i 2 2 λ i 2 ( 0 ) λ 1 2 ( 0 ) ξ 1 2 ( 0 ) ξ i 2 ( 0 ) + m 1 * m i * i A Ψ 2 + κ 1 2 ( H H a ) 2 ]
Next, variable t = T / T 1 * and ratios c T = T c , 1 / T c , 2 , c λ = λ 2 2 ( 0 ) / λ 1 2 ( 0 ) , c ξ = ξ 2 2 ( 0 ) / ξ 1 2 ( 0 ) and c m = m 1 * / m 2 * are defined. Eq. A3 now takes the form:
F = d V [ ( 1 c T t c m c ξ ) | Ψ | 2 + 1 2 c λ c m 2 c x i | Ψ | 4 + c m i A Ψ 2 + κ 1 2 ( H H a ) 2 ]
where c m , c ξ , c λ and c T are equal 1 inside S 1 material.

Appendix A.2. Derivation of GL equations in a hybrid system

Appendix A.2.1. First GL equation

An infinitesimal change of order parameter δ ψ with which the free energy should remain invariant ( δ F = 0 ), i.e.
δ F = V s d V [ ( 1 c T t ) c m c ξ ψ δ ψ * + c λ c m 2 c ξ | Ψ | 2 ψ δ ψ * + c m ( Π ψ ) · ( Π * δ ψ * ) ] + c . c . = 0
We introduced the canonical momentum operator Π = i A . The last term of Eq. A5 can be simplify by using the relationship · ( c v ) = v · c + c · v where c is a scalar, but also taking into account the Gauss’s theorem,( · N = d S n · N , with n the unit vector perpendicular to the surface), we get:
δ F = V s d V δ ψ * [ ( 1 c T t ) c m c ξ ψ + c λ c m 2 c ξ | Ψ | 2 ψ + c m Π 2 ψ ] = i d S [ n · Π ψ ] + c . c . = 0 .
The fact that this equation must hold for arbitrary δ ψ * means tha the terms between brackets have to be 0. This leads to the first GL equation:
( 1 c T t ) 1 c ξ ψ + c λ c ξ | ψ | 2 ψ + Π 2 ψ = 0 ,
where c m = 1 and the boundary condition:
n · Π ψ | S s

Appendix A.2.2. Second GL equation

In order to derive the second GL equation, the vector potential will be varied by δ A . The part of free energy containing the magnetic field then gives:
F M ( A + δ A ) = d V c m | ( Π δ A ) ψ | 2 + κ 1 2 ( × ( A + δ A A 0 ) ) 2
We considered H = × A and H a = × A 0 where H a is the applied magnetic field. Now, since F M ( A + δ A ) F ( A ) + δ F we can separate the terms that are linear in δ A to find δ F :
δ F = d V c m ( δ A ( ψ * Π ψ ) ) δ A ( ψ Π * ) ψ * ) ) + 2 κ 1 2 ( × ( A A 0 ) ) ( × δ A ) = d V 2 c m δ A R ( ψ * Π ψ ) + 2 κ 1 2 ( × ( A A 0 ) ) · ( × δ A )
The second part of Eq.A10 can be rewritten by using the Stock’s theorem ( ( a × b ) = b · ( × a ) a · ( × b ) ), as
δ F = d V 2 κ 1 2 ( ( δ A × ( × ( A A 0 ) ) + δ A · ( × × ( A A 0 ) ) )
The first part of Eq. A12 can be modified into a surface integral using Gauss’s theorem. Since the surface lies at infinity, A = A 0 thus the contribution of the surface integral vanishes. The variation of the free energy becomes:
δ F = 2 d V δ A c m R ( ψ * Π ψ ) + κ 1 2 ( × × ( A A 0 ) ) = 0
This equation should hold for arbitrary δ A . This can only be the case if the term between square brackets is zero. This yields the second Ginzburg-Landau equation:
j s = c m R ( ψ * Π ψ ) = κ 1 2 ( × × ( A A 0 ) )
where j s is the supercurrent, induced in the superconductor, in response to the applied magnetic field. The equation can be further reduced after choosing the Coulomb gauge · ( A A 0 ) = 0 .

References

  1. de Gennes, P. G. Boundary effects in superconductors. Rev. Mod. Phys. 1964, 36, 225. [Google Scholar] [CrossRef]
  2. Buzdin, A.I. Proximity effects in superconductor-ferromagnet heterostructures. Rev. Mod. Phys. 2005, 11, 935–976. [Google Scholar] [CrossRef]
  3. Baelus, B.J.; Partoens, B.; Peeters, F.M. ; One-dimensional modulation of the superconducting boundary condition for thin superconducting films. Phys. Rev. B 2006, 73, 212503. [Google Scholar] [CrossRef]
  4. Ozaeta, A.; Vasenko, A.S.; Hekking, F.W.J.; Bergeret, F.S. Andreev current enhancement and subgap conductance of superconducting SFN hybrid structures in the presence of a small spin-splitting magnetic field. Phys. Rev. B 2012, 86, 060509. [Google Scholar] [CrossRef]
  5. Bergeret, F.S.; Tokatly, I.V. Singlet-Triplet Conversion and the Long-Range Proximity Effect in Superconductor-Ferromagnet Structures with Generic Spin Dependent Fields. Phys. Rev. Lett. 2013, 110, 117003. [Google Scholar] [CrossRef]
  6. Black-Schaffer, A.M. Self-consistent superconducting proximity effect at the quantum spin Hall edge. Phys. Rev. B 2011, 83, 060504. [Google Scholar] [CrossRef]
  7. Yano, R.; Hirose, H.T.; Tsumura, K.; Yamamoto, S.; Koyanagi, M.; Kanou, M.; Kashiwaya, H.; Sasagawa, T.; Kashiwaya, S. Proximity-Induced Superconducting States of Magnetically Doped 3D Topological Insulators with High Bulk Insulation. Condens. Matter 2019, 4, 9. [Google Scholar] [CrossRef]
  8. Karabassov, T.; Amirov, E.S.; Bobkova, I.V.; Golubov, A.A.; Kazakova, E.A.; Vasenko, A.S. Superconducting Diode Effect in Topological Hybrid Structures. Condens. Matter 2023, 8, 36. [Google Scholar] [CrossRef]
  9. Xu, M.; Liang, T.; Shi, M.; Chen, H. Graphene-Like Two-Dimensional Materials. Chem. Rev. 2013, 113, 3766–3798. [Google Scholar] [CrossRef]
  10. Perez de Lara, D. Hybrid Superconducting/Magnetic Multifunctional Devices in Two-Dimensional Systems. Physchem 2022, 2, 347–356. [Google Scholar] [CrossRef]
  11. Natterer, F. D.; Ha, J.; Baek, H.; Zhang, D.; Cullen, W. G.; Zhitenev, N. B.; Kuk, Y.; Stroscio, J. A. Scanning tunneling spectroscopy of proximity superconductivity in epitaxial multilayer graphene. Phys. Rev. B 2016, 93, 045406. [Google Scholar] [CrossRef] [PubMed]
  12. Berdiyorov, G. R.; Misko, V. R.; Milošević, M. V.; Escoffier, W.; Grigorieva, I. V.; Peeters, F. M. Pillars as antipinning centers in superconducting films. Phys. Rev. B 2008, 77, 024526. [Google Scholar] [CrossRef]
  13. Barba-Ortega, J.; González, J. D.; Sardella, E. ; Superconducting State of a Disk with a Pentagonal/Hexagonal Trench/Barrier. J. Low Temp. Phys. 2013, 174, 96. [Google Scholar] [CrossRef]
  14. Baelus, B.J.; Peeters, F.M. ; Mesoscopic Superconductors Multiply Connected Mesoscopic Superconductors. Mod. Phys. Lett. B 2003, 17, 527. [Google Scholar] [CrossRef]
  15. Baelus, B.J.; Peeters, F.M. ; Dependence of the vortex configuration on the geometry of mesoscopic flat samples. Phys. Rev. B 2002, 65, 104515. [Google Scholar] [CrossRef]
  16. Chao-Yu, L.; Berdiyorov, G. R.; Milošević, M. V. Vortex states in layered mesoscopic superconductors. Phys. Rev. B 2011, 83, 104524. [Google Scholar]
  17. Berdiyorov, G. R.; de, C. Romaguera, A. R.; Milošević, M. V.; Doria, M. M.; Covaci, L.; Peeters, F. M. Dynamic and static phases of vortices under an applied drive in a superconducting stripe with an array of weak links. Eur. Phys. J. B 2012, 85, 130. [Google Scholar] [CrossRef]
  18. González, J. D.; Barón-Jaimez, J.; Barba-Ortega, J. Complex vortex configuration in a disk with a higher/lower critical temperature superconducting geometrical central defect. J. Low Temp. Phys. 2015, 179, 264. [Google Scholar] [CrossRef]
  19. Bouquet, F.; Fisher, R. A.; Phillips, N. E.; Hinks, D. G.; Jorgensen, J.D. Specific heat of Mg11B2: evidence for a second energy gap. Phys. Rev. Lett. 2001, 87, 047001. [Google Scholar] [CrossRef]
  20. Geurts, R.; Milošević, M. V.; Peeters, F. M. Vortex matter in mesoscopic two-gap superconducting disks: Influence of Josephson and magnetic coupling. Phys. Rev. B 2010, 81, 214514. [Google Scholar] [CrossRef]
  21. Shalnikov, A. Superconducting Thin Films. Nature 1938, 142, 74. [Google Scholar] [CrossRef]
  22. Strongin, M.; Kammerer, O. F. Superconductive Phenomena in Ultrathin Films. J. Appl. Phys. 1968, 39, 2509. [Google Scholar] [CrossRef]
  23. Jaeger, H. M.; Haviland, D. B.; Orr, B. G.; Goldman, A. M. Onset of superconductivity in ultrathin granular metal films. Phys. Rev. B 1989, 40, 182. [Google Scholar] [CrossRef] [PubMed]
  24. Qin, Y.; Vicente, C. L.; Yoon, J. Magnetically induced metallic phase in superconducting tantalum films. Phys. Rev. B 2006, 73, 100505. [Google Scholar] [CrossRef]
  25. Qin, S.; Kim, J.; Niu, Q.; Shih, C. K. Superconductivity at the Two-Dimensional Limit. Science 2009, 234, 1314. [Google Scholar] [CrossRef] [PubMed]
  26. Saito, Y.; Nojima, T.; Iwasa, Y. Highly crystalline 2D superconductors. Nat. Rev. Mater. 2017, 2, 16094. [Google Scholar] [CrossRef]
  27. Costanzo, D.; Jo, S.; Berger, H.; Morpurgo, A. F. Gate-induced superconductivity in atomically thin MoS2 crystals. Nat. Nanotechnol. 2016, 11, 339. [Google Scholar] [CrossRef] [PubMed]
  28. Buzdin, A. Mixing superconductivity and magnetism. Nat. Mater. 2004, 3, 751. [Google Scholar] [CrossRef]
  29. Biscaras, J.; Bergeal, N.; Hurand, S.; Feuillet-Palma, C.; Rastogi, A.; Budhani, R. C.; Grilli, M.; Caprara, S.; Lesueur, J. Multiple quantum criticality in a two-dimensional superconductor. Nat. Mater. 2013, 12, 542. [Google Scholar] [CrossRef]
Figure 1. (Color online) Schematic representation of a hybrid superconducting system made of two types of superconductors: S 1 and S 2 . The lateral size of the superconducting sample is a = 400 nm, and the width of the sample is d = 20 nm. Two cases are studied: 1. S 1 and S 2 are both type II superconductors with the following parameters: a coherence length of ξ 1 ( 0 ) = 39 nm and ξ 2 ( 0 ) = 20 nm and a penetration depth λ 1 ( 0 ) = 52 nm and λ 2 ( 0 ) = 200 nm; 2. S 1 is a type II superconductor with the parameters ξ 1 ( 0 ) = 39 nm and λ 1 ( 0 ) = 52 nm, but S 2 is a type I superconductor with the parameters ξ 2 ( 0 ) = 120 nm and λ 1 ( 0 ) = 72 nm.
Preprints 90857 g001
Figure 2. (Color online) (Left) The curve represents the magnetization as a function of an applied magnetic field H for a type II/type II superconducting square sample with a = 400 nm and a width of d = 20 nm. (Right) Contour plots of the density of the superconducting order parameter for different selected vortex states; the upper section of the simulated sample is S 1 , and the characteristic lengths are ξ 1 ( 0 ) = 39 nm and λ 1 ( 0 ) = 52 nm, whereas the lower section is S 2 with ξ 2 ( 0 ) = 20 nm, λ 2 ( 0 ) = 200 nm (first column), and the corresponding phase of the order parameter (second column).
Preprints 90857 g002
Figure 3. (g-i) (Color online) Contour plots of the superconducting order parameter for selected vortex states that show that the vortices move from S 1 to S 2 with larger values of the applied magnetic field when considering the case analyzed in Figure 2 to follow the evolution of the behavior of the vortex state. Snapshots (l–o) show contour plots of the superconducting order parameter for selected vortex states; these show the vortices that correspond to the lower jumps in the magnetization curve. The simulation corresponds to a type II/type II superconducting square sample with a = 400 nm and a width of d = 20 nm. The characteristic lengths for S 1 are ξ 1 ( 0 ) = 39 nm and λ 1 ( 0 ) = 52 nm, and for S 2 , they are ξ 2 ( 0 ) = 20 nm and λ 2 ( 0 ) = 200 nm.
Preprints 90857 g003
Figure 4. (Color online) The curve represents the vorticity as a function of the applied magnetic field H for a type II/type II superconducting square sample with a = 400 nm and a width of d = 20 nm. The characteristic lengths for S 1 are ξ 1 ( 0 ) = 39 nm and λ 1 ( 0 ) = 52 nm, and those for S 2 are ξ 2 ( 0 ) = 20 nm and λ 2 ( 0 ) = 200 nm.
Preprints 90857 g004
Figure 5. (a-g)(Color online) The corresponding simulation of the behavior of the supercurrent for different selected vortex states in a type II/type II superconducting square sample with a = 400 nm and a width of d = 20 nm. The characteristic lengths for S 1 were ξ 1 ( 0 ) = 39 nm and λ 1 ( 0 ) = 52 nm, and those for S 2 are ξ 2 ( 0 ) = 20 nm and λ 2 ( 0 ) = 200 nm.
Preprints 90857 g005
Figure 6. The curve represents the magnetization as a function of the applied magnetic field H for a type II/type I superconducting sample. The size of the superconducting sample is a = 400 nm and d = 20 nm. The following parameters are chosen for S 1 and S 2 : a coherence length of ξ 1 ( 0 ) = 39 nm and ξ 2 ( 0 ) = 120 nm and a penetration depth of λ 1 ( 0 ) = 52 nm and λ 2 ( 0 ) = 72 nm.
Preprints 90857 g006
Figure 7. (a-c) (Color online) Contour plots of the density of the superconducting order parameter for different selected vortex states (first column), the phase of the order parameter (second column), and the supercurrent corresponding to the first three vortex states in the sample (third column). The size of the considered superconducting sample is a = 400 nm and d = 20 nm. The following parameters are chosen for S 1 and S 2 : a coherence length of ξ 1 ( 0 ) = 39 nm and ξ 2 ( 0 ) = 120 nm and a penetration depth of λ 1 ( 0 ) = 52 nm and λ 2 ( 0 ) = 72 nm.
Preprints 90857 g007
Table 1. The vortex states in S 1 and S 2 , the applied magnetic field H / H c 2 , 1 ( 0 ) , the entry of magnetic flux Φ / H c 2 , 1 ( 0 ) ξ 1 2 × 10 4 into the sample, and the variations in magnetization Δ M / H c 2 , 1 × 10 5 that we obtained for the magnetization curve (Figure 2). The superconducting square sample had a length of a = 400 nm and a width of d = 20 nm. For S 1 , and the characteristics lengths were ξ 1 ( 0 ) = 39 nm and λ 1 ( 0 ) = 52 nm; for S 2 , they were ξ 2 ( 0 ) = 20 nm and λ 2 ( 0 ) = 200 nm.
Point L 1 L 2 Φ Δ M
(a) 0 2 2.32 0.455
(b) 1 2 4.67 0.893
(c) 1 4 1.91 0.364
(d) 2 3 3.76 0.715
(e) 3 4 2.574 0.522
(f) 4 6 2.571 0.489
Table 2. The vortex states in S 1 and S 2 , the applied magnetic field H / H c 2 , 1 ( 0 ) , the entry of magnetic flux Φ 0 / H c 2 , 1 ( 0 ) ξ 1 2 × 10 4 into the sample, and the variations in magnetization Δ M / H c 2 , 1 × 10 5 that we obtained for the magnetization curve shown in Figure 6 (points (a–g)). The size of the considered superconducting sample was a = 400 nm and d = 20 nm. The following parameters were chosen for S 1 and S 2 : a coherence length of ξ 1 ( 0 ) = 39 nm and ξ 2 ( 0 ) = 120 nm and a penetration depth of λ 1 ( 0 ) = 52 nm and λ 2 ( 0 ) = 72 nm.
Point L 1 L 2 H Φ Δ M
(a) 0 1 0.038 4.328 0.824
(b) 0 2 0.063 2.363 0.450
(c) 0 3 0.088 0.493 0.094
(d) 1 3 0.110 4.242 0.807
(e) 2 5 0.161 4.164 0.792
(f) 3 7 0.211 3.430 0.653
(g) 4 9 0.260 2.689 0.512
Disclaimer/Publisher’s Note: The statements, opinions and data contained in all publications are solely those of the individual author(s) and contributor(s) and not of MDPI and/or the editor(s). MDPI and/or the editor(s) disclaim responsibility for any injury to people or property resulting from any ideas, methods, instructions or products referred to in the content.
Copyright: This open access article is published under a Creative Commons CC BY 4.0 license, which permit the free download, distribution, and reuse, provided that the author and preprint are cited in any reuse.
Prerpints.org logo

Preprints.org is a free preprint server supported by MDPI in Basel, Switzerland.

Subscribe

© 2024 MDPI (Basel, Switzerland) unless otherwise stated