1. Introduction
Indonesia is the largest archipelagic country in the world, with a total of 17,000 islands in 2021, according to an agreement on the Island Data Coordination Follow-up Meeting led by the Geospatial Information Agency [
1]. Besides that, Indonesia has a coastline of 99,093 km2, a land area of 2.012 million km2, and a sea area of 5.8 million km
2 [
2]. Based on data from the Ministry Maritime Affairs and Fisheries, Indonesia has 450 coral reef species out of 700 species in the world [
3]. This shows that Indonesia has enormous marine tourism potential, so it can be an opportunity for the Indonesian people to improve their welfare and introduce Indonesia abroad through Indonesia's maritime potential. Marine tourism is a recreational activity carried out with objects and attractions originating from seascapes and coastal landscapes (coastal seascapes) [
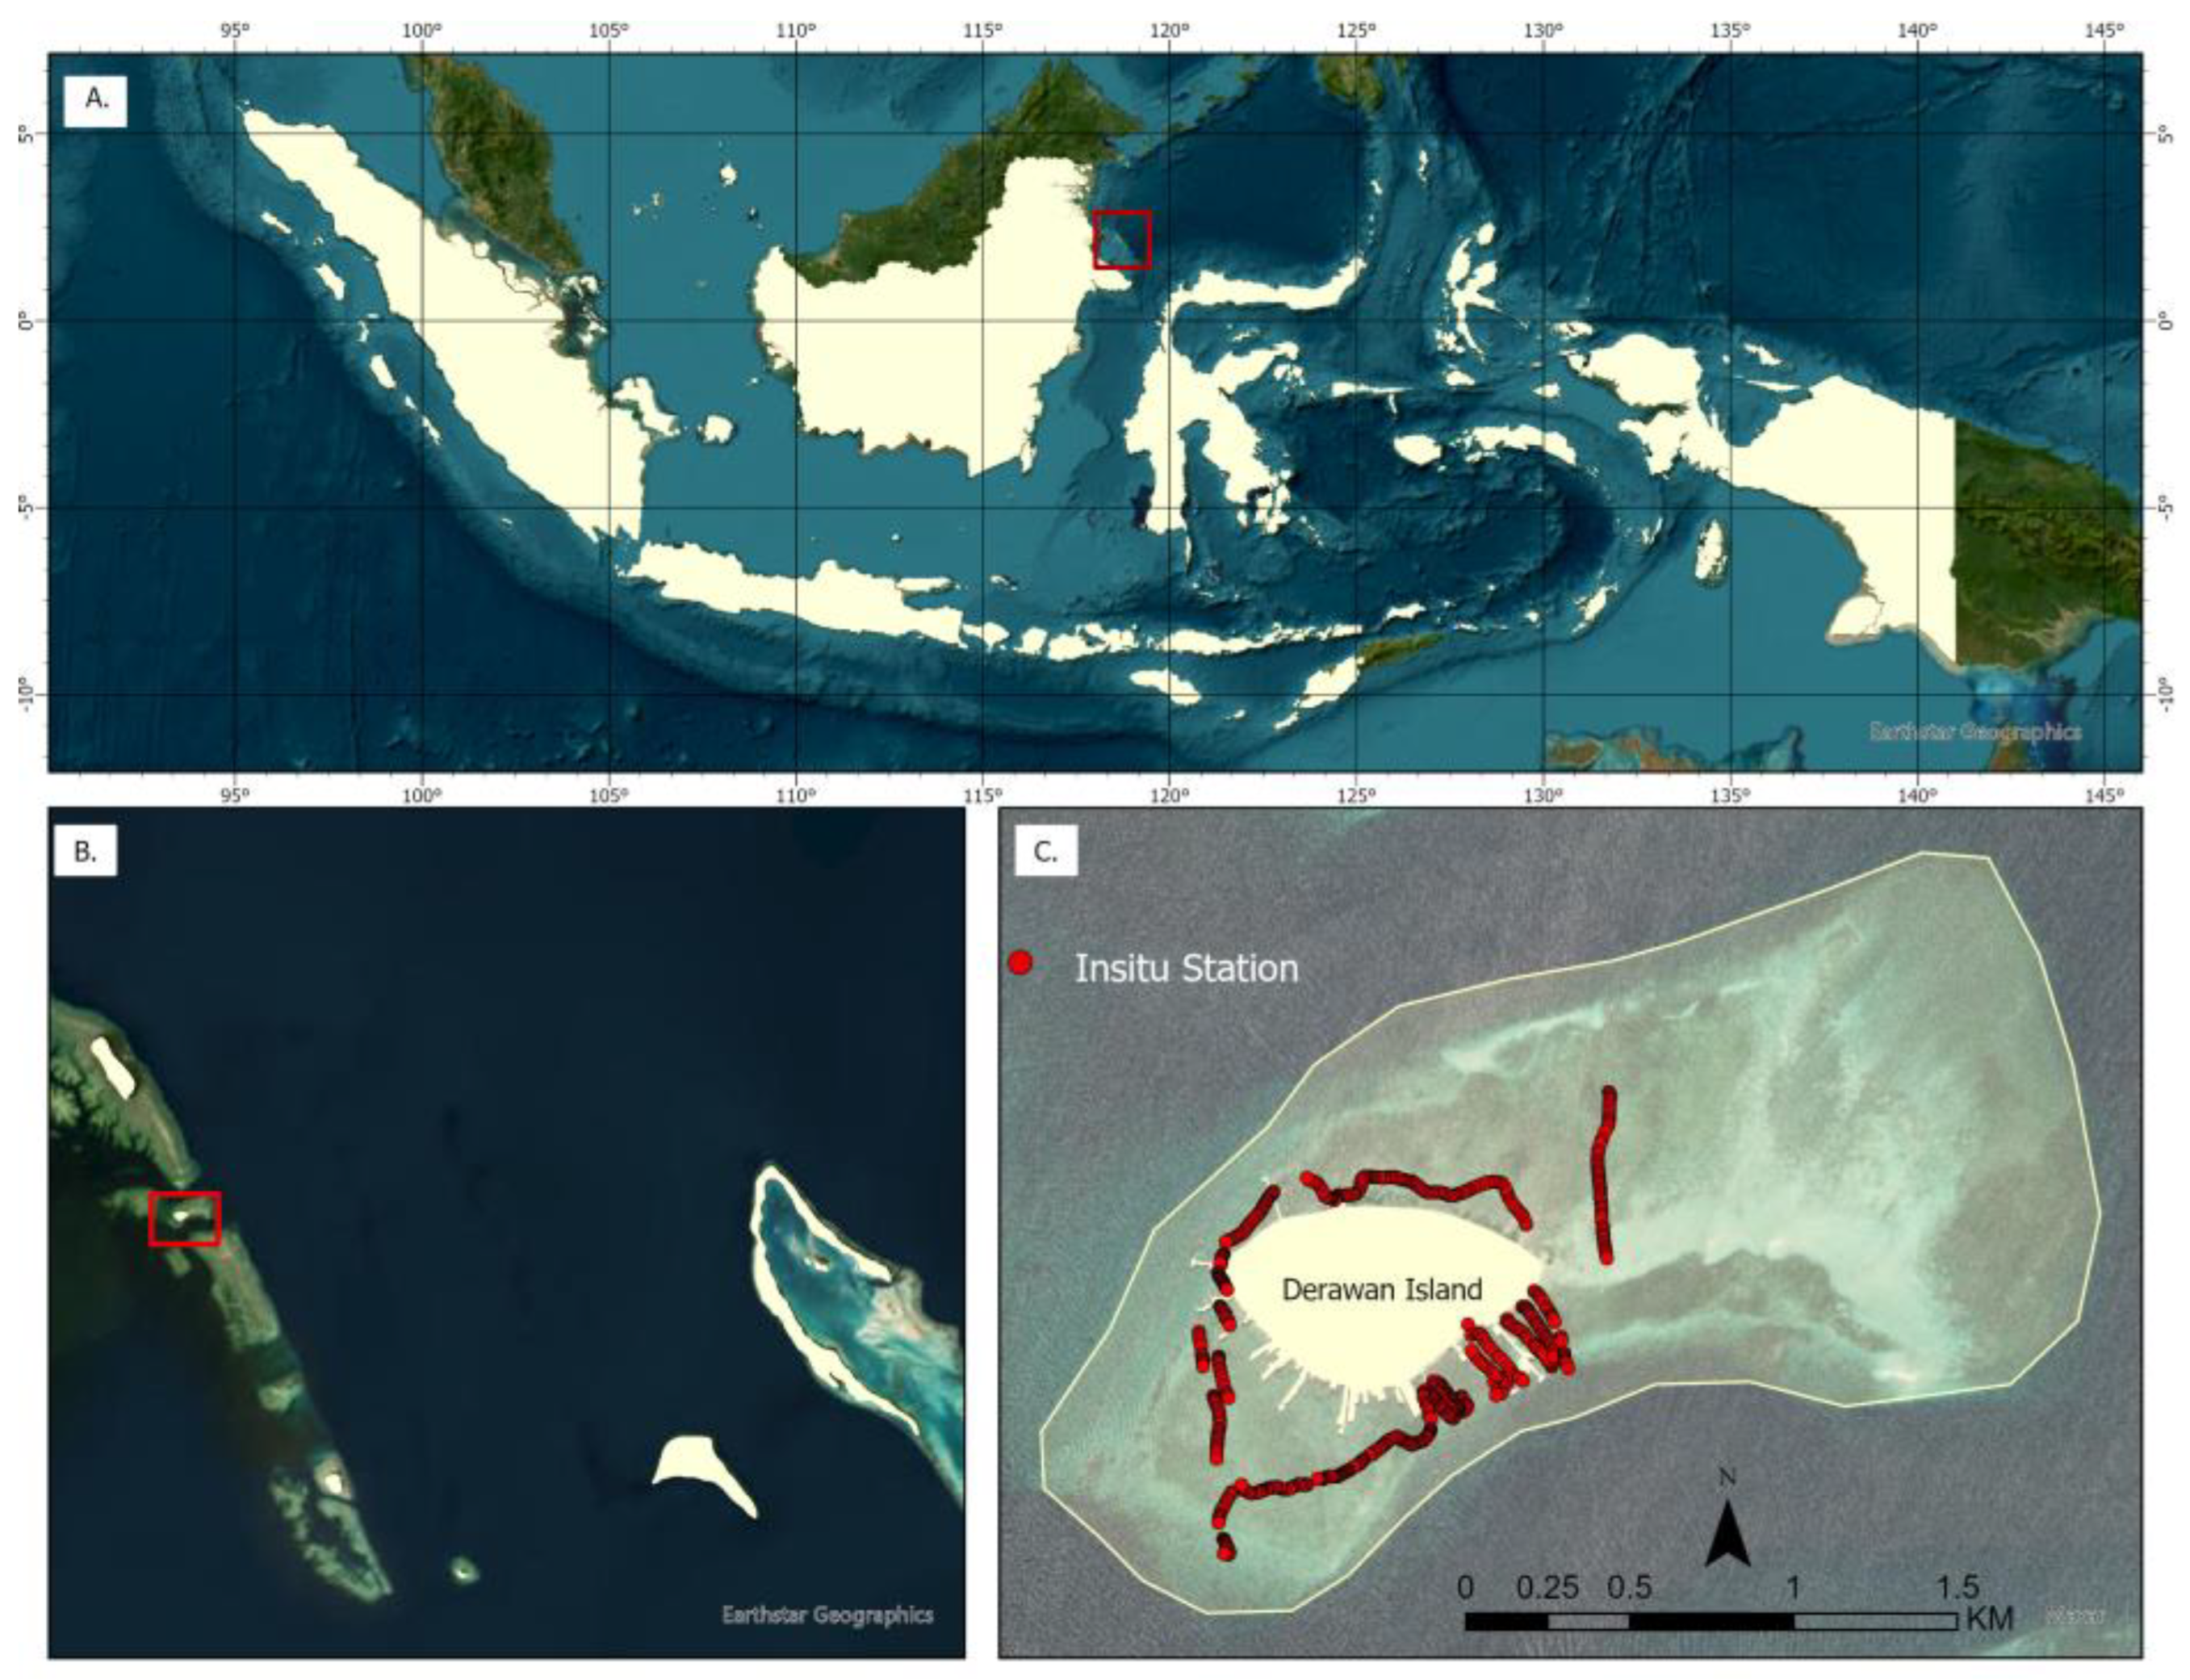
4]. One of Indonesia's marine tourism destinations, which is a favorite of domestic and foreign tourists, especially world-class divers, is the beauty of the coral reefs in the Derawan Islands.
Derawan Island, one of the Derawan Archipelago, was designated a UNESCO World Heritage Site in 2005 [
5]. The main attraction of Derawan Island is the charm of its underwater tourism with the coral reef ecosystem of Derawan Island, which is known to be so beautiful that it rivals the beauty of the coral reefs of the Raja Ampat Islands [
6]. Having a well-maintained ecosystem, Derawan Island is home to the natural habitat for various types of protected turtles, like hawksbill turtles and green turtles. According to the Directorate of Coastal and Small Island Utilization, coral reefs are a group of coral animals that have a symbiotic relationship with a type of algae called zooxanthellae. Coral reefs are dynamic ecosystems with rich biodiversity and high levels of productivity [
7]. Coral reefs generally live on the coast or in shallow sea areas that are still exposed to sunlight at a depth of approximately 50 meters below sea level. However, several types of coral reefs can live without needing light, but these coral reefs do not have symbiosis with zooxanthellae and do not form coral [
8]. In the growth of coral reefs, some factors influence the growth of coral reefs, such as tolerance limits for coral reefs are 21.7–29.6 °C for temperature, 28.7–40.4 psu for salinity [
9], these systems can have water clarities ranging from reasonably clear oceanic-type to high-attenuation regimes with complex optical characteristics, sufficient water movement and currents, waters free from pollution, and a hard and compact substrate for coral reefs to attach to [
10]. Ecologically, coral reefs are a place for marine biota to find food and provide shelter. Physically, coral reefs protect beaches and shallow water ecosystems from marine abrasion caused by sea waves [
11]. Apart from this, coral reefs are also an ecosystem that is vulnerable to environmental change, but these changes can increase in line with the increasing number of tourists and community activities on the coast of Derawan Island.
The challenges of coral reef ecosystems are damage to coral reefs, High levels of pollution, overfishing, harmful fishing methods, and global warming are all significant contributors to coastal damage [
12]. Referring to East Kalimantan Governor Regulation Number 60 of 2019 concerning RZWP3K for the Derawan Islands and Surrounding Waters, Derawan Island is the area with the highest damage to coral reefs compared to other areas in the Derawan Islands region [
13], which refers to the results of the 2011–2012 Manta Tow survey on the coral around the island. Derawan shows HCL cover of 11-25% and 26-50%, and HCL cover <10% is found mainly on coral reefs near Derawan Island. Based on the data described, it is known that the role of coral reefs is very important in maintaining coastal ecosystems. By looking at the current condition of coral reefs on Derawan Island, a study is needed to monitor the condition of coral reef habitats in a time series on Derawan Island. Monitoring is carried out using remote sensing technology through the use of multispectral imagery. According to [
14], remote sensing is a science that can be used to obtain information on objects, areas, or phenomena through the analysis of data obtained without making direct contact with the object being studied. Remote sensing data can be used to identify coastal typologies, one of which is coral reef habitat. Multispectral image data can record the condition of coral reef habitats because it contains visible light, which has a wavelength between 0.4 μm and 0.7 μm. Visible light can penetrate the water column to a depth of 20 meters so that objects at that depth can be recorded [
15].
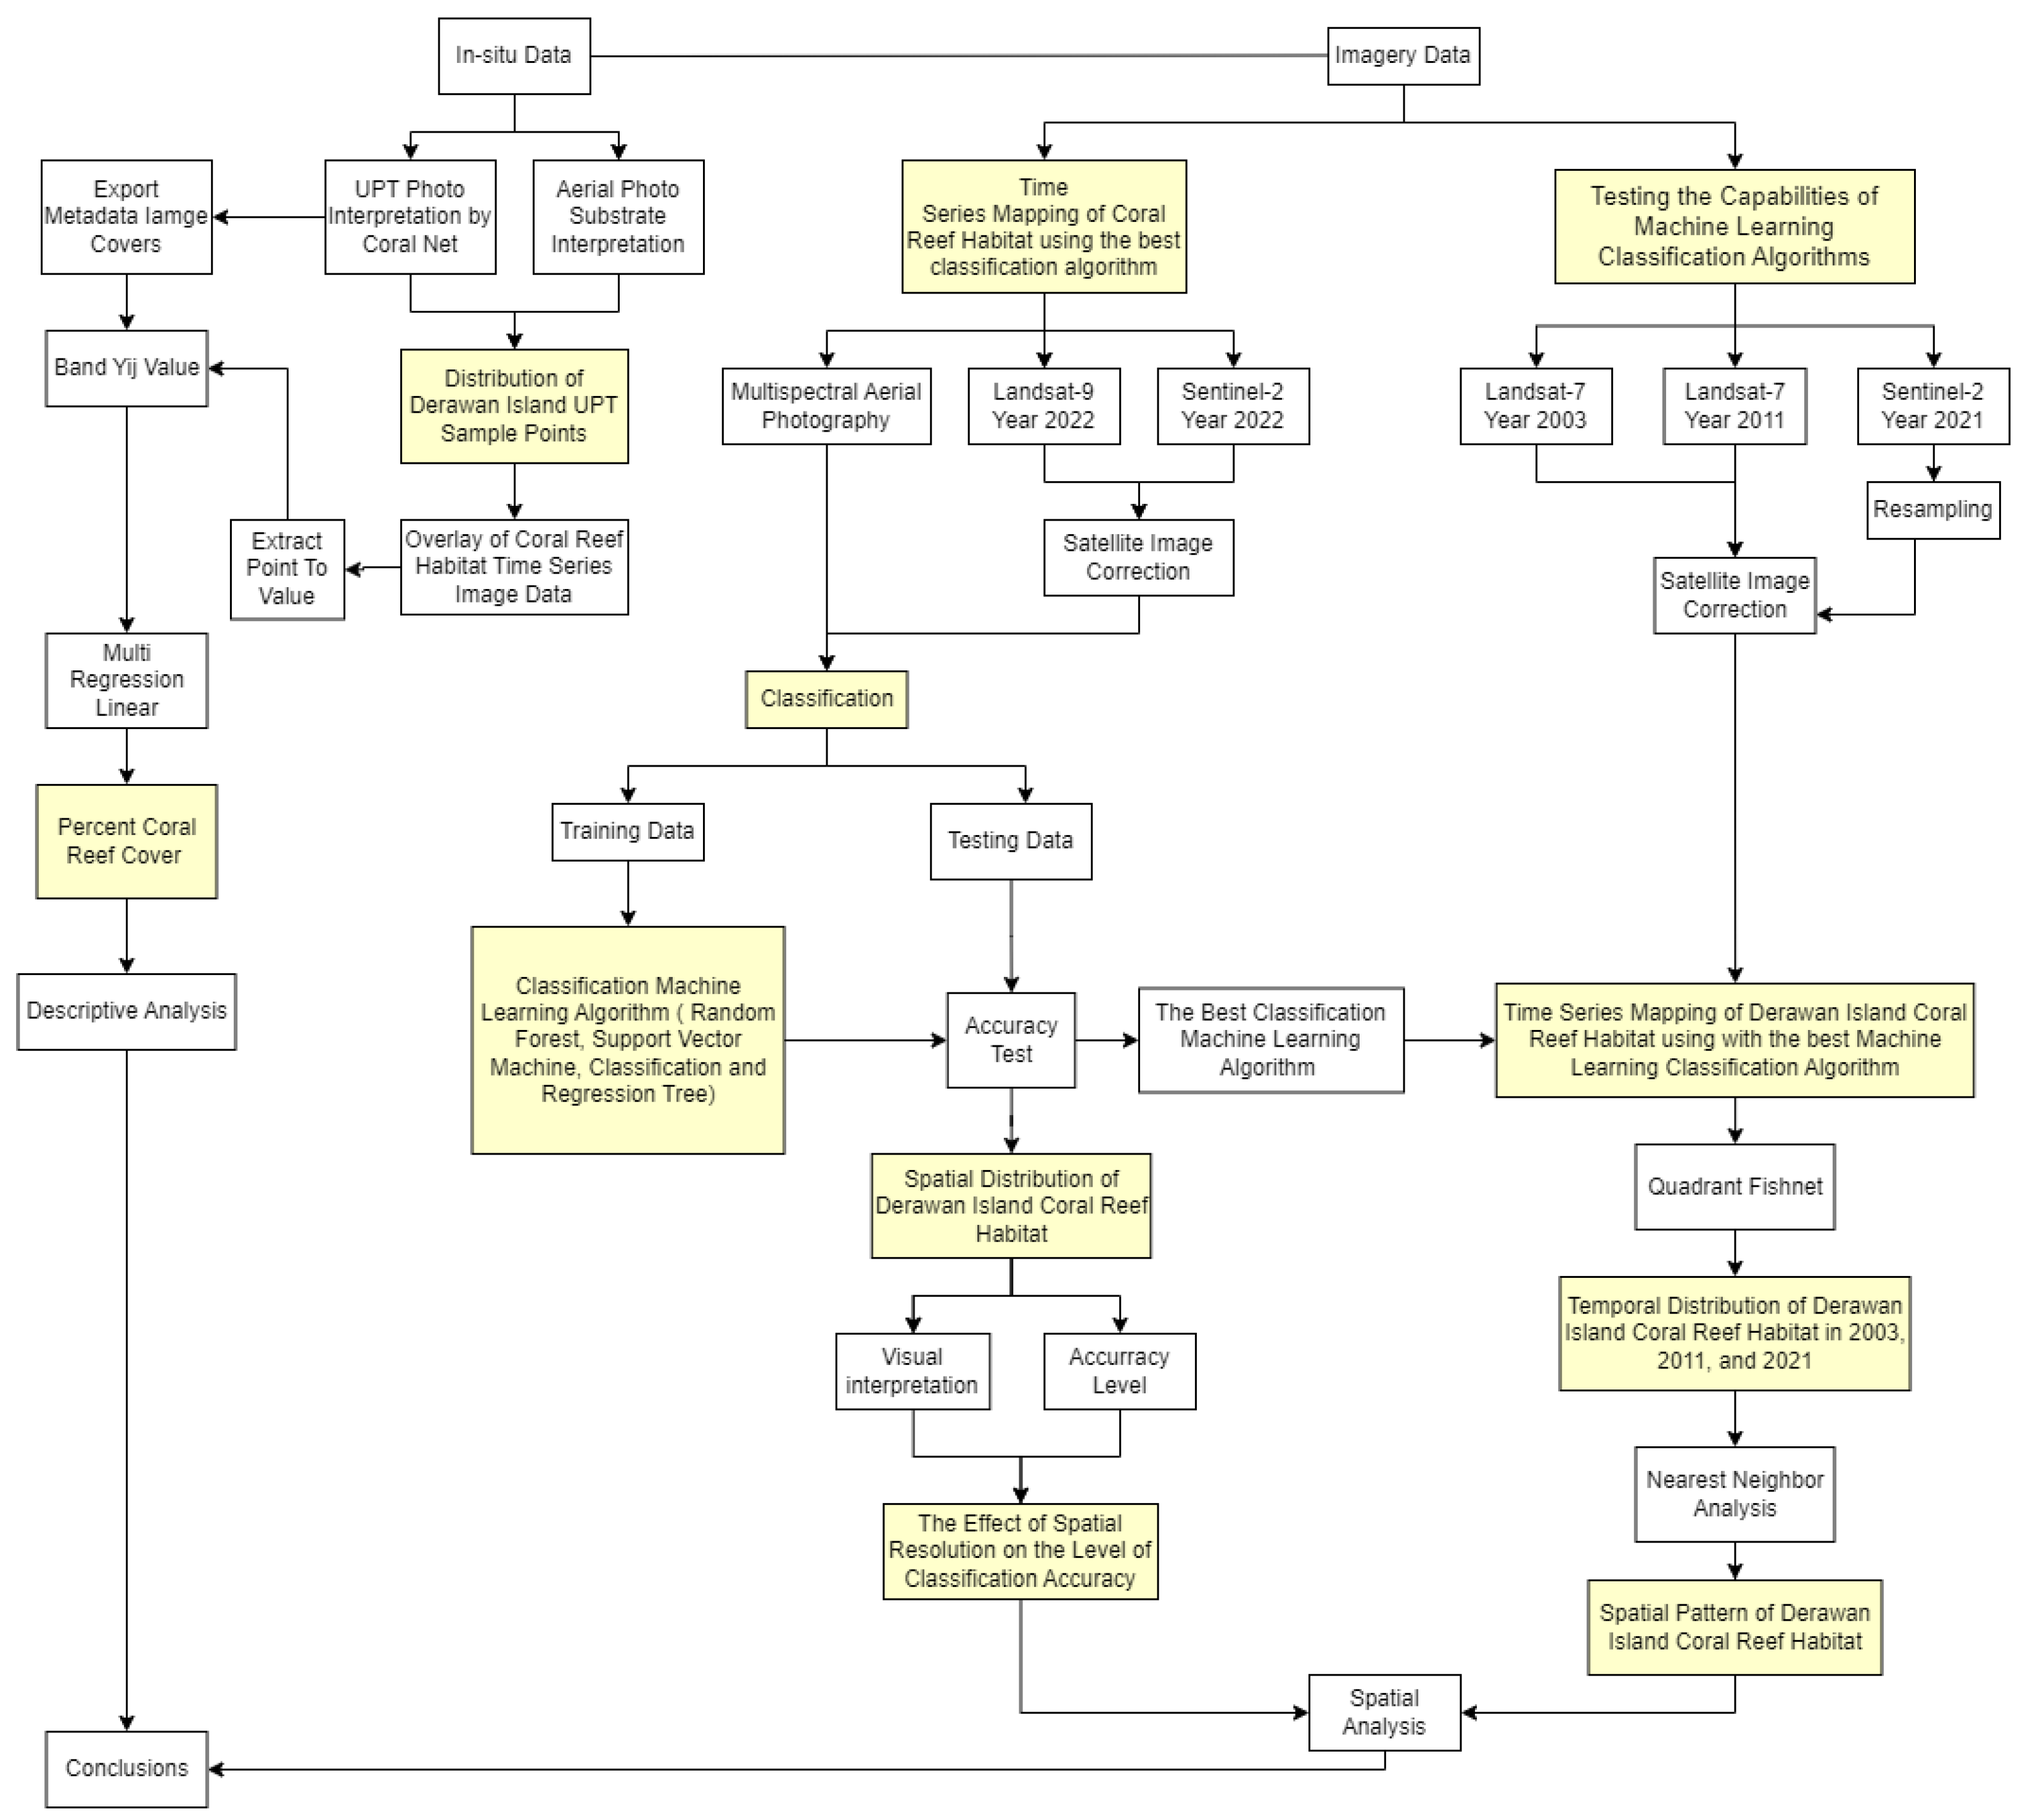
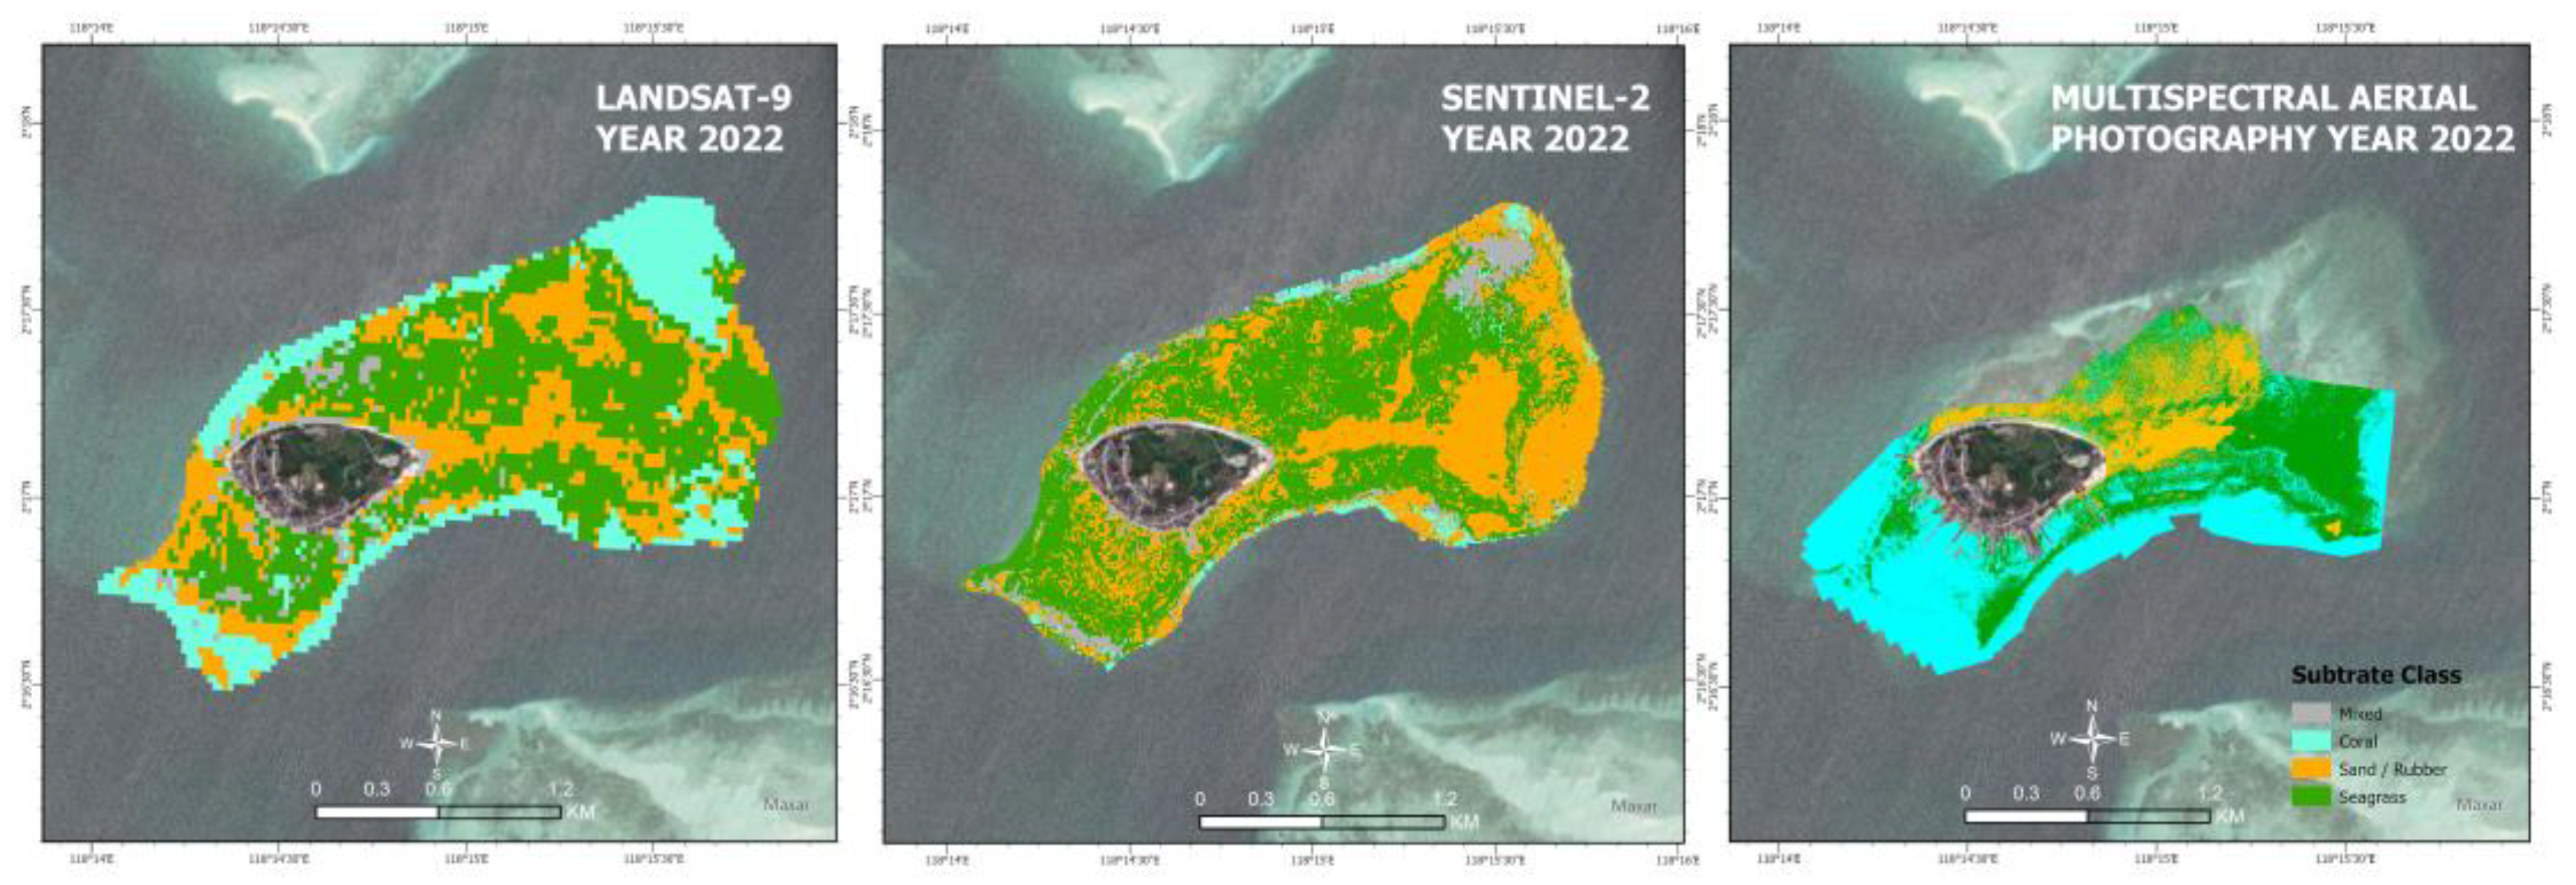
Satellite images that will be used in research on the spatial distribution of coral reef habitat include Landsat 7 ETM and Sentinel-2. Apart from that, in assessing the level of capability of the machine learning classification algorithm for spatial resolution, three spatial resolutions were used: low resolution from Landsat 9 satellite imagery, medium resolution from Sentinel-2 satellite imagery [
16], and high resolution from Multispectral Aerial Photography [
17]. In the process of monitoring changes in coral reef habitat, a classification stage is needed to identify benthic habitats in the coastal area of Derawan. The classification used is a non-parametric classification algorithm such as Random Forest (RF), Support Vector Machine (SVM), and Classification and Regression Tree (CART) [
18]. This classification algorithm will be used to determine the level of precision and accuracy of the machine learning classification algorithm for satellite images that have low resolution, medium resolution, and high resolution. Through these stages, an algorithm will be selected that has the highest accuracy, which will be used in conducting mapping studies of the spatial distribution of coral reef habitats.
Remote sensing technologies with machine learning algorithms have been widely used to study changes in coral reefs. In previous research “
Benthic Habitat Mapping Model and Cross Validation Using Machine Learning Classification Algorithm”[
19] regarding the development of benthic habitat models using machine learning classification and applying classification models in several research areas, This research uses in situ integration data on benthic habitats and uses WorldView-2 imagery to parameterize machine learning algorithms, like Random Forest, Classification Tree Analysis, and Support Vector Machine. The results obtained in previous research show that the Random Forest algorithm is more accurate than other algorithms, with a maximum accuracy of 94.17% for 4 classes and 88.54% for 14 classes. Meanwhile, in other research, coral habitat mapping using Sentinel-2 and Landsat 8 Oli imagery can be used [
16] and also multispectral aerial photography can be used for habitat mapping. This is possible because Sentinel-2, Landsat 8 Oli, and multispectral aerial photography all have wavelengths between 400 and 700 nm [
17]. Nevertheless, this research was carried out to determine the spatial distribution pattern of changes in coral reef habitat in the coastal area of Derawan Island, Berau Regency, East Kalimantan in 2003, 2011, and 2021. As well as assessing the influence of spatial resolution and the level of capability of machine learning classification algorithms in mapping the distribution of reef habitat coral.
In conclusion, while there have been significant advancements in the use of remote sensing technologies and machine learning algorithms for coral reef studies, there remains a gap in comprehensive, long-term analysis, particularly in the context of Derawan Island. Previous studies, such as the 'Benthic Habitat Mapping Model' and others utilizing Sentinel-2, Landsat 8 Oli, and multispectral aerial photography, have demonstrated the effectiveness of these technologies in habitat mapping. However, they have often focused on shorter time frames or specific types of coral habitats. This research seeks to bridge this gap by employing a detailed, long-term study (2003, 2011, and 2021) to understand the spatial distribution and change patterns of coral reef habitats in the Derawan Island coastal area. Furthermore, it aims to assess the impact of varying spatial resolutions and the efficacy of different machine learning classification algorithms in mapping these coral habitats, providing a more nuanced understanding of their temporal dynamics and contributing to more effective conservation strategies.
4. Discussion
4.1. Spatial Distribution and Habitat Density of Derawan Island Coral Reefs
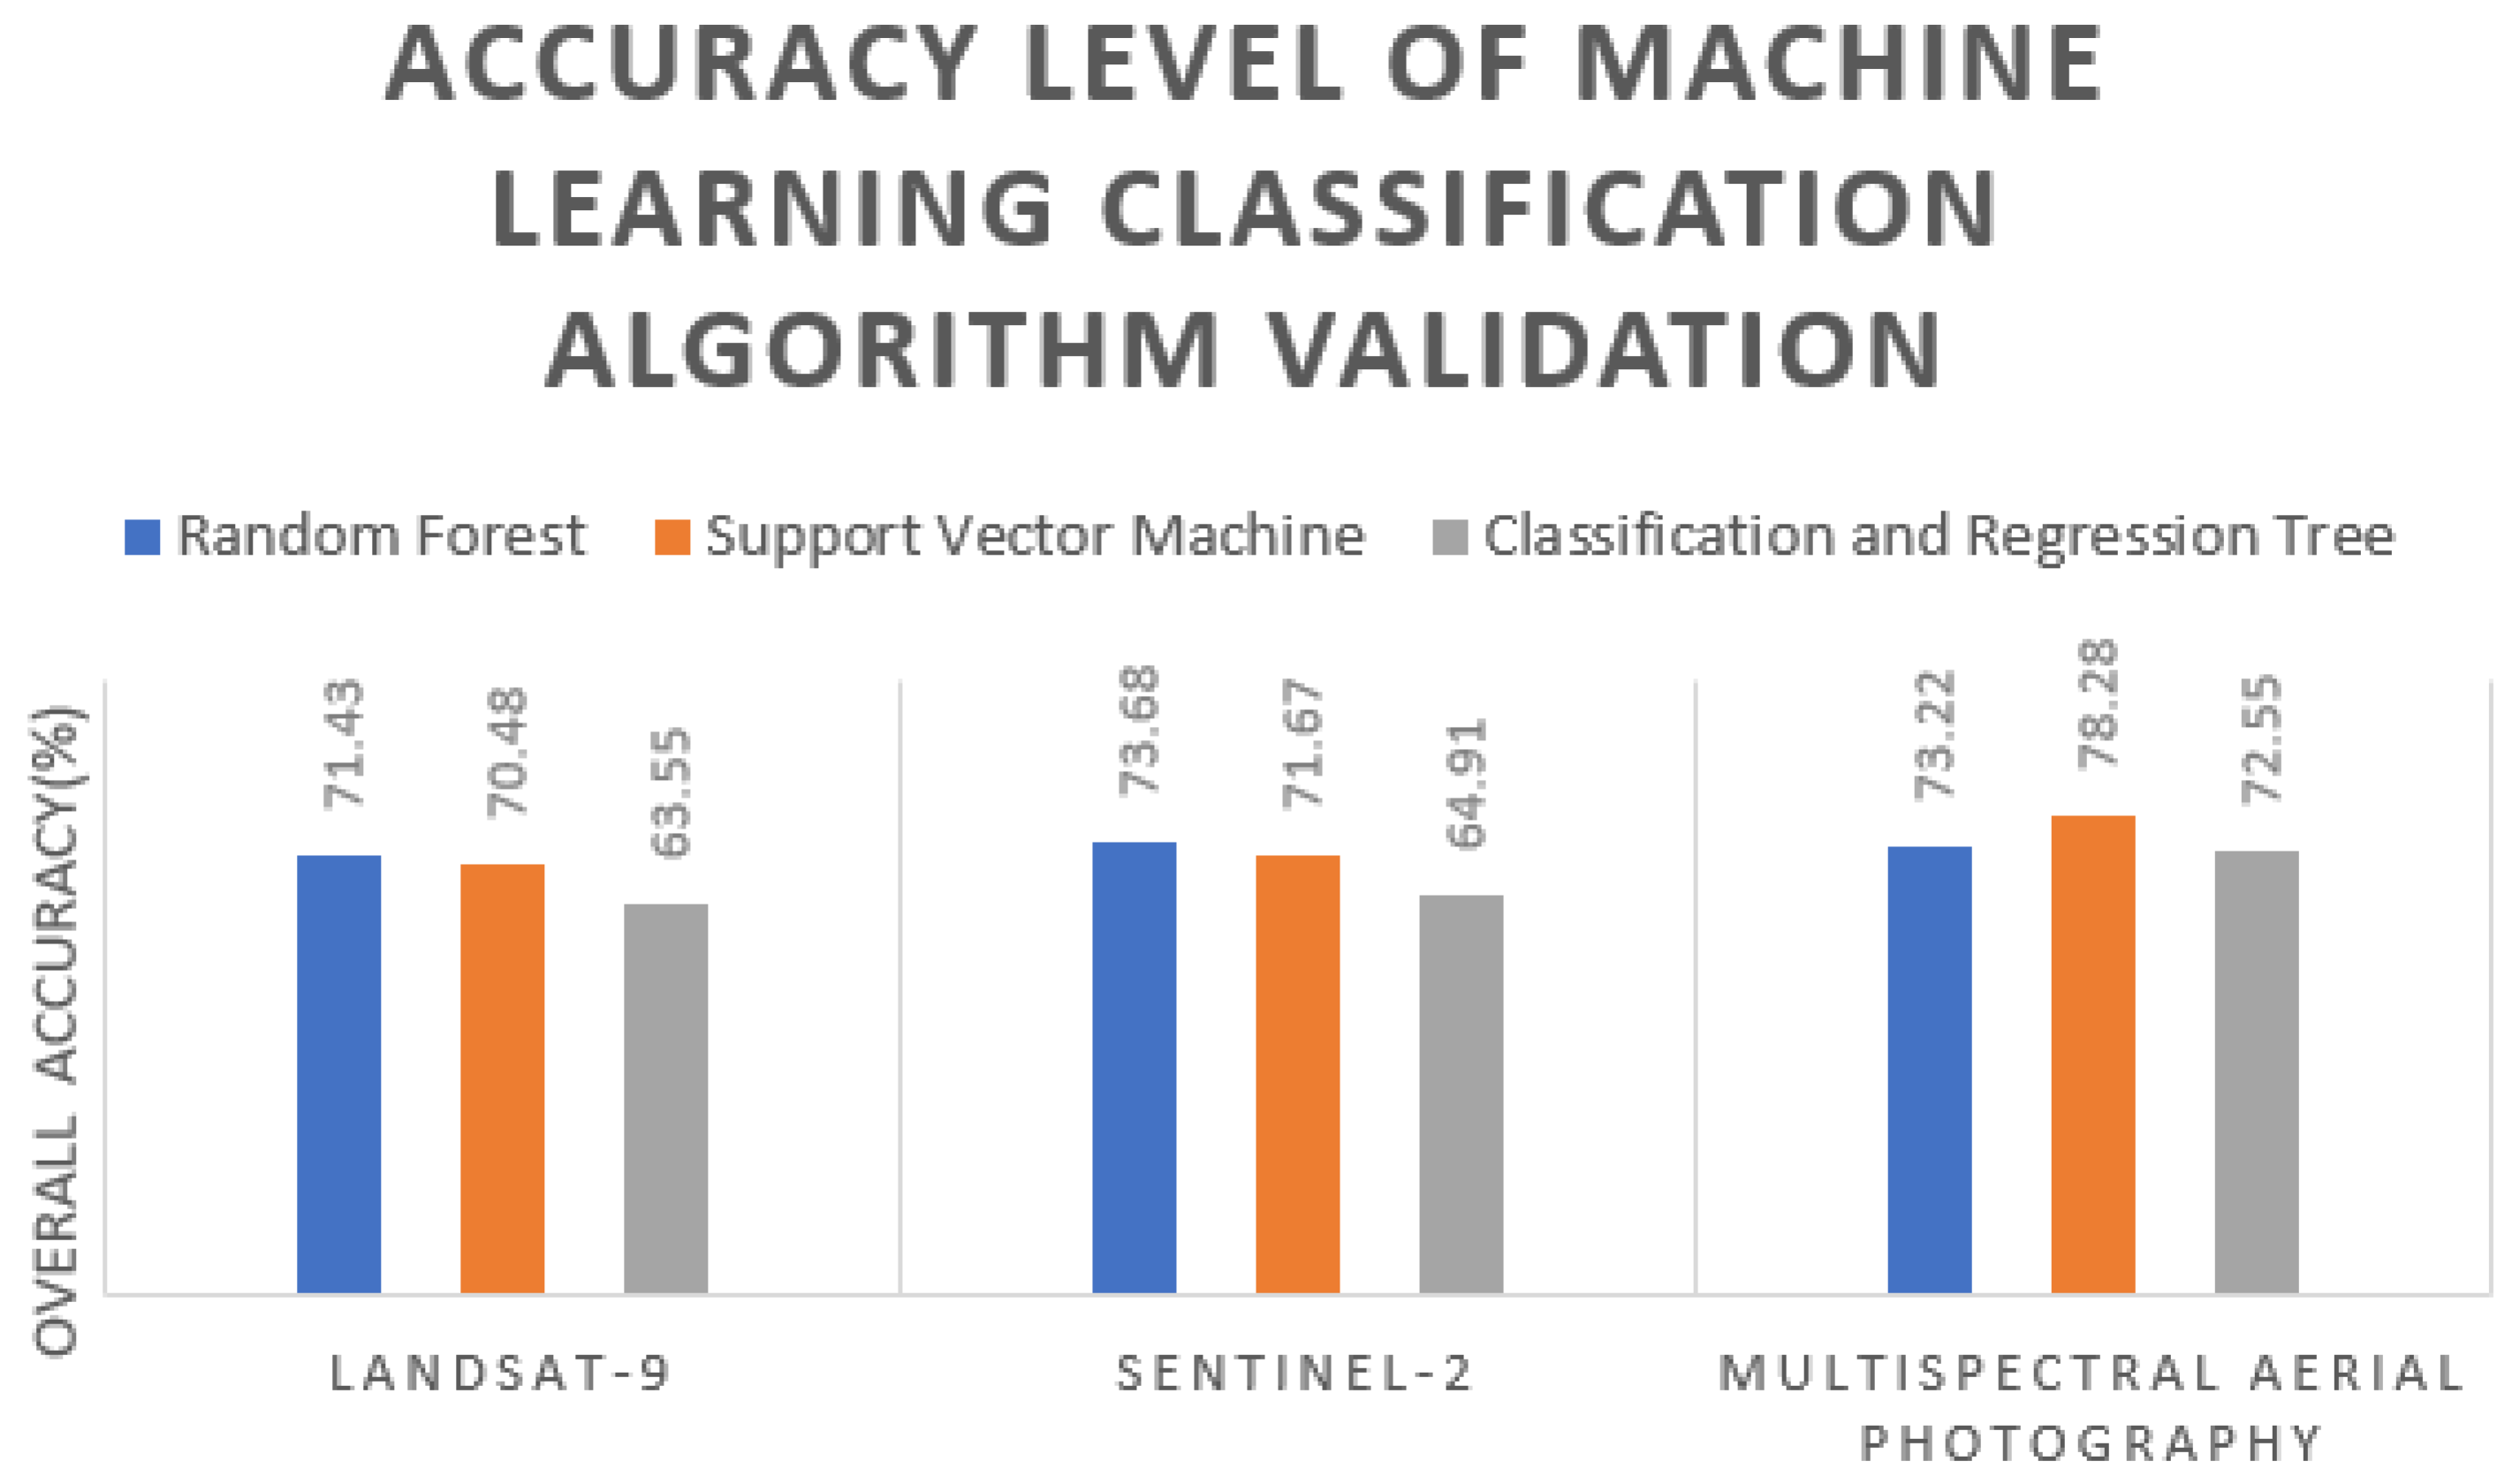
Our evaluation revealed that the Random Forest classification algorithm exhibited the highest accuracy, a result attributable to its proficiency in handling large-scale data. In this study, the benthic habitat is categorized into four types: mixed, coral reefs, seagrass, and sand or rubble. Subsequent to this classification, we conducted coral reef habitat mapping using data from four satellite images: Landsat 7 imagery from 2003 and 2011, and Sentinel-2 imagery from 2021. This mapping forms the basis for an in-depth analysis of the regional and temporal variations in the coral reef habitat of Derawan Island, focusing on changes in size and composition over the studied periods
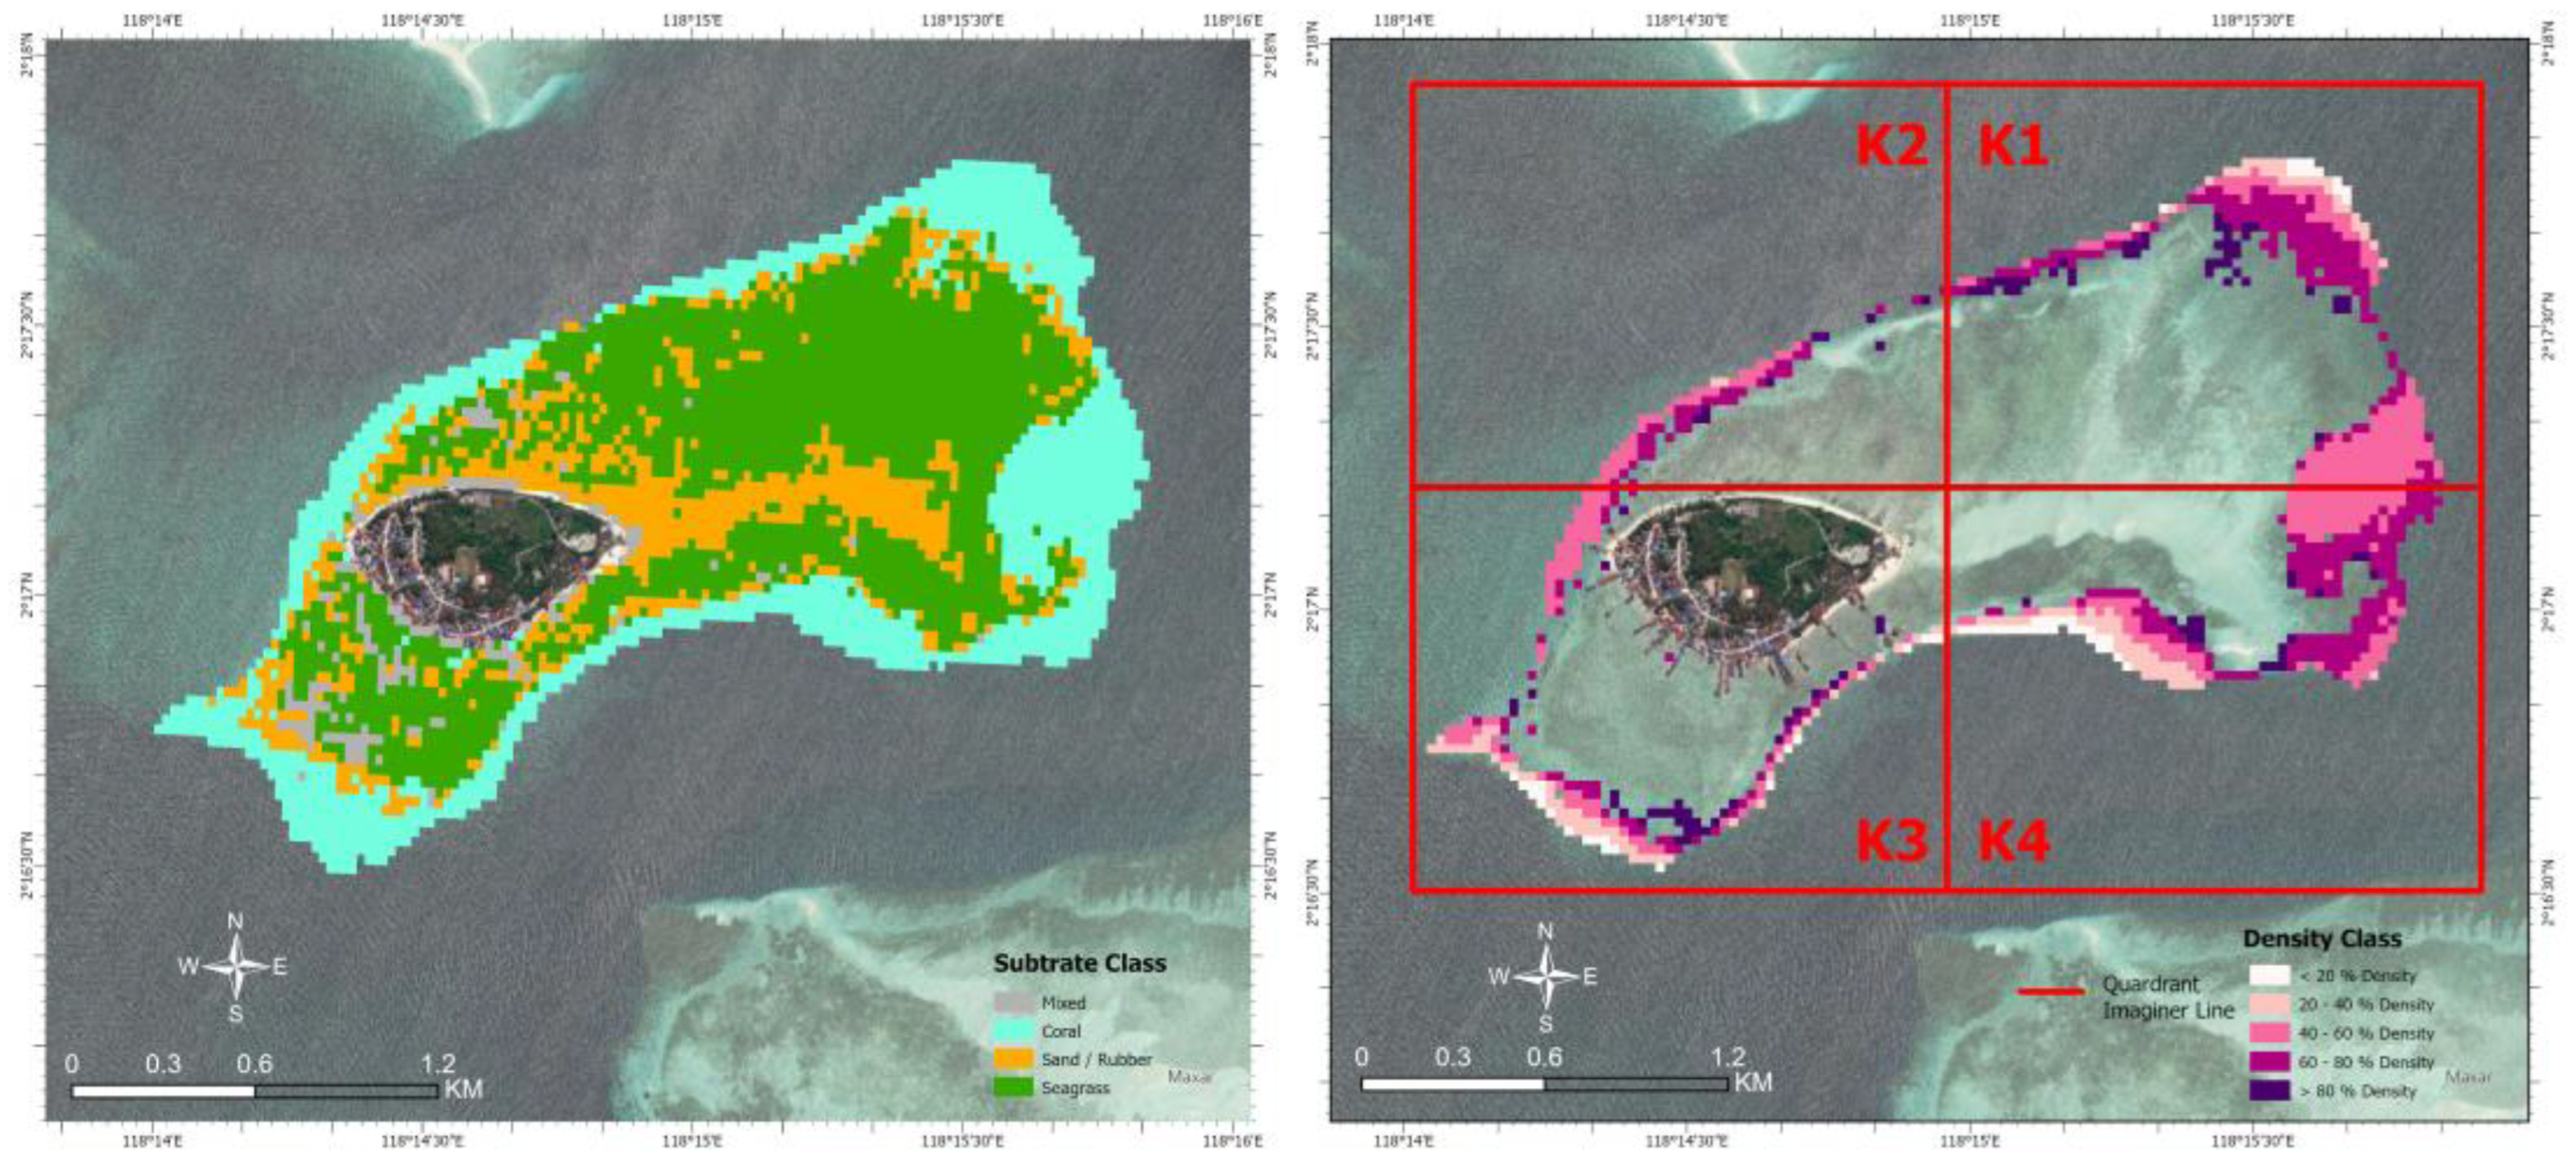
The results of the benthic habitat classification using Landsat 7 satellite imagery in 2003 on Derawan Island, as shown in
Figure 7, are based on the data processing that was done. These results indicate that the coastal area of Derawan Island in 2003 was dominated by seagrass areas, with an area of 119.33 ha and covering 34, 13% of the benthic habitat on Derawan Island in 2003. The Derawan Island rim area, which has a 111 Ha area and a percentage of 31.78%, is home to the majority of the coral reef substrate. With a total area of 112.5 ha and a proportion of 32.18%, the sand/rubble area comes in second.
Table 2, which presents a tabulation of the benthic habitat area of Derawan Island in 2003, reveals that the mixed area only has a size of 6.6 ha and a percentage of 1.91%.
According to the data processing done,
Figure 8's results of the benthic habitat classification using Landsat 7 satellite imagery in 2011 on Derawan Island reveal that the coastal area of Derawan Island was still largely dominated by seagrass beds in 2011, with an area of 175 ha and a percentage of 50.20%. The Derawan Island rim area, which has a 95.8 ha area and a percentage of 27.40%, is where the majority of the coral reef substrate is located. Afterward, the coral reefs suffered a 15% to 20% decline, leaving 95.8 ha of the eastern section with a decline. Then the sand/rubble area also experienced a decrease in habitat area, reaching more than 30 ha, and the mixed class only had a total area of 10.6 ha with a percentage of 3%, as shown in
Table 3, which shows a tabulation of the benthic habitat area of Derawan Island in 2011.
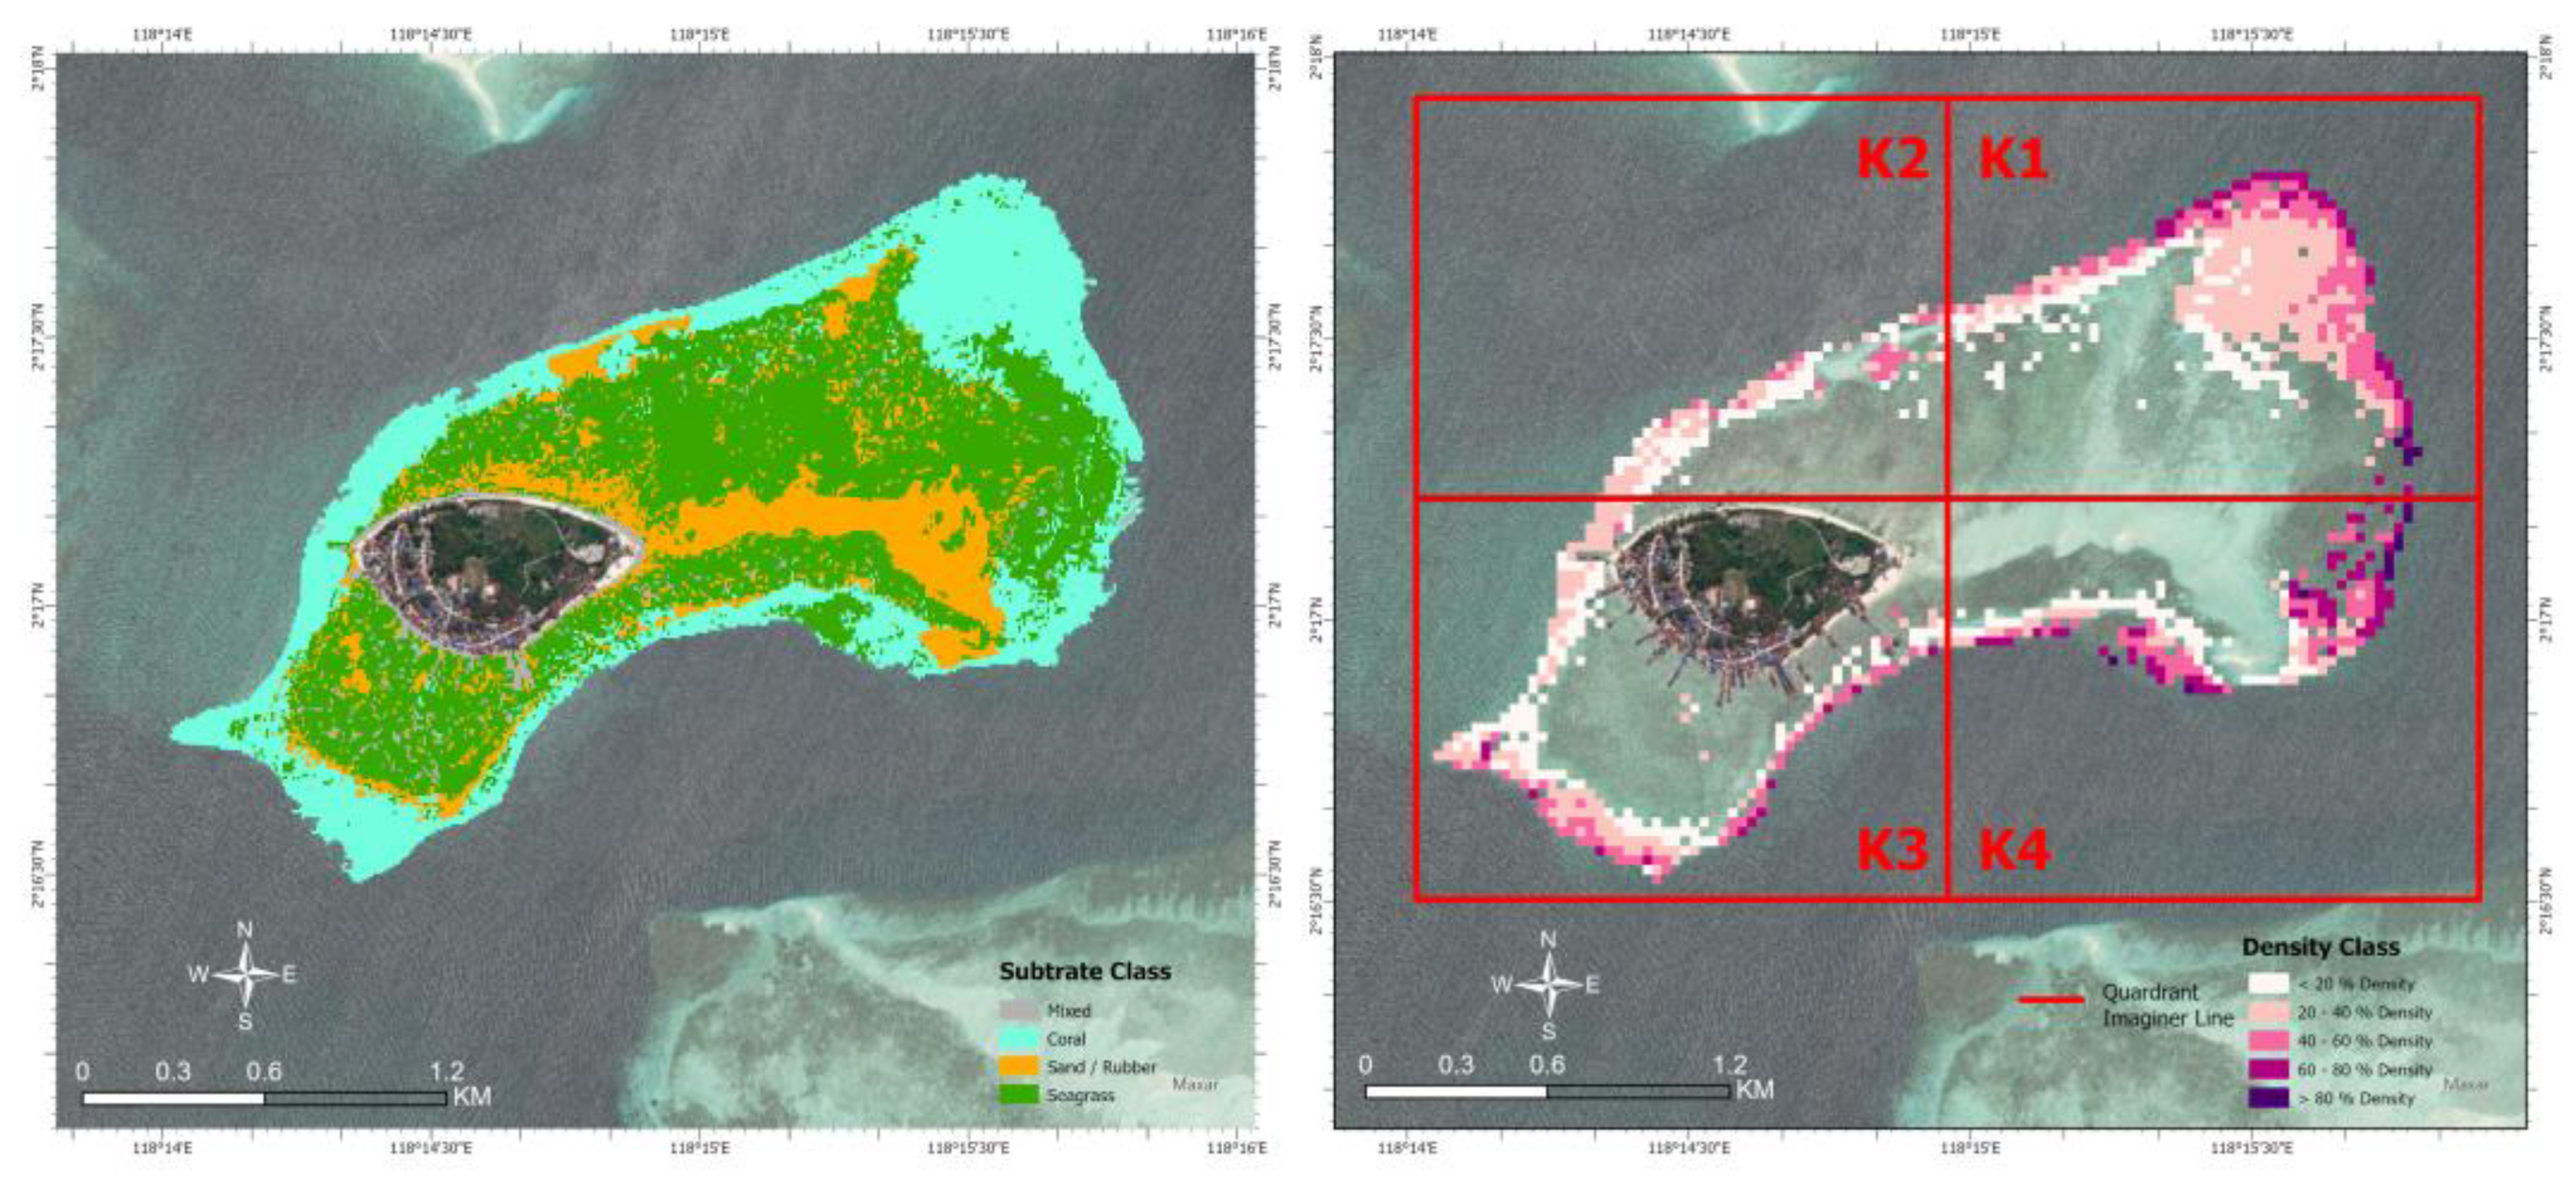
Based on the data processing, the conclusions of the benthic habitat classification were obtained from 2021 Sentinel-2 satellite photographs on Derawan Island, as shown in
Figure 9. The classification that is formed is resampled by pixels first to 30 meters so that it can be relevant in analyzing changes in the area with Landsat 7 ETM+ satellite imagery. According to the results of the benthic habitat classification, the coastline area of Derawan Island will still be dominated by seagrass beds in 2021, but with an increase in area of 167.6 hectares and a percentage of 48.02%. Meanwhile, the coral reef substrate also experienced an increase in the area of 16 ha with a total area of 110.5 ha with a percentage of 31.68%, where there was an increase in the eastern region of Derawan Island. Then class sand/rubble substrate shows an area of 56.1 ha with a percentage of 13.24%. Then the mixed substrate only has a total area of 14.7 ha with a percentage of 4.40%, as shown in
Figure 9 and
Table 4, which gives information on a tabulation of the benthic habitat area of Derawan Island in 2021.
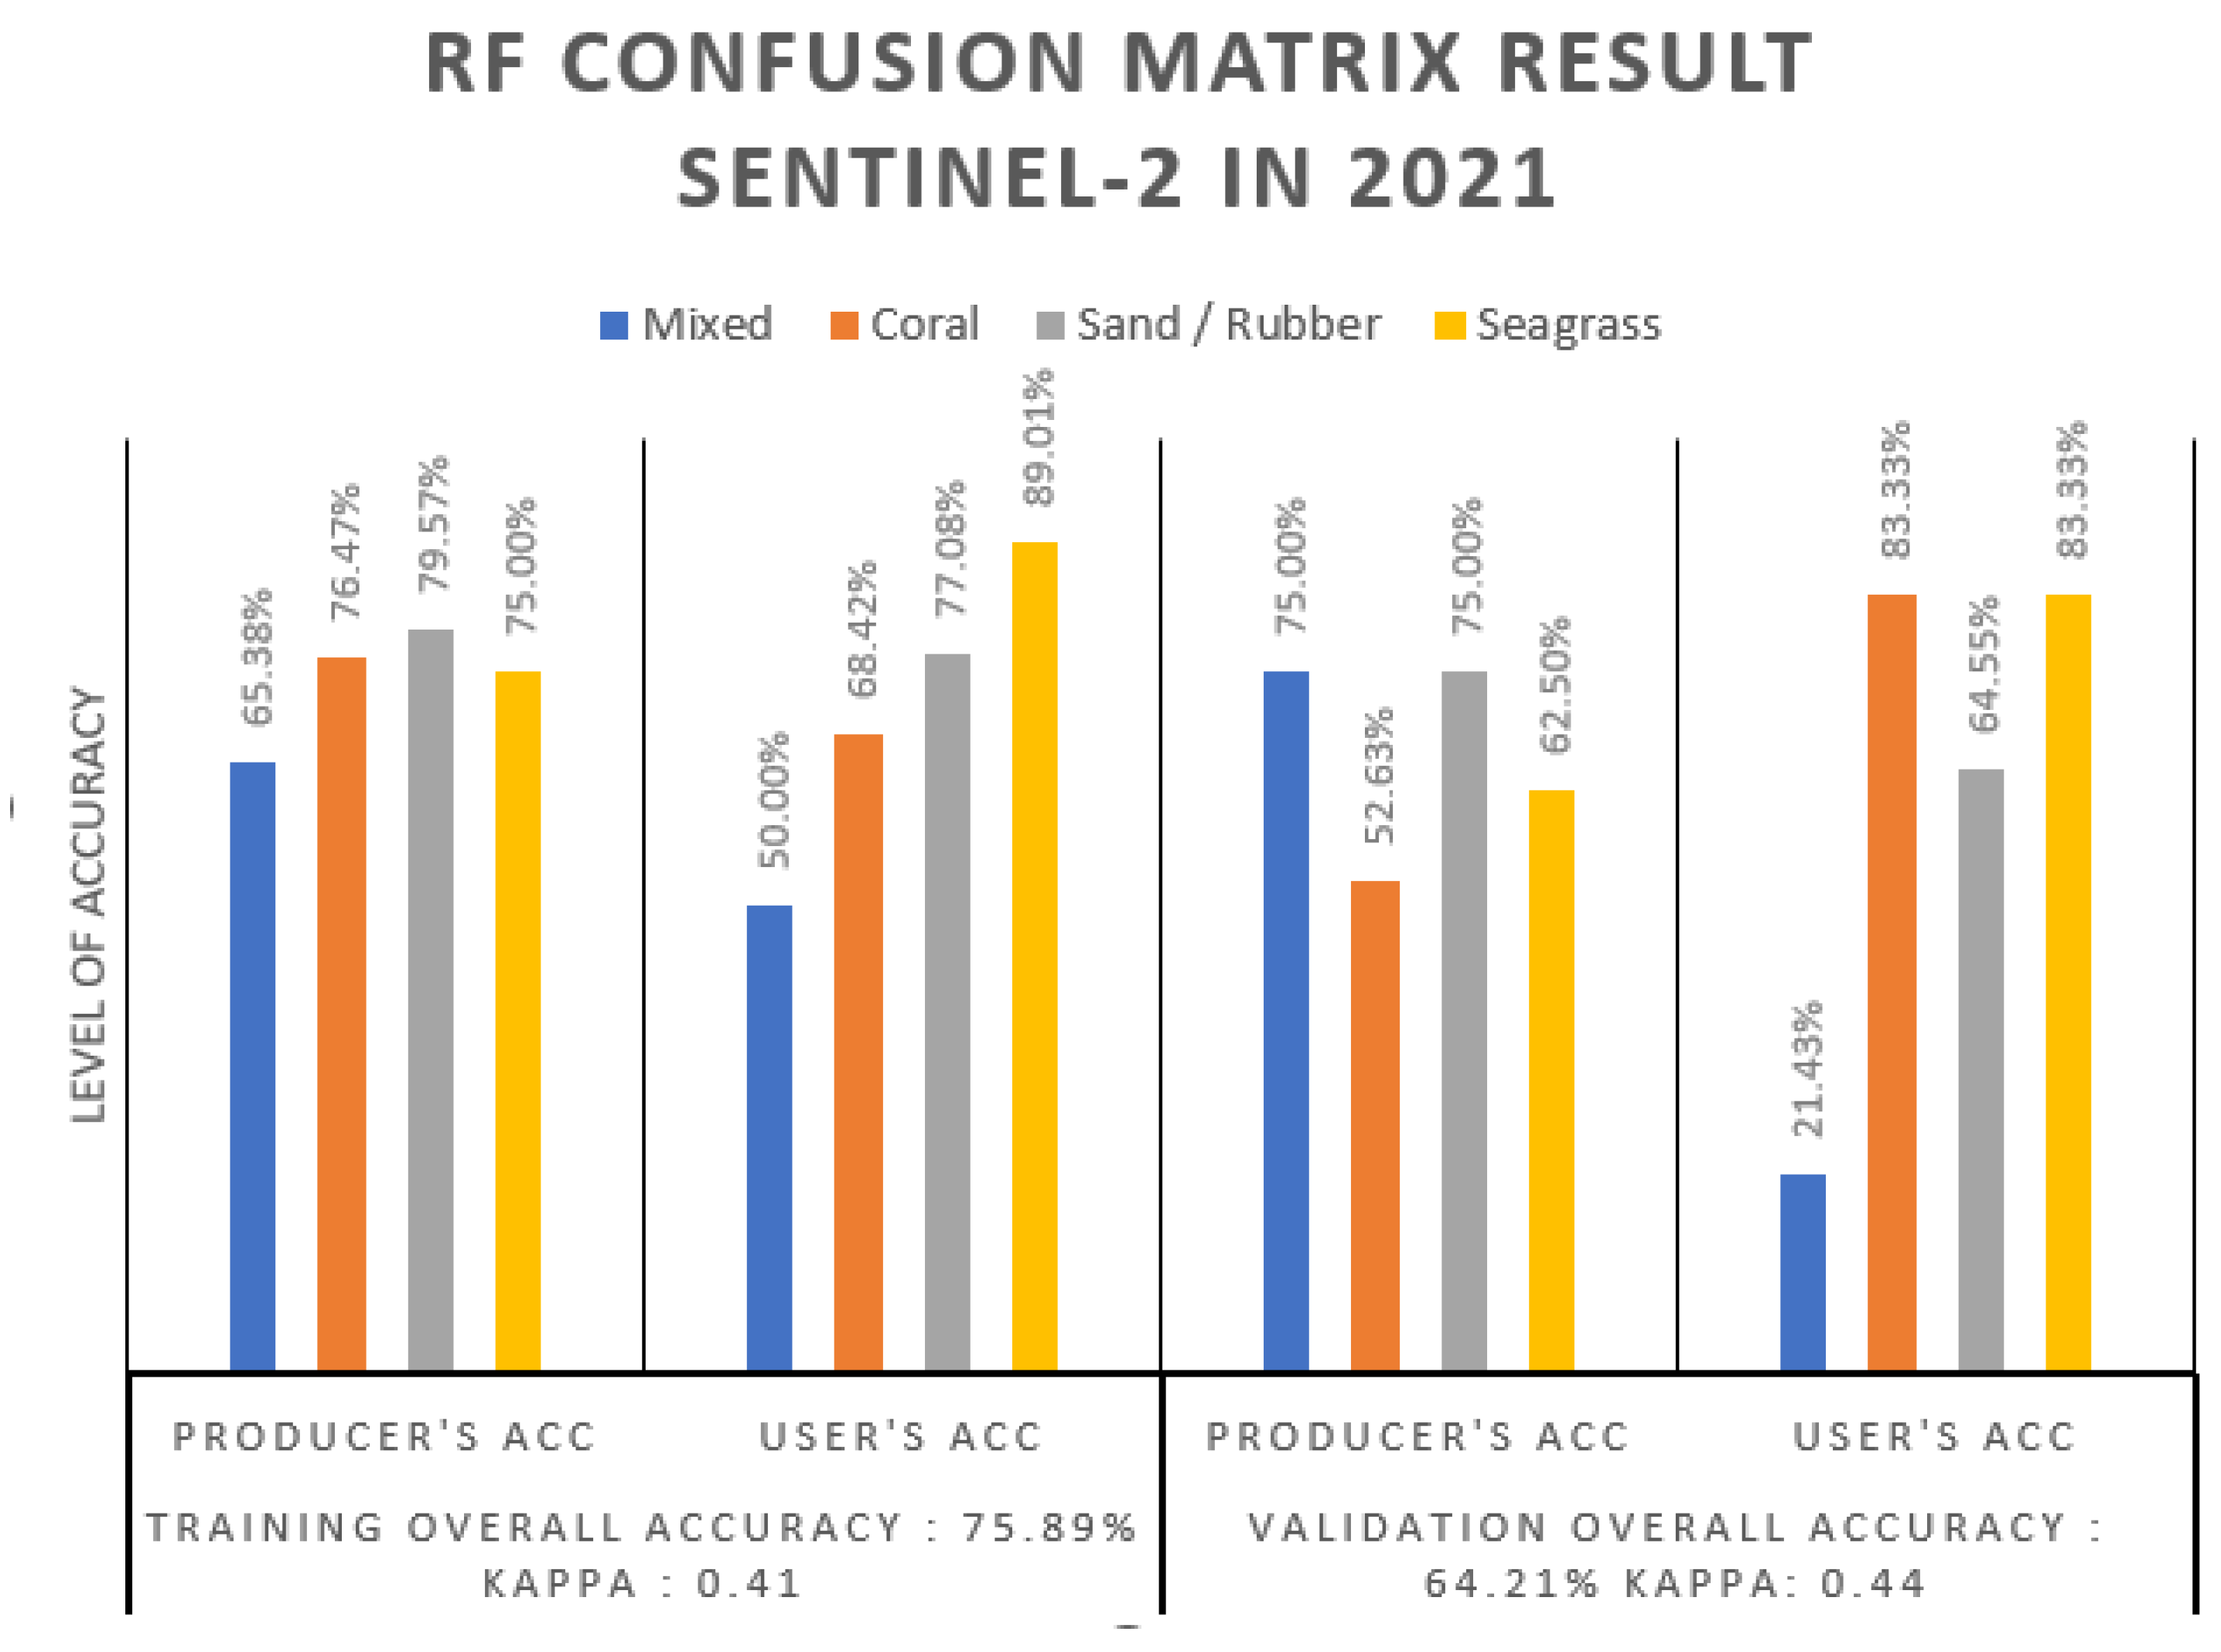
It is known that the Random Forest classification algorithm on Sentinel-2 satellite images provides the level of accuracy in benthic habitat classification based on the accuracy test results given in
Figure 10. The accuracy test value for benthic habitats has a minimum accuracy value of 60%, according to SNI 7716:2011, established by the National Standardization Agency. With a validation accuracy value of 64.21% and a validation Kappa value of 0.44, the accuracy test results demonstrate that accuracy is satisfactory. The coral reef substrate generated in the accuracy validation has a producer accuracy of 52.63% and a user accuracy of 83.33%. In the accuracy validation, the accuracy level of the sand/rubble substrate formed was 75% with a producer's accuracy and 54.55% with a user's accuracy. Furthermore, accuracy validation was used to determine the accuracy of the seagrass substrate, with a producer's accuracy value of 62.5% and a user's accuracy value of 83.33%. Then the mixed substrate has a level of accuracy that is formed in accuracy validation with a producer's accuracy value of 75% and a user's accuracy of 21.43%.
4.2. Temporal Pattern of Changes in Derawan Island Coral Reef Habitat in 2003, 2011, and 2021
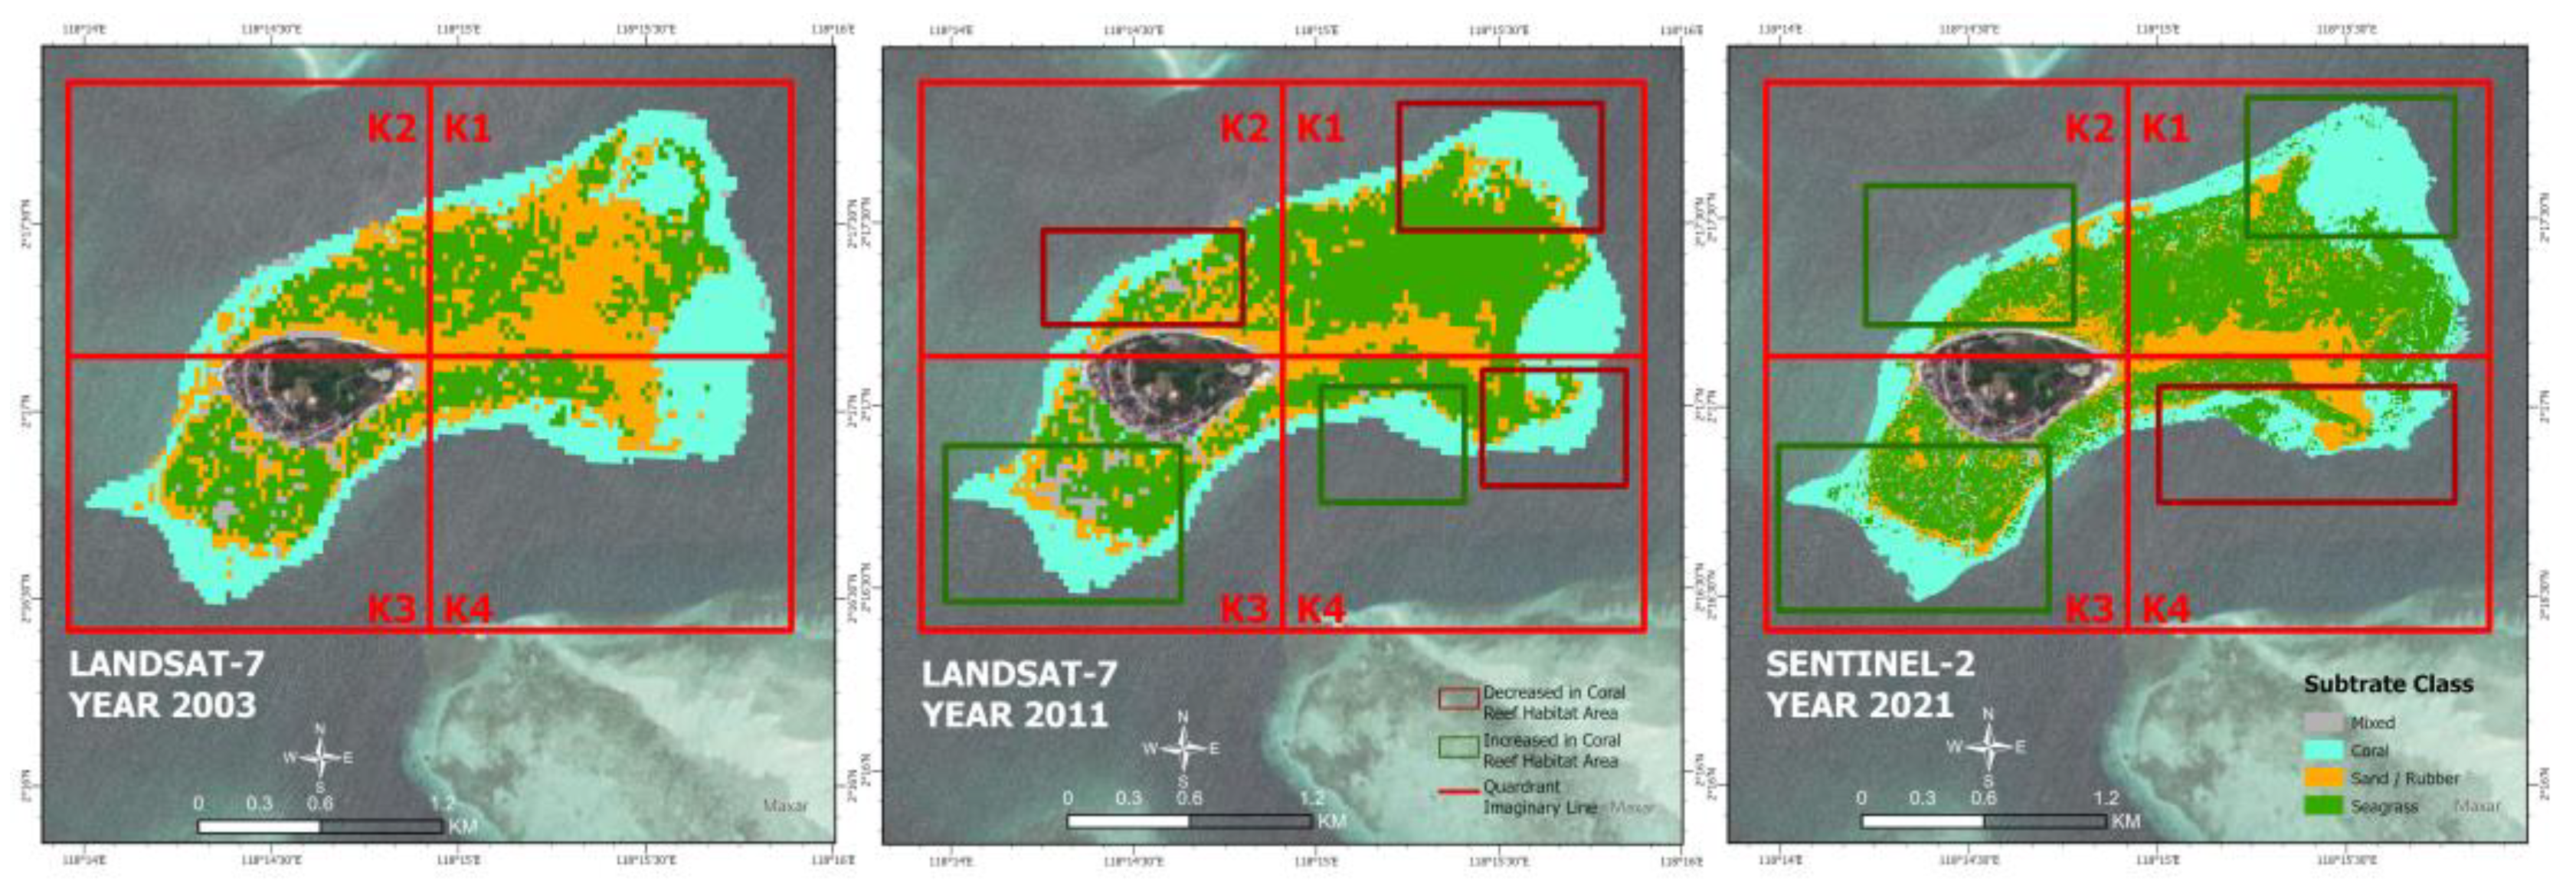
According on
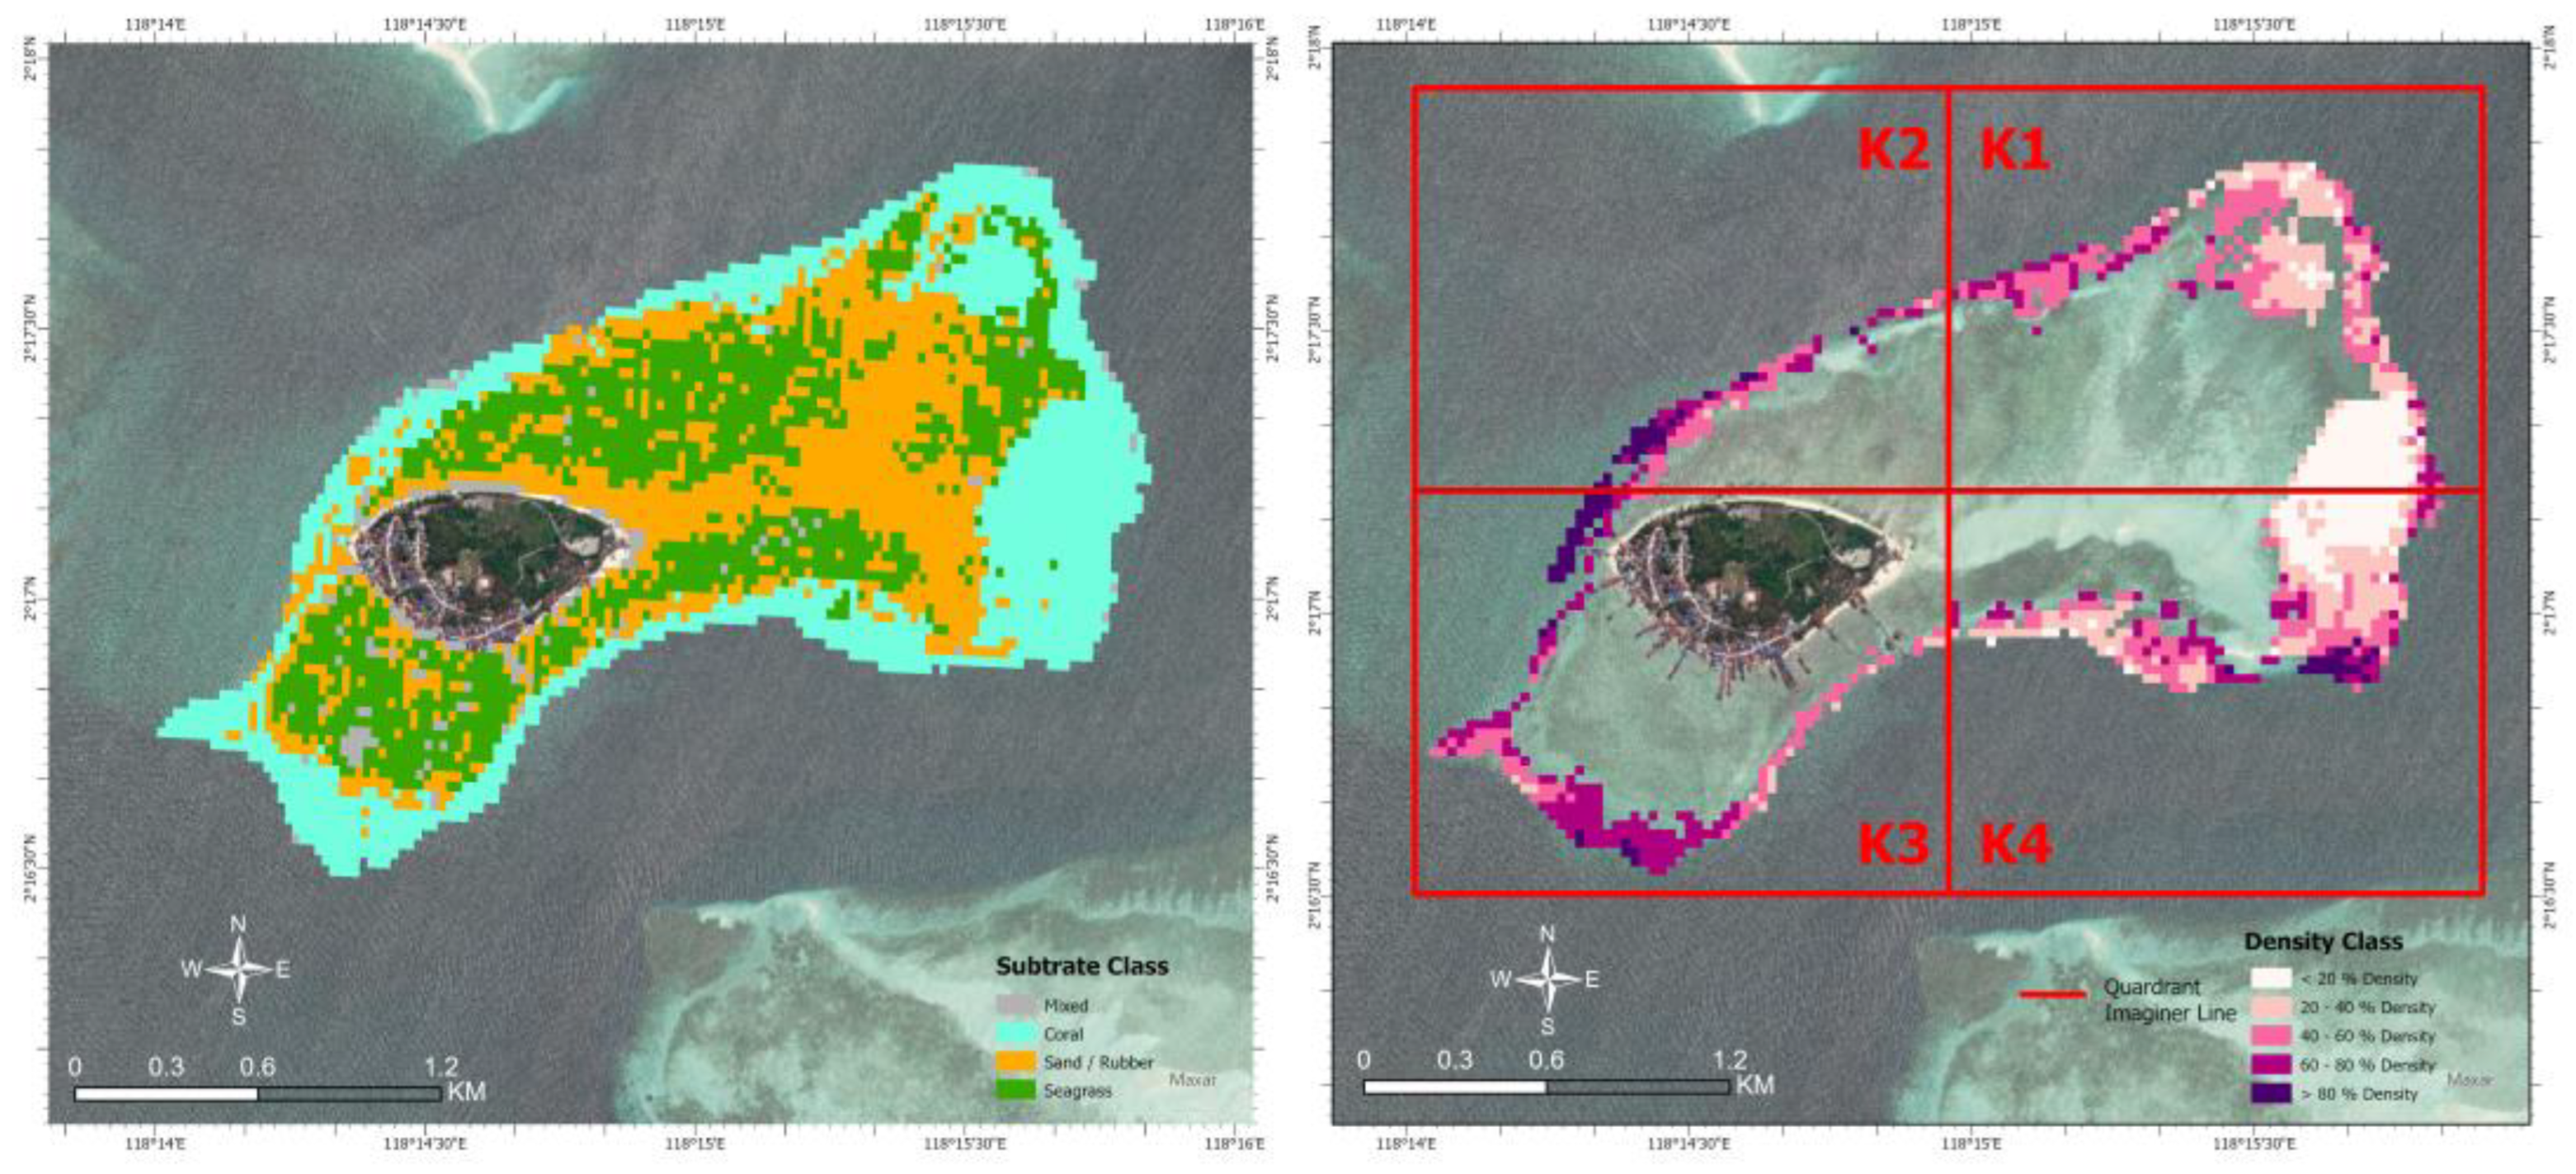
Figure 11, Pattern of Change in the Spatial Distribution of Benthic Habitat on Derawan Island in 2003–2021, it is shown that in analyzing the pattern of change in the distribution of benthic habitat, an imaginary line is used in the form of a quadrant area, which is divided into four areas with regional characteristics, such as Quadrant 1 and Quadrant 4, which are areas that are more influenced by natural factors, while Quadrant 2 and Quadrant 3 are more influenced by human activity factors, with each quadrant area being 200 ha. The division of the reference area using imaginary lines aims to make it easier to analyze patterns of changes in the distribution of benthic habitat on Derawan Island from 2003 to 2021.
According to the conclusions drawn from the findings of the Derawan Island benthic habitat classification, the complete distribution of coral reef habitat is in the reef crest zone, also known as the edge area. The green polygon symbol represents places where the coral reef habitat area has increased, whereas the red polygon symbol represents areas where the coral reef habitat area has decreased. From 2003 to 2011, there was a significant deterioration of coral reef habitat in Quadrants 1 and 4, with an area drop of 15.3 hectares. Natural factors such as current movements and sea surface temperature have a greater influence on changes in Quadrants 1 and 4. Based on the current data, it is clear that the current moves from east to west, causing changes in sea surface temperature over time. Then, from 2003 to 2021, the Quadrant 3 and Quadrant 2 areas experienced a decrease in a small portion of the distribution of coral reef habitat; the decrease occurred on the reef slope, although the Quadrant 3 and Quadrant 2 areas are areas closer to Derawan Island and human activities with gentle slopes.
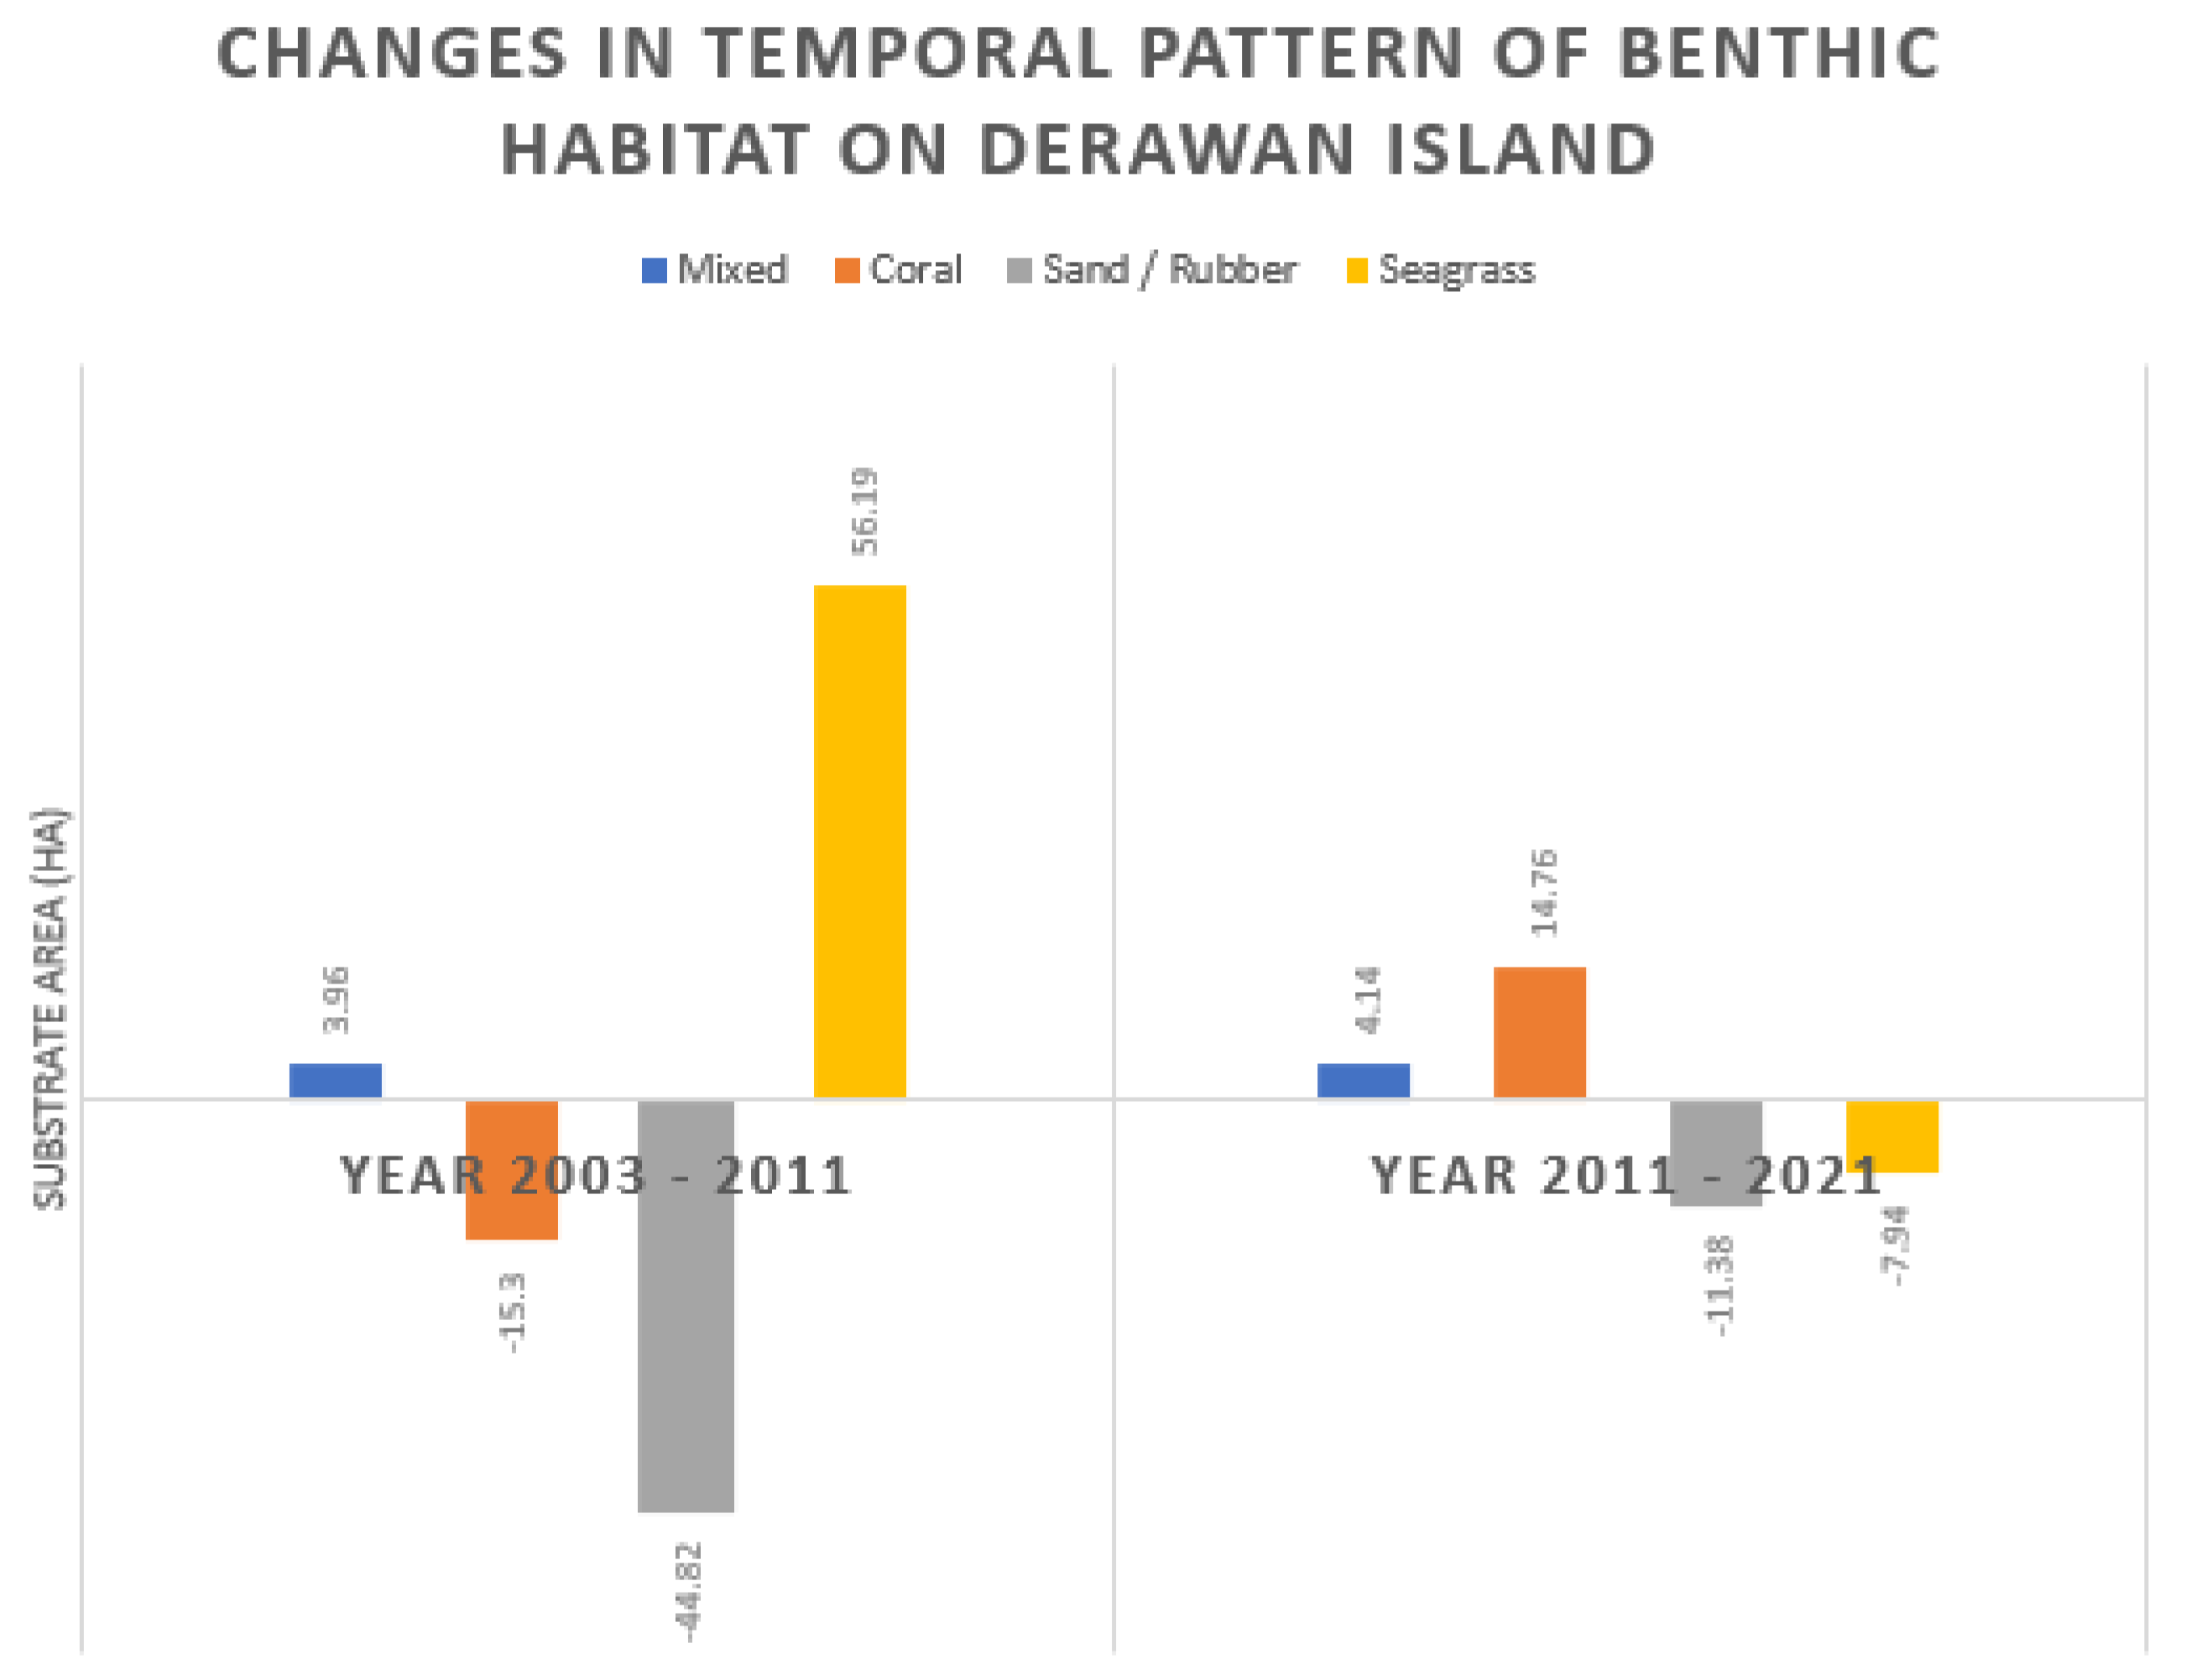
Meanwhile, from 2011 to 2021, in general, there was an increase in coral reef habitat in Quadrant 1, Quadrant 3, and Quadrant 2, where the condition of coral reef habitat has begun to return to normal with a lower density, and there are several coral areas located outside the barrier. in the period 2011–2021. This increase occurred entirely in the reef crest, or tuber, which allows many types of coral to grow, increasing the distribution of Derawan Island's coral reef habitat. The increase in the area of coral reef habitat that occurred in the period 2011–2021 was 14.76 ha, and this value resembles the area of coral reef habitat on Derawan Island in 2003. However, only in the Quadrant 4 region does the area of coral reef habitat continue to decrease. If we look at the regional characteristics in Quadrant 4, changes in coral reef habitat tend to be influenced by natural factors, namely current movements and changes in sea surface temperature. From statistical data on the temporal distribution of benthic habitat obtained from data processing, it can be seen that a reduction in distribution continues to occur on sand and rubble substrates. Meanwhile, the distribution of coral reef substrates from 2011 to 2021 continues to experience an increase in area of up to 15 ha as well as mixed substrates of up to 4 ha. Then, for seagrass substrate, there was an increase in 2003–2011, but a decrease occurred in the period 2011–2021, reaching 8 ha.
Figure 12.
Graph of changes in the temporal distribution of benthic habitat on Derawan Island in 2003, 2011, 2021.
Figure 12.
Graph of changes in the temporal distribution of benthic habitat on Derawan Island in 2003, 2011, 2021.
