
You are currently viewing a beta version of our website. If you spot anything unusual, kindly let us know.
Preprint
Article
A Novel Platinum Modified Barium Zirconate-Based Electrolyte for Enhanced Solid Oxide Fuel Cell Performance
Altmetrics
Downloads
121
Views
34
Comments
0
A peer-reviewed article of this preprint also exists.


This version is not peer-reviewed
Abstract
Pt modified BaZr0.76Y0.2Ni0.04O3 (BZYN) is fabricated and characterized as a stable electrolyte for proton-conducting solid oxide fuel cell (H-SOFC). The utilization of X-ray diffraction method (XRD) and transmission electron microscopy (TEM) enables the identification of the presence of platinum (Pt) in both the crystal lattice sites and the grain interface. This occurrence contributes to a reduction in grain boundary resistance. Consequently, this phenomenon improves the conductivity of the electrolyte. The electrochemical performance of the single cell with Pt modified BZY electrolyte is improved by the reduction of ohmic resistance and enhancement of ion migration. This signifies a noteworthy advancement in the creation of more efficient and durable proton-conducting SOFCs.
Keywords:
Subject: Chemistry and Materials Science - Physical Chemistry
1. Introduction
The past few decades have witnessed a persistent rise in interest in proton solid oxide fuel cells (H-SOFCs) due to the pressing demand for clean energy and environmental conservation. The primary reason for their suitability for future commercial applications is their excellent cell performance and better conversion efficiency at intermediate temperatures[1]. Barium cerate and barium zirconate materials exhibit a notable degree of proton mobility, rendering them highly suitable as electrolytes for H-SOFCs. This is mostly attributed to their exceptional proton conductivity[2,3,4]. The currently predominant proton-conducting oxides in use are materials based on BaCeO3. These materials have notable ionic conductivity, but are prone to chemical instability when exposed to atmospheres containing CO2 and H2O. [5,6]. Yttrium-doped BaCeO3 has superior proton conductivity compared to other oxides within its class. However, its commercial viability is hindered by insufficient chemical stability when subjected to operational conditions within a cell[4,7].
In recent years, researchers have made significant progress in developing viable techniques to address the challenges associated with BaZrO3 based materials, thereby enhancing their suitability for use in proton conducting SOFCs. Considering the chemical stability, fabrication feasibility and proton conductivity, Y doped BaZrO3 (BZY) shows promising application potential[8,9,10]. Although the bulk proton conductivity of BZY is competitive with other proton conductors, the high grain boundary resistance caused by its poor sintering ability hinders widely application as an electrolyte for H-SOFCs[11]. In recent years, numerous endeavors have been undertaken to enhance the sintering density of BZY, hence reducing the resistance at grain boundaries[12,13]. Sintering aids, such as zinc oxide (ZnO) and nickel oxide (NiO), are employed to lower sintering temperatures. Extensive study has been conducted to investigate the underlying mechanisms by which these aids exert control over stoichiometry. It is found that NiO can react with BZY and BaZr0.76Y0.2Ni0.04O3 (BZYN) exhibits adequate total conductivity. Hence, it is imperative to investigate a viable approach for the production of high-performance BZY cells without the intentional inclusion of sintering aids, since this offers significant benefits for practical application.
Platinum (Pt) is frequently employed as the electrode material for conducting conductivity tests, as well as serving as an electrode in fuel cell testing[14,15]. The experimental procedure for evaluating the electrochemical properties of BZY material involves several stages. Firstly, a dense BZY pellet is prepared through the process of sintering. Subsequently, a layer of Pt film is applied onto the surface of the dense BZY pellet. Finally, the coated pellet is subjected to high-temperature firing to serve as the electrodes for testing the electrochemical properties. The potential interaction between Pt and BZY is often overlooked since Pt is considered an inert substance. Bi has recently provided a definitive result regarding the diffusion of Pt into the lattice of BZY[16]. Another study indicates that at elevated temperatures, Pt has the potential to undergo a reaction with BaCeO3, resulting in the formation of different proton conductor phases [17]. It follows that Pt is not totally inert with proton-conducting oxides, and that a reaction will take place between Pt and BZY. In addition, the reaction of Pt and BZY powders is also studied and O1s binding energy decreases which might be crucial to proton migration[18]. On account of the demands of proton-conducting electrolytes, it is imperative to elucidate the impact of Pt on conductivity and boundary resistance.
In the present work, we chose BZYN as electrolyte which was treated with Pt foil at the high sintering temperature. The influence of Pt on the phase structure, grain boundary growth, and electrical conductivity of the materials were investigated. In addition, an anode-supported fuel cell with Pt modified BZYN electrolyte was assembled and its performance was evaluated to determine the benefits of employing this approach for H-SOFCs.
2. Experimental
2.1. Materials Synthesis
BZYN powders were produced via a wet chemical combustion method supported by citric acid[19]. The appropriate weights of several raw precursors were identified based on the stoichiometric ratio derived from the BZYN formula. Initially, appropriate precursors of BaCO3 (99.95%, Macklin), Zr(NO3)4·5H2O (99.99%, Macklin), Y(NO3)3·6H2O (99.99%, Macklin), and Ni(NO3)2·6H2O (Xilong Scientific) were dissolved into dilute nitric acid solution while Citric acid monohydrate (99.99%, Macklin) with a weight ratio of 1.5:1 to metallic ions was added as complexing agents. Afterwards, the pH of the solution was modulated to around 7 using ammonia, resulting in a transparent solution. Following that, the solution endured continuous mixing at a temperature of 80 ℃ until combustion, which was subsequently subjected to firing at a temperature of 1000 ℃ for 3 h.
2.2. Characterization and Electrochemical Measurement
The BZYN powders were pressed under 300MPa to form BZYN pellets which were subsequently sintered at 1550 oC for 10h for the electrical conductivity test. The sintered pellets were treated on Pt foil at 1300 oC for 5 h to obtain Pt modified BZYN (Pt-BZYN). The total electrical conductivities of the sintered pellets were measured by analyzing impedance spectrum via a Zahner Zennium electrochemical workstation with amplitude of 5 mV.
The BZYN electrolyte was co-pressed on the anode substrate and functional layer mezzanine. The anode powder is composed of BZYN, NiO and starches in a ratio of 40: 60: 20, while the functional layer powder is formed of BZYN and NiO in a ratio of 45:55. The functional layer powder synthesized by BaCO3 (99.95%, Macklin), Zr(NO3)4·5H2O (99.99%, Macklin), Y(NO3)3·6H2O (99.99%, Macklin), and Ni(NO3)2·6H2O (Xilong Scientific) by the wet chemical combustion method with the assistance of citric acid. The half-cell was then sintered at 1350◦C for 5 h. Pt-BYZN electrolyte was obtained through placing previous BZYN powder on the surface of Pt foil and heating it at 1000 oC for 3 h. Powdered La0.6Sr0.4Co0.2Fe0.8 O3-δ (LSCF) was combined with 10 wt% of ethylcellulose-pineol adhesive to create the cathode slurry. The BZYN and Pt-BZYN electrolytes were then screen printed with the cathode slurry before being calcined at 1000 oC for 3 h. Subsequently, the cell performance was measured between 600 to 700 oC on an electrochemical workstation (Admiral-plus-1772). Wet hydrogen gas, containing about 3% water, was used as the fuel source at a flow rate of 25 ml min-1 while ambient air was adopted as oxidant. The Linear Sweep Voltammetry (LSV) mode was employed to obtain the I-V/I-P curves of the cell. Furthermore, the Electrochemical Impedance Spectra (EIS) were obtained by conducting measurements under open circuit conditions. The frequency range utilized for these measurements was set at 0.1-1 MHz, while the alternating current (AC) amplitude was maintained at 10 mV.
The crystal phase and structure parameters of the produced BZYN and BZYNP samples were determined using X-ray diffraction (XRD) analysis, employing CuKa radiation. The morphology and elemental distribution of the powders were observed and analyzed through scanning electron microscopes (SEM, Phenom XL) and Transmission electron microscopy (TEM, JE0L JEM-F200).
3. Results and Discussion
Figure 1 presents XRD patterns of synthesized BZYN and Pt-BZYN powders. The image illustrates that only peaks attributed to BZYN and Pt-BZYN are present, indicating that both BZYN and Pt-BZYN exhibit a singular phase that can be identified as a cubic perovskite structure (PDF No. 06-0399). In order to observe the influence of Pt, an enlarged diffraction pattern is provided. Based on the observed specific magnification ranging from 26-34° in Figure 1, it is evident that the peaks exhibit a minor shift towards higher angles. In accordance with the Bragg equation, it becomes evident that the introduction of Pt as a dopant leads to a reduction in the lattice constants. This phenomenon can be attributed to the variance in atomic radius between Pt4+ (0.62 Å) and Zr4+ (0.79 Å), resulting in a reduction of the lattice parameter when Zr4+ is replaced with Pt4+.
The microstructures of the sintered Pt-BZYN samples were meticulously examined using scanning electron microscopy (SEM) and are prominently displayed in Figure 2(a). Notably, the sample exhibits a state of complete density, devoid of any discernible pores. This compelling observation underscores that the introduction of Pt as a dopant has no adverse effects on the sintering activity. In addition, energy dispersive spectroscopy (EDS) is employed to investigate the elemental distribution within the material, and these results are thoughtfully illustrated in Figure 2(b-f). The elemental analysis reveals a remarkably even dispersion of Ba, Y, Ni, and Zr throughout the sample. Interestingly, minute quantities of Pt are also detectable. This distribution pattern of Pt strongly suggests its potential incorporation into the BZYN lattice, consistent with the previously discussed XRD findings.
Through a meticulous analysis of lattice parameters and structural characteristics, it has been unequivocally demonstrated that Pt not only partially inhabits the lattice sites but also conforms to findings in the existing literature on this subject [20]. In our study, to further study doping sites of Pt, the morphology of Pt-BZYN powders are characterized using transmission electron microscopy (TEM). Figure 3(d) illustrates the presence of dark nano-particles attached to the grain boundary, indicating that Pt has a tendency to aggregate at the interface in addition to occupying lattice sites. This aggregation of Pt on the grain boundary may have a positive impact on ion conductivity. It is because the resistance at the grain boundary significantly influences the conductivity of BZY. In addition, it is obvious from Figure 3(c) that a d-spacing value of 0.300 nm corresponds to (110) planes of BaZrO3-based material as reported by reference[21]. Conversely, a d-spacing value of 0.21 nm corresponds to the (110) planes of Pt-based materials, as depicted in Figure 3(b)[22,23]. This compelling evidence confirms the presence of Pt generated at the grain boundaries. Furthermore, Figure 4 presents the transmission electron microscopy-energy dispersive X-ray spectroscopy (TEM-EDX) scanning outcome of Pt-BZYN, providing insights into the quantification of platinum (Pt) content within the Pt-BZYN samples.
The conductivity of BZYN and Pt-BZYN was meticulously assessed under ambient air at various temperatures via electrochemical impedance spectroscopy, and the results are visually presented in Figure 5. It becomes readily apparent that Pt-BZYN consistently exhibits notably higher conductivities across the temperature range of 350°C to 700°C, in sharp contrast to BZYN. This conspicuous difference underscores the critical role of Pt doping in enhancing conductivity, a factor that exhibits a direct and positive correlation with electrochemical performance.
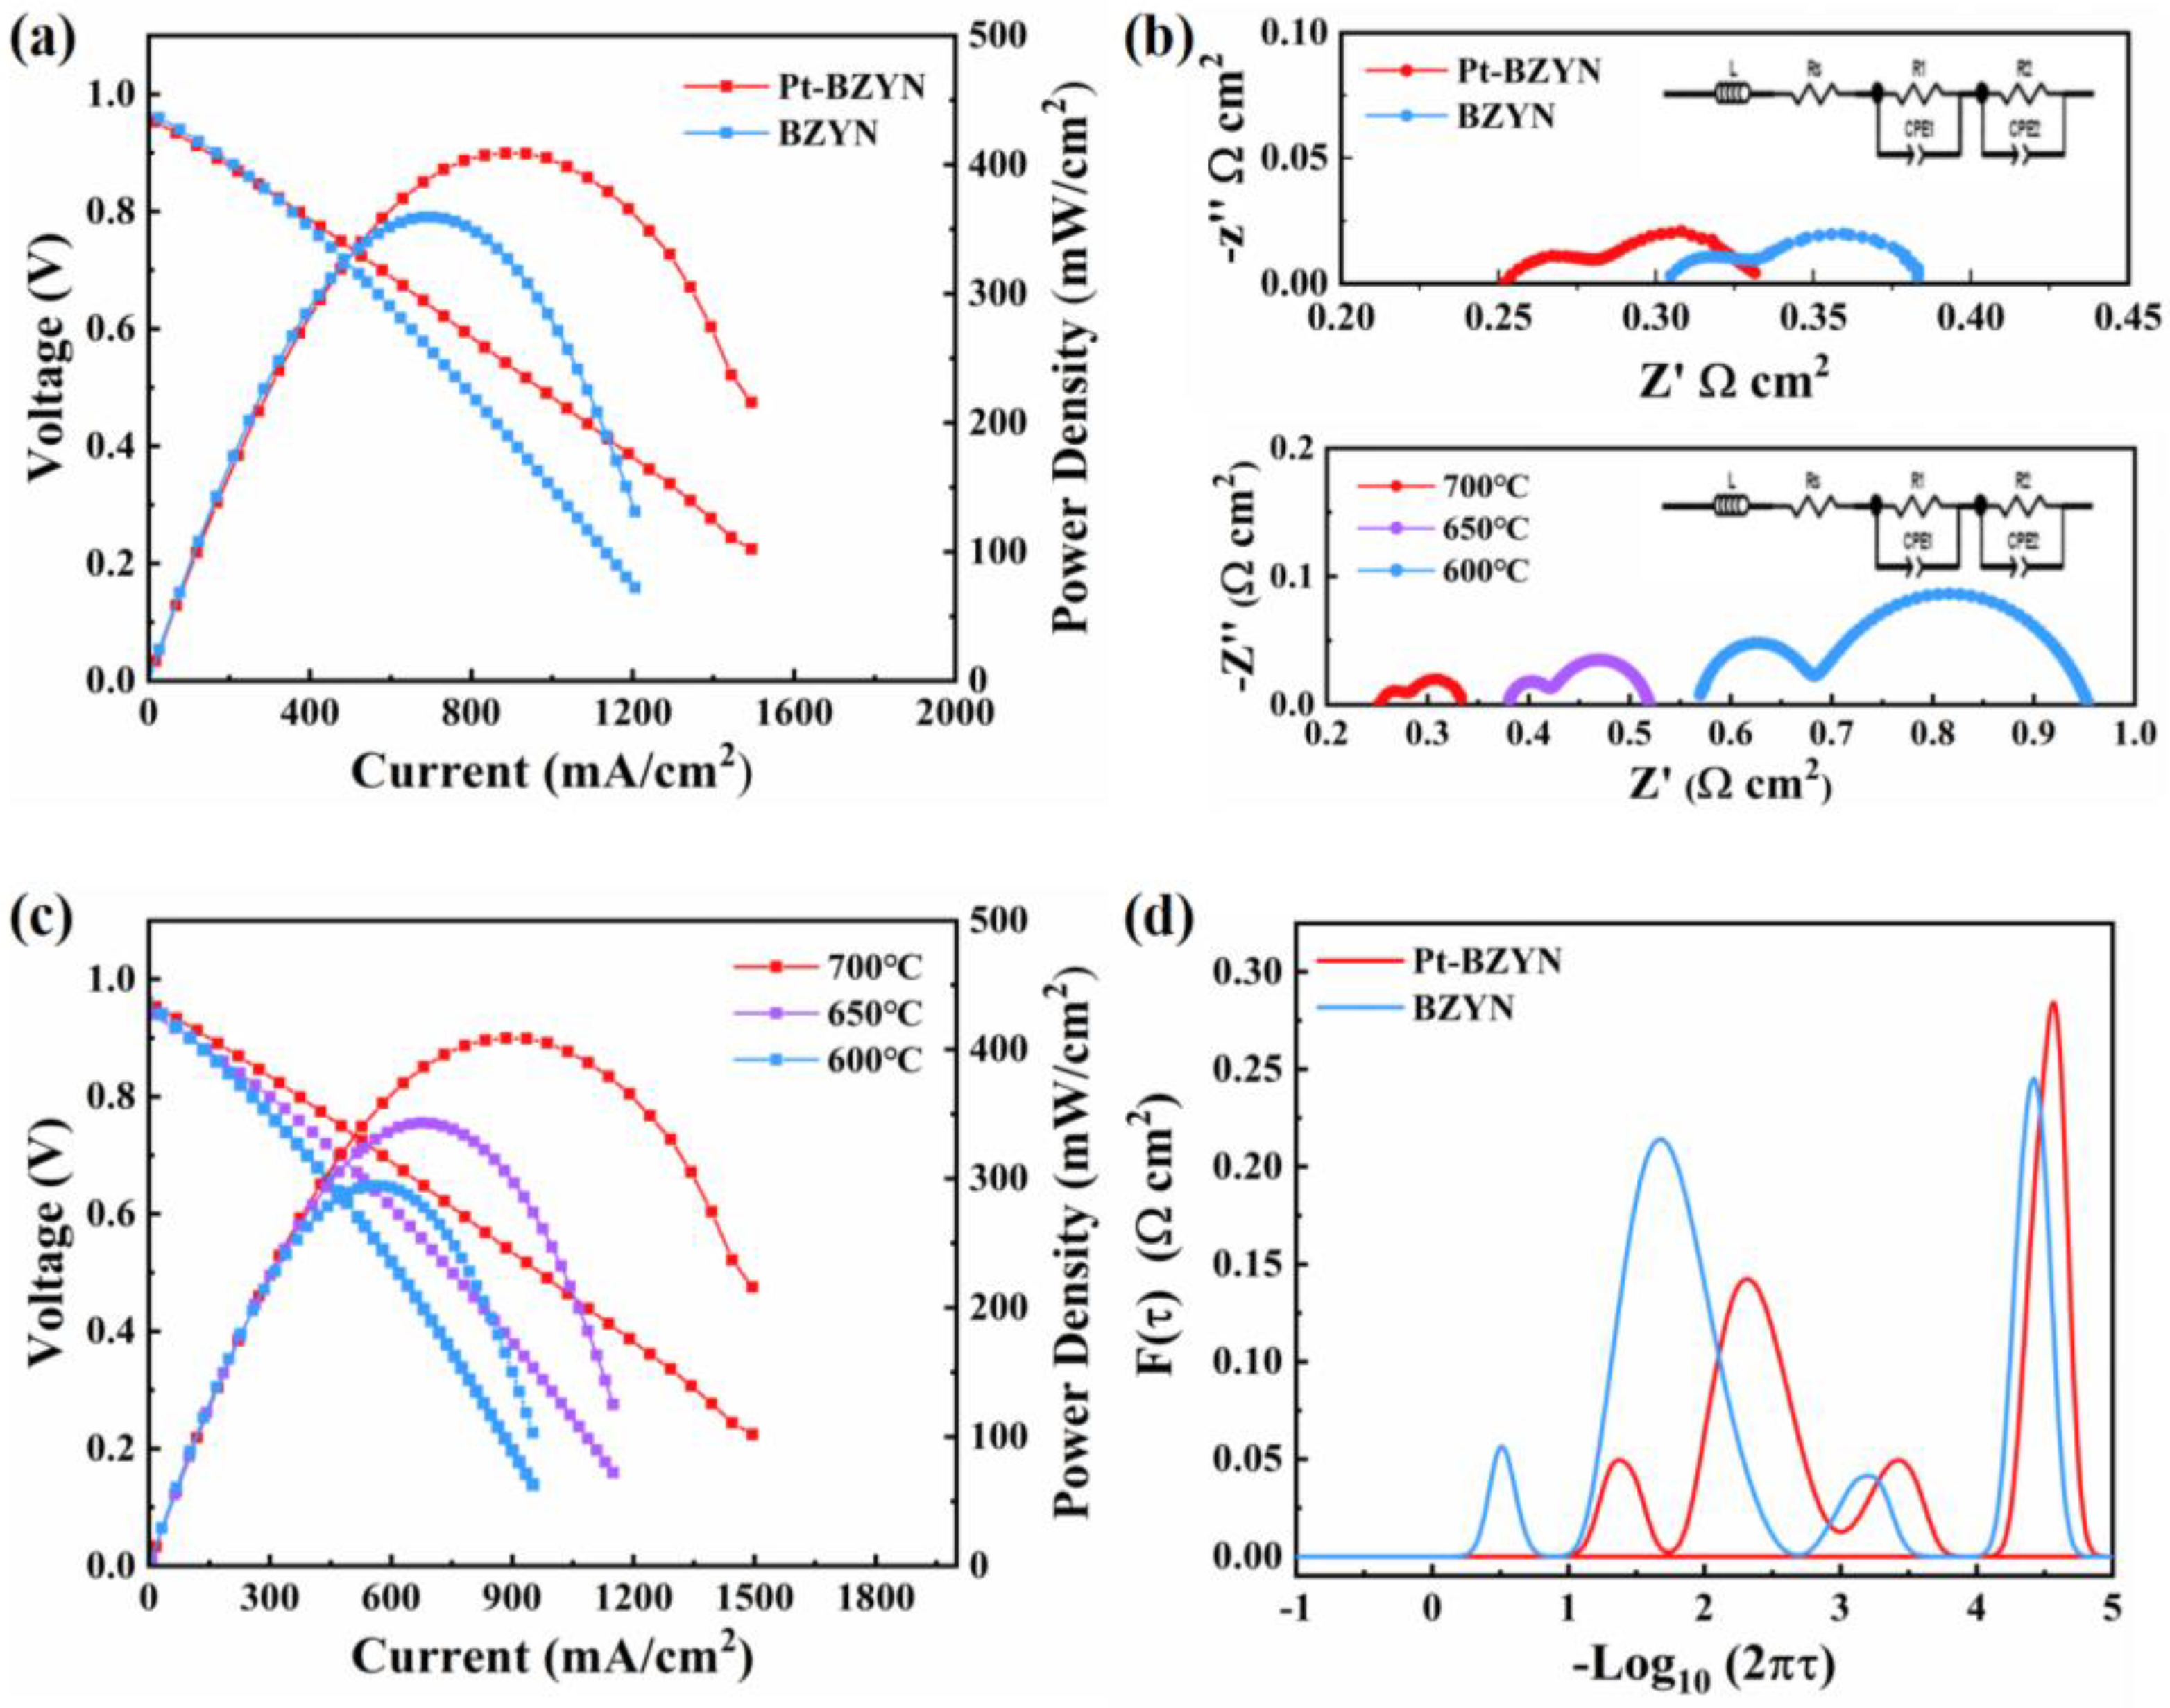
The cross-sectional microstructure of single cells utilizing BZYN and Pt-BZYN as the electrolyte materials is vividly illustrated in Figure 6. This micrograph reveals four distinct layers, with the electrolyte layer boasting a thickness of approximately 6-7 micrometers. Furthermore, it’s evident that both electrolyte layers exhibit a high degree of density, signifying robust contact between the electrolytes and electrodes, thus ensuring the integrity of the hydrogen containment within the cell. Given the uniformity in electrolyte thickness, the electrochemical performances of these assembled single cells are characterized and evaluated. Figure 7a presents a compelling comparison of the cell performance of H-SOFCs employing BZYN and Pt-BZYN electrolytes at an operating temperature of 700 °C. Clearly, the cell with Pt-BZYN as the electrolyte exhibits superior performance. Notably, there is an approximate 15% enhancement in maximum power density (MPD) observed, rising from 350 to 408 mW·cm-2. In Figure 7c, we can observe the cell performance of Pt-BZYN at various temperatures, revealing a positive correlation between power density and operating temperatures. Specifically, as depicted in the figure, the MPDs achieved are 408 mW cm−2 at 700°C, 345 mW cm−2 at 650°C, and 290 mW cm−2 at 600°C for the single cell. This trend underscores the significance of temperature control in optimizing power density in the cell.
The electrochemical impedance spectra (EIS) of the cells under open circuit voltage (OCV) conditions were conducted to assess the impact of Pt. As illustrated in Figure 7b, it can be observed that the polarization resistance (Rp) values of the two different cells are nearly identical. This suggests that the electrolyte has a relatively weak influence on Rp, with the main factors potentially being related to the cathode materials and their structures. However, it is clear that the ohm resistance of Pt-BYZN is much lower than that of BZYN, indicating the conductivity of the electrolyte is improved through doping of pt which in turn modifies the grain boundary to decrease grain boundary resistance. Furthermore, the EIS results across the temperature range from 600 °C to 700 °C are presented. As illustrated, the overall ohmic resistance decreases from 0.56 Ω cm2 at 600 °C to 0.25 Ω cm2 at 700 °C, indicating a negative relationship between temperature and ohmic resistance. Additionally, there are two distinct arcs in the impedance spectrum, corresponding to the two cathode reaction processes related to oxygen adsorption and transmission.
Recently, the distribution of relaxation time (DRT) method has been employed for analyzing EIS results to gain insights into the detailed reaction processes of fuel cells. In Figure 7(d), we present the DRT results calculated from impedance spectra obtained at 700 °C to investigate the impact of Pt. Notably, there are several distinct peaks, each representing specific reaction processes. The peaks at high and low frequencies are relatively similar, while the peak at intermediate frequency shows significant differences. It’s worth highlighting that the process at intermediate frequency is influenced by the migration of protons and oxygen ions [24]. The higher conductivity associated with Pt likely facilitates greater proton transfer to the cathode side through the electrolyte, thereby reducing the intensity of the peak at the intermediate frequency.
4. Conclusion
The low conductivity of BZYN due to the high grain boundary resistance hindered its application as a stable electrolyte for H-SOFCs. A simple technique via volatilization of platinum was adopted to treat BZYN electrolyte. The XRD results showed that pt modified BZYN had the same phase structure as BZYN and lattice parameters decreased for the lower ion radius, presenting pt partially located into the lattice sites. TEM results future determined that nanoparticle of pt attached at the grain boundary which may be beneficial for the ion conductivity. The cell with Pt-BZYN electrolyte displayed a higher maximum power density of 408mW cm-2 and a lower polarization resistance of 0.25 Ω·cm2 compared to the cell employing BZYN as electrolyte at 700 oC. Our findings suggest that the application of Pt treatment can be considered as a viable and efficient technical approach.
Acknowledgments
This work was supported by the National Natural Science Foundation of China (Grant Nos.: 11875164) and Natural Science Foundation of the Higher Education Institutions of Jiangsu Province (No. 18KJA430017).
References
- Gao, Y.; Zhang, M.; Fu, M.; Hu, W.; Tong, H.; Tao, Z. A comprehensive review of recent progresses in cathode materials for Proton-conducting SOFCs. Energy Reviews 2023, 100038. [Google Scholar] [CrossRef]
- Loureiro, F.J.; Nasani, N.; Reddy, G.S.; Munirathnam, N.; Fagg, D.P. A review on sintering technology of proton conducting BaCeO3-BaZrO3 perovskite oxide materials for Protonic Ceramic Fuel Cells. Journal of Power Sources 2019, 438, 226991. [Google Scholar] [CrossRef]
- Vignesh, D.; Sonu, B.K.; Rout, E. Factors constituting proton trapping in BaCeO3 and BaZrO3 perovskite proton conductors in fuel cell technology: a review. Energy & Fuels 2022, 36, 7219–7244. [Google Scholar] [CrossRef]
- Tong, H.; Fu, M.; Yang, Y.; Chen, F.; Tao, Z. A Novel Self-Assembled Cobalt-Free Perovskite Composite Cathode with Triple-Conduction for Intermediate Proton-Conducting Solid Oxide Fuel Cells. Advanced Functional Materials 2022, 32, 2209695. [Google Scholar] [CrossRef]
- Dudek, M.; Lis, B.; Lach, R.; Daugela, S.; Salkus, T.; Kezionis, A.; Mosialek, M.; Socha, R.P.; Morgiel, J.; Gajek, M.; Sitarz, M.; Ziabka, M. Ba0.95Ca0.05Ce0.9Y0.1O3 as an electrolyte for proton-conducting ceramic fuel cells. Electrochimica Acta 2019, 304, 70–79. [Google Scholar] [CrossRef]
- Xie, K.; Yan, R.Q.; Liu, X.Q. Stable BaCe0.7Ti0.1Y0.2O3-δ proton conductor for solid oxide fuel cells. Journal of Alloys and Compounds 2009, 479, L40–L42. [Google Scholar] [CrossRef]
- Hossain, M.K.; Iwasa, T.; Hashizume, K. Hydrogen isotope dissolution and release behavior in Y-doped BaCeO3. Journal of the American Ceramic Society 2021, 104, 6508–6520. [Google Scholar] [CrossRef]
- Han, D.; Uda, T. The best composition of an Y-doped BaZrO3 electrolyte: selection criteria from transport properties, microstructure, and phase behavior. Journal of Materials Chemistry A 2018, 6, 18571–18582. [Google Scholar] [CrossRef]
- Fluri, A.; Marcolongo, A.; Roddatis, V.; Wokaun, A.; Pergolesi, D.; Marzari, N.; Lippert, T. Enhanced proton conductivity in Y-doped BaZrO3 via strain engineering. Advanced Science 2017, 4, 1700467. [Google Scholar] [CrossRef]
- Hu, H.J.; Zou, J.; Shan, L.; Jiang, X.Q.; Ni, Y.J.; Li, X.B.; Qian, X.W.; Chen, W.W.; Zhou, Y.C.; Zhang, W.F.; Wei, S.H.; Jian, J.W. Conductivities in Yttrium-Doped Barium Zirconate: A First-Principles Study. Crystals 2023, 13. [Google Scholar] [CrossRef]
- Bondevik, T.; Bjørheim, T.S.; Norby, T. Assessing common approximations in space charge modelling to estimate the proton resistance across grain boundaries in Y-doped BaZrO3. Physical Chemistry Chemical Physics 2020, 22, 11891–11902. [Google Scholar] [CrossRef]
- Sun, W.; Zhu, Z.; Shi, Z.; Liu, W. Chemically stable and easily sintered high-temperature proton conductor BaZr0.8In0.2O3−δ for solid oxide fuel cells. Journal of power sources 2013, 229, 95–101. [Google Scholar] [CrossRef]
- Sun, W.; Shi, Z.; Liu, M.; Bi, L.; Liu, W. An easily sintered, chemically stable, barium zirconate-based proton conductor for high-performance proton-conducting solid oxide fuel cells. Advanced Functional Materials 2014, 24, 5695–5702. [Google Scholar] [CrossRef]
- Ji, S.; Tanveer, W.H. Thickness determination of porous Pt cathode thin film capped by atomic layer-deposited alumina for low-temperature solid oxide fuel cells. Applied Surface Science 2020, 514. [Google Scholar] [CrossRef]
- Gandavarapu, S.R.; Sabolsky, K.; Gerdes, K.; Sabolsky, E.M. Direct foamed and nano-catalyst impregnated solid-oxide fuel cell (SOFC) cathodes. Materials Letters 2013, 95, 131–134. [Google Scholar] [CrossRef]
- Xu, Y.S.; Kou, H.N.; Fang, S.H.; Wang, X.F.; Bi, L. Evaluation of potential reaction between BaZr0.8Y0.2O3-δ ceramics and Pt at high temperatures. Ceramics International 2019, 45, 22383–22387. [Google Scholar] [CrossRef]
- Lussier, J.A.; Shafi, S.P.; Donaberger, R.L.; Bieringer, M. Platinum Uptake and Ba2CePtO6 Formation During in Situ BaCe1-xMxO3-δ (M=La, In) Formation. Inorganic Chemistry 2014, 53, 8809–8815. [Google Scholar] [CrossRef]
- Xu, Y.; Kou, H.; Fang, S.; Wang, X.; Bi, L. Evaluation of potential reaction between BaZr0.8Y0.2O3-δ ceramics and Pt at high temperatures. Ceramics International 2019, 45, 22383–22387. [Google Scholar] [CrossRef]
- Fu, M.; Lin, X.; Li, X.Y.; Tao, Z.T. Applications of microwave technology in the field of solid oxide fuel cell - a review. Russian Chemical Reviews 2023, 92. [Google Scholar] [CrossRef]
- Xu, Y.; Kou, H.; Fang, S.; Wang, X.; Bi, L. Evaluation of potential reaction between BaZr0.8Y0.2O3-δ ceramics and Pt at high temperatures. Ceramics International 2019, 45, 22383–22387. [Google Scholar] [CrossRef]
- Shi, N.; Xie, Y.; Huan, D.; Yang, Y.; Xue, S.; Qi, Z.; Pan, Y.; Peng, R.; Xia, C.; Lu, Y. Controllable CO2 conversion in high performance proton conducting solid oxide electrolysis cells and the possible mechanisms. Journal of Materials Chemistry A 2019, 7, 4855–4864. [Google Scholar] [CrossRef]
- Mohamed, R.M.; Ismail, A.A.; Kadi, M.W.; Alresheedi, A.S.; Mkhalid, I.A.J.A. o. Fabrication of mesoporous PtO–ZnO nanocomposites with promoted photocatalytic performance for degradation of tetracycline. 2021, 6, 6438–6447. [CrossRef]
- Zheng, L.; Xie, J.; Liu, X.; Yang, C.; Zheng, W.; Zhang, J.J.A.A.M. Interfaces, Unveiling the electronic interaction in ZnO/PtO/Pt nanoarrays for catalytic detection of triethylamine with ultrahigh sensitivity. 2020, 12, 46267–46276. [CrossRef]
- Wang, X.; Ma, Z.; Zhang, T.; Kang, J.; Ou, X.; Feng, P.; Wang, S.; Zhou, F.; Ling, Y. Charge-transfer modeling and polarization DRT analysis of proton ceramics fuel cells based on mixed conductive electrolyte with the modified anode–electrolyte interface. ACS applied materials & interfaces 2018, 10, 35047–35059. [Google Scholar] [CrossRef]
Figure 1.
XRD patterns of as-prepared BZYN and Pt-BZYN mixture after co-fired at temperature of 1000℃ for 3h.
Figure 1.
XRD patterns of as-prepared BZYN and Pt-BZYN mixture after co-fired at temperature of 1000℃ for 3h.
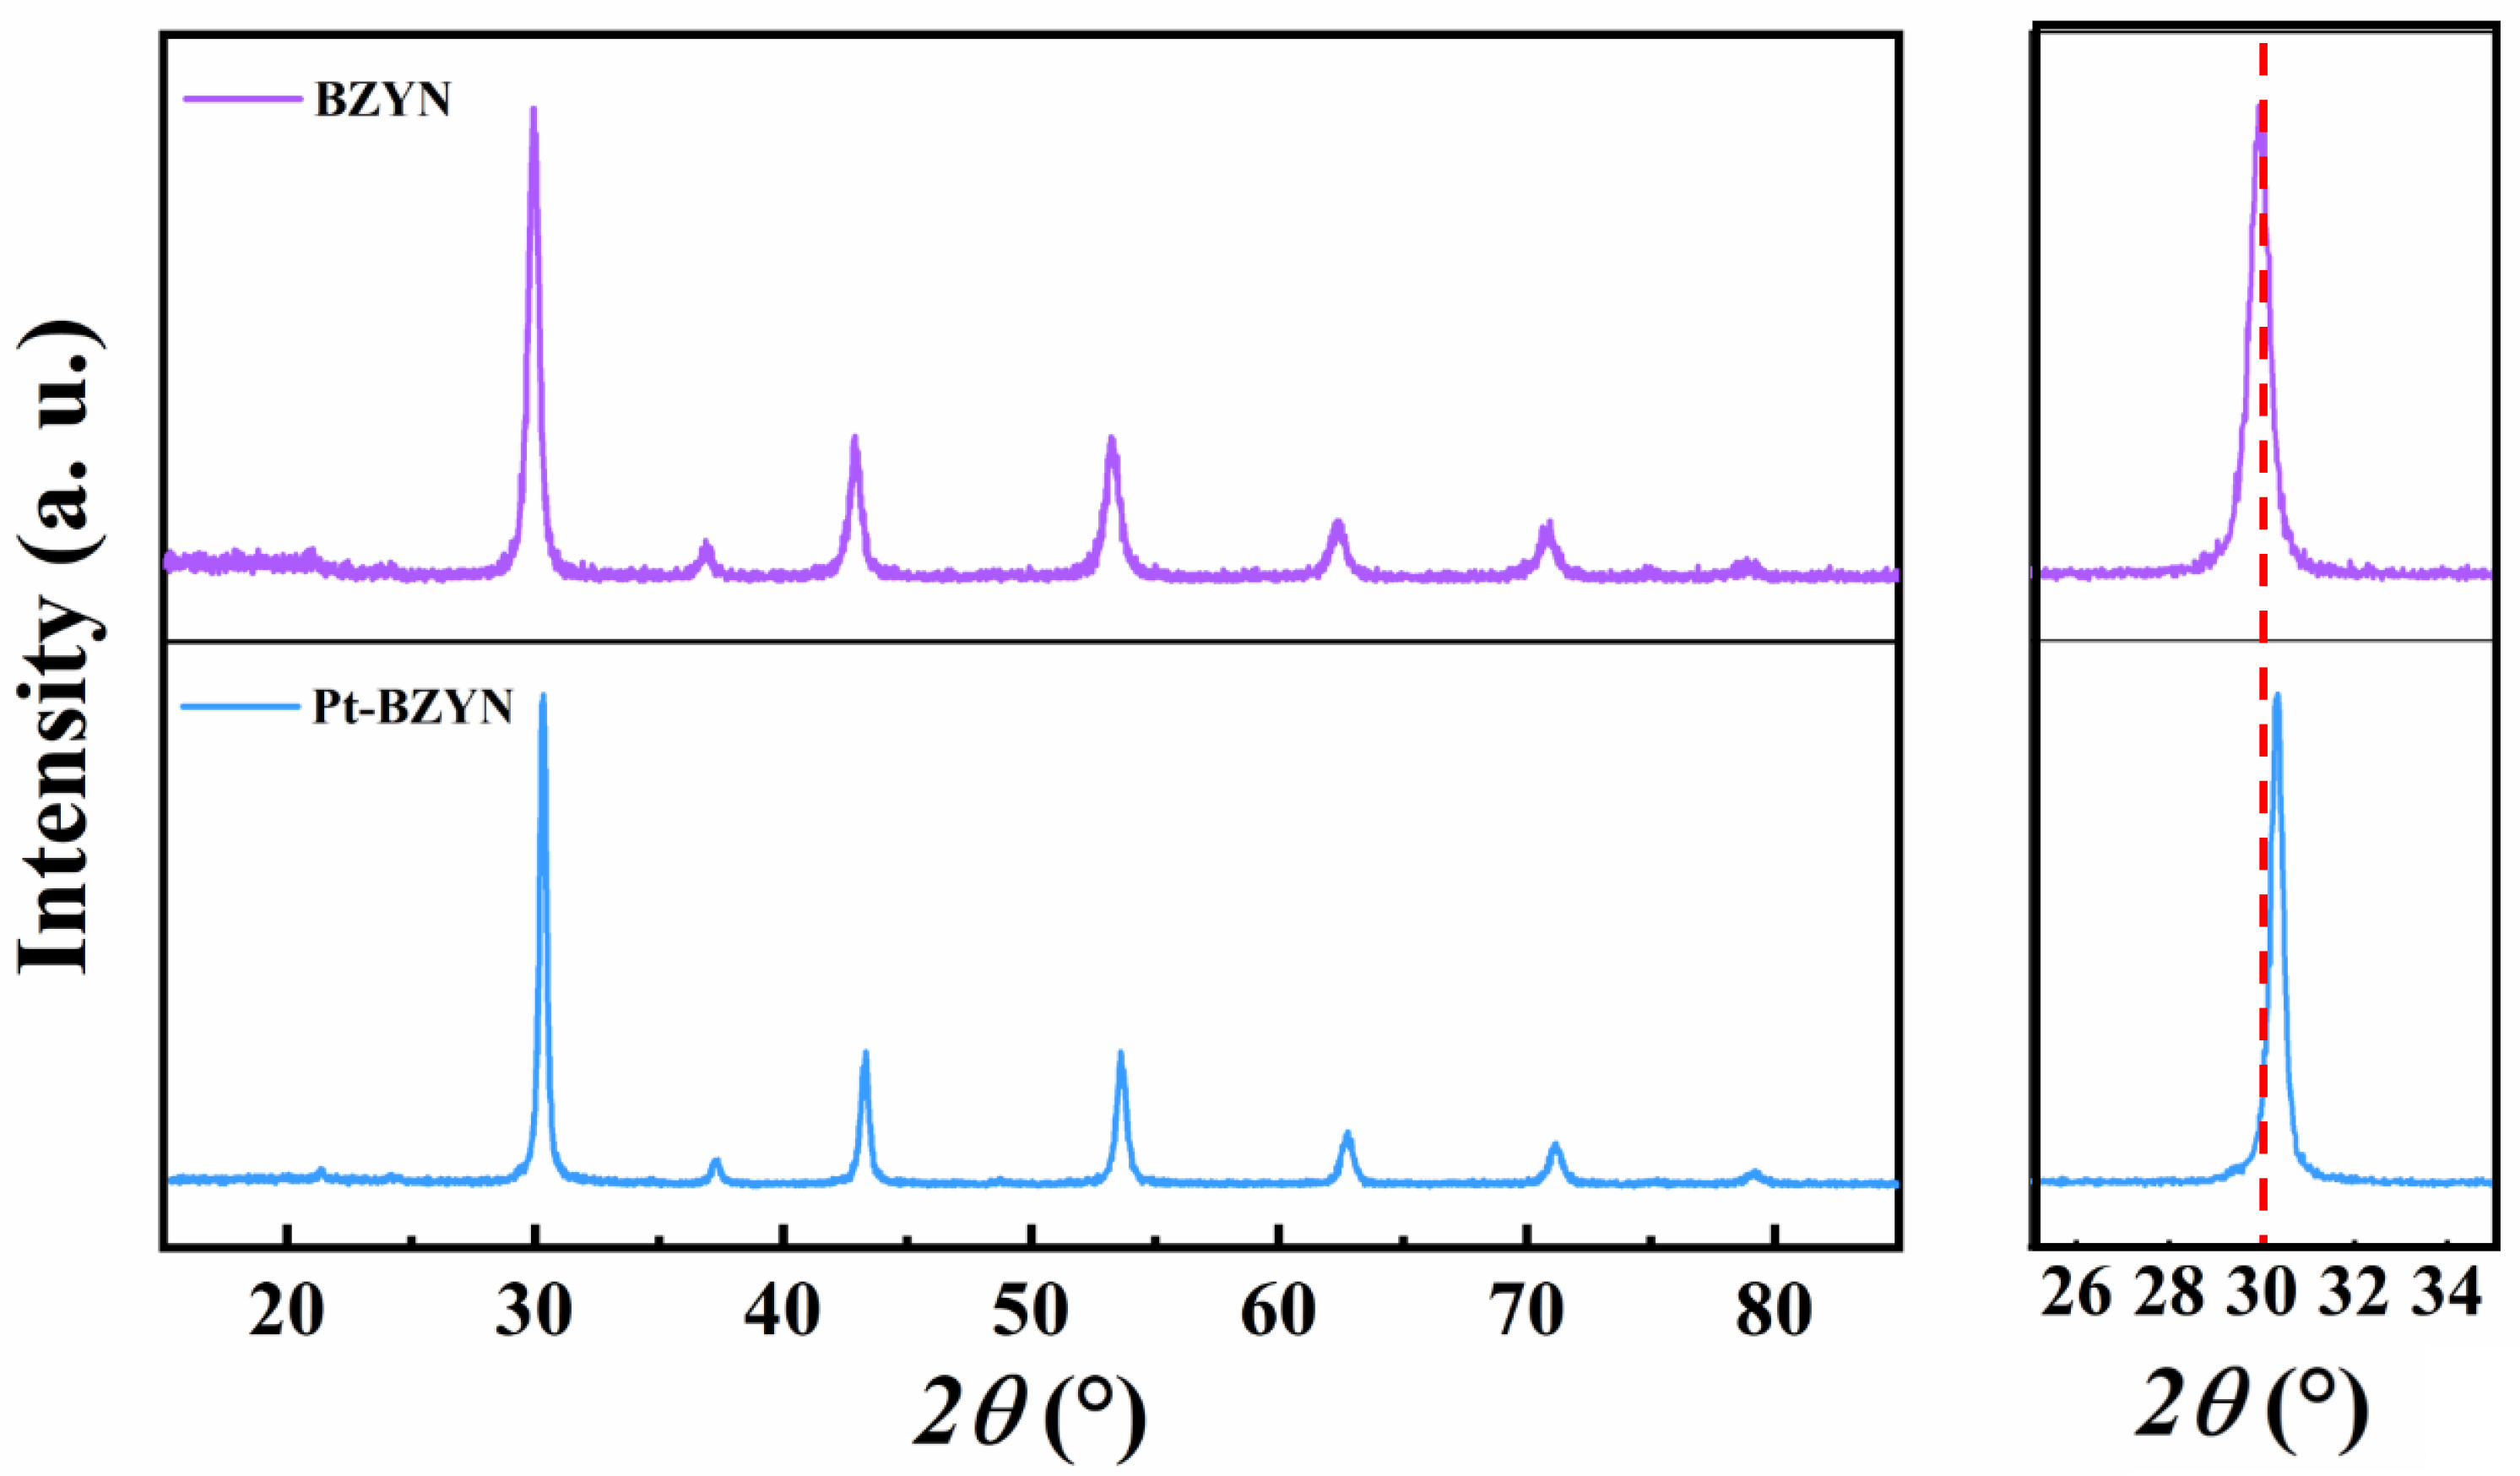
Figure 2.
SEM-EDS elemental mapping of Pt, Zr, Ba, Y, Ni and O.
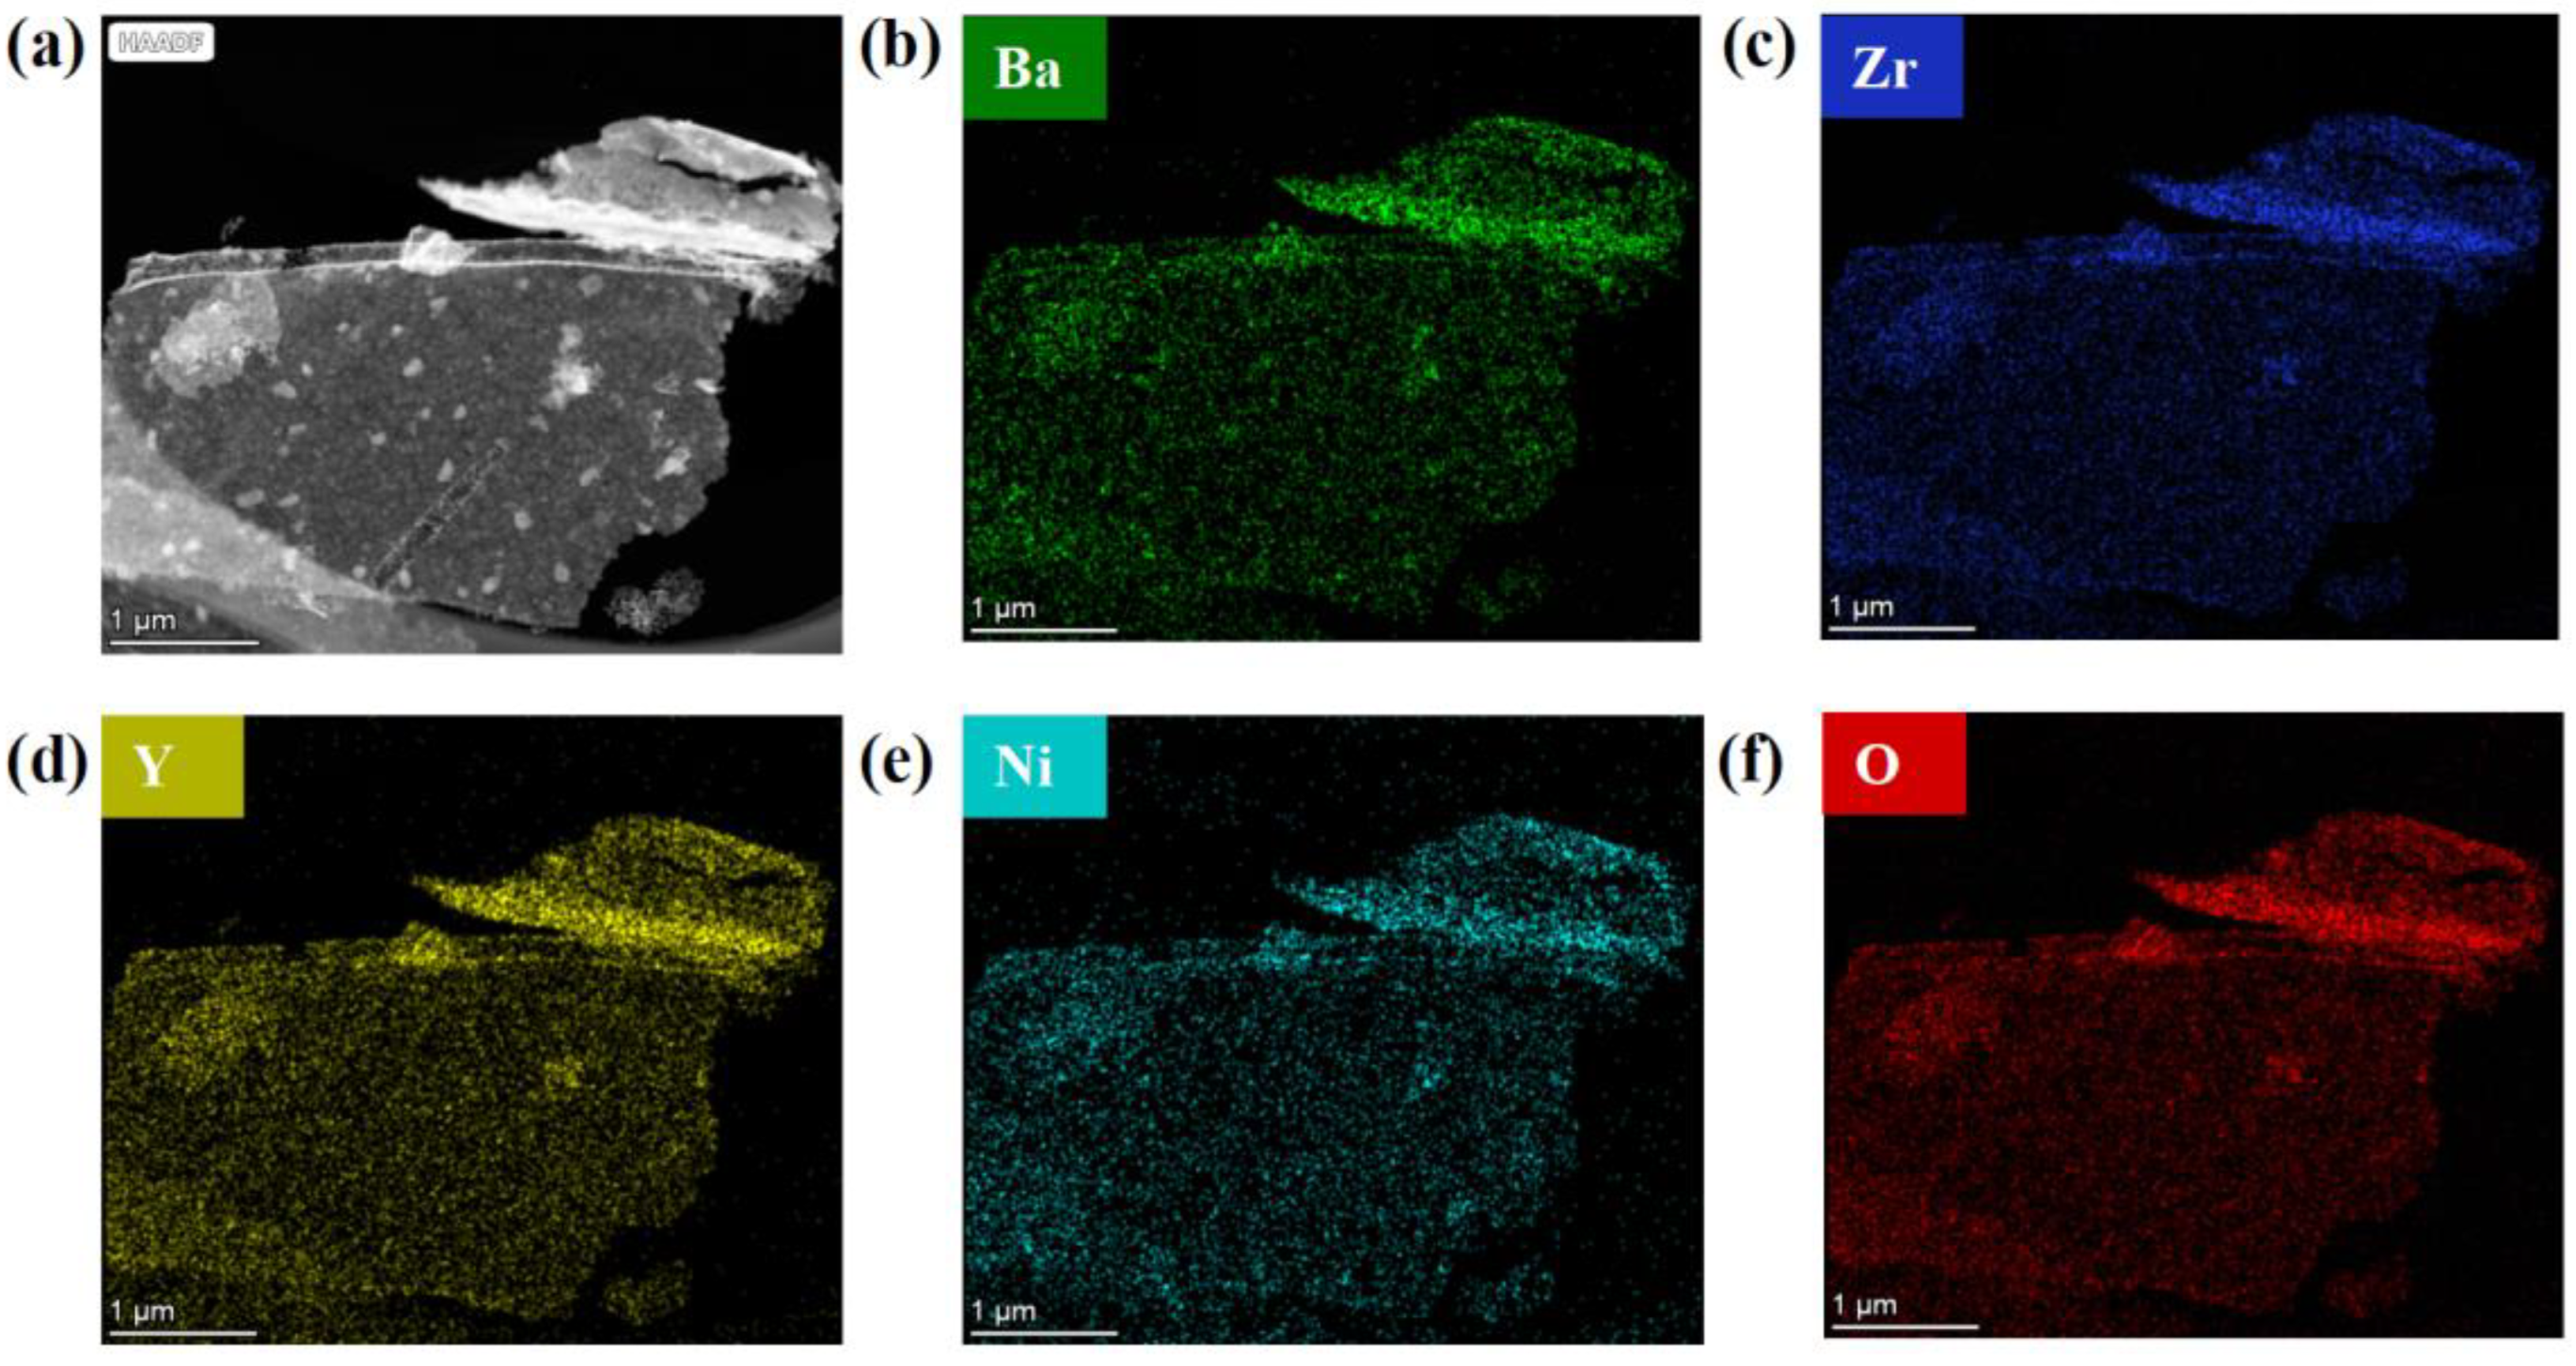
Figure 3.
TEM image displayed d-spacing of BaZrO3-based material and Pt.
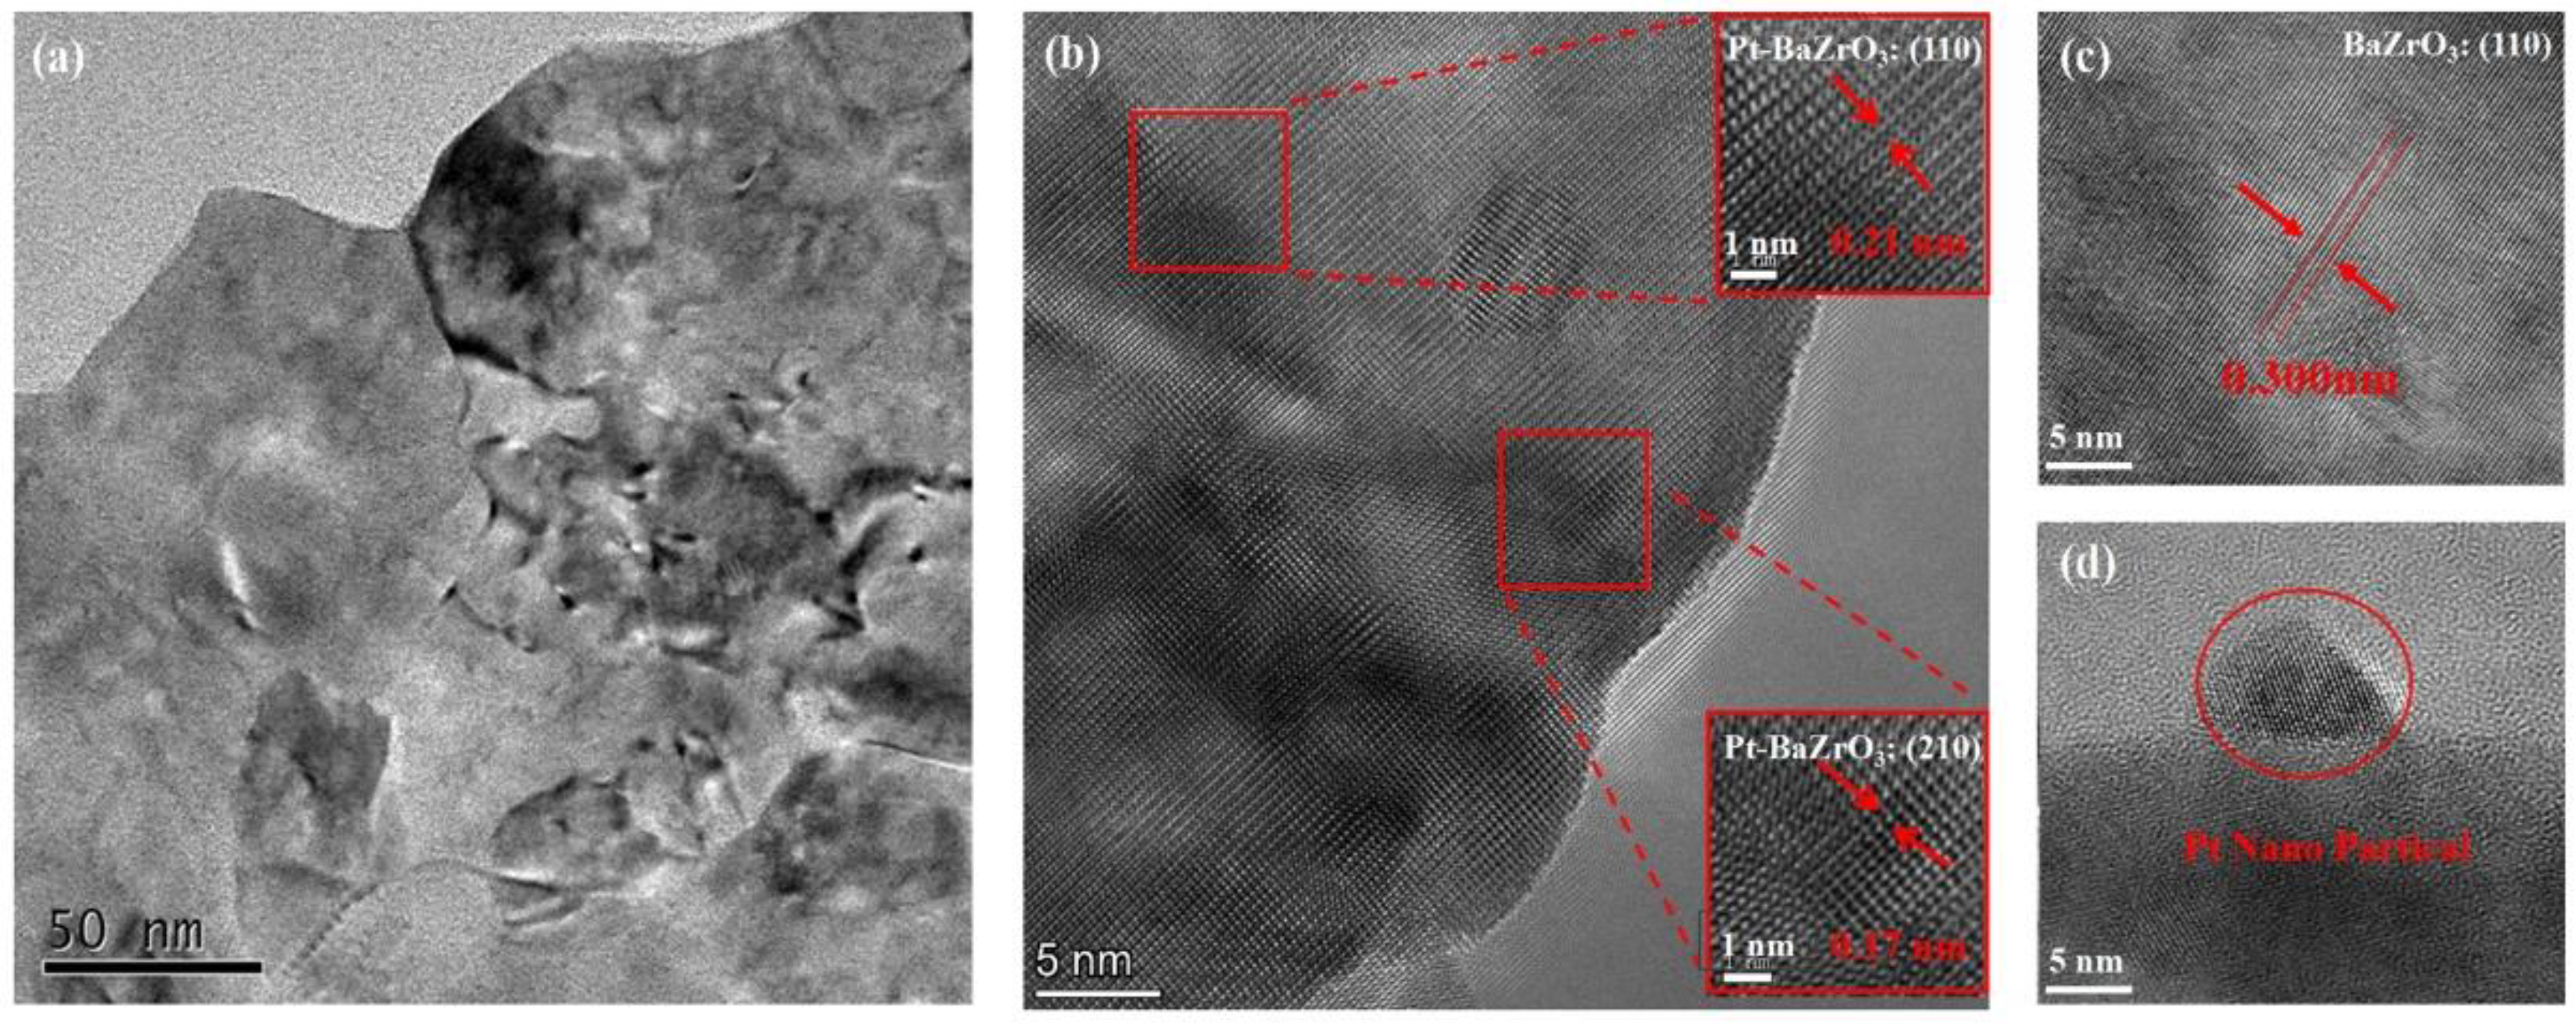
Figure 4.
TEM-EDX scanning result of Pt-BZYN.
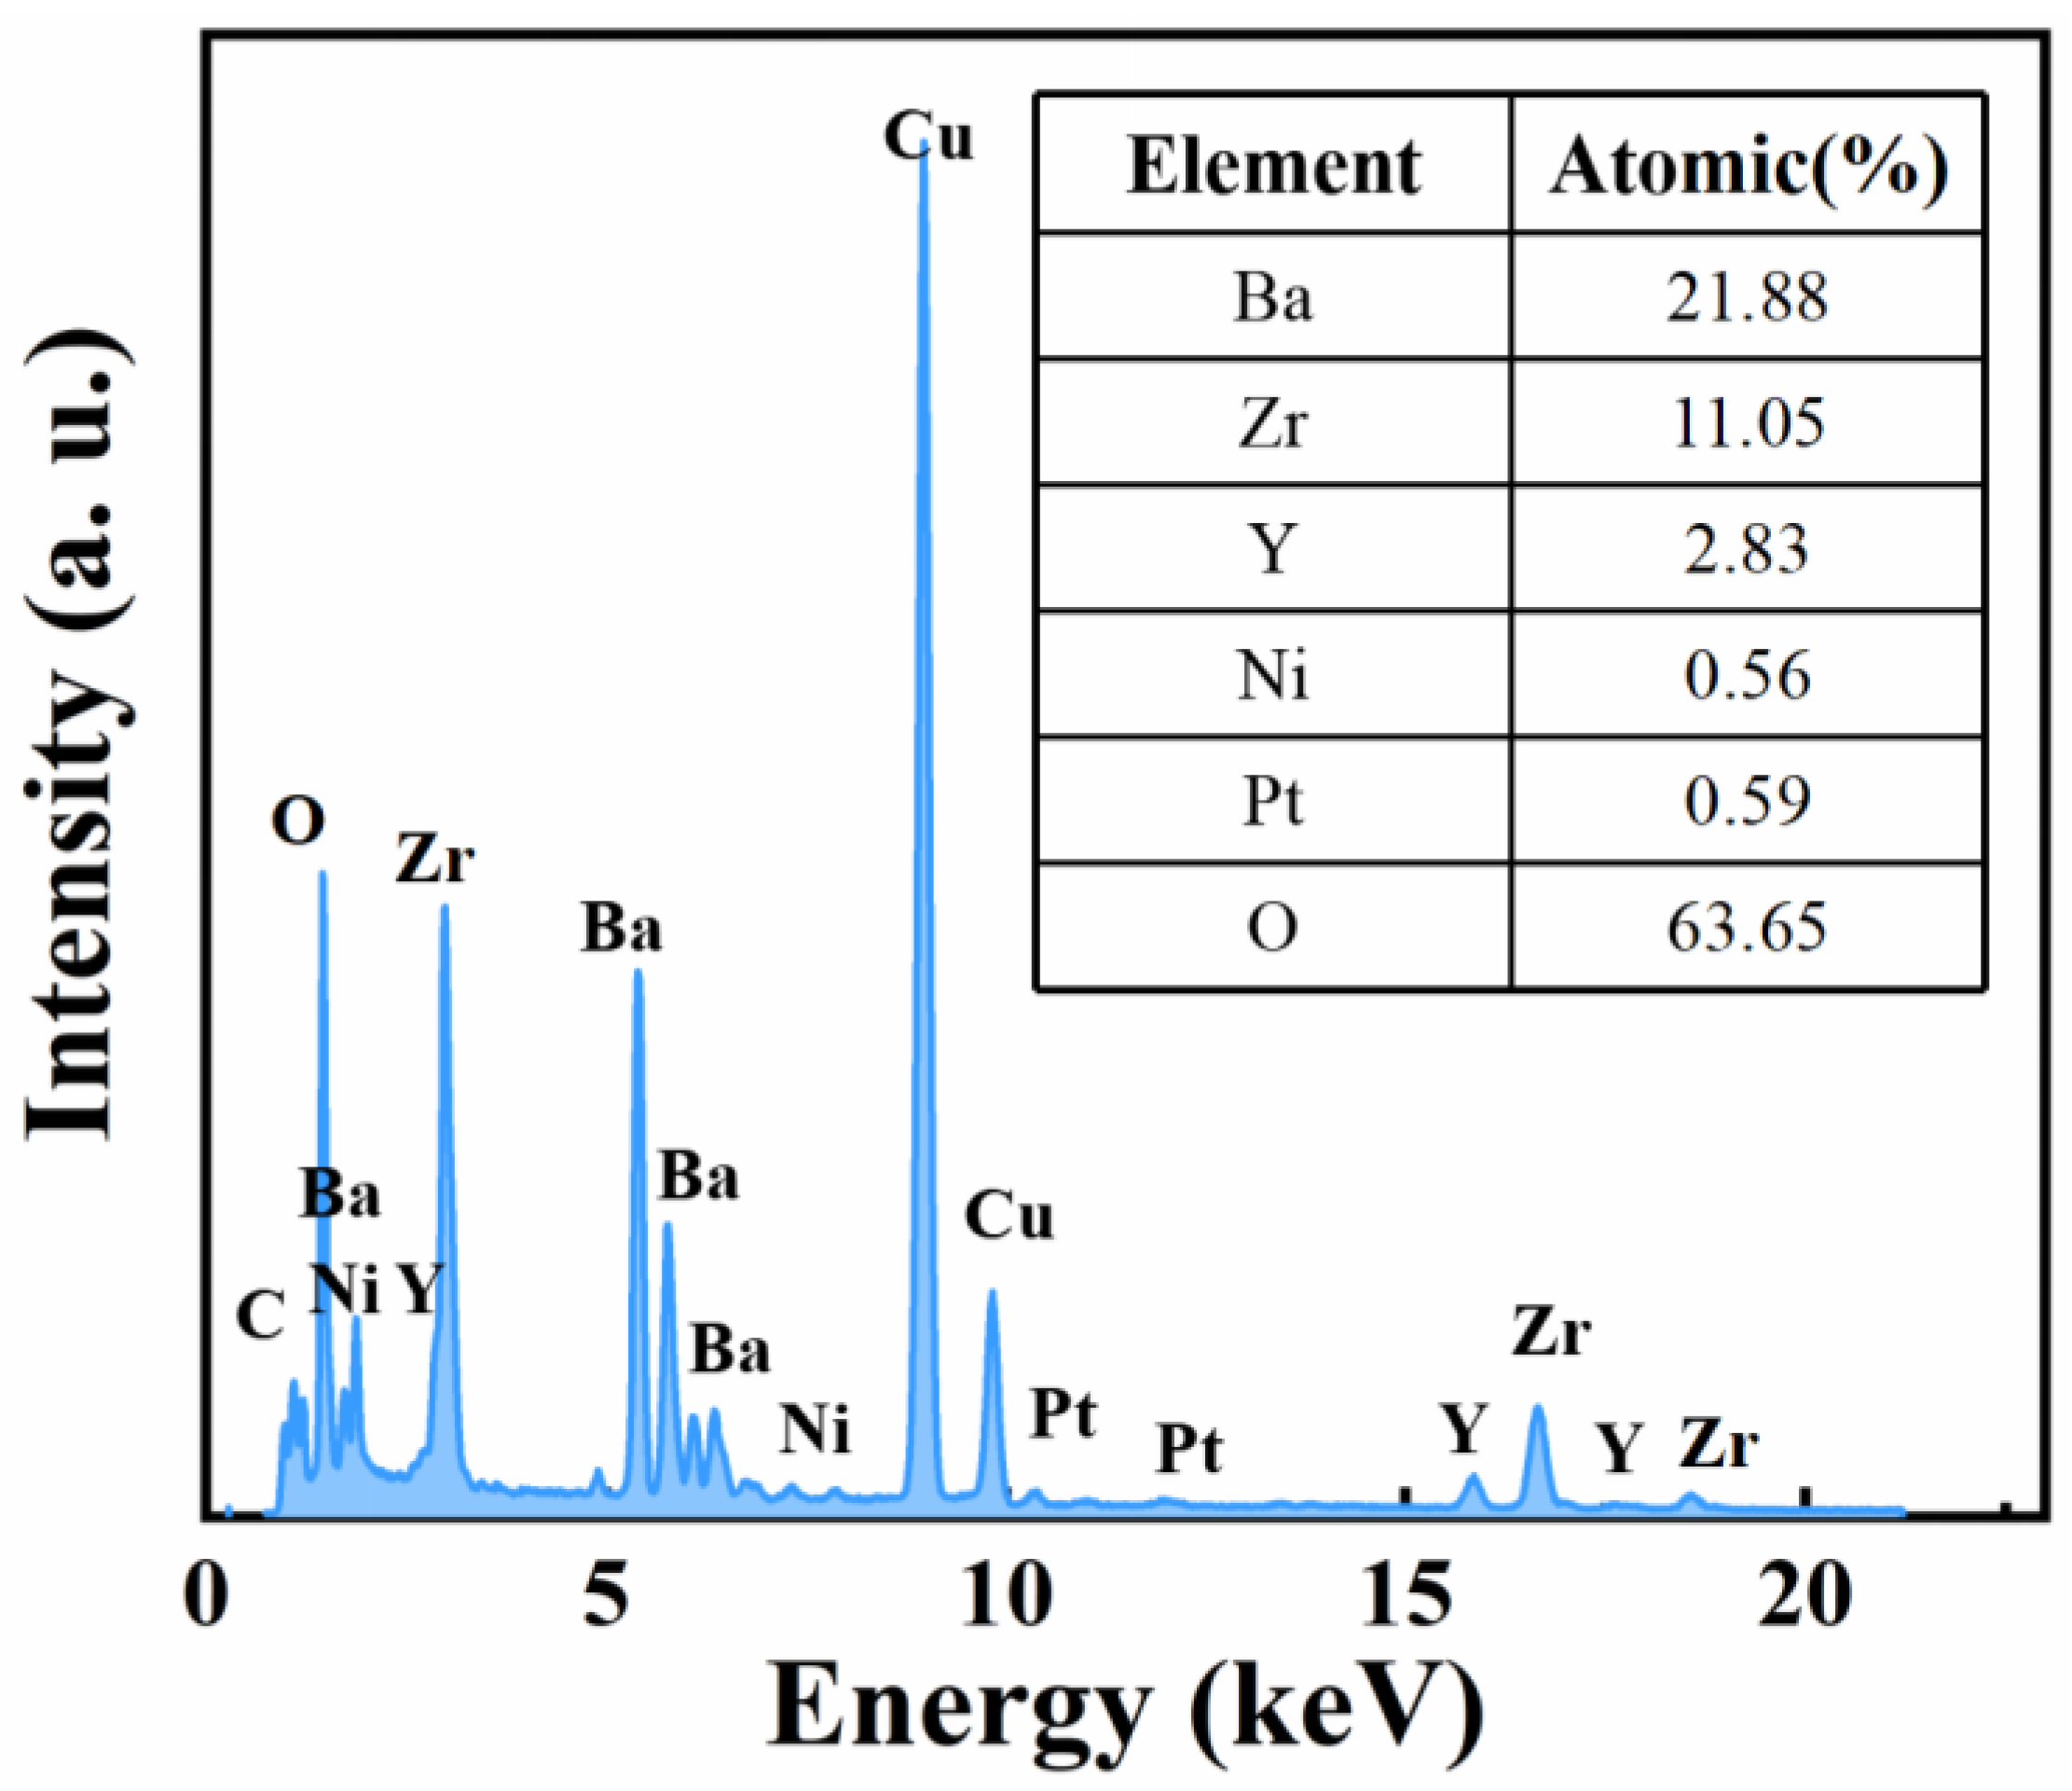
Figure 5.
Total conductivity curves of fuel cells with different electrolyte membranes of Pt-BZYN, BZYN measured at different temperatures from 350 °C to 700 °C.
Figure 5.
Total conductivity curves of fuel cells with different electrolyte membranes of Pt-BZYN, BZYN measured at different temperatures from 350 °C to 700 °C.
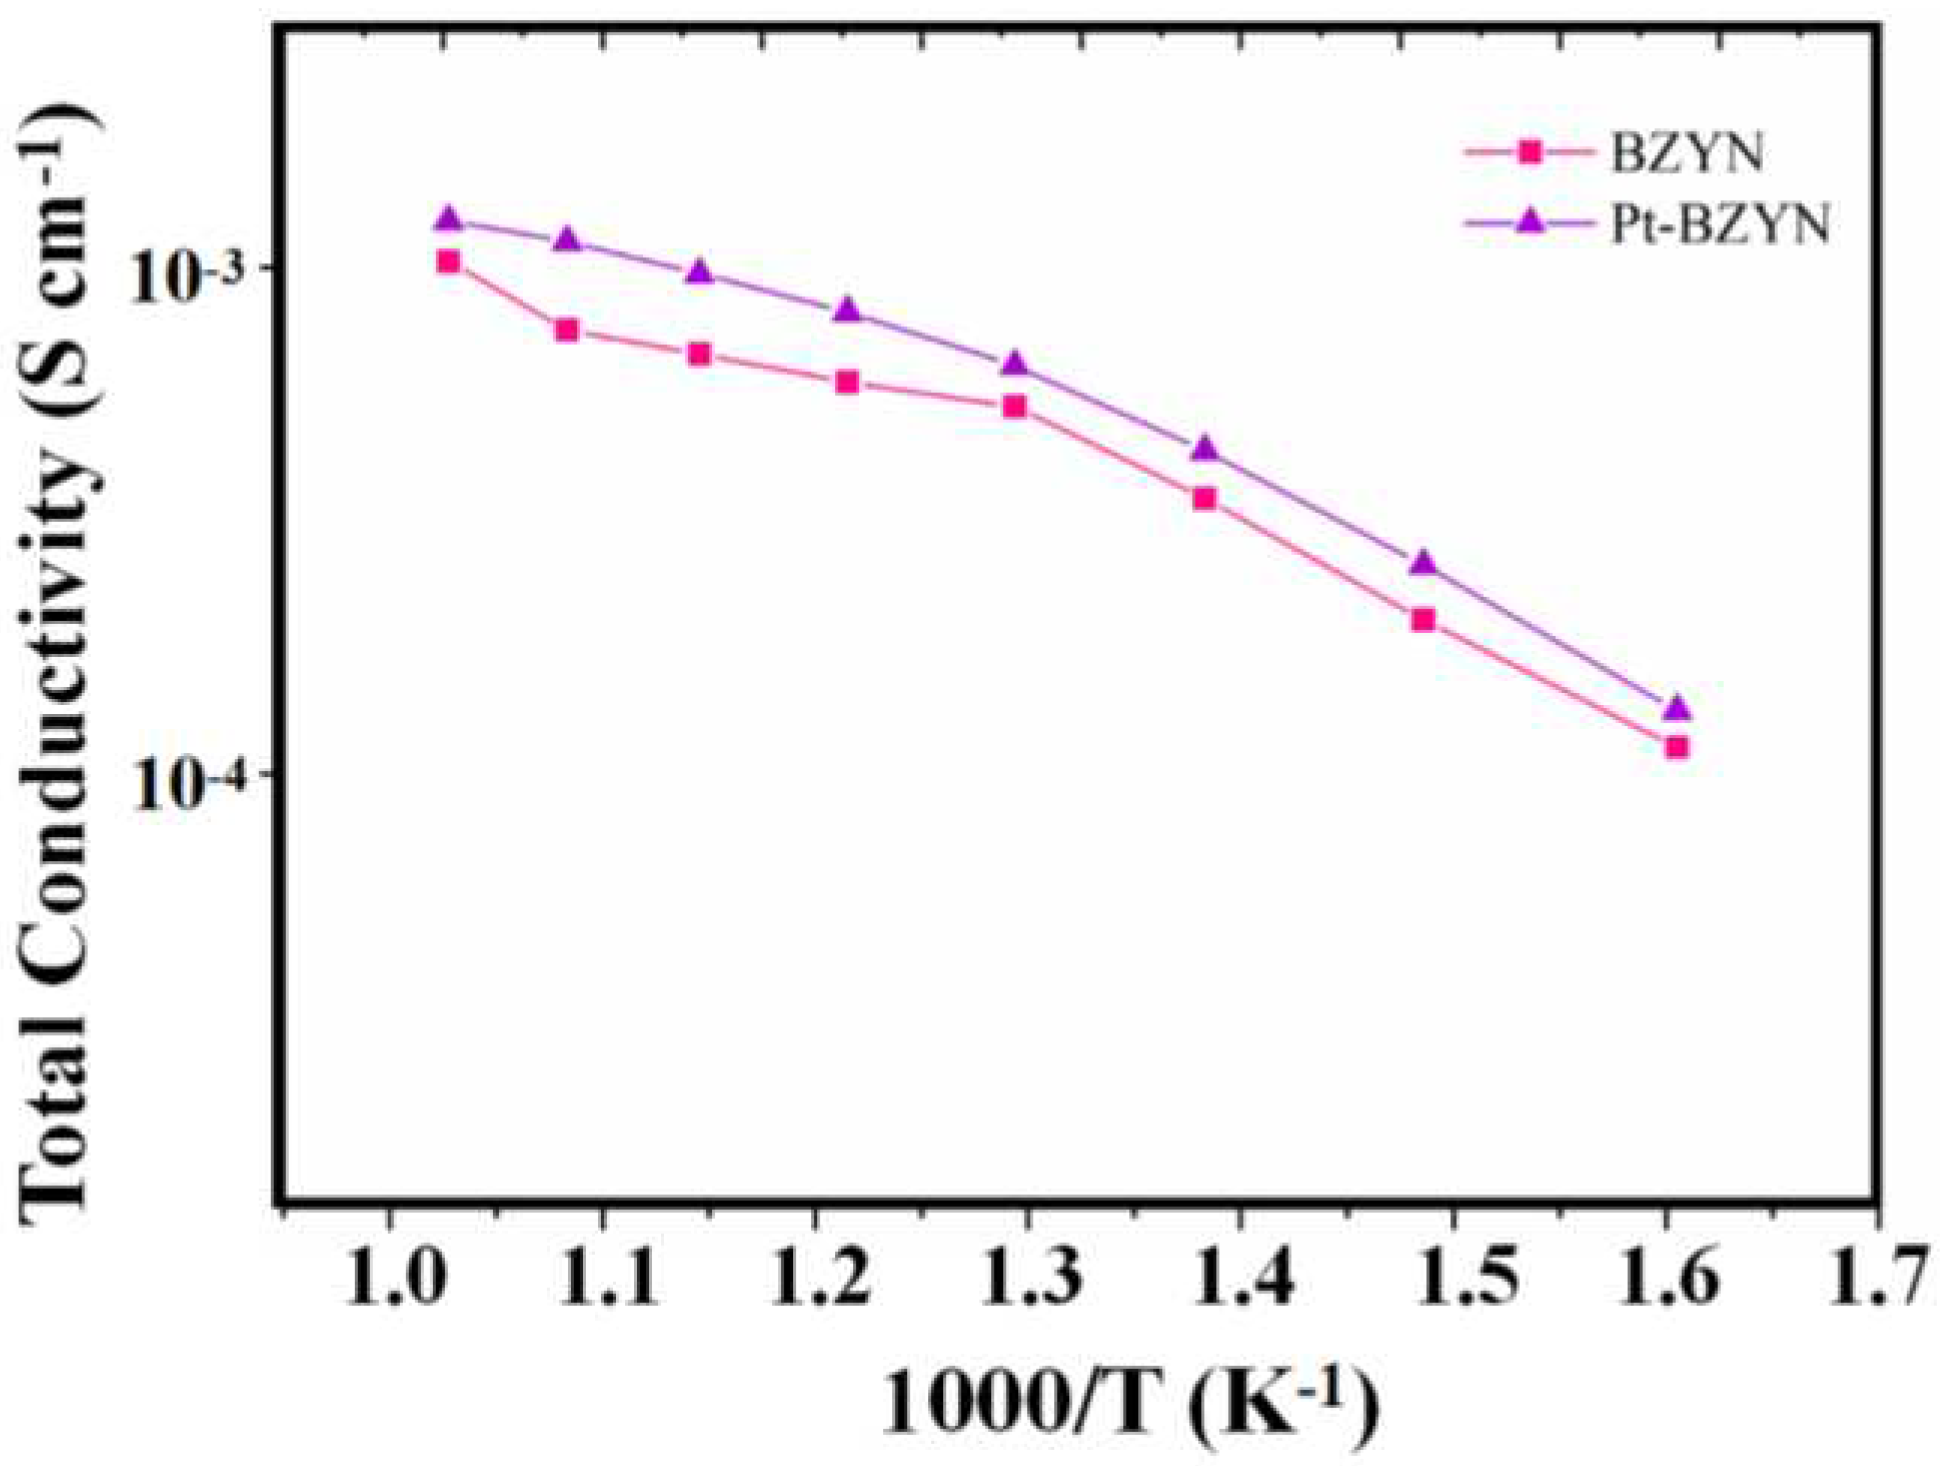
Figure 6.
SEM micrographs of the fuel cell cross-sections and electrolyte membrane for (a) BZYN, (b) Pt-BZYN.
Figure 6.
SEM micrographs of the fuel cell cross-sections and electrolyte membrane for (a) BZYN, (b) Pt-BZYN.
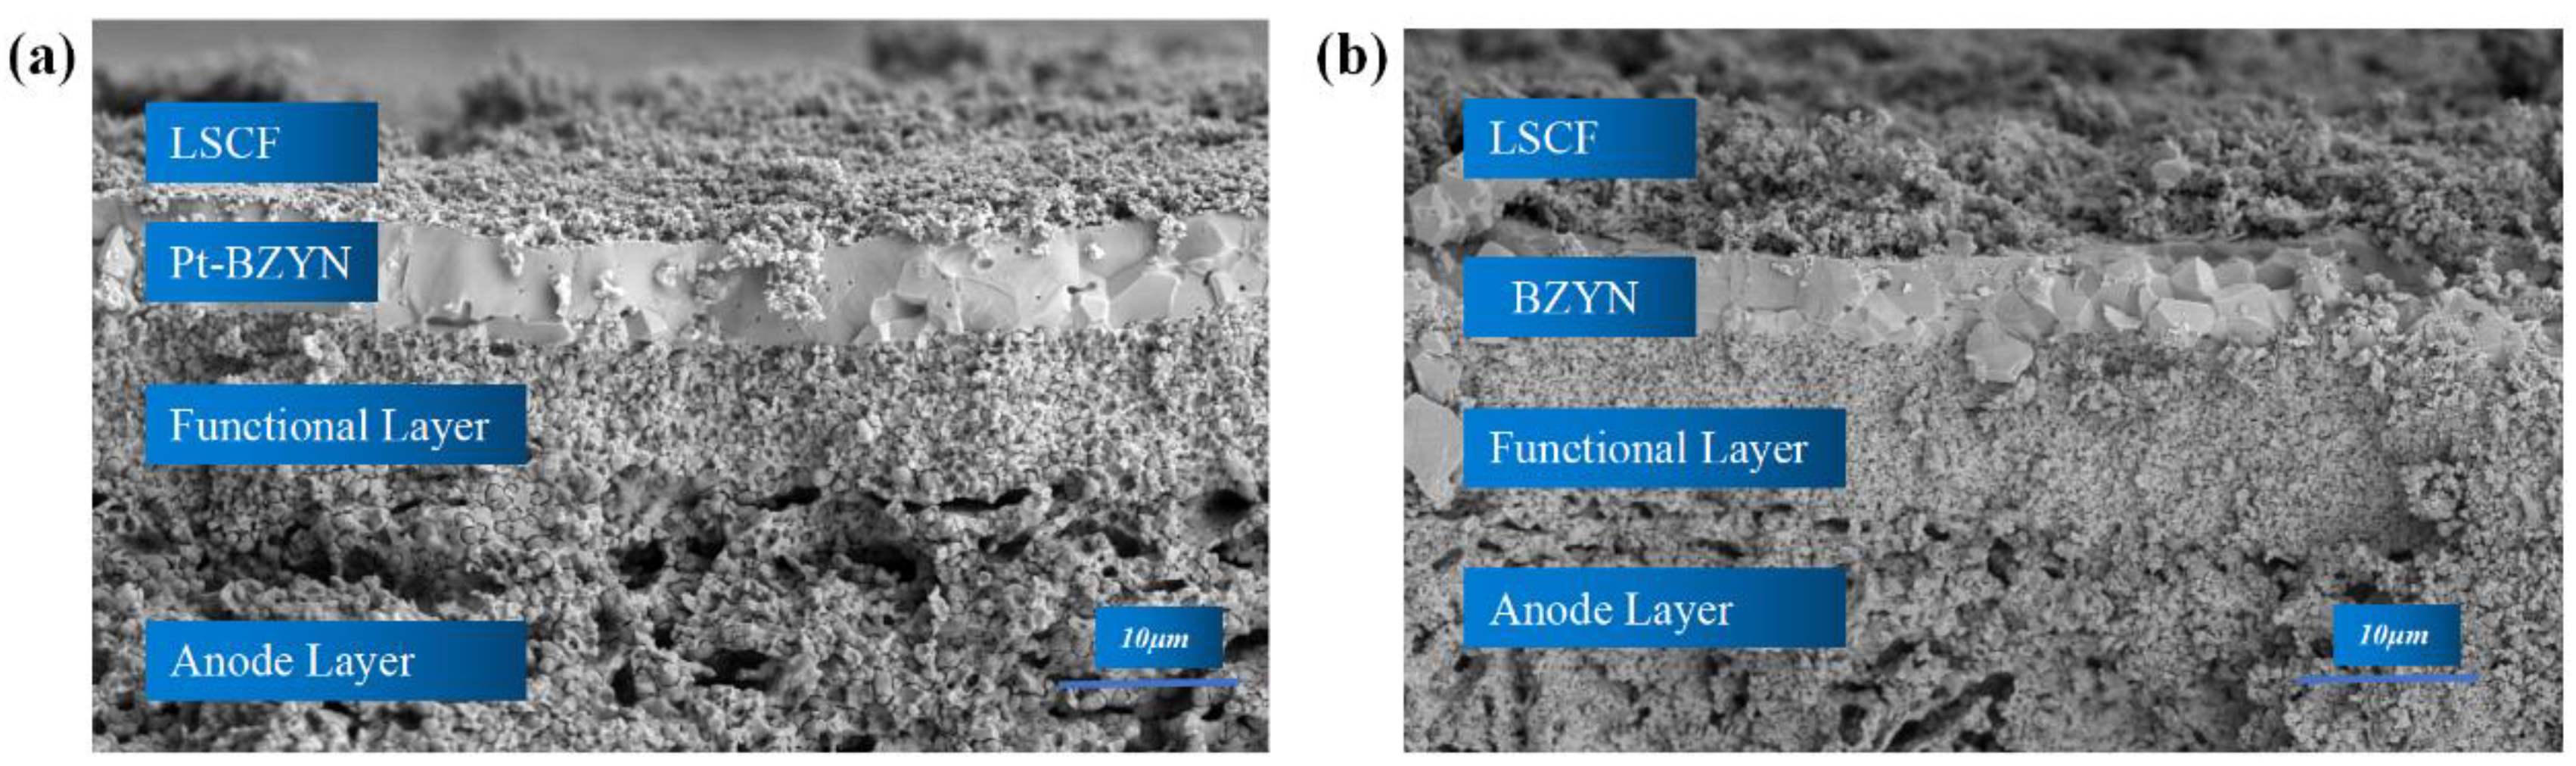
Figure 7.
(a) I–V and power density curves for the cell with Pt-BZYN, BZYN electrolyte membrane measured at 700 °C; (b) A comparison of impedance plots of fuel cells with BZYN and Pt-BZYN electrolyte membrane measured at 700 °C and impedance plots of fuel cells with Pt-BZYN electrolyte membrane measured at 600, 650, and 700 °C.; (c) I–V and power density curves for the cell with Pt-BZYN electrolyte membrane measured at 600, 650, and 700 °C ; (d) The impedance spectra corresponding distributions of relaxation times plots for the fuel cells with different electrolyte membrane.
Disclaimer/Publisher’s Note: The statements, opinions and data contained in all publications are solely those of the individual author(s) and contributor(s) and not of MDPI and/or the editor(s). MDPI and/or the editor(s) disclaim responsibility for any injury to people or property resulting from any ideas, methods, instructions or products referred to in the content. |
© 2023 by the authors. Licensee MDPI, Basel, Switzerland. This article is an open access article distributed under the terms and conditions of the Creative Commons Attribution (CC BY) license (http://creativecommons.org/licenses/by/4.0/).
Copyright: This open access article is published under a Creative Commons CC BY 4.0 license, which permit the free download, distribution, and reuse, provided that the author and preprint are cited in any reuse.
Submitted:
20 November 2023
Posted:
21 November 2023
You are already at the latest version
Alerts
A peer-reviewed article of this preprint also exists.
This version is not peer-reviewed
Submitted:
20 November 2023
Posted:
21 November 2023
You are already at the latest version
Alerts
Abstract
Pt modified BaZr0.76Y0.2Ni0.04O3 (BZYN) is fabricated and characterized as a stable electrolyte for proton-conducting solid oxide fuel cell (H-SOFC). The utilization of X-ray diffraction method (XRD) and transmission electron microscopy (TEM) enables the identification of the presence of platinum (Pt) in both the crystal lattice sites and the grain interface. This occurrence contributes to a reduction in grain boundary resistance. Consequently, this phenomenon improves the conductivity of the electrolyte. The electrochemical performance of the single cell with Pt modified BZY electrolyte is improved by the reduction of ohmic resistance and enhancement of ion migration. This signifies a noteworthy advancement in the creation of more efficient and durable proton-conducting SOFCs.
Keywords:
Subject: Chemistry and Materials Science - Physical Chemistry
1. Introduction
The past few decades have witnessed a persistent rise in interest in proton solid oxide fuel cells (H-SOFCs) due to the pressing demand for clean energy and environmental conservation. The primary reason for their suitability for future commercial applications is their excellent cell performance and better conversion efficiency at intermediate temperatures[1]. Barium cerate and barium zirconate materials exhibit a notable degree of proton mobility, rendering them highly suitable as electrolytes for H-SOFCs. This is mostly attributed to their exceptional proton conductivity[2,3,4]. The currently predominant proton-conducting oxides in use are materials based on BaCeO3. These materials have notable ionic conductivity, but are prone to chemical instability when exposed to atmospheres containing CO2 and H2O. [5,6]. Yttrium-doped BaCeO3 has superior proton conductivity compared to other oxides within its class. However, its commercial viability is hindered by insufficient chemical stability when subjected to operational conditions within a cell[4,7].
In recent years, researchers have made significant progress in developing viable techniques to address the challenges associated with BaZrO3 based materials, thereby enhancing their suitability for use in proton conducting SOFCs. Considering the chemical stability, fabrication feasibility and proton conductivity, Y doped BaZrO3 (BZY) shows promising application potential[8,9,10]. Although the bulk proton conductivity of BZY is competitive with other proton conductors, the high grain boundary resistance caused by its poor sintering ability hinders widely application as an electrolyte for H-SOFCs[11]. In recent years, numerous endeavors have been undertaken to enhance the sintering density of BZY, hence reducing the resistance at grain boundaries[12,13]. Sintering aids, such as zinc oxide (ZnO) and nickel oxide (NiO), are employed to lower sintering temperatures. Extensive study has been conducted to investigate the underlying mechanisms by which these aids exert control over stoichiometry. It is found that NiO can react with BZY and BaZr0.76Y0.2Ni0.04O3 (BZYN) exhibits adequate total conductivity. Hence, it is imperative to investigate a viable approach for the production of high-performance BZY cells without the intentional inclusion of sintering aids, since this offers significant benefits for practical application.
Platinum (Pt) is frequently employed as the electrode material for conducting conductivity tests, as well as serving as an electrode in fuel cell testing[14,15]. The experimental procedure for evaluating the electrochemical properties of BZY material involves several stages. Firstly, a dense BZY pellet is prepared through the process of sintering. Subsequently, a layer of Pt film is applied onto the surface of the dense BZY pellet. Finally, the coated pellet is subjected to high-temperature firing to serve as the electrodes for testing the electrochemical properties. The potential interaction between Pt and BZY is often overlooked since Pt is considered an inert substance. Bi has recently provided a definitive result regarding the diffusion of Pt into the lattice of BZY[16]. Another study indicates that at elevated temperatures, Pt has the potential to undergo a reaction with BaCeO3, resulting in the formation of different proton conductor phases [17]. It follows that Pt is not totally inert with proton-conducting oxides, and that a reaction will take place between Pt and BZY. In addition, the reaction of Pt and BZY powders is also studied and O1s binding energy decreases which might be crucial to proton migration[18]. On account of the demands of proton-conducting electrolytes, it is imperative to elucidate the impact of Pt on conductivity and boundary resistance.
In the present work, we chose BZYN as electrolyte which was treated with Pt foil at the high sintering temperature. The influence of Pt on the phase structure, grain boundary growth, and electrical conductivity of the materials were investigated. In addition, an anode-supported fuel cell with Pt modified BZYN electrolyte was assembled and its performance was evaluated to determine the benefits of employing this approach for H-SOFCs.
2. Experimental
2.1. Materials Synthesis
BZYN powders were produced via a wet chemical combustion method supported by citric acid[19]. The appropriate weights of several raw precursors were identified based on the stoichiometric ratio derived from the BZYN formula. Initially, appropriate precursors of BaCO3 (99.95%, Macklin), Zr(NO3)4·5H2O (99.99%, Macklin), Y(NO3)3·6H2O (99.99%, Macklin), and Ni(NO3)2·6H2O (Xilong Scientific) were dissolved into dilute nitric acid solution while Citric acid monohydrate (99.99%, Macklin) with a weight ratio of 1.5:1 to metallic ions was added as complexing agents. Afterwards, the pH of the solution was modulated to around 7 using ammonia, resulting in a transparent solution. Following that, the solution endured continuous mixing at a temperature of 80 ℃ until combustion, which was subsequently subjected to firing at a temperature of 1000 ℃ for 3 h.
2.2. Characterization and Electrochemical Measurement
The BZYN powders were pressed under 300MPa to form BZYN pellets which were subsequently sintered at 1550 oC for 10h for the electrical conductivity test. The sintered pellets were treated on Pt foil at 1300 oC for 5 h to obtain Pt modified BZYN (Pt-BZYN). The total electrical conductivities of the sintered pellets were measured by analyzing impedance spectrum via a Zahner Zennium electrochemical workstation with amplitude of 5 mV.
The BZYN electrolyte was co-pressed on the anode substrate and functional layer mezzanine. The anode powder is composed of BZYN, NiO and starches in a ratio of 40: 60: 20, while the functional layer powder is formed of BZYN and NiO in a ratio of 45:55. The functional layer powder synthesized by BaCO3 (99.95%, Macklin), Zr(NO3)4·5H2O (99.99%, Macklin), Y(NO3)3·6H2O (99.99%, Macklin), and Ni(NO3)2·6H2O (Xilong Scientific) by the wet chemical combustion method with the assistance of citric acid. The half-cell was then sintered at 1350◦C for 5 h. Pt-BYZN electrolyte was obtained through placing previous BZYN powder on the surface of Pt foil and heating it at 1000 oC for 3 h. Powdered La0.6Sr0.4Co0.2Fe0.8 O3-δ (LSCF) was combined with 10 wt% of ethylcellulose-pineol adhesive to create the cathode slurry. The BZYN and Pt-BZYN electrolytes were then screen printed with the cathode slurry before being calcined at 1000 oC for 3 h. Subsequently, the cell performance was measured between 600 to 700 oC on an electrochemical workstation (Admiral-plus-1772). Wet hydrogen gas, containing about 3% water, was used as the fuel source at a flow rate of 25 ml min-1 while ambient air was adopted as oxidant. The Linear Sweep Voltammetry (LSV) mode was employed to obtain the I-V/I-P curves of the cell. Furthermore, the Electrochemical Impedance Spectra (EIS) were obtained by conducting measurements under open circuit conditions. The frequency range utilized for these measurements was set at 0.1-1 MHz, while the alternating current (AC) amplitude was maintained at 10 mV.
The crystal phase and structure parameters of the produced BZYN and BZYNP samples were determined using X-ray diffraction (XRD) analysis, employing CuKa radiation. The morphology and elemental distribution of the powders were observed and analyzed through scanning electron microscopes (SEM, Phenom XL) and Transmission electron microscopy (TEM, JE0L JEM-F200).
3. Results and Discussion
Figure 1 presents XRD patterns of synthesized BZYN and Pt-BZYN powders. The image illustrates that only peaks attributed to BZYN and Pt-BZYN are present, indicating that both BZYN and Pt-BZYN exhibit a singular phase that can be identified as a cubic perovskite structure (PDF No. 06-0399). In order to observe the influence of Pt, an enlarged diffraction pattern is provided. Based on the observed specific magnification ranging from 26-34° in Figure 1, it is evident that the peaks exhibit a minor shift towards higher angles. In accordance with the Bragg equation, it becomes evident that the introduction of Pt as a dopant leads to a reduction in the lattice constants. This phenomenon can be attributed to the variance in atomic radius between Pt4+ (0.62 Å) and Zr4+ (0.79 Å), resulting in a reduction of the lattice parameter when Zr4+ is replaced with Pt4+.
The microstructures of the sintered Pt-BZYN samples were meticulously examined using scanning electron microscopy (SEM) and are prominently displayed in Figure 2(a). Notably, the sample exhibits a state of complete density, devoid of any discernible pores. This compelling observation underscores that the introduction of Pt as a dopant has no adverse effects on the sintering activity. In addition, energy dispersive spectroscopy (EDS) is employed to investigate the elemental distribution within the material, and these results are thoughtfully illustrated in Figure 2(b-f). The elemental analysis reveals a remarkably even dispersion of Ba, Y, Ni, and Zr throughout the sample. Interestingly, minute quantities of Pt are also detectable. This distribution pattern of Pt strongly suggests its potential incorporation into the BZYN lattice, consistent with the previously discussed XRD findings.
Through a meticulous analysis of lattice parameters and structural characteristics, it has been unequivocally demonstrated that Pt not only partially inhabits the lattice sites but also conforms to findings in the existing literature on this subject [20]. In our study, to further study doping sites of Pt, the morphology of Pt-BZYN powders are characterized using transmission electron microscopy (TEM). Figure 3(d) illustrates the presence of dark nano-particles attached to the grain boundary, indicating that Pt has a tendency to aggregate at the interface in addition to occupying lattice sites. This aggregation of Pt on the grain boundary may have a positive impact on ion conductivity. It is because the resistance at the grain boundary significantly influences the conductivity of BZY. In addition, it is obvious from Figure 3(c) that a d-spacing value of 0.300 nm corresponds to (110) planes of BaZrO3-based material as reported by reference[21]. Conversely, a d-spacing value of 0.21 nm corresponds to the (110) planes of Pt-based materials, as depicted in Figure 3(b)[22,23]. This compelling evidence confirms the presence of Pt generated at the grain boundaries. Furthermore, Figure 4 presents the transmission electron microscopy-energy dispersive X-ray spectroscopy (TEM-EDX) scanning outcome of Pt-BZYN, providing insights into the quantification of platinum (Pt) content within the Pt-BZYN samples.
The conductivity of BZYN and Pt-BZYN was meticulously assessed under ambient air at various temperatures via electrochemical impedance spectroscopy, and the results are visually presented in Figure 5. It becomes readily apparent that Pt-BZYN consistently exhibits notably higher conductivities across the temperature range of 350°C to 700°C, in sharp contrast to BZYN. This conspicuous difference underscores the critical role of Pt doping in enhancing conductivity, a factor that exhibits a direct and positive correlation with electrochemical performance.
The cross-sectional microstructure of single cells utilizing BZYN and Pt-BZYN as the electrolyte materials is vividly illustrated in Figure 6. This micrograph reveals four distinct layers, with the electrolyte layer boasting a thickness of approximately 6-7 micrometers. Furthermore, it’s evident that both electrolyte layers exhibit a high degree of density, signifying robust contact between the electrolytes and electrodes, thus ensuring the integrity of the hydrogen containment within the cell. Given the uniformity in electrolyte thickness, the electrochemical performances of these assembled single cells are characterized and evaluated. Figure 7a presents a compelling comparison of the cell performance of H-SOFCs employing BZYN and Pt-BZYN electrolytes at an operating temperature of 700 °C. Clearly, the cell with Pt-BZYN as the electrolyte exhibits superior performance. Notably, there is an approximate 15% enhancement in maximum power density (MPD) observed, rising from 350 to 408 mW·cm-2. In Figure 7c, we can observe the cell performance of Pt-BZYN at various temperatures, revealing a positive correlation between power density and operating temperatures. Specifically, as depicted in the figure, the MPDs achieved are 408 mW cm−2 at 700°C, 345 mW cm−2 at 650°C, and 290 mW cm−2 at 600°C for the single cell. This trend underscores the significance of temperature control in optimizing power density in the cell.
The electrochemical impedance spectra (EIS) of the cells under open circuit voltage (OCV) conditions were conducted to assess the impact of Pt. As illustrated in Figure 7b, it can be observed that the polarization resistance (Rp) values of the two different cells are nearly identical. This suggests that the electrolyte has a relatively weak influence on Rp, with the main factors potentially being related to the cathode materials and their structures. However, it is clear that the ohm resistance of Pt-BYZN is much lower than that of BZYN, indicating the conductivity of the electrolyte is improved through doping of pt which in turn modifies the grain boundary to decrease grain boundary resistance. Furthermore, the EIS results across the temperature range from 600 °C to 700 °C are presented. As illustrated, the overall ohmic resistance decreases from 0.56 Ω cm2 at 600 °C to 0.25 Ω cm2 at 700 °C, indicating a negative relationship between temperature and ohmic resistance. Additionally, there are two distinct arcs in the impedance spectrum, corresponding to the two cathode reaction processes related to oxygen adsorption and transmission.
Recently, the distribution of relaxation time (DRT) method has been employed for analyzing EIS results to gain insights into the detailed reaction processes of fuel cells. In Figure 7(d), we present the DRT results calculated from impedance spectra obtained at 700 °C to investigate the impact of Pt. Notably, there are several distinct peaks, each representing specific reaction processes. The peaks at high and low frequencies are relatively similar, while the peak at intermediate frequency shows significant differences. It’s worth highlighting that the process at intermediate frequency is influenced by the migration of protons and oxygen ions [24]. The higher conductivity associated with Pt likely facilitates greater proton transfer to the cathode side through the electrolyte, thereby reducing the intensity of the peak at the intermediate frequency.
4. Conclusion
The low conductivity of BZYN due to the high grain boundary resistance hindered its application as a stable electrolyte for H-SOFCs. A simple technique via volatilization of platinum was adopted to treat BZYN electrolyte. The XRD results showed that pt modified BZYN had the same phase structure as BZYN and lattice parameters decreased for the lower ion radius, presenting pt partially located into the lattice sites. TEM results future determined that nanoparticle of pt attached at the grain boundary which may be beneficial for the ion conductivity. The cell with Pt-BZYN electrolyte displayed a higher maximum power density of 408mW cm-2 and a lower polarization resistance of 0.25 Ω·cm2 compared to the cell employing BZYN as electrolyte at 700 oC. Our findings suggest that the application of Pt treatment can be considered as a viable and efficient technical approach.
Acknowledgments
This work was supported by the National Natural Science Foundation of China (Grant Nos.: 11875164) and Natural Science Foundation of the Higher Education Institutions of Jiangsu Province (No. 18KJA430017).
References
- Gao, Y.; Zhang, M.; Fu, M.; Hu, W.; Tong, H.; Tao, Z. A comprehensive review of recent progresses in cathode materials for Proton-conducting SOFCs. Energy Reviews 2023, 100038. [Google Scholar] [CrossRef]
- Loureiro, F.J.; Nasani, N.; Reddy, G.S.; Munirathnam, N.; Fagg, D.P. A review on sintering technology of proton conducting BaCeO3-BaZrO3 perovskite oxide materials for Protonic Ceramic Fuel Cells. Journal of Power Sources 2019, 438, 226991. [Google Scholar] [CrossRef]
- Vignesh, D.; Sonu, B.K.; Rout, E. Factors constituting proton trapping in BaCeO3 and BaZrO3 perovskite proton conductors in fuel cell technology: a review. Energy & Fuels 2022, 36, 7219–7244. [Google Scholar] [CrossRef]
- Tong, H.; Fu, M.; Yang, Y.; Chen, F.; Tao, Z. A Novel Self-Assembled Cobalt-Free Perovskite Composite Cathode with Triple-Conduction for Intermediate Proton-Conducting Solid Oxide Fuel Cells. Advanced Functional Materials 2022, 32, 2209695. [Google Scholar] [CrossRef]
- Dudek, M.; Lis, B.; Lach, R.; Daugela, S.; Salkus, T.; Kezionis, A.; Mosialek, M.; Socha, R.P.; Morgiel, J.; Gajek, M.; Sitarz, M.; Ziabka, M. Ba0.95Ca0.05Ce0.9Y0.1O3 as an electrolyte for proton-conducting ceramic fuel cells. Electrochimica Acta 2019, 304, 70–79. [Google Scholar] [CrossRef]
- Xie, K.; Yan, R.Q.; Liu, X.Q. Stable BaCe0.7Ti0.1Y0.2O3-δ proton conductor for solid oxide fuel cells. Journal of Alloys and Compounds 2009, 479, L40–L42. [Google Scholar] [CrossRef]
- Hossain, M.K.; Iwasa, T.; Hashizume, K. Hydrogen isotope dissolution and release behavior in Y-doped BaCeO3. Journal of the American Ceramic Society 2021, 104, 6508–6520. [Google Scholar] [CrossRef]
- Han, D.; Uda, T. The best composition of an Y-doped BaZrO3 electrolyte: selection criteria from transport properties, microstructure, and phase behavior. Journal of Materials Chemistry A 2018, 6, 18571–18582. [Google Scholar] [CrossRef]
- Fluri, A.; Marcolongo, A.; Roddatis, V.; Wokaun, A.; Pergolesi, D.; Marzari, N.; Lippert, T. Enhanced proton conductivity in Y-doped BaZrO3 via strain engineering. Advanced Science 2017, 4, 1700467. [Google Scholar] [CrossRef]
- Hu, H.J.; Zou, J.; Shan, L.; Jiang, X.Q.; Ni, Y.J.; Li, X.B.; Qian, X.W.; Chen, W.W.; Zhou, Y.C.; Zhang, W.F.; Wei, S.H.; Jian, J.W. Conductivities in Yttrium-Doped Barium Zirconate: A First-Principles Study. Crystals 2023, 13. [Google Scholar] [CrossRef]
- Bondevik, T.; Bjørheim, T.S.; Norby, T. Assessing common approximations in space charge modelling to estimate the proton resistance across grain boundaries in Y-doped BaZrO3. Physical Chemistry Chemical Physics 2020, 22, 11891–11902. [Google Scholar] [CrossRef]
- Sun, W.; Zhu, Z.; Shi, Z.; Liu, W. Chemically stable and easily sintered high-temperature proton conductor BaZr0.8In0.2O3−δ for solid oxide fuel cells. Journal of power sources 2013, 229, 95–101. [Google Scholar] [CrossRef]
- Sun, W.; Shi, Z.; Liu, M.; Bi, L.; Liu, W. An easily sintered, chemically stable, barium zirconate-based proton conductor for high-performance proton-conducting solid oxide fuel cells. Advanced Functional Materials 2014, 24, 5695–5702. [Google Scholar] [CrossRef]
- Ji, S.; Tanveer, W.H. Thickness determination of porous Pt cathode thin film capped by atomic layer-deposited alumina for low-temperature solid oxide fuel cells. Applied Surface Science 2020, 514. [Google Scholar] [CrossRef]
- Gandavarapu, S.R.; Sabolsky, K.; Gerdes, K.; Sabolsky, E.M. Direct foamed and nano-catalyst impregnated solid-oxide fuel cell (SOFC) cathodes. Materials Letters 2013, 95, 131–134. [Google Scholar] [CrossRef]
- Xu, Y.S.; Kou, H.N.; Fang, S.H.; Wang, X.F.; Bi, L. Evaluation of potential reaction between BaZr0.8Y0.2O3-δ ceramics and Pt at high temperatures. Ceramics International 2019, 45, 22383–22387. [Google Scholar] [CrossRef]
- Lussier, J.A.; Shafi, S.P.; Donaberger, R.L.; Bieringer, M. Platinum Uptake and Ba2CePtO6 Formation During in Situ BaCe1-xMxO3-δ (M=La, In) Formation. Inorganic Chemistry 2014, 53, 8809–8815. [Google Scholar] [CrossRef]
- Xu, Y.; Kou, H.; Fang, S.; Wang, X.; Bi, L. Evaluation of potential reaction between BaZr0.8Y0.2O3-δ ceramics and Pt at high temperatures. Ceramics International 2019, 45, 22383–22387. [Google Scholar] [CrossRef]
- Fu, M.; Lin, X.; Li, X.Y.; Tao, Z.T. Applications of microwave technology in the field of solid oxide fuel cell - a review. Russian Chemical Reviews 2023, 92. [Google Scholar] [CrossRef]
- Xu, Y.; Kou, H.; Fang, S.; Wang, X.; Bi, L. Evaluation of potential reaction between BaZr0.8Y0.2O3-δ ceramics and Pt at high temperatures. Ceramics International 2019, 45, 22383–22387. [Google Scholar] [CrossRef]
- Shi, N.; Xie, Y.; Huan, D.; Yang, Y.; Xue, S.; Qi, Z.; Pan, Y.; Peng, R.; Xia, C.; Lu, Y. Controllable CO2 conversion in high performance proton conducting solid oxide electrolysis cells and the possible mechanisms. Journal of Materials Chemistry A 2019, 7, 4855–4864. [Google Scholar] [CrossRef]
- Mohamed, R.M.; Ismail, A.A.; Kadi, M.W.; Alresheedi, A.S.; Mkhalid, I.A.J.A. o. Fabrication of mesoporous PtO–ZnO nanocomposites with promoted photocatalytic performance for degradation of tetracycline. 2021, 6, 6438–6447. [CrossRef]
- Zheng, L.; Xie, J.; Liu, X.; Yang, C.; Zheng, W.; Zhang, J.J.A.A.M. Interfaces, Unveiling the electronic interaction in ZnO/PtO/Pt nanoarrays for catalytic detection of triethylamine with ultrahigh sensitivity. 2020, 12, 46267–46276. [CrossRef]
- Wang, X.; Ma, Z.; Zhang, T.; Kang, J.; Ou, X.; Feng, P.; Wang, S.; Zhou, F.; Ling, Y. Charge-transfer modeling and polarization DRT analysis of proton ceramics fuel cells based on mixed conductive electrolyte with the modified anode–electrolyte interface. ACS applied materials & interfaces 2018, 10, 35047–35059. [Google Scholar] [CrossRef]
Figure 1.
XRD patterns of as-prepared BZYN and Pt-BZYN mixture after co-fired at temperature of 1000℃ for 3h.
Figure 1.
XRD patterns of as-prepared BZYN and Pt-BZYN mixture after co-fired at temperature of 1000℃ for 3h.
Figure 2.
SEM-EDS elemental mapping of Pt, Zr, Ba, Y, Ni and O.
Figure 3.
TEM image displayed d-spacing of BaZrO3-based material and Pt.
Figure 4.
TEM-EDX scanning result of Pt-BZYN.
Figure 5.
Total conductivity curves of fuel cells with different electrolyte membranes of Pt-BZYN, BZYN measured at different temperatures from 350 °C to 700 °C.
Figure 5.
Total conductivity curves of fuel cells with different electrolyte membranes of Pt-BZYN, BZYN measured at different temperatures from 350 °C to 700 °C.
Figure 6.
SEM micrographs of the fuel cell cross-sections and electrolyte membrane for (a) BZYN, (b) Pt-BZYN.
Figure 6.
SEM micrographs of the fuel cell cross-sections and electrolyte membrane for (a) BZYN, (b) Pt-BZYN.
Figure 7.
(a) I–V and power density curves for the cell with Pt-BZYN, BZYN electrolyte membrane measured at 700 °C; (b) A comparison of impedance plots of fuel cells with BZYN and Pt-BZYN electrolyte membrane measured at 700 °C and impedance plots of fuel cells with Pt-BZYN electrolyte membrane measured at 600, 650, and 700 °C.; (c) I–V and power density curves for the cell with Pt-BZYN electrolyte membrane measured at 600, 650, and 700 °C ; (d) The impedance spectra corresponding distributions of relaxation times plots for the fuel cells with different electrolyte membrane.
Disclaimer/Publisher’s Note: The statements, opinions and data contained in all publications are solely those of the individual author(s) and contributor(s) and not of MDPI and/or the editor(s). MDPI and/or the editor(s) disclaim responsibility for any injury to people or property resulting from any ideas, methods, instructions or products referred to in the content. |
© 2023 by the authors. Licensee MDPI, Basel, Switzerland. This article is an open access article distributed under the terms and conditions of the Creative Commons Attribution (CC BY) license (http://creativecommons.org/licenses/by/4.0/).
Copyright: This open access article is published under a Creative Commons CC BY 4.0 license, which permit the free download, distribution, and reuse, provided that the author and preprint are cited in any reuse.
Promoted Performance of Layered Perovskite PrBaFe2O5+δ Cathode for Protonic Ceramic Fuel Cells by Zn Doping
Birkneh Teketel
et al.
Catalysts,
2022
ORR in Non-Aqueous Solvent for Li-Air Batteries: The Influence of Doped MnO2-Nanoelectrocatalyst
Eleonora Pargoletti
et al.
Nanomaterials,
2020
Proton-Ion Conductivity in Hexagonal Wurtzite-Nanostructured ZnO Particles When Exposed to a Reducing Atmosphere
Jinpeng Li
et al.
Crystals,
2022


MDPI Initiatives
Important Links
© 2024 MDPI (Basel, Switzerland) unless otherwise stated