Submitted:
20 November 2023
Posted:
22 November 2023
You are already at the latest version
Abstract
Background - Technological developments induced lifestyle changes and increase population physical inactivity. This change in lifestyle can affect the male-female morphological and physical fitness differences.
The aim of this study is to determine and to compare the effect of sex differences in percentage of body fat on speed and endurance running performance.
Methods - 72 male and 64 female students aged 20 to 23 years participated in this study.
After assessing their morphological characteristics, running performances during 30 m and 400 m, and maximum aerobic velocity (MAV) and maximal oxygen consumption (VO2max) during a 20 m shuttle running test have been estimated for each subject.
Male students were re-tested after being overweighed down with a weight equivalent to the mean differences in body fat recorded between the two sexes in the form of a loaded worn vest.
Results – Male presented a percentage of fat mass (17.2 ±2%) significantly (p <0.001) lower than that of women subject (25.0 ±2.5%).
Running performances during 30 m and 400 m, MAV and VO2max were significantly (p<0.001) better in males. During the weighted condition, male performances during 30 m and 400 m, MAV and VO2max were attenuated by 6.89%, 14.16%, 6.48% and 10.07%, respectively but remain significantly better than those of female students.
Conclusion - The persistence of sex differences after overweighting male students indicates that body fat could be responsible for ≈ 50 to 70% of the observed differences between sexes performances during short and long sprints, and 20 m shuttle running test.
Keywords:
sex
; fat mass
; speed
; maximum aerobic velocity
1. Introduction
Regular physical activity contributes to both maintaining and improving health, and is important for human development throughout the entire lifespan of a person. There is strong evidence for the beneficial effects of physical activity on health, in the areas of all-cause mortality, cancer, cardiovascular health, musculoskeletal health, metabolic health, and neurocognitive health [1,2,3,4]. Paradoxically, technological developments over the past two decades induced lifestyle changes such as high TV-viewing and high computer/tablet/smartphone and increase population physical inactivity [5,6,7]. This change in lifestyle can affect young people and adults of both sexes differently and modify or reverse the well-known male-female morphological and physical differences. In this line and during the first wave of the COVID-19 pandemic Brazilian, the Institute of Geography and Statistics Rio de Janeiro (2015) reported that women and the younger age group were more affected during the quarantine, given that they tend to be involved in formal physical activity usually practice physical activity outside the home, which was restricted [7].
In the other hand, a look at the Greek statues of Apollo and Venus shows that the sexual dimorphism of our species has been known for a very long time. The quantification of these sexual differences has been carried out in a myriad of anthropometric studies over the last 2 centuries [8] since the pioneer work of Adolphe Quételet [9]. Regardless of the ethnicity studied, young adult men are on average taller, more muscular, and less fat than women of the same age. The impact of these morphological differences on motor performance is also well documented and well described in sport ( [10,11]. For example, the intersex difference (male as reference vs. female athletes) on the world record in 400 m running (outdoor), and the 100th and 1000th best world performances are respectively -10.6%, -12.4% and -14,2% [12]. Similarly, these intersex differences in the 60 m sprint are -9.1%, -8.3% and -10.2% respectively [13]. It is also noticeable that over longer running distances (i.e. 5000 m in stadium), strongly dependent on the high aerobic potential of the subjects, these intersex differences increase being -12.1%, -13.6% and 13.5%, respectively [14].
According to Sparling and Cureton [15], the higher percentage of fat in young women explains two thirds of the VO2max differences in body mass and one-third of the performance differences obtained during a 12-minute run for both sexes. Similarly for anaerobic power and anaerobic capacity, sex is the most important factor influencing performance. Mayhew and Salm [16] suggest that anaerobic power is related to anthropometric dimensions and that size and strength are the major factors that explain intersex differences for the lower limbs. Maud and Shultz [17] stipulate that the anaerobic power and the anaerobic capacity of men are higher than those of women. However, these observed differences decrease when normalized to body mass and disappeared when normalized to lean mass.
These intersex differences in performance are the result of lifelong interactions between genetic inheritance and environmental factors (e.g. balanced nutrition, prevention against infectious diseases, level of physical activity...). Thus, during the 20th century, the improvement of living conditions for most humans has led to anthropometric changes (i.e. mainly an increase in height and weight) in both sexes. However, technology and its consequences on the mechanization of our lifestyles (e.g. travel, mechanical handling, etc.) has drastically decreased our level of daily physical activity, which in turn has lowered the physical performance of adolescents [18] and has led to the development of noncommunicable diseases in older adults (cf. “epidemiological transition”, https://www.emro.who.int/emhj-volume-2-1996/volume-2-issue-1/article2.html). The recent COVID-19 health crisis with long periods of lockdown has considerably exacerbated physical inactivity and sedentariness in some countries.
In this context, it is essential to continue studies aiming to quantify the level of motor performance of children, adolescents, and young adults in relation to their anthropometric data and more particularly their body composition. Such studies (preferably longitudinal) are needed to clarify the relationship between changes in fitness and changes in health in both male and female subjects [19].
Thus, the aim of the present study was to determine and compare the morphological characteristics of two groups of young adults of both sexes and to quantify the effect of intersex differences in percentage of body fat on short (30 m and 400 m) and long (20 m shuttle running test: Luc Léger test) running distance performances.
Based on the data of the literature, we advance the following hypotheses:
1- Sex differences in percentage of body fat would have deleterious effects on female physical performance during short and long-distance running performances.
2- Adding a load to male subjects to reproduce the excess fat mass of female subjects will drastically reduce the differences in running performance between the 2 sexes.
2. Materials and Methods
2.1. Subjects
We enrolled a total of 72 male and 64 female Tunisian students aged 21±2 and 22±3 years old, respectively.
The inclusion criteria were: (a) healthy student volunteers who practiced similar volume of physical activity as part of their university physical weekly training, i.e., 5 hours per week; (b) male subjects exhibiting a % body fat around 17%; (c) Female subjects with a % body fat around 25%. The exclusion criterions were (a) participation in additional physical activity (i.e., part of training in civilian clubs); (b) smokers and subjects who take any medication or nutritional supplements.
All women were tested in the middle of the follicular phase (PF) of the menstrual cycle between days 4 and 8 after menstruation.
The study has been approved by the local ethics committee of the Medicine Faculty of Sousse in Tunisia (Code: LR19ES09) and has therefore been performed in accordance with the ethical standards laid down in the 1964 Declaration of Helsinki (Revised in 2013).
All participants gave their informed formal consent prior to their inclusion in the study and details that might disclose the identity of the subjects under study have been omitted.
2.2. Anthropometric Measurements
2.2.1. Body Mass
Body mass was measured using a Tanita balance (model TBF-300). The subject must stand upright without assistance. It must stand still in the center of the weighing pan, the body weight evenly distributed over the two feet slightly apart. Shoes and clothing should be removed, except for underwear that can be kept. Body mass was recorded in kilograms 0.1 kg.
2.2.2. Height
Subject height was measured using a measuring rod (graduated in centimeters; a standard anthropometric kit; Harpenden type, Switzerland) comprising a horizontal cursor which is brought into contact with the highest point of the head. The subject must be barefoot, and little dressed so that the experimenter can observe the positioning of his body as well as his posture. He should stand as straight as possible on a flat surface, the weight distributed evenly on both feet, heels joined, and the head placed so that the line of sight is perpendicular to the body. The arms hang freely along the body, and the head, back, buttocks and heels are in contact with the flat, vertical surface behind the subject. Then, subject took a deep breath, and the measurement was made just before expiration. The movable cursor is brought into contact with the highest point of the head, pressing it down enough to compress the hair. Height was measured in meters 0.1 cm.
2.2.3. Body Mass Index
Body mass index (BMI in kg/m2) was calculated for each subject by dividing body mass (in kg) by the square of the height (in m).
2.2.4. Body Fat
Skin pliers (Harpenden type, Switzerland) was used to measure skin folds. These measurements have always been carried out by the same experimenter, perfectly trained in this technique. Skin fold measurements were taken at 4 traditional sites (i.e., biceps: front side middle upper arm, triceps: back side middle upper arm, subscapular: under the lowest point of the shoulder blade, supra-iliac: above the upper bone of the hip) on the dominant side of the body. The measurements were carried out three times according to the technic established by the international biological program [20]. The average of the three measurements determined the value for the measured skin fold. The percentage of body fat was estimated from the skin folds using the equation of Durnin and Womersely [21] for young adults aged from 20 to 29 years.
where Density = 1.1631 - (0.0632 * Log sum of the 4 folds) for male subjects
% body fat = (4.95 / [Density - 4.5]) * 100
Density = 1.1599 - (0.0717 * Log sum of the 4 folds) for female subjects
2.2.5. Ballasting Protocol
Male students were overweighted by wearing a loaded worn vest (CAPITAL SPORTS Monstervest). This vest features weight separately removable 30 kg metal weights and a soft padding all around and an adjustable nylon strap with Velcro.
The ballast weight (kg) was calculated as follows:
- ∆ F/M (%) body fat = % Female mean body fat - %Male mean body fat
- Ballast weight (kg) for each male subject = weight subject (kg) x ∆ Female/Male (%) body fat
- The calculated ballast weight (kg) was entered using 1, 0.5 and 0.1 kg weights introduced into the jacket pockets.
2.3. Physical Measurements
The physical protocol started with the determination of the maximum aerobic power and the maximal aerobic velocity during the 20 m shuttle running test (SRT). Three days later, the speed at 30 meters and at 400 m are determined for each male and female subjects. One week later, male subjects were asked to repeat the same tests after ballasting them. Care was taken to ensure that the added weight was secure, comfortable and did not interfere with the running movements.
2.3.1. 30 m Test
Subjects had to start from a standing position with their front foot just behind the start line and their rear foot on the pedal. They had a 30 m sprint with a stationary start, and the timing started as soon as the rear foot left the pedal. The speed was measured with an electronic infrared photo cell (Witty, Microgate, Bolzano, Italie) placed at a height of 1 m from the ground on the starting and on the finish line (30 m).
Three trials tests were performed by each subject and a recovery of three minutes was allowed between each trial. The best (fastest) 30 m sprint time was selected for the analysis [22].
2.3.2. 400 m Test
The 400 m race is a very intense effort often called the "long sprint". Like any short-term high-intensity physical activity, the 400 m run is almost entirely performed under anaerobic (the so called “lactate”) conditions.
The test was conducted around 400 m Tartan track. The start and finish lines were marked with cones and time in seconds to cover the distance of 400 m was measured using a stopwatch. Each test was preceded by 10 minutes general and specific warm-up after which the assistant gives the command “GO” and starts the stopwatch. Following the assistant's signal, the subject runs full speed over 400 m and the assistant stops the stopwatch when the athlete's torso crosses the finishing line and records the time in seconds.
2.3.3. 20 m Shuttle Running Test
The 20m SRT was conducted following the standard methodology and the speed level recorded was converted into VO2 max [23]. The subjects were instructed to run back and forth on a 20 m course with compulsorily touching the 20 m line. A sound signal was played from a prerecorded tape at the same time, with the frequency of the sound signals being increased from a starting speed of 8.5 km/hour by 0.5 km/hour each minute.
The last stage number announced was noted when the subjects could no longer follow the pace.
The equation used for ≥18 years old subjects is: VO2max in ml/kg/min = –27.439 + 6.0028 S; where S (speed in km/hour) = 8 + 0.5 stage.
2.4. Statistical Analysis
For all comparisons, the values obtained by the male subjects are used as references. A value with a minus sign indicates a poorer performance compared to the male subjects. Before ballasting male subjects, the comparison of the morphological and physical parameters recorded in the two sex groups was performed using a one-way (Sex: male and female) analysis of variance ''ANOVA''. After ballasting male subjects, running tests results were compared using one way analysis of variance (Weighting: weighted male, non-weighted male and female). When the analysis showed significant results, a ‘’Post Hoc’’ test comparison "Scheffé Test" was used to determine the importance of the differences between the mean values of the different groups. The significance threshold is conventionally set at p < 0.05.
3. Results
For all comparisons, the values obtained by the male subjects are used as references. Hence, a value with a minus sign (for both F and wM) indicates a poorer performance compared to that of the male subjects.
3.1. Morphological Parameters
Subjects body mass, height, body mass index and percentage of body fat were presented in Table 1.
3.1.1. Body Mass
Male students were 15.7 % heavier than female students with a body mass of 72.8 ± 7 kg for men and 61.4 ± 7 kg for women (F = 75.65; p < 0.001).
3.1.2. Height
The average height of the male and female students were 1.75 ± 0.05 m and 1.62 ± 0.05 m, respectively. Men are 7.4 % taller than women (F = 148.6; p < 0.001).
3.1.3. Body Mass Index
Statistical analysis did not reveal any statistical differences between male (23.77 ± 2 kg/m²) and female BMI (23.40 ± 2 kg/m²).
3.1.4. Body Fat
Male subjects exhibited a percentage of fat mass (17.2 ± 1.8%) significantly (F = 57.5; p < 0.001) lower than that of female subjects (25.0 ± 2.5%) (i.e., intersex difference: +45.34%).
3.2. Physical Parameters
Physical performances of both female, male and weighted male students during tests are summarized in Table 2.
3.2.1. 30 m Test
The intersex difference between male (4.81±0.11 sec) and female (5.58±0.31 sec) subjects during the 30 m test reached -16.1% (F = 171.11; p <0.001) (Table 2). After ballasting males, the difference between weighted male and female groups was reduced to -6.89% but gross performances remain significantly better (p < 0.01) in weighted male (5.22 ± 0.13 sec) than in female group (Table 2). This corresponds to a reduction of 57.14% of the intersex difference formerly observed between male and female subjects.
3.2.2. 400 m Test
The intersex difference between male (61.97±2.63 sec) and female (87.95±8.93 sec) students during the 400 m race reached -41.92% (F = 107.34; p <0.001) (Table 2). After ballasting male subjects, the difference between weighted male and female groups was reduced to -14.6% but gross performances remain significantly better (p < 0.001) in weighted male (77.04 ± 4.51 sec) than in female students (Table 2). This corresponds to a reduction of 66.22% of the intersex difference formerly described between male and female subjects.
3.2.3. 20 m Shuttle Running Test
The average VO2max recorded in male and female students during the 20m SRT was respectively 49.67±3.3 and 37.22±3.31 ml/min/kg. Thus, the intersex difference reached -25.08 % (F = 155.6; p < 0.001) (Table 2).
Similarly, MAV performance of the male subjects (12.53±0.54 km/h) was significantly higher (F = 75.2; p < 0.001) to that of the female ones (10.38±0.57 km/h). This corresponded to an intersex difference of -17.15% (Table 2).
After ballasting male students, VO2max and MAV performances during 20m SRT decreased to to 41.39±3.17 ml/min/kg and 11.10±0.47 km/h. Hence, the differences between weighted male and female students for VO2max and MAV were reduced to -10.07% (p<0.001) and -06.48 % (p<0.01), respectively (Table 2). This corresponds to a reduction of 59.84% (VO2max) and 62.21% (MAV) of the intersex differences formerly described between male and female subjects.
4. Discussion
The aim of this study was to compare some anthropological and physical characteristics of two groups of adult subjects of both sexes, and to determine the effect of the difference in fat mass on 30 m, 400 m and maximal aerobic velocity (MAV) and the maximum oxygen consumption (VO2max).
To achieve our objectives, the subjects carried out the 30 m, 400 m tests and 20 m multistage SRT with and without ballasting male students. The overweighting consisted in having in the final session all the male subjects wear a weighted vest during each test. The additional weight carried by each of them corresponded to the weight necessary to cancel the average difference in fat mass of the female subjects.
4.1. Morphological Parameters
Our study reveals that male students are 7.4% (≈ 13 cm) taller and 15.7% (≈ 11.4 kg) heavier than female ones. These findings are comparable to those of Shephard et al. [24] and Withers et al. [25] according to which men are ≈ 13 cm taller, ≈ 14 to 18 kg heavier. Male also have a significantly lower body fat al. [26] (∆ F percentage than women (∆ F/M: - 45.5%, p<0.001%). Our results are close to those reported by Ben Mansour et al. [10] but lower to those reported by Kacem et /M: around -96%). Note that in the latter study, male subjects exhibited a particularly low body fat percentage (12,9 ± 4,5%) for students while that of the female ones (25.3 ± 6.8%) was very close to that of the present study (25.0±2.5%).
In the present study, this choice of high mean intersex differences in body fat percentage is deliberate. This allowed for the analysis of the effect of sex differences in body fat percentage on running performances. Note that in this study, the male and female groups had comparable BMI around 23.5±2 kg/m2, supporting the idea that male students are more muscular than female’s ones.
4.2. Physical and Physiological Parameters
4.2.1. The Speeds over 30 and 400 m
The results recorded during the 30 m speed test reveal that the male subjects are 16.1% (p <0.001) faster than the female subjects (4.81 ± 0.11s vs 5.58 ± 0.31s). Likewise, during the 400 m test, the performance of male subjects is 41.92% (p <0.001) significantly better than that of female subjects (61.97 ± 2.63s and 87.95 ± 8.93s). This difference is much higher than that measured in high-level athletes around 10.6%. This more male/female pronounced difference in our study is probably linked to a greater sedentary lifestyle of our female (VO2max: 49.67±3.3 ml/min/kg) compared to male subjects (VO2max: 37.22±3.31 ml/min/kg).
Our results are in agreement with those of Maud and Shultz [17] who stipulate that the anaerobic power and the anaerobic capacity of men are superior to those of women. For Maciejczyk et al.
[27], body composition had the greatest impact on anaerobic power. Precisely, Vardar et al. [28] showed that anaerobic performance parameters obtained from Wingate Test were positively associated with fat free mass but not % body fat mass in elite young wrestlers.
In this sense, Taylor et al. [29] reported that muscle power is mainly determined by muscle volume which is the product of the average cross-sectional area and the length of the muscle. In this context, Mercier et al. [30], suggested that lean mass and other indeterminate factors could explain 88% of the maximum anaerobic power. In cycling activity, Maciejczyk et al. [27] suggested that body fat can negatively influence anaerobic performance. However, body fat decreased with age in men and increased in women [31].
Women have more adipose tissue than men, especially located around the thighs, buttocks, and hips [32]. Similarly, Kacem and al. [26] have shown that the percentage of body fat is a factor that disadvantages performance during brief and intense (explosive) efforts such as the 5 Jump Test. Katralli and Goudar [33] explained that the higher the percentage of body fat, the higher the performance in activities involving movement of the body is weak. In this sense, our results show that male subjects are less fat (-45.5%) and more efficient than female subjects.
The weighting of the male subjects was accompanied by an average reduction in the speed race time over 30 m by 0.41sec (-8.53 %, p<0.001) and the intersex differences (F/wM) were reduced to -6.89% (p<0.001). Similarly for the 400 m race, ballasting of the male subjects decreased their average performance by 15.07 sec (-24.32 %, p<0.001) and the intersex differences (F/wM) were reduced to -14.16% (p<0.001) (Figure 1).
Our results are in agreement with those of Cureton et al. [34] who showed that excess weight or body fat affects performance by lowering the energy available to move each kilogram of body weight. Likewise, Legaz and Eston [35] report that an excess of adipose tissue in runners requires greater muscular effort to accelerate the legs and energy expenditure at the same speed. Indeed, body fat is a passive tissue during exercise, while power generation depends mainly on muscle mass, which is the main component of lean mass. Fat can however constitute an additional load, in particular during running, leading to the generation of higher power necessary for rapid movement [36,37].
In the present study, the results obtained indicate that if the average percentage of body fat for male students is made equal (i.e. with ballasting) to the average percentage of fat for female ones, the difference in average performance during races over 30 m and 400 m are reduced but persist significantly. This suggests other factors such as size, body mass, muscle volume, and neural and hormonal factors can interfere with the negative effects of excess fat.
4.2.2. 20 m Shuttle Running Test
Our study showed that performances during SRT is significantly higher (i.e. lower time) in male subjects compared to female ones. The intersex differences are around -17.19% for MAV (p<0.001) and -25.10% for (estimated) VO2max (p<0.001). Our results are under those reported by Sharma and Kailashiya [38], according to which the average value of VO2max for women is around 70 to 75% (78% in our study) that for men, after puberty. Likewise, Palomino-Devia et al. [39] have shown that male subjects presented better levels of aerobic capacities than female subjects. In this sense and in accordance with our study, Cureton et al. [34] and Palomino-Devia et al. [39] have shown that females are notably distinguished from males by their greater percentage of body fat and their lower VO2max (ml/min/kg). Sharma and Kailashiya [38], confirm that body fat in women has been reported as one of the main determinants of intersex differences for VO2max and the metabolic response to running.
In this sense, Pribis et al. [40], Davies et al. [41], Shete et al. [42] and Sharma and Kailashiya [11] have shown a negative correlation between VO2max and body fat percentage. Pollock et al. [43], in their study of marathon runners, concluded that champion athletes had lower body weights (6.9%) and less fat (29.8%) than moderately trained athletes. Likewise, Maciejczyk et al. [27] have shown that gaining body mass due to increased adiposity or increased muscle mass reduces aerobic endurance performance (i.e. "lighter, better performing").
For Donnelly et al. [44], the use of regular physical activity to induce a loss of body fat is more effective in men than in women. Donnelly et al. [44], and Potteiger et al. [45] reported that 16-month supervised aerobic exercise reduced body fat in men who consumed as much as they wanted but there was no change in body fat in women. These data suggest that in response to aerobic exercise, women more specifically associate energy intake with energy expenditure and thus preserve body fat. Men, on the other hand, do not increase energy intake enough to compensate for the new, larger energy expenditure and therefore lose more body fat.
The overweighting of the male subjects was accompanied by 16.67% (p<0.001) reduction in VO2max and the intersex differences were reduced to -10.10% (p<0.001). Similarly, when ballasted male MAV decreased by 11.41% (p<0.001) and the difference between male and female students was reduced to -17.15% (p<0.001) (Figure 1).
Our results are in agreement with those of Cureton et al. [34], according to which the greater female specific body fat mass is a determining factor of intersex differences for metabolic responses and performance during a 12-minute race. The higher the percentage of fat, the lower the performance in activities involving movement of the body [33]. In endurance sports requiring body propulsion, greater body mass can constitute a performance limiting factor (Maciejczyk et al. [27].
The increase in weight carried has resulted in an increase in the amount of energy required to perform the running tests. Thus, the ratio of available oxygen to that required during maximum work has been reduced (Cureton et al. [34]. Wan Nudri et al. [46] reported that athletes with a lower percentage of body fat had higher maximum oxygen uptake (VO2max). In other words, athletes with a lower body fat percentage appeared to use oxygen most efficiently [47], while excess body fat would have a negative effect on physical performance [48].
Cureton et al. [34] reported that the addition of overweight to lean individuals decreased the expressed VO2max compared to the supported load without significantly affecting the absolute cardiorespiratory capacity. In this line, during field hockey efforts, Sharma and Kailashiya [11], stated the existence of a negative correlation between body fat and VO2max, thus explaining the need for a lean body and a low-fat mass to improve the weight/strength ratio and therefore physical performance.
When the VO2 max is expressed relative to the lean mass, Cureton et al. [34] have shown that correlations with performance are weaker. Likewise, Zwiren et al. [49] reported a significant reduction in intersex differences after having assimilated the groups to training habits. In contrast and more recently, Sharma and Kailashiya [38] have shown that when expressed in relation to lean body mass, the VO2max values of male subjects are, on average, 12 to 15% higher than those of female subjects. This persistence of intersex differences is explained by the difference in relative hemoglobin content, lower red blood cell mass and lower hematocrit in women.
5. Conclusion
Speed performance over 30 and 400 m (i.e. short and long sprints, respectively) and SRT are significantly better in male subjects compared to female one. Precisely, relative differences represented -16,1%, -41,92%, -17.15% and -25.08% of the male performances for 30 m, 400 m, MAV and VO2max, respectively.
The persistence of intersex differences after overweighting male subjects indicates that body fat mass could be responsible for only 9.21%, 27.76%, 10.67% and 15.01% of observed intersex differences for 30 m, 400 m, MAV and VO2max performances, respectively. Hence, morphological, physiological, neuromuscular factors or habitual global physical activities and sport training (i.e. volume*intensity, and not only volume) may play an important role for the observed differences in physical performance between male and female students.
Author Contributions
Establishment of the experimental protocol: K.A. and F.F.; Recruitment of subjects: K.A.; Setting up Experiences: K.A. and B.M.G.; Monitoring of experiences: K.A., B.M.G. and F.F.; Data analysis: K.A., B.M.G. and F.F.; Writing the manuscript: K.A.; Correction of the manuscript: B.M.G. and G.L.; Idea proposal: G.L. and F.F.; Data Discussion: G.L.; Director of the work, Data Interpretation AND Supervision: F.F.
Funding
This research received no external funding.
Ethics approval and consent to participate
The Study has been approved by the local ethics committee of the Medicine Faculty of Sousse in Tunisia (Code: LR19ES09) and has therefore been performed in accordance with the ethical standards laid down in the 1964 Declaration of Helsinki (Revised in 2013). All participants gave their informed formal consent prior to their inclusion in the study and that details that might disclose the identity of the subjects under study have been omitted.
Informed Consent Statement
Each author is in full accord with the contents of the manuscript All the authors have given their consent for the publication of the manuscript in the Journal of Women’s Health and Development. None of the data have previously been published or submitted for publication. In addition, the manuscript will not be submitted for publication elsewhere until a decision has been made as to its acceptability for the Journal of Journal of Women’s Health and Development.
Data Availability Statement
The datasets used and/or analysed during the current study available from the corresponding author on reasonable request.
Acknowledgments
The authors would like to thank all the students participating in the present study for their contribution to the success of the experimental protocol, their patience and their collaboration. The authors also thank the higher institute of sport and physical education of Sfax for having provided all the evaluation material necessary for the evaluation of the physical qualities of the participants and for the fact that they put at our disposal the athletics field and the indoor team sports hall for the duration of the protocol.
Conflicts of Interest
No competing interests exist for this manuscript.
References
- Micheli, L.; Mountjoy, M.; Engebretsen, L.; Hardman, K.; Kahlmeier, S. ; Lambert, E. ; Ljungqvist A. ; Matsudo, V. ; McKay, H.; Sundberg, C.J. Fitness and health of children through sport: the context for action. Br J Sports Med. 2011;45:931-936.
- Harrison, C.L.; Brown, W.J.; Hayman, M.; Moran, L.J.; Redman, L.M. The Role of Physical Activity in Preconception: Pregnancy and Postpartum Health. Semin Reprod Med. 2016;34: 28-37.
- Miko, H.C.; Zillmann, N.; Ring-Dimitriou, S.; Dorner, T.E.; Titze, S.; Bauer, R. Effects of Physical Activity on Health. Gesundheitswesen. 2020;82:184-195.
- Kotarska, K.; Nowak, M.A. ; Nowak, L., Król, P., Sochacki, A.; Sygit, K.; Sygit, M. Physical Activity and Quality of Life of University Students, Their Parents, and Grandparents in Poland-Selected Determinants. Int J Environ Res Public Health. 2021;18:3871.
- Babey, S.H.; Hastert, T.A.; Yu, H.; Brown, E.R. Physical activity among adolescents. When do parks matter?. Am J Prev Med. 2008;34:345-348.
- Werneck, A.O.; Oyeyemi, A.L.; Szwarcwald, C.L.; Vancampfort, D.; Silva, D.R. Associations between TV viewing and depressive symptoms among 60,202 Brazilian adults: The Brazilian national health survey. J Affect Disord. 2018 15;236:23-30.
- Silva, D.R.; André, O.; Werneck, A.O.; Deborah, C.; Malta, D.C.; Souza-Júnior, P.R.B.; Azevedo, L.O.; Marilisa, B.A.; Barros, M.B.A.; Célia, L.; Szwarcwald, C.L. Incidence of physical inactivity and excessive screen time during the first wave of the COVID-19 pandemic in Brazil: what are the most affected population groups?. Annals of Epidemiology. 2021;62:30-35.
- Park, R. J. Measurement of physical fitness: a historical perspective. In Office of Disease Prevention and Health Promotion Monograph Series. Washington DC: HHS, Public Health Service; 1989.
- Quételet, A. Sur l'homme et le développement de ses facultés, ou essai de physique sociale. Paris: Bachelier vol. 2; 1835.
- Ben Mansour, G.; Kacem, A.; Ishak, M.; Grélot, L.; Ftaiti, F. The effect of body composition on strength and power in male and female students. BMC Sports Sci Med Rehabil. 2021;13:150.
- Sharma, H.B.; Kailashiya, J. Anthropometric and Physiological Basis of Endurance Capacity in Young Indian Field Hockey Players. Indian J Physiol Pharmacol. 2017;61:114-121.
- https://www.worldathletics.org/records/all-time-toplists/sprints/400-metres/outdoor/men/senior?regionType=world&timing=electronic&page=1&bestResultsOnly=true&firstDay=1900-01-01&lastDay=2022-11-28.
- https://www.worldathletics.org/records/all-time-toplists/sprints/60-metres/indoor/men/senior?regionType=world&timing=electronic&page=1&bestResultsOnly=true&firstDay=1900-01-01&lastDay=2022-11-28.
- https://www.worldathletics.org/records/all-time-toplists/middle-long/5000-metres/outdoor/men/senior?regionType=world&page=1&bestResultsOnly=true&firstDay=1900-01-01&lastDay=2022-11-28.
- Sparling, P.B.; Cureton, K.J. Biological determinants of the sex difference in 12-min run performance. Med Sci Sports Exerc.1983;15:218-223.
- Mayhew, J.L.; Salm, P.C. Gender differences in anaerobic power tests. Eur J Appl Physiol Occup Physiol.1990;60:133-138.
- Maud, P.J.; Shultz, B.B. Gender comparisons in anaerobic power and anaerobic capacity tests. Br J Sports Med.1986;20:51-54.
- Tomkinson, G.R.; Carver, K.D.; Atkinson, F., Daniell, N.D.; Lewis, L.K.; Fitzgerald J.S.; Lang J.J.; Ortega, F.B. European normative values for physical fitness in children and adolescents aged 9-17 years: results from 2 779 165 Eurofit performances representing 30 countries. Br J Sports Med. 2018;52:1445-14563.
- Lang, J.J. et al. Top 10 International Priorities for Physical Fitness Research and Surveillance Among Children and Adolescents: A Twin-Panel Delphi Study. Sports Med. 2022;24:1-16.
- Weiner, J.S.; Lourie, J.A. Practical human biology. London: Academic Press;1981. p. 27-52.
- Durnin, J.V.G.A.; Womersley, J. Body fat assessed from the total body density and its estimation from skinfold thickness: measurements on 481 men and women aged from 16 to 72 years. Br J Nutr.1974;32:77-97.
- Wong, P.L.; Chamari, K.; Dellal, A.; Wisloff, U. Relationship between anthropometric and physiological characteristics in youth soccer players. J Strength Cond Res.2009;23:1204-1210.
- Léger, L.A.; Mercier, D.; Gadoury, C.; Lambert, J. The multistage 20-meter shuttle run test for aerobic fitness. J Sports Sci. 1988;6:93-101.
- Shephard, R.J. Exercise and training in woman. Gender differences on exercise responses. Can J Appl Physiol. 2000;25:35-54.
- Withers, R.T.; LaForgia, J.; Pillans, R.K.; Shipp, N.J.; Chatterton, B.E,; Schultz, C.G.; Leaney, F. Comparisons of two, three, and four-compartment models of body composition analysis in men and women. J Appl Physiol. 1998;85:238-245.
- Kacem, A.; Ftaiti, F.; Grélot, L.; Tabka, Z. Effects of muscle volume on five successive jumps performance in both sexes. Science & Sports. 2015;31:44-50.
- Maciejczyk, M.; Wiecek, M.; Szymura, J.; Cempla, J.; Wiecha, S.; Szygula, Z., Brown, L.E. The effect of body composition on respiratory compensation point during incremental test. J Strength Cond Res. 2014;28:2071-2077.
- Vardar, S.A.; Tezel, S.; Ozturk, L., Kaya, O. The relationship between body composition and anaerobic performance of elite young wrestlers. J Sports Sci Med. 2007;6: 34-38.
- Taylor, M.J.D.; Cohen, D.; Voss, C., Sandercock, G.R.H. Vertical jumping and leg power normative data for English school children aged 10-15 years. J Sports Sci. 2010;28:867-872.
- Mercier, B.; Mercier, J.; Granier, P.; Gallais, D.Le.; Préfaut, C. Maximal anaerobic power: relationship to anthropometric characteristics during growth. Int J Sports Med. 1992;13:21-26.
- Palomino-Devia, C.; Otero-Saborido, F.M.; González-Jurado, J.A. Analysis of adiposity and physical fitness in young Colombian students. Biomedica. 2016;36:343-353.
- Kenney, W.L.; Wilmore, J.H.; Costill, D.L. Obesity, diabetes, and physical activity. Physiology of Sports and Exercise. 5th ed. Champaign (IL): Human Kinetics. 2012;546-570.
- Katralli, J., Goudar, S.S. Anthropometric Profile and Special Judo Fitness levels of Indian Judo Players. Asian J Sports Med. 2012;3:113-118.
- Cureton, K. J.; Sparling, P.B.; Evans, B.W.; Johnson, S. M.; Kong, U.D.; Purvis. J.W. Effect of experimental alterations in excess weight on aerobic capacity and distance running performance. Med Sci Sports.1978;10:194-9.
- Legaz, A.; Eston, R. Changes in performance, skin fold thickness, and fat patterning after three years of intense athletic conditioning in high level runners. Br J Sports Med. 2005;39:851-856.
- Morgan, W.; Daniels. T. Relationship between VO2max and the aerobic demand of running in elite distance runners. Int J Sports Med. 1994;15:426-429.
- Maciejczyk, M.; Wiecek, M.; Szymura, J.; Szygula, Z.; Brown, L.E. Influence of increased body mass and body composition on cycling anaerobic power. J Strength Cond Res. 2015;29:58-65.
- Sharma, H.B.; Kailashiya, J. Gender difference in aerobic capacity and the contribution by body composition and haemoglobin concentration: A study in Young Indian National Hockey Players. J Clin and Diagn Res. 2016;10:CC09–CC13.
- Palomino-Devia, C.; González-Jurado, J.A.; Ramos-Parraci, C.A. Body composition and physical fitness in Colombian high school students from Ibagué. Biomedica. 2017;37:408-415.
- Pribis, P.; Burtnack, C.A.; Mckenzie, S.O.; Thayer, J. Trends in body fat, body mass index and physical fitness among male and female college students. Nutrients. 2010;2:1075-1085.
- Davies, C.T.M.; Godfrey, S.; Light, M.; Sargeant, A.J.; Zeidifard, E. Cardiopulmonary response to exercise in obese girls and young women. JAP. 1975;38:373-376.
- Shete, A.N.; Bute, S.S.; Deshmukh, P.R. A Study of VO2 Max and Body Fat Percentage in Female Athletes. J Clin Diagn Res. 2014;8:BC01-3.
- Pollock, M.L.; Gettman, L.R.; Jackson, A.; Ayres, J.; Ward, A.; Linnerud, A.C. Body composition of elite class distance runners. Ann N Y Acad Sci. 1977;301:361-370.
- Donnelly, J.E. ; Hill, J.O. ; Jacobsen, D.J. ; Joseph, E. ; Donnelly, J.E.; Potteiger, J.; Sullivan, D.K.; Johnson,S.L.; Heelan, K.; Hise, M.; Fennessey, P.V.; Sonko, B.; Sharp, T.; Jakicic, J.M.; Blair, S.N. ; Tran, Z.V. ; Mayo, M. ; Gibson, C. ; Washburn, R.A. Effects of a 16-month randomized controlled exercise trial on body weight and composition in young, overweight men and women: the Midwest Exercise Trial. Arch Intern Med. 2003;163:1343-1350.
- Potteiger, J.A.; Jacobsenm D.J.; Donnelly, J.E.; Hill, J.O. Glucose and insulin responses following 16 months of exercise training in overweight adults: the Midwest Exercise Trial. Metab. 2003;52:1175-1181.
- Wan Nudri, W.; Ismail, M., Zawiak, H. Anthropometric measurements and body composition of selected national athletes. Malays J Nutr. 1996;2:138-147.
- Heck, K. Nutrition, diet and weight control for athletes. JOPER. 1980;51:43-45.
- Leelarthaepin, B.; Chesworth, E.; Boleyn, T. Physical performance, physical activity and body fatness. J Food Nutr. 1983;40:164-168.
- Zwiren, L.D; Cureton, K.J.; Hutchinson, P. Comparison of circulatory responses to submaximal exercise in equally trained men and women. Int J Sports Med. 1983;4:255-259.
Figure 1.
Performances Difference (%) during 30 m, 400 m and 20 m and SRT tests between Female (F) and male (M) students before and after ballasting male subjects (wM). ∆ F/M (%): difference between male and female students expressed in % of the value of male subjects. ∆ F/wM (%): difference between weighted male and female subjects expressed in % of the value of weighted male subjects.
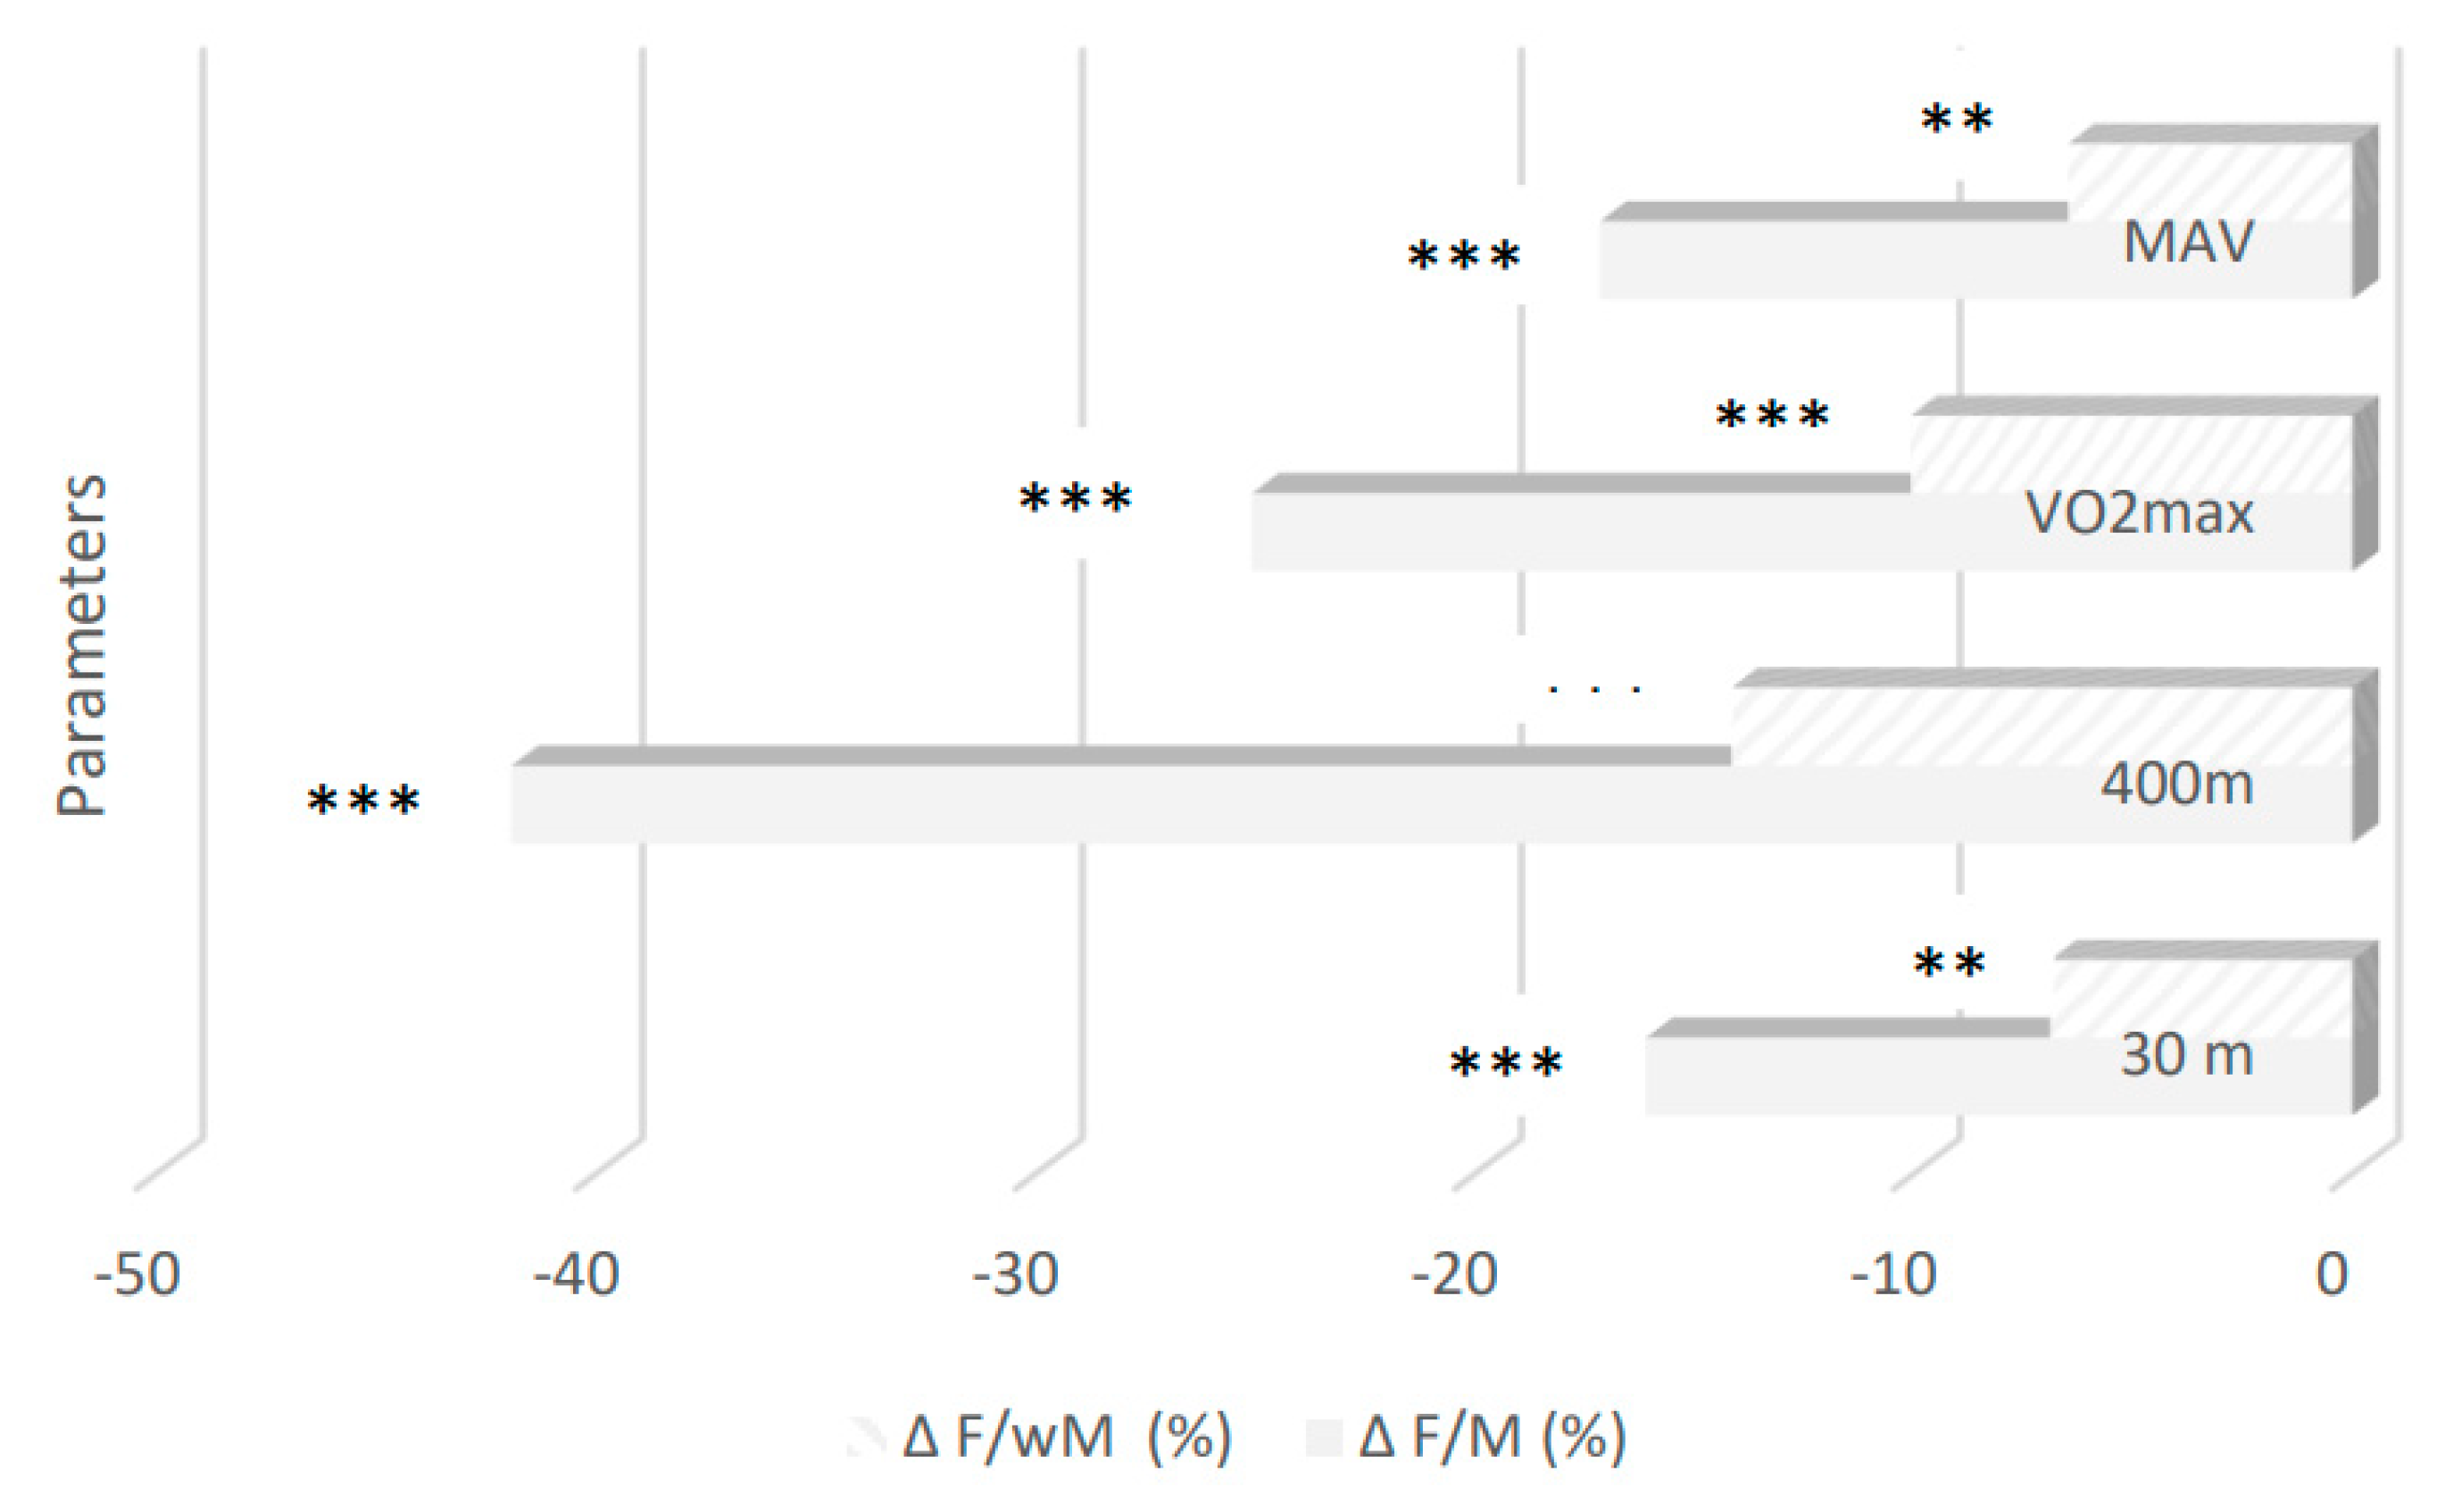

Table 1.
Anthropometric characteristics of the 136 subjects. ∆ F/M (%): difference between female (F) and male (M) subjects expressed as in % of the value of male subjects.
Table 1.
Anthropometric characteristics of the 136 subjects. ∆ F/M (%): difference between female (F) and male (M) subjects expressed as in % of the value of male subjects.
| Groups Parameters |
Male (n=72) | Female (n=64) | ∆ F/M (in %) |
|---|---|---|---|
|
Body mass (kg) |
72.8±7 | 61.4±7 |
-15.7 p<0.001 |
| Height (m) | 1.75±0.05 | 1.62±0.05 | -7.4 p<0.001 |
| BMI (kg/m²) | 23.77±2 | 23.40±2.01 | -1.55 NS (P<0.56) |
| Body fat (%) | 17.2±1.8 | 25.0±2.5 | 45.34 p<0.001 |
Table 2.
Performances related to 30 m, 400 m and 20m SRT for male (M) and female (F) subjects before and after ballasting male subjects (wM).
Table 2.
Performances related to 30 m, 400 m and 20m SRT for male (M) and female (F) subjects before and after ballasting male subjects (wM).
| Groups Tests |
Male | Female | ∆ F/M (%) Female vs. Male |
Weighted Male | ∆ F/wM (%) Female vs weighted Male |
∆ reduction (%) Female vs. Male (after ballasting male subjects) | ∆ wM/M (%) weighted Male vs. Male |
|---|---|---|---|---|---|---|---|
| 30 m (sec) | 4.81 ±0.11 |
5.58 ±0.31 |
-16.1 p<0.001 |
5.22 ±0.13 |
-6.89 p<0.01 |
57.14 | -8,53 p<0.001 |
| 400m (sec) | 61.97 ±2.63 |
87.95 ±8.93 |
-41.92 p<0.001 |
77.04 ±4.51 |
-14,16 p<0.001 |
66.22 | -24,32 p<0.001 |
| VO2max (ml/min/kg) | 49.67 ±3.3 |
37.22 ±3.31 |
-25.08 p<0.001 |
41.39 ±3.17 |
-10.07 p<0.001 |
59.84 | -16.67 p<0.001 |
| MAV (km/h) | 12.53 ±0.54 |
10.38 ±0.57 |
-17.15 p<0.001 |
11.1 ±0.47 |
-6.48 p<0.01 |
62.21 | -11.41 p<0.001 |
∆ F/M (%): difference between male and female students expressed in % of the value of male subjects. ∆ F/wM (%): difference between weighted male and female subjects expressed in % of the value of weighted male subjects. ∆ wM/M (%): difference between weighted male and male subjects expressed in % of the value of male subjects.
Disclaimer/Publisher’s Note: The statements, opinions and data contained in all publications are solely those of the individual author(s) and contributor(s) and not of MDPI and/or the editor(s). MDPI and/or the editor(s) disclaim responsibility for any injury to people or property resulting from any ideas, methods, instructions or products referred to in the content. |
© 2023 by the authors. Licensee MDPI, Basel, Switzerland. This article is an open access article distributed under the terms and conditions of the Creative Commons Attribution (CC BY) license (http://creativecommons.org/licenses/by/4.0/).
Copyright: This open access article is published under a Creative Commons CC BY 4.0 license, which permit the free download, distribution, and reuse, provided that the author and preprint are cited in any reuse.


