Preprint
Article

Disruptions in the Pandemic COVID-19 in the Supply Chains of the Automotive Industry as Crucial for the Polish Economy

Altmetrics

Downloads

174

Views

70

Comments

0

A peer-reviewed article of this preprint also exists.

Submitted:

20 November 2023

Posted:

22 November 2023

You are already at the latest version

Alerts
Abstract
The purpose of this article is to present the COVID-19 pandemic disruptions occurring in the supply chain of automotive companies, taking into account the type of business. The specific objectives are: to identify and characterise the types of enterprises operating in automotive supply chains, to identify changes during the pandemic in automotive enterprises, depending on the type of activity, to show disruptions in automotive supply chains and ways to counteract these disadvantages depending on the type of activity. Automotive enterprises operating in Poland were selected for the study purposefully. A random selection method was used to select 500 automotive companies for the study. The data sources were surveys conducted in June 2023 among 500 enterprises in the form of a face-to-face telephone interview. Automotive companies experienced supply chain disruptions, regardless of the type of business. Most often, these were caused by lockdowns and official closures, low stocks of materials and products, and problems with employees. There was no difference by type of business. Disruptions were most often short-lived, up to 1 year. Companies countered disruptions by using mostly operational measures, which were short-lived. Only a small percentage of operators made strategic decisions and countered disruptions over a longer period. The scale of these actions was greater among manufacturers than among dealers and car service companies.
Keywords: 
Subject: Business, Economics and Management  -   Business and Management

1. Introduction

1.1. The importance of logistics and supply chains

Business today is changing rapidly. This is influenced primarily by the growing demands of consumers and the increasingly widespread use of IT tools. This makes the environment in which a company operates very dynamic. In addition, the dynamics of these changes are accelerating. All this makes it necessary for companies to change and use modern solutions to remain in the market and play a significant role in it [1,2,3,4]. Logistics is one area that is subject to rapid change. This is because logistics has a servant function in the core business of a company. Therefore, conscious managers recognise the importance of logistics. Its role is particularly important in a highly competitive market. In such a situation, manufacturers use standard technology and logistics can be an element that will provide a competitive advantage [5,6,7]. Logistics should operate according to the 7W principle. The advantage is gained by the company that delivers the right product, in the right quantity, in the right condition, to the right place, at the right time, to the right customer, and at the right (appropriate) price. Logistics can also be defined as the management of goods flows phenomena and processes based on an integrated view of them [8,9]. In general, the task of logistics is to efficiently overcome time and space during the execution of the flow of goods. It should also be emphasised that logistics is linked to many functional areas in a company, such as production, marketing, and accounting. Transport and warehousing seem to be the most important logistics activities [10]. However, other types of services provided to companies and individual customers cannot be marginalised, such as just-in-time deliveries for manufacturing companies or courier parcels for individual customers ordering products from online shops. Logistics is essential for the smooth functioning of the economy and society [11,12,13].
Logistics is essential to the proper functioning of commodity supply chains, especially those with a global character [14,15,16]. Global supply chains (GSCs) are evolving towards an increasing integration of services, finance, retail, manufacturing and distribution. This is all made possible by better transport and logistics [17]. The popularity of GSCs is primarily due to cost reductions compared to local supply chains [18]. Companies operate globally in both production and distribution spheres [19]. Each company can organise its GSC individually and configure its business processes accordingly. Such actions affect the operational efficiency of the supply chain [20]. One of the key decisions is the location of facilities, i.e. the geographical dimension of supply chains [21].
However, it must be stressed that managing a globally distributed supply chain is a difficult task. First of all, such a chain consists of many links, the facilities do not belong to one owner. In such a situation, it is difficult to coordinate activities on the procurement and distribution side. All these elements affect the complexity of the supply chain and their operational efficiency [22]. Meanwhile, there have also been efforts to ensure the security of supply chains and the associated fast and reliable delivery of a wide range of goods [23]. However, no scenario seems to have envisaged a global pandemic that would destabilise social and economic life, including global supply chains.

1.2. Impact of COVID-19 on logistics and supply chains

Changes in logistics activities as a result of COVID-19 did not affect all segments of the business. For example, in the first months of the pandemic, only freight transport increased, while passenger transport decreased [24]. For example, the situation of global passenger air transport was closely linked to the rate of disease growth [25]. Overall, the first year of the pandemic was the most difficult. In the second year, adaptation measures were put in place to partially recover lost passenger traffic. For freight transport, the blockade on the European economy had a negative impact on the short-term operations of transport companies [26]. In the long term, the situation was favourable because, for example, the number of kilometres travelled in road transport increased.
Logistics also benefited from changing shopping habits and preferences, as a result of the shift of sales to the internet [27]. The benefits affected transport companies, but also those involved in renting warehouse space [28]. A number of research findings confirm the close link between the dynamic development of e-commerce services and the COVID-19 pandemic, as online shopping grew during a period of increased incidence. As a result, logistics companies handling such sales experienced a very large increase in revenue [29].
The growth of the e-commerce market during the pandemic was closely linked to the increase in the volume of courier services provided. New services developed specifically for the COVID-19 pandemic were often created [30]. A positive effect of the pandemic was the acceleration of widespread digitalisation. Customers’ needs and expectations for ease of shopping and greater flexibility have also increased [31]. As a rule, the pandemic had a positive impact on the financial performance of logistics companies. Of course, there have been negative situations, but these have affected a smaller number of companies and those that have not implemented adaptation measures [32].
Today, all sectors of the economy are interconnected by a complex network of supply chains and logistics [33]. Therefore, expectations for logistics during the pandemic were very high. Several studies have highlighted the significant impact of the COVID-19 pandemic on supply chain and production operations. The consequences were global in scope [34]. The search for innovative approaches to supply chain remediation has become an important issue [35]. In general, research in the area of supply chains was focused on several issues. In particular, the impact of the COVID-19 pandemic on supply chain performance was studied, as well as resilience strategies for impact management and chain recovery. The role of technology in implementing resilience strategies and supply chain sustainability was also important [36]. The global reach of the pandemic means that all nodes (supply chain members) as well as supply chain linkages were affected [37]. The pandemic in its various is phases included border closures, blockages of supply markets, disruptions to vehicle movements and international trade, and labor shortages. As a result of such situations, the efficiency of supply, transport, and production has decreased. In such challenging times, it is important to increase supply chain resilience [38]. One way may be to shorten supply chains through renewed strategies that increasingly focus on relocation and backshoring [39]. Other authors pointed to the need to improve the flexibility of production capacity [40], or the importance of the logistics system [41]. Overall, however, the consensus was that the COVID-19 pandemic was a lesson in answering the questions of what kind of resilience and robustness to adopt in the supply chain to help companies return to smooth operations [42,43,44].

1.3. The impact of COVID-19 on the automotive industry

The automotive industry was an industry that was heavily affected by the consequences of the COVID-19 pandemic. These consequences were particularly evident during the first wave. Problems in the supply chains of the European automotive industry resulted from the closure of Chinese factories [45]. In Europe, closures of car manufacturing factories occurred between March and May 2020. During this time, on average, factories were closed for 30 days [46]. This caused consequences in terms of reduced revenues and costs incurred. According to estimates, there was a drop in car production in the EU of around 22.3% in 2020, which meant large losses [47]. Even after the factories opened, reductions in the number of people working were necessary, the plants were not fulfilling their production potential. This was due to the need to maintain hygiene, distance, and safety measures. On the other hand, the demand for cars also decreased [48]. The demand reduction occurred at the beginning of the pandemic and especially during the second wave from November 2020. At that time, new blockades and restrictive measures were introduced in EU countries, including the closure of car dealerships. Of course, there were differences between EU countries, but the second wave was less severe for the automotive industry [49].
Overall, the COVID-19 pandemic had a negative impact on the supply chains of the entire automotive industry. Major problems affected the operations of many Original Equipment Manufacturers (OEMs), which were dependent on manufacturers. There were, of course, differences in individual car components, which would need to be investigated [50]. An example of major constraints and problems was the battery supply chain. In this case, the problem was a very high dependence on suppliers from China, where production was stopped and many lockdowns were introduced [51].

1.4. Justification, aims and structure of the article

The importance of the automotive industry in Poland can be assessed based on data from before the crisis caused by the COVID-19 pandemic. At the time, it generated 8% of the Polish GDP and, at the same time, 21% of exports. This meant that in terms of the value of exports of car parts and accessories, Poland ranked 10th in the world. The presented data allow us to conclude that the development of the automotive industry is an important factor influencing economic growth in Poland. In such a situation, the proper condition of enterprises operating in this industry is of great importance. This has a direct and indirect impact on the competitive position of the Polish economy. In such a situation, it is reasonable to examine the disruption during the pandemic in the automotive supply chains, using the example of companies from Poland. The COVID-19 pandemic caused disruptions in the supply chains of various activities. It is important to identify what kind of disruptions occurred in the automotive industry and how they influenced decision-making. Research knowledge in this area is not limited. The authors have not yet encountered research on such a large group of companies in the automotive industry. Usually, studies focus on a selected company or a few companies. The proposed research fills a research gap and allows to identify the disruptions occurring and how to respond to them in automotive supply chains.
The article’s main objective is to present the COVID-19 pandemic disruptions occurring in the supply chain of automotive companies, taking into account the type of business involved.
The specific objectives are:
  • identification and characterisation of the types of companies operating in automotive supply chains,
  • identification of changes during a pandemic in automotive companies, depending on the type of business
  • demonstrating disruptions in automotive supply chains and how to counteract these disadvantages depending on the type of business.
The article seeks the answers to one research hypothesis:
Hypothesis 1.
Supply chain disruptions during the COVID-19 pandemic in the automotive industry varied by type of business, with more frequent disruptions in businesses at the beginning of the supply chain than at the end.
The organisation of the work is as follows: Chapter 1 provides an introduction to the topic. The importance of logistics and supply chains in business and the impact of COVID-19 on the functioning of logistics and supply chains were presented in turn. An important aspect was also to determine the impact of COVID-19 on the automotive industry. The section also includes the rationale and objectives of the article. Section II proposes methods to identify disruptions occurring in supply chains in different types of automotive companies. In Section 3, the research findings were presented. In Section 4, the reference is made to other research results that dealt with the relationships tested. Furthermore, the main conclusions of this paper can be found in Section 5.

2. Materials and Methods

2.1. Data collection, processing, and limitations

Automotive companies operating in Poland were selected for the study in a purposive manner. Subsequently, 500 automotive enterprises were selected for the study using the random sampling method. The enterprises were randomly drawn from a database by an IT programme. The drawn enterprises constituted a large research sample. There were approximately 2,000 enterprises operating directly in the automotive industry and several thousand with indirect links. The data source was 500 questionnaires conducted in June 2023 in the form of a face-to-face telephone interview. The interview questions were prepared in advance and generally contained closed answers. Few questions had open-answer options. Company participation in the survey was voluntary. The most frequent participants in the interviews were the owners of the company (81% of interviews), followed by logistics staff (10%), administrative staff (7%), and accounting staff (2%).
The data obtained in the interviews were collected in an Excel form and then coded and processed. The results of the surveys are presented in an aggregated manner, without disclosing data on individual enterprises. The results obtained allow the shares of individual responses to be determined for specific types of enterprises, by type of business. The data were aggregated by three types of activity, i.e. enterprises engaged in the production of cars and other vehicles and their components, entities engaged in the sale of vehicles and vehicle parts, and enterprises engaged in vehicle maintenance and repair.

2.2. Applied methods

The research was divided into stages. In the first stage, the focus was on presenting basic information about the surveyed companies, taking into account the type of business. This method of aggregation was used in all phases of the study. At the same time, in all phases of the research, the relationship or independence between the type of activity carried out (production, sales, repair and servicing) and the distribution of specific responses was checked. The aim was to determine whether the type of activity carried out conditioned the disruptions occurring in the supply chains and how to respond to such irregularities. To this end, Pearson’s χ2 independence test was used for the study. It is categorised as a statistical inference method. It is also a non-parametric test, so it does not depend on the distribution of the population under study. It can be applied in the case of a normal distribution, as well as in all other cases. Pearson’s χ2 test of independence is particularly useful, when the two survey variables are measured on nominal scales and the results of the measurements are presented in a matrix (contingency table) with any number of rows and columns. The χ2 test of independence in our case was used only for the analysis of the two characteristics of the variables. In the calculation procedure, after creating a contingency table for the observed variables, a table with expected (theoretical) counts is established assuming that the variables are independent. The individual expected counts indicate how many respondents should represent a given research condition in order for the postulate of independence of variables presented in the null hypothesis (H0) to be fully satisfied. The formula [52,53] is used to calculate theoretical counts (Eij ):
E i j = f ( i . ) · f ( j . ) n
Where:
n - sample size,
f (i) - sum of edge counts for row i,
f (j) - sum of the marginal abundance for column j.
The values of the mentioned data are found in the table of observed counts created at the beginning of the calculation procedure. The calculation of the value of the χ2 statistic based on the formula [52,53] follows:
χ 2 = Σ i = 1 r Σ j = 1 k ( O i j E i j ) 2 E i j
Where:
O i j - abundance observed,
E i j - expected (theoretical) numbers,
r - rows, number of categories of the trait under study,
k - columns, number of categories of the trait under study,
i - the number of the line in question,
j - the number of the column in question.
The final step in verifying statistical hypotheses with the χ test2 is to compare the calculated value of the χ2 statistic with the critical value ( χ α 2 ). The critical values for the adopted significance level (e.g. α = 0.05) and the corresponding degrees of freedom are read from special chi-square distribution tables [52]. The degrees of freedom (ss) for the study variables are determined according to the following rules [52]:
- if r > 1 and k > 1, then ss = (r - 1)(k - 1);
Based on χ2 values i χ α 2 hypothesis verification is carried out. There are two hypotheses in the χ2 test of independence: the null hypothesis (H0 ) and the alternative hypothesis (H1 ), formulated as follows:
H0: the variables under study are independent.
H1: the variables under study are dependent.
If the calculated χ2 value is less than the critical value read (χ ≤ 2 χ α 2 ) then there are no grounds to reject the null hypothesis, i.e. the variables are found to be independent, while in the opposite situation, when χ2 > χ α 2 , the null hypothesis should be rejected, which means that the variables under study are dependent [54].
In the second stage of the research, sourcing, and diversification directions in this regard were identified. This is important to establish the scale of companies’ links with the closest cooperating companies in the supply chain. Such direct links can show the scale of dependence on suppliers and the level of complexity of supply. As a rule, a larger number of suppliers requires more sophisticated logistics management and, on the other hand, allows for greater flexibility.
Stage three identified the disruptions occurring in automotive supply chains and how companies responded to these problems. It is important to identify the patterns occurring depending on the type of business.
A limitation of the research carried out was that it was not possible to survey all companies operating in the automotive industry. On the one hand, this would have been time-consuming, on the other hand, costly. Some of the companies could refuse to take part in the research. The study includes the results of research on only selected questions, which is a fragment of the research conducted, but quite significant. Another limitation is the focus only on relationships by type of business. It is planned to conduct in-depth interviews with a smaller number of companies. This extension of the research will make it possible to show the exact actions and ways to counteract supply chain crises in specific automotive companies.

3. Results

3.1. Basic data on the surveyed companies

In the first step, the basic data of the surveyed enterprises were presented. About half of the enterprises were engaged in car maintenance and repair (Figure 1). This was followed by car sales (32% of all enterprises), while the smallest number of enterprises was engaged in car manufacturing (20%). In the case of sales, one can distinguish between wholesale and retail sales of cars, as well as parts and accessories for these vehicles. In turn, production concerned both the production of rubber tyres and tubes, retreading and remanufacturing of rubber tyres, production of engines for motor vehicles, production of cars, buses, lorries, motorbikes, and other vehicles, production of bodies for motor vehicles, production of trailers and semi-trailers, production of electrical and electronic equipment for motor vehicles, production of other parts and accessories for motor vehicles. In general, the structure of the enterprises surveyed is in line with that found in the population as a whole. The smallest number of enterprises are directly or indirectly involved in manufacturing. The next links related to wholesale and retail trade are represented in greater numbers. Car maintenance and repair enterprises are the most numerous. This type of service is provided after the sale and increases as the life of the vehicle increases. There are maintenance services related to the replacement of parts, and operating fluids, but also related to ad hoc repairs, and changing tyres for summer or winter.
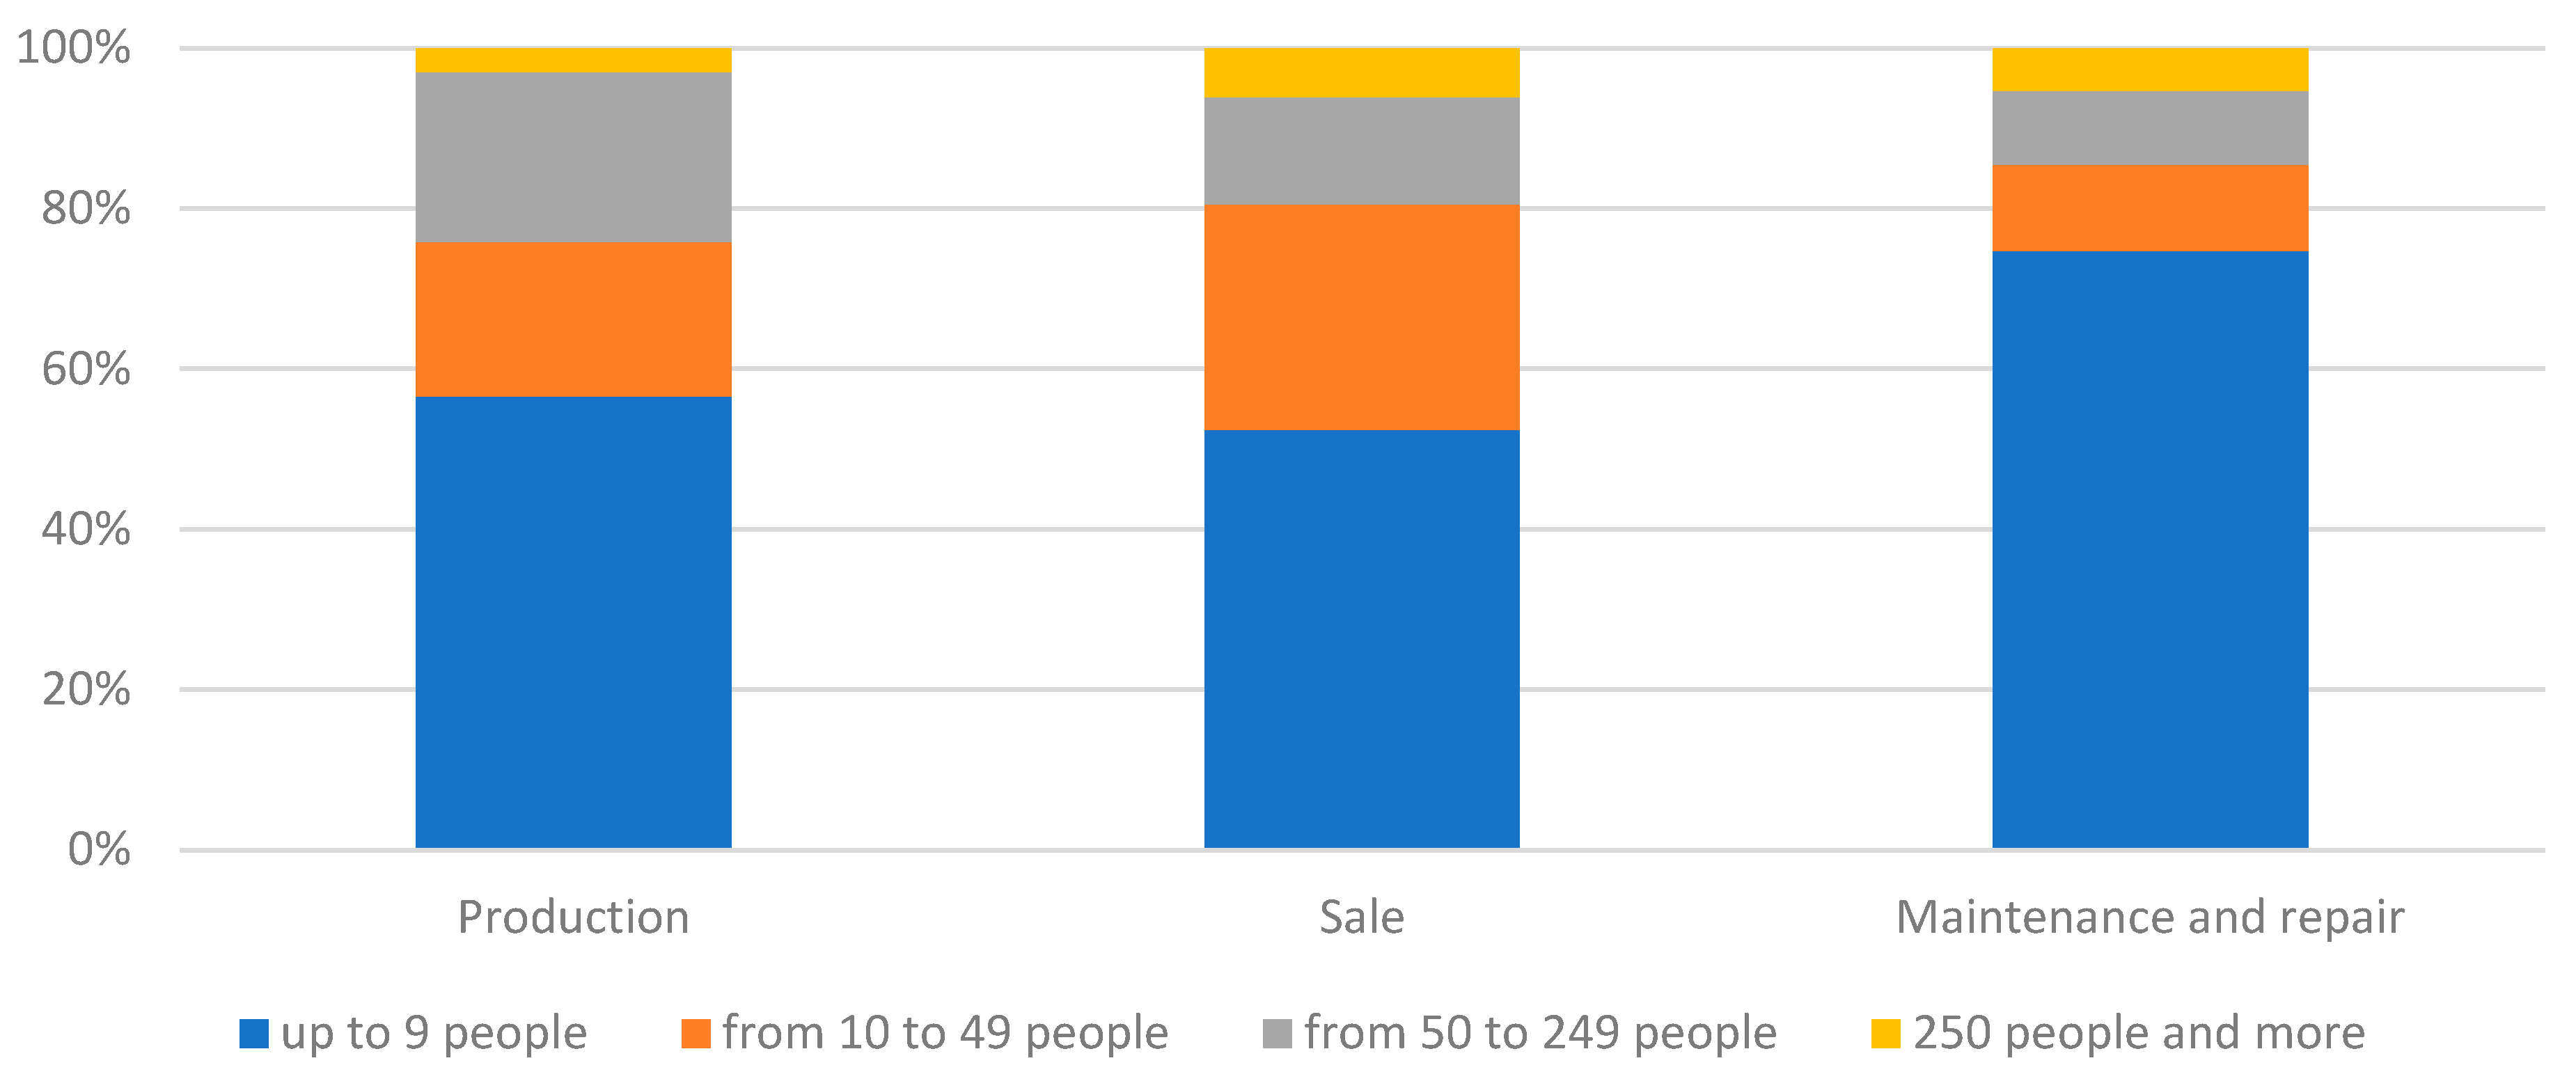
Another aspect is the size of the enterprise, which can be determined, among other things, by the number of employees (Figure 2). In general, micro-enterprises with up to 9 employees prevailed in all groups. The highest share of micro-enterprises was found in the group of entities engaged in vehicle maintenance and repair (75%). In contrast, the share of small enterprises with 10 to 49 employees was low in this group. In contrast, small enterprises accounted for as much as 28% of all enterprises involved in sales. Within manufacturing enterprises, it is important to note the high share of medium-sized enterprises with 50 to 249 employees (21%). In general, the distribution is as expected. In the manufacturing group, there is a higher share of large entities. In the subsequent sales-related links, the share of smaller enterprises increases, and the largest share is in the case of enterprises providing after-sales and vehicle repair services. The statistical tests performed confirmed that there was a strong significant relationship between the type of business carried out and the size of the enterprise measured by the number of employees (χ2emp=33.56; χ20.05=12.59; p-value<0.05).

3.2. Organisation of procurement in the companies surveyed

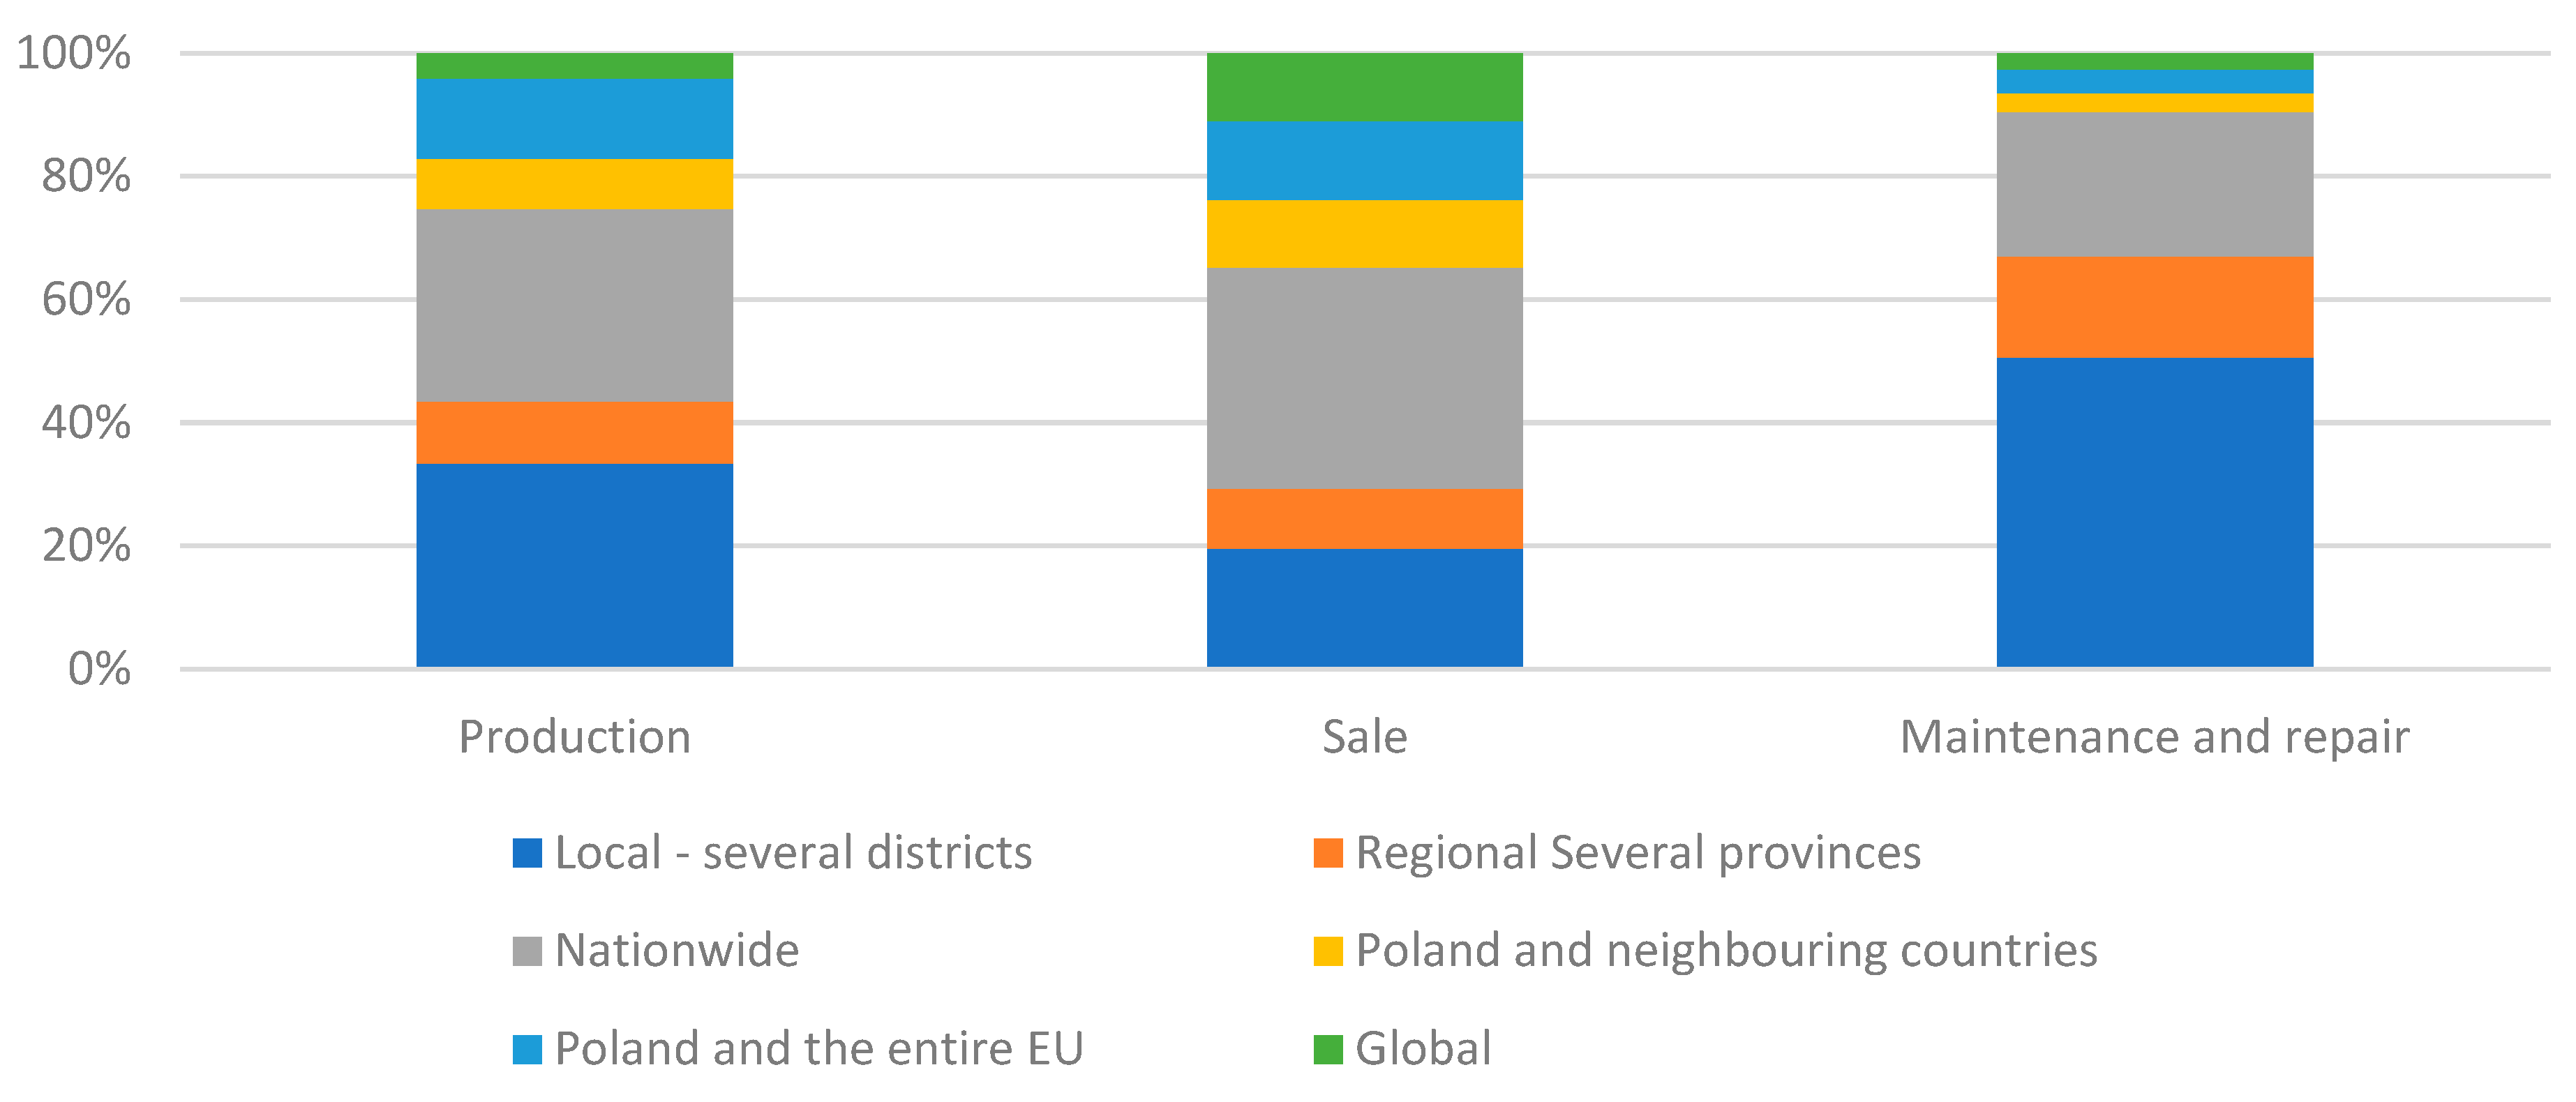
Sources of supply were then examined in terms of their geographical location to the companies surveyed (Figure 3). In general, sourcing from local and national suppliers predominated. In the case of maintenance and repair enterprises, half of the subjects had local sourcing, followed by national (23%) and regional (16%). There was a small proportion of businesses with only foreign suppliers. Interestingly, the structure was similar in manufacturers, but there was a higher proportion of entities with international sourcing. In contrast, the largest number of companies with international sourcing was in the sales group. This is due, for example, to the sale in Poland of cars that are manufactured in other countries or on other continents. Parts and components for repairs can also be sourced from international markets at better prices. The tests performed confirmed that there was a strong significant relationship between the type of business and the company’s supply market (χ2emp=76.55; χ20.05=18.31; p-value<0.05).
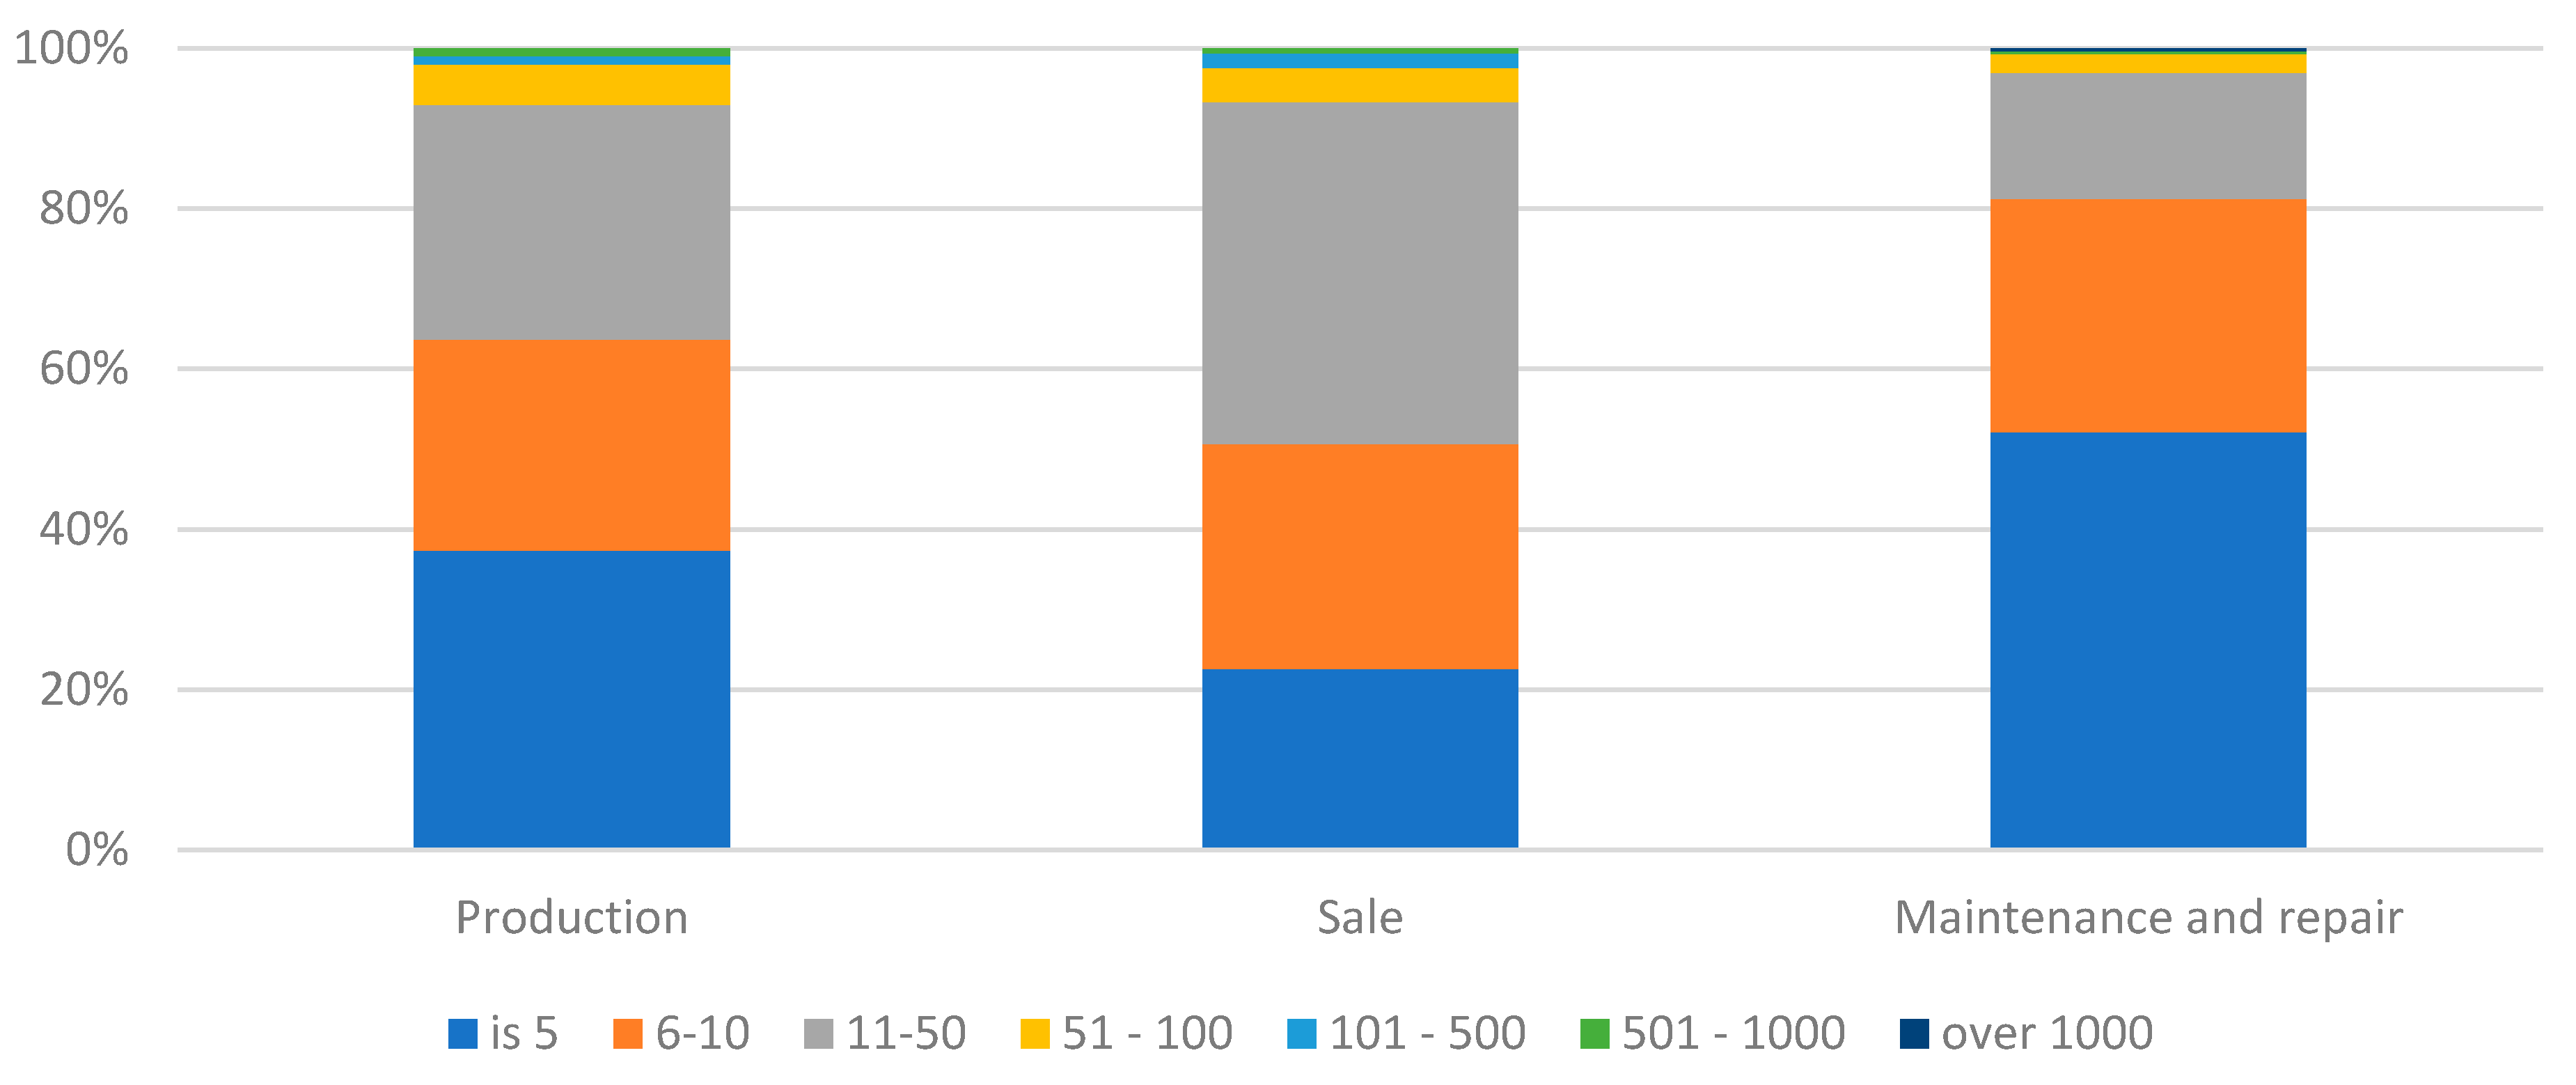
Companies generally used a small number of suppliers (Figure 4). As many as 52% of maintenance and repair businesses had up to 5 suppliers. In contrast, the group of sales operators had the highest number of enterprises with between 11 and 50 suppliers. In the case of car manufacturers, there were both enterprises with up to 5 suppliers (37%), 6 to 10 suppliers (26%), and 11-50 suppliers (29%). In the case of manufacturers, a higher proportion of enterprises with 50 or more suppliers was also expected. In general, however, there was a small proportion of enterprises with more than 50 suppliers. The statistical tests conducted confirmed that there was a strong significant relationship between the type of business and the number of suppliers (χ2emp=60.78; χ20.05=21.03; p-value<0.05).

3.3. Types of disruption in the supply chains of the companies studied

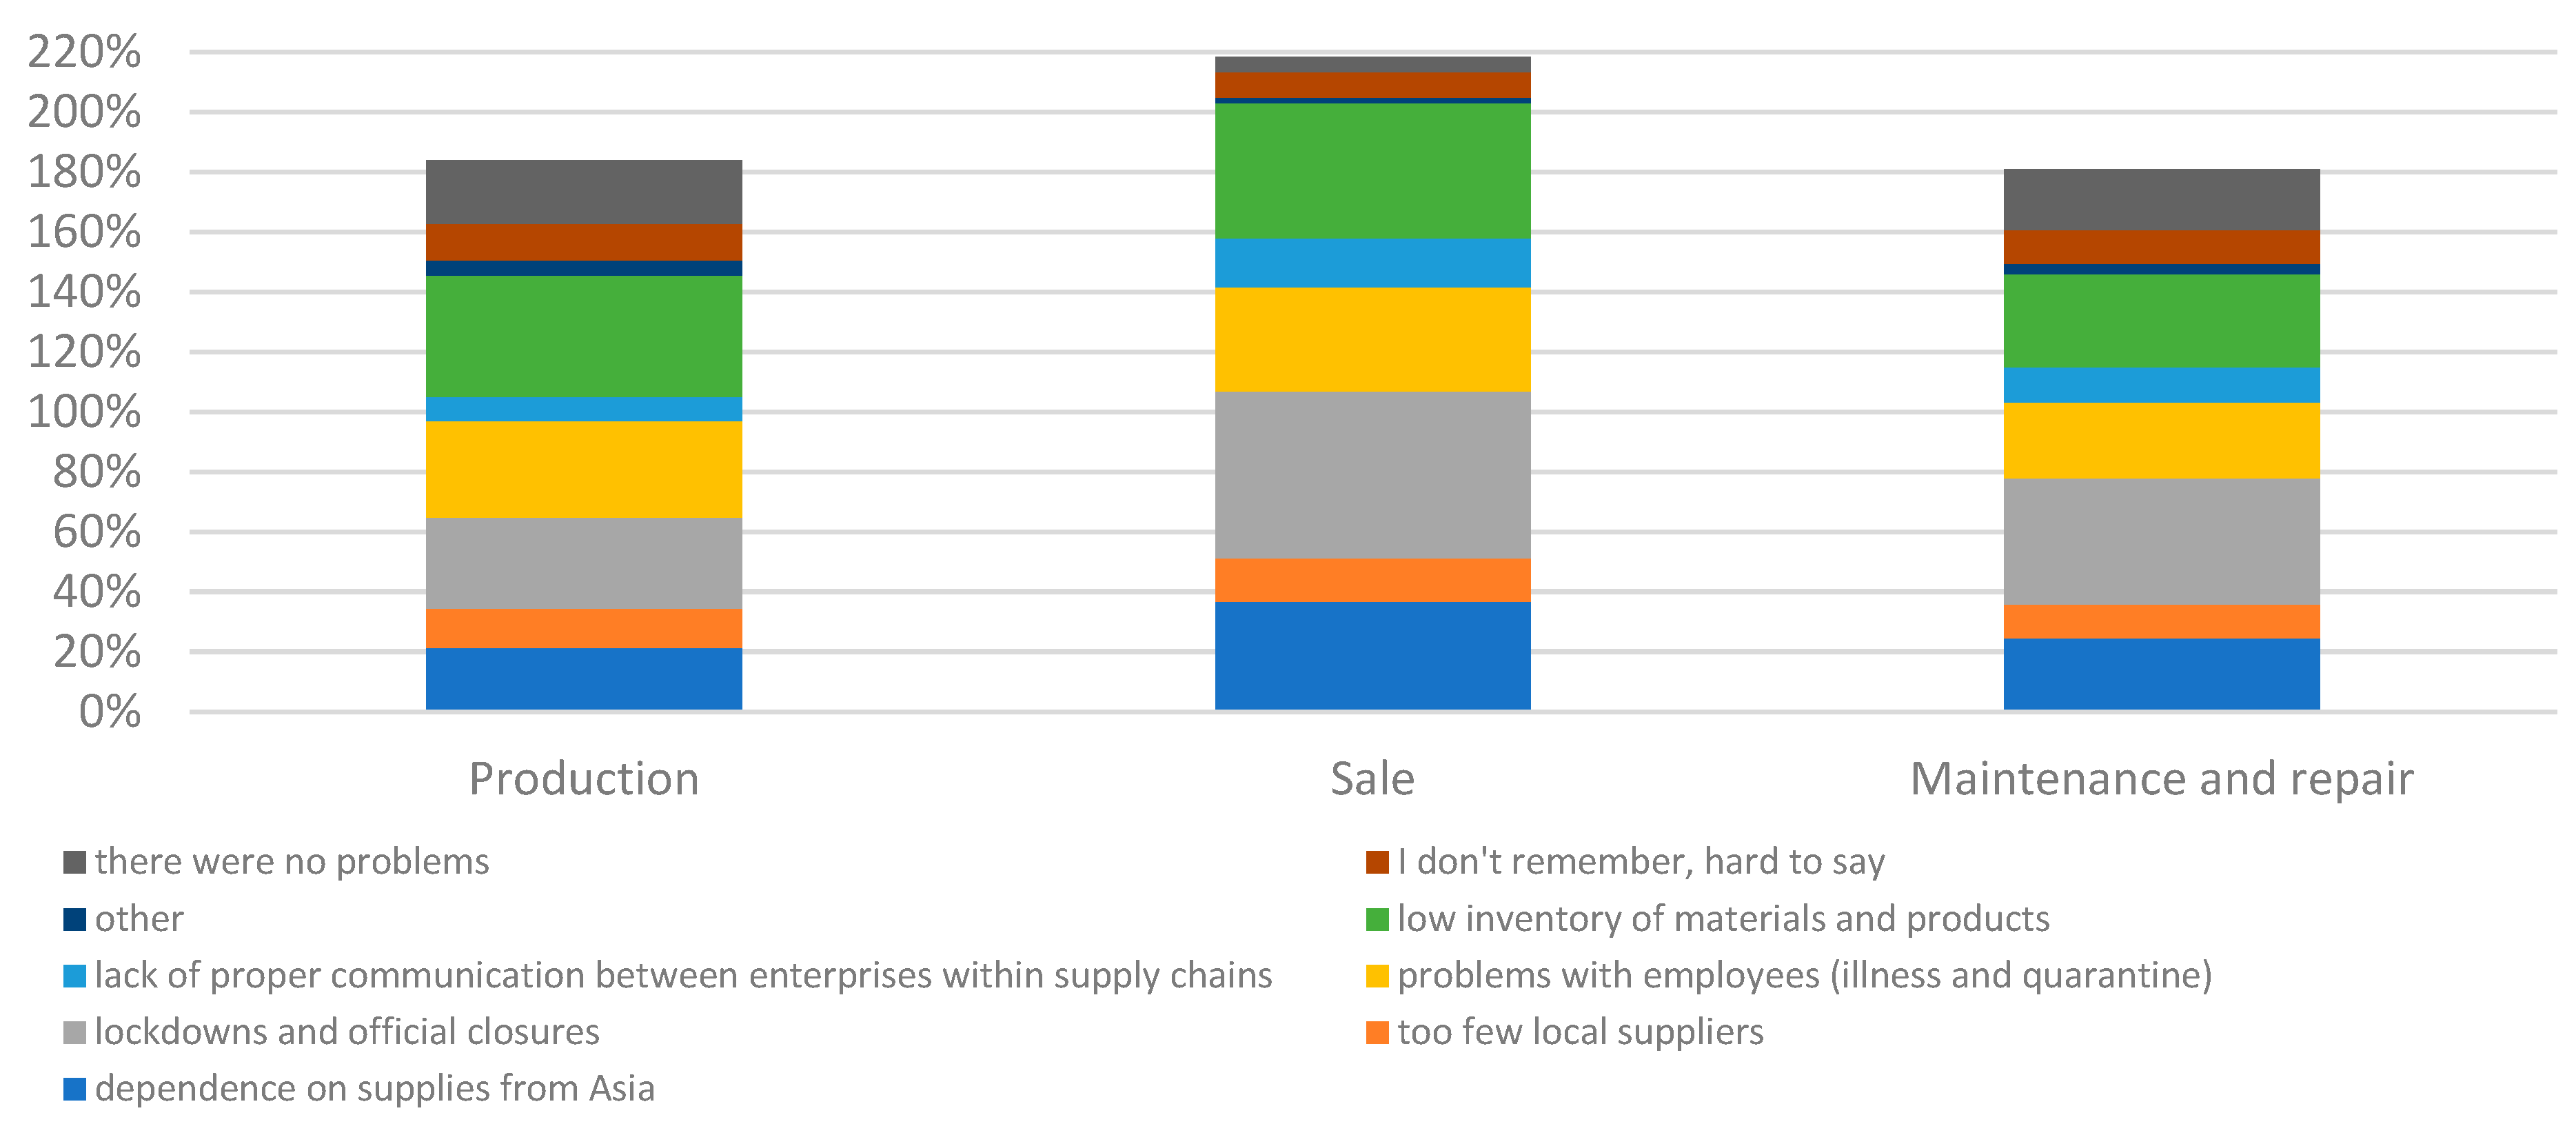
Business representatives also indicated the most important causes of problems occurring in the supply chain during a pandemic (Figure 5). Among the most frequently cited causes were lockdowns and official closures, low inventories of materials and products, and to a lesser extent problems with employees (illness and quarantine), and dependence on supplies from Asia. There were also differences by type of business. Businesses involved in sales largely indicated lockdown problems. These types of businesses were shut down in the second phase of the pandemic. Low stock levels of materials and products were indicated equally often in sales and manufacturing enterprises. In sales companies, dependence on Asian supplies was indicated quite frequently. This mainly referred to problems with the supply of car parts and components, and less frequently to finished vehicles. The statistical tests performed confirmed that there was a significant relationship between the type of business and the causes of supply chain problems (χ2emp=38.27; χ20.05=26.30; p-value<0.05). However, the differences were not very large.
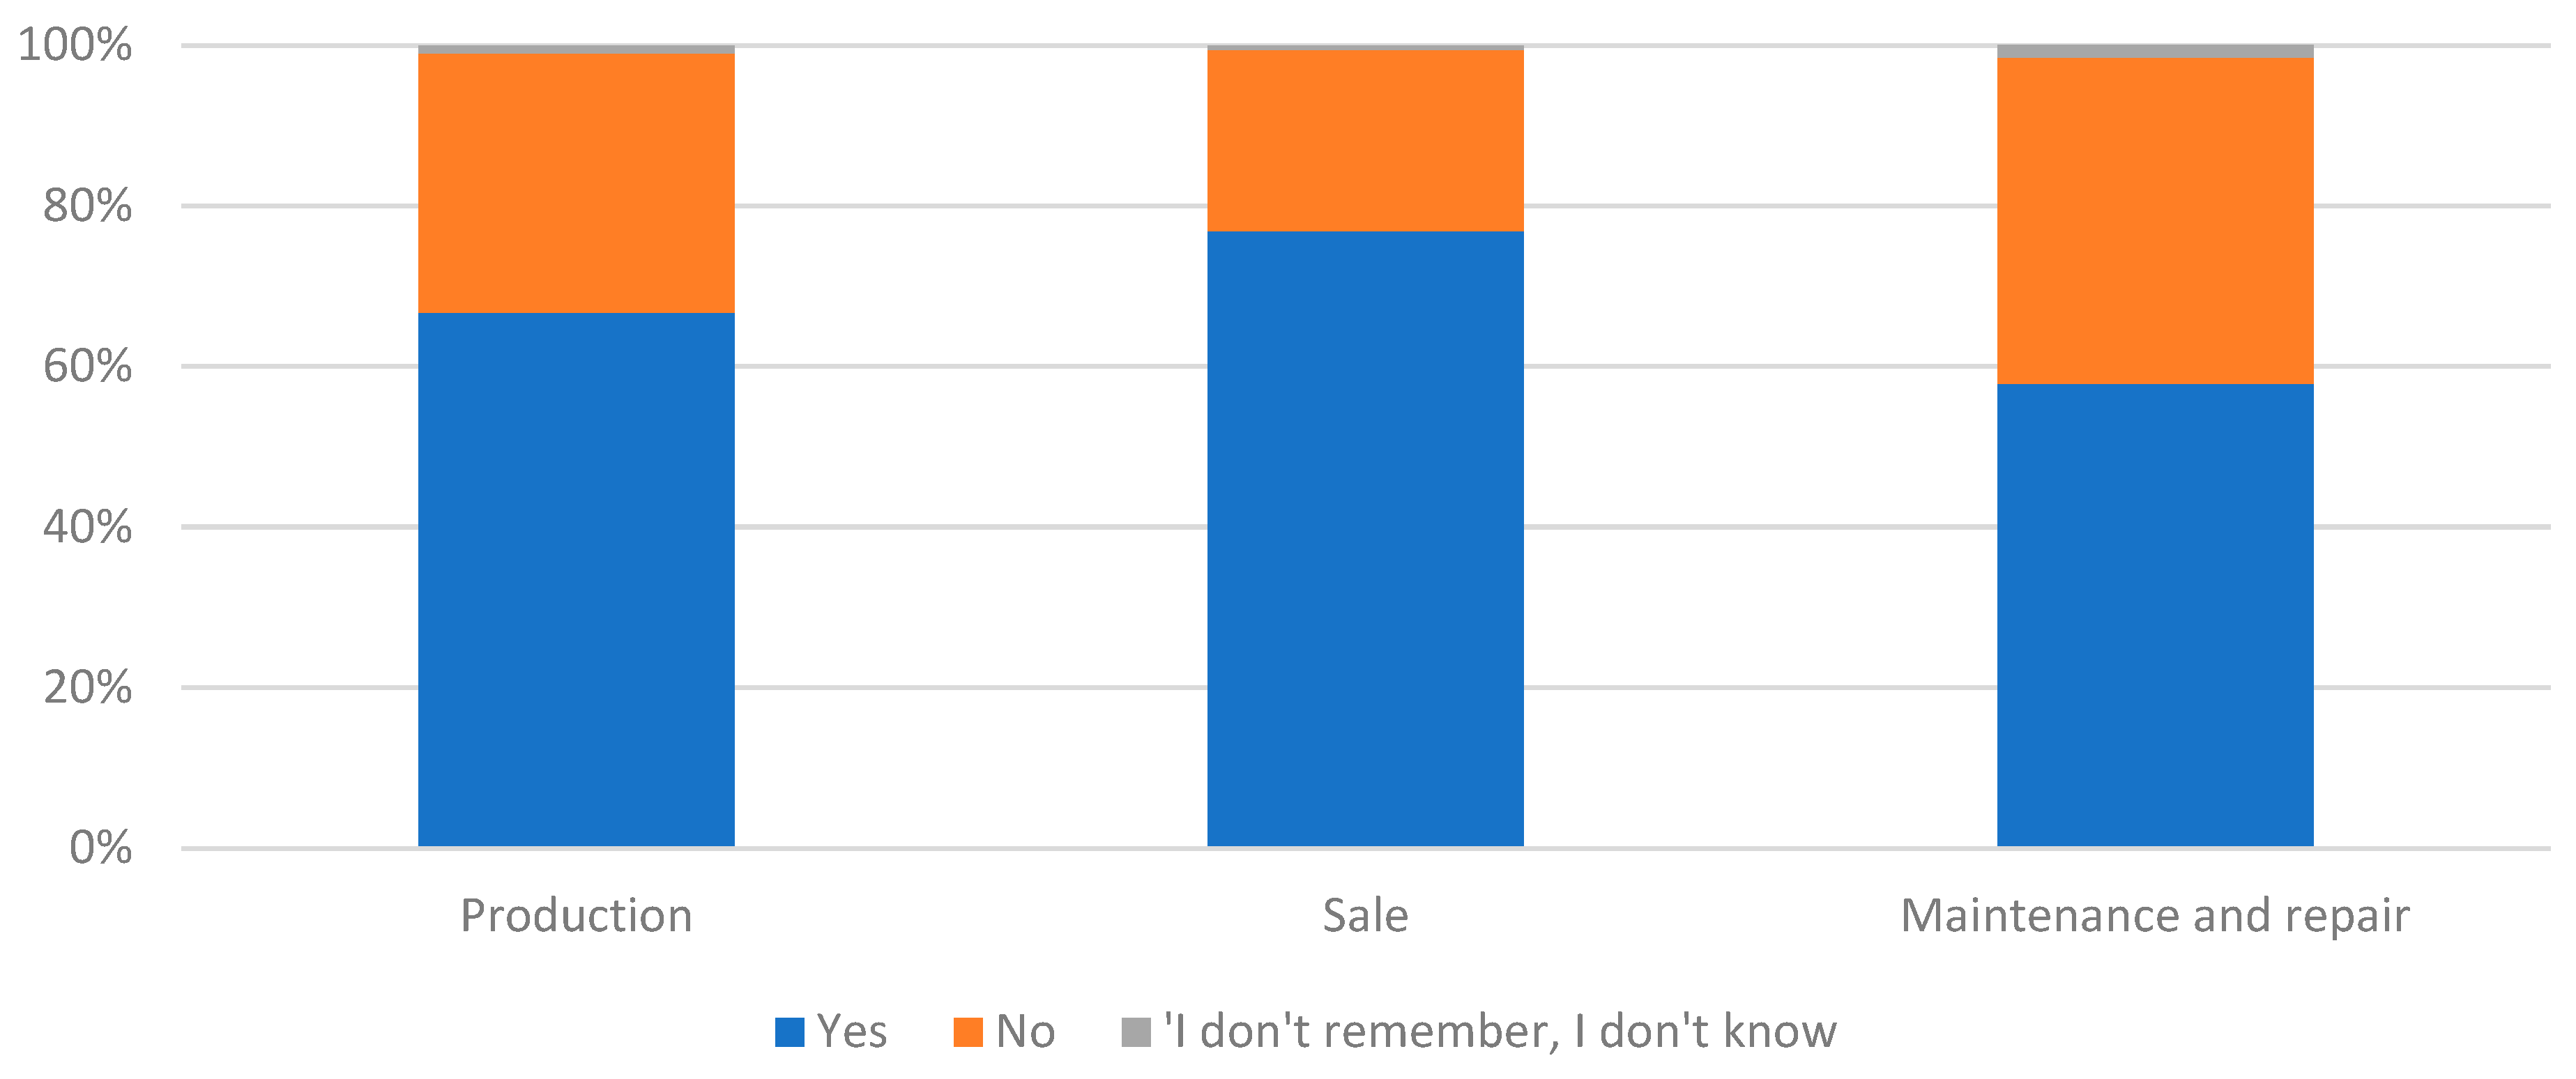
The vast majority of companies experienced disruptions or problems in their supply chains during the pandemic (Figure 6). These could have been different types of problems, such as delays, lack of goods, and price increases. The greatest number of problems were in companies involved in sales, which was also correlated with dependence on Asian suppliers (the largest among the types of businesses surveyed). Relatively the least problems were in vehicle maintenance and repair businesses. This may have been caused by sourcing from local regional and national markets. Statistical tests conducted confirmed that there was a significant relationship between the type of business and the experience of problems in the supply chain (χ2emp=16.74; χ20.05=9.49; p-value<0.05). However, the differences were small.
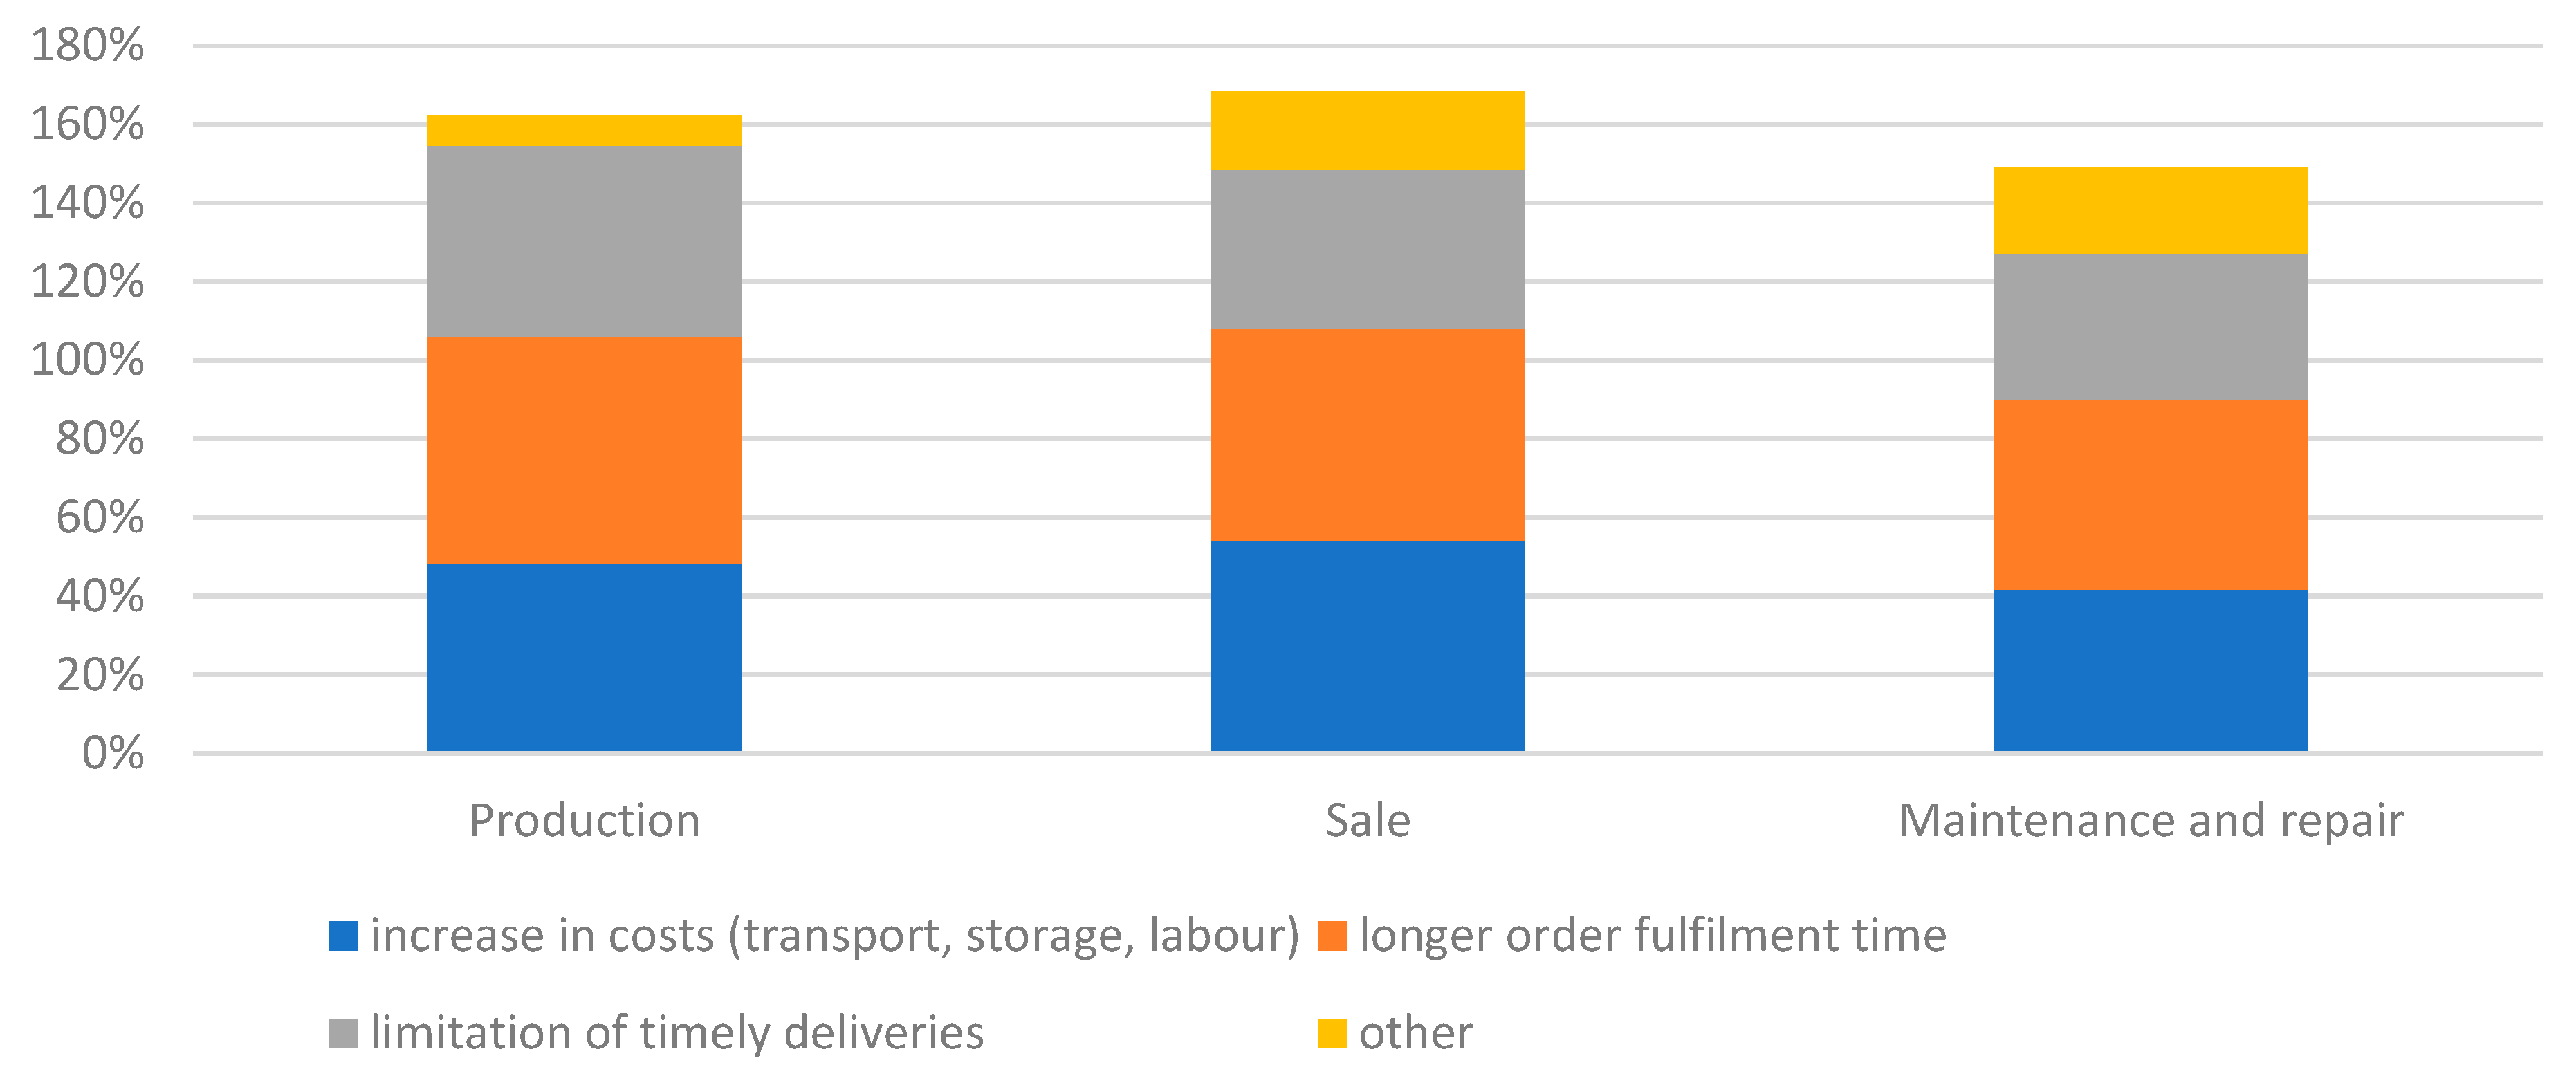
Representatives of the companies surveyed also indicated the types of disruption associated with pandemic supply chains (Figure 7). Across all groups, almost half of the companies indicated longer lead times, as well as increased transport, storage, and labor costs. Of slightly lesser importance was a reduction in on-time delivery. Overall, there were no very large differences between the types of companies. This was also confirmed by the statistical tests performed. It was shown that there was no significant relationship between the type of business and the causes of supply chain problems (χ2emp=8.56; χ20.05=12.59; p-value=0.20). All groups of companies had similar problems with similar intensity.
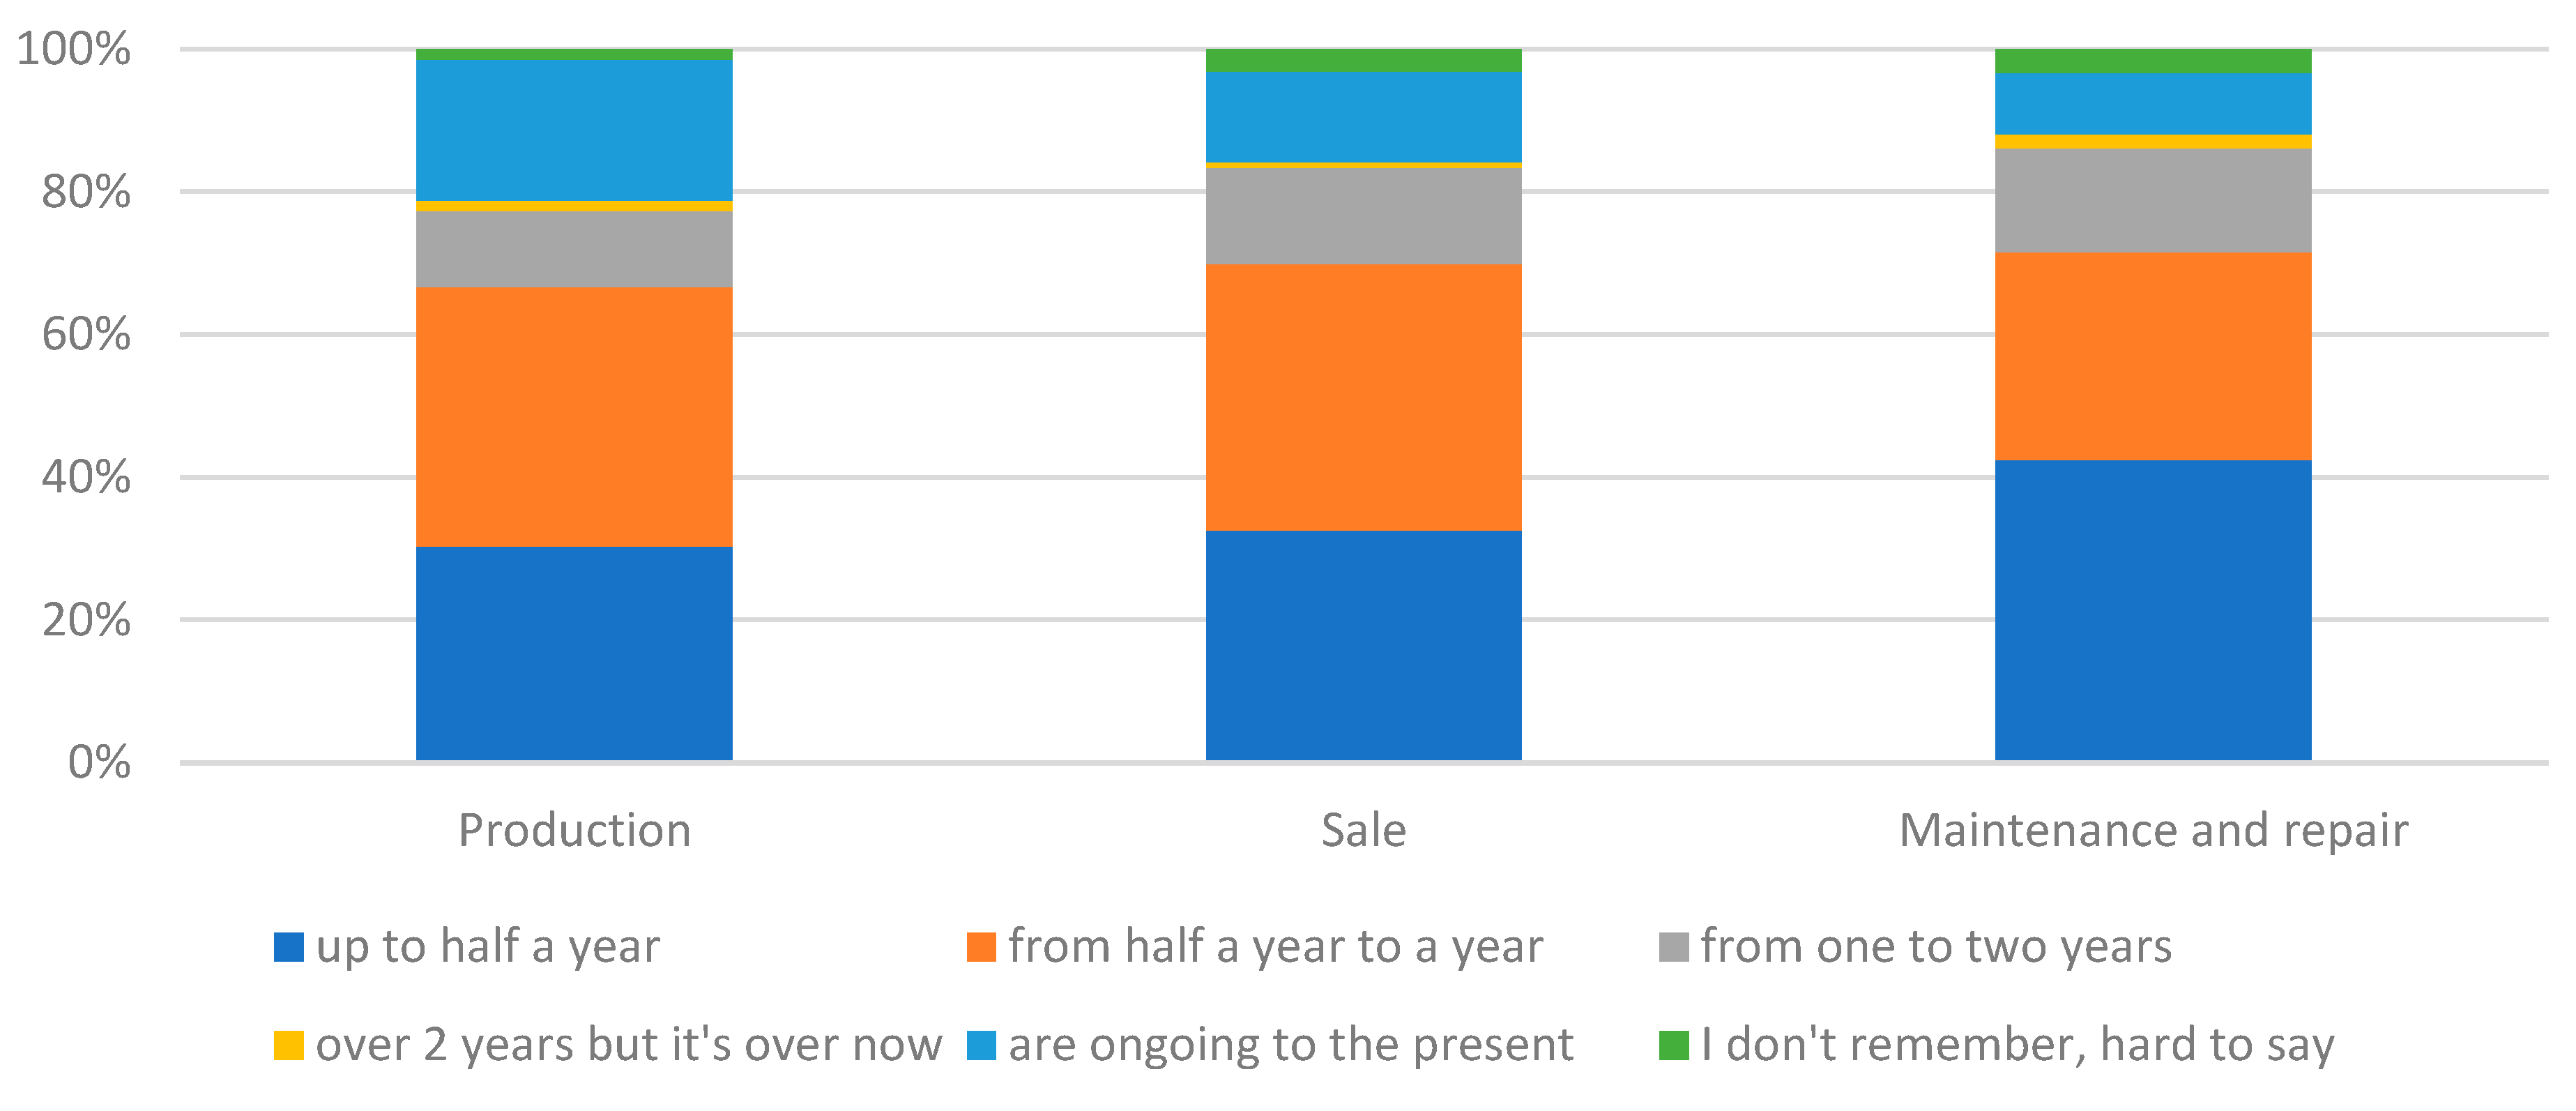
In the companies surveyed, supply chain-related disruptions generally lasted up to six months or up to one year (Figure 8). The period of disruption was particularly short for maintenance and repair enterprises, as the answer of up to six months was indicated by 42% of the entities in this group. In contrast, car manufacturing businesses indicated that these disruptions were now (this was the state at the time the survey was carried out, June 2023). There seemed to be some disparity depending on the actors’ place in the supply chain. Nevertheless, the statistical tests performed showed that there was no significant relationship between the type of business and the duration of supply chain disruptions (χ2emp=11.51; χ20.05=18.31; p-value=0.32). Across all groups of companies, the distribution of the duration of supply chain disruptions was similar.
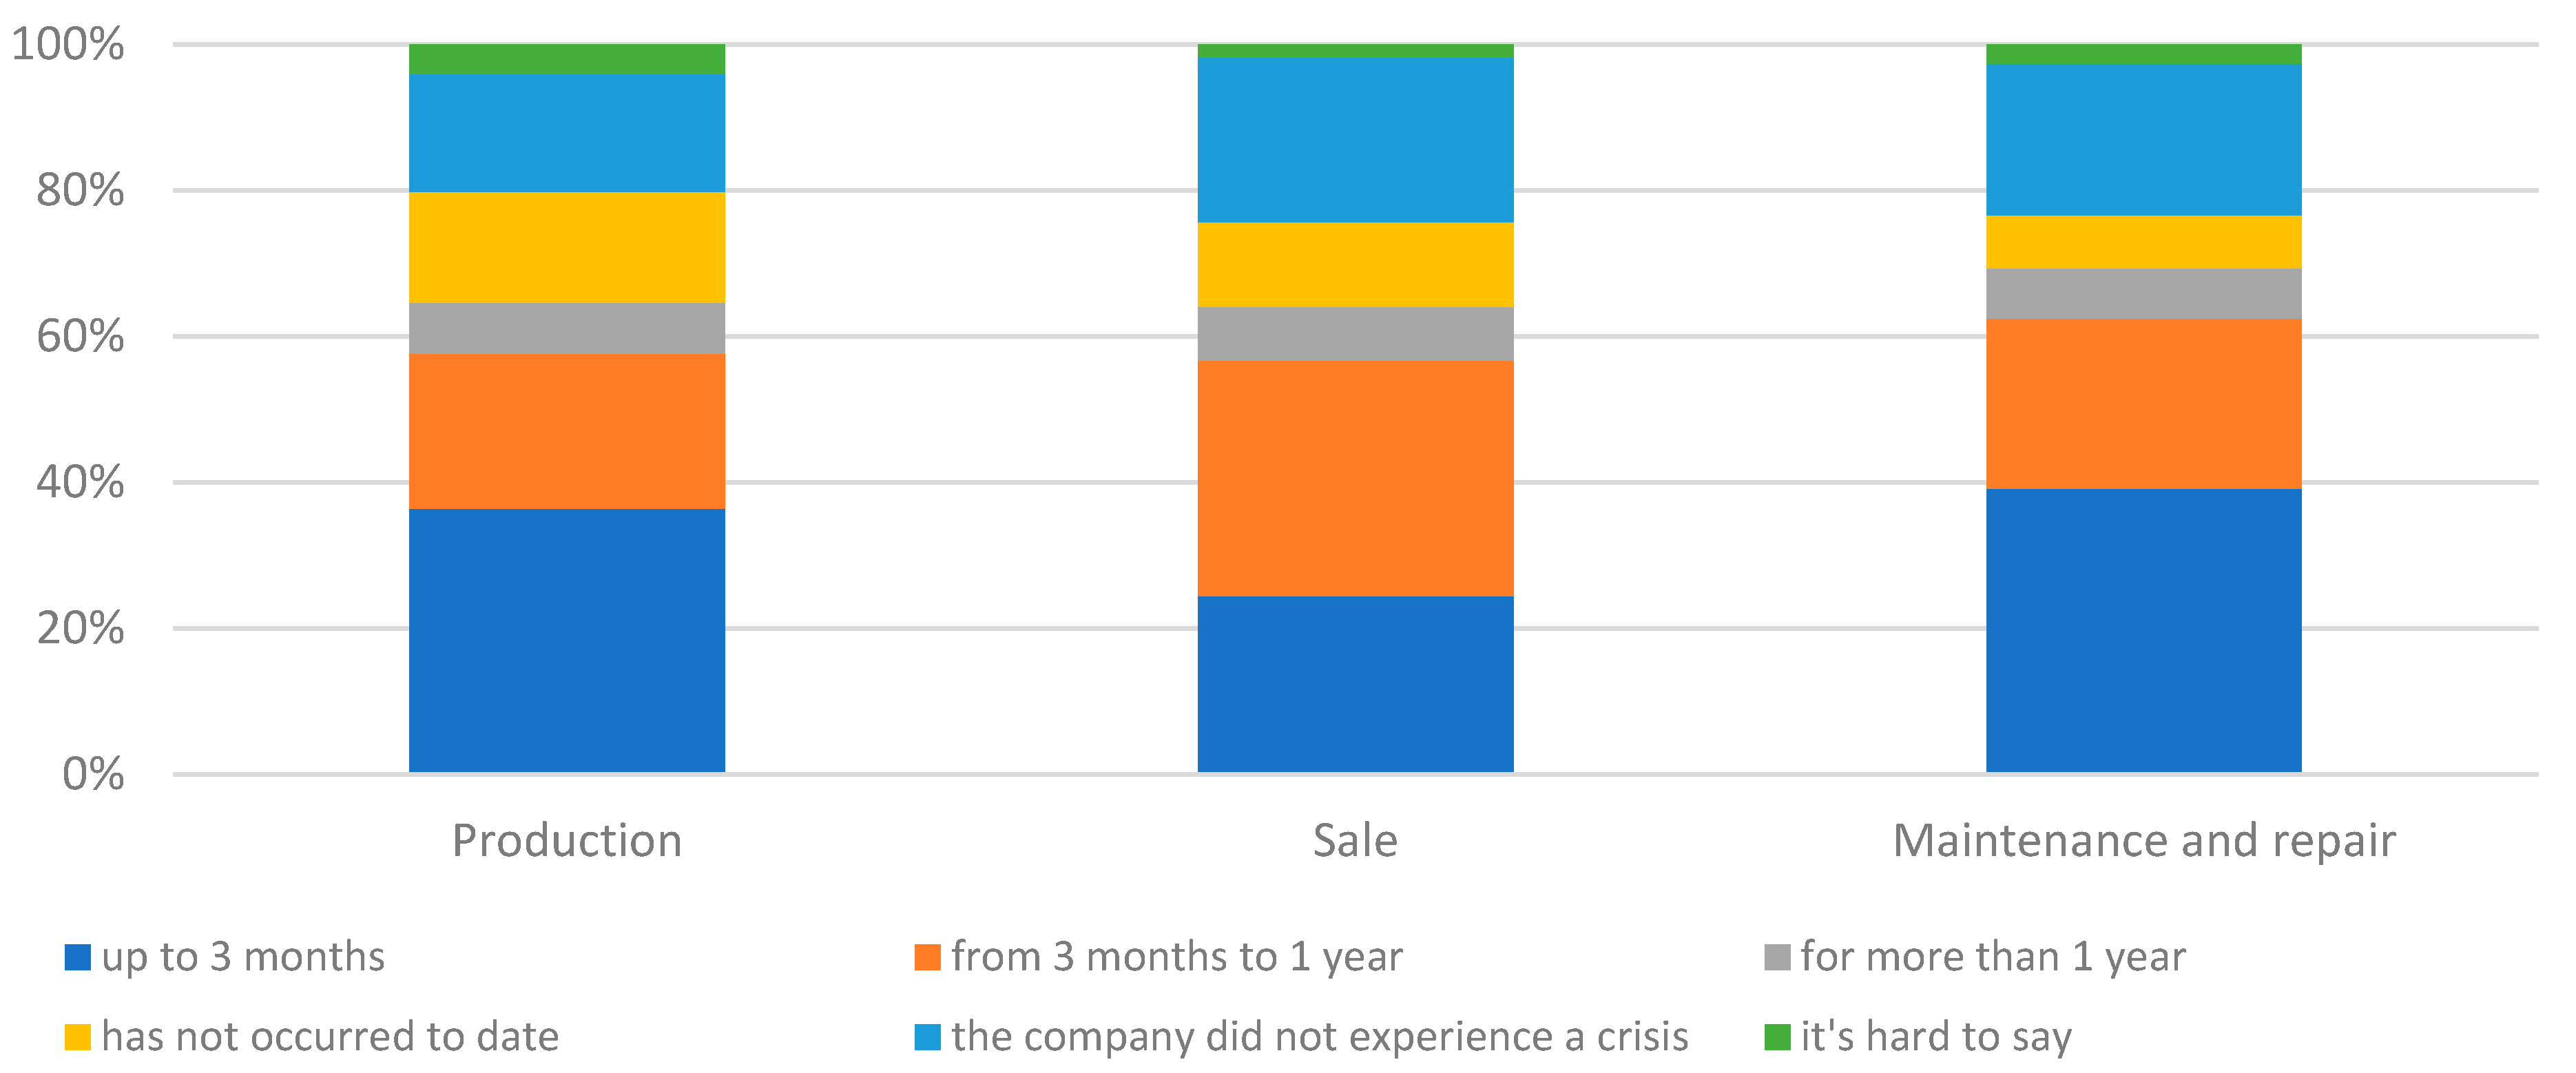
As a control, a question was asked about how long it took for a business to return to pre-crisis activity due to the pandemic (Figure 9). In the group of car manufacturers and maintenance and repair businesses, there was a high proportion of businesses that returned to pre-crisis activity within 3 months (36 and 39% of surveyed businesses respectively). In contrast, in the group of car and parts dealers, most indications were between 3 months and 1 year. In general, the majority of businesses in each group indicated a period of up to 1 year. Some businesses indicated that they were not yet back in business. The largest proportion of this type was for manufacturers. The percentage decreased downstream. The statistical tests performed confirmed that there was a significant relationship between the type of business and the time to return to pre-pandemic activity (χ2emp=18.81; χ20.05=18.31; p-value<0.05). However, the differences were not very large.

3.4. Tackling disruption in automotive supply chains

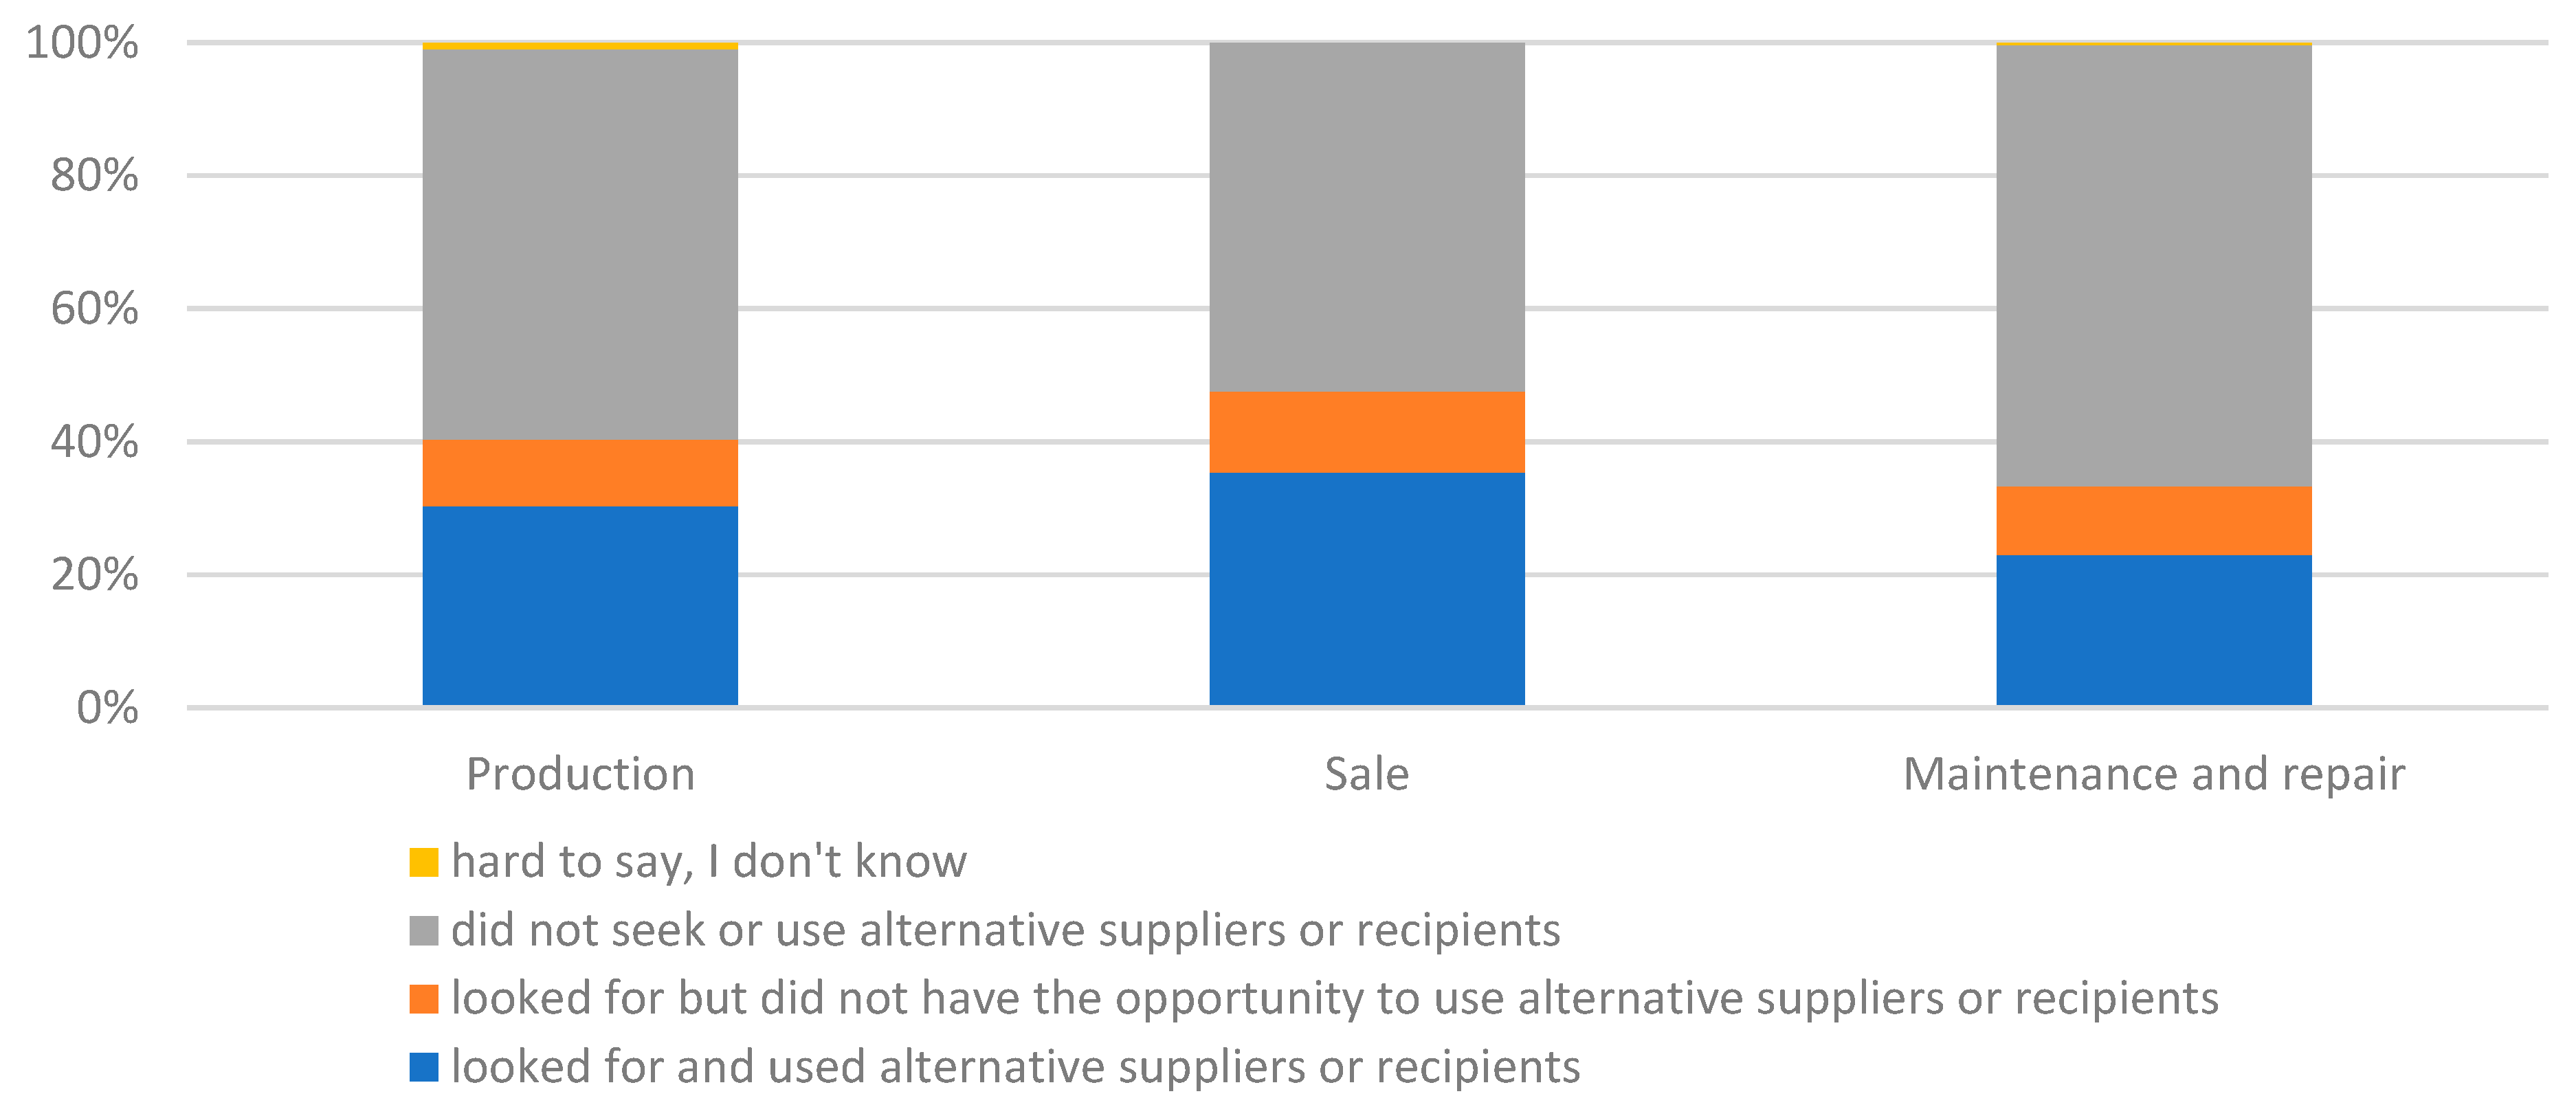
The majority of businesses surveyed most often did not seek and use alternative suppliers or customers (Figure 10). This approach was particularly popular among maintenance and repair businesses (66% of entities). It was less important in enterprises involved in car manufacturing (59%) and car and parts sales (52%). Alternative suppliers or customers were sought and used by 35% of sales businesses, 30% of manufacturing businesses, and only 23% of maintenance and repair businesses. There was therefore some variation in approach. There were also around 10% of each group looking for alternative suppliers but unable to use them. Contracts and over-reliance on a few suppliers may have been a problem. Statistical tests confirmed that there was a significant relationship between the type of business and the type of action taken by the companies during the pandemic (χ2emp=10.58; χ20.05=9.49; p-value<0.05). However, the differences were small.
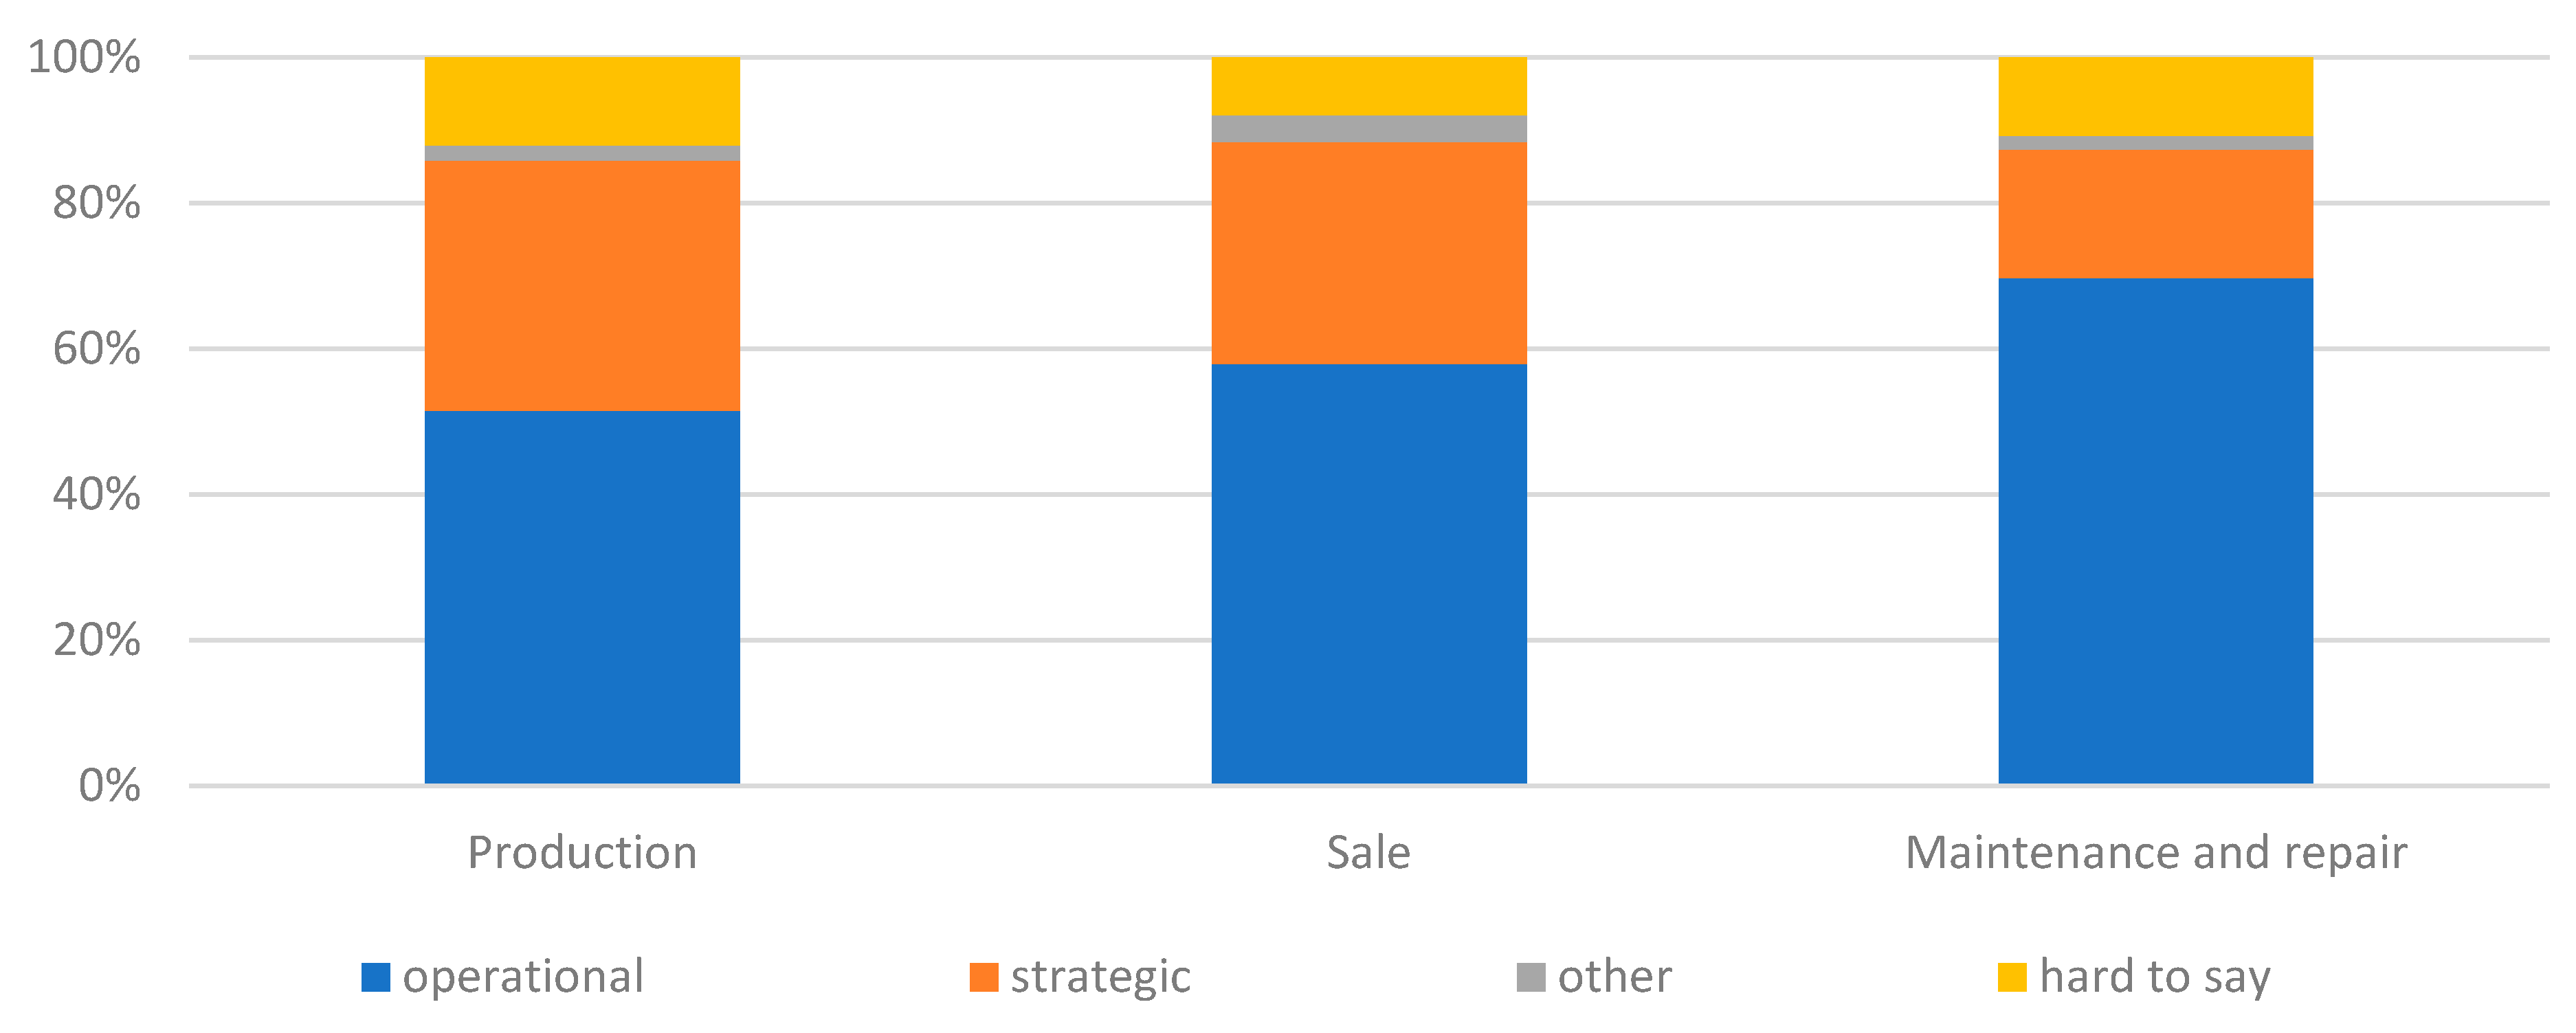
The nature of supply chain activities and decisions during the pandemic was then examined (Figure 11). It appeared that operational decisions were dominant, regardless of the type of business. The further down the supply chain a company was, the more willing it was to make such decisions. Thus, companies reacted based on the here and now, i.e. solving current problems. Strategic decisions were less popular. There was an inverse relationship to operational decisions. The closer companies were to the beginning of the supply chain, the more often they made strategic decisions. This may be due to a greater reliance on multiple suppliers, often from Asia. During the pandemic, this direction of supply created problems. Companies may also have learned lessons and tried to protect themselves for future crises. Statistical tests confirmed that there was a significant relationship between the type of business and the nature of supply chain activities undertaken by companies during the pandemic (operational or strategic?) (χ2emp=16.83; χ20.05=12.59; p-value<0.05). However, the differences were not large.
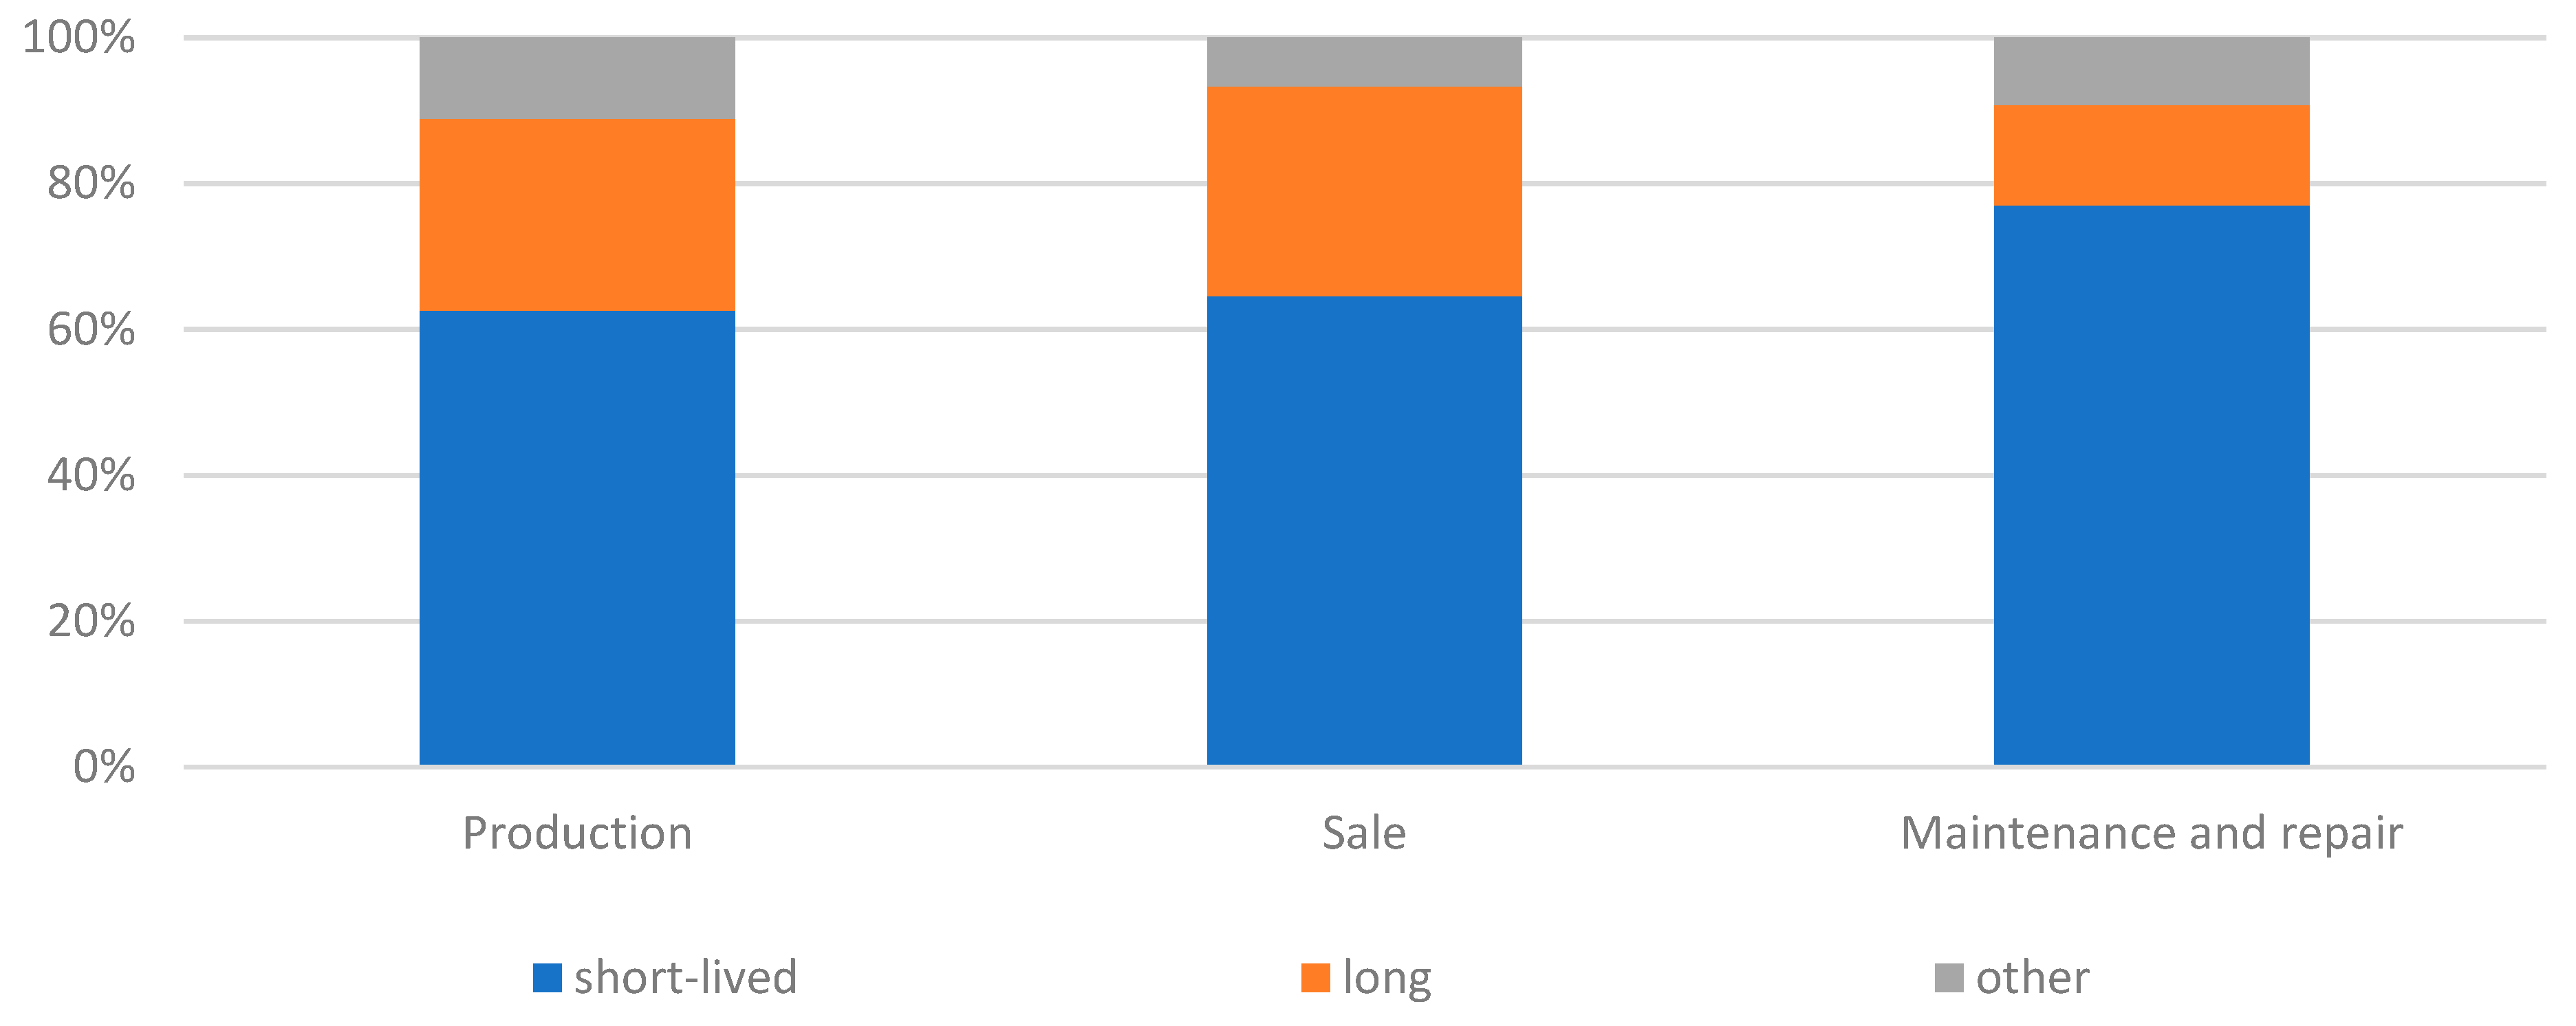
The follow-up question concerned the nature of the changes and adjustments in the companies surveyed (Figure 12). The majority indicated that the changes were of a short-term nature. The further a company was in the supply chain, the more often it so identified the nature of the changes. There was an inverse relationship when assessing changes as long-term. In general, however, changes were understood to be ad hoc and introduced during a pandemic. After a pandemic, most changes would be stopped or reversed. In such a situation, the danger may be that companies do not adapt to future crises. Indeed, the COVID-19 pandemic demonstrated the low resilience of automotive supply chains to disruptions and crises of a global nature. Statistical tests performed confirmed that there was a significant relationship between the type of business and the nature of supply chain changes undertaken by companies during the pandemic (short-term or long-term?) (χ2emp=12.93; χ20.05=9.49; p-value<0.05). However, the differences were small.

4. Discussion

At the outset, it is worth explaining the importance of the automotive industry in Poland and its conditions. There are various types of linkages and dependencies in this industry. According to Lampón et al. [55], the countries and areas most developed in terms of automotive, such as Western Europe Japan, and the USA, are the core having control of ownership and being responsible for development research. Poland is one of the countries distinguished by low production costs and a good technological base. In addition, this country is located in the vicinity of major manufacturers and is therefore export-oriented. Hence the importance of this industry in Poland. Kordalska and Olczyk [56] point out the beginning of a close link between Poland’s automotive industry and other European countries since its accession to the EU in 2004.
It is also important to note the specificity of global supply chains, which arises from the different dimensions of the automotive industry, namely production, distribution, and consumption. The handling of flow within such supply chains is handled by external logistics companies (logistics operators). As a rule, such companies are flexible [57]. However, the COVID-19 pandemic demonstrated the lack of flexibility and resilience of supply chains, especially in the first waves of morbidity and lockdowns. Questions of whether and where to relocate production, therefore, became legitimate. Such decisions are considered strategic. According to Barbieri et al. [58], such decisions aim to reduce logistical costs, uncertainties associated with shipping. They aim to increase supply chain resilience. In our research, we showed that companies in the automotive industry generally did not make strategic decisions. Ad hoc and operational measures were taken.
According to Strange [59], reshoring, i.e. returning production to the countries of origin, is one of the most important elements of reconfiguring the global supply chain. The popularity of this idea was heavily influenced by the COVID-19 pandemic. In our research, looking for alternative suppliers and customers was not often cited as a way to counter supply chain disruption. Such actions were more often taken by companies involved in the sale of vehicles and parts (35% of subjects) and least often by companies involved in vehicle maintenance and repair (23%). Assertive behavior and not looking for new suppliers were most prevalent.
Javorcik [60] suggests that the transformation of global supply chains will happen, but not so fast. The reason for this was the realisation of the high dependence of industrialised countries on Chinese suppliers. Increasing resilience is possible primarily through diversification of supply sources. For this, direct investment is needed, so the process can be lengthy. Van Hassel et al. [61] point to the growing importance of nearshoring, i.e. relocating production and parts of operations to a nearby country. Poland may be regarded as such a country for Germany, but also for other Western European countries. This may also explain the results we obtained, i.e. the low share of companies making strategic decisions. In addition, the majority of companies stated that the disruption caused by COVID-19 was short-lived. However, such views in academic research were rare. They tended to assume a shift away from globalisation towards regionalisation. Ciravegna and Michailova [62] gave reasons for such patterns, i.e. less trust in global supply chains, greater nationalisation, and state interventionism. During the pandemic in Poland, the government took measures to support companies that were pillars of the economy, such as those in the automotive industry. As a result, the resilience of the economy and the supply chains in which Polish companies operated was strengthened [63]. This may be the rationale behind the results we obtained in terms of the actions taken by the surveyed companies. Enterprises with financial support from government programs did not make radical decisions and were able to wait out the crisis caused by the COVID-19 pandemic.
According to Ivanov [64], the COVID-19 pandemic was a special case of supply chain risk, because it was characterised by the long-term existence of disruptions and high uncertainty. This was caused by linkages and dependencies in supply chains, which became a bottleneck during the pandemic. In addition, the automotive industry is characterised by highly centralised supply chains, which also influenced decision-making [65]. This may explain the correlations we obtained in our study. Polish automotive companies generally did not make radical decisions, they focused on operational changes.
According to Gereffi [66], global supply chains are subject to the same regularities, regardless of the type of product. These regularities apply at the macro level for international trade, investment, and finance, the meso level for national and regional economies, and the micro level for local economies, suppliers, communities, and workers. The pandemic, however, brought to light differences between industries that resulted from variations in demand, supply, and logistical operations. The onset of the crisis in the automotive industry coincided with the emergence of the SARS-CoV-2 virus in China’s Hubei province. This province was one of the main industrial bases where a large number of suppliers were located. Eldem et al. [67] suggest that the automotive industry was one of the most affected by the pandemic, due to the interconnectedness of global supply chains present. It is estimated that as many as 80% of parts in the automotive industry come from China [68]. Therefore, the economic impact of the COVID-19 pandemic quickly extended to other regions of the world that import automotive parts from their Chinese partners. It is also acknowledged that the pandemic has only accelerated processes started earlier, related to the relocation of production from Asia and the establishment of regional supply chains. In our study, companies generally made operational decisions during the pandemic. There was a small proportion of companies deciding to make radical changes. Perhaps such decisions were deferred until stabilisation. During the crisis, the most important thing was to survive in the market. Empirical studies on the functioning of the automotive industry during the pandemic are scarce. In one such study, Eldem et al. [67] found that the automotive industry mostly made operational decisions related to adapting to the new situation. According to Ruggiero et al. [69], the COVID-19 pandemic also had positive effects. Specific operational risks in the supply chain were identified and placed in the companies’ operations to be regularly controlled and monitored. Eldem et al. [67] suggested that the pandemic has created new challenges in transforming existing automotive supply chains to make business operations more sustainable. Companies need to plan for future operational changes against the activities of manufacturing companies in their supply chains. Automotive manufacturers and parts suppliers need to redefine their supply chain risk model, from sourcing raw materials to the production of finished products, to protect their market position and limit supply chain disruptions.

5. Conclusions and recommendations

5.1. Conclusions

Based on the research conducted, it was possible to identify disruptions in the supply chains of automotive companies depending on the type of business. The research presented allows several conclusions to be drawn:
  • The automotive industry in Poland was dominated by small-scale enterprises, which means high fragmentation. The largest proportion of large enterprises was among manufacturers. In contrast, the largest number of micro-enterprises was in the case of car maintenance and repair activities. The scale of the operation was related to the type of business.
  • The majority of companies sourced from local and national suppliers, with dependence on these markets increasing for companies further down the supply chain (this was highest in car maintenance and repair operators). International or global sourcing was declared by a fairly large group of car manufacturers and dealers, but sourcing from closer markets dominated these groups of companies. Such a result indicates a low dependence of the surveyed companies on international or global supply chains. Interestingly, sourcing from closer markets was also associated with a small number of suppliers, which generally did not exceed 50. Most maintenance and repair companies had up to 5 suppliers. In contrast, the vendor group was dominated by companies with between 11 and 50 suppliers. There were differences between companies depending on the type of business.
  • Regardless of the type of business, automotive companies experienced disruption in their supply chains. There was little variation by type of business. The most frequent disruptions were due to lockdowns and official closures, low stocks of materials and products, and problems with employees due to illness and quarantine. In all cases, the greatest number of disruptions were at car and parts dealers. In concretising the types of disruption, it was indicated that there was no difference by type of business. The research hypothesis was rejected. In all companies, problems with longer lead times, with increased costs of transport, storage, and work with on-time delivery were mainly indicated.
  • Disruptions in supply chains were generally short-lived (up to 1 year). Companies at the beginning of the supply chain (manufacturers) indicated longer disruptions and even continued disruptions. Statistical tests, however, did not show a dependence of the duration of disruptions on the type of business.
  • To address disruptions in supply chains, operational measures were most commonly used. The scale of these actions increased further down the supply chain. There was a similar relationship in the actions taken by companies. These tended to be short-lived and their frequency increased further downstream in the supply chain. Most companies may have assumed that the pandemic was short-lived, so this type of action would be sufficient. Smaller companies, on the other hand, were only focusing on day-to-day operations, and on survival in the market. Therefore, strategic decisions such as looking for alternative suppliers were rarely taken.

5.2. Recommendations

The results of the survey can be used for comparison with other similar surveys, and also by managers of companies operating in the automotive industry to assess the situation in their companies against the sector as a whole.
Subsequent studies may compare companies operating in the automotive industry in other EU countries. These could be companies operating in neighboring countries, but also in more developed Western European countries. It will then be possible to identify the effects and ways to counteract disruptions in supply chains in the various crashes. Another research proposal is to identify the changes made in the longer term after the COVID-19 pandemic. It would be important to assess the nature of these changes. To this end, it would be useful to carry out research in a few selected companies from different parts of the automotive supply chain.
A limitation of conducting such research is the lack of readily available up-to-date and detailed data directly from enterprises. Conducting such research on a large sample of companies is time-consuming but above all costly.

References

  1. Erkan, B. The importance and determinants of logistics performance of selected countries. J. Emerg. Issues Econ. Financ. Bank 2014, 3, 1237–1254. [Google Scholar]
  2. Bashir, R.; Vijayalakshmi, H.; Bashir, N.A. Comparative Study on the Prices of Products in Logistics Companies and Their Impact on Economic Growth. In Proceedings of the 2020 8th International Conference on Reliability, Infocom Technologies and Optimization (Trends and Future Directions) (ICRITO), Noida, India, 4–5 June 2020; pp. 934–939. [Google Scholar]
  3. Es, H.A.; Hamzacebi, C.; Firat, S.U.O. Assessing the logistics activities aspect of economic and social development. Int. J. Logist. Syst. Manag. 2018, 29, 1–16. [Google Scholar] [CrossRef]
  4. Rokicki, T.; Bórawski, P.; Bełdycka-Bórawska, A.; Żak, A.; Koszela, G. Development of Electromobility in European Union Countries under COVID-19 Conditions. Energies 2022, 15, 9. [Google Scholar] [CrossRef]
  5. Huang, H.; Xu, T. Discussing about the relationship between logistics industry and economy development. Logistics Management 2005, 5. [Google Scholar]
  6. Tudor, F. Historical evolution of logistics. Rev. Des Sci. Polit. 2012, 36, 22–32. [Google Scholar]
  7. Rokicki, T. The importance of logistics in agribusiness sector companies in Poland. In Economic Science for Rural Development: Production and cooperation in agriculture/finance and taxes. In Proceedings of the International Scientific Conference; Jelgava, Latvia, 6 April 2013, pp. 116–120.
  8. Hanne, T.; Dornberger, R. Computational Intelligence in Logistics and Supply Chain Management; Springer: Cham, Switzerland, 2017; pp. 1–12. [Google Scholar]
  9. Pfohl, H.C. Characterization of the Logistics Conception. In Logistics Systems; Springer: Berlin/Heidelberg, Germany, 2022; pp. 21–45. [Google Scholar]
  10. Rokicki, T.; Koszela, G.; Ochnio, L.; Wojtczuk, K.; Ratajczak, M.; Szczepaniuk, H.; Bełdycka-Bórawska, A. Diversity and changes in energy consumption by transport in EU countries. Energies 2021, 14, 5414. [Google Scholar] [CrossRef]
  11. Chu, Z. Logistics and economic growth: A panel data approach. Ann. Reg. Sci. 2012, 49, 87–102. [Google Scholar] [CrossRef]
  12. Saidi, S.; Mani, V.; Mefteh, H.; Shahbaz, M.; Akhtar, P. Dynamic linkages between transport, logistics, foreign direct Investment, and economic growth: Empirical evidence from developing countries. Transp. Res. Part A Policy Pract. 2020, 141, 277–293. [Google Scholar] [CrossRef]
  13. Rokicki, T.; Bórawski, P.; Bełdycka-Bórawska, A.; Szeberényi, A.; Perkowska, A. Changes in Logistics Activities in Poland as a Result of the COVID-19 Pandemic. Sustainability 2022, 14, 10303. [Google Scholar] [CrossRef]
  14. Amin, H.M.; Shahwan, T.M. Logistics management requirements and logistics performance efficiency: The role of logistics management practices-evidence from Egypt. Int. J. Logist. Syst. Manag. 2020, 35, 1–27. [Google Scholar] [CrossRef]
  15. Chu, Z.; Wang, Q.; Lado, A.A. Customer orientation, relationship quality, and performance: The third-party logistics provider’s perspective. Int. J. Logist. Manag. 2016, 27, 738–754. [Google Scholar] [CrossRef]
  16. Wicki, L.; Rokicki, T. Differentiation of level of logistics activities in milk processing companies. In Information Systems in Management X: Computer Aided Logistics/Sci; Jałowiecki, P., Orłowski, A., Eds.; WULS Press: Warsaw, Poland, 2011; pp. 117–127. [Google Scholar]
  17. Rodrigue, J.P.; Notteboom, T. Comparative North American and European gateway logistics: the regionalism of freight distribution. Journal of Transport Geography 2010, 18, 497–507. [Google Scholar] [CrossRef]
  18. Ashby, A. From global to local: reshoring for sustainability. Operations Management Research 2016, 9, 75–88. [Google Scholar] [CrossRef]
  19. Stanczyk, A.; Cataldo, Z.; Blome, C.; Busse, C. The dark side of global sourcing: a systematic literature review and research agenda. International Journal of Physical Distribution & Logistics Management 2017, 47, 41–67. [Google Scholar]
  20. Onstein, A.T.; Tavasszy, L.A.; Van Damme, D.A. Factors determining distribution structure decisions in logistics: a literature review and research agenda. Transport Reviews 2019, 39, 243–260. [Google Scholar] [CrossRef]
  21. Kchaou Boujelben, M.; Boulaksil, Y. Modeling international facility location under uncertainty: A review, analysis, and insights. IISE Transactions 2018, 50, 535–551. [Google Scholar] [CrossRef]
  22. Kalchschmidt, M.; Birolini, S.; Cattaneo, M.; Malighetti, P.; Paleari, S. The geography of suppliers and retailers. Journal of Purchasing and Supply Management 2020, 26, 100626. [Google Scholar] [CrossRef]
  23. Cowen, D. The deadly life of logistics: Mapping violence in global trade; University of Minnesota Press: Minneapolis, USA, 2014. [Google Scholar]
  24. Arellana, J.; Márquez, L.; Cantillo, V. COVID-19 outbreak in Colombia: An analysis of its impacts on transport systems. J. Adv. Transp. 2020, 8867316. [Google Scholar] [CrossRef]
  25. Li, S.; Zhou, Y.; Kundu, T.; Sheu, J.B. Spatiotemporal variation of the worldwide air transportation network induced by COVID-19 pandemic in 2020. Transp. Policy 2021, 111, 168–184. [Google Scholar] [CrossRef]
  26. Łącka, I.; Suproń, B. The impact of COVID-19 on road freight transport evidence from Poland. Eur. Res. Stud. 2021, 24, 319–333. [Google Scholar] [CrossRef] [PubMed]
  27. Alaimo, L.S.; Fiore, M.; Galati, A. How the COVID-19 pandemic is changing online food shopping human behaviour in Italy. Sustainability 2020, 12, 9594. [Google Scholar] [CrossRef]
  28. Chang, H.H.; Meyerhoefer, C.D. COVID-19 and the demand for online food shopping services: Empirical Evidence from Taiwan. Am. J. Agric. Econ. 2021, 103, 448–465. [Google Scholar] [CrossRef]
  29. Abdelrhim, M.; Elsayed, A. The Effect of COVID-19 Spread on the e-Commerce Market: The Case of the 5 Largest e-Commerce Companies in the World 2022, 3621166.
  30. Izzah, N.; Dilaila, F.; Yao, L. The growth of reliance towards courier services through e-business verified during COVID-19: Malaysia. J. Phys. Conf. Ser. 2021, 1874, 012041. [Google Scholar] [CrossRef]
  31. Chornopyska, N.; Bolibrukh, L. The Influence of the Covid-19 Crisis on the Formation of Logistics Quality. Intellect. Logist. Supply Chain. Manag. 2020, 2, 88–98. [Google Scholar] [CrossRef]
  32. Atayah, O.F.; Dhiaf, M.M.; Najaf, K.; Frederico, G.F. Impact of COVID-19 on financial performance of logistics firms: Evidence from G-20 countries. J. Glob. Oper. Strateg. Sourc. 2021, 15, 172–196. [Google Scholar] [CrossRef]
  33. Rokicki, T.; Koszela, G.; Ochnio, L.; Perkowska, A.; Bórawski, P.; Bełdycka-Bórawska, A.; Dzikuć, M. Changes in the production of energy from renewable sources in the countries of Central and Eastern Europe. Frontiers in Energy Research 2022, 10, 993547. [Google Scholar] [CrossRef]
  34. Haren, P.; Simchi-Levi, D. How Coronavirus Could Impact the Global Supply Chain by Mid-March; Harvard Business Review: Harvard, UK, 2020. [Google Scholar]
  35. Remko, V.H. Research opportunities for a more resilient post-COVID-19 supply chain–closing the gap between research findings and industry practice. Int. J. Oper. Prod. Manag. 2020, 40, 341–355. [Google Scholar] [CrossRef]
  36. Chowdhury, P.; Paul, S.K.; Kaisar, S.; Moktadir, M.A. COVID-19 pandemic related supply chain studies: A systematic review. Transp. Res. Part E Logist. Transp. Rev. 2021, 148, 102271. [Google Scholar] [CrossRef] [PubMed]
  37. Gunessee, S.; Subramanian, N. Ambiguity and its coping mechanisms in supply chains lessons from the Covid-19 pandemic and natural disasters. Int. J. Oper. Prod. Manag. 2020, 40, 1201–1223. [Google Scholar] [CrossRef]
  38. Amankwah-Amoah, J. Note: Mayday, Mayday, Mayday! Responding to environmental shocks: Insights on global airlines’ responses to COVID-19. Transp. Res. Part E Logist. Transp. Rev. 2020, 143, 102098. [Google Scholar] [CrossRef] [PubMed]
  39. Xu, Z.; Elomri, A.; Kerbache, L.; El Omri, A. Impacts of COVID-19 on global supply chains: Facts and perspectives. IEEE Eng. Manag. Rev. 2020, 48, 153–166. [Google Scholar] [CrossRef]
  40. Heidary, M.H. The Effect of COVID-19 Pandemic on the Global Supply Chain Operations: A System Dynamics Approach. Foreign Trade Rev. 2022, 57, 198–220. [Google Scholar] [CrossRef]
  41. Choi, T.M. Innovative “bring-service-near-your-home” operations under corona-virus (COVID-19/SARS-CoV-2) outbreak: Can logistics become the messiah? Transp. Res. Part E Logist. Transp. Rev. 2020, 140, 101961. [Google Scholar] [CrossRef] [PubMed]
  42. Currie, C.S.; Fowler, J.W.; Kotiadis, K.; Monks, T.; Onggo, B.S.; Robertson, D.A.; Tako, A.A. How simulation modelling can help reduce the impact of COVID-19. J. Simul. 2020, 14, 83–97. [Google Scholar] [CrossRef]
  43. Ivanov, D. Viable supply chain model: Integrating agility, resilience and sustainability perspectives—lessons from and thinking beyond the COVID-19 pandemic. Ann. Oper. Res. 2020, 1–21. [Google Scholar] [CrossRef] [PubMed]
  44. Rokicki, T.; Bórawski, P.; Bełdycka-Bórawska, A.; Żak, A.; Koszela, G. Development of electromobility in european union countries under covid-19 conditions. Energies 2021, 15, 9. [Google Scholar] [CrossRef]
  45. Accenture, COVID-19: Impact on the Automotive Industry, 2020 (Online). Available: https://www.accenture.com/_acnmedia/PDF-121/Accenture-COVID-19-Impact-Automotive-Industry.pdf.
  46. ACEA, Passenger car registrations, 2020 (Online). Available: https://www.acea.be/press-releases/article/passenger-car-registrations-28.8-nine-months-into-2020-3.1-in-september.
  47. ACEA, Truck makers gear up to go fossil-free by 2040, but EU and Member States need to step up their game, 2021 (Online). Available: https://www.acea.
  48. McKinsey, Reimaginig the auto indsutry’s future its now or never, 2020 (Online). Available: https://www.mckinsey.com/industries/automotive-and-assembly/our-insights/reimagining-the-auto-industrys-future-its-now-or-never.
  49. McKinsey, The second COVID-19 lockdown in Europe: Implications for automotive retail, 2020 (Online). Available: https://www.mckinsey.com/industries/automotive-and-assembly/our-insights/the-second-covid-19-lockdown-in-europe-implications-for-automotive-retail.
  50. Ecorys, TRT Srl.; and M-Five GmbH, 2020 (Online). Available: Study on exploring the possible employment implications of connected and automated driving. Annexes, available at: https://www.ecorys.com/cad.
  51. Huisman, J.; Ciuta, T.; Mathieux, F.; Bobba, S.; Georgitzikis, K.; Pennington, D. RMIS–Raw materials in the battery value chain; Publications Office of the European Union: Luxembourg, 2020. [Google Scholar]
  52. Aczel, A.D.; Sounderpandian, J. Statystyka w zarządzaniu; Wydawnictwo Naukowe PWN: Warszawa, Poland, 2000. [Google Scholar]
  53. Kowal, J. Statystyka opisowa w zarządzaniu. W: Z. Knecht (red.), Zarządzanie przedsiębiorcze, 2011, 107-162.
  54. Łapczyński, M. Analiza porównawcza tabel kontyngencji i metody CHAID. Zeszyty Naukowe/Akademia Ekonomiczna w Krakowie 2005, 659, 149–163. [Google Scholar]
  55. Lampón, J.F.; Perez-Elizundia, G.; Delgado-Guzmán, J.A. Relevance of the cooperation in financing the automobile industry’s supply chain: the case of reverse factoring. Journal of Manufacturing Technology Management 2021, 32, 1094–1112. [Google Scholar] [CrossRef]
  56. Kordalska, A.; Olczyk, M. Is Germany a Hub of ‘Factory Europe’for CEE Countries? Ekonomista 2019, 734–759. [Google Scholar]
  57. Rodrigue, J.P. The geography of global supply chains: Evidence from third-party logistics. Journal of Supply Chain Management 2012, 48, 15–23. [Google Scholar] [CrossRef]
  58. Barbieri, P.; Boffelli, A.; Elia, S.; Fratocchi, L.; Kalchschmidt, M.; Samson, D. What can we learn about reshoring after Covid-19? Operations Management Research 2020, 13, 131–136. [Google Scholar] [CrossRef]
  59. Strange, R. The 2020 Covid-19 pandemic and global value chains. Journal of Industrial and Business Economics 2020, 47, 455–465. [Google Scholar] [CrossRef]
  60. Javorcik, B. Reshaping of global supply chains will take place, but it will not happen fast. Journal of Chinese Economic and Business Studies 2020, 18, 321–325. [Google Scholar] [CrossRef]
  61. Van Hassel, E.; Vanelslander, T.; Neyens, K.; Vandeborre, H.; Kindt, D.; Kellens, S. Reconsidering nearshoring to avoid global crisis impacts: Application and calculation of the total cost of ownership for specific scenarios. Research in Transportation Economics 2022, 93, 101089. [Google Scholar] [CrossRef]
  62. Ciravegna, L.; Michailova, S. Why the world economy needs, but will not get, more globalization in the post-COVID-19 decade. Journal of International Business Studies 2022, 1–15. [Google Scholar] [CrossRef] [PubMed]
  63. Azadegan, A.; Dooley, K. A typology of supply network resilience strategies: complex collaborations in a complex world. Journal of Supply Chain Management 2021, 57, 17–26. [Google Scholar] [CrossRef]
  64. Ivanov, D. Predicting the impacts of epidemic outbreaks on global supply chains: A simulation-based analysis on the coronavirus outbreak (COVID-19/SARS-CoV-2) case. Transportation Research Part E: Logistics and Transportation Review 2020, 136, 101922. [Google Scholar] [CrossRef] [PubMed]
  65. Ishida, S. Perspectives on supply chain management in a pandemic and the post-COVID-19 era. IEEE Engineering Management Review 2020, 48, 146–152. [Google Scholar] [CrossRef]
  66. Gereffi, G. What does the COVID-19 pandemic teach us about global value chains? The case of medical supplies. Journal of International Business Policy 2020, 3, 287–301. [Google Scholar] [CrossRef]
  67. Eldem, B.; Kluczek, A.; Bagiński, J. The COVID-19 impact on supply chain operations of automotive industry: A case study of sustainability 4.0 based on Sense–Adapt–Transform framework. Sustainability 2022, 14, 5855. [Google Scholar] [CrossRef]
  68. KPMG. 2020. Covid-19: Impact on the automotive sector. Available: https://assets.kpmg/content/dam/kpmg/ar/pdf/2020/covid-19-impact-on-the-automotivesector.pdf (20.11.2022).
  69. Ruggiero, S.; Kangas, H.L.; Annala, S.; Lazarevic, D. Business model innovation in demand response firms: Beyond the niche-regime dichotomy. Environmental Innovation and Societal Transitions 2021, 39, 1–17. [Google Scholar] [CrossRef]
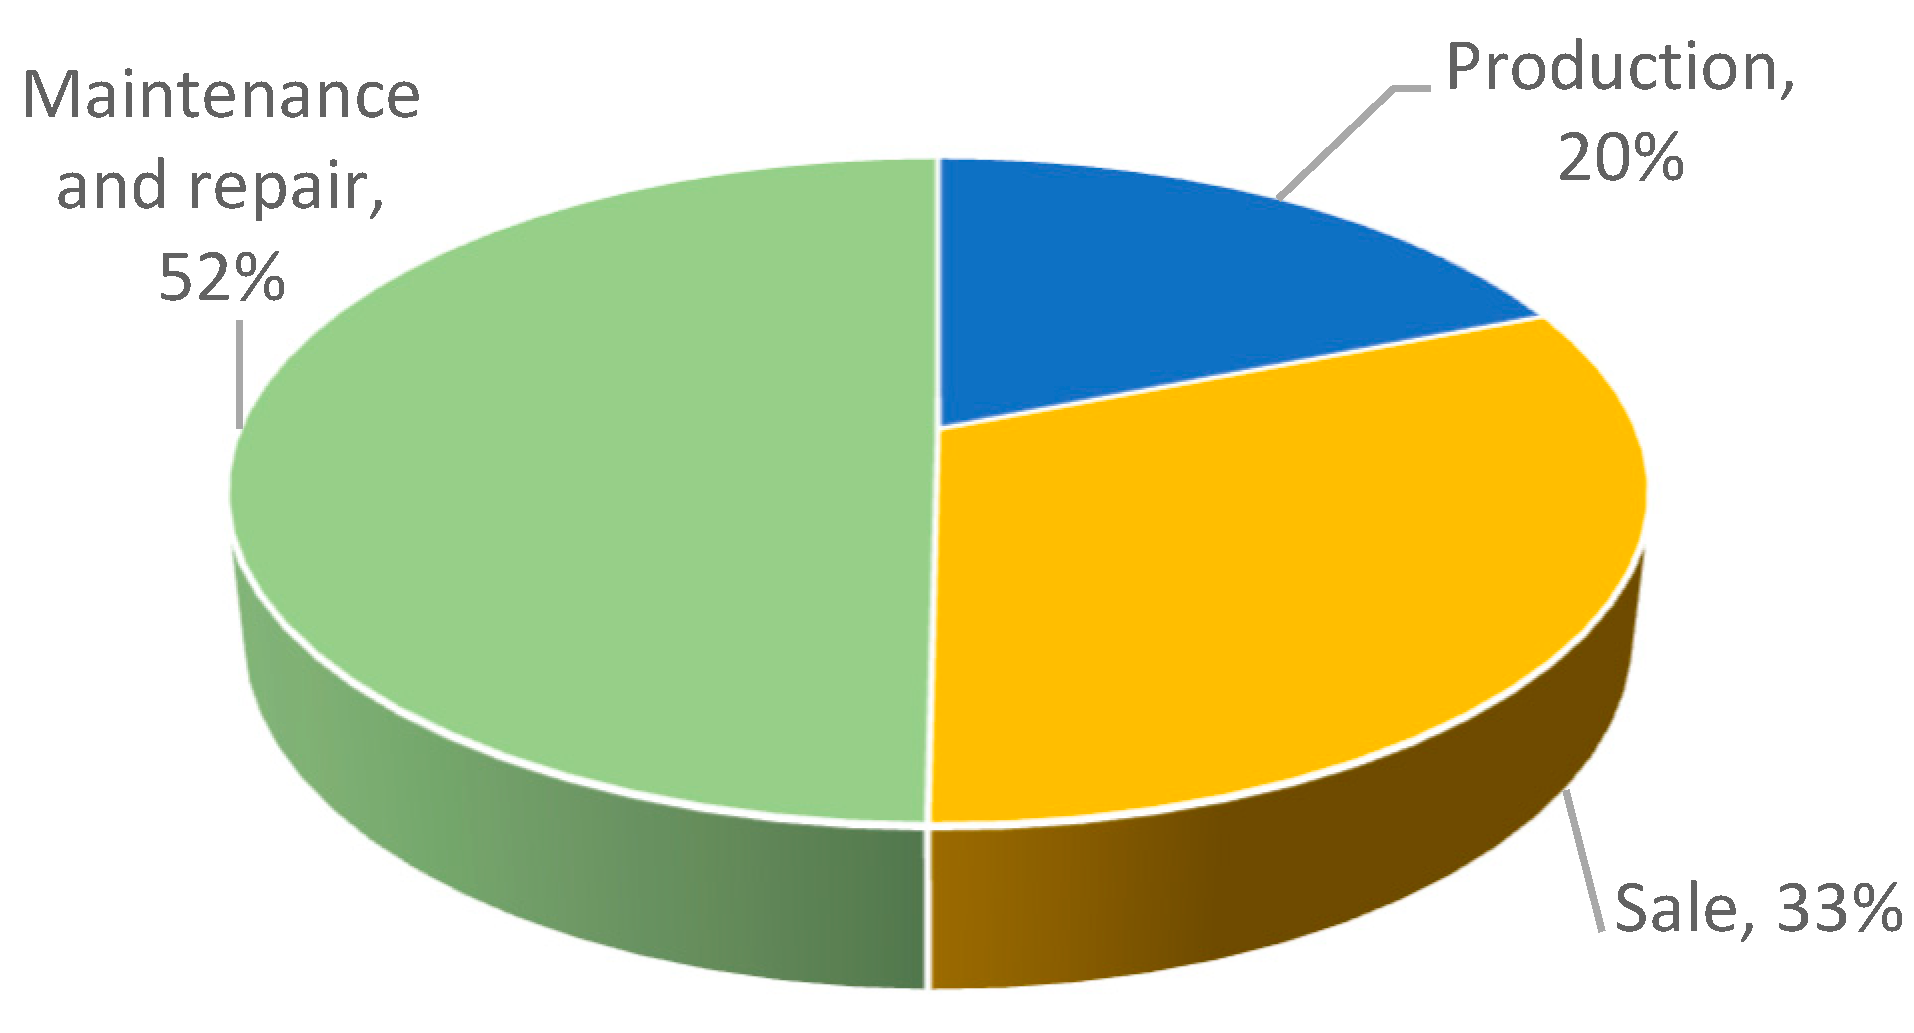
Figure 1. The main activity of the surveyed enterprises.
Preprints 91012 g001
Figure 2. Number of people employed in the surveyed enterprises.
Preprints 91012 g002
Figure 3. The main supply market of the surveyed enterprises.
Preprints 91012 g003
Figure 4. The number of suppliers of the surveyed enterprises.
Preprints 91012 g004
Figure 5. The most important causes of problems in the supply chains in the surveyed enterprises (multiple choice).
Preprints 91012 g005
Figure 6. Occurrence of disruptions or problems in supply chains during the pandemic in the surveyed enterprises.
Preprints 91012 g006
Figure 7. Types of disruptions (problems) related to the supply chain during the pandemic in the surveyed enterprises (multiple choice).
Preprints 91012 g007
Figure 8. Duration of supply chain disruption during the pandemic in the surveyed companies.
Preprints 91012 g008
Figure 9. The time of return to activity from before the crisis caused by the pandemic in the surveyed enterprises.
Preprints 91012 g009
Figure 10. Actions taken during the pandemic in the surveyed enterprises.
Preprints 91012 g010
Figure 11. The nature of activities and decisions regarding the supply chain during the pandemic in the surveyed enterprise.
Preprints 91012 g011
Figure 12. The nature of changes (adjustments) in the supply chain as a result of the pandemic in the surveyed enterprises.
Preprints 91012 g012
Disclaimer/Publisher’s Note: The statements, opinions and data contained in all publications are solely those of the individual author(s) and contributor(s) and not of MDPI and/or the editor(s). MDPI and/or the editor(s) disclaim responsibility for any injury to people or property resulting from any ideas, methods, instructions or products referred to in the content.
Copyright: This open access article is published under a Creative Commons CC BY 4.0 license, which permit the free download, distribution, and reuse, provided that the author and preprint are cited in any reuse.
Prerpints.org logo

Preprints.org is a free preprint server supported by MDPI in Basel, Switzerland.

Subscribe

© 2024 MDPI (Basel, Switzerland) unless otherwise stated