1. Introduction
Banana (Musa spp.) is a crop of fundamental importance to the economies of many developing countries. In terms of production, it is the fourth most important food crop in the world, after rice, wheat and maize (Arias et al., 2004). The international market shows a marked regional character, with transportation cost and distribution time being the main factors influencing regionalization.
The first reference to banana production in Argentina dates from 1915 in the province of Jujuy. However, the production of subtropical regions acquired commercial importance in the country by 1960. The growth in the cultivation area occurred with the introduction of corms from neighboring countries, without any type of control in the genetic identification and phytosanitary condition (Colque & Tenaglia, 2010).
In the humid subtropical region of the province of Formosa, located in the Argentine northeast, banana cultivation grows in suboptimal climatic conditions (Supplementary Table S1, S2 and S3), affecting its production. However, it is possible to identify genotypes adapted to unfavorable environments, increasing crop biodiversity. Ermini et al. (2018) reported the existence in Argentina of unique banana variability in the world. At present there is an enormous diversity, with plants of different cycles, heights, hand shapes, yield, flavor, etc. These genetic resources, which have not been previously characterized, constitute an enormous possibility of finding superior, tolerant, high-yielding genotypes and better flavor than the product which was imported from tropical countries.
Although crop diversification is one of the main strategies of the agroecological transition, one of the principal obstacles is the lack of local references for all cultivated species. Land suitability methods can provide a quick assessment of the yield of a given crop in a region. However, conventional methods are mainly based on the evaluation of the suitability of the soil and the climate, being essential to know where and how a new crop can be introduced and if this introduction would be profitable. Marraccini et al. (2020) have developed a method based on the characterization of farming systems at the regional level in order to assess the potential yield of a new crop. It could be easily adapted to quickly evaluate the potential for the introduction of new crops, in cases where climatic data and soil map information are available.
Works have been published on the introduction of banana varieties in new environments and their evaluation and adoption to increase production. In Dagnew et al. (2021) four introduced and five local banana cultivars were evaluated with a control variety, while in Uazire et al. (2010) four improved varieties and one control were analyzed. In the present research three varieties of international commercial use were selected, two of them used as control in the previously mentioned works, considering them as representative to characterize the agroecological aptitude of Formosa for banana production.
Hence, in this work an alternative method was proposed that consists of the application of the Multiple Factorial Analysis technique on known banana varieties of international use, in order to characterize the agroecological aptitude of a new region -the province of Formosa, Argentina- for banana cultivation. In this context, the objective of this work was to characterize the agroecological aptitude of Formosa, Argentina, for banana production, through the agronomic behavior of three varieties of international use: Willians, Jafa and Gran Enano, evaluated during five consecutive campaigns. Likewise, the Multiple Dual Factor Analysis (DMFA) was applied as a methodological proposal in order to evaluate its suitability to study the agroecological aptitude of a certain environment in relation to the introduction of a crop that presents known diversity, at least in other productive environments.
2. Materials and methods
2.1. Plant material
Three commercial banana varieties for international use were characterized, each of which was considered as a group:
Group 1: composed by 11 individuals of the variety Williams.
Group 2: composed by 7 individuals of the variety Jafa.
Group 3: composed by 12 individuals of the variety Gran Enano.
Due to the fact that they are varieties widely evaluated in traditional banana production environments, their agronomic behavior in the conditions of the province of Formosa allows estimating the agroecological suitability of this area of northeastern Argentina compared to crops worldwide. The premise of this work is that from these results it will be possible to reference in the short term the production of superior clones identified within the unique diversity that exists in Argentina, previously mentioned, in order to achieve the first variety locally adapted to the harsh environment of this region.
2.2. Experiment design
In a completely randomized block design, during 5 consecutive campaigns from 2015 to 2020, the 3 banana varieties were evaluated. The design was carried out at the facilities of the Institute for Research and Technological Development for Family Agriculture (IPAF), Formosa, Argentina (26°11'31.8"S, 58°12'22.4"W).
2.3. Traits evaluated
The following 10 vegetative and production characteristics were observed in these groups: plant height (m), plant diameter (cm), leaves at flowering, number of hands, hands weight (kg), second hand diameter (cm), last hand diameter (cm), second hand length (cm), last hand length (cm) and peel thickness (mm).
2.4. Statistical analysis
To achieve the proposed methodological objective, the three-way data analysis technique called Multiple Factor Analysis (MFA) was used. This methodology allows a global analysis of data tables in which the same group of individuals is described through a set of variables, evaluated in different conditions, moments in time or places, such as the global evaluation of genotypes of tomato in two successive generations (Del Medico et al., 2019, 2020) or to globally analyze banana clones evaluated through quantitative and qualitative variables (Del Medico et al., 2021). This analysis allows balancing the influence of the different conditions in order to analyze them simultaneously.
The conventional way of statistically inferring on variety, campaign and the genotype by environment interaction (GEI) effects is ANOVA, so it was applied to verify the results of the MFA. A significance level of α=0.05 was used.
Finally, considering that the three varieties analyzed are different and that they could interact differentially in this new production environment for banana, the DMFA technique was carried out, which allows examining the variability of the data when the same group of variables is observed in different groups of individuals. It is an extension of the MFA in the case that the individuals are structured according to a partition (Lê & Pagès, 2010). The method is based on a factor analysis known as internal, for which the data is systematically centered by group. This analysis is an internal principal component analysis (PCA) when all variables are quantitative. DMFA provides the classic results of a PCA.
The RV coefficient (Abdi, 2007), a global measure of the relationship between the configurations defined by the different conditions for the same individuals and variables, was calculated. The RV coefficient takes values between 0 (the configurations are orthogonal) and 1 (the distance between the configurations is zero).
The InfoStat software was used to perform the univariate analyzes and the FactoMineR package of the statistical software environment R to perform the multivariate analyses.
3. Results
First, a descriptive analysis of the data was carried out by calculating the average and standard deviation of each variable analyzed for each of the groups under study (
Table 1). Acceptable values in respect to traditional areas for banana production were observed in the Argentinian province of Formosa.
Results from the MFA indicate that the first global axis collected a percentage of the total variation of 17.37%; while the second, 11.68% (
Table 2). These results indicated that 29.05% of the total variation was explained by the first two global axes of the MFA. Considering the first five global axes, 55.51% of the total variability was explained.
According to the low proportion of global variance explained by the first five global axes of the MFA, no clear patterns of varieties’ performances across campaigns could be inferred. This could be due to the different weather conditions recorded in each campaign (Supplementary Table S1, S2 and S3). These climatic conditions can differentially affect the genotypes, inducing GEI in the characteristics under evaluation.
In fact,
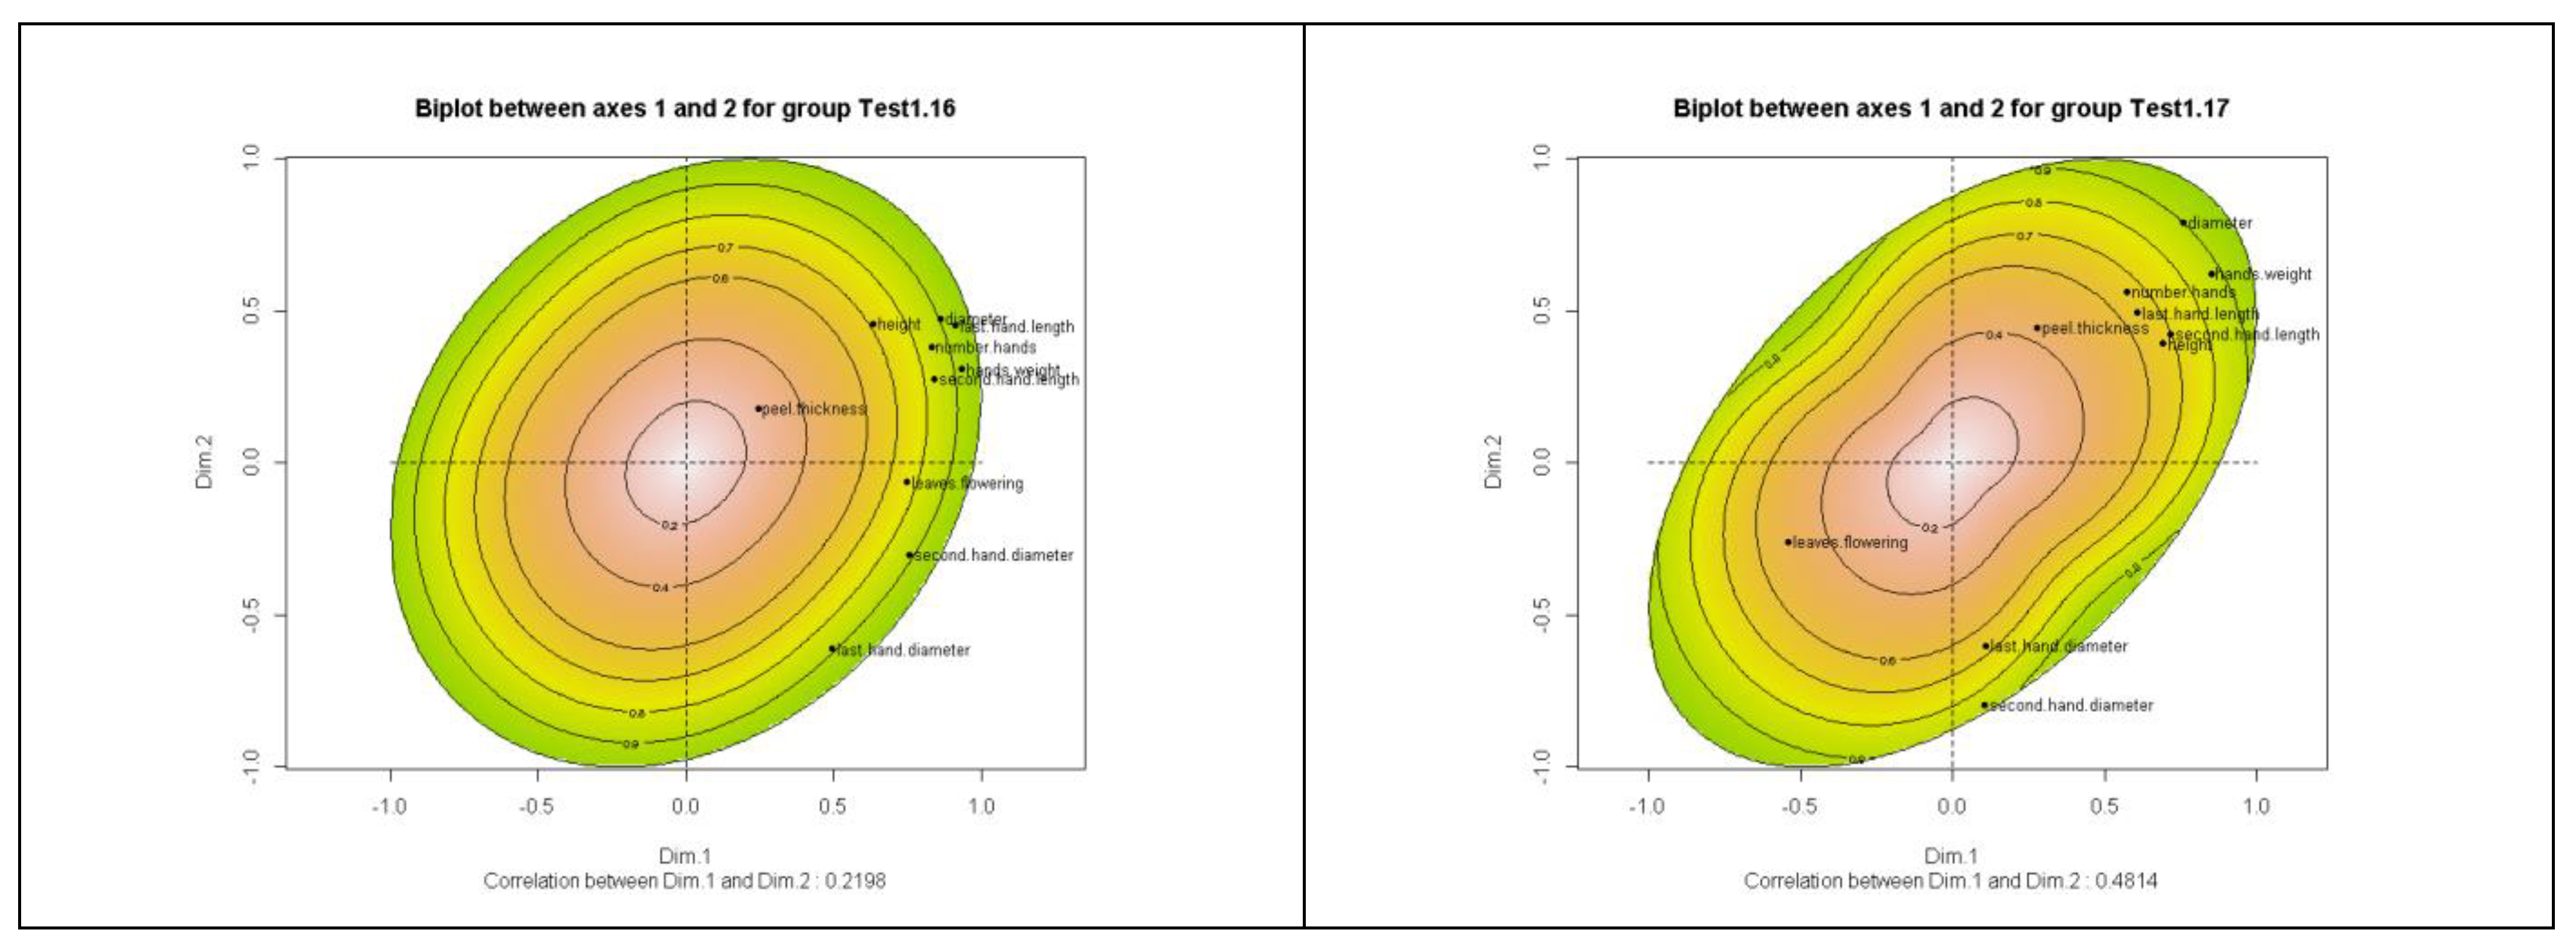
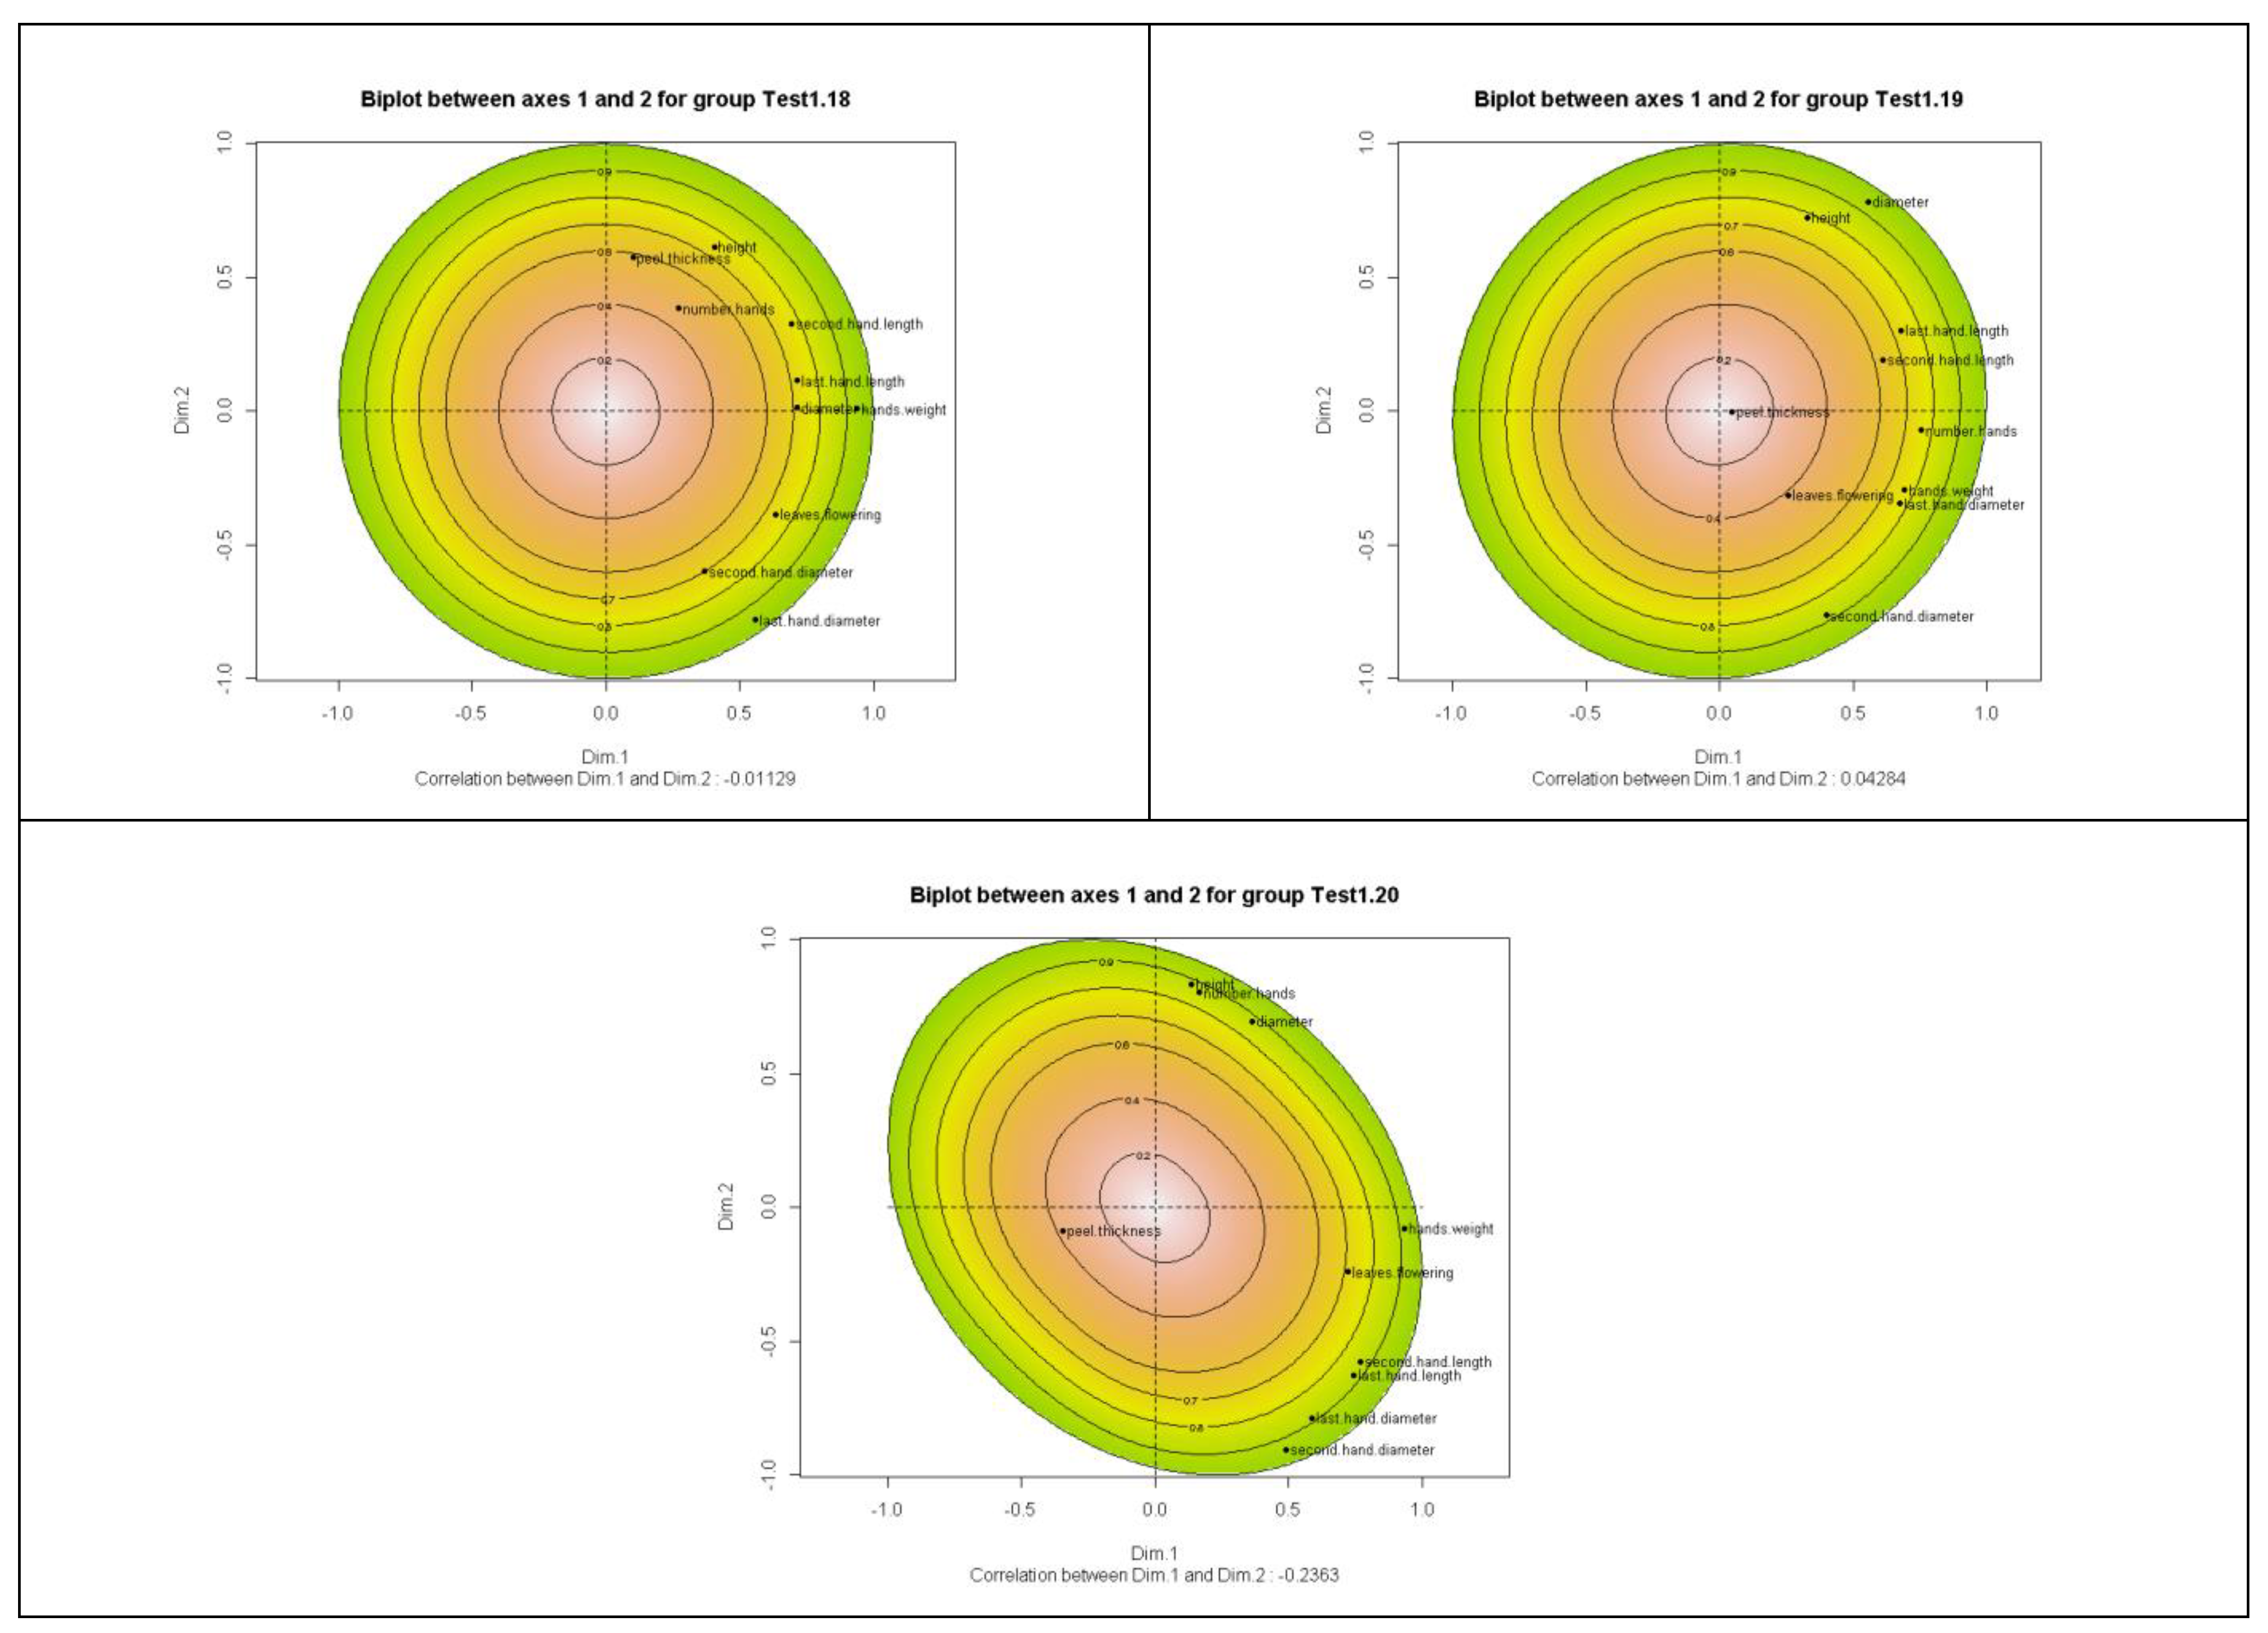
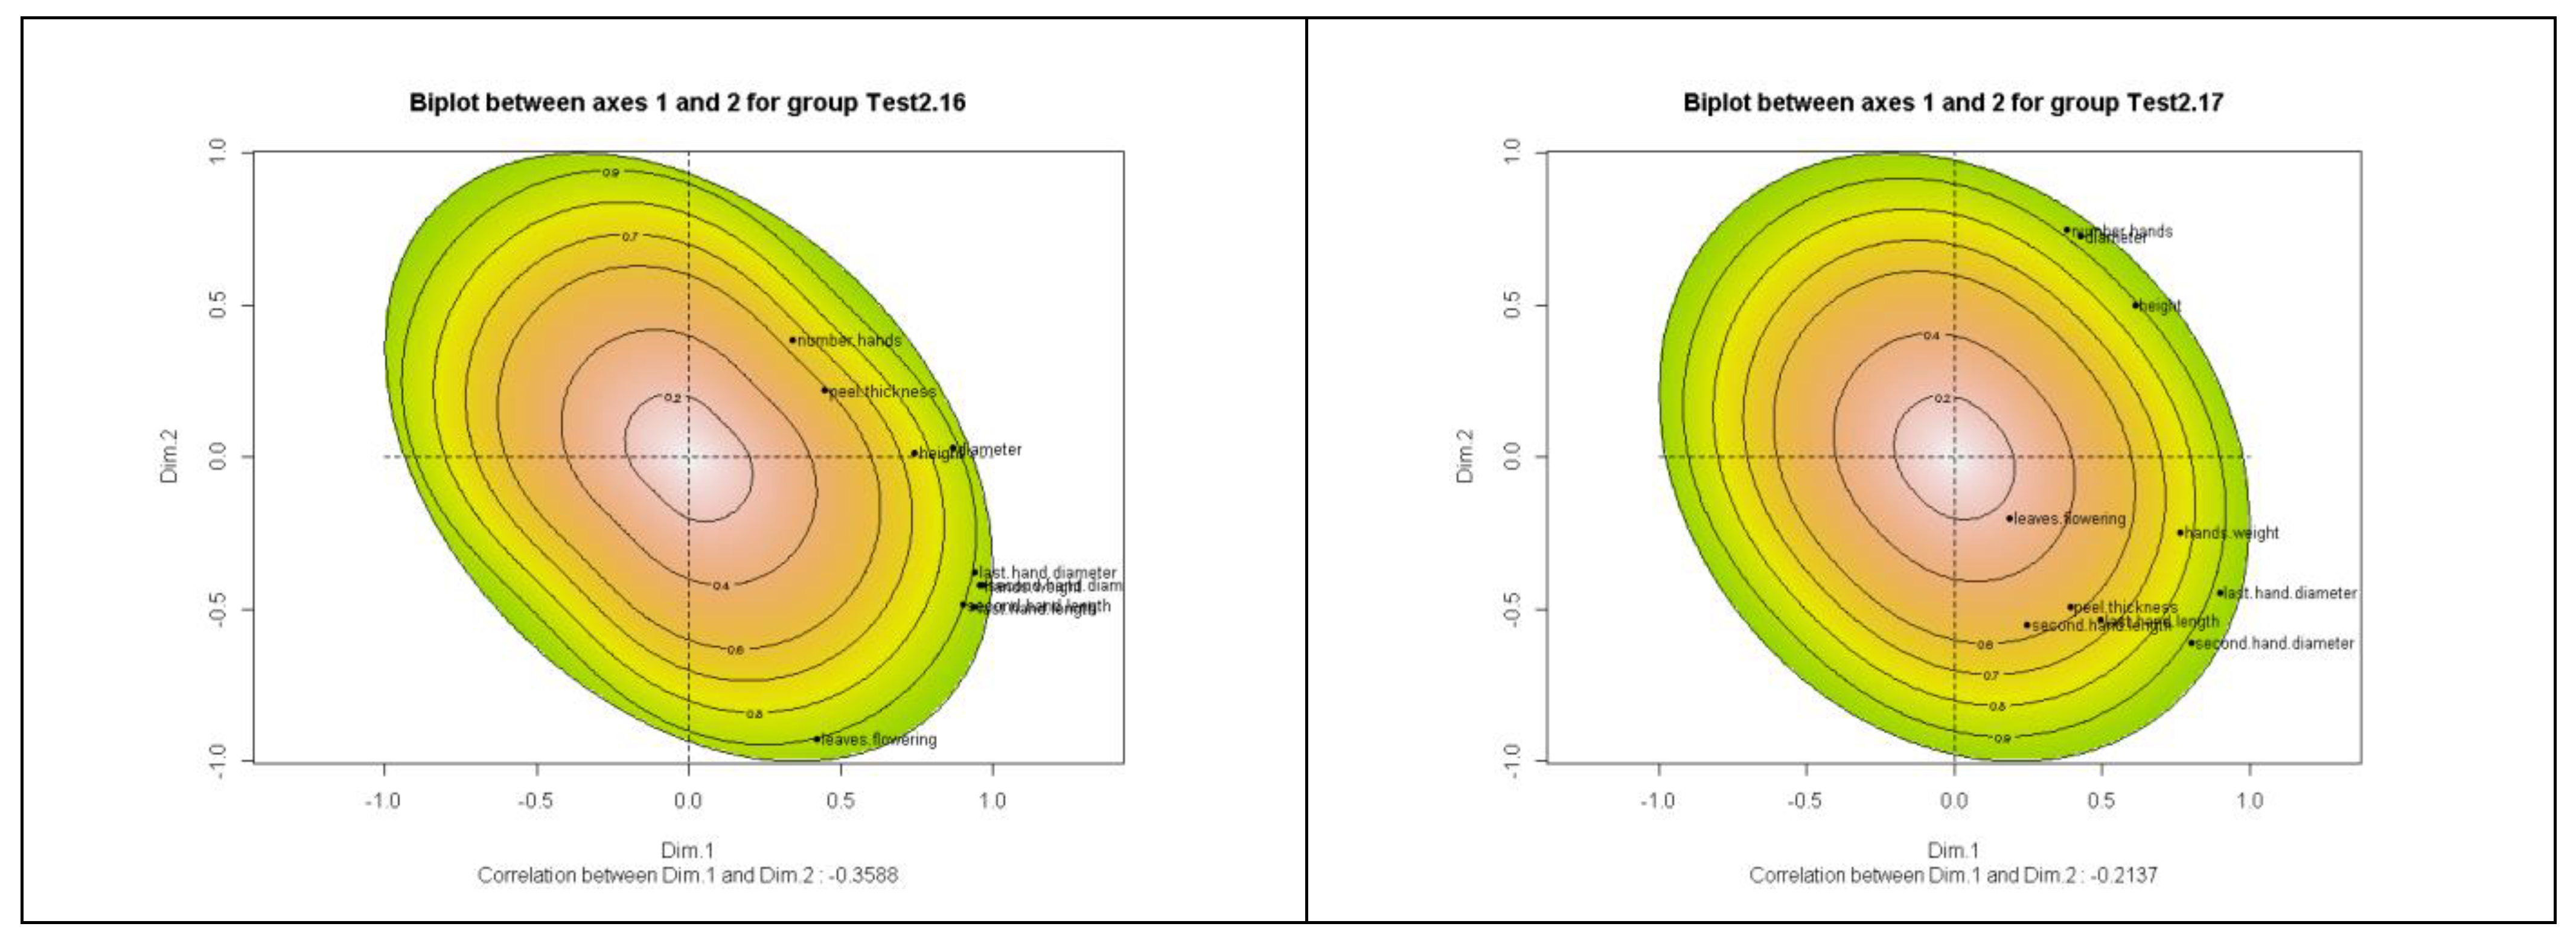
Figure 1 shows that in general the variables presented different correlation structures through all the campaigns, supporting the putative presence of GEI. Furthermore, peel thickness was the variable that presented the most notorious discrepancies in the whole data.
Table 3 presents the RV coefficients calculated between each pair of configurations associated with the five evaluation campaigns. The values were low; one of the possible causes may be the existence of interaction. As previously described, two-way factorial ANOVAs (Supplementary Table S5 to Table S14) corroborated the GEI early suggested by average of each variable for each group of genotypes at each campaign reported in
Table 1. The effect of the variety x campaign interaction was statistically significant for plant diameter, hands weight, second hand diameter, second hand length and peel thickness. The effect of the campaign was significant for plant height, leaves at flowering, number of hands, last hand diameter and last hand length. The effect of variety was significant for leaves at flowering and number of hands.
In order to explore the GEI for traits under study and get a more precise knowledge of the agroecological aptitude for banana production of the northeastern region of Formosa, DMFA technique was applied. Hence, a multivariate three-way analytical approach should be achieved considering how each campaign affected each genotype in a differential and specific way. To do this, each combination of genotype and campaign was considered as a group.
The first global axis of DMFA explained 36.37% of the total variation of the data; while the second, 15.68% (
Table 4), indicated that 52.11% of the total variation was explained by only the first two global axes of the DMFA. This proportion of explained variance was greater than by MFA.
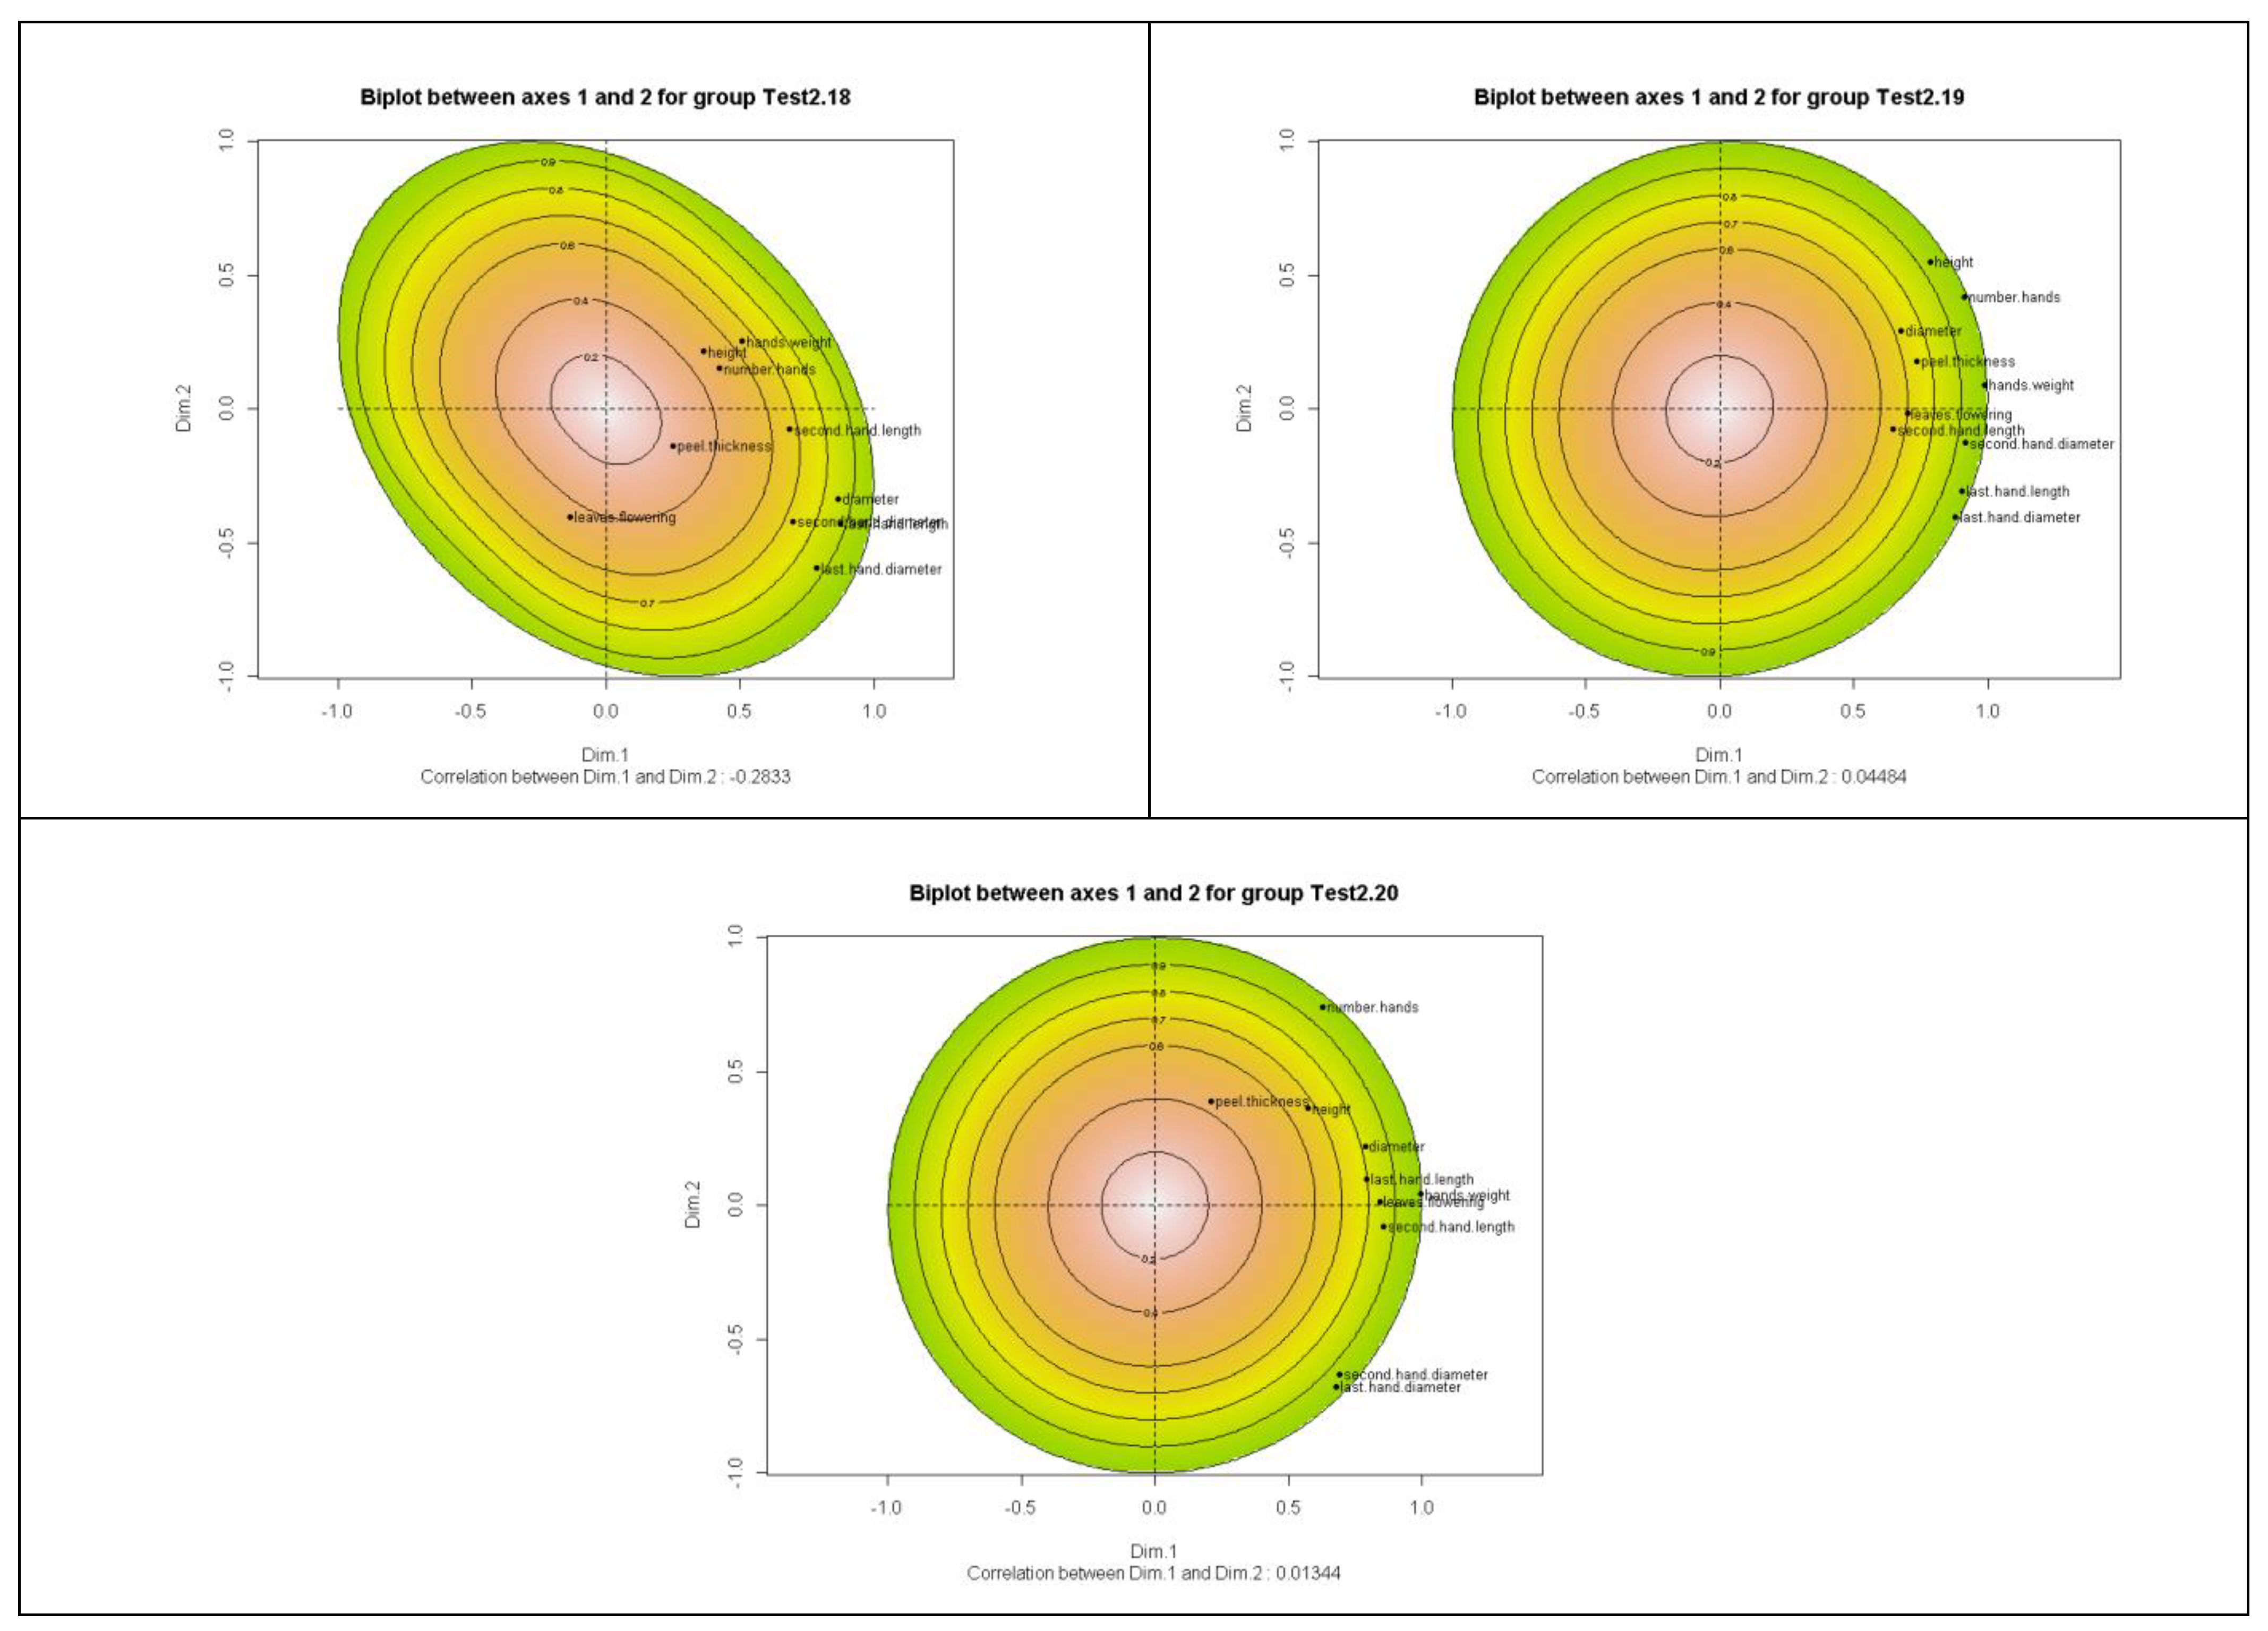
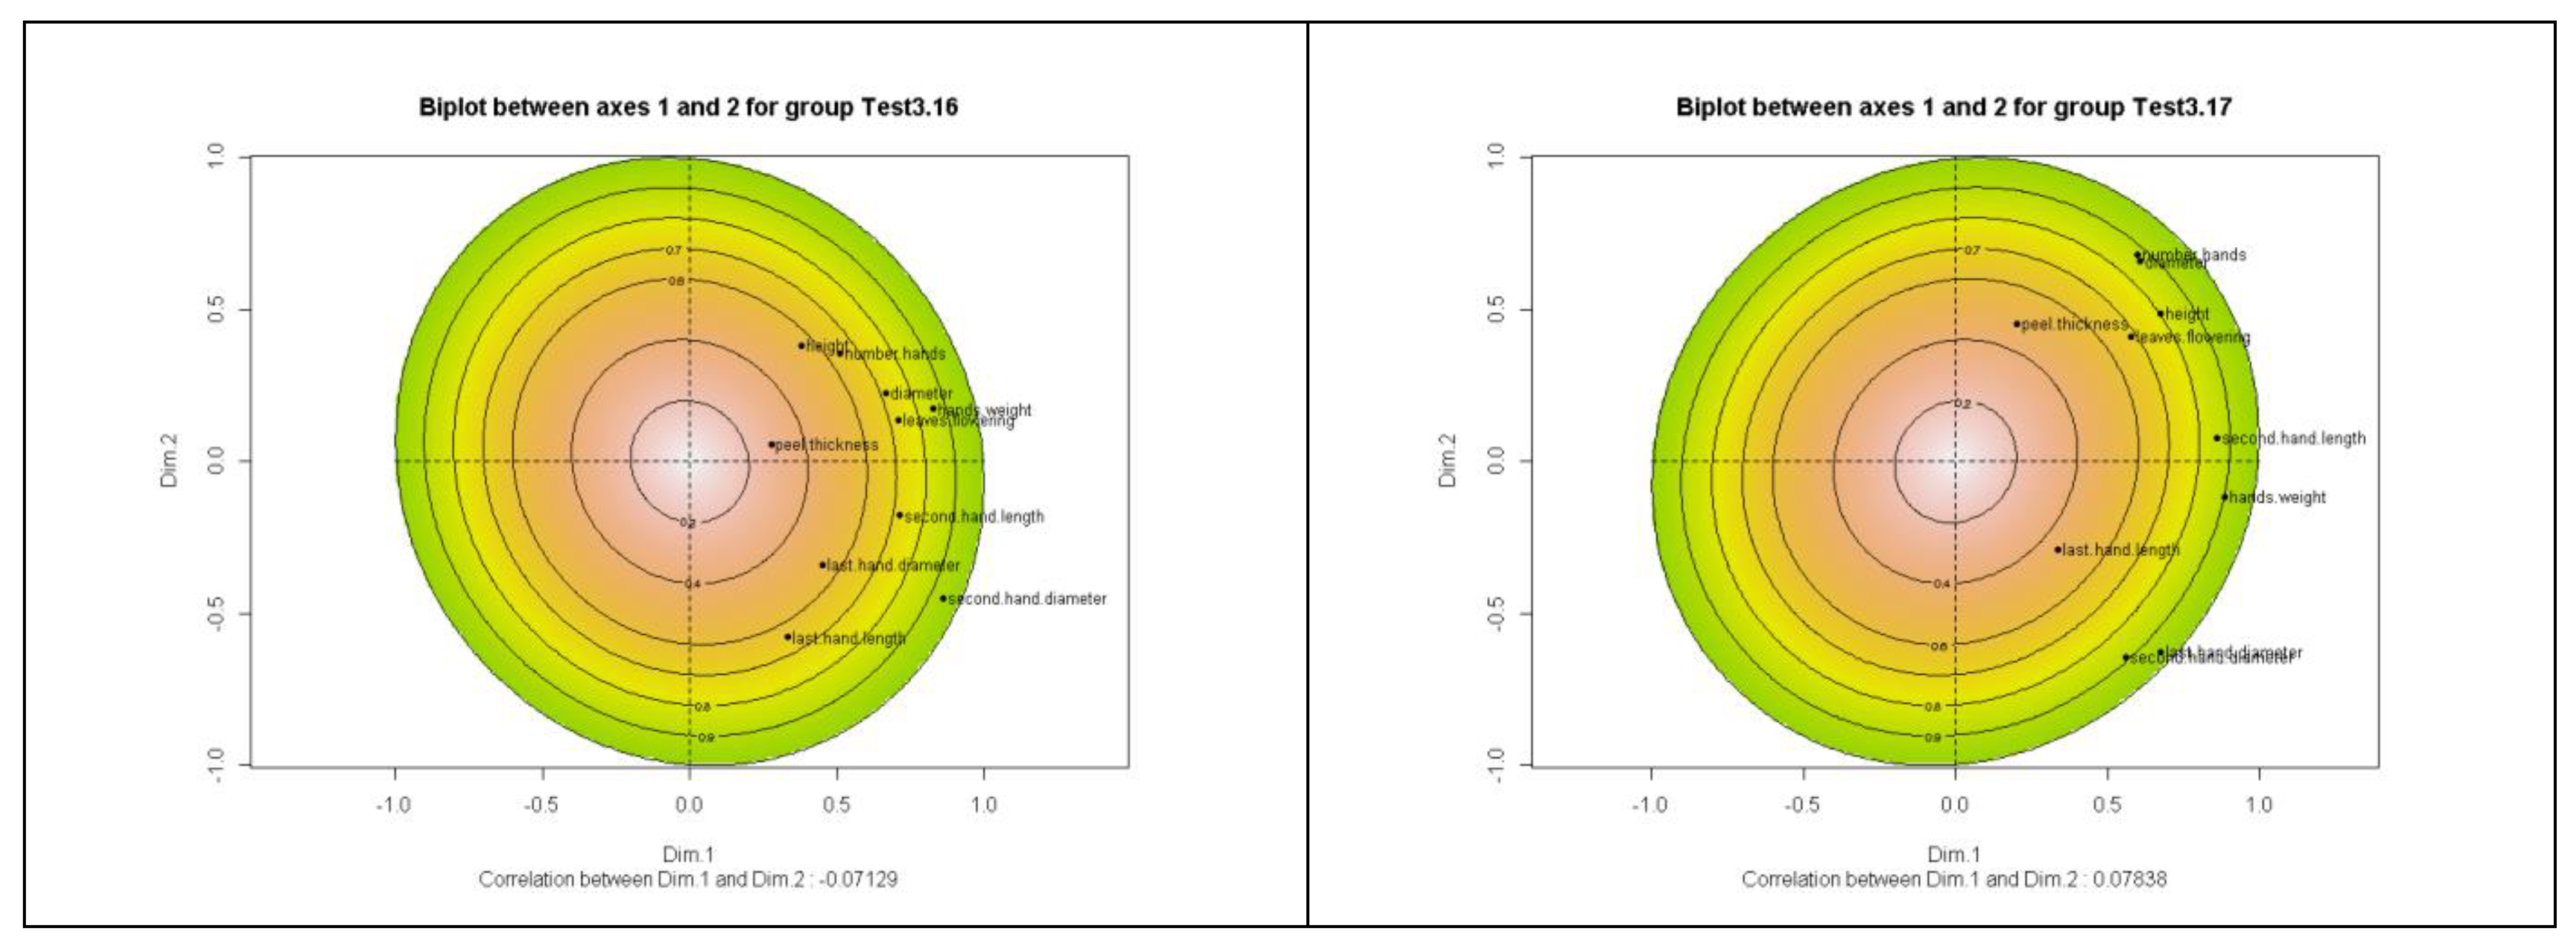
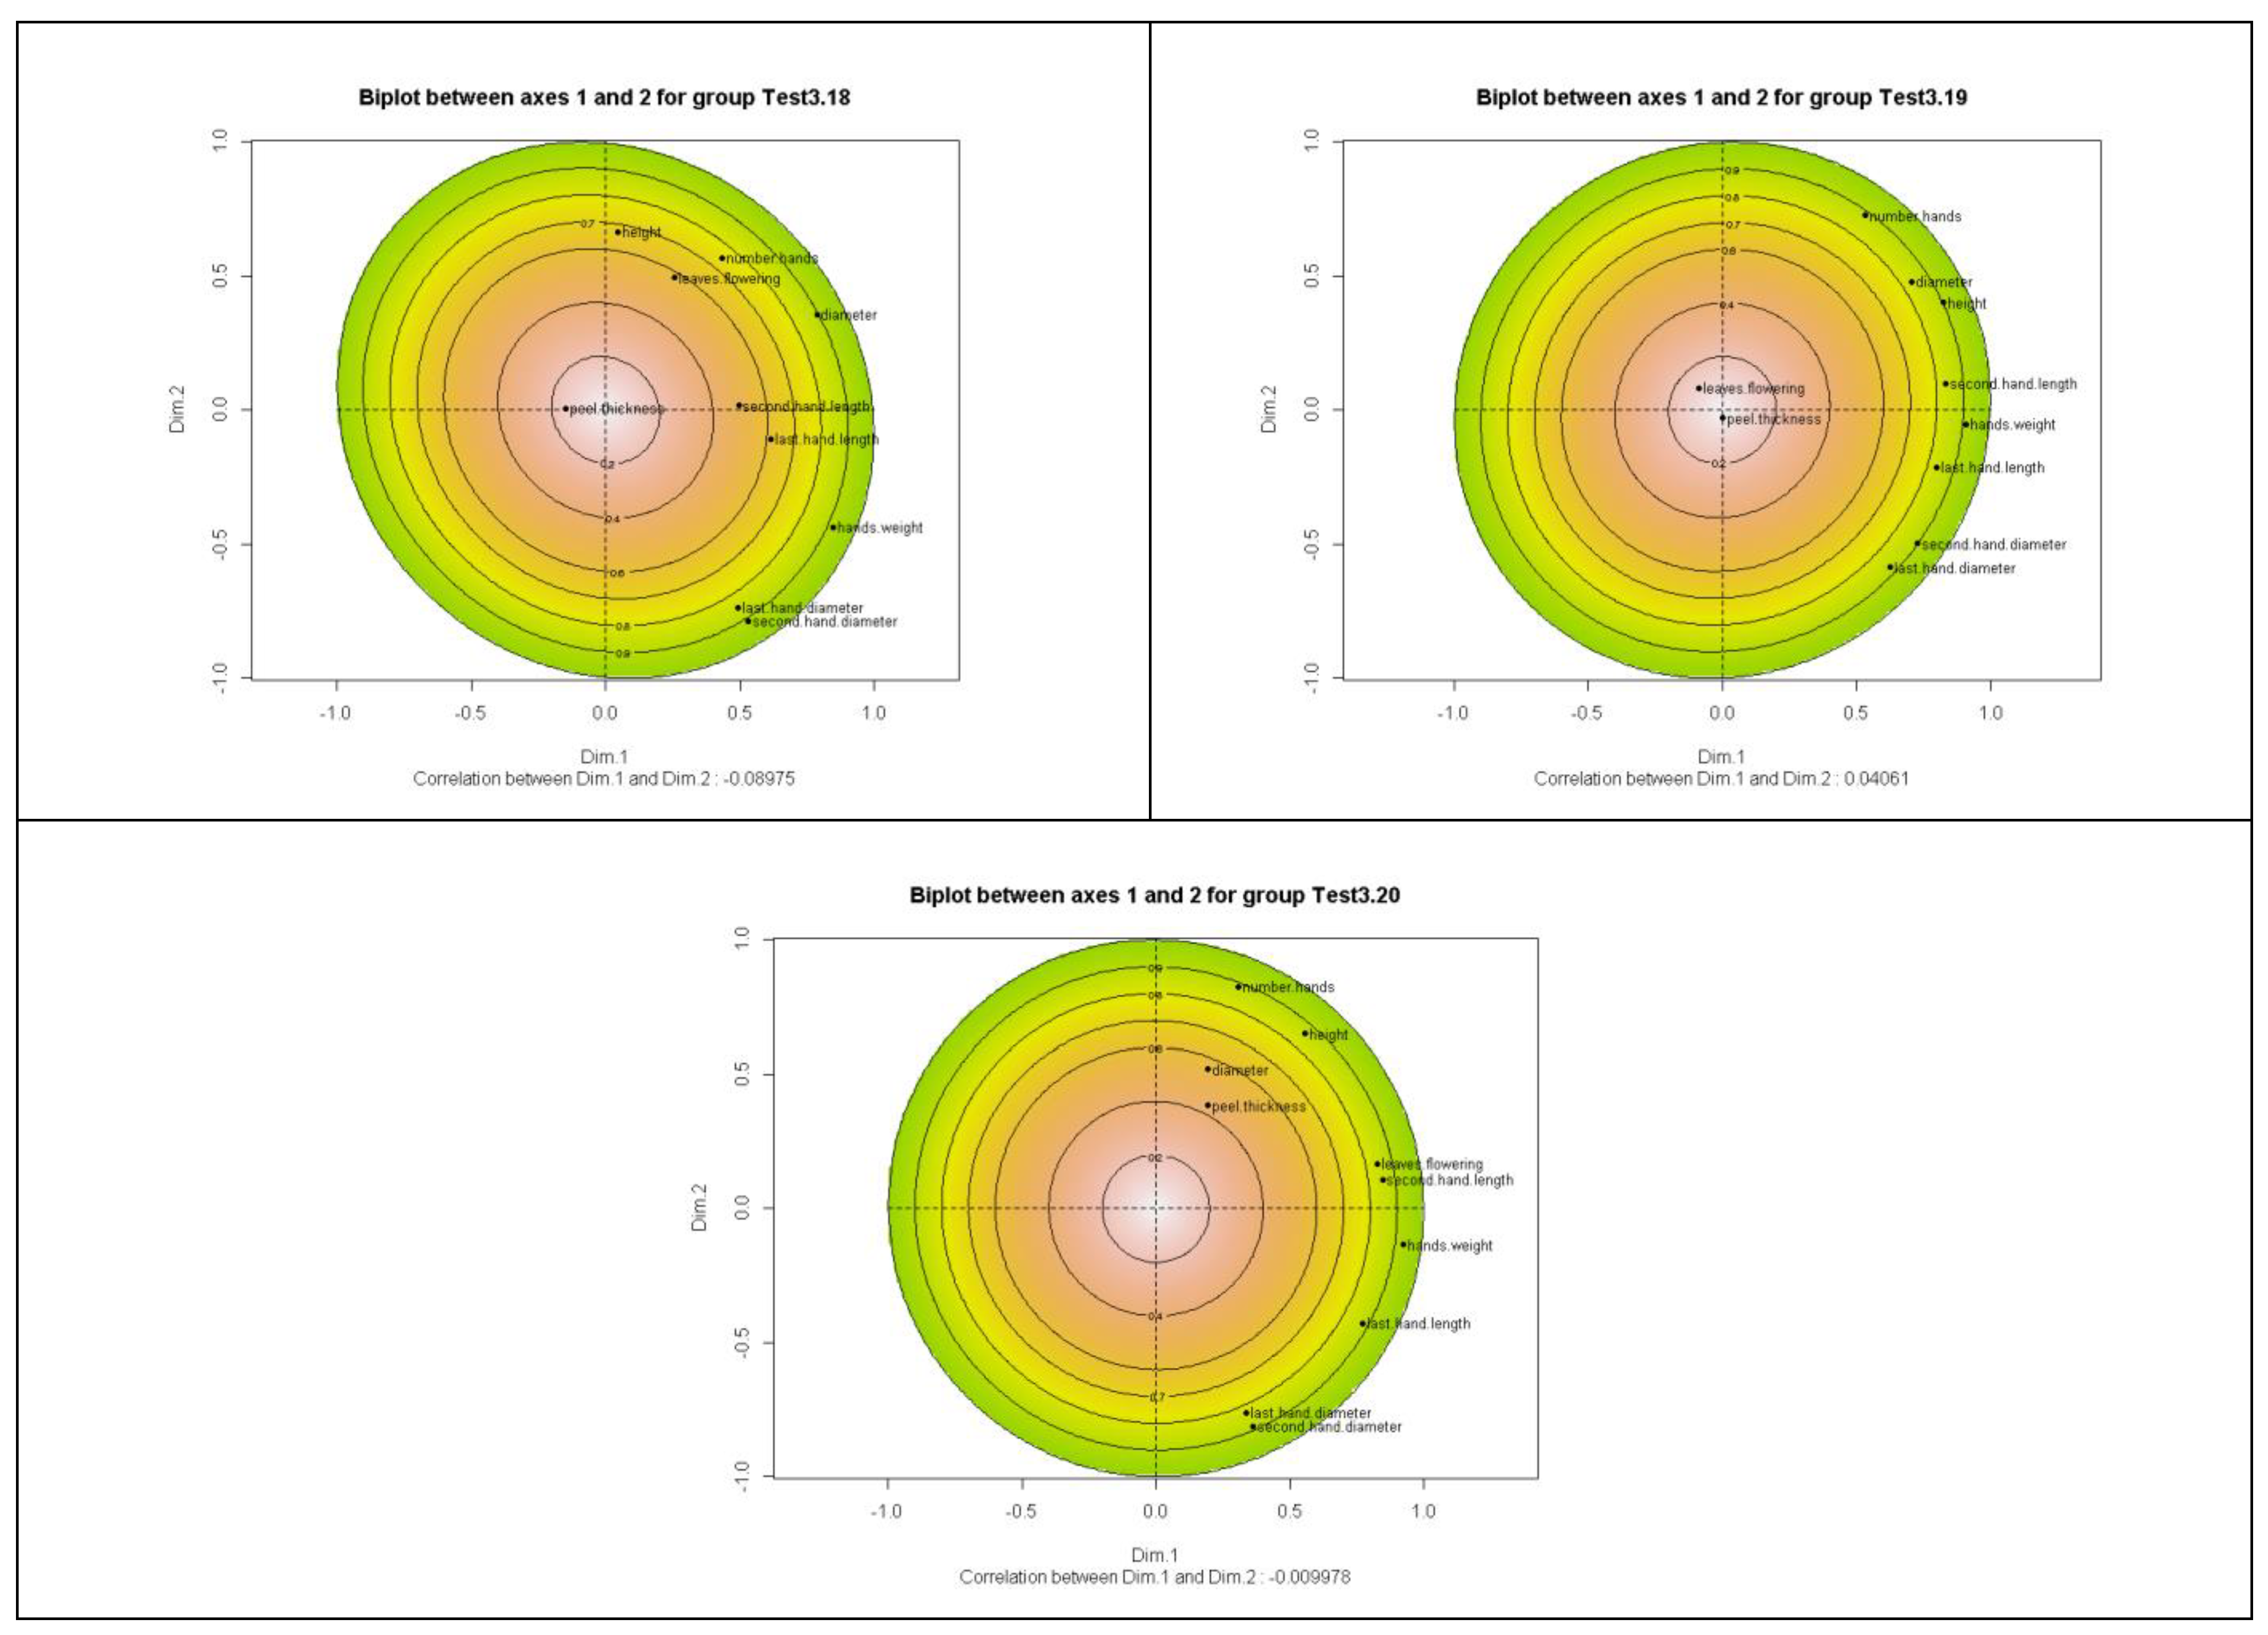
From the representation of the correlation structure of variables on the first factorial plane of the DMFA in each of the groups (
Figure 2,
Figure 3 and
Figure 4) the peel thickness was distinguished by its discrepant behavior throughout the campaigns. However, in general, the rest of the variables did not seem to maintain any predictable trend. Though the statistical robustness of DMFA was more noticeable than that of MFA, results from this research pointed out the existence of highly significant GEI affecting banana production in the province of Formosa.
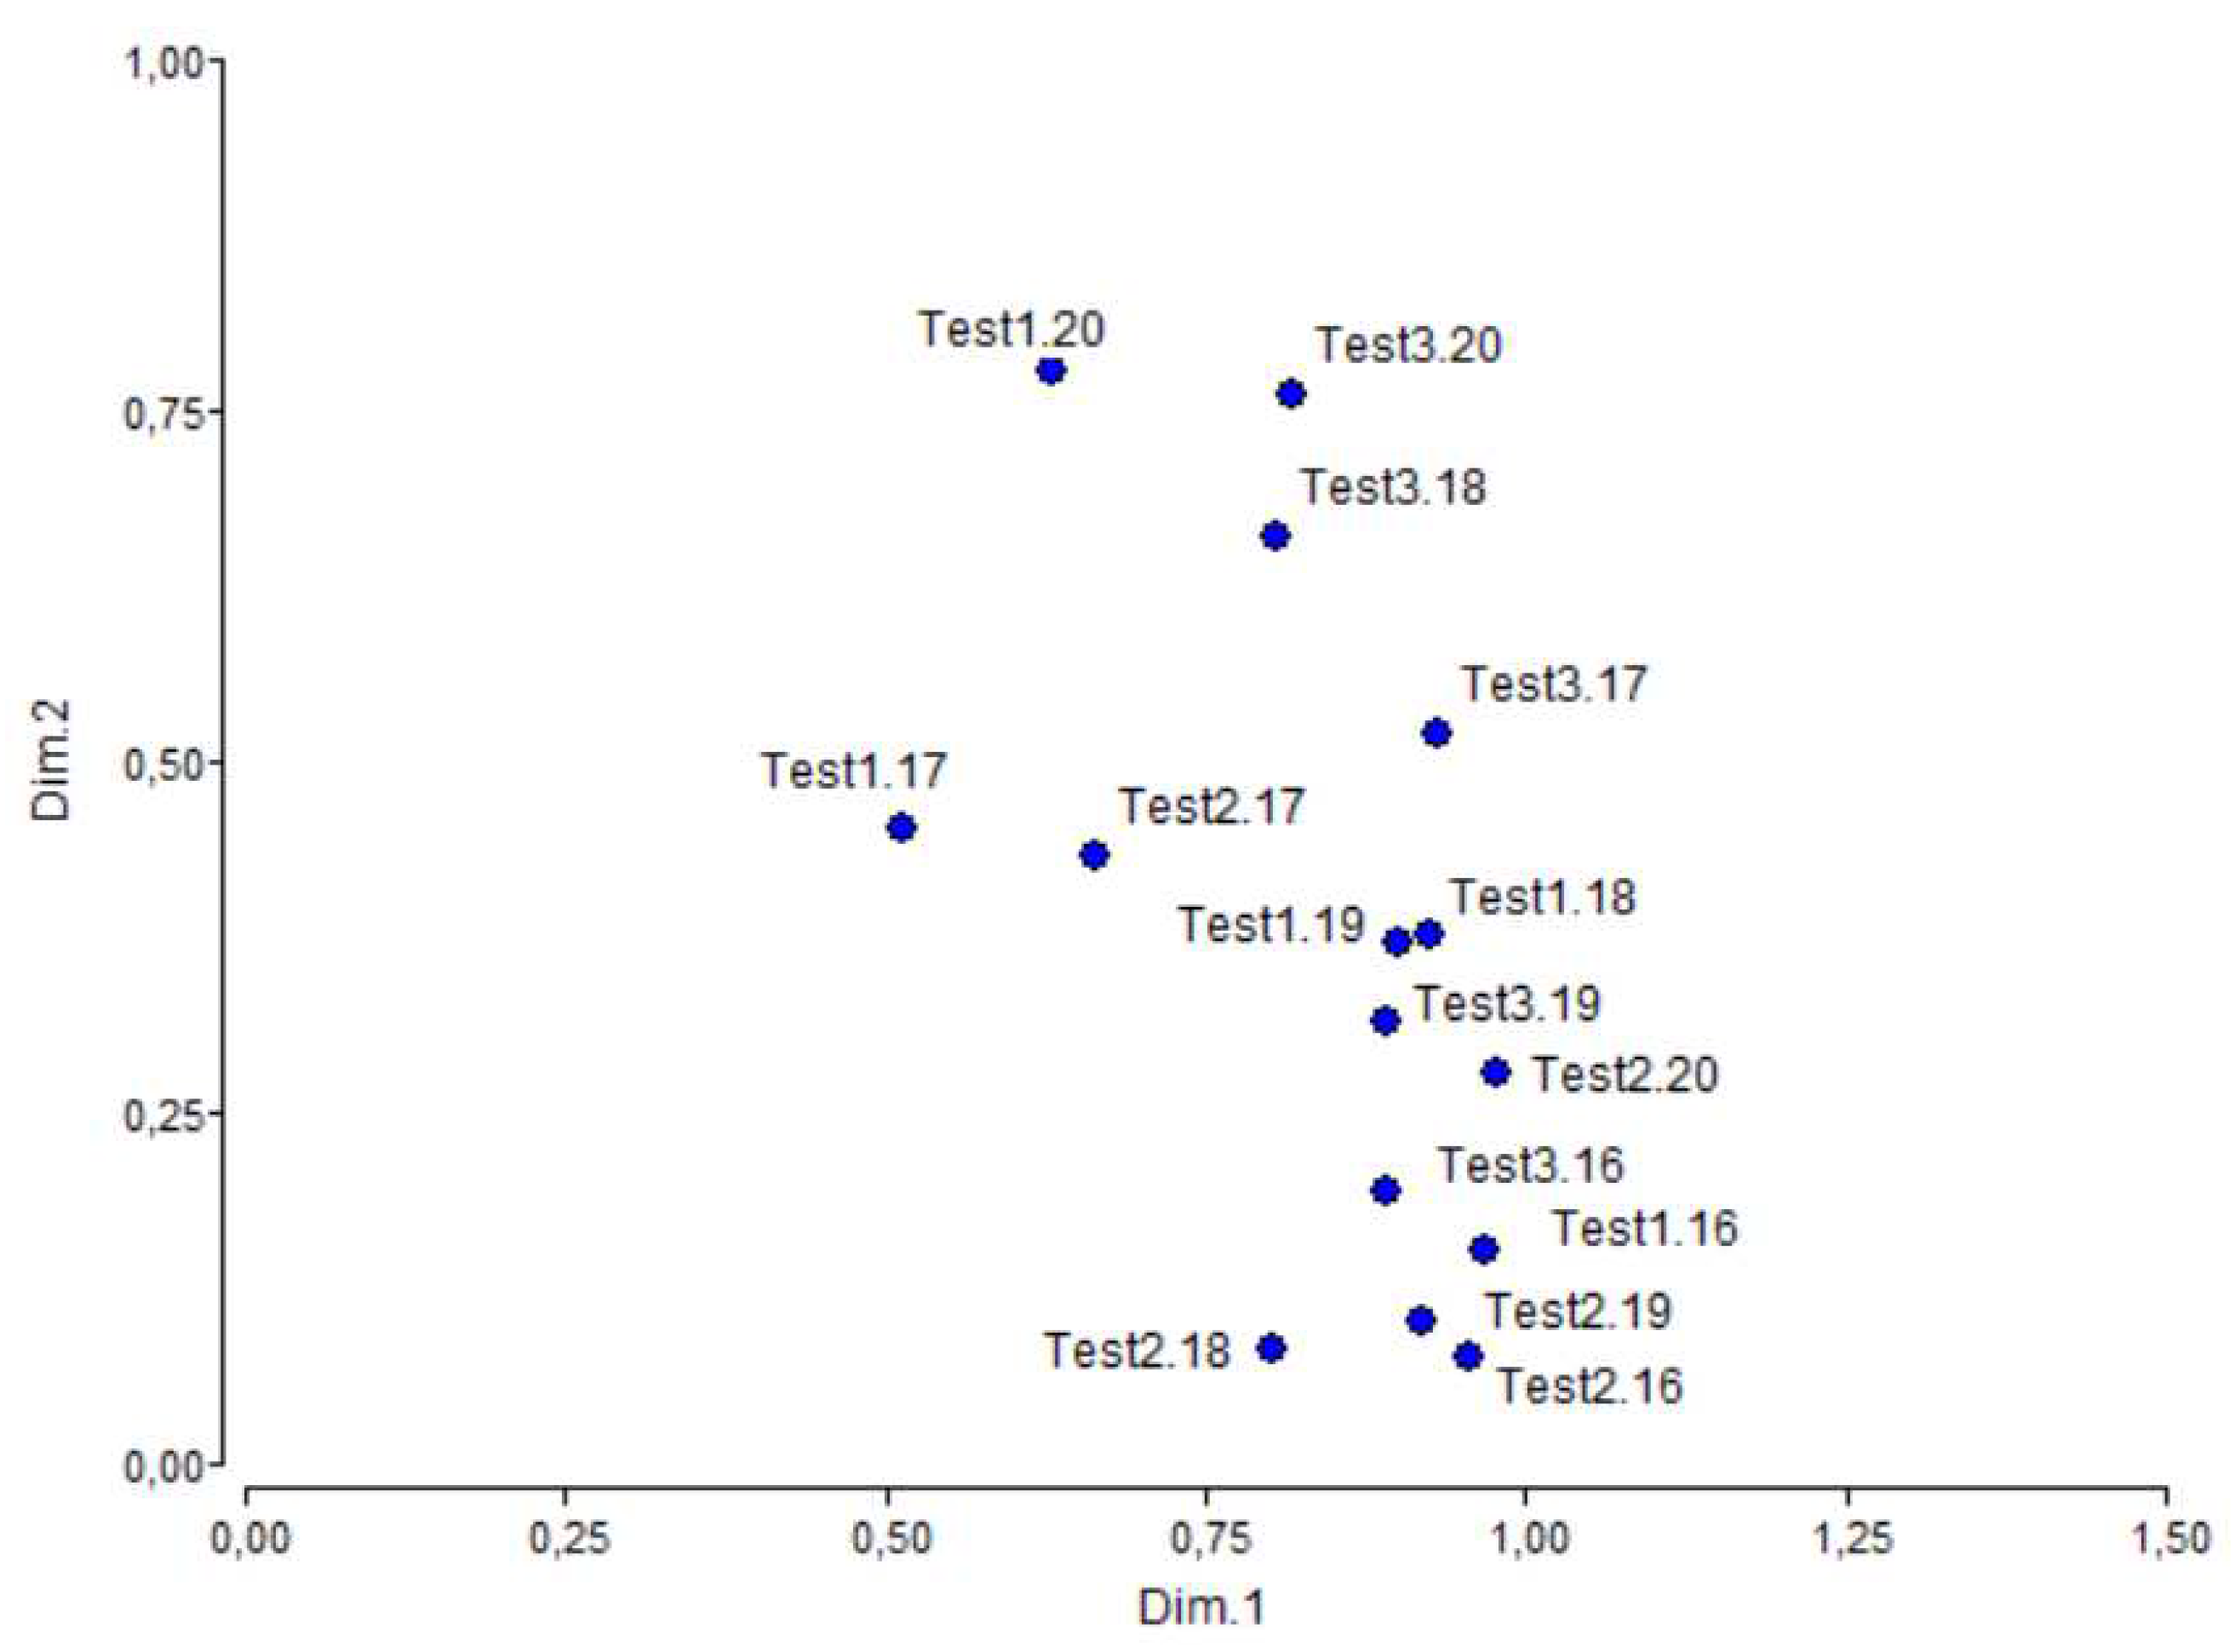
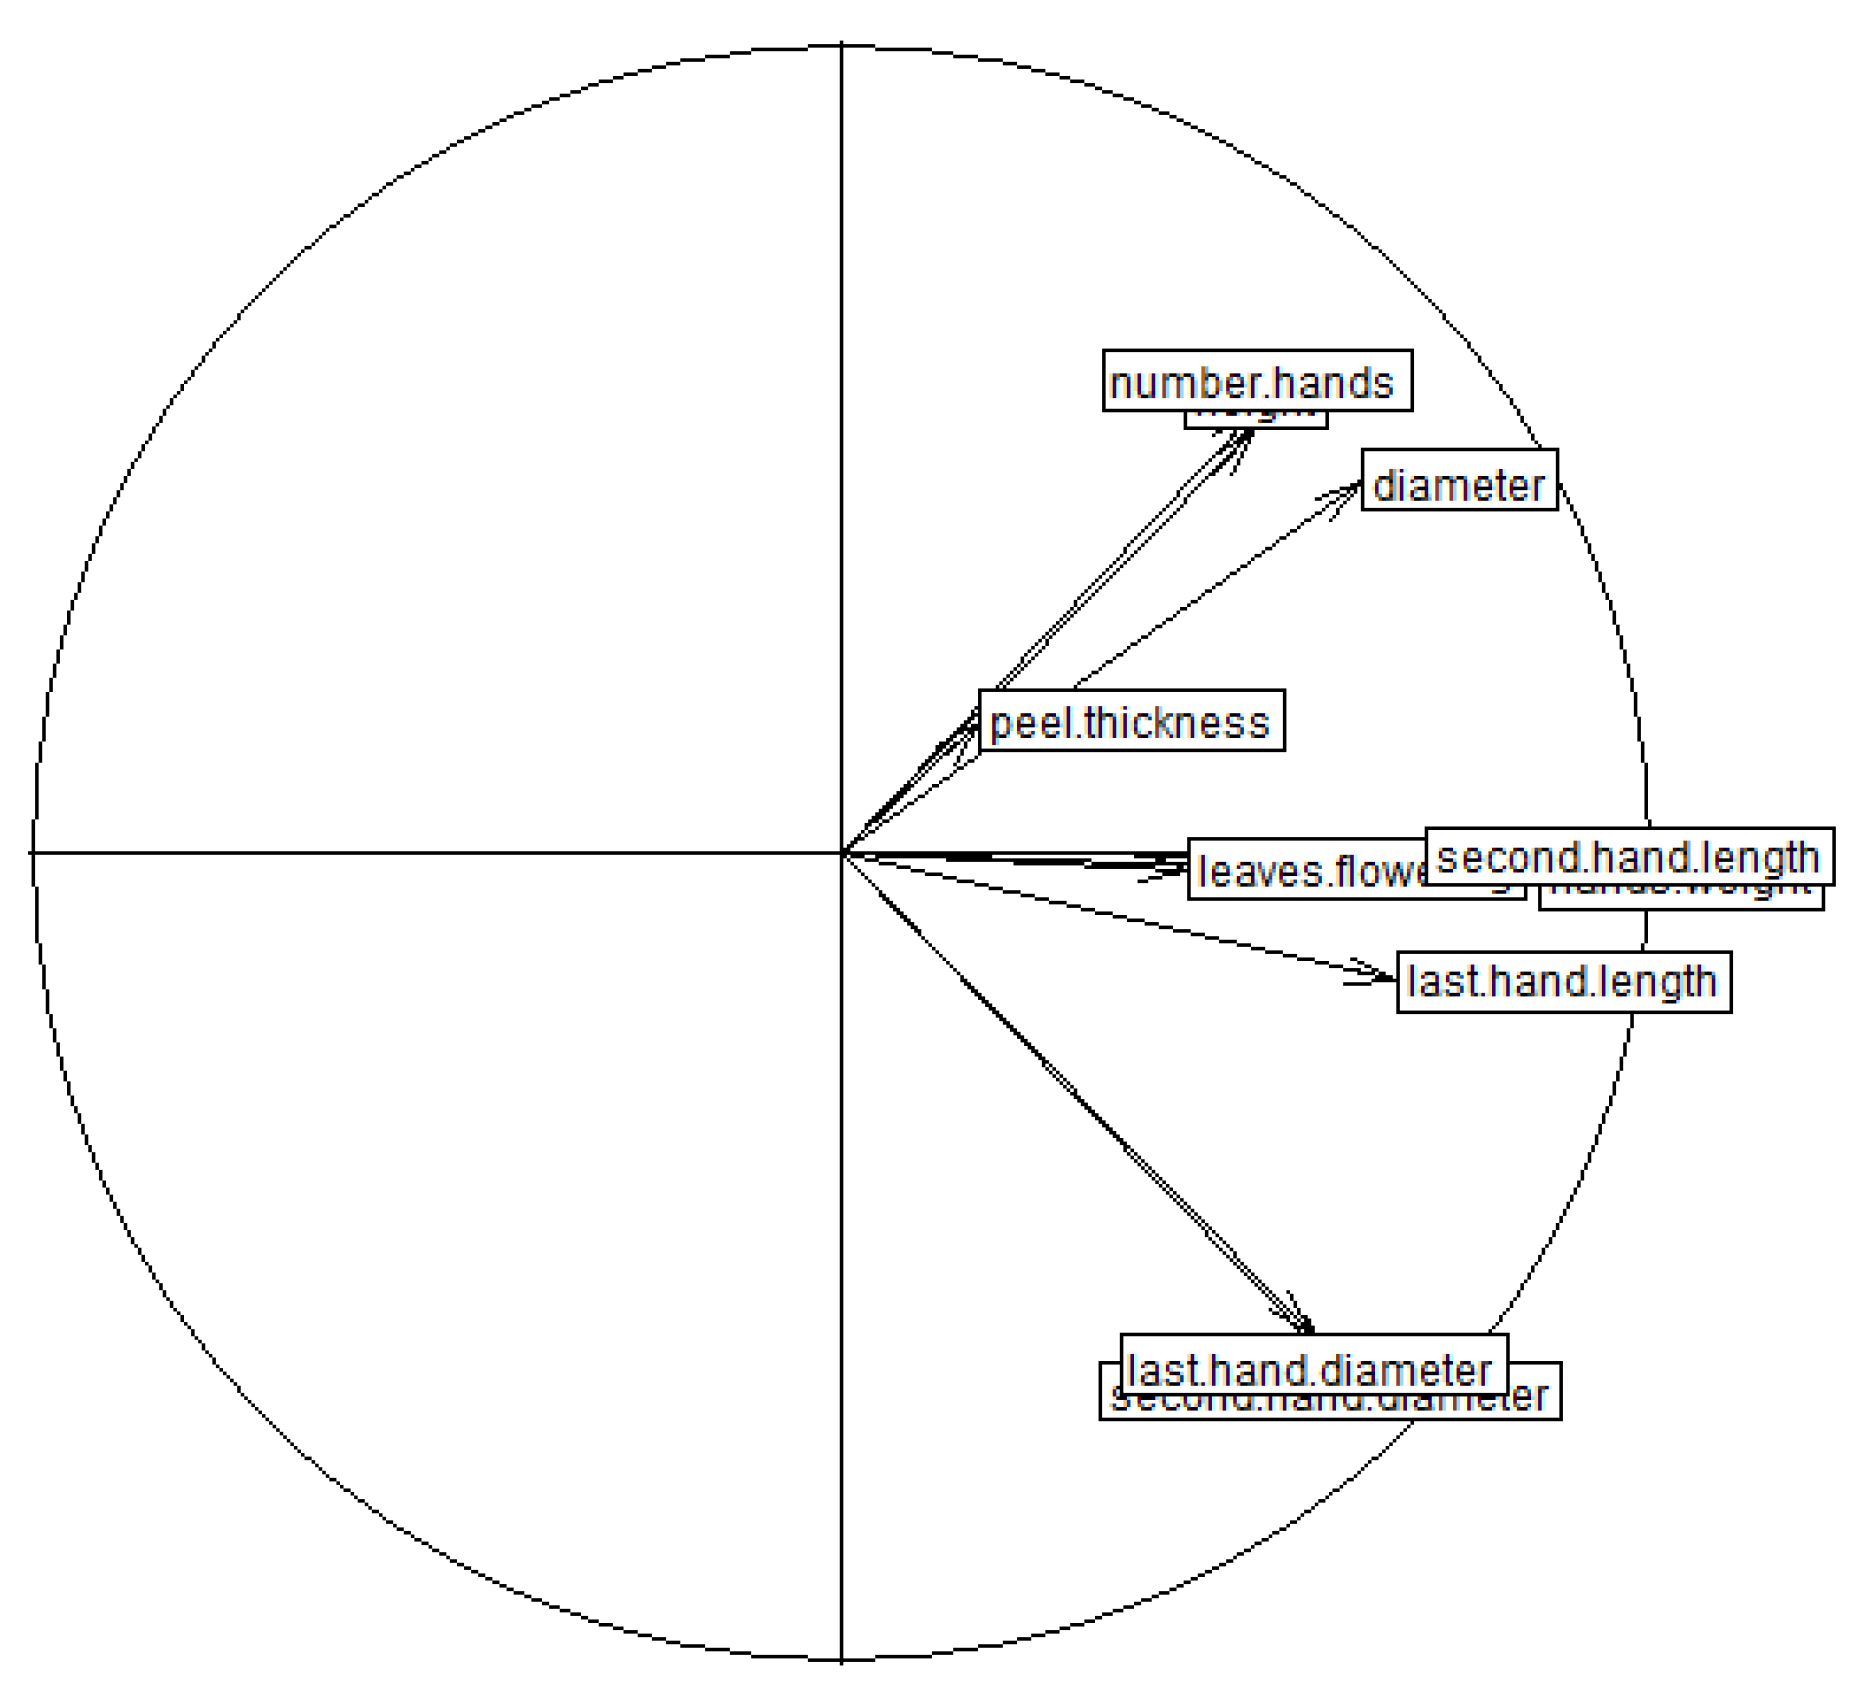
From the representation of the consensus structure of variables on the first factorial plane of the DMFA (
Figure 5), a horizontal gradient formed by the variables hand weight, second hand length, last hand length and leaves at flowering was observed. Instead, an oblique gradient from the 3
rd to the 1
st quadrant with the variable plant diameter, and a vertical one with number of hands and plant height, closely related to each other, were detected. Also, an oblique gradient from the 2
nd to the 4
th quadrant with the variables second hand diameter and second hand diameter was verified. The peel thickness was not significant.
From
Figure 2,
Figure 3 and
Figure 4 and comparing with the consensus structure of the variables (
Figure 5), some tendencies relevant for the agroecological characterization can be obtained. For instance, the correlation between last hand diameter and second hand length remained stable in all campaigns and control tests, except for control test 2 in 2019. Otherwise, the correlation between last hand length and second hand length only remained stable along campaigns for control test 1. For control test 2, it was not verified in 2018 and 2019, and for control test 3 it was only verified for 2018 and 2019. Also, the correlation between number of hands, plant height and plant diameter remained stable for control test 1 except in 2019. In control test 2, there was greater variability and in control test 3 it remained stable. Hand weight was correlated with second hand length and last hand length for control test 1 in 2016, 2017 and 2018. For control test 2, except in 2020, a correlation structure was observed between hand weight, second hand length, last hand length, second hand diameter, and last hand diameter. For control test 3, the correlations between hand weight, second hand length and last hand length were lower. Leaves at flowering and peel thickness presented a changing behavior, being in general the ones that caused the greatest differences between the correlation structures.
Figure 6.
Representation of the individuals for the first two global axes of the DMFA.
Figure 6.
Representation of the individuals for the first two global axes of the DMFA.
Table 5.
Correlations between the variables and for the first two global axes of the DMFA.
Table 5.
Correlations between the variables and for the first two global axes of the DMFA.
| Variables |
Axis 1 |
Axis 2 |
| Height |
0.515 |
0.523 |
| Diameter |
0.647 |
0.461 |
| Leaves to flowering |
0.433 |
-0.020 |
| Number of hands |
0.514 |
0.547 |
| Hands weight |
0.865 |
-0.032 |
| Second hand diameter |
0.604 |
-0.628 |
| Second hand length |
0.725 |
-0.005 |
| Last hand diameter |
0.586 |
-0.597 |
| Last hand length |
0.687 |
-0.159 |
| Peel thickness |
0.174 |
0.163 |
From the
Table 5,
Figure 5 and 6, the projection of the individuals on the axis 1, it could be thought that the controls Test1.17, Test1.20, Test2.17, Test2.18, Test3.18 and Test3.20 are the ones with the lowest hand weight, second hand length and last hand length. On the other hand, from the projection of the individuals on the axis 2, it could be argued that the controls Test2.16, Test2.18, Test2.19, Test1.16 and Test3.16 are the ones with the lowest height, number of hands and diameter but are the ones with the highest second hand diameter and last hand diameter. Instead, the controls Test3.18, Test3.20, Test1.20 are the ones with the highest height, number of hands and diameter but are the ones with the lowest second and last hand diameter values.
The presence of interaction was evident; there was no differentiated behavior by control test.
4. Discussion
As mentioned in Marraccini et al. (2020) it is necessary to explore alternative ways of evaluating the agronomic suitability of new regions, which not only must take into account agroclimatic data but also carry out an evaluation of known genotypes and compare the results that are collated. In this work, the average values of the variables evaluated in these materials are compatible with an agronomic behavior that generates quality and quantity of the fruit produced, since the yield of internationally used banana varieties in the province of Formosa was acceptable. Of course, from an agronomic viewpoint, the opportunity cost of this crop should be compared to those of other crops, and such an economical benefit is favorable to banana even in the present macroeconomic context of Argentina.
Additionally, the use of three-way data analysis techniques allowed visualizing the behavior of the varieties and its interaction with the environment. On the one hand, the MFA evidenced the existence of GEI through the representation of the correlations between the variables. In general, it was observed that the peel thickness presented different correlations with the rest of the variables through the different campaigns under evaluation. Hence the greatest environmental effect was observed for this trait. Likewise, most of the variables presented discrepancies in their correlation structures throughout the years studied, but a less environmental effect was observed for these traits. As described in Results section, correlation structure of important agronomic traits varied among tester varieties and campaigns, thus indicating not only genotype and environment effects but also interaction GxE on their expression. This evidence was verified by the ANOVA, being especially remarkable the GEI detected in the variables diameter, weight of hands, diameter and length of the secondhand and peel thickness. The significant effect of GEI detected in this research when evaluating international varieties may be due to the new environmental challenges that the subtropical northeastern region of Formosa presents to genotypes developed for being cultivated in more traditional tropical areas of banana production. But, as a positive issue, it also suggests that adapted genotypes should be present in the wide genetic variability reported by Ermini et al. (2018). In other words, intuitive in situ selection made by farmers along the extensive period of banana cultivation in the region must have generated resilient genotypes at their production systems that respond to varying environment conditions so that yield and quality may be maintained assuring the economical rent. The adequate agroecological aptitude of Formosa northeastern region to produce banana by evaluating known varieties has been demonstrated in this research according to the values obtained for important agronomic traits. Hence, the next challenge is to detect in the local variability the most promising genotypes in order to form and release the first Argentinian banana variety by usufructing the rich genetic resources in terms of resilience intuitively generated in the local farms by producer. This way of taking benefit from folk knowledge is the basis for a more sustainable agronomy.
The application of DMFA in evaluating the agroecological aptitude of a given region showed to be superior to that of MFA since it allowed the consideration and interpretation of the GEI. Hence, the appropriate characterization of the agroecological aptitude of the province of Formosa, Argentina was achieved by DMFA in this research. In conclusion, the subtropical environment of this region is suitable for banana production because the reference genotypes presented a good performance, as presented in
Table 1. However, the existence of GEI indicates that each variety responds differently, providing a reference framework for the evaluation of promising clones collected in producer fields. Hence, the use of variability available
in situ for the formation of a national variety adapted to environmental rigor must be done based on high resilience.
Author Contributions
Del Medico wrote the manuscript with the support of Tenaglia and Pratta. Tenaglia carried out the design of the experiment and performed the measurements. Analytical methods were verified by Lavalle and Vitelleschi. Pratta advised Del Medico to investigate the feasibility of a three-way data analysis to characterize the agroecological suitability of a subtropical region for banana production and supervised the findings of this work. All authors discussed the results and contributed to the final manuscript.
Acknowledgments
This research was supported by the Consejo Nacional de Investigaciones Científicas y Técnicas (CONICET), the Agencia Nacional de Promoción Científica y Tecnológica (ANPCyT) and the Instituto Nacional de Tecnología Agropecuaria (INTA).
Conflicts of Interests
The authors do not report a conflict of interest
Abbreviations
DMFA, Dual Multiple Factor Analysis; GEI, Genotype x Environment Interaction; IPAF, Institute for Research and Technological Development for Family; Agriculture; MFA, Multiple Factor Analysis; PCA, Principal Component Analysis
Core Ideas:
three varieties of banana evaluated in a sub-tropical region during five consecutive campaigns
this region appeared as a promising subtropical agroecological environment to produce banana
varieties’ performances were acceptable for large scale production systems
all traits showed a great variation across years and genotypes the fruit peel thickness being the most discrepant throughout the campaigns
References
- Abdi, H. Neil Salkind (Eds.). (2007). RV coefficient and congruence coefficient. Thousand Oaks. ISBN 978-1-4129-1611-0.
- Arias, P.; Dankers, C.; Liu, P.; Pilkauskas, P. (Eds.). (2004). La economía mundial del banano 1985-2002 (N° 1). Food & Agriculture Org.
- Colque, O.; Tenaglia, G. (2010). Situación actual de la producción, cosecha, poscosecha y comercialización del banano, Formosa, Argentina. I Simposio Cono Sur. Joinville SC Brasil.
- Dagnew, A.; Assefa, W.; Kebede, G.; Ayele, L.; Mulualem, T.; Mensa, A.; Kenbon, D.; Gabrekirstos, E.; Minuye, m.; Alemu, A.; Beker, J.; Seyoum, M. Evaluation of Banana (Musa spp.) Cultivars for Growth, Yield and Fruit Quality. Ethiopian Journal of Agricultural Sciences 2021, 31, 1–25. [Google Scholar]
- Del Medico, A. P.; Cabodevila, V. G.; Vitelleschi, M. S.; Pratta, G. R. Multivariate estimate of heritability for quality traits in tomatoes by three-way data analysis. Pesquisa Agropecuária Brasileira 2019, 54, e00064. [Google Scholar] [CrossRef]
- Del Medico, A. P.; Cabodevila, V. G.; Vitelleschi, M. S.; Pratta, G. R. Characterization of tomato generations according to a three-way data analysis. Bragantia 2020, 79. [Google Scholar] [CrossRef]
- Del Medico, A. P.; Tenaglia, G.; Lavalle, A. L.; Vitelleschi M., S.; Pratta G., R. Analysis of mixed data to select banana clones (Musa spp.) to be included in a germplasm bank. BAG. Journal of Basic and Applied Genetics 2021, XXXII. [Google Scholar] [CrossRef]
- Ermini, J. L.; Tenaglia, G.; Pratta, G. R. Molecular Diversity in Selected Banana clones (Musa AAA Cavendish) Adapted to the Subtropical Environment of Formosa province (Argentina). American Journal of Plant Sciences, 2018, 9, 2504–2513. [Google Scholar] [CrossRef]
- Lê, S.; Pagès, J. DMFA: Dual Multiple Factor Analysis. Communications in Statistics - Theory and Methods 2010, 39, 483–492. [Google Scholar] [CrossRef]
- Marraccini, E.; AyerdiGotor, A.; Scheurer, O.; Leclercq, C. An Innovative Land Suitability Method to Assess the Potential for the Introduction of a New Crop at a Regional Level. Agronomy 2020, 10, 1–24. [Google Scholar] [CrossRef]
- Uazire, A.; Ribeiro, C.; Ruth BilaMussane, C.; Pillay, M.; Blomme, G.; Fraser, C.; Staver, C.; Karamura, E. Preliminary Evaluation Of Improved Banana Varieties In Mozambique. African Crop Science Journal 2010, 16, 17–25. [Google Scholar] [CrossRef]
|
Disclaimer/Publisher’s Note: The statements, opinions and data contained in all publications are solely those of the individual author(s) and contributor(s) and not of MDPI and/or the editor(s). MDPI and/or the editor(s) disclaim responsibility for any injury to people or property resulting from any ideas, methods, instructions or products referred to in the content. |
© 2023 by the authors. Licensee MDPI, Basel, Switzerland. This article is an open access article distributed under the terms and conditions of the Creative Commons Attribution (CC BY) license (http://creativecommons.org/licenses/by/4.0/).
