Submitted:
22 November 2023
Posted:
23 November 2023
You are already at the latest version
Abstract
Keywords:
1. Introduction
2. Material and methods
2.1. Experimental design
2.2. Sampling technique
2.3. Laboratory materials and methods
Method of plastic particles separation
Microscopic investigations of MPs
Methods for MPs identification
3. Results and discussion
3.1. Characterization of floating plastics particles
3.2. Microscopic analysis of separated MPs
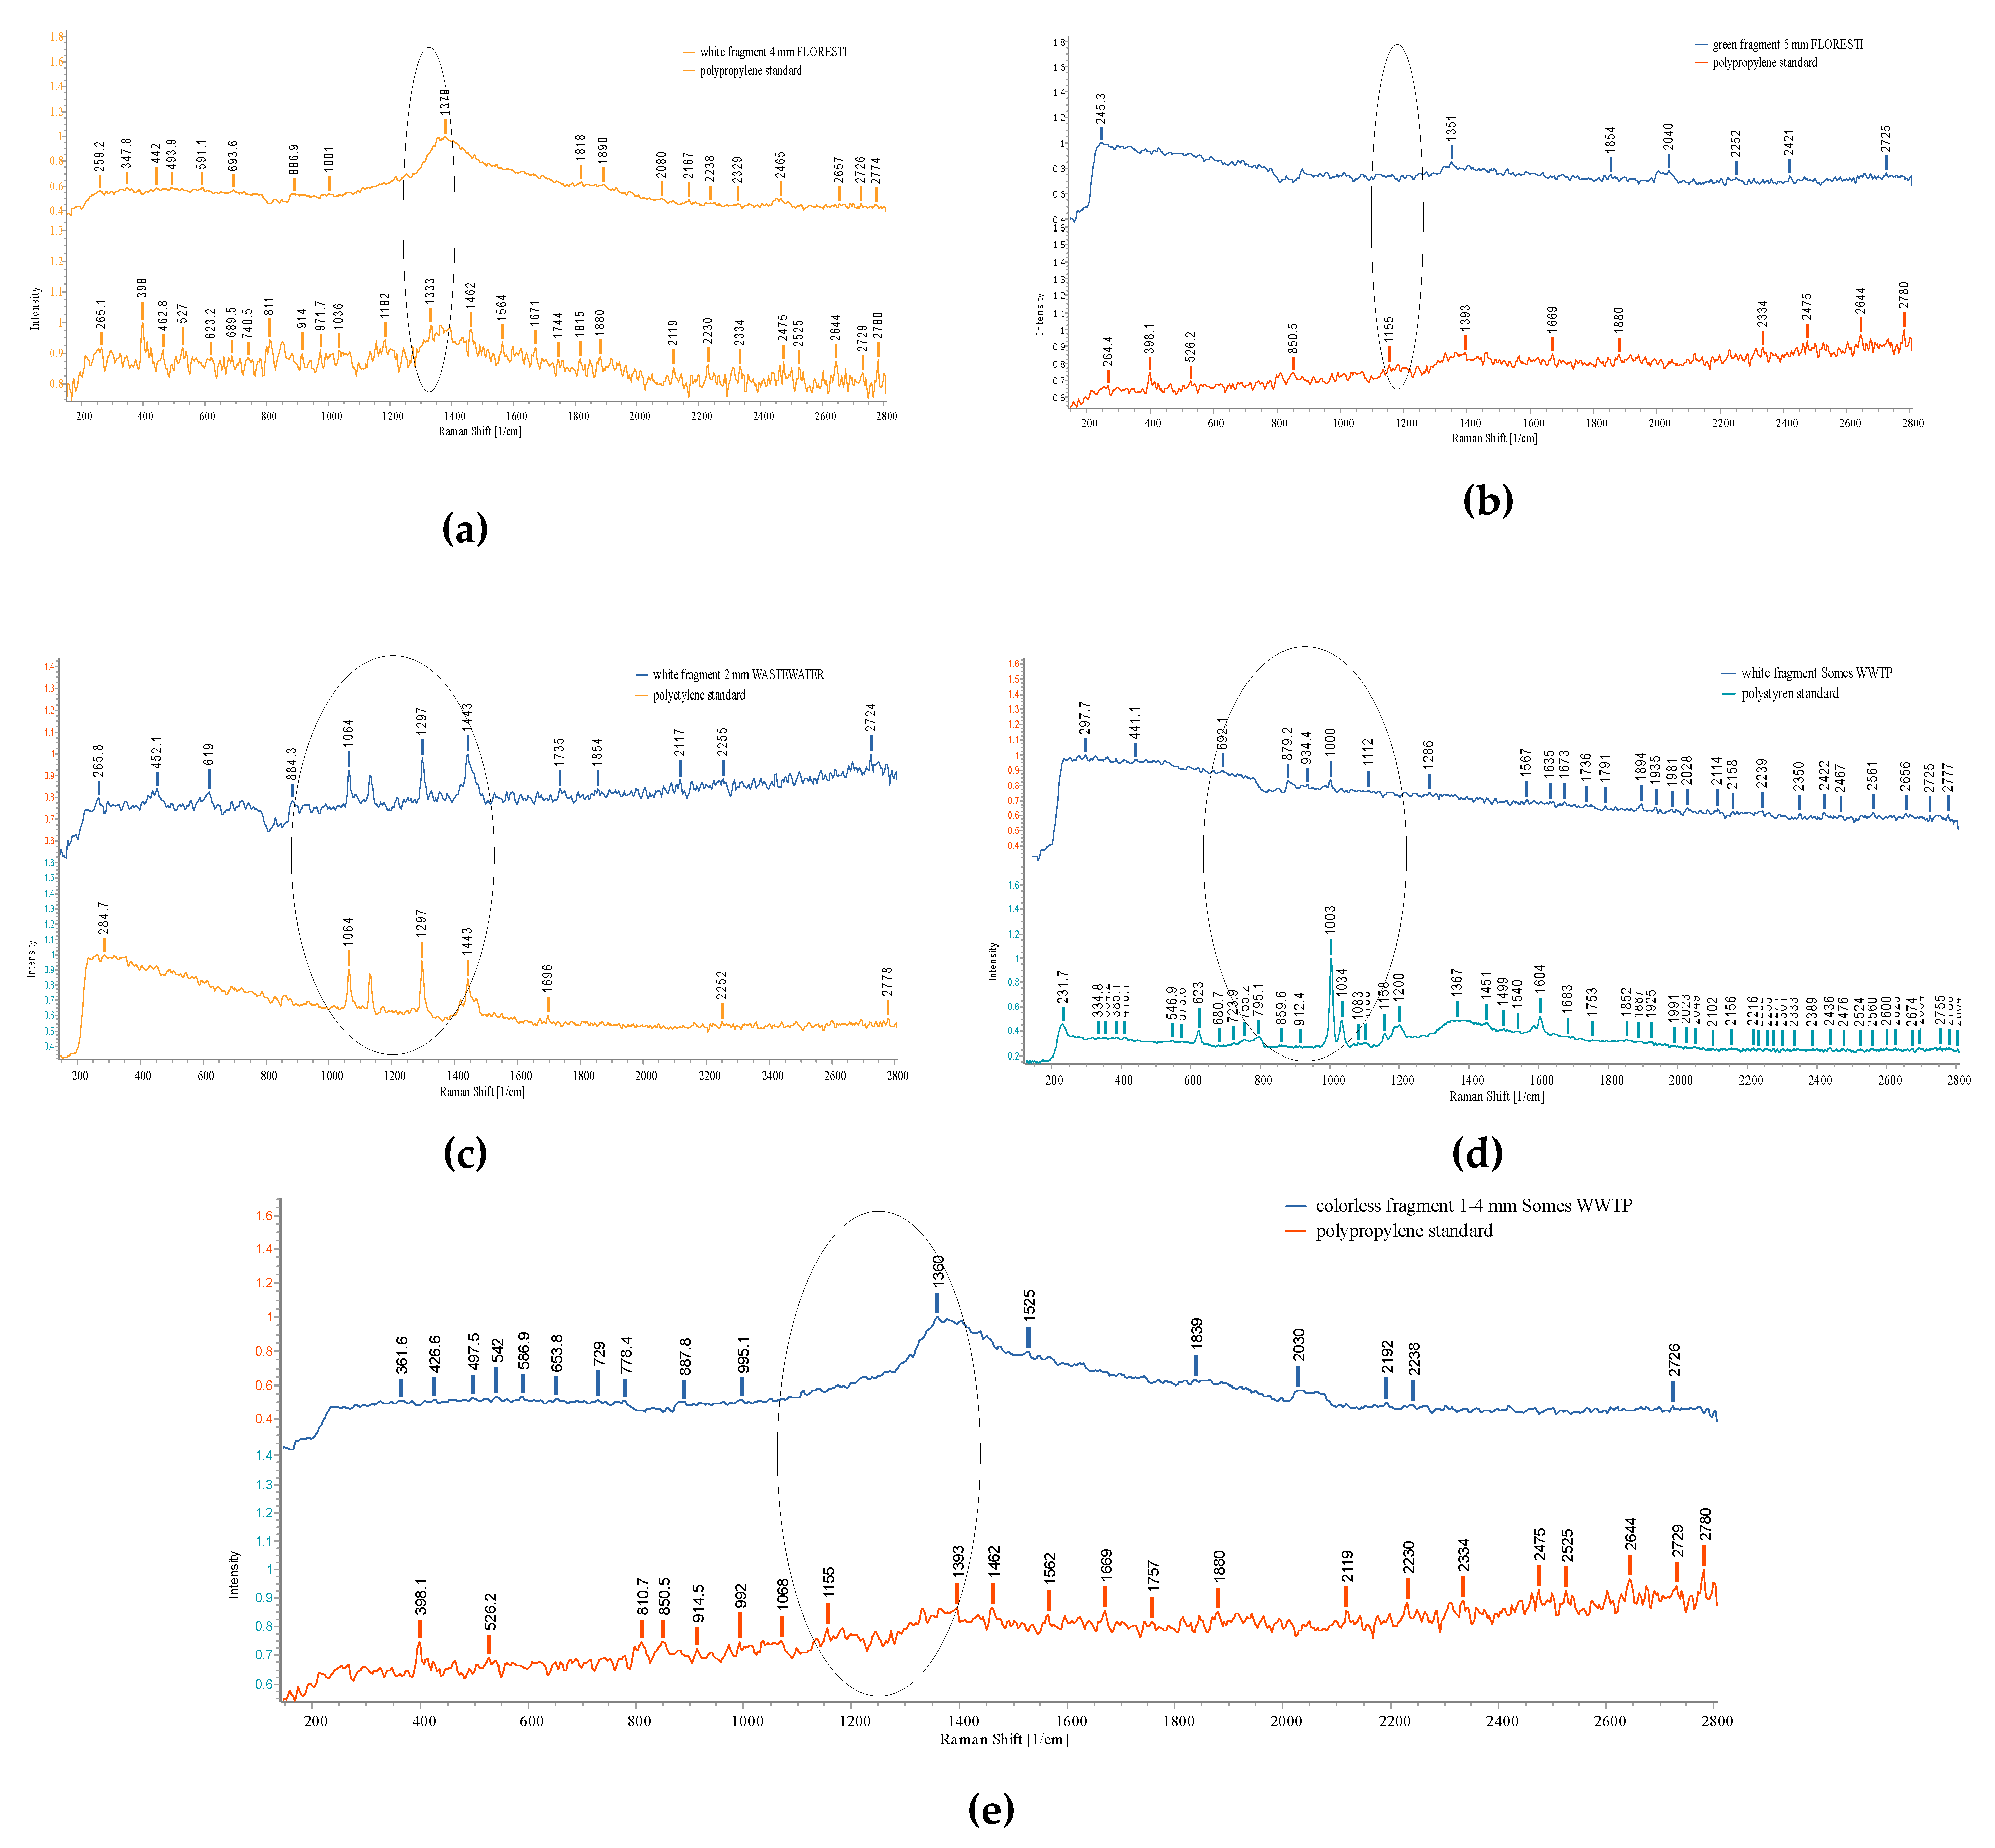
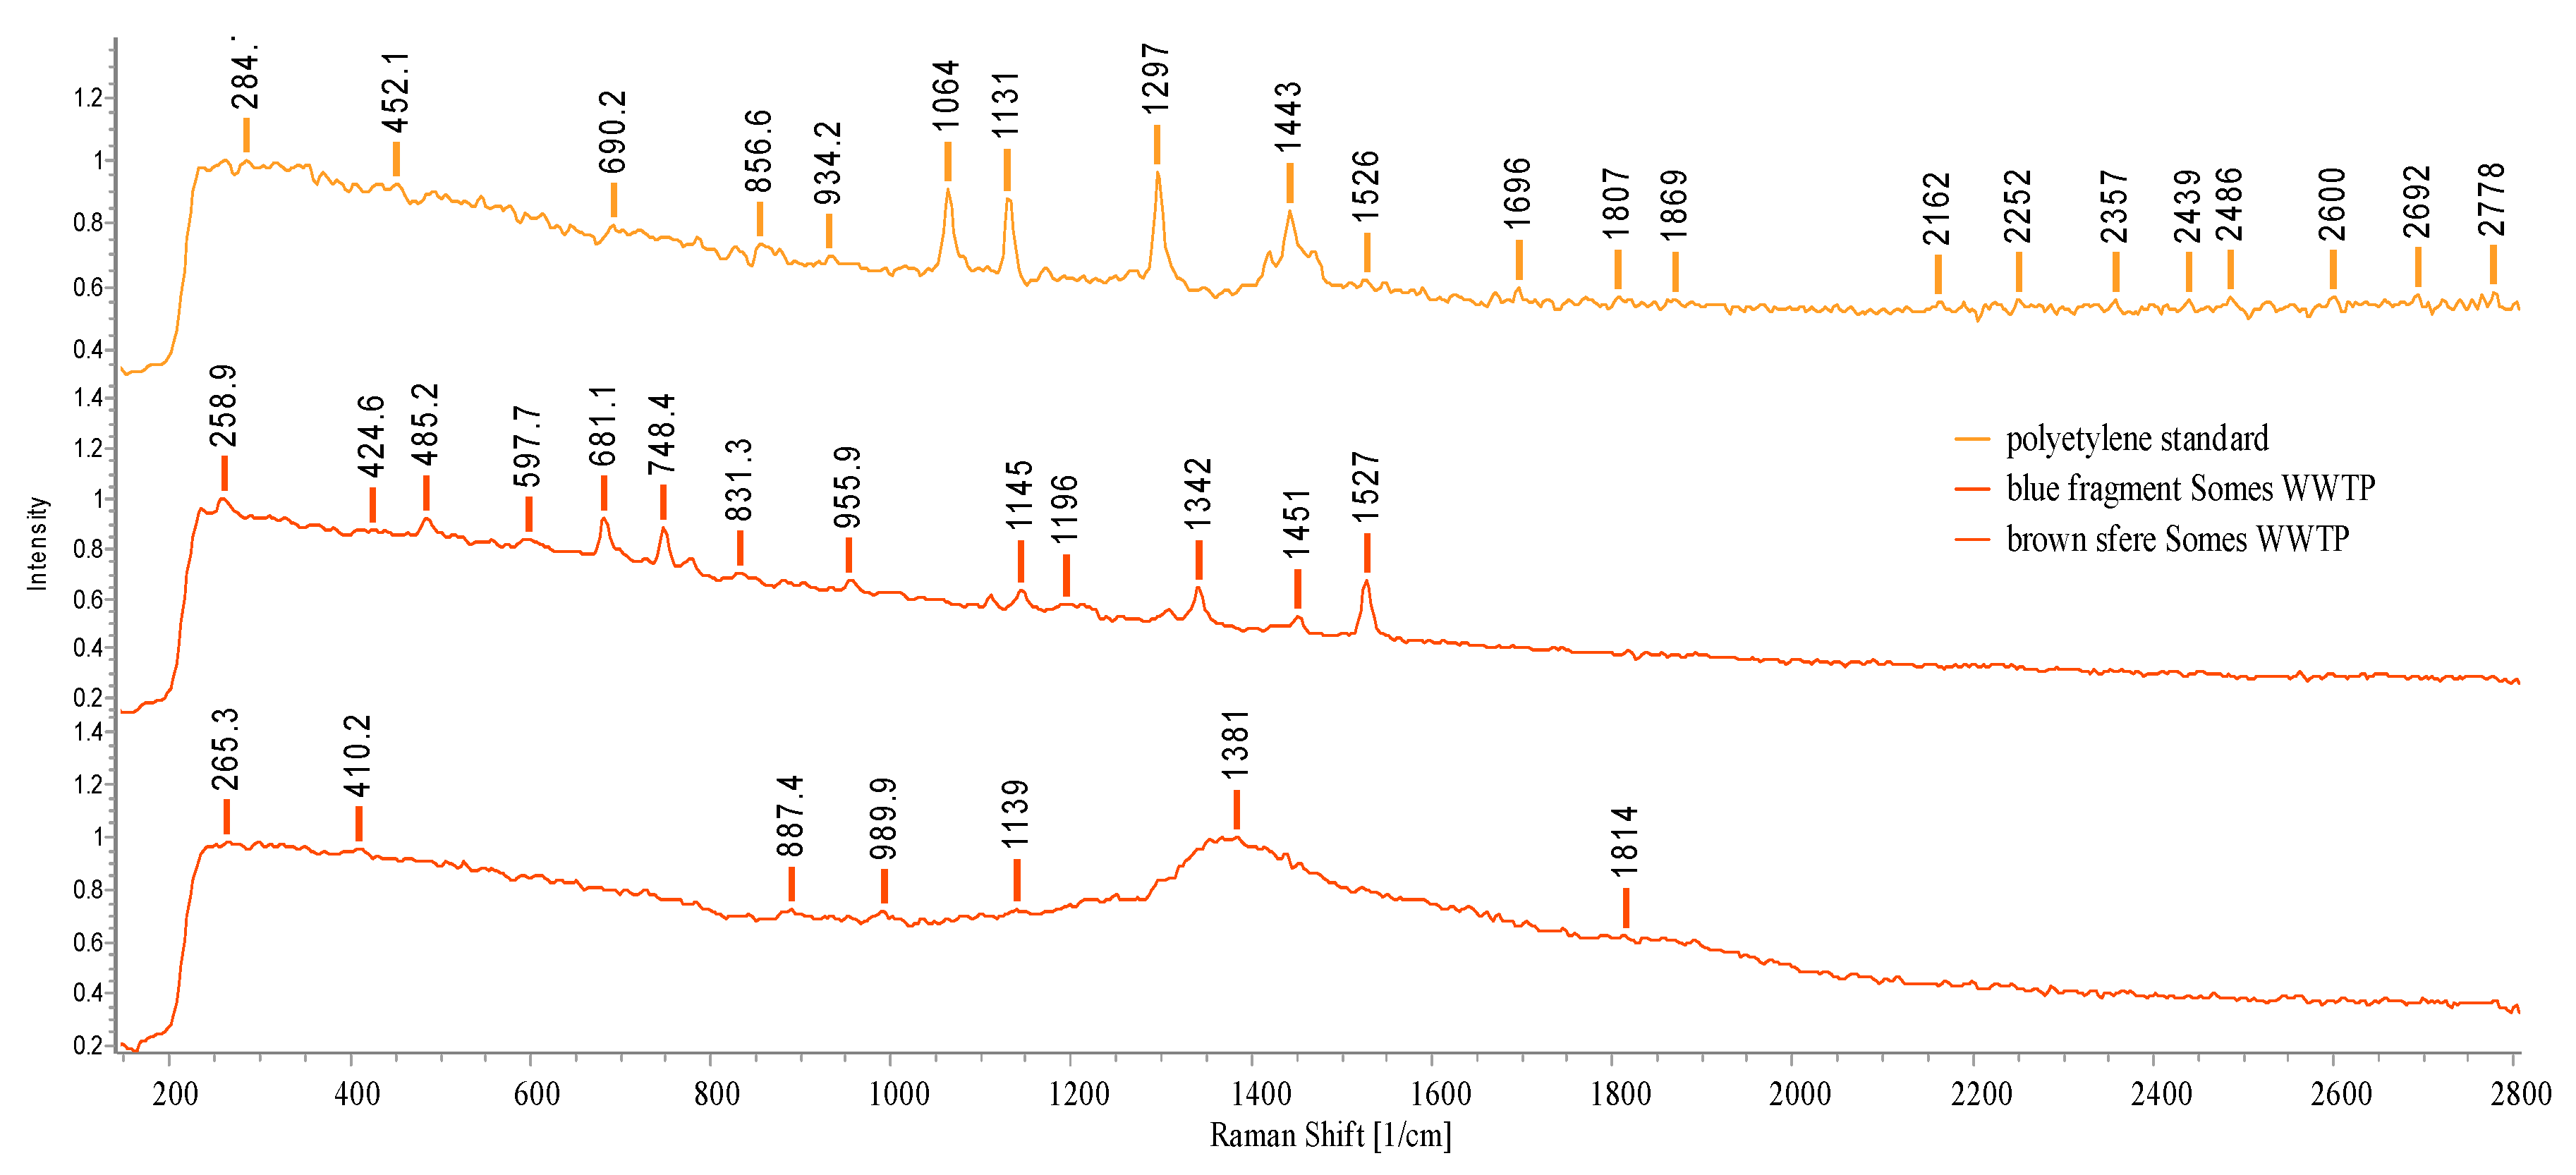
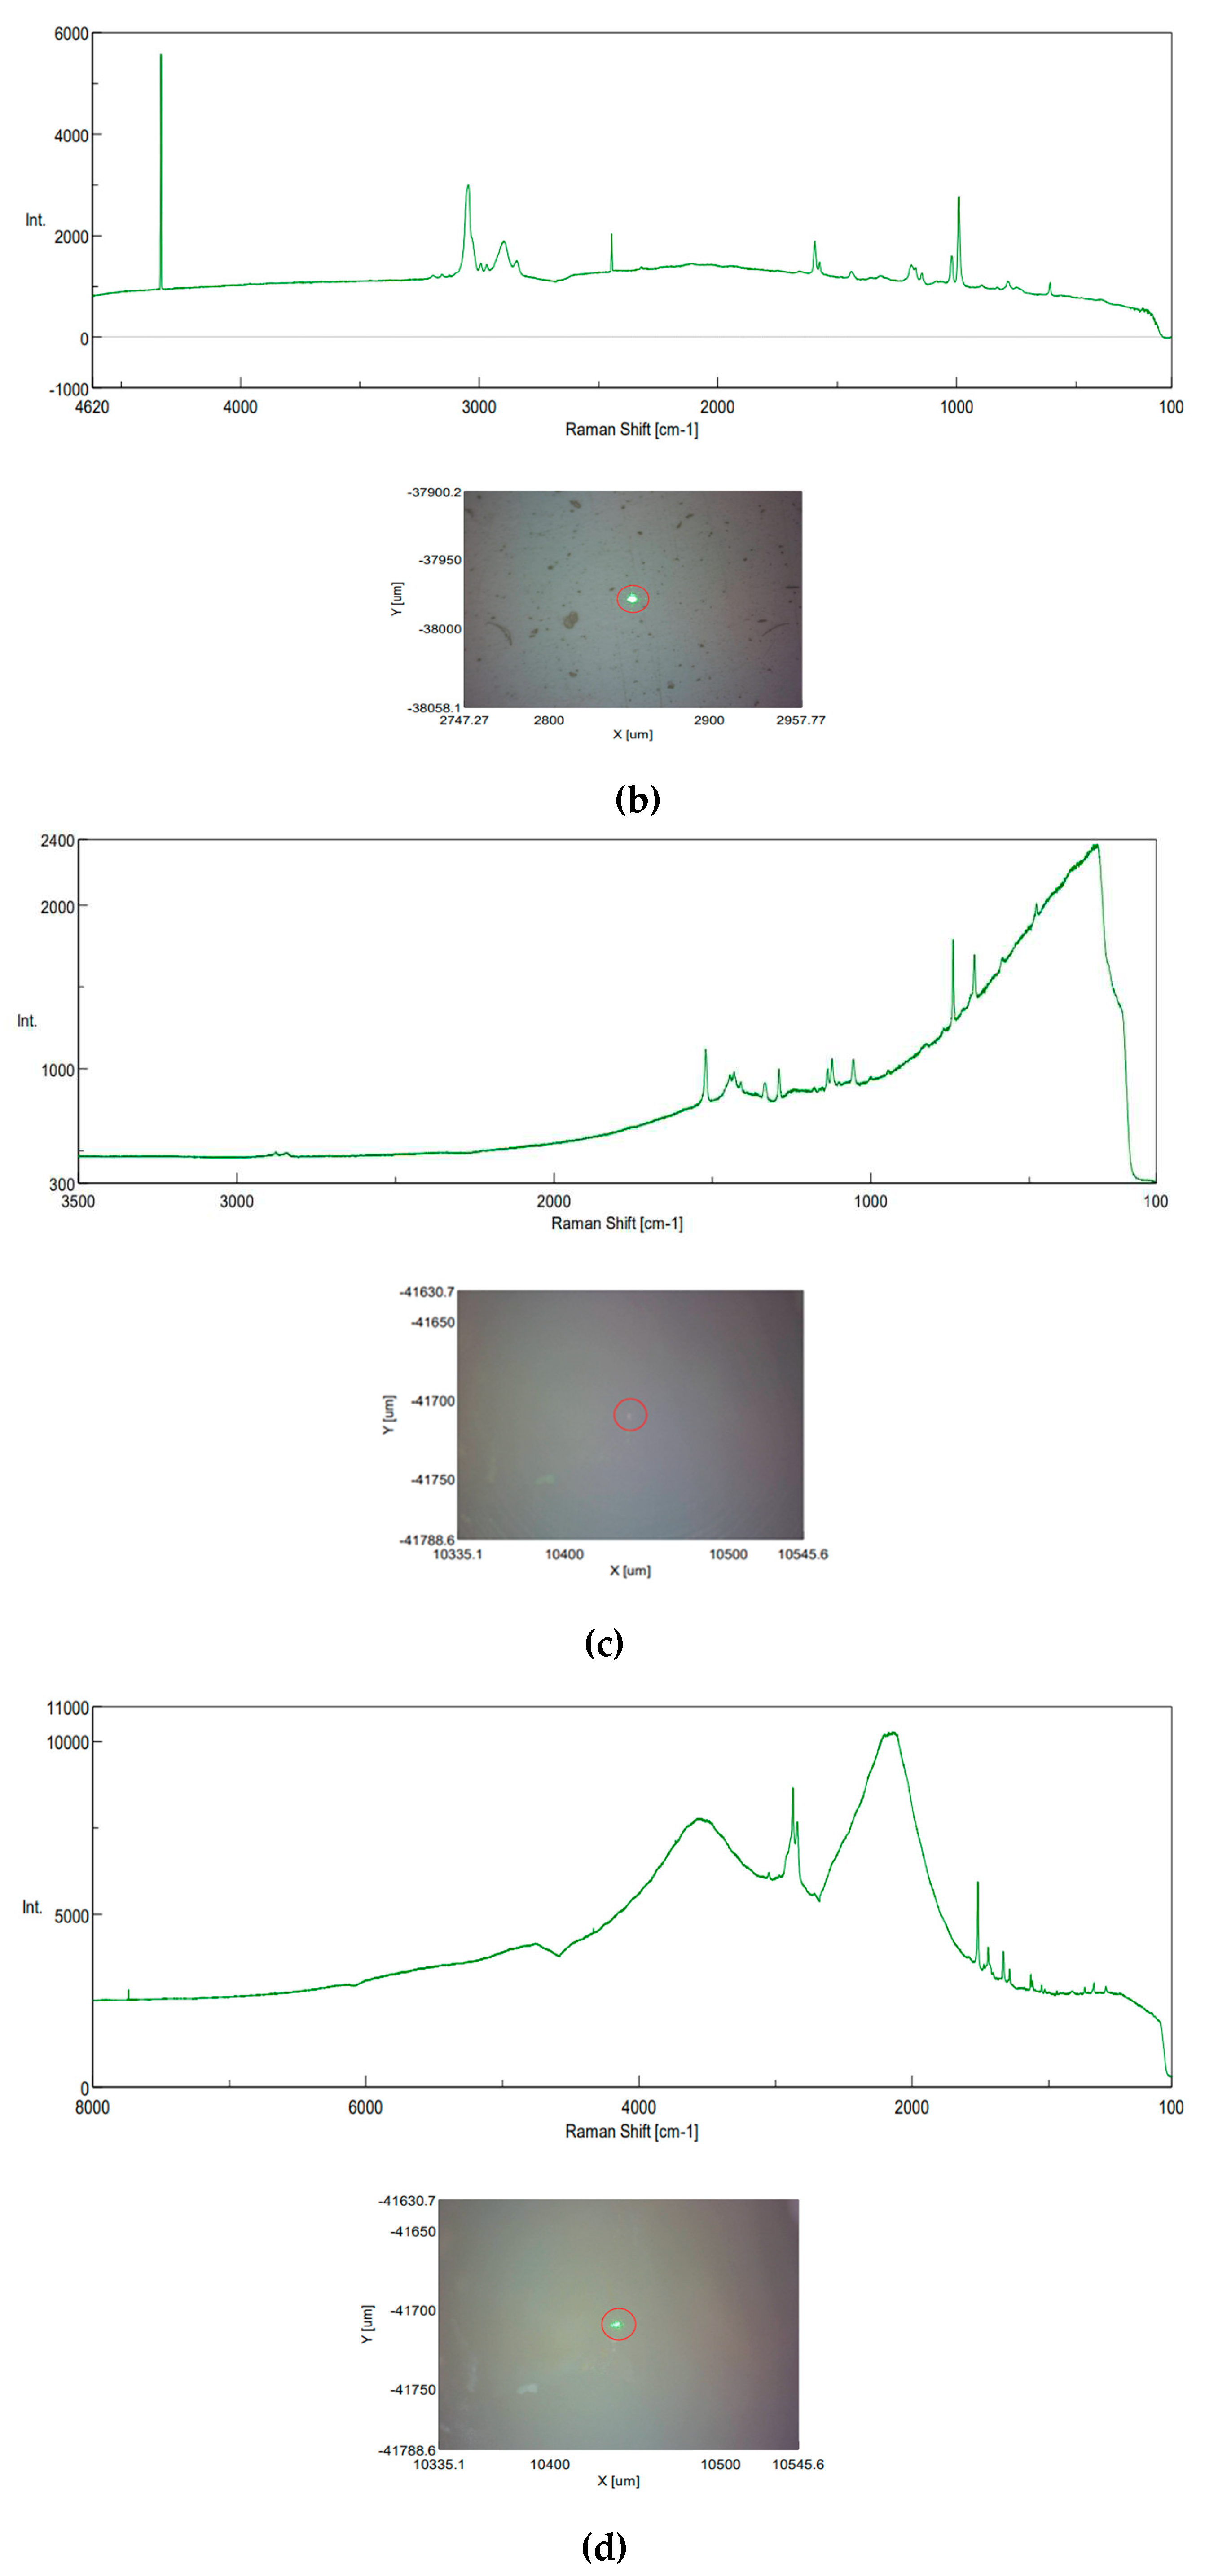
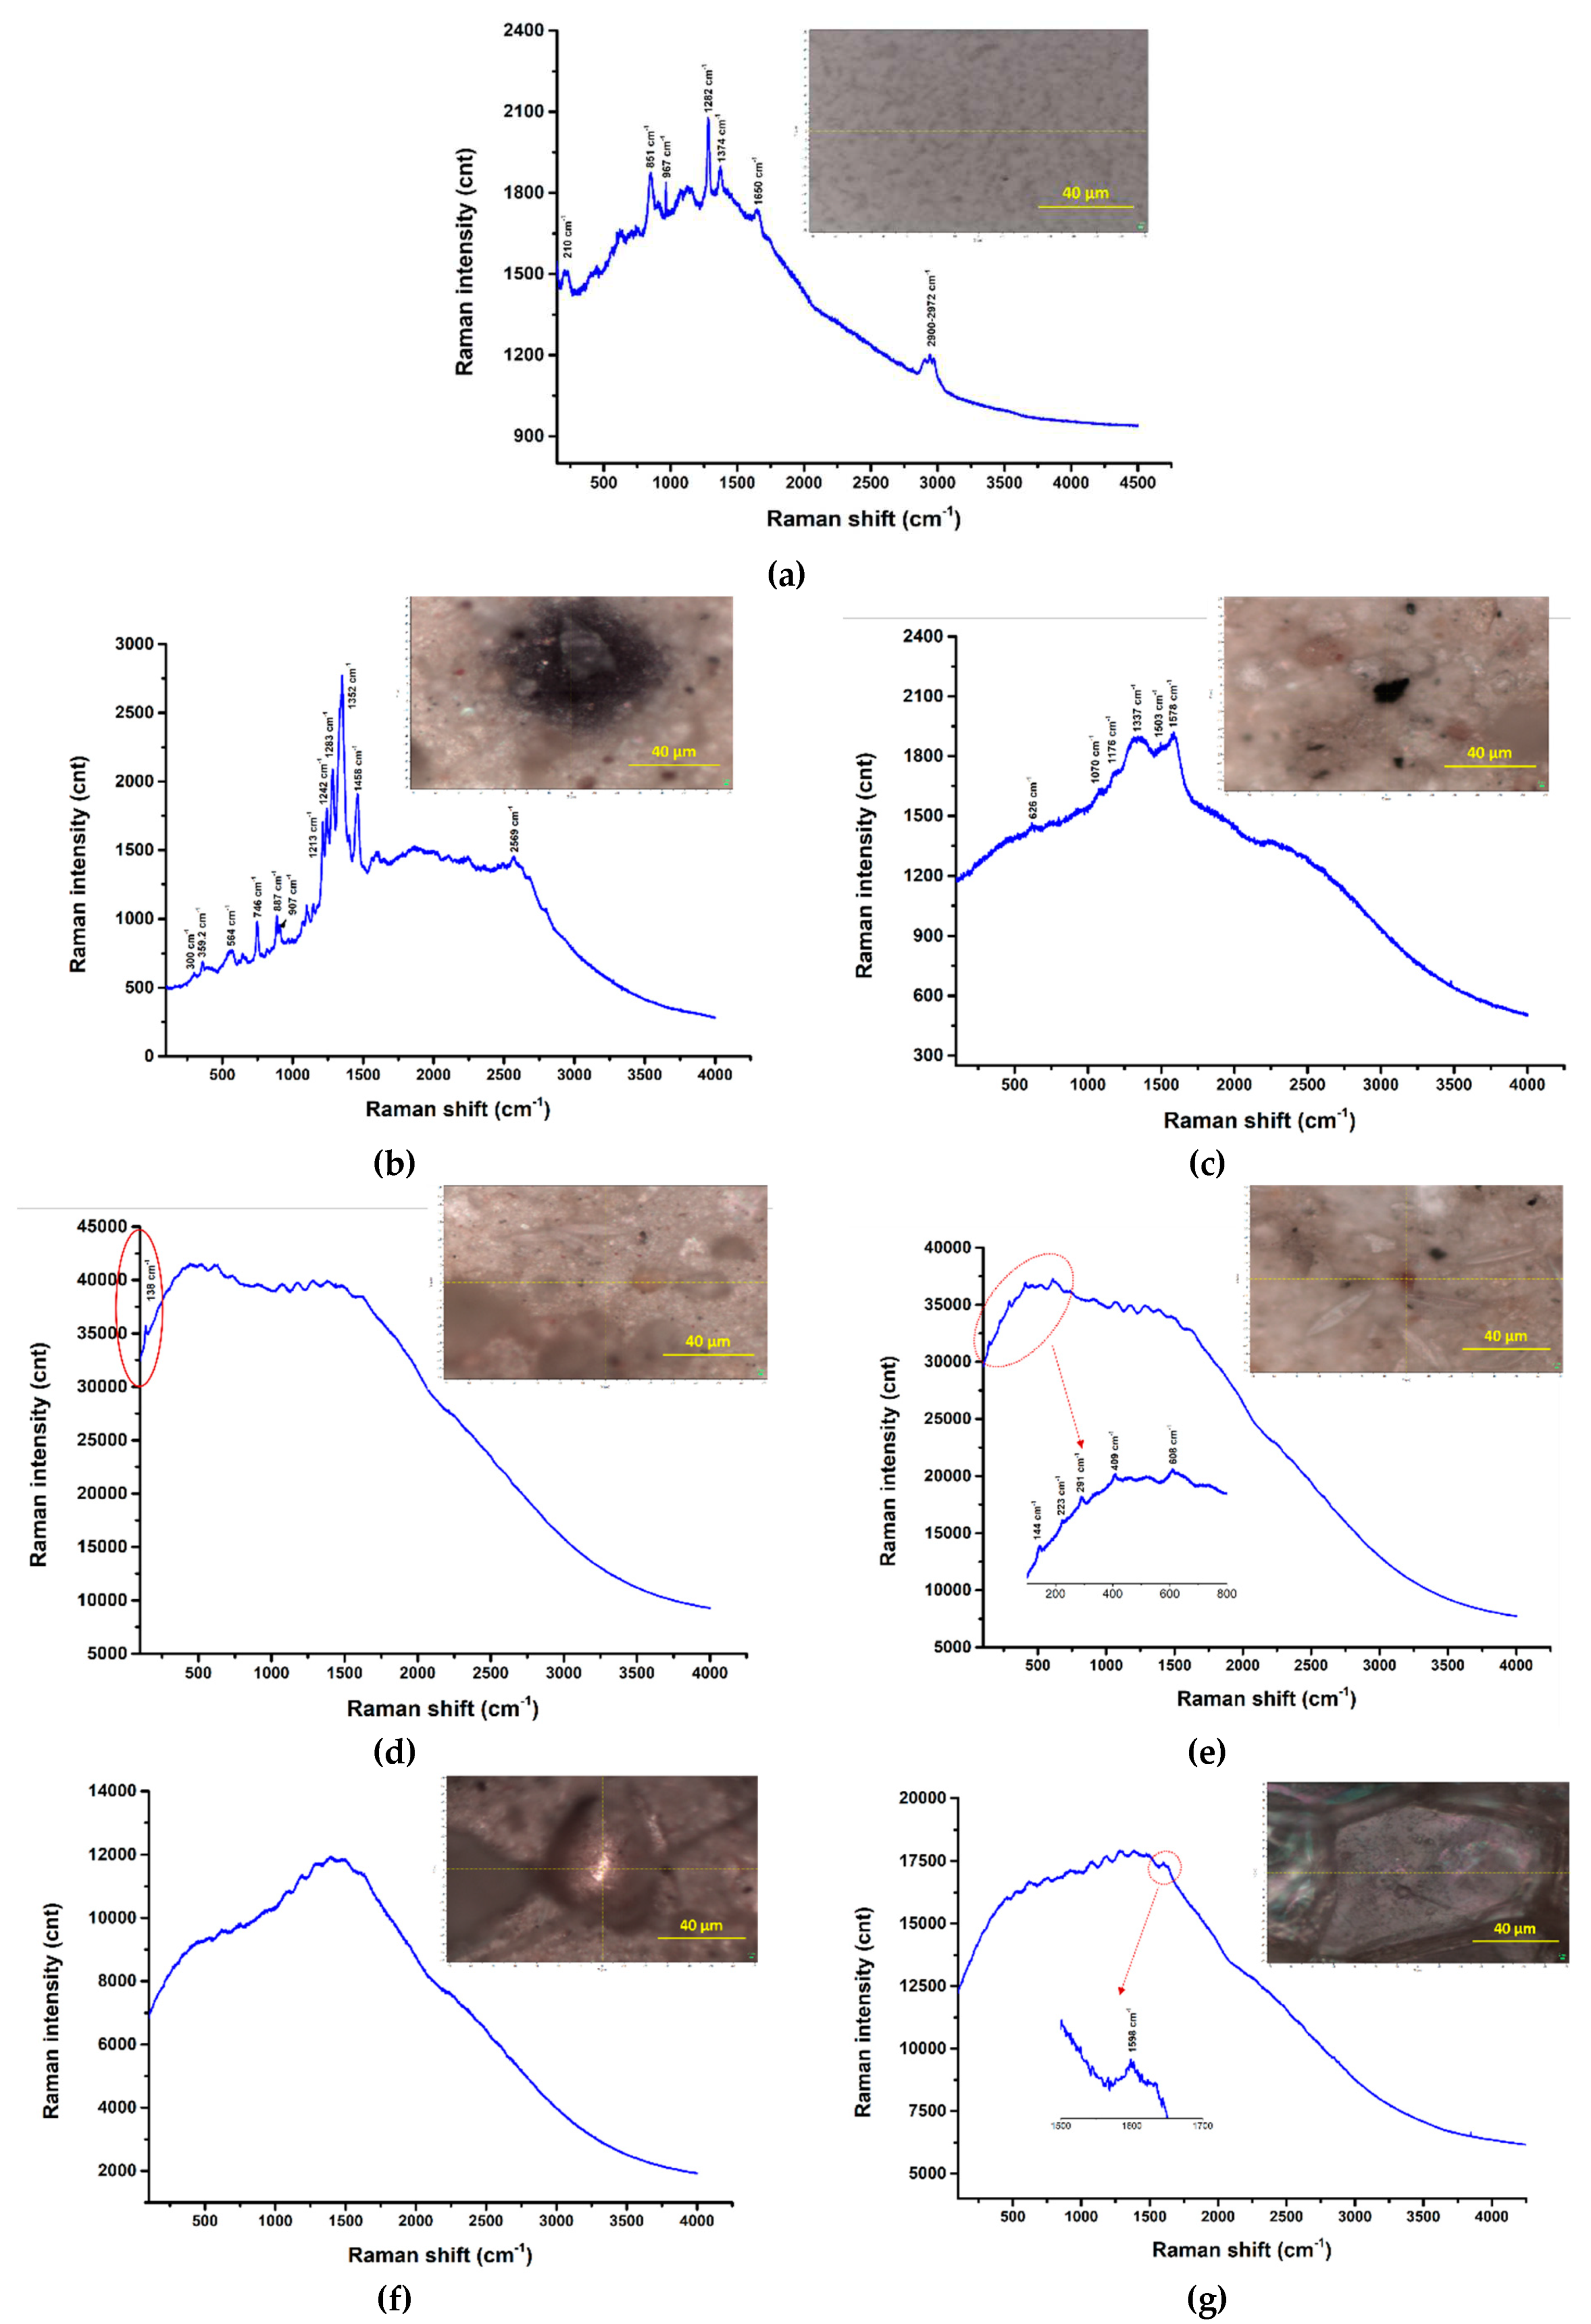
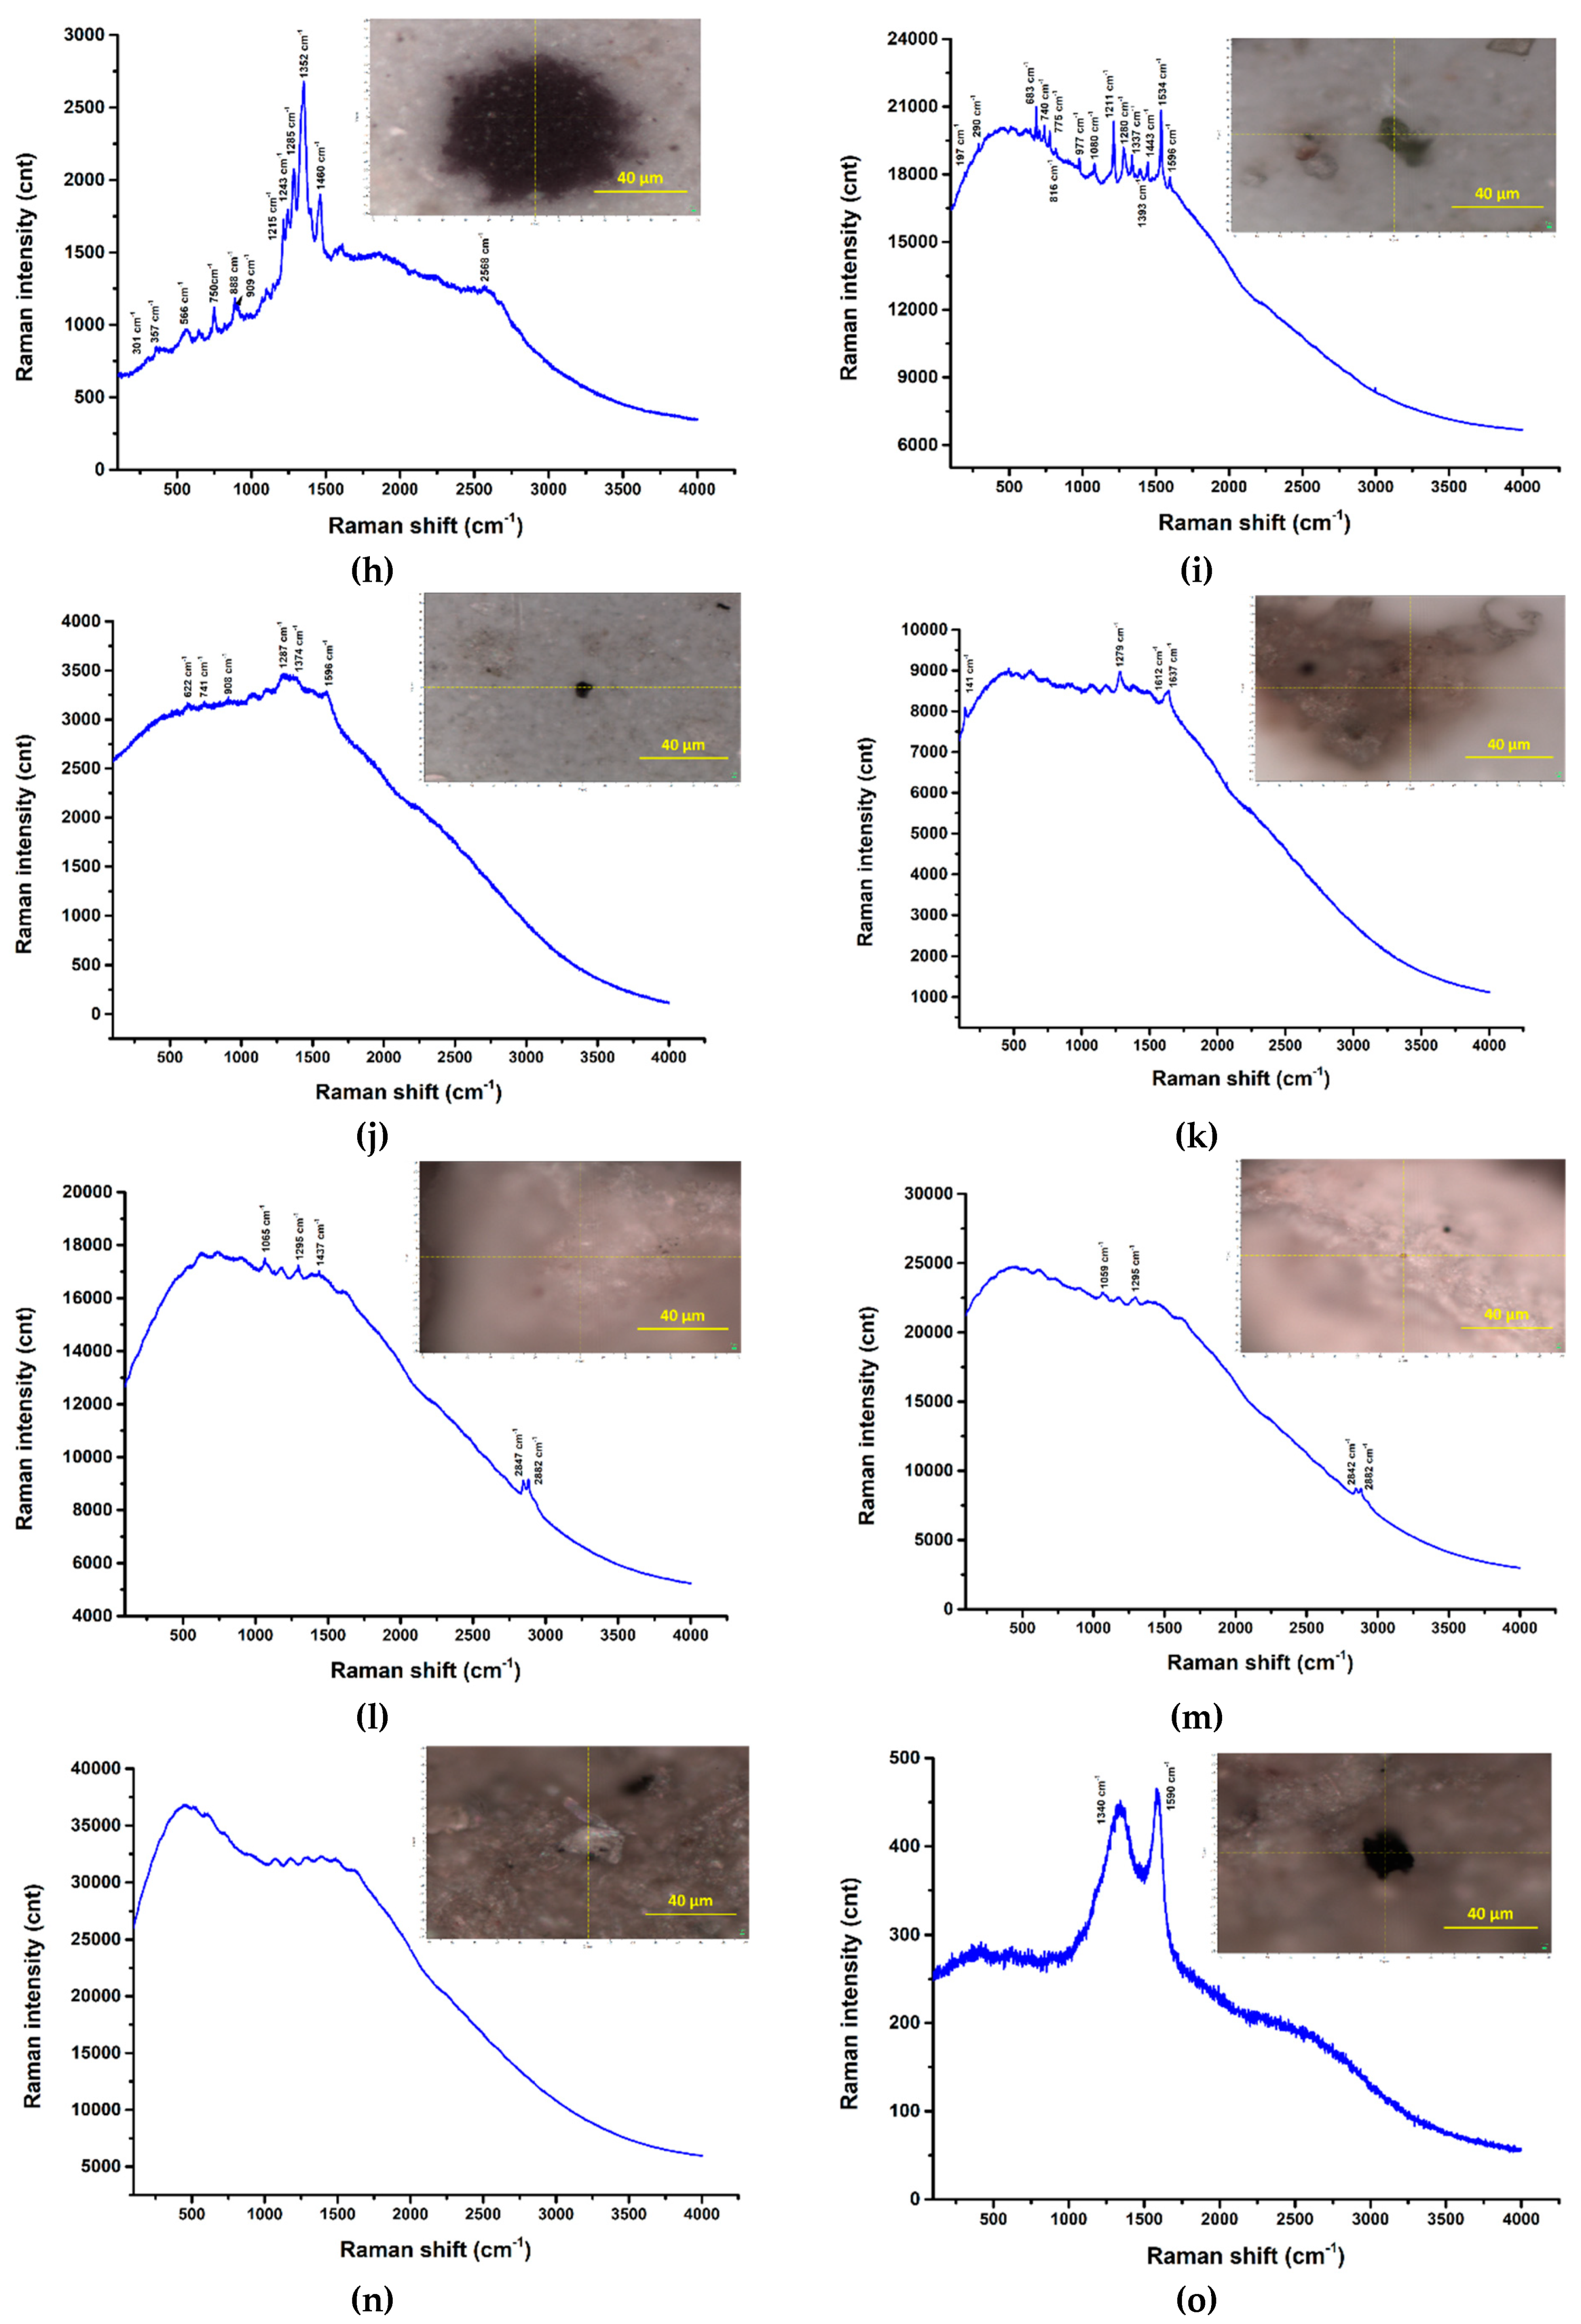
3.3. Raman investigation
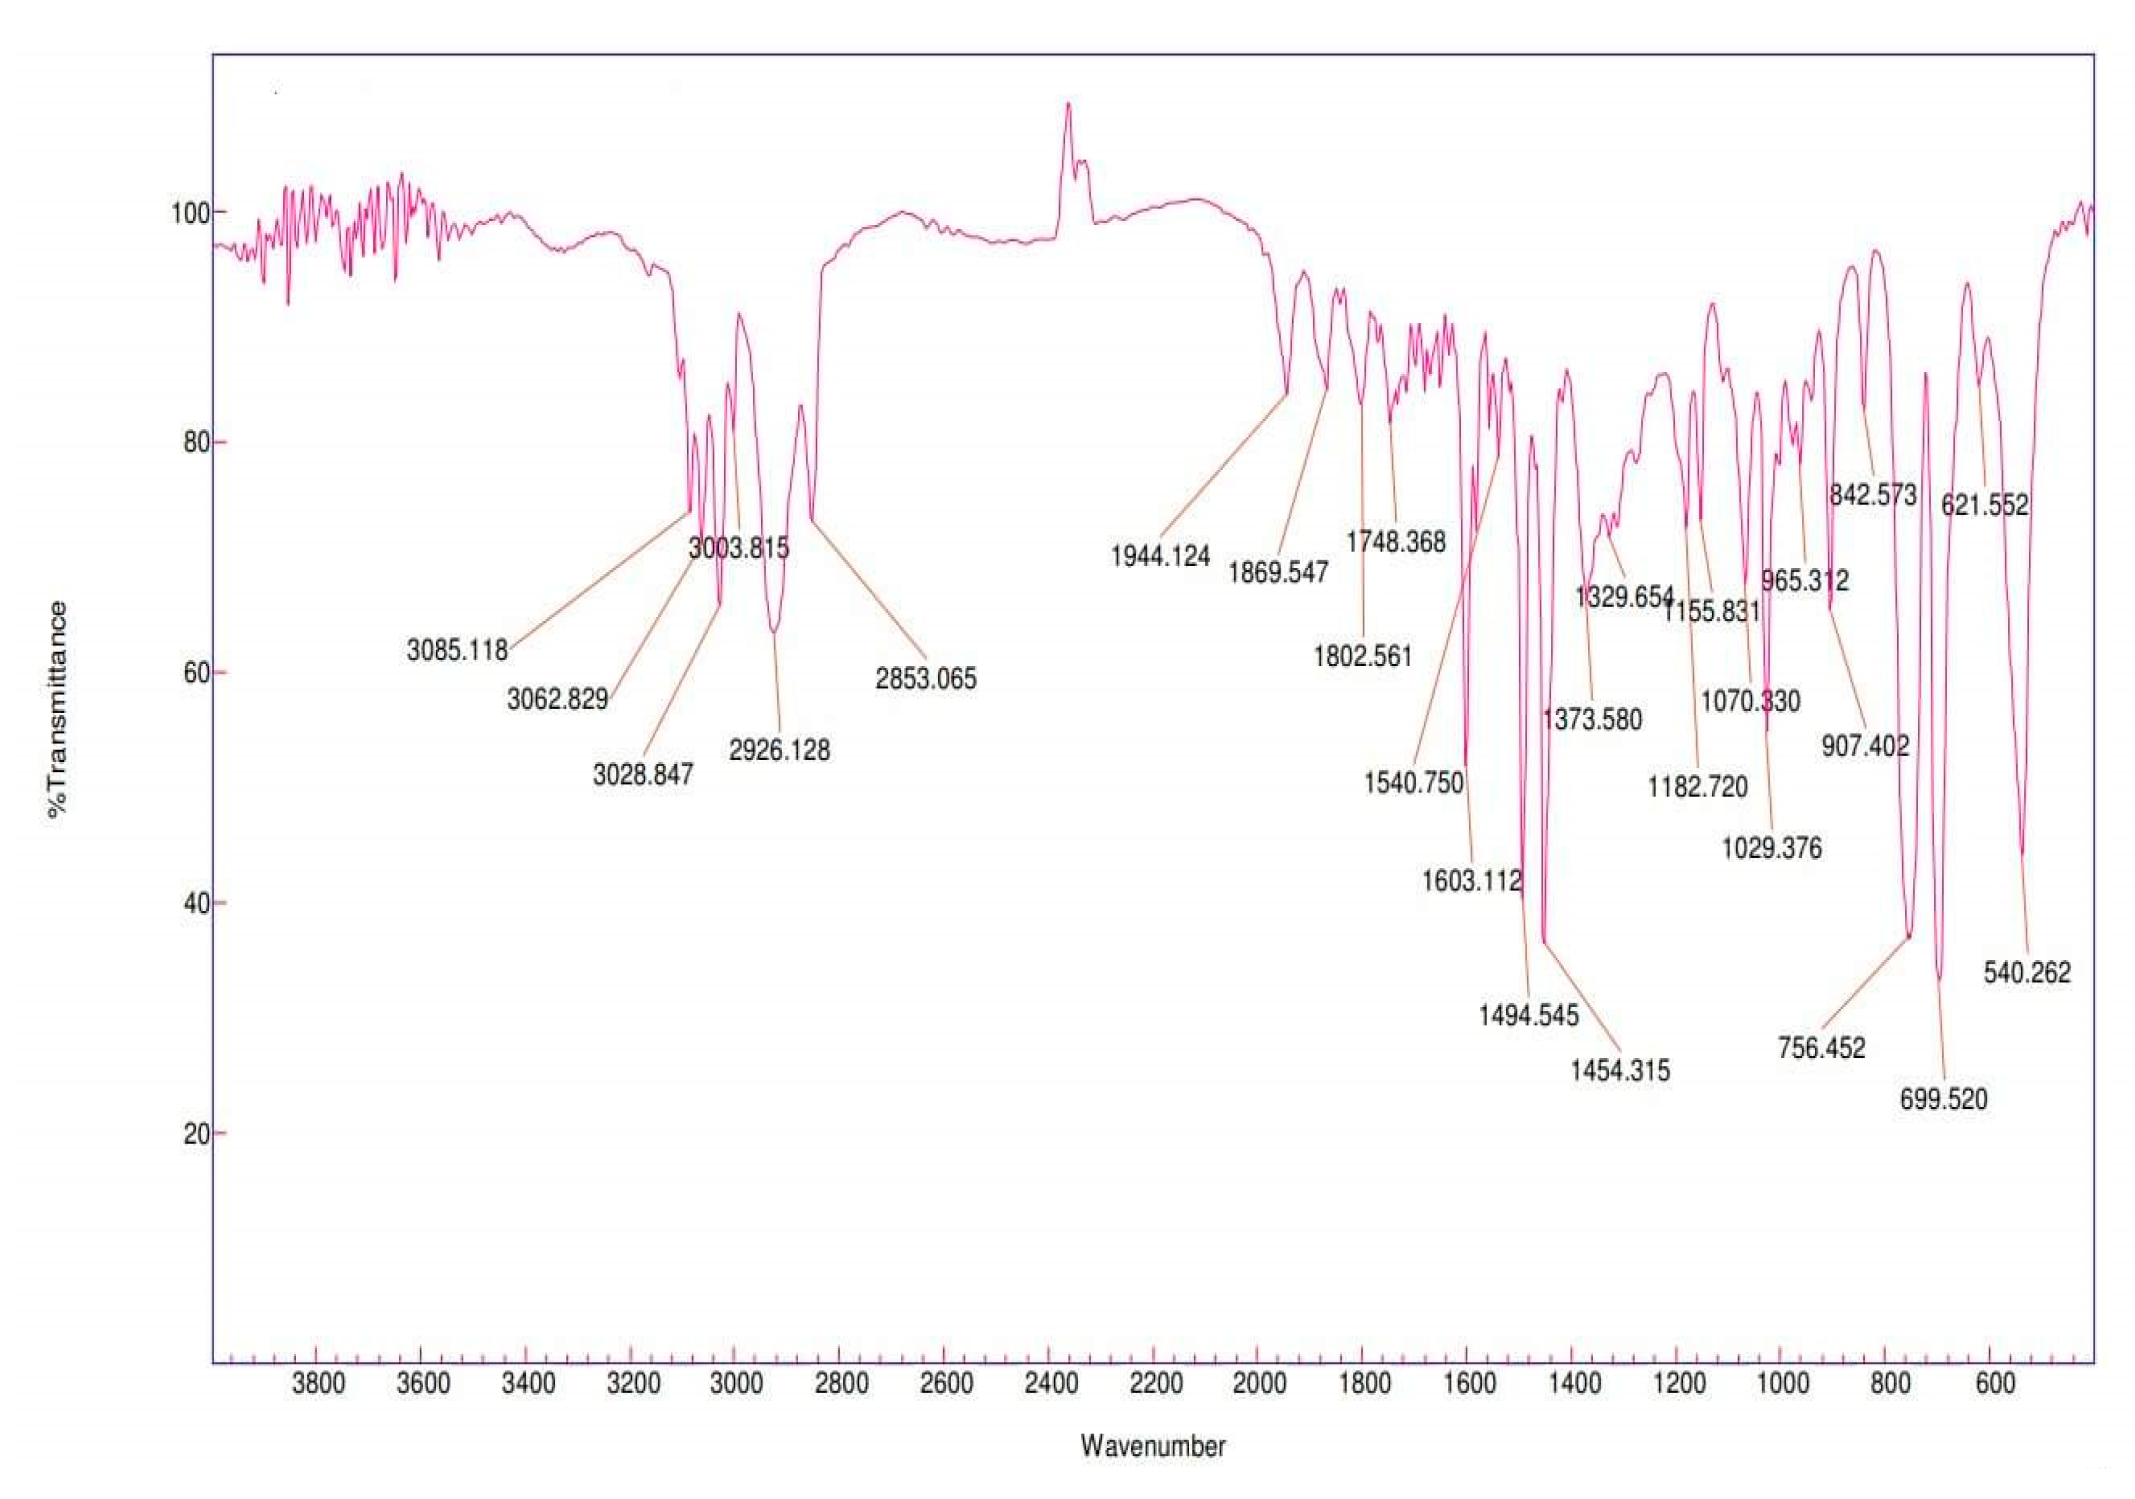
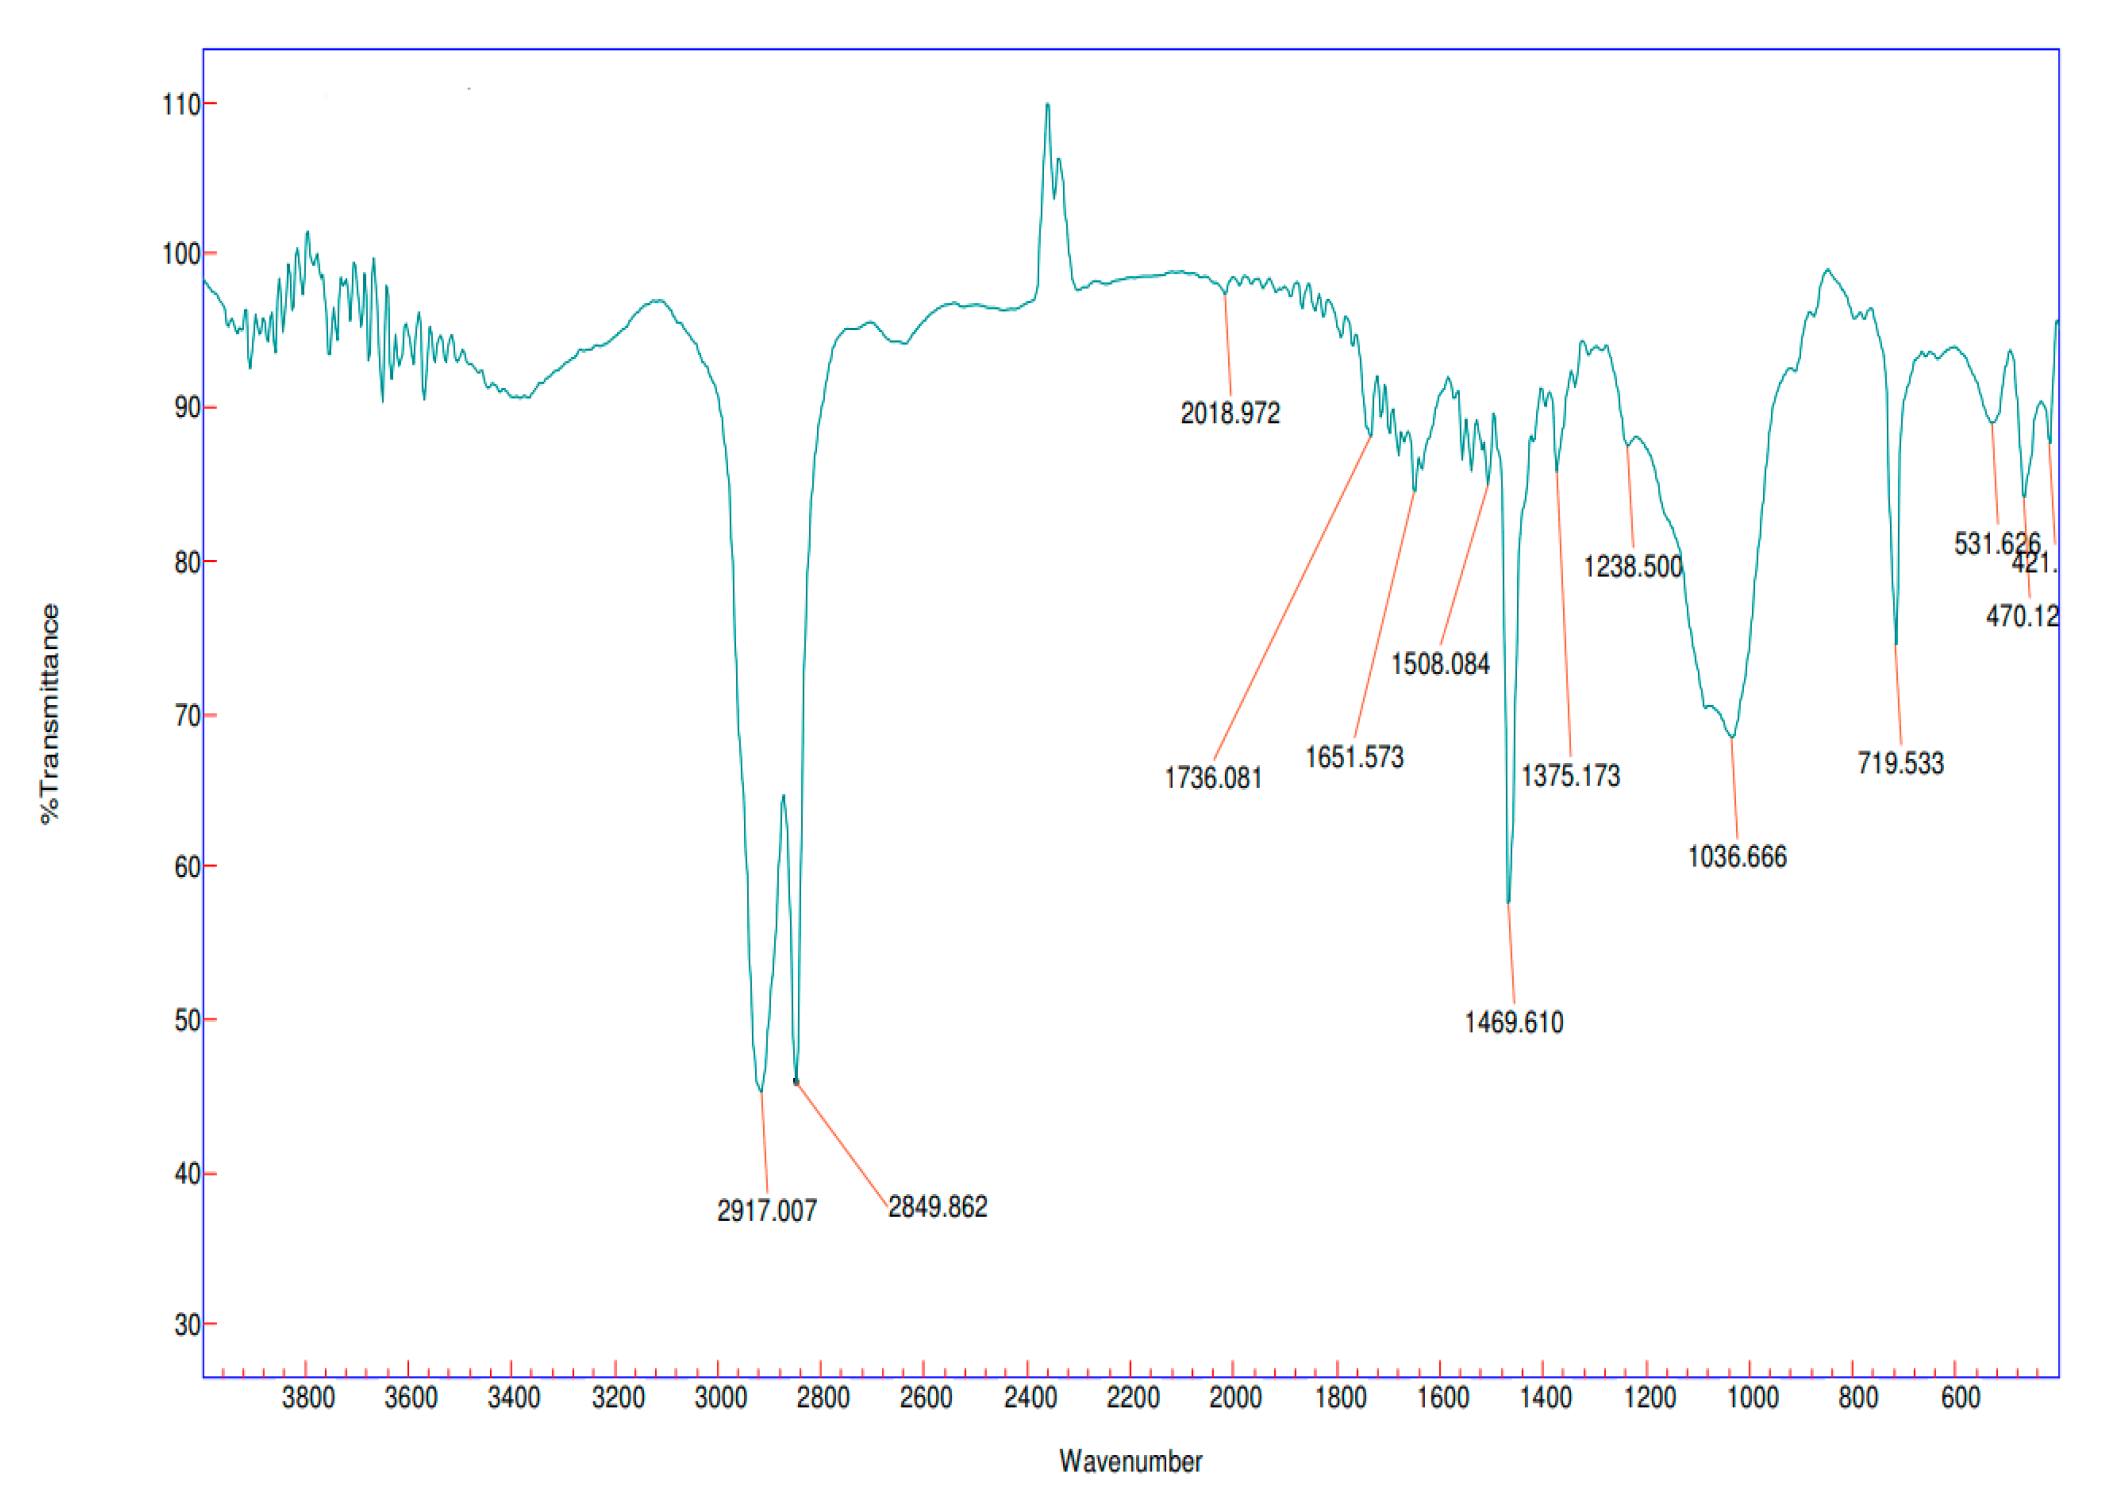
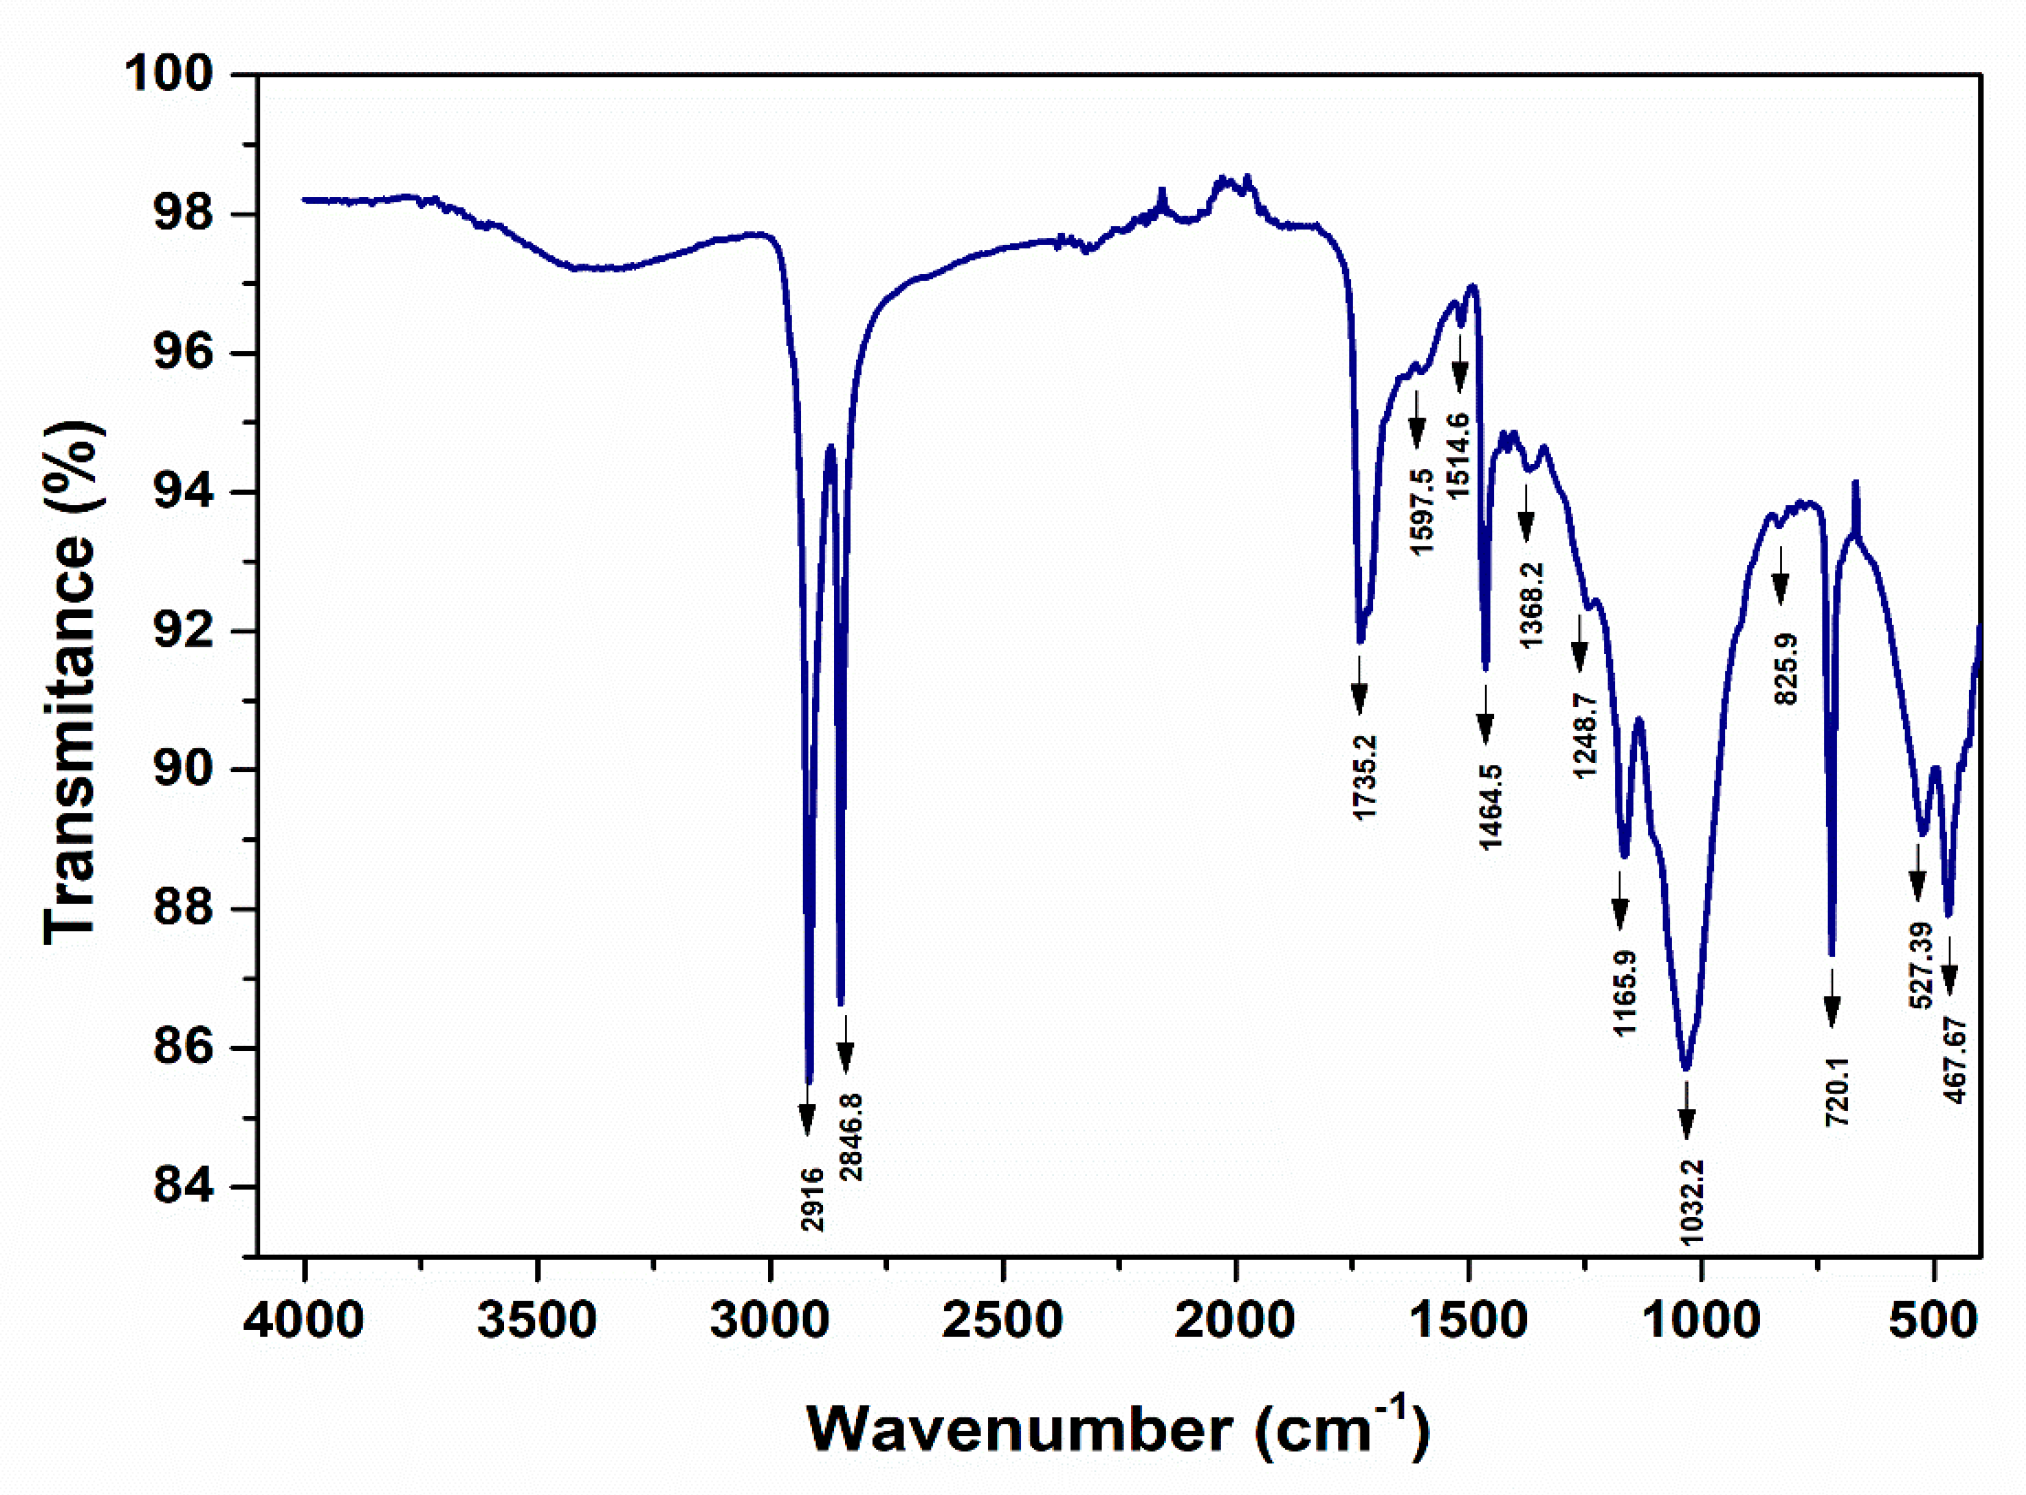
3.4. Fourier transform infrared spectroscopic analysis (FT-IR)
4. Conclusions
Supplementary Materials
Author Contributions
Funding
Institutional Review Board Statement
Informed Consent Statement
Data Availability Statement
Acknowledgments
Conflicts of Interest
References
- Nava, V.; Frezzotti, M.L.; Leoni, B. Raman Spectroscopy for the Analysis of Microplastics in Aquatic Systems. Appl. Spectrosc. 2021, 75, 1341–1357. [Google Scholar] [CrossRef] [PubMed]
- Rodriguez, Ferdinand. “plastic”. Encyclopedia Britannica, 22 Jun. 2023. Available online: https://www.britannica.com/science/plastic (accessed on 9 October 2023).
- Geerdes, Z.; Hermann, M.; Ogonowski, M.; et al. A novel method for assessing microplastic effect in suspension through mixing test and reference materials. Sci Rep. 2009, 9, 10695. [Google Scholar] [CrossRef] [PubMed]
- Hurley, R.; Woodward, J.; Rothwell, J.J. Microplastic contamination of river beds significantly reduced by catchment-wide flooding. Nat. Geosci. 2018, 11, 251–257. [Google Scholar] [CrossRef]
- Cózar, A.; Echevarría, F.; González-Gordillo, J.I.; Irigoien, X.; Úbeda, B.; Hernández-León, S.; Palma, A.T.; Navarro, S.; García-de-Lomas, J.; Ruiz, A.; Fernández-de-Puelles, M.L.; Duarte, C.M. Plastic debris in the open ocean. Proc. Natl. Acad. Sci. 2014, 111, 10239–10244. [Google Scholar] [CrossRef] [PubMed]
- Park, H.; Park, B. Review of Microplastic Distribution, Toxicity, Analysis Methods, and Removal Technologies. Water, 2021, 13, 2736. [Google Scholar] [CrossRef]
- ISO/DIS 24187:2022; Principles for the analysis of microplastics present in the environment.
- Jadhav, E.B.; Sankhla, M.S.; Bhat, R.A.; Bhagat, D.S. Microplastics from food packaging: An overview of human consumption, health threats, and alternative solutions. Environ. Nanotechnol. Monit. Manag. 2021, 16, 100608. [Google Scholar] [CrossRef]
- Boucher, J.; Friot, D. Primary Microplastics in the Oceans: A Global Evaluation of Sources; IUCN: Gland, Switzerland, 2017; Volume 43. [Google Scholar]
- Available online: https://www.who.int/news/item/03-03-2020-shortage-of-personal-protective-equipment-endangering-health-workers-worldwide (accessed on 10 August 2023).
- Martinho, S.D.; Fernandes, V.C.; Figueiredo, S.A.; Delerue-Matos, C. Microplastic Pollution Focused on Sources, Distribution, Contaminant Interactions, Analytical Methods, and Wastewater Removal Strategies: A Review. Int. J. Environ. Res. Public Health. 2022, 19, 5610. [Google Scholar] [CrossRef]
- Available online: https://waterquality.danube-region.eu/wp-content/uploads/sites/13/sites/13/2019/11/EUSDR_20191.pdf (accessed on 11 August 2023).
- Schrank, I.; Löder, M.G.J.; Imhof, H.K.; Moses, S.R.; Heß, M.; Schwaiger, J.; Laforsch, C. Riverine microplastic contamination in southwest Germany: A large-scale survey. Front. Earth Sci. 2022, 10, 794250. [Google Scholar] [CrossRef]
- Liu, R.-P.; Li, Z.-Z.; Liu, F.; Dong, Y.; Jiao, J.G.; Sun, P.-P.; El-Wardany, R.M. Microplastic pollution in Yellow River, China: Current status and research progress of biotoxicological effects. China Geol. 2021, 4, 585–592. [Google Scholar]
- Scherer, C.; Weber, A.; Stock, F.; Vurusic, S.; Egerci, H.; Kochleus, C.; Arendt, N.; Foeldi, C.; Dierkes, G.; Wagner, M.; Brennholt, N.; Reifferscheid, G. Comparative assessment of microplastics in water and sediment of a large European river. Sci. Total Environ. 2020, 738, 139866. [Google Scholar] [CrossRef]
- Gerolin, C.R.; Nascimento Pupim, F.; Oliveira Sawakuchi, A.; Grohmann, C.H.; Labuto, G.; Semensatto, D. Microplastics in sediments from Amazon rivers, Brazil. Sci. Total Environ. 2020, 749, 141604. [Google Scholar] [CrossRef] [PubMed]
- Kiessling, T.; Knickmeier, K.; Kruse, K.; Brennecke, D.; Nauendorf, A.; Thiel, M. Plastic Pirates sample litter at rivers in Germany – Riverside litter and litter sources estimated by schoolchildren. Environ. Pollut. 2019, 245, 545–557. [Google Scholar] [CrossRef] [PubMed]
- Huang, S.; Peng, C.; Wang, Z.; Xiong, X.; Bi, Y.; Liu, Y.; Li, D. Spatiotemporal distribution of microplastics in surface water, biofilms, and sediments in the world’s largest drinking water diversion project. Sci. Total Environ. 2021, 789, 148001. [Google Scholar] [CrossRef] [PubMed]
- Semmouri, I.; Vercauteren, M.; Van Acker, E.; et al. Presence of microplastics in drinking water from different freshwater sources in Flanders (Belgium), an urbanized region in Europe. FoodContamination. 2022, 9, 6. [Google Scholar] [CrossRef]
- Ziani, K.; Ioniță-Mîndrican, C.-B.; Mititelu, M.; Neacșu, S.M.; Negrei, C.; Moroșan, E.; Drăgănescu, D.; Preda, O.-T. Microplastics: A Real Global Threat for Environment and Food Safety: A State of the Art Review. Nutrients. 2023, 15, 617. [Google Scholar] [CrossRef]
- Available online: https://cdn.who.int/media/docs/default-source/wash-documents/microplastics-in-dw-information-sheet190822.pdf (accessed on 13 August 2023).
- Mason, S.A.; Welch, V.G.; Neratko, J. Synthetic Polymer Contamination in Bottled Water. Front Chem 2018, 6, 407. [Google Scholar] [CrossRef] [PubMed]
- Chaudhari, S.; Samnani, P. Determination of microplastics in pond water. Mater. Today: Proc. 2023, 77, 91–98. [Google Scholar] [CrossRef]
- Pojar, I.; Stănică, A.; Stock, F.; Kochleus, C.; Schultz, M.; Bradley, C. Sedimentary microplastic concentrations from the Romanian Danube River to the Black Sea. Sci Rep. 2021, 11, 2000. [Google Scholar] [CrossRef]
- Pojar, I.; Kochleus, C.; Dierke, G.; Ehlers, M.S.; Reifferscheid, G.; Stock, F. Quantitative and qualitative evaluation of plastic particles in surface waters of the Western Black Sea. Environmental Pollution 2021, 268, 115724. [Google Scholar] [CrossRef]
- Ding, L.; Mao R f Guo, X.; Yang, X.; Zhan, Q.; et al. Microplastics in surface waters and sediments of the Wei River, in the northwest of China. Sci. Total Environ. 2019, 667, 427–434. [Google Scholar] [CrossRef]
- Global Plastics Outlook: Policy Scenarios to 2060; OECD Publishing: Paris, France, 2022.
- Available online: https://plasticseurope.org/knowledge-hub/plastics-the-facts-2022/ (accessed on 10 August 2023).
- Uddin, S.; Fowler, S.W.; Saeed, T.; Naji, A.; Al-Jandal, N. Standardized protocols for microplastics determinations in environmental samples from the Gulf and marginal seas. Mar. Pollut. Bull. 2020, 158, 111374. [Google Scholar] [CrossRef] [PubMed]
- Wagner, M.; Scherer, C.; Alvarez-Munoz, D.; Brennholt, N.; Bourrain, X.; Buchinger, S.; et al. Microplastics in freshwater ecosystems: what we know and what we need to know. Environ Sci Eur. 2014, 26, 12. [Google Scholar] [CrossRef] [PubMed]
- Asifa, A.; Afroza, A.L.; Md Nazrul, I.; Md Morsaline, B.; Shaikh, T.A.; Md Moshiur, R.; Sheikh, M.R. Microplastics Pollution: A Brief Review of Its Source and Abundance in Different Aquatic Ecosystems. Journal of Hazardous Materials Advances 2023, 9, 100215. [Google Scholar] [CrossRef]
- Ashkan, J. Microplastics in the urban atmosphere: Sources, occurrences, distribution, and potential health implications. Journal of Hazardous Materials Advances 2023, 12, 100346. [Google Scholar] [CrossRef]
- Enders, K.; Lenz, R.; Stedmon, C.A.; Nielsen, T.G. Abundance, size and polymer composition of marine microplastics >= 10um in the atlantic ocean and their modelled vertical distribution. Mar Pollut Bull 2015, 100, 70–81. [Google Scholar] [CrossRef] [PubMed]
- Eriksson, C.; Burton, H. Origins and biological accumulation of small plastic particles in fur seals from macquarie island. Ambio 2003, 32, 380–384. [Google Scholar] [CrossRef] [PubMed]
- Cox, K.G.; Covernton, G.A.; Davies, H.J.; Dower, J.F.; Juanes, F.; Dudas, S.E. Environ. Sci. Technol. 2019, 53, 7068–7074. [CrossRef] [PubMed]
- Meyers, N.; Catarino, A.I.; Declercq, A.M.; Brenan, A.; Devriese, L.; Vandegehuchte, M.; De Witte, B.; Janssen, C.; Everaert, G. Microplastic detection and identification by Nile red staining: Towards a semi-automated, cost- and time-effective technique. Sci. Total Environ. 2022, 823, 153441. [Google Scholar] [CrossRef]
- Cowger, W.; Gray, A.; Christiansen, S.H.; DeFrond, H.; Deshpande, A.D.; Hemabessiere, L.; Lee, E.; Mill, L.; Munno, K.; Ossmann, B.E.; Pittroff, M.; Rochman, C.; Sarau, G.; Tarby, S.; Primpke, S. Critical review of processing and classification techniques for images and spectra in microplastic research. Appl. Spectrosc. 2020, 74, 989–1010. [Google Scholar] [CrossRef]
- Bianco, V.; Memmolo, P.; Carcagnì, P.; Merola, F.; Paturzo, M.; Distante, C.; Ferraro, P. Microplastic identification via holographic imaging and machine learning. Adv. Intell. Syst. 2020, 2, 1900153. [Google Scholar] [CrossRef]
- Available online: https://www.epa.gov/system/files/documents/2021-09/microplastic-beach-protocol_sept-2021.pdf (accessed on 13 August 2023).
- Guidelines for sampling microplastics on sandy beaches. Rocha International Sampling Guide; A Rocha International: London, UK, 2018. [Google Scholar]
- Filipa, B.; et al. Technical Report. Harmonized protocol for monitoring microplastics in biota. JPI-Oceans BASEMAN project. 2019.
- ISO/TR 21960:2020; Plastics — Environmental aspects — State of knowledge and methodologies.
- Masura, J.; et al. Laboratory methods for the analysis of microplastics in the marine environment: recommendations for quantifying synthetic particles in waters and sediments. NOAA Technical Memorandum NOS-OR&R-48. 2015.
- Schrank, I.; Möller, J.N.; Imhof, H.K.; Hauenstein, O.; Zielke, F.; Agarwal, S.; Löder, M.G.J.; Greiner, A.; Laforsch, C. Microplastic sample purification methods - Assessing detrimental effects of purification procedures on specific plastic types. Sci. Total Environ. 2022, 833, 154824. [Google Scholar] [CrossRef] [PubMed]
- Al-Azzawi, M.S.M.; Kefer, S.; Weißer, J.; Reichel, J.; Schwaller, C.; Glas, K.; Knoop, O.; Drewes, J.E. Validation of Sample Preparation Methods for Microplastic Analysis in Wastewater Matrices—Reproducibility and Standardization. Water 2020, 12, 2445. [Google Scholar] [CrossRef]
- Kärrman, A.; Schönlau, C.; Engwall, M. Exposure and Effects of Microplastics on Wildlife—A Review of Existing Data; Funded by Swedish Environmental Protection Agency, MTM Research Centre School of Science and Technology Örebro University: Sweden, 2016. [Google Scholar]
- Wu, X.; Zhao, X.; Chen, R.; Liu, P.; Liang, W.; Wang, J.; Teng, M.; Wang, X.; Gao, S. Wastewater treatment plants act as essential sources of microplastic formation in aquatic environments: A critical review. Water Research. 2022, 221, 118825. [Google Scholar] [CrossRef] [PubMed]
- Gerdts, G. (Ed.) Defining the BASElines and standards for Microplastics ANalyses in European waters. Project BASEMAN Final report. JPI-Ocean. BASEMAN Proj. 2019, 25. [Google Scholar]
- Blair, R.M.; Waldron, S.; Phoenix, V.R.; et al. Microscopy and elemental analysis characterisation of microplastics in sediment of a freshwater urban river in Scotland, UK. Environ Sci Pollut Res. 2019, 26, 12491–12504. [Google Scholar] [CrossRef] [PubMed]
- Joshy, A.; Krupesha Sharma, S.R.; Mini, K.G. Microplastic contamination in commercially important bivalves from the southwest coast of India. Environ. Pollut. 2022, 305, 119250. [Google Scholar] [CrossRef] [PubMed]
- Mariano, S.; Tacconi, S.; Fidaleo, M.; Rossi, M.; Dini, L. Micro and Nanoplastics Identification: Classic Methods and Innovative Detection Techniques. Front. Toxicol. 2021, 3, 636640. [Google Scholar] [CrossRef] [PubMed]
- Schwarzer, M.; Brehm, J.; Vollmer, M.; Jasinski, J.; Xu, C.; Zainuddin, S.; Fröhlich, T.; Schott, M.; Greiner, A.; Scheibel, T.; Laforsch, C. Shape, size, and polymer dependent effects of microplastics on Daphnia magna. J. Hazard. Mater. 2022, 426, 128136. [Google Scholar] [CrossRef] [PubMed]
- Rytelewska, S.; Dąbrowska, A. The Raman Spectroscopy Approach to Different Freshwater Microplastics and Quantitative Characterization of Polyethylene Aged in the Environment. Microplastics. 2022, 1, 263–281. [Google Scholar] [CrossRef]
- Sharma, S.; Chio, C.; Muenow, D. Raman Spectroscopic Investigation of Ferrous Sulfate Hydrates. 2006, 37. [Google Scholar]
- Scardaci, V.; Compagnini, G. Raman Spectroscopy Investigation of Graphene Oxide Reduction by Laser Scribing. C 2021, 7, 48. [Google Scholar] [CrossRef]
- Primpke, S.; Christiansen, S.H.; Cowger, W.; de Frond, H.; et al. Critical Assessment of Analytical Methods for the Harmonized and Cost Efficient Analysis of Microplastics. Appl. Spectrosc. 2020, 74, 1012–1047. [Google Scholar] [CrossRef] [PubMed]
- Leung, M.M.-L.; Ho, Y.-W.; Lee, C.-H.; Wang, Y.; Hu, M.; Kwok KW, H.; Chua, S.-L.; Fang, J.K.-H. Improved Raman spectroscopy-based approach to assess microplastics in seafood. Environ. Pollut. 2021, 289, 117648. [Google Scholar] [CrossRef]
- Karami, A.; Golieskardi, A.; Choo, C.K.; Romano, N.; Ho, Y.B.; Salamatinia, B. A high-performance protocol for the extraction of microplastics in fish. Sci. Total Environ. 2017, 578, 485–494. [Google Scholar] [CrossRef] [PubMed]
- Smith, B.C. The Infrared Spectra of Polymers II: Polyethylene. Spectroscopy 2021, 36, 24–29. [Google Scholar] [CrossRef]
- Herman, V.; Takacs, H.; Duclairoir, F.; Renault, O.; Tortai, J.H.; Viala, B. Core double-shell cobalt/graphene/polystyrene magnetic nanocomposites synthesized by in situ sonochemical polymerization. RCS Advenced 2015, 5, 51371–51381. [Google Scholar] [CrossRef]
- Smith, B.C. The Infrared Spectra of Polymers III: Hydrocarbon Polymers. Spectroscopy 2021, 36, 22–25. [Google Scholar] [CrossRef]
- Käppler, A.; et al. Analysis of environmental microplastics by vibrational microspectroscopy: FT-IR, Raman or both? Anal. Bioanal. Chem. 2016, 408, 8377–8391. [Google Scholar] [CrossRef] [PubMed]
- Sharma, N.; Sharma, V.; Jain, Y.; Kumari, M.; Gupta, R.; Sharma, S.K.; Sachdev, K. Synthesis and Characterization of Graphene Oxide (GO) and Reduced Graphene Oxide (rGO) for Gas Sensing Application. Macromol. Symp. 2017, 376, 1700006. [Google Scholar] [CrossRef]
- Nallasamy, P.; Anbarasan, P.M.; Mohan, S. Vibrational Spectra and Assignments of cis- and Trans-1,4-Polybutadiene. Turk J Chem. 2002, 26, 105–111. [Google Scholar]
- Gong, Y.; Li, D.; Fu, Q.; Pan, C. Influence of graphene microstructures on electrochemical performance for supercapacitors. Prog. Nat. Sci.: Mater. Int. 2015, 25, 379–385. [Google Scholar] [CrossRef]
- Syakti, A.D.; et al. Simultaneous grading of microplastic size sampling in the small islands of Bintan Water, Indonesia. Mar. Pollut. Bull. 2018, 137, 593–600. [Google Scholar] [CrossRef] [PubMed]
- Chirea, M.; et al. Gold nanowire networks: Synthesis, characterization, and catalytic activity. Langmuir. 2011, 27, 3906–3913. [Google Scholar] [CrossRef] [PubMed]
- Krylova, V.; Dukštienė, N. Synthesis and characterization of AG2S layers formed on polypropylene’. J. Chem. 2013, 1–11. [Google Scholar] [CrossRef]
- Bhattacharya, S.S.; Chaudhari, S.B. Study on Structural, Mechanical and Functional Properties of Polyester Silica Nanocomposite Fabric. Int. J. Pure Appl. Sci. Technol. 2014, 21, 43–52. [Google Scholar]
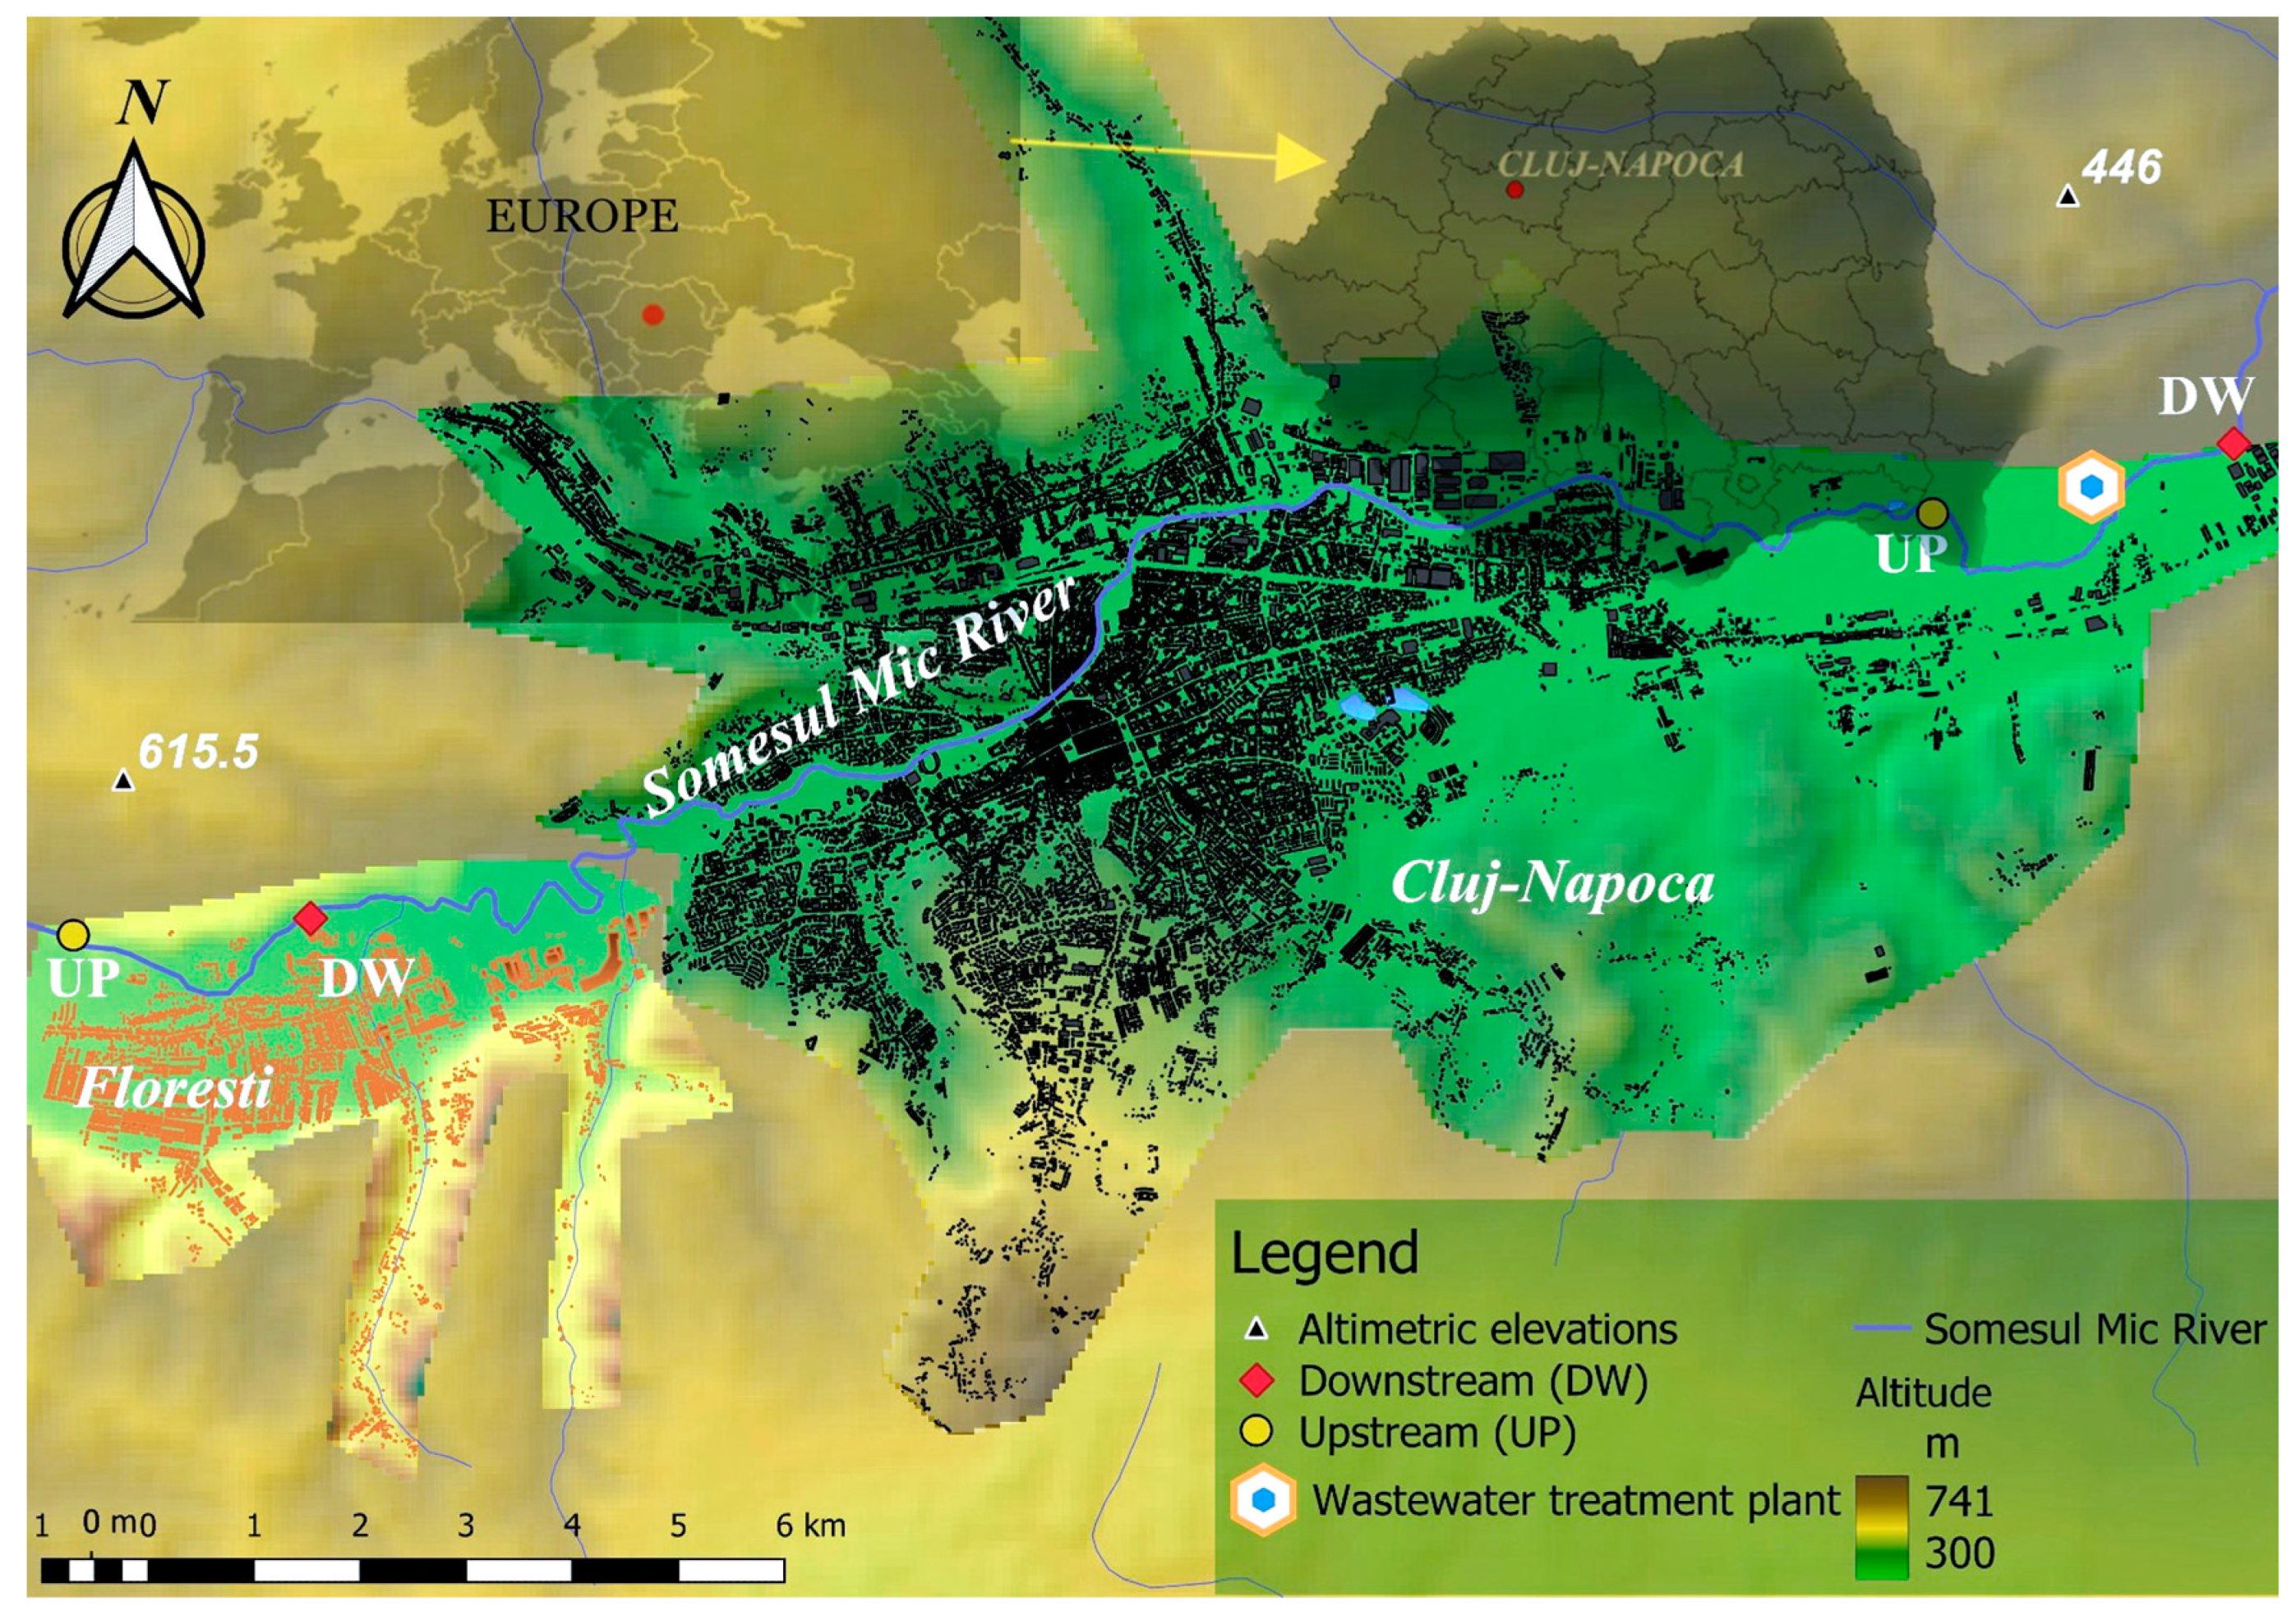
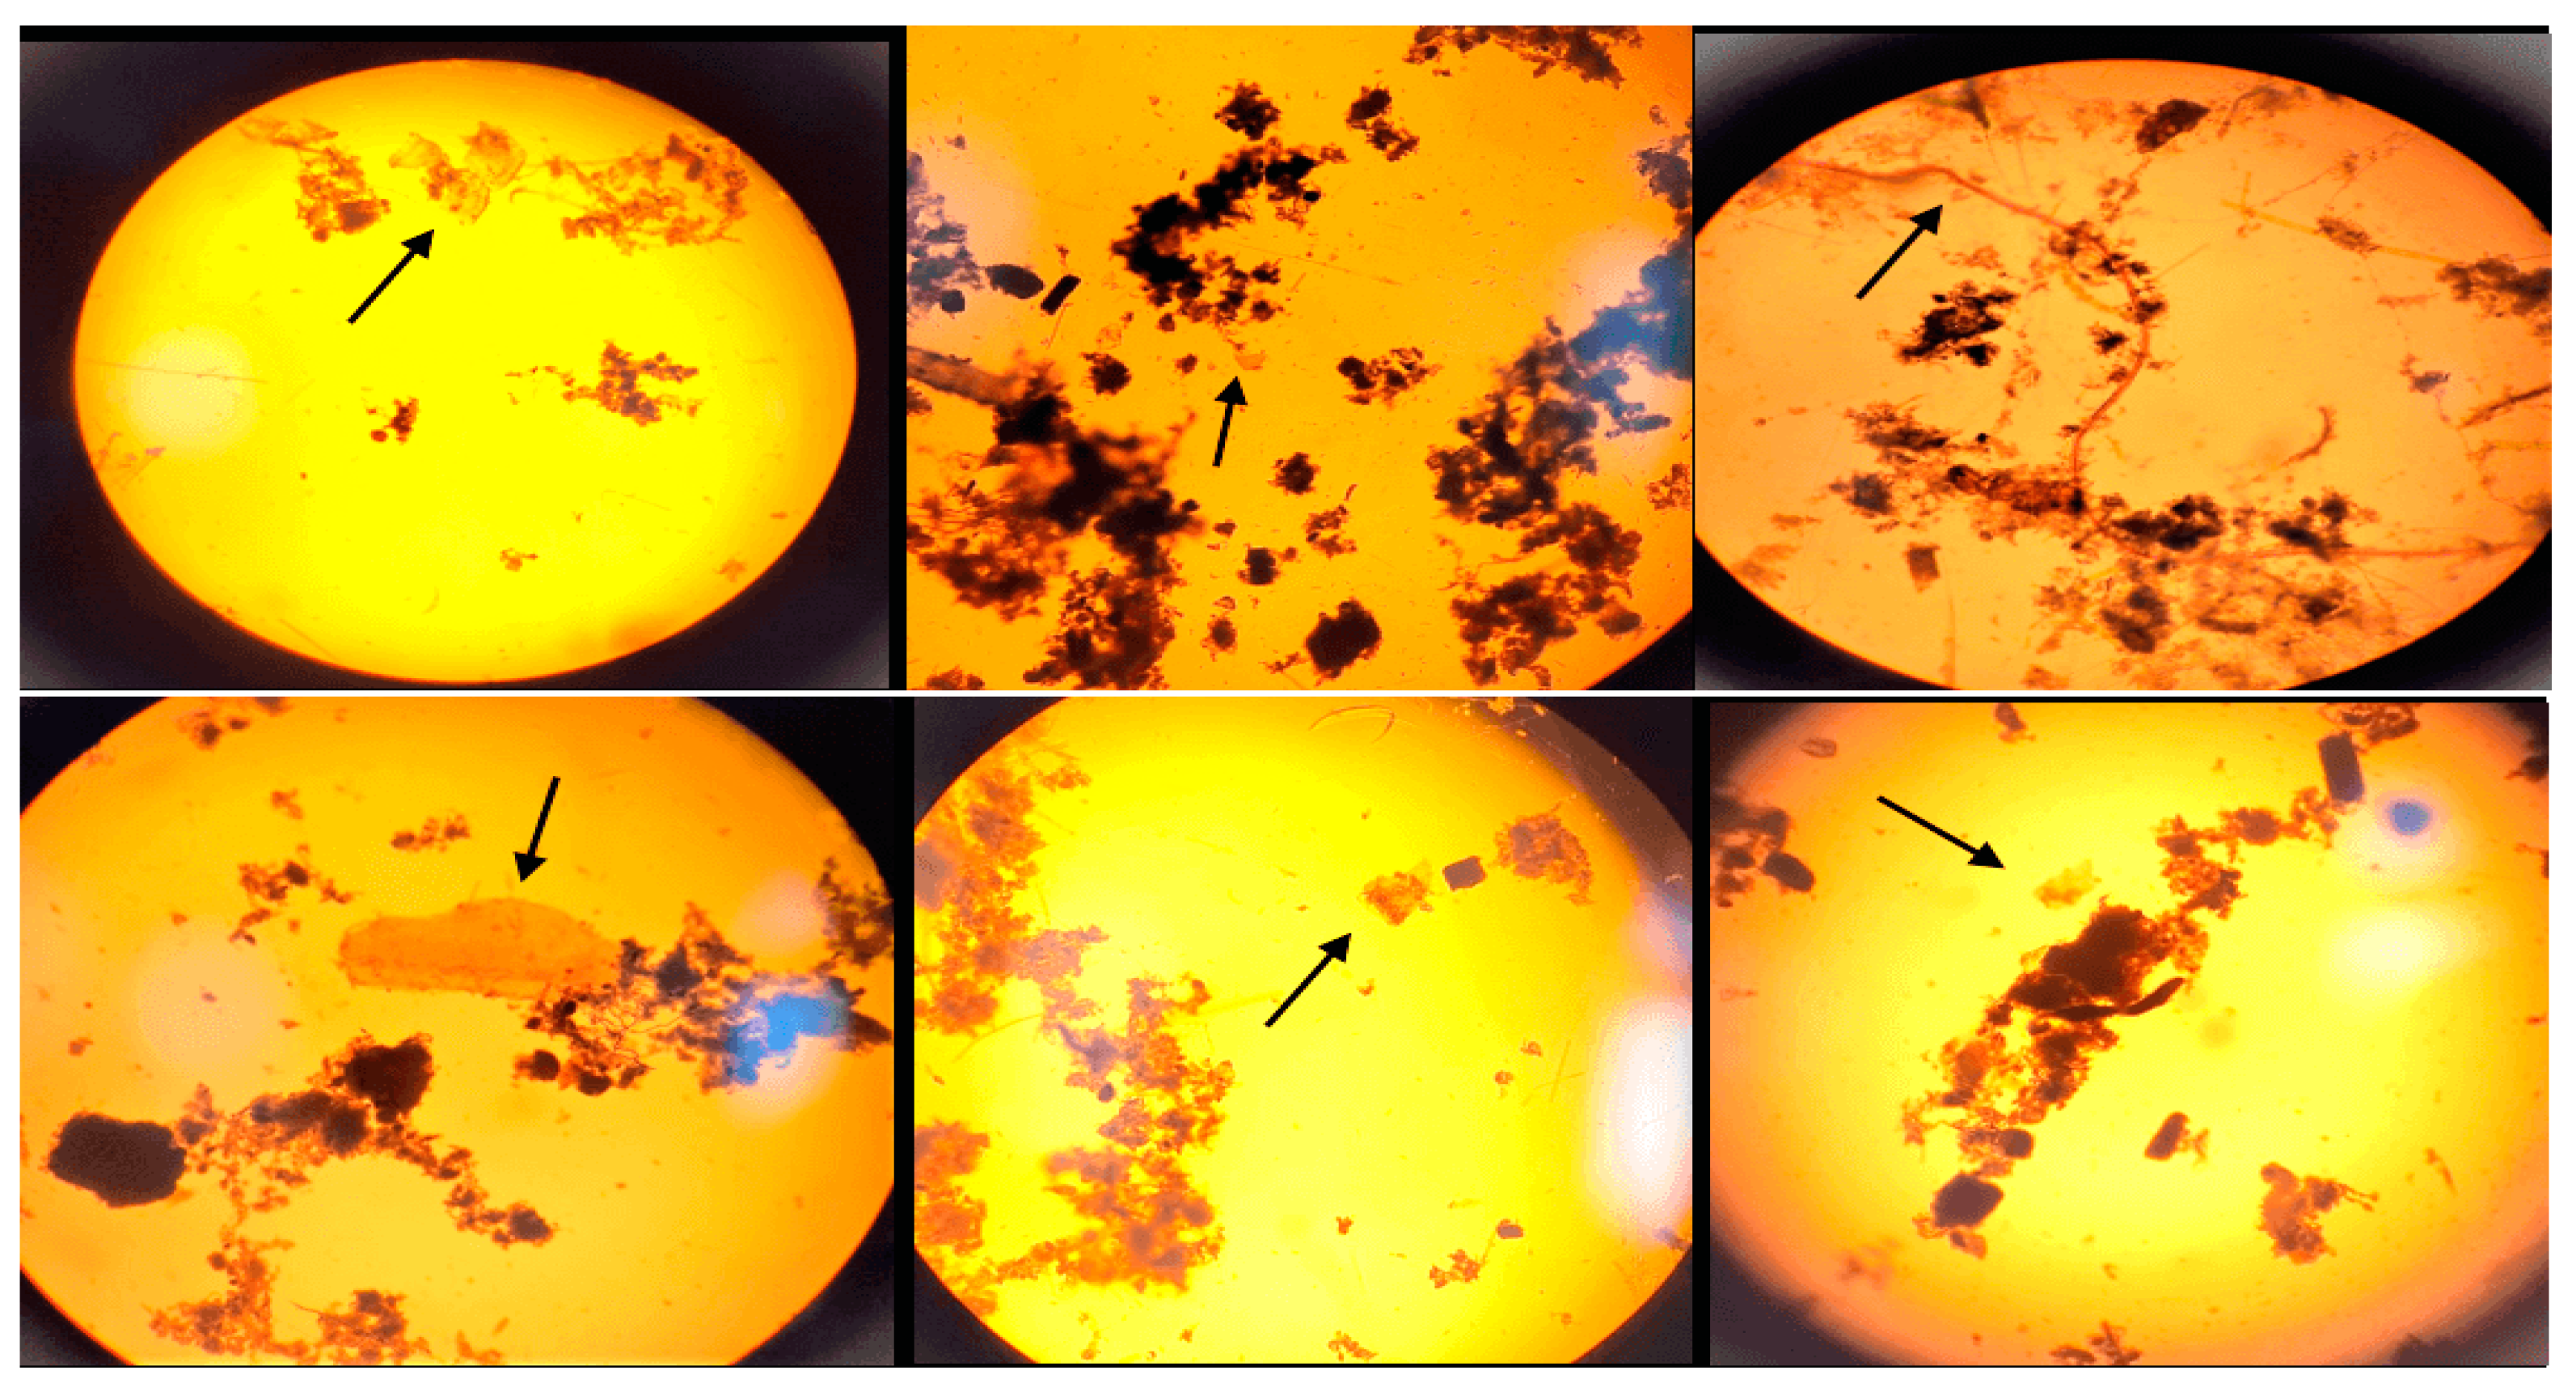
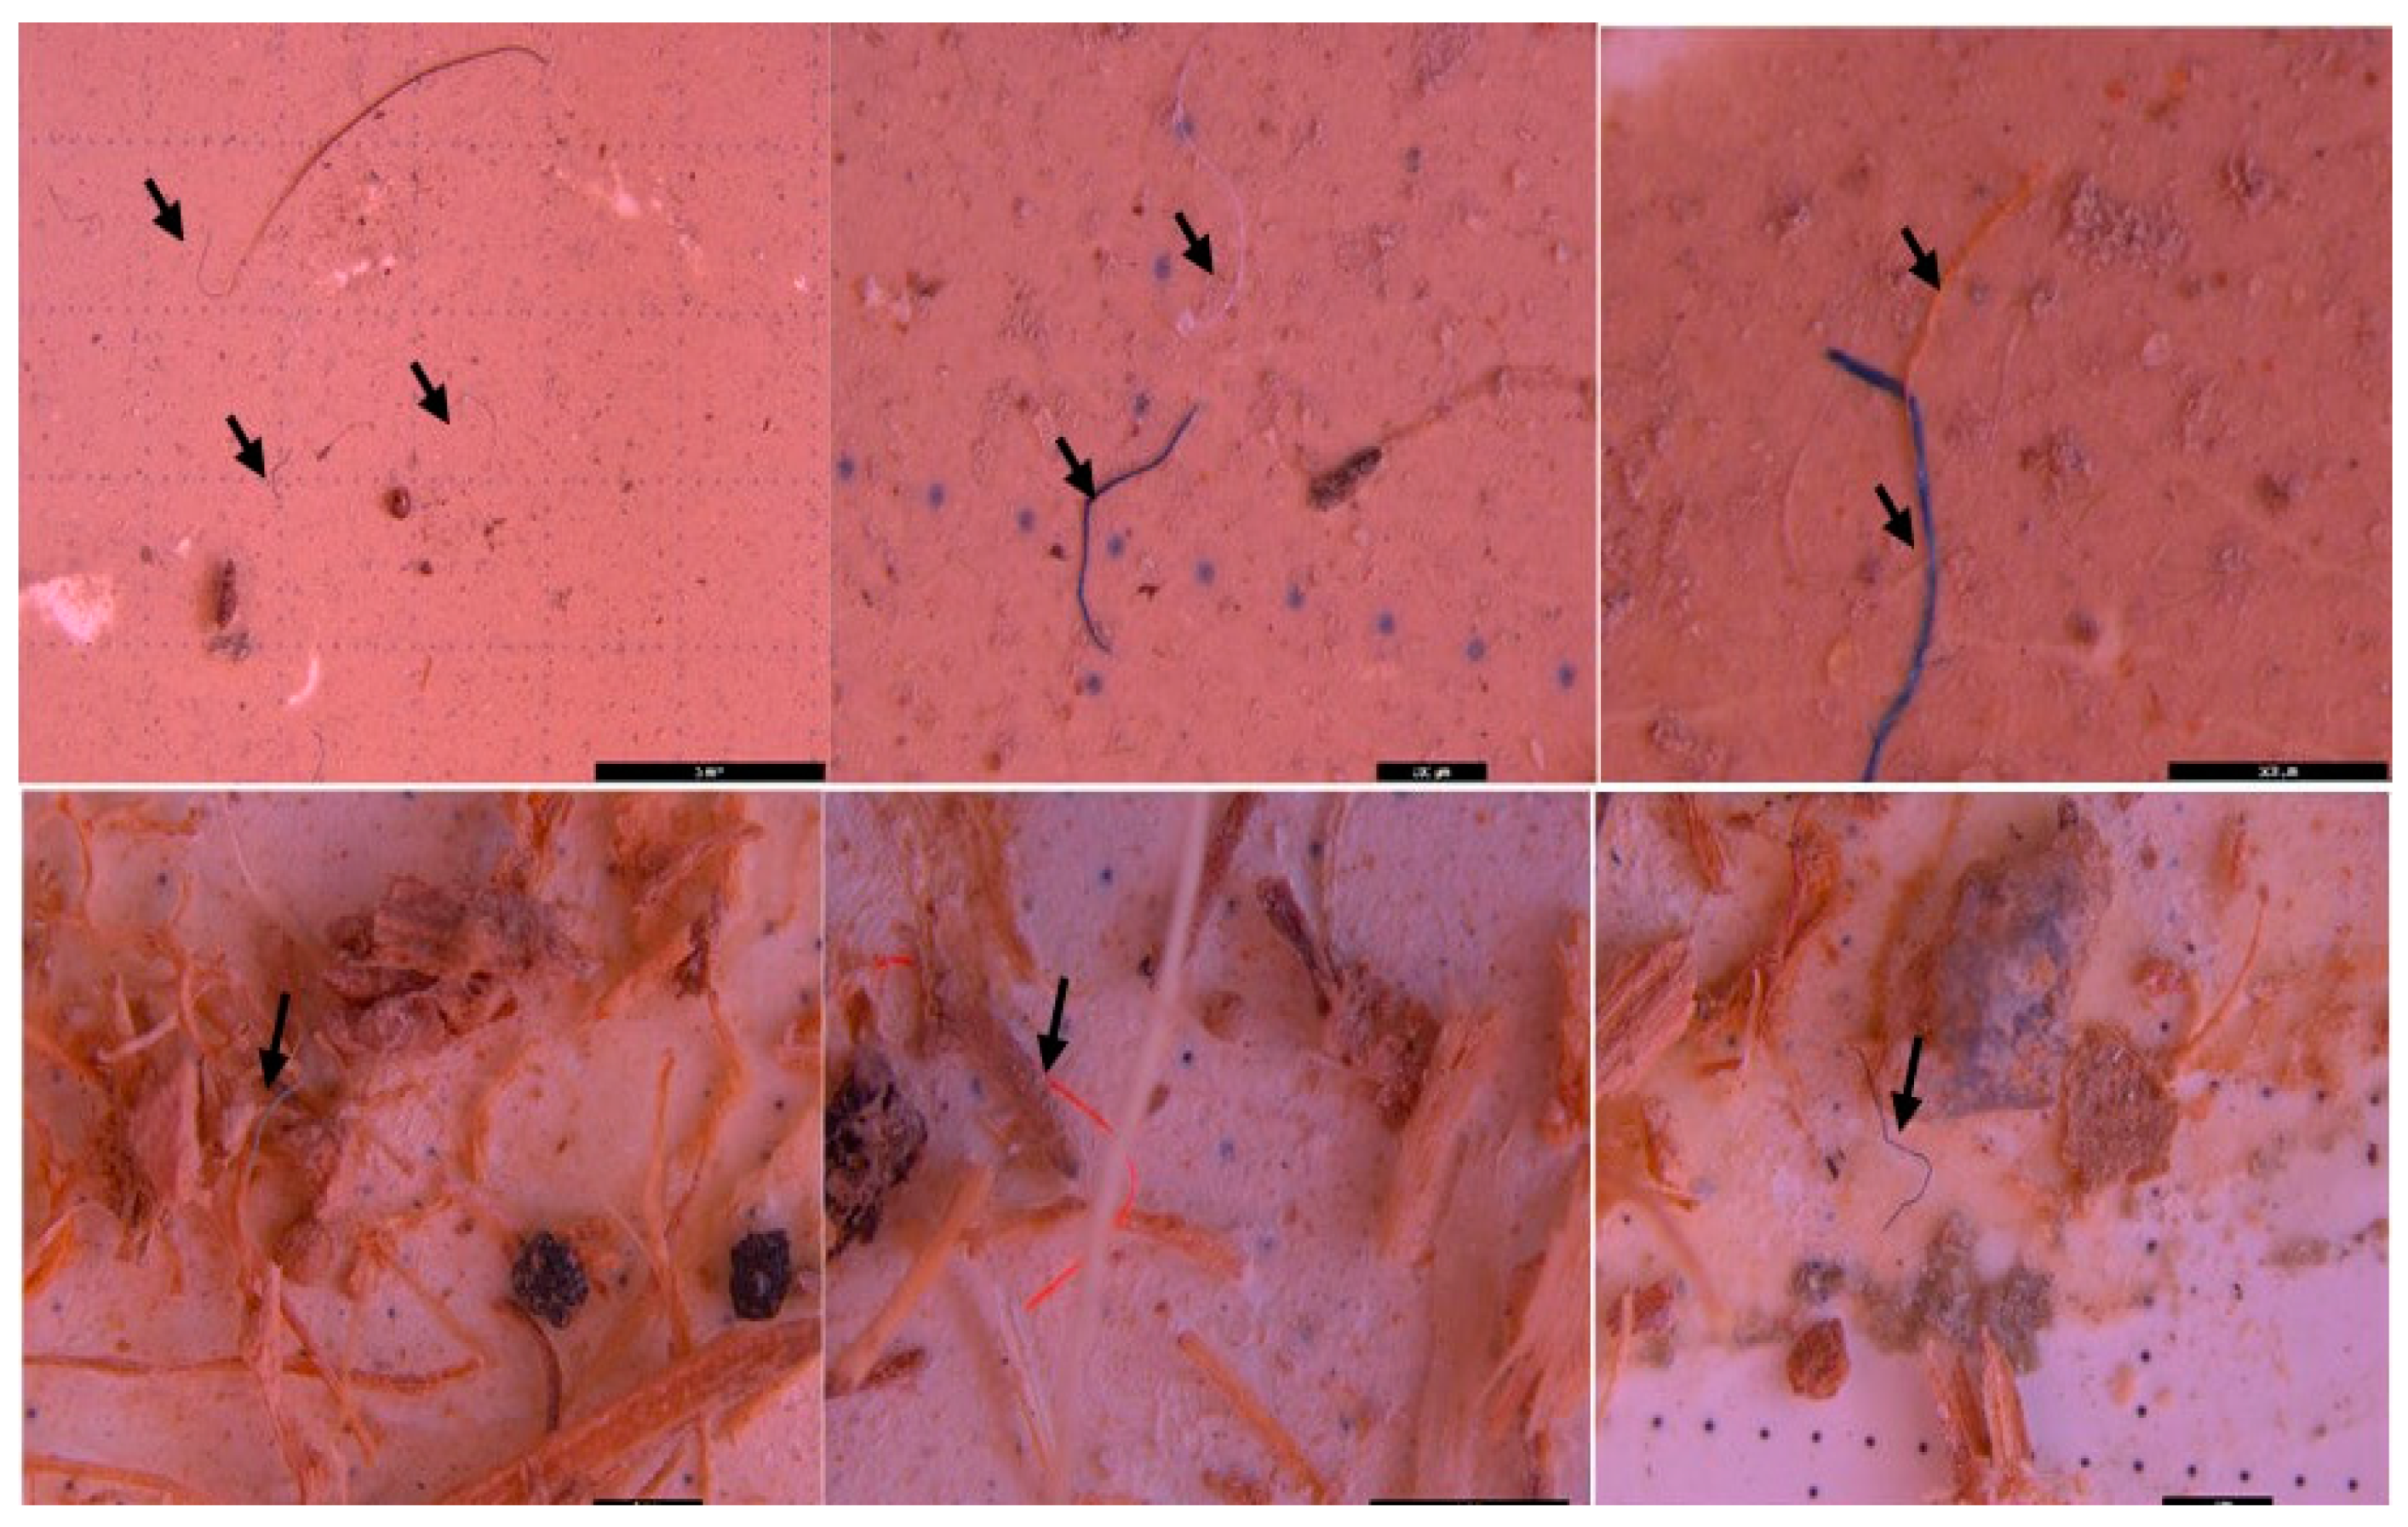
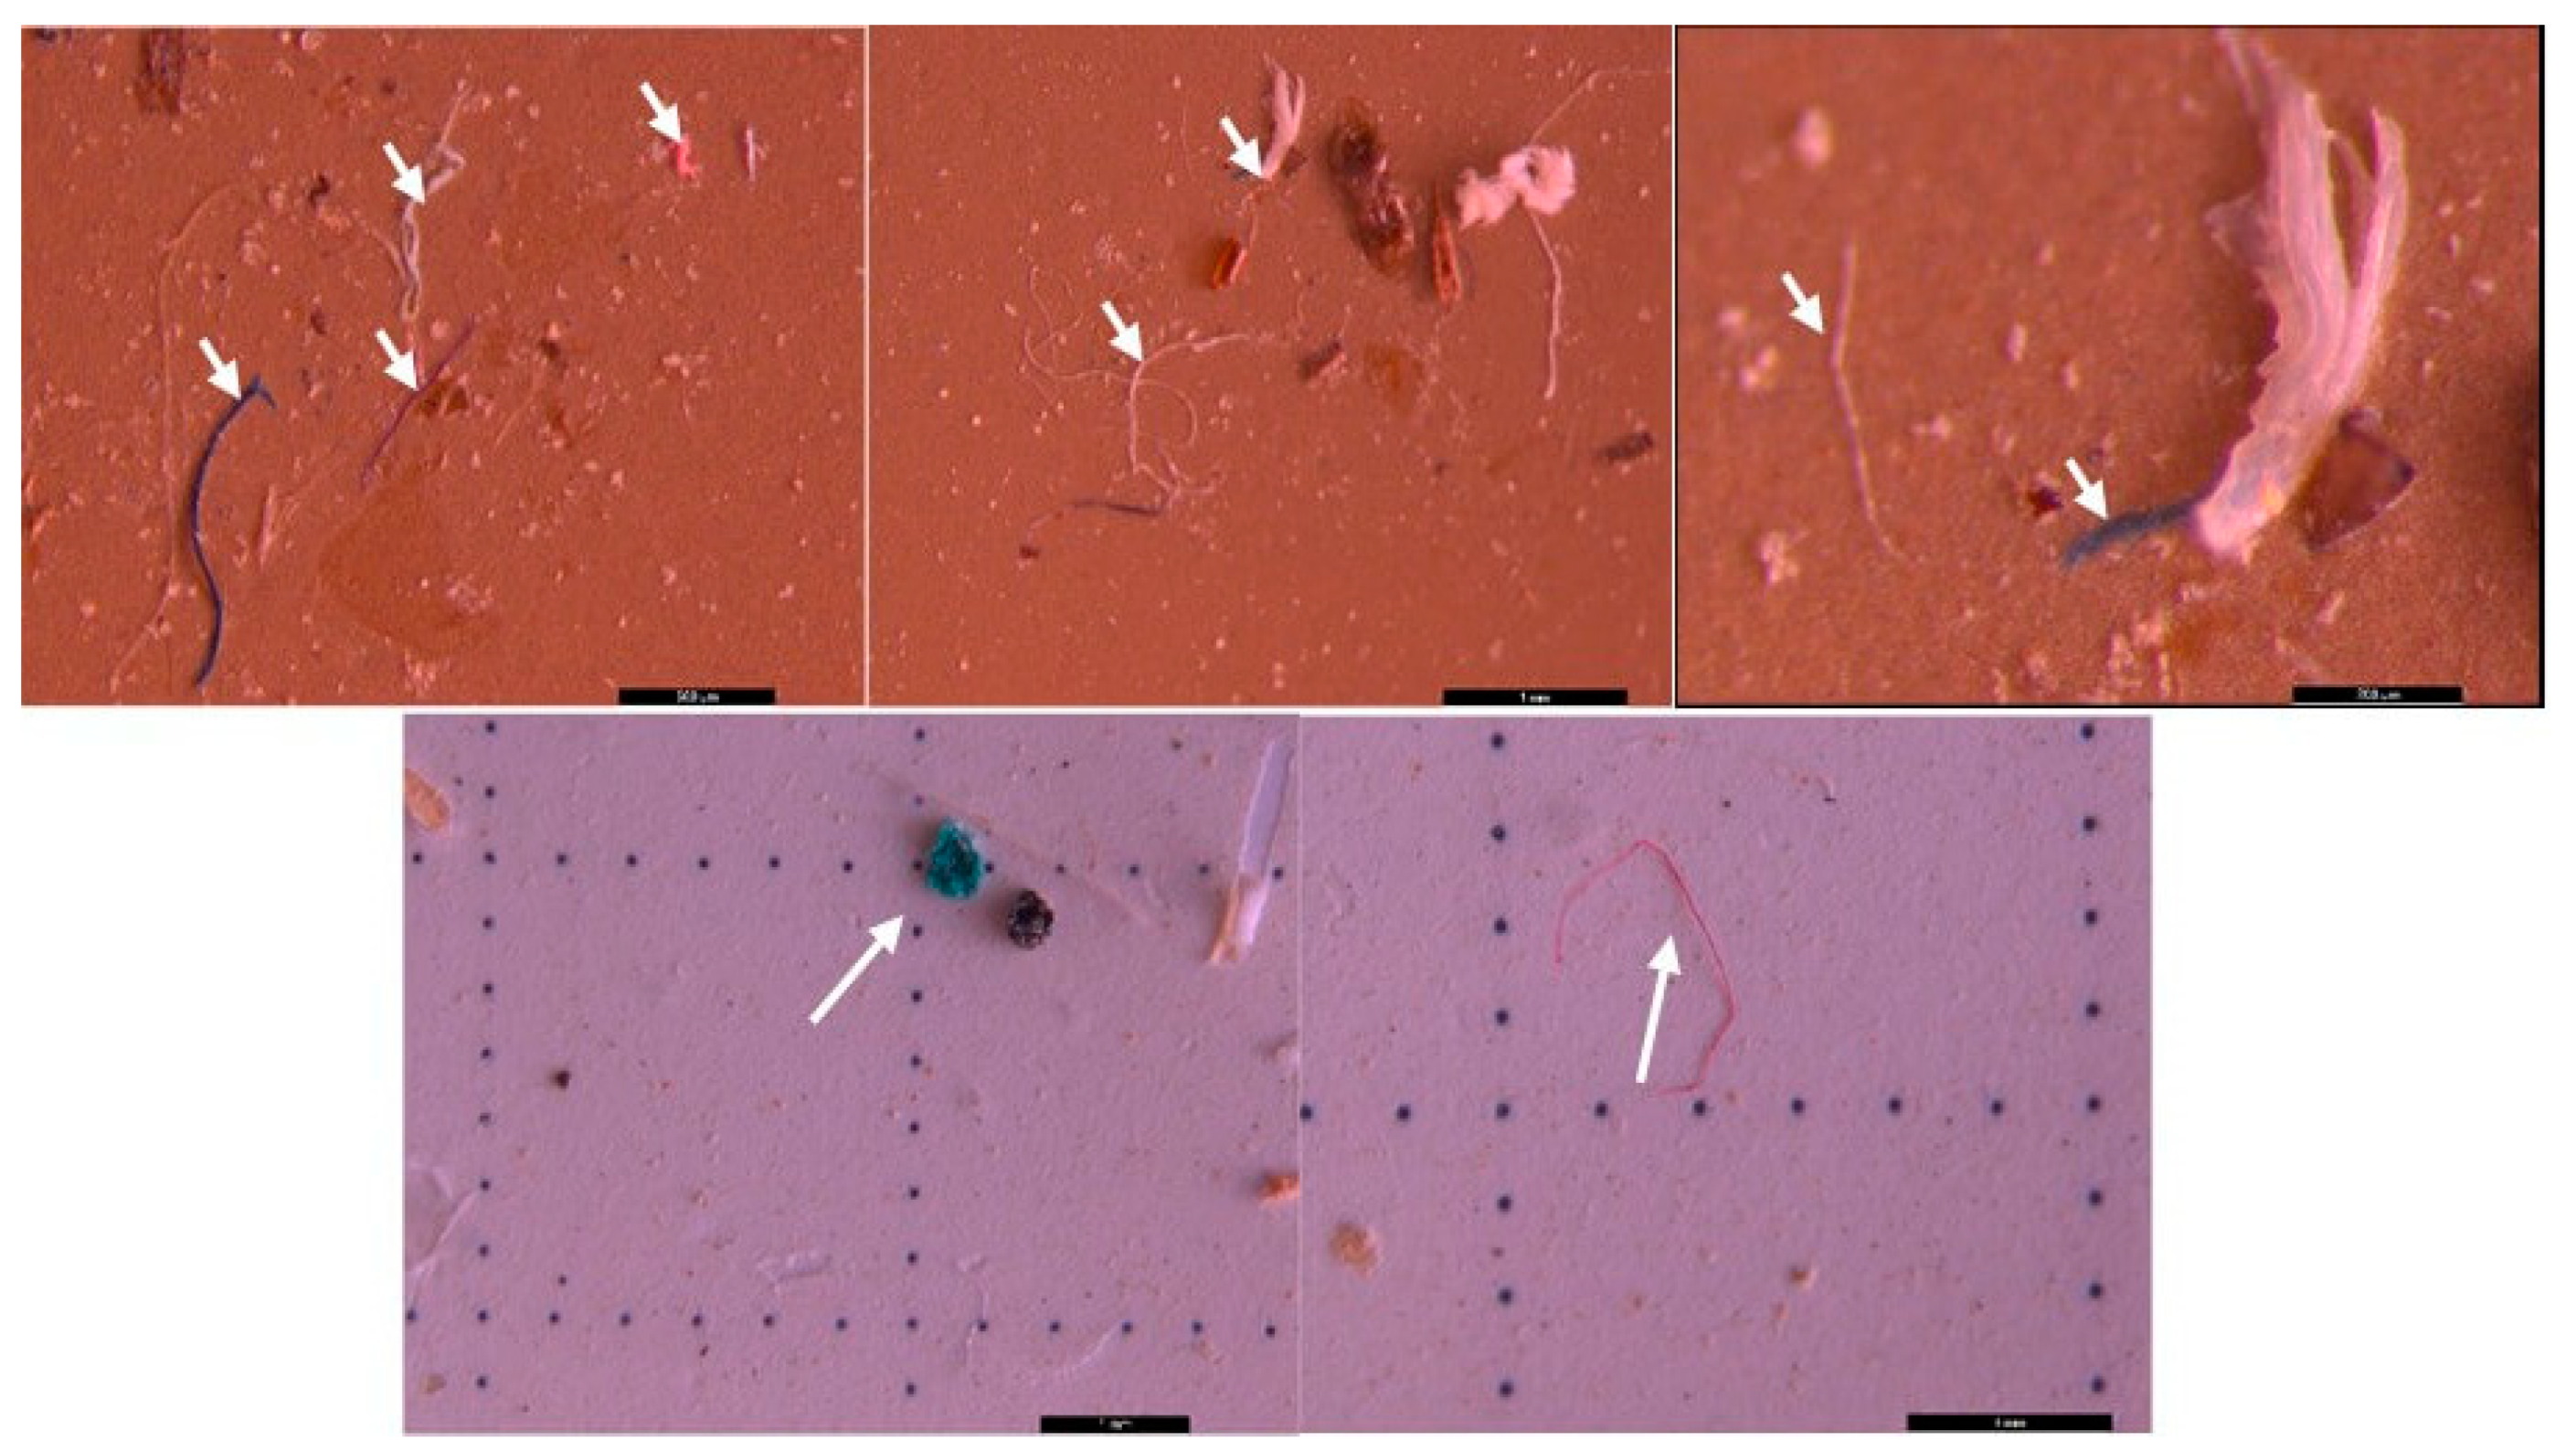


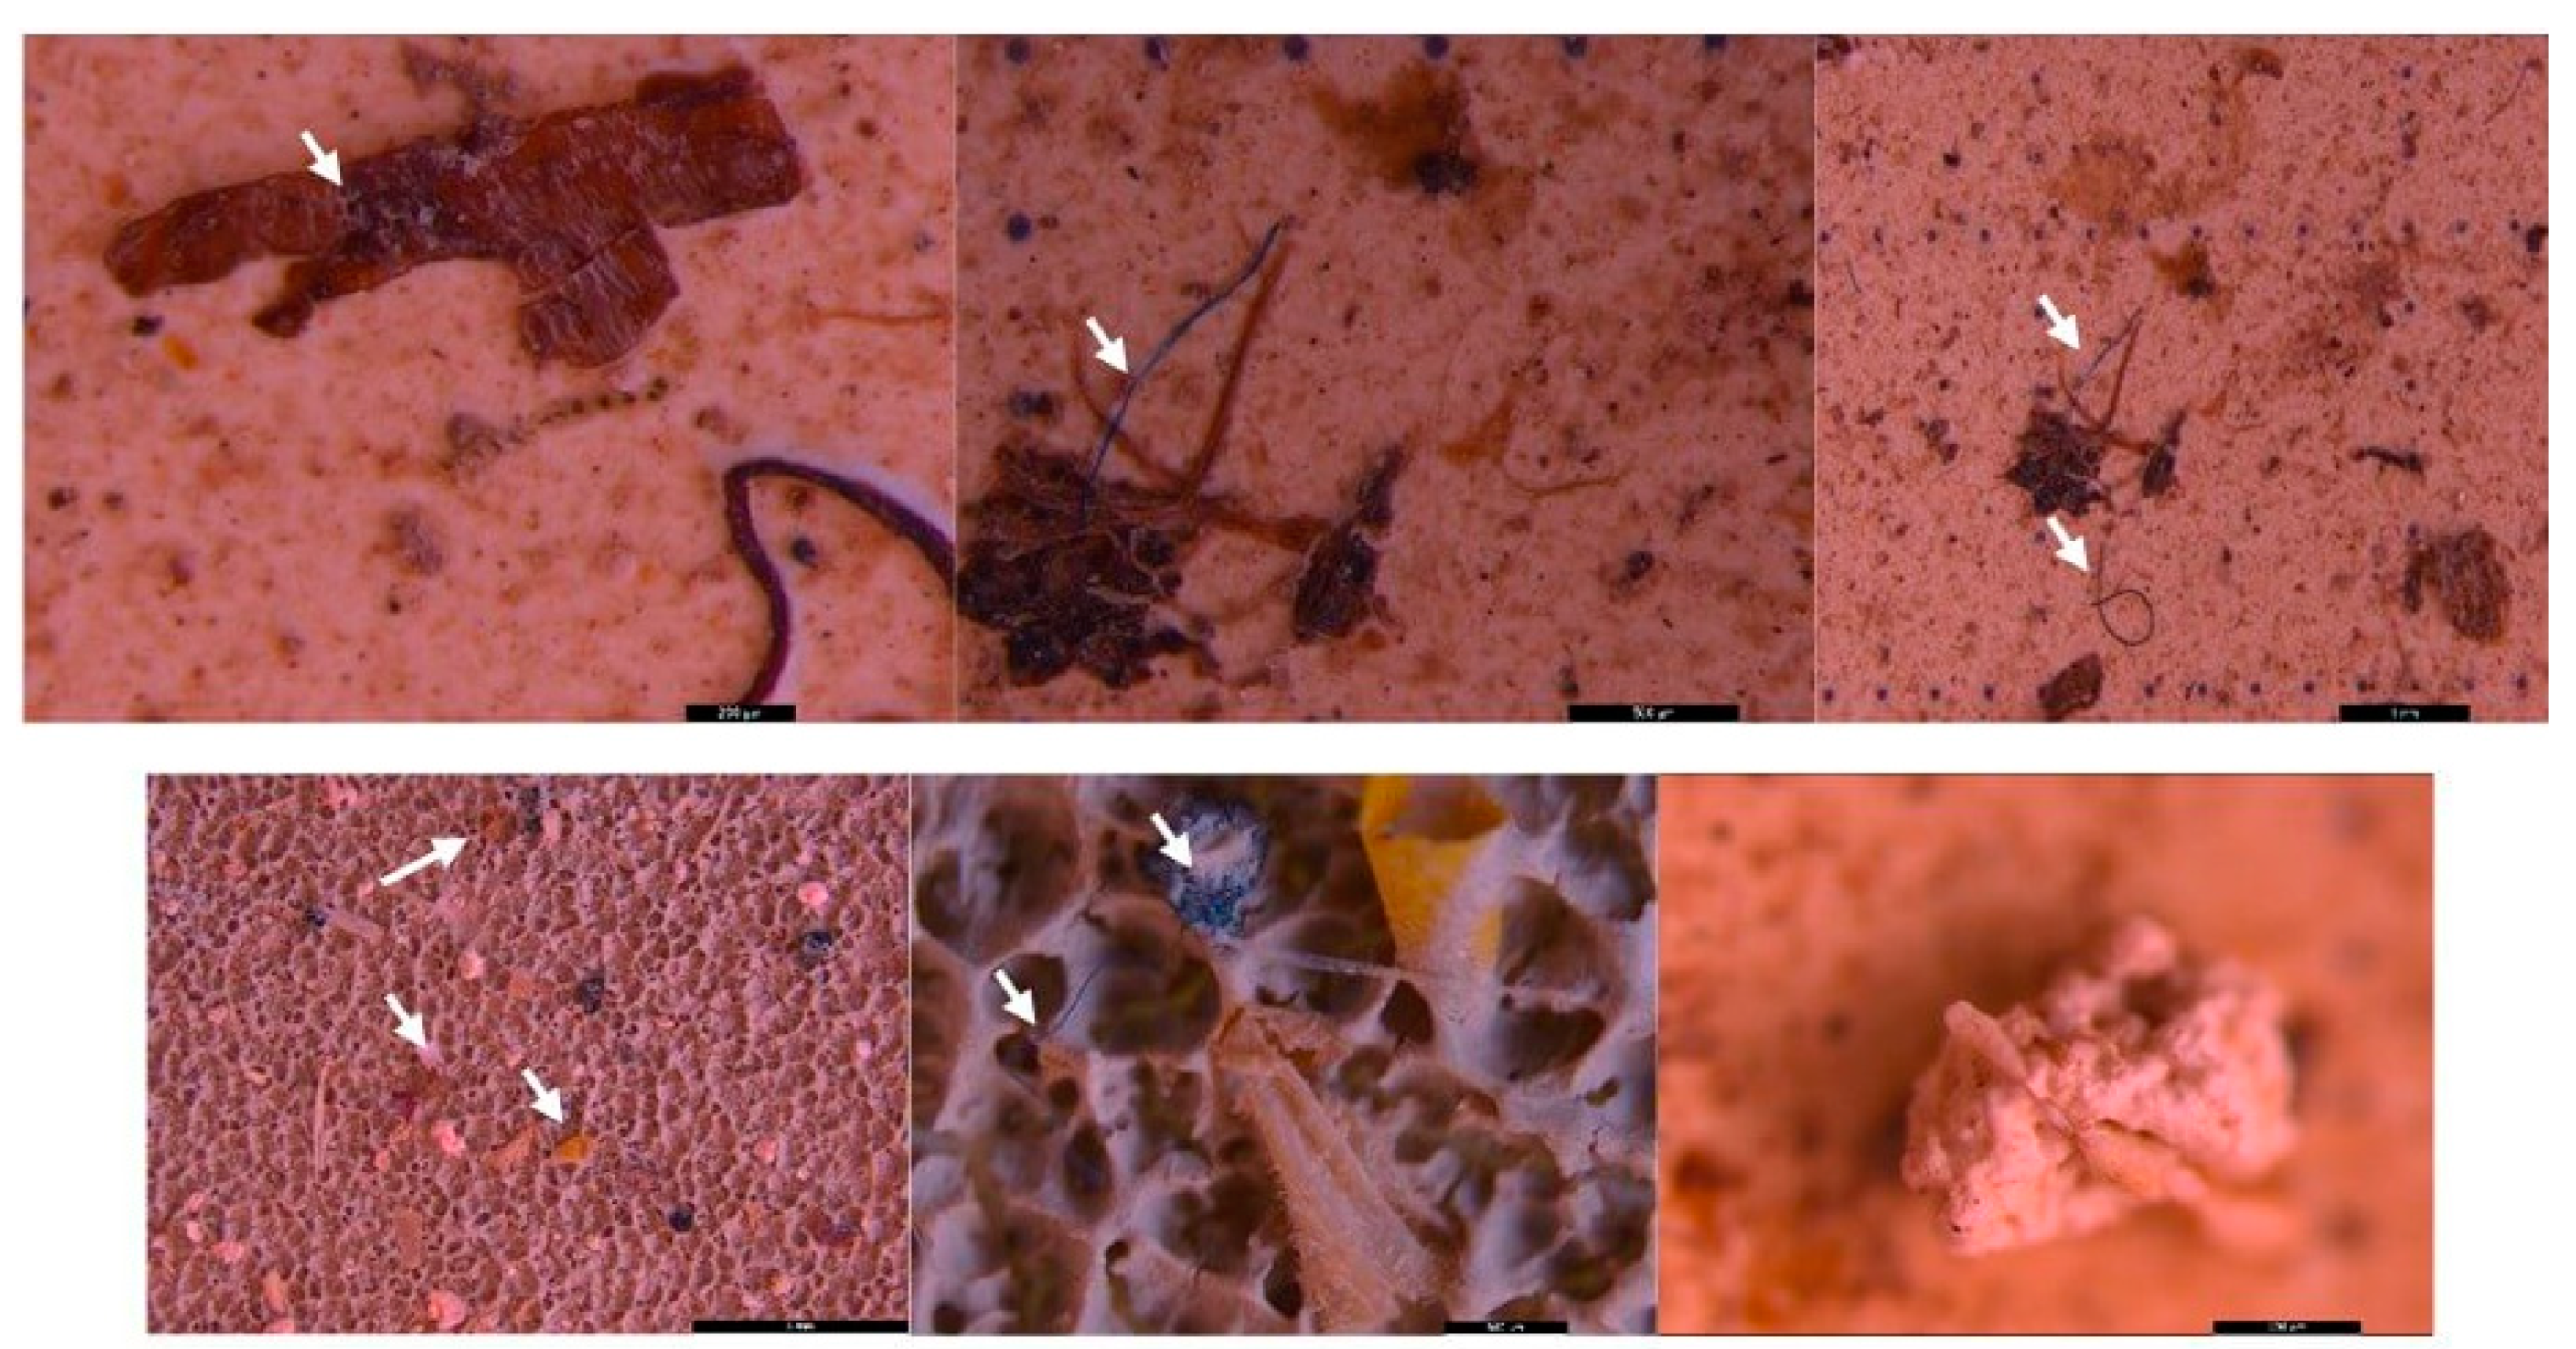

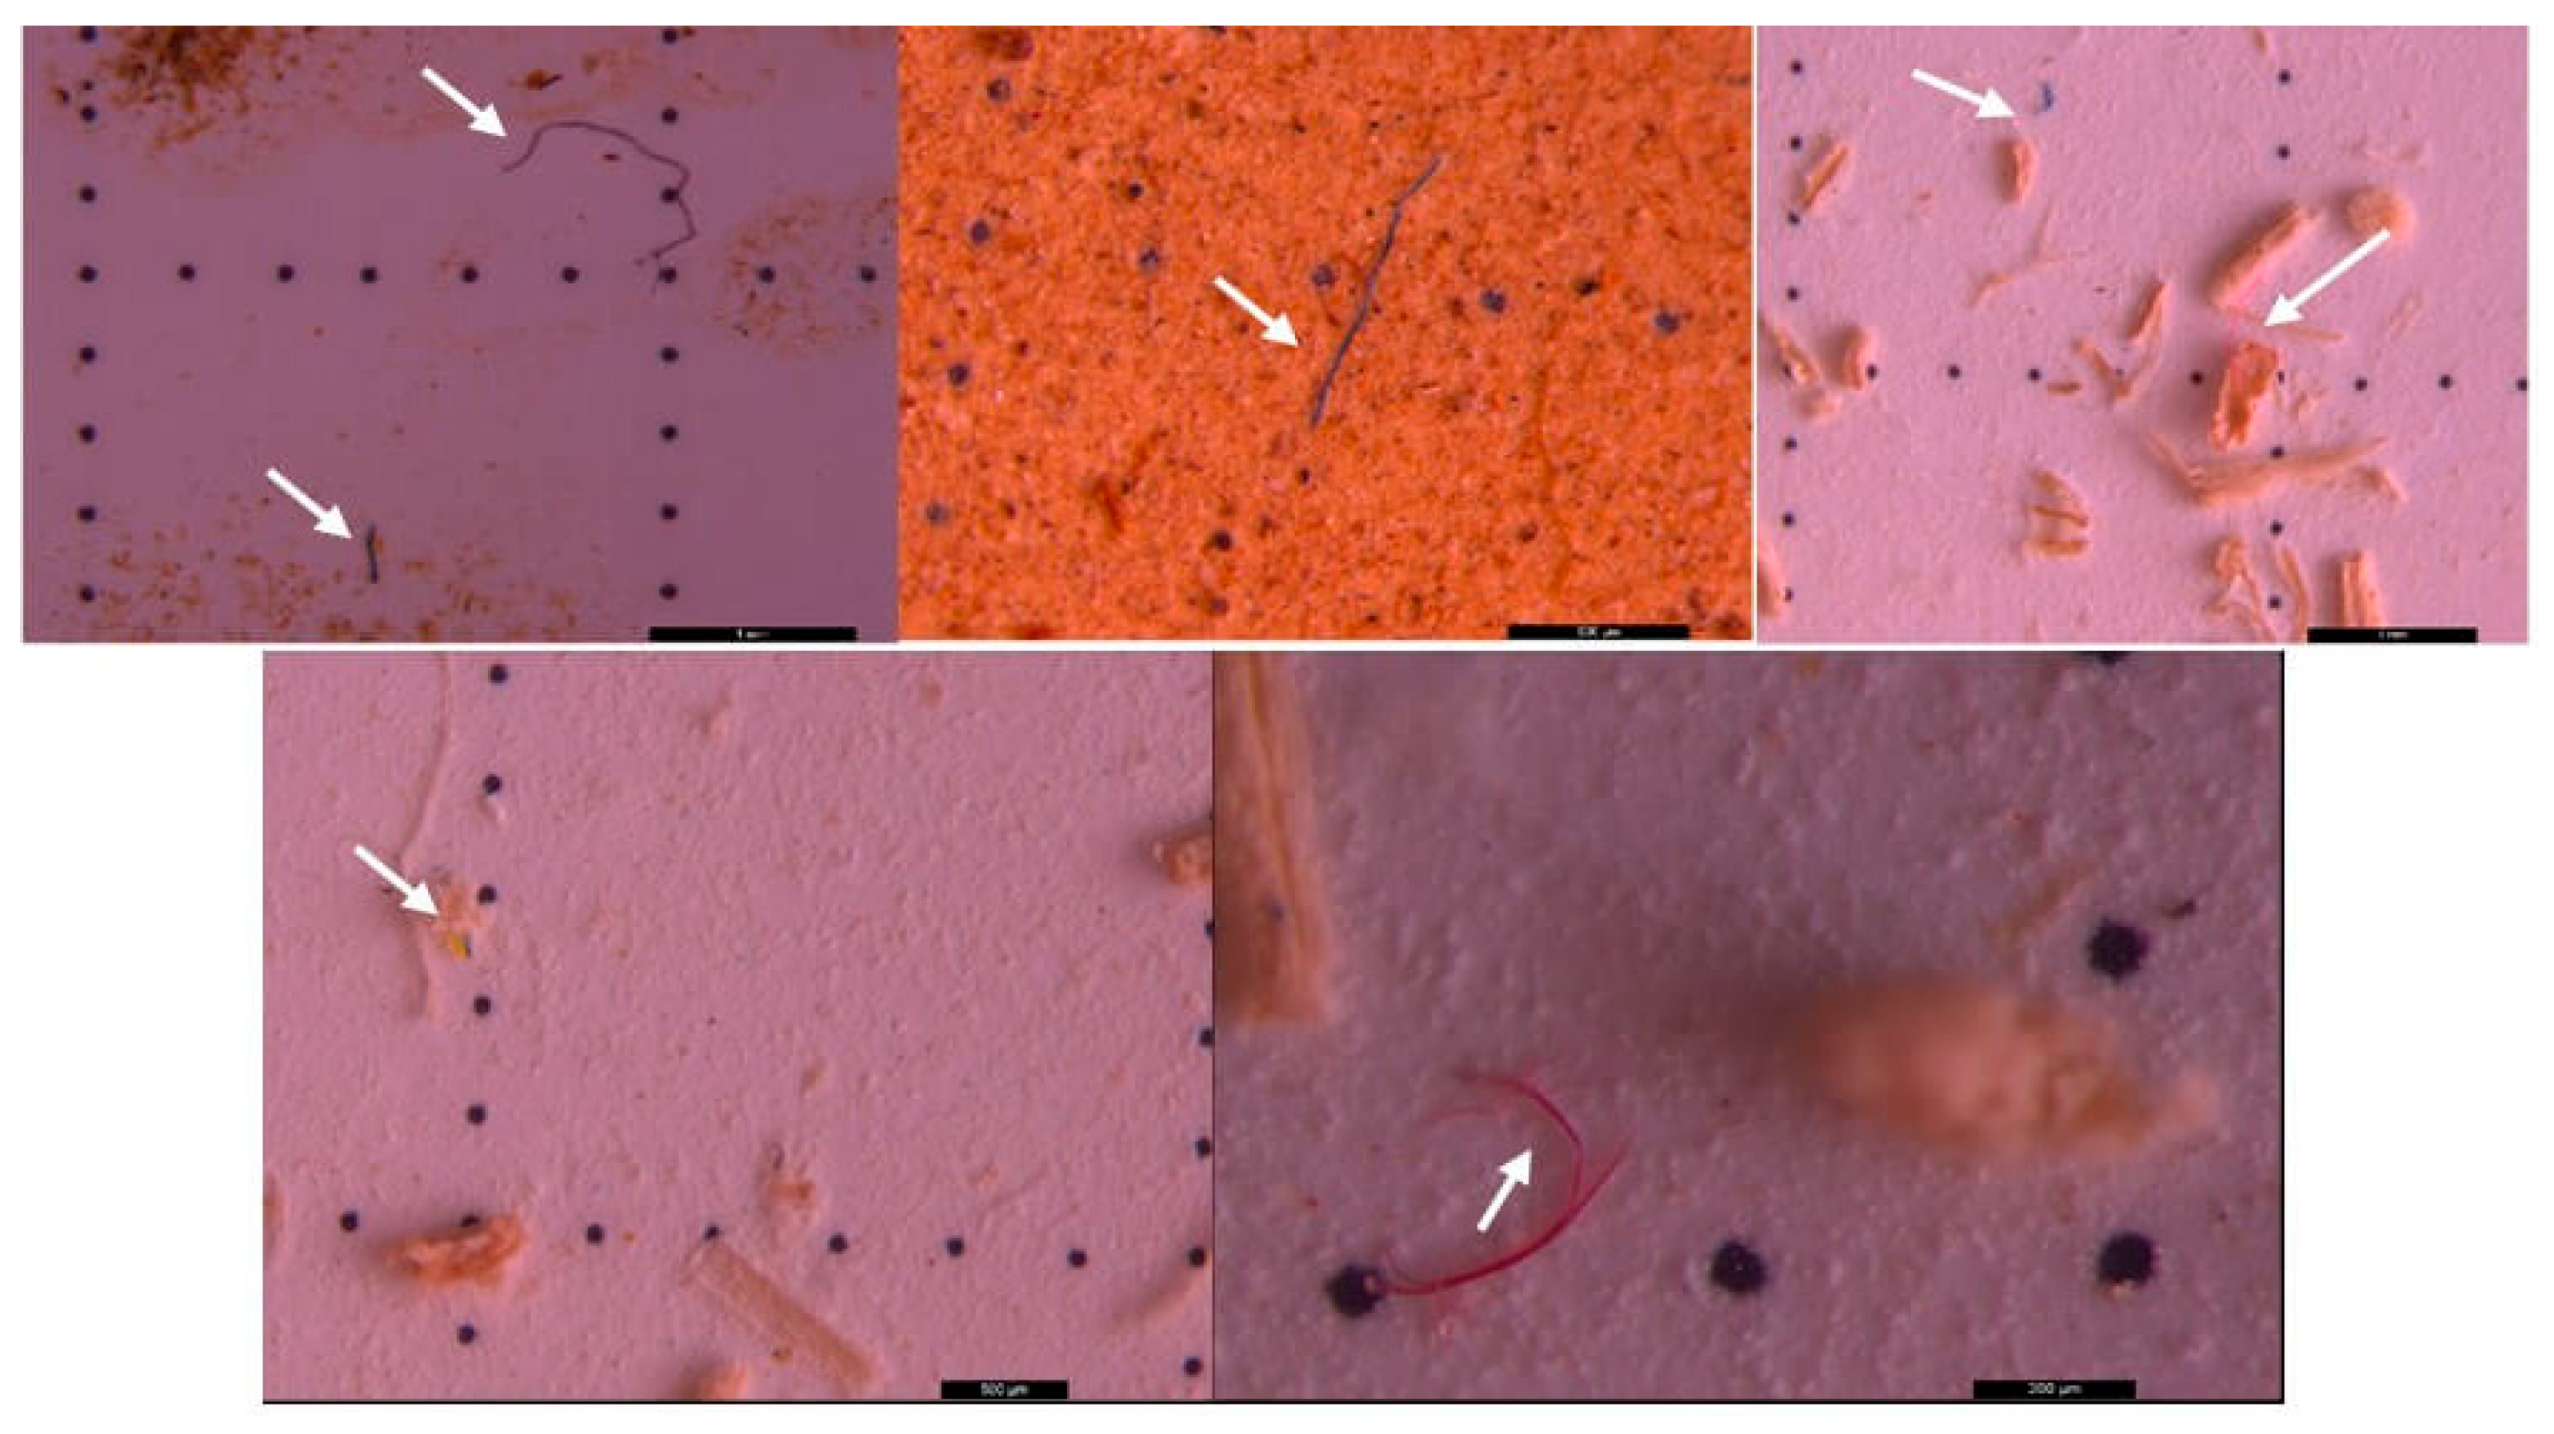


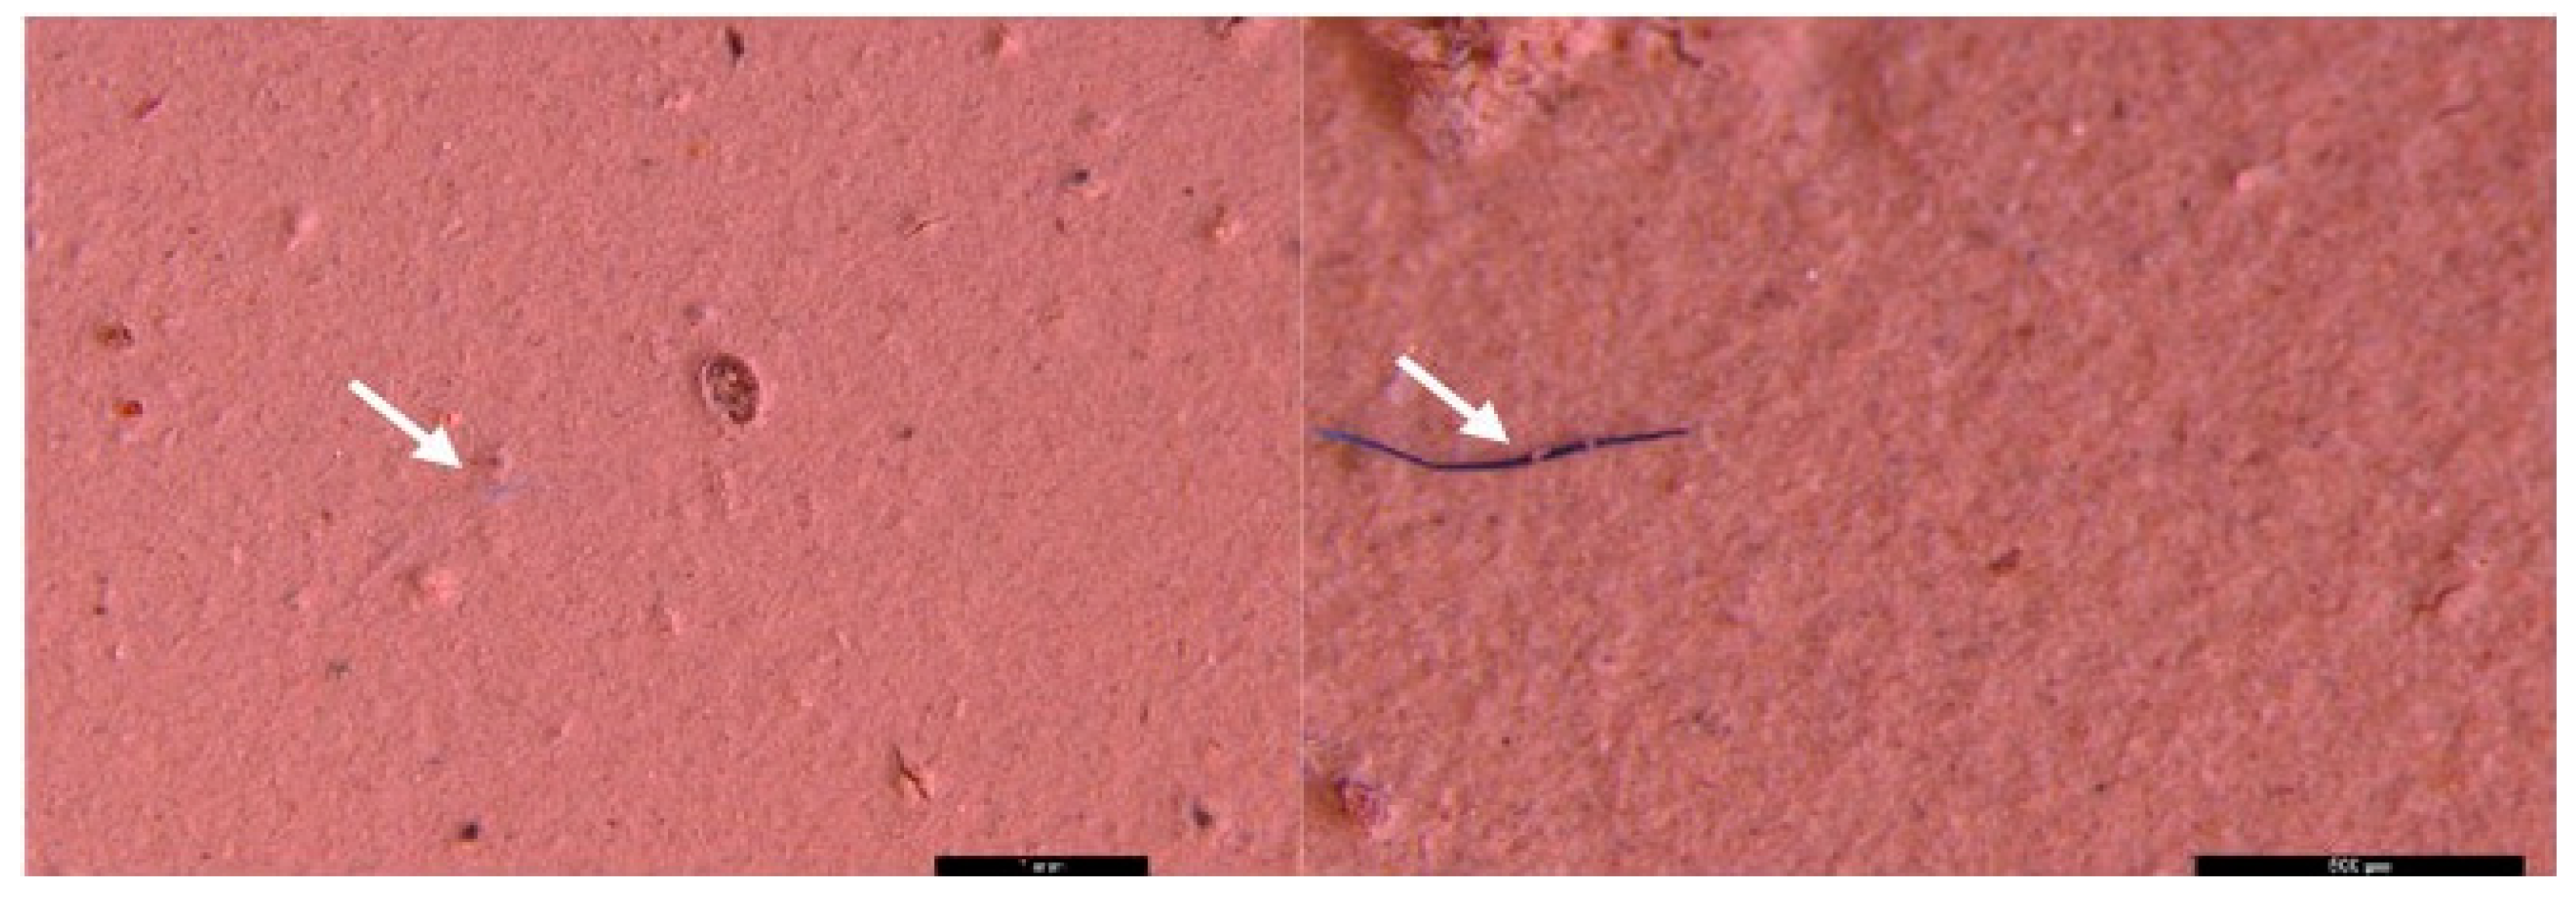
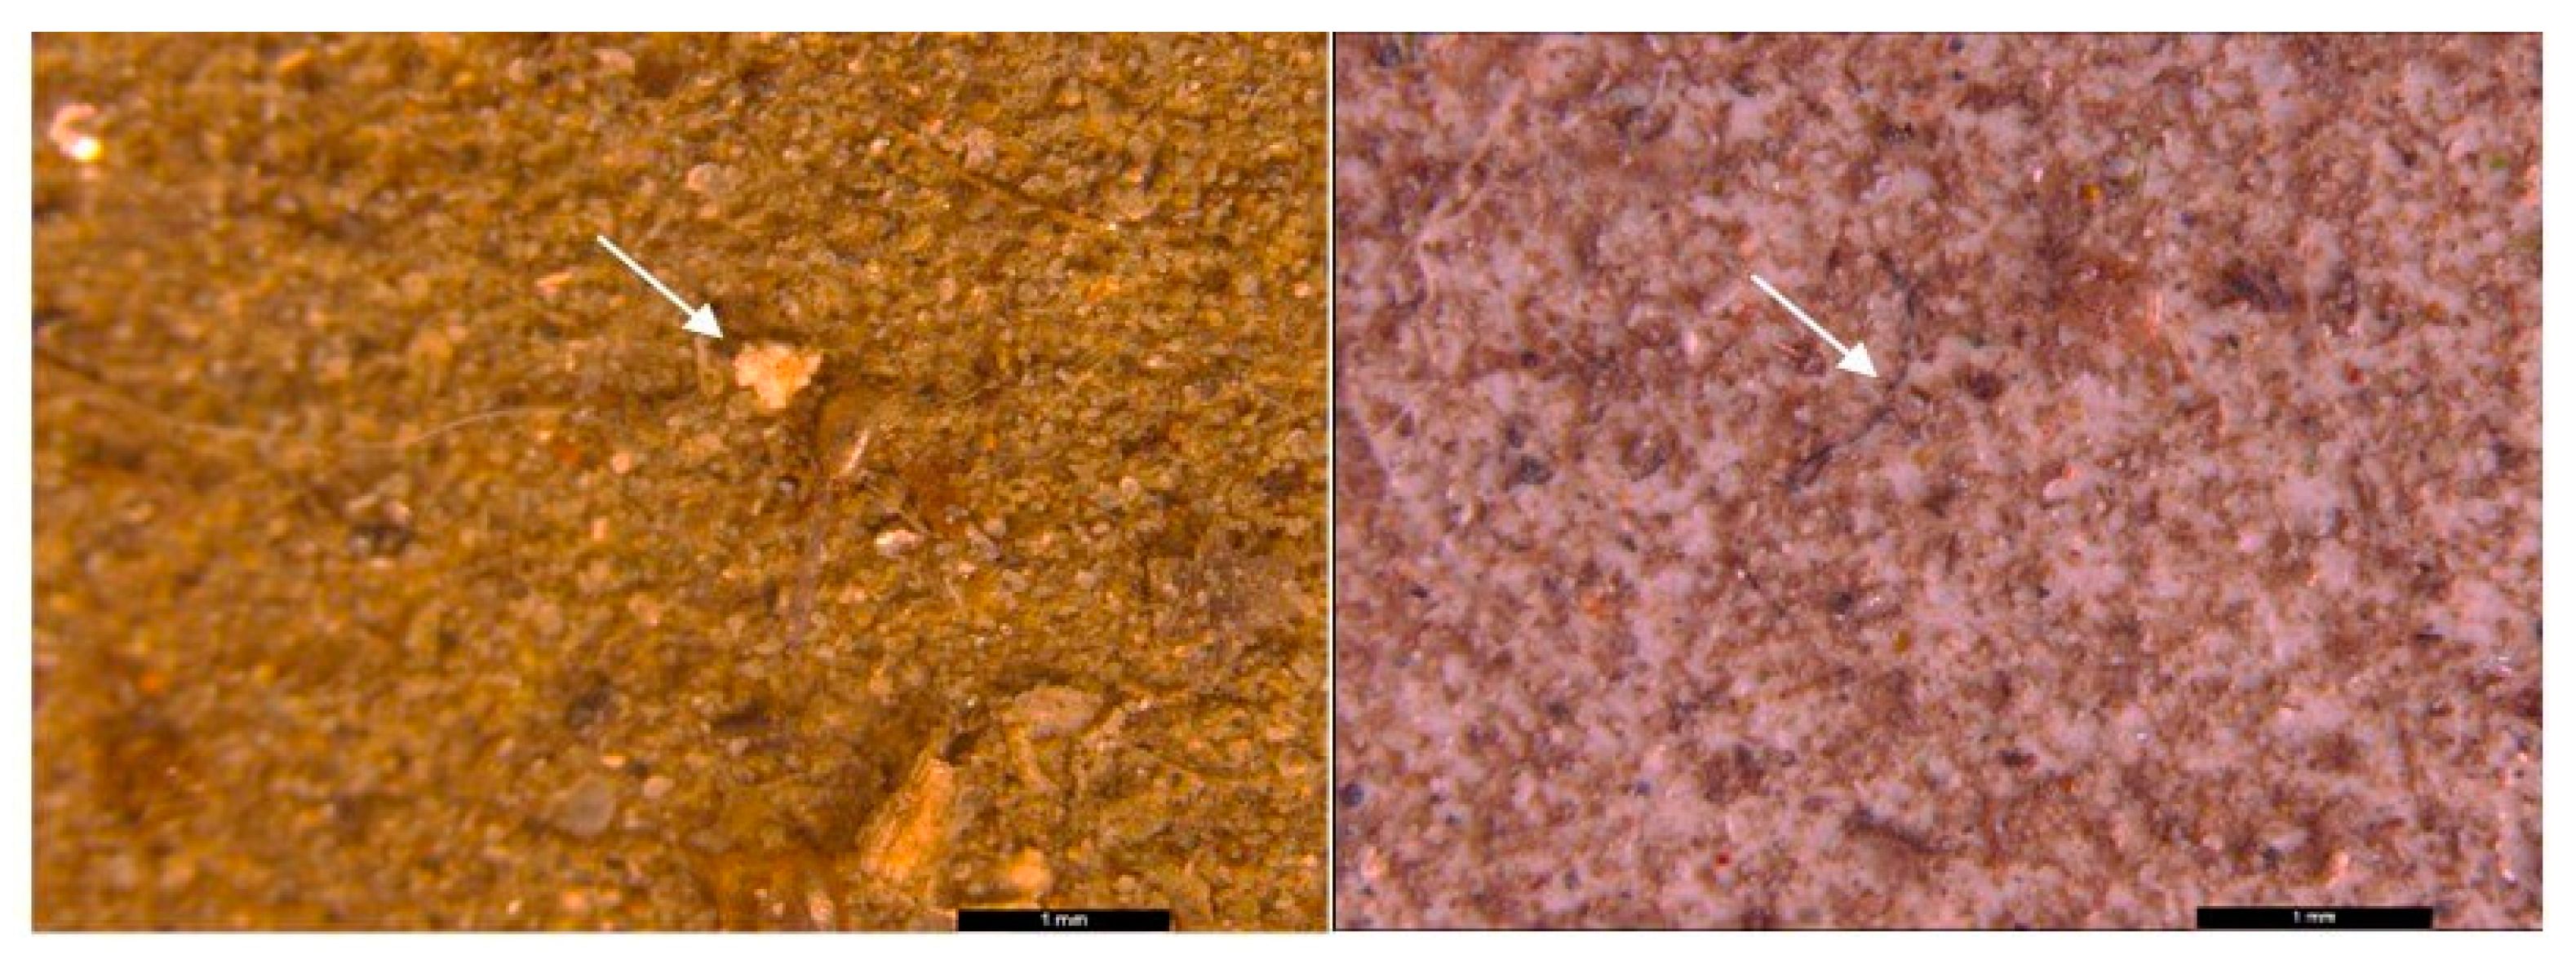
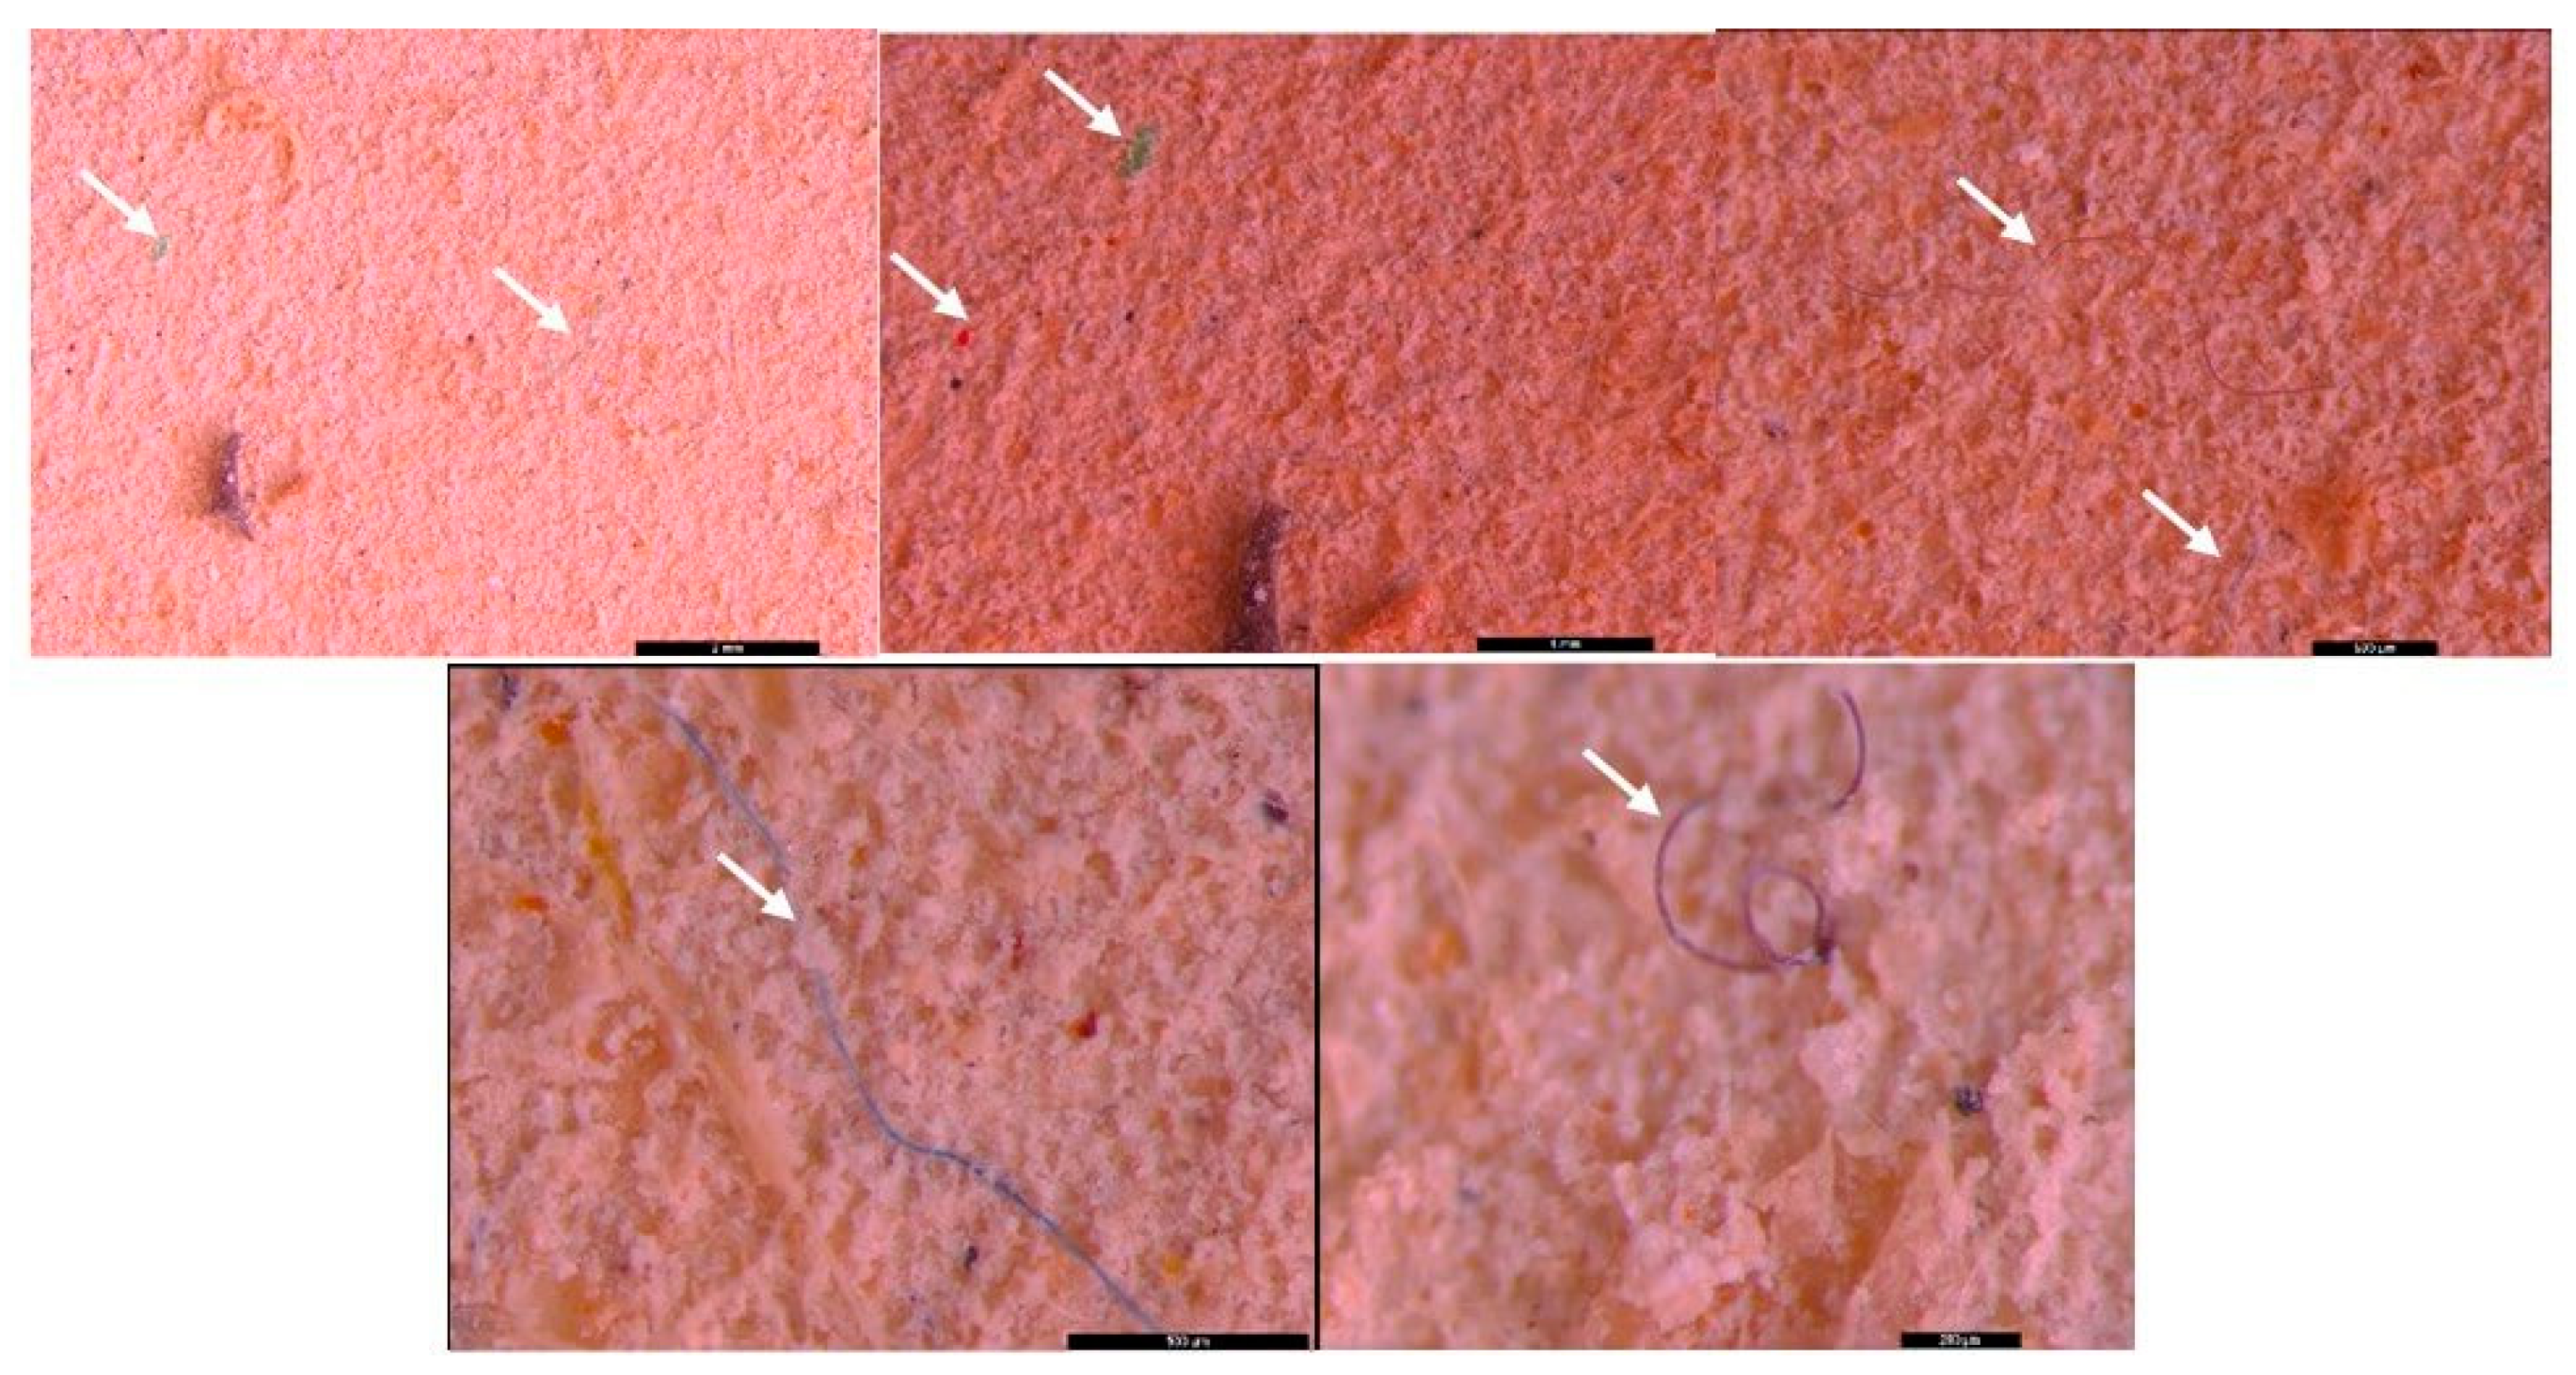
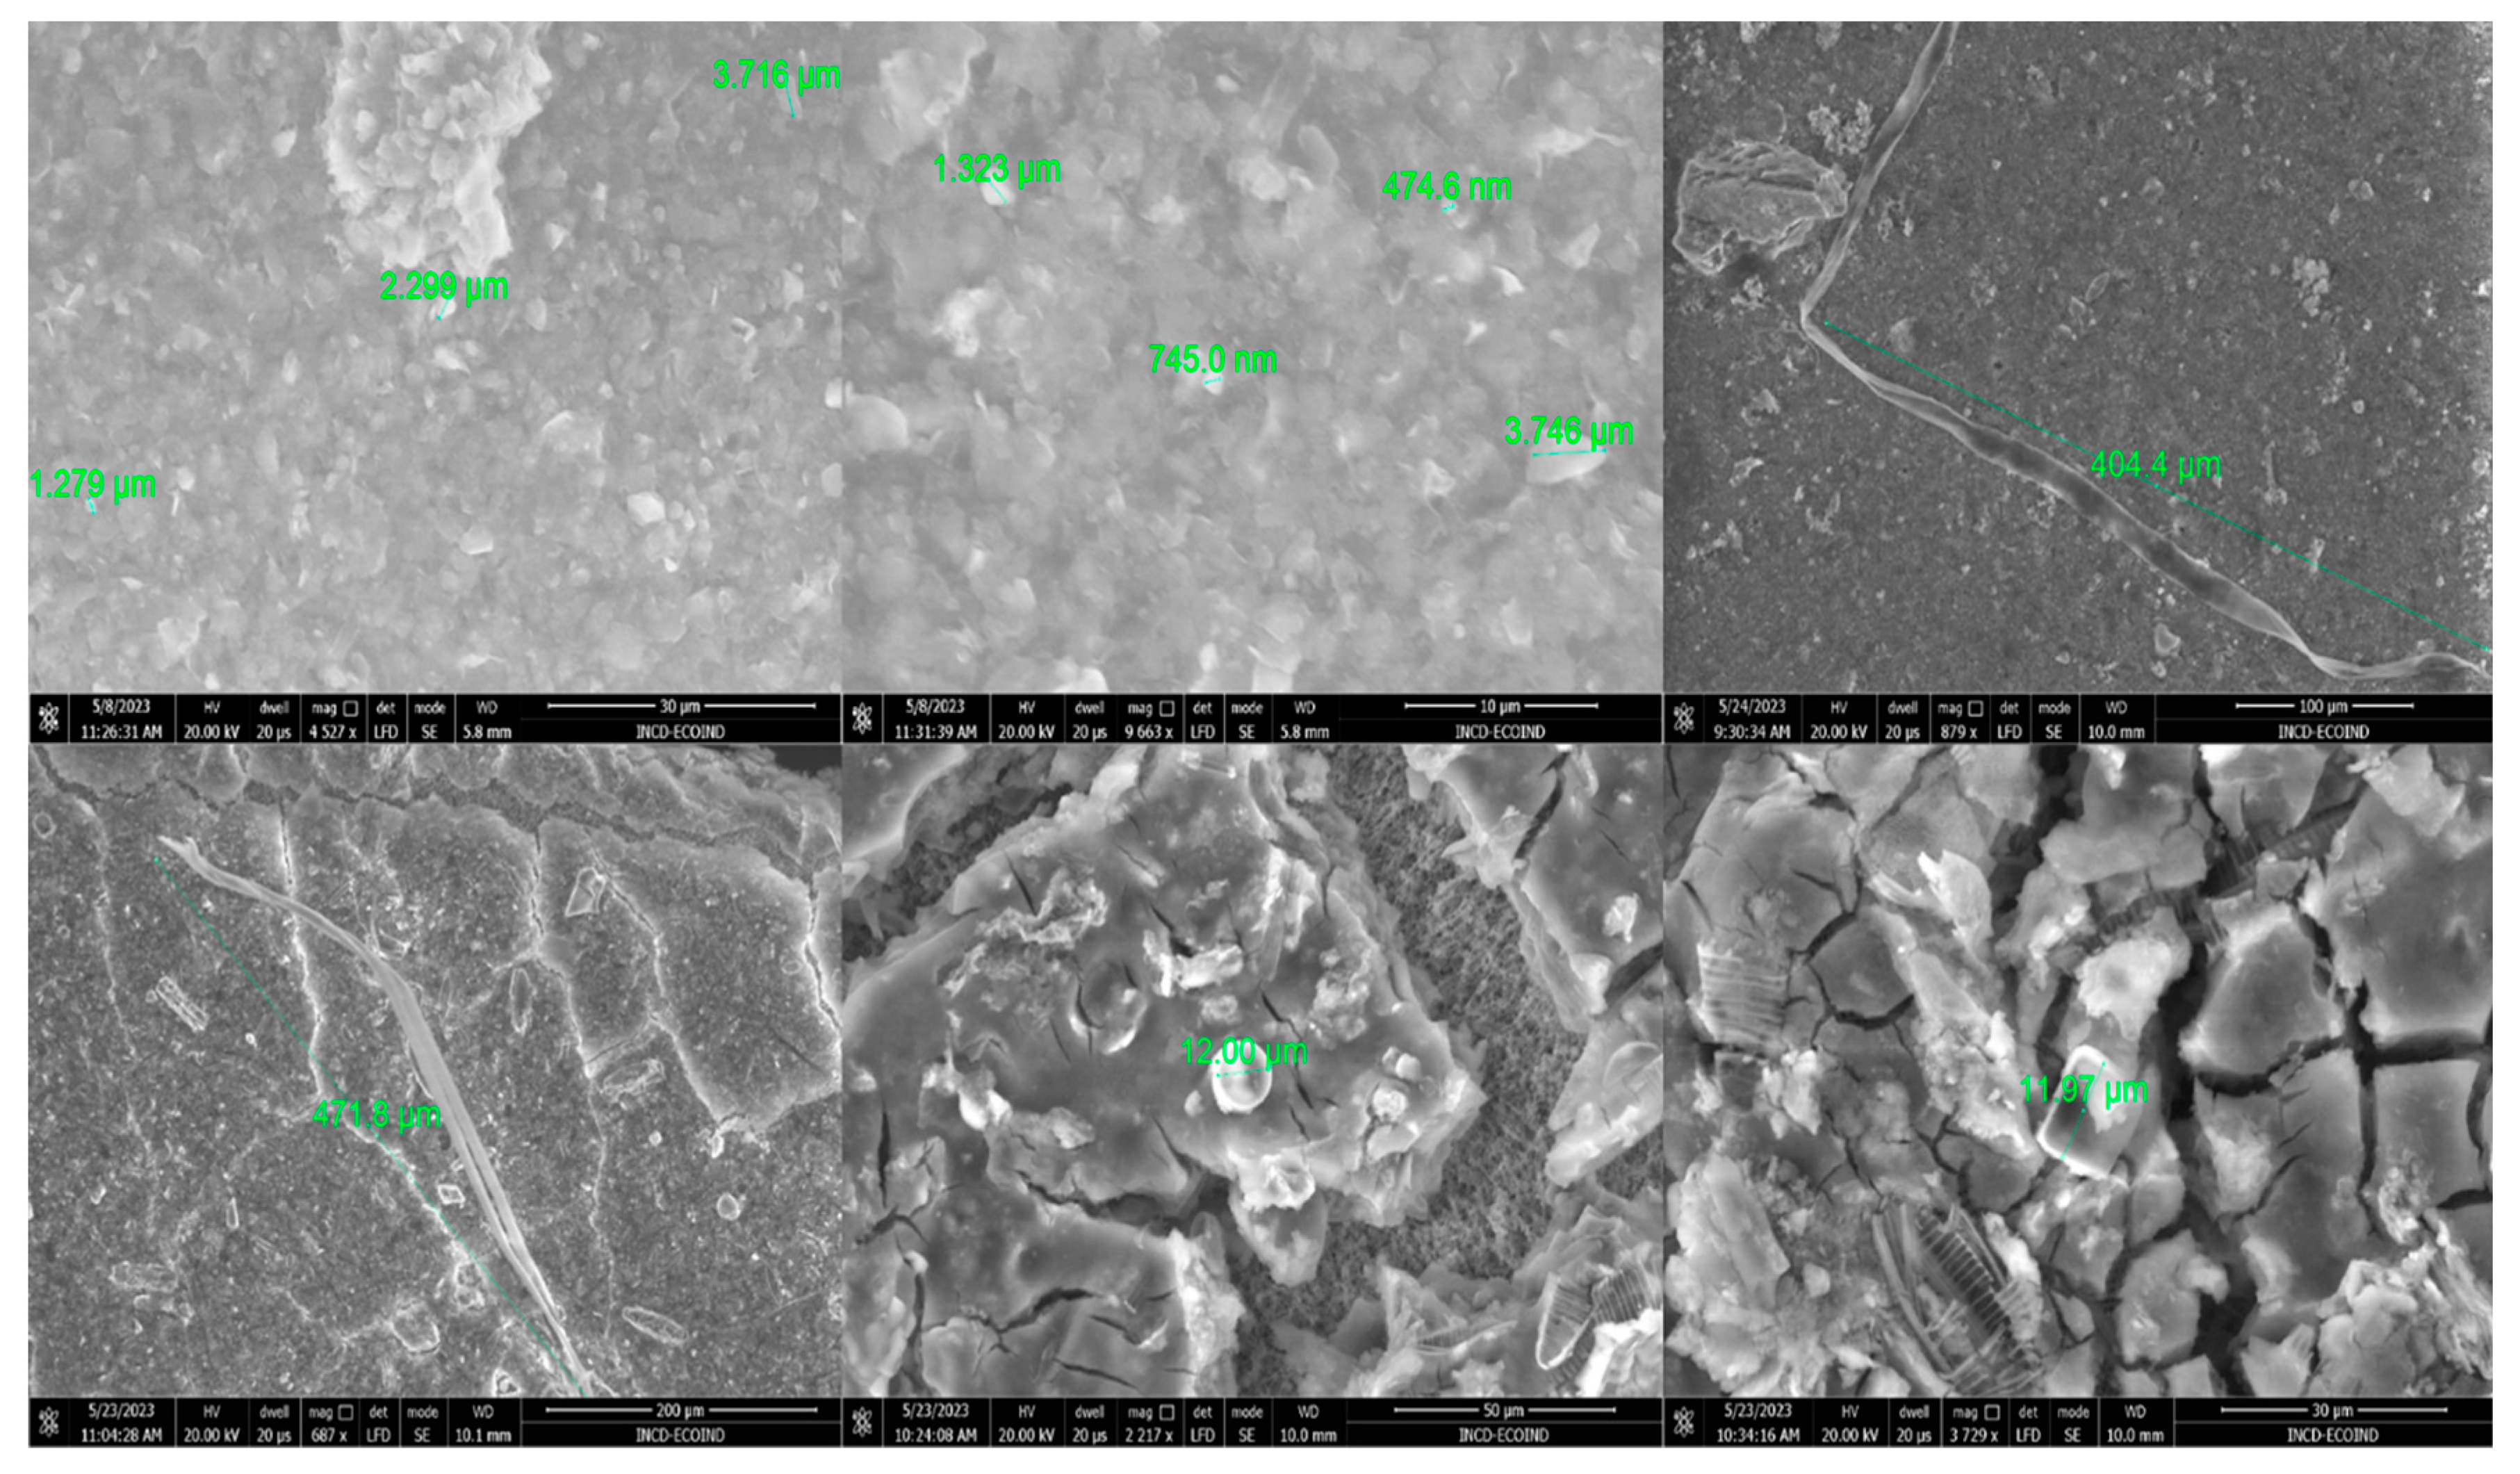
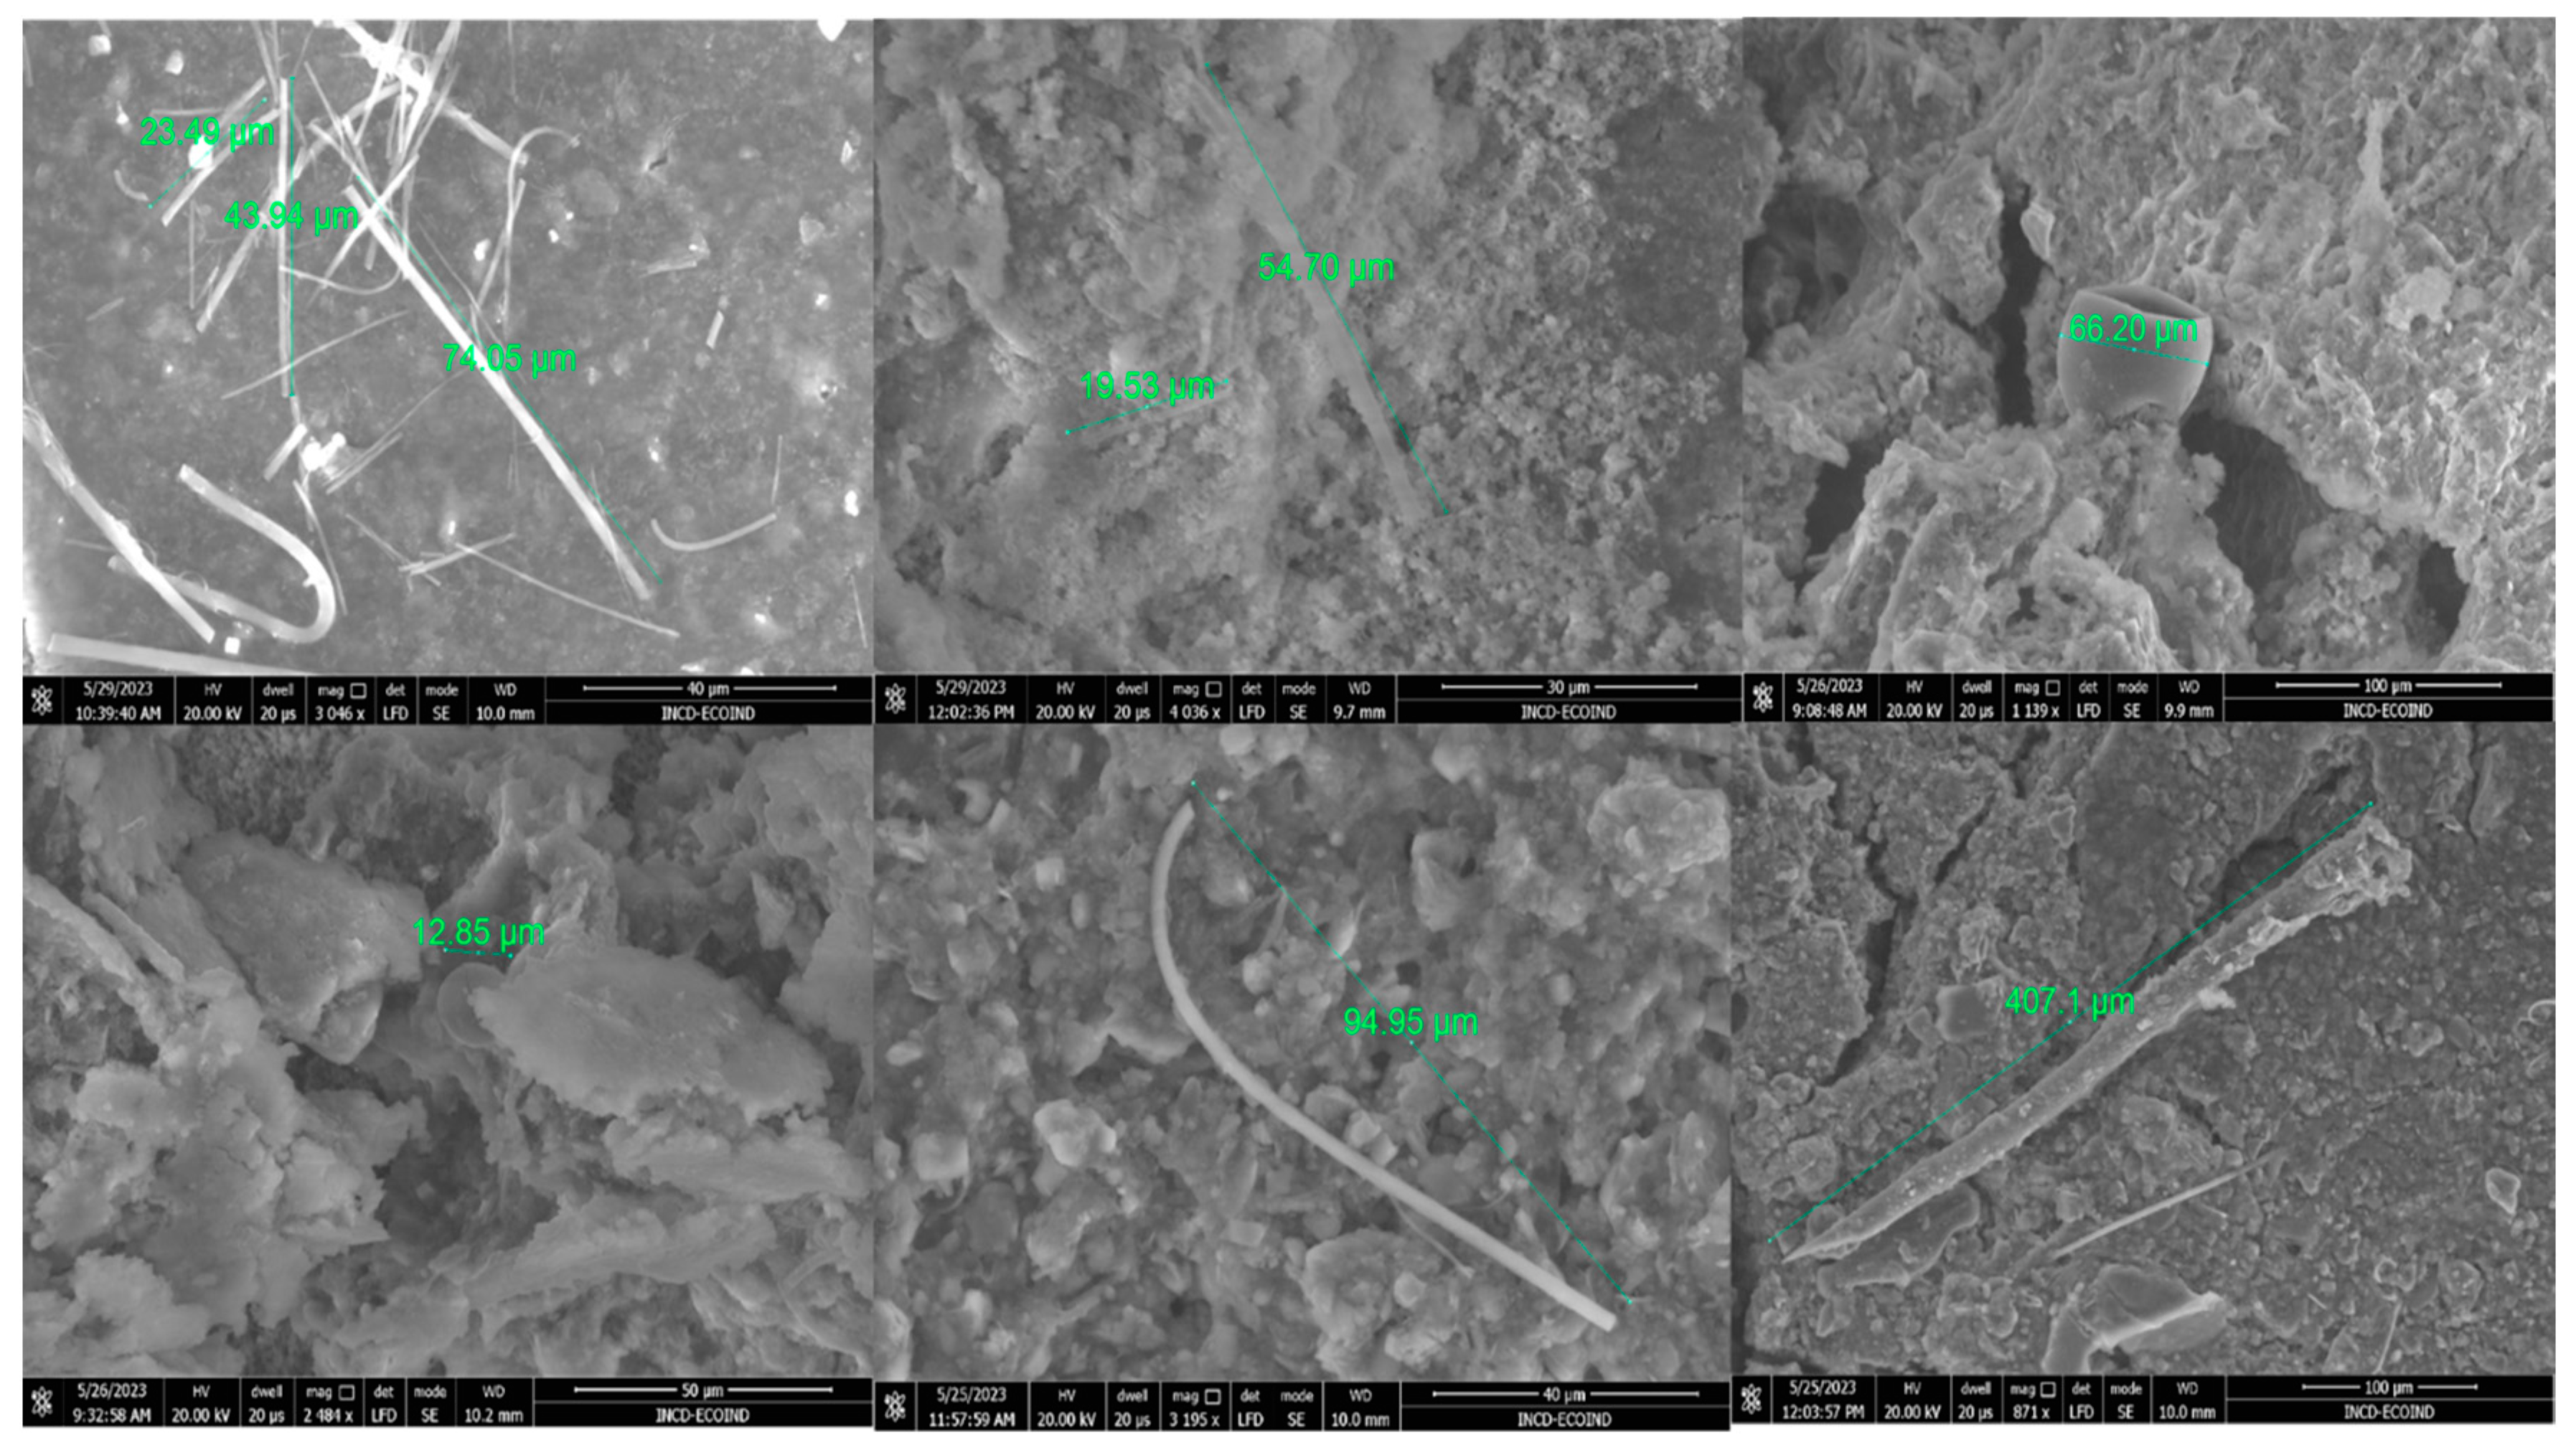
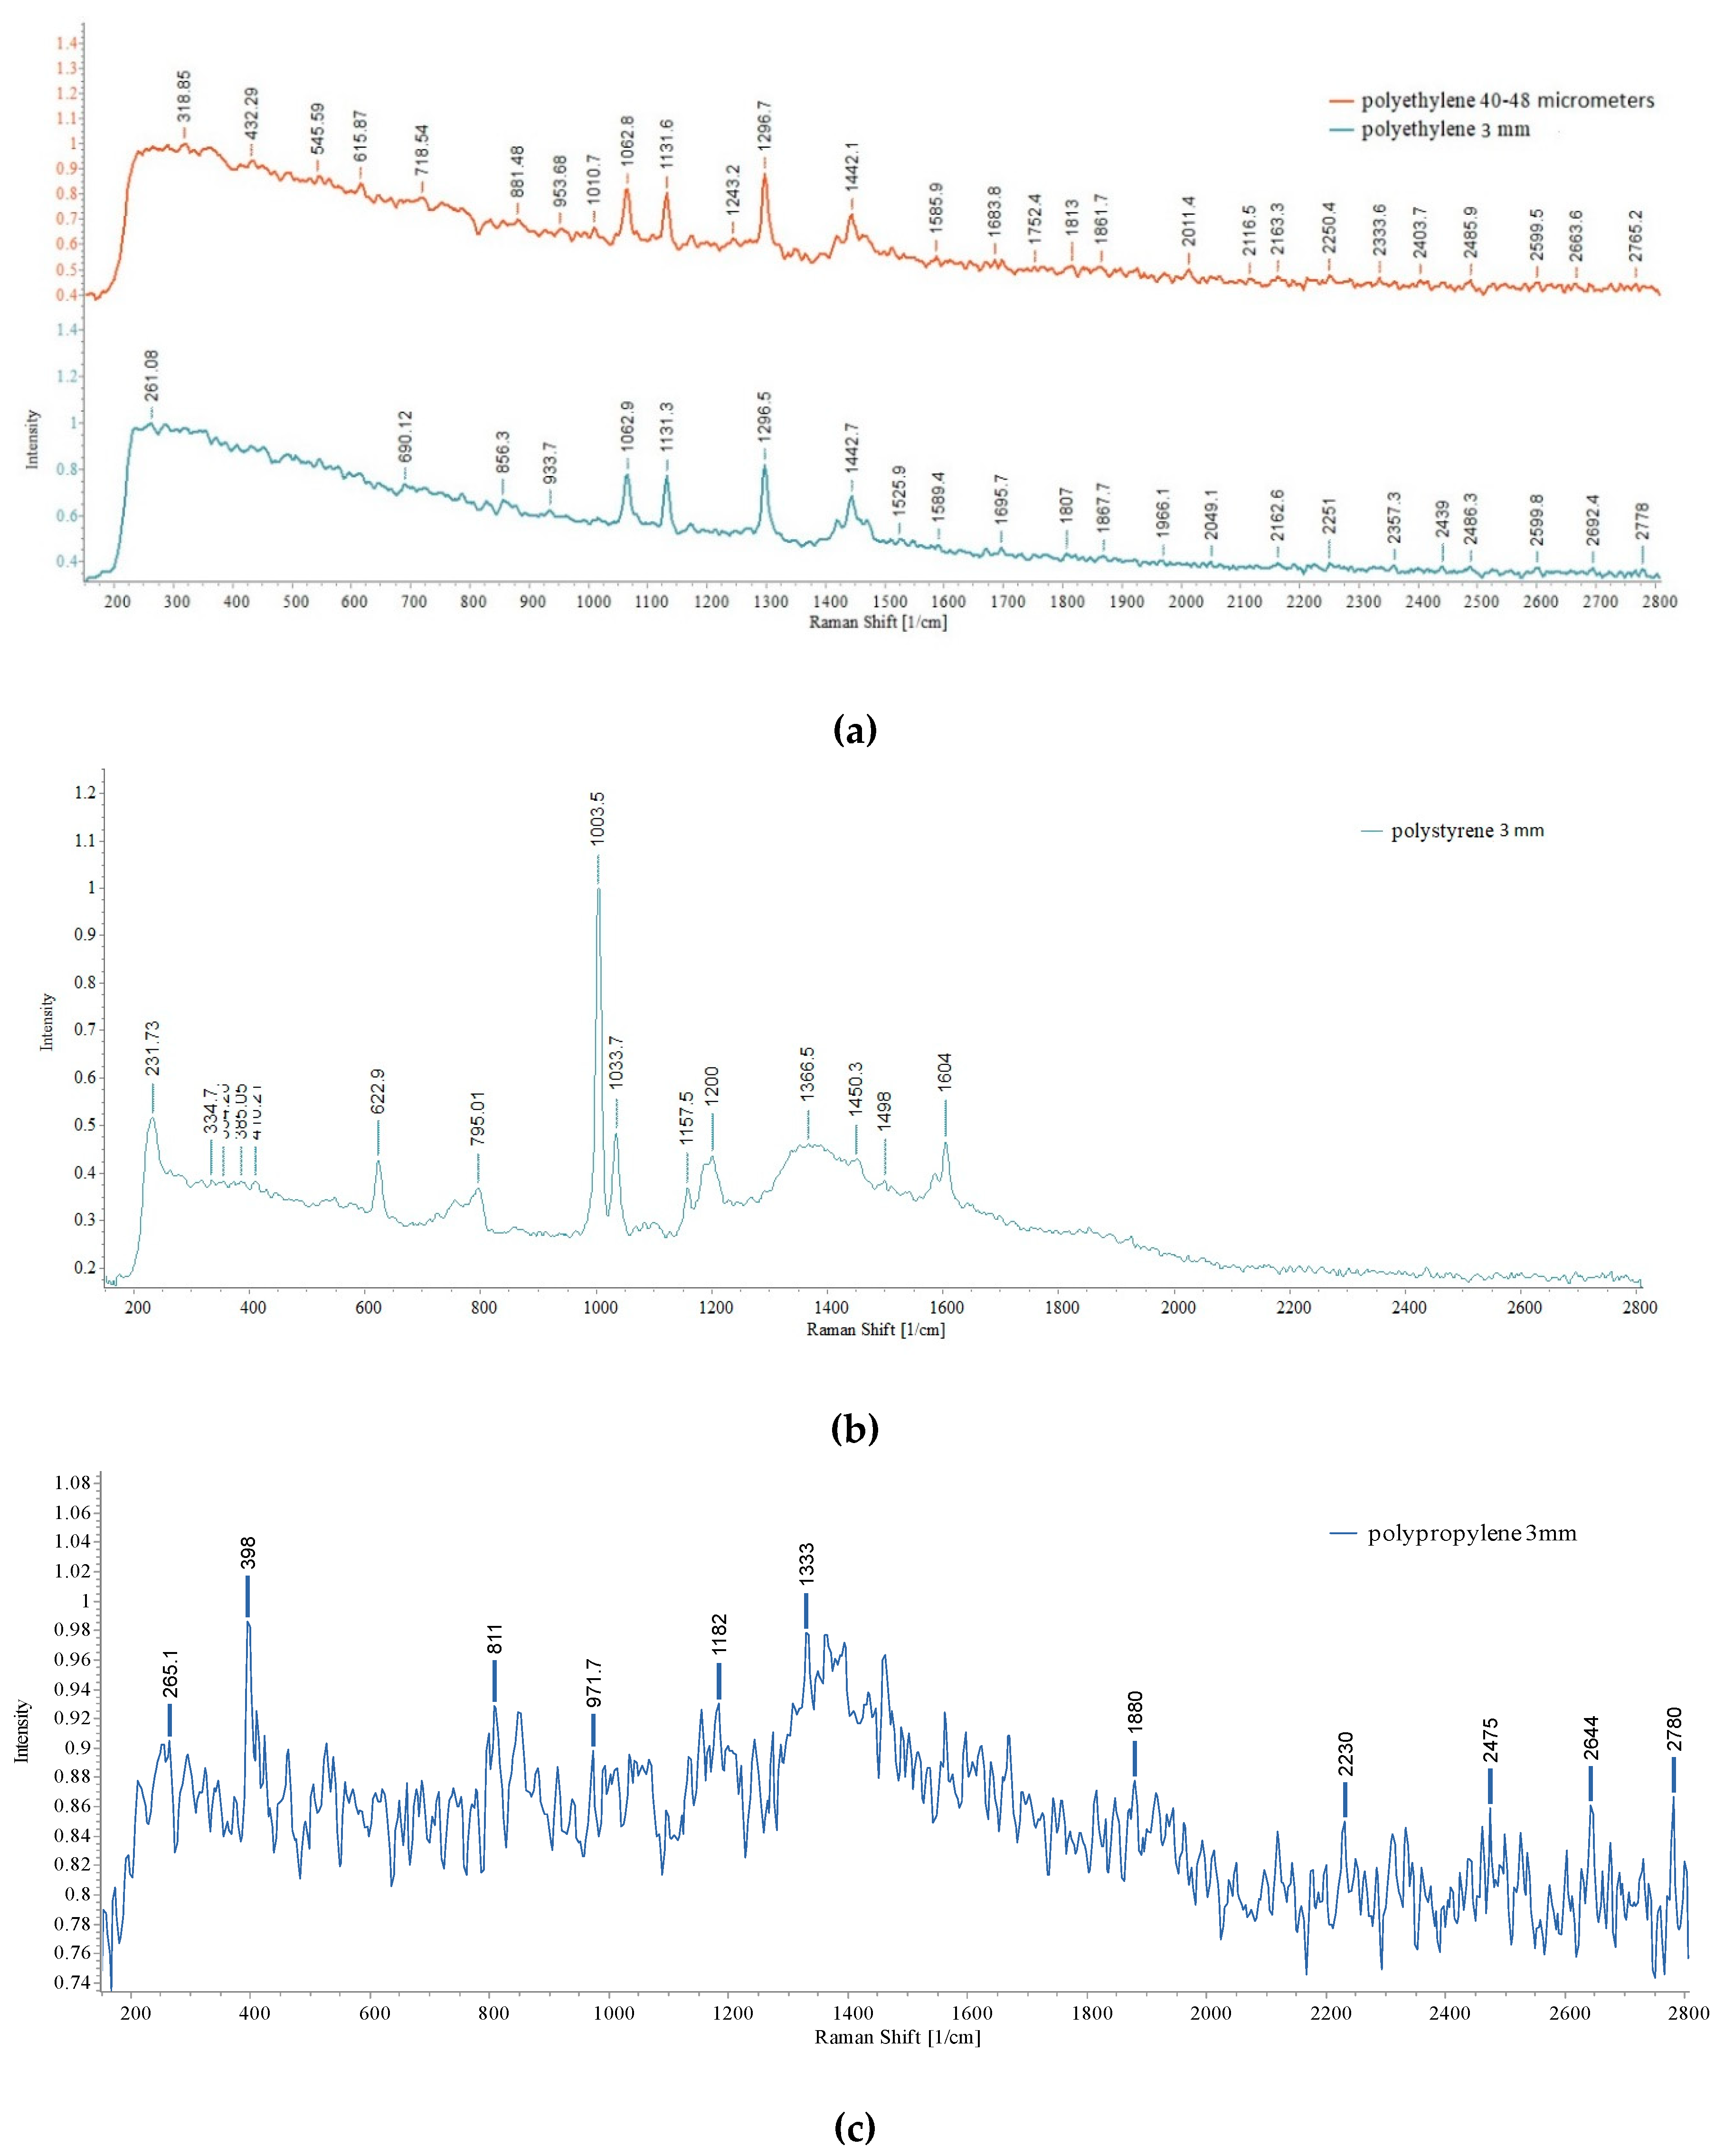

| Sampling point | Type | Dimension | Color | No. total of particles | Classification |
|---|---|---|---|---|---|
|
UP Floresti left bank, low water level, clear water, waste island on the right bank, flow speed approx. = 0.58 m/s |
Fragment | >30 mm | black, green, blue | 5 | Macro |
| Fragment - foil | ≥20 mm | white, green/blue | 2 | Macro | |
| Sphere | <5 mm | red, brown | 2 | Large | |
| Fragment | ~10 mm | white-gray | 1 | Meso | |
| Foam | ~5 mm | yellow | 1 | Large | |
| Polystyrene pieces | >10, 20, 30 mm | white | 3 | Meso / Macro | |
| Non–plastics and other wastes | |||||
| Surgical mask fragment / cellulose | >30 mm | green | 1 | - | |
| Fragments of aluminum packaging | >50 mm | blue | 1 | - | |
| Electronic parts | 20 mm | white | 1 | - | |
| Aluminum plugs | ~20 mm | gray | 2 | - | |
| Textile | >30 mm | 1 | - | ||
| Plastic coated wire | ~ 2, 10, 12cm | gray, white, blue | 3 | - | |
| Construction materials (brick, cement, etc.) |
- | - | abundantly | - | |
|
DW Floresti left bank, under construction, cloudy water flow rate approx. = 0.40 m/s |
Fragment- foil | 10 mm | transparent | 1 | Meso |
| Fragment | 30 mm | transparent | 1 | Meso | |
| Sphere | <5 mm | green | 1 | Large | |
| Polystyrene foam | 5 mm | white | 5 | Large | |
| Foam / sponge | >30 mm | yellow | 1 | Macro | |
| Fragment | >30 mm | blue | 1 | Macro | |
| Plastic toy piece | > 30 mm | red | 1 | Macro | |
| Non–plastics and other wastes | |||||
| Construction materials |
- | - | abundantly | - | |
|
UP Cluj- Napoca WWTP left bank low level, flow rate approx. = 0.64 m/s |
Polystyrene spheres, foam | <5 mm | white | abundantly | Large |
| Pieces of polystyrene | >20 mm | white | abundantly | Meso | |
| Fragment | <5 mm | white | 1 | Large | |
| Fragment | ~3, 5, 10 mm | white | 3 | Large / Meso | |
| Non–plastics and other wastes | |||||
| Cigarette butts | >10 mm | brown | 1 | Meso | |
| Plastic waste from toys and packaging | >10 cm >30 cm |
2 | Macro | ||
| Pet bottles | - | - | 1 | - | |
|
DW Cluj –Napoca WWTP left bank, there is waste on the bank, bags and foils under sediment and stones flow rate approx. = 0.62 m/s |
Fragment | >30 mm | transparent | 1 | Macro |
| Fragment | ~20 mm | black | 1 | Meso | |
| Polystyrene foam spheres | ~5 mm | white | 1 | Large | |
| Pieces of polystyrene | ~5 mm | white | >10 | Large | |
| Non–plastics and other wastes | |||||
| Textile | >30 mm | - | - | - | |
| Construction material | - | - | abundantly | - | |
Disclaimer/Publisher’s Note: The statements, opinions and data contained in all publications are solely those of the individual author(s) and contributor(s) and not of MDPI and/or the editor(s). MDPI and/or the editor(s) disclaim responsibility for any injury to people or property resulting from any ideas, methods, instructions or products referred to in the content. |
© 2023 by the authors. Licensee MDPI, Basel, Switzerland. This article is an open access article distributed under the terms and conditions of the Creative Commons Attribution (CC BY) license (http://creativecommons.org/licenses/by/4.0/).


