
You are currently viewing a beta version of our website. If you spot anything unusual, kindly let us know.
Preprint
Article
Automatic Estimation for Visual Quality Changes of Street Space Via Street-View Images and Multimodal Large Language Models
Altmetrics
Downloads
180
Views
143
Comments
0
A peer-reviewed article of this preprint also exists.


This version is not peer-reviewed
Abstract
Estimating Visual Quality of Street Space (VQoSS) is pivotal for urban design, environmental sustainability, civic engagement, etc. Recent advancements, notably in deep learning, have enabled large-scale analysis. However, traditional deep learning approaches are hampered by extensive data annotation requirements and limited adaptability across diverse VQoSS tasks. Multimodal Large Language Models (MLLMs) have recently demonstrated proficiency in various computer vision tasks, positioning them as promising tools for automated VQoSS assessment. In this paper, we pioneer the application of MLLMs to VQoSS change estimation, with our empirical findings affirming their effectiveness. In addition, we introduce Street Quality GPT (SQ-GPT), a model that distills knowledge from the current most powerful but inaccessible (not free) GPT-4, requiring no human efforts. SQ-GPT approaches GPT-4’s performance and is viable for large-scale VQoSS change estimation. In a case study of Nanjin, we showcase the practicality of SQ-GPT and knowledge distillation pipeline. Our work promises to be a valuable asset for future urban studies research.
Keywords:
Subject: Computer Science and Mathematics - Artificial Intelligence and Machine Learning
1. Introduction
Urban landscapes, encompassing a tapestry of streets, parks, and public squares, are more than mere channels of movement; they are the lifeblood of city vibrancy and communal interaction. Within this urban fabric, the aesthetic, functional, and social dimensions of street spaces emerge as pivotal to public well-being and community cohesion [1]. They are not just static structures but vibrant stages where the urban narrative unfolds over time. The temporal evolution of street spaces is critical to understanding and fostering urban vitality, as they are the sites where the past converses with the present and shapes the future [2]. This recognition has sparked a series of urban design initiatives [3], underscoring the global movement towards enhancing the Visual Quality of Street Space (VQoSS) [4].
The concept of VQoSS is not a contemporary invention. Its origin can be traced back to the advocacy for community-centric urban design in the mid-20th century [5]. Despite their contributions, historical limitations in data collection confined such research to the realm of small-scale studies, impeding the development of empirically grounded urban design principles that could be applied broadly. Urban planners face the complex challenge of estimating VQoSS changes as they endeavor to shape environments that align with human experiences amid the continuous progression of urban development [6].
In an era where technological advancements have revolutionized data accessibility and analytical capabilities, tools like Geographic Information Systems (GIS) for street-view images [7,8], remote sensing technologies [9,10], and deep learning based methods [11,12] present new opportunities for comprehensive urban analysis. They introduce a refined methodology for evaluating the visual quality of street spaces, both in their current state and across temporal shifts, quantifying and analyzing the temporal changes of VQoSS with unprecedented precision. By leveraging image processing and machine learning, we can dissect the physical and perceived visual qualities of urban thoroughfares, even applying our techniques to the storied alleyways of historic districts. People can examine the past, present, and potential futures of urban streets, laying the groundwork for methodologies that blend tradition with innovation in pursuit of urban spaces that are not only functional but also inviting.
Previous works [4,13,14] incorporate the ability of deep learning in computer vision, offering solutions for a variety task of VQoSS. However, current deep learning technologies face several limitations. One of the primary challenges is the inherent difficulty in capturing the subjective elements of aesthetics and social vibrancy that constitute the essence of street quality. Moreover, deep learning models require vast amounts of labeled data to learn effectively [15,16]. The labor-intensive process of gathering and annotating temporal visual data from urban environments can be prohibitive, often resulting in models that may not generalize well across different cities or cultural contexts [17]. Lastly, environmental and seasonal variations, along with the dynamic nature of urban life, introduce a level of complexity that deep learning models, with their need for stable and consistent patterns, struggle to accommodate. It seems that only using vision-related technology can not satisfy the real-world demands of VQoSS tasks [18]. This leads to a question: Can we design a method that can efficiently and accurately realize the large-scale VQoSS change estimation tasks without any manual annotation?
Recently, Large Language Models (LLMs) [19,20] have shown their power in a variety of complex language understanding and generation tasks, fundamentally altering the landscape of natural language processing. These models, trained on expansive corpora of text, excel at grasping the nuances of human language, from writing and summarizing articles to generating coherent and contextually relevant text. This ability has been further extended to Multimodal Large Language Models (MLLMs) [21], achieving outstanding accomplishments. Models like GPT-4 [22] can now not only understand and generate text but also interpret and analyze visual data. This integration of vision and language processing enables them to provide answers to questions about the content of images, effectively bridging the gap between visual perception and linguistic expression [23,24]. By processing and understanding complex visual scenes, these models can identify objects, recognize patterns, and even infer emotions or actions depicted in images [24,25,26]. We can directly use them for the purpose of VQoSS estimation. Although GPT-4 is powerful, using its API is expensive [27], and its structure is still unknown, which makes it impossible for large-scale VQoSS change estimation.
In this study, we investigate the potential for automating the estimation of VQoSS changes using street-view imagery and MLLMs. Our analysis is centered on the urban center of Nanjing, China. We collected a dataset of 10,598 data points along main thoroughfares, capturing images from four cardinal directions (0°, 90°, 180°, and 270°) at each location for two different periods. We also set 9 different VQoSS change evaluation tasks to quantify the performance of MLLMs. Our findings indicate that models such as GPT-4 exhibit remarkable proficiency in discerning temporal street variations for VQoSS evaluation. Moreover, as GPT-4 is not free in use, in order to reduce the cost for large-scale estimation, we introduce the Street Quality GPT (SQ-GPT) for VQoSS change estimation, which can efficiently distill [28,29] GPT-4’s knowledge. Through rigorous experimentation, we demonstrate that the performance of SQ-GPT is close to GPT-4, validating its utility as a cost-effective instrument for large-scale urban street quality surveillance.
We summarized our contributions as follows: (1) Our study pioneers the integration of MLLMs into the automation process for estimating changes in the VQoSS, offering a significant tool for urban research advancements. (2) We have identified 9 critical VQoSS tasks and have rigorously evaluated the effectiveness of MLLMs through both quantitative measures and qualitative analysis. (3) We introduce SQ-GPT, an innovative model that demonstrates performance on par with GPT-4, providing an alternative for large-scale VQoSS estimation tasks.
2. Related Works
2.1. Visual Quality of Street Space
The requirements to quantify the VQoSS changes in urban spaces date back to the latter half of the 20th century. Pioneering works [5] emphasized the importance of street life and social interactions in urban spaces. They underscored the need for empirical studies to connect physical appearance with social attributes. Early efforts were largely qualitative due to the challenges of quantitative data collection over large areas [30].
In the end of last century, there seems to be a shift towards more systematic methodologies for assessing the visual quality of street spaces [31,32]. Researchers began employing a mix of subjective assessments, systematic observations, and technological advancements such as GIS [33] for more objective measurements. Studies offered structured approaches to evaluate the physical and perceptual dimensions of urban spaces. Recent years have marked the introduction of advanced technologies into the realm of urban space assessment. The utilization of Street View Imagery (SVI) [7,34,35] and deep learning algorithms [4,13,14,36], for instance, has allowed for large-scale quantitative analyses [37]. This integration has propelled the field from qualitative descriptions to data-driven, automated evaluations, as evidenced in works [38] that leveraged SVI for extensive urban analysis [39].
Tang and Long [4] built upon this progression by offering a comprehensive methodology that combines physical and perceived evaluations of visual quality using machine learning (SegNet [40]), GIS analysis, and systematic user-based assessments. Their work stands at the intersection of urban planning, computer science, and psychology, showcasing a multifaceted approach to understanding the temporal dynamics of street space quality in historical areas like Beijing’s Hutongs. The current trajectory of research suggests a continuous refinement of methodologies with an increasing emphasis on integrating user perceptions and technological sophistication [1,7]. Upcoming studies will likely focus on enhancing the objectivity in measuring visual quality [41,42], fine-tuning algorithmic approaches [43], and incorporating real-time data to capture the ever-evolving nature of urban spaces [44]. This evolution reflects a broader trend in urban planning towards smart, data-informed decision-making that prioritizes both the physical attributes and the experiential qualities of urban environments. Although previous studies have achieved promising results, large-scale estimation of VQoSS changes is still labor-intensive. Especially methods based on deep learning, their accuracy requires a large amount of data annotation.
2.2. Multimodal Large Language Models
In recent years, the field of multimodal learning [21,45] has experienced rapid development, with researchers striving to construct artificial intelligence models capable of comprehending and generating multiple types of data, including text, images, videos, and more. In this section, we provide a concise overview of the relevant literature that informs our work.
To empower LLMs with the ability to interpret images and engage in user interactions based on visual inputs, a multitude of methods have emerged. These methods aim to establish connections between frozen visual encoders and LLMs while keeping the number of trainable parameters minimal. Prominent approaches in this category encompass BLIP-2 [23], InstructBLIP [46], LLaMA-Adapter [47], LLaMA-Adapter V2 [48], LLaVA [25], MiniGPT-4 [26], MultiModal-GPT [49], and PandaGPT [50]. These models introduce additional trainable parameters between the frozen image encoder (or multimodal encoder in the case of PandaGPT) and the LLMs. For instance, BLIP-2 [23] utilizes a lightweight Transformer (Q-Former) as a bridge between the image encoder and the LLMs. LLaMA-Adapter and LLaMA-Adapter V2 introduce adaptation prompts that are pre-added to higher converter layer inputs, along with new teaching cues injected into LLaMA via a zero-gated zero-initial attention mechanism. MultiModal-GPT leverages low-rank adapters (LoRA) [51] for efficient fine-tuning of OpenFlamingo [52]. MiniGPT-4 and LLaVA simply add Linear layers between the frozen visual encoder and frozen LLMs.
A critical objective in developing LLMs is to ensure that they produce coherent and extended natural language responses, enabling more human-like conversations. Multimodal instruction tuning [53] is a widely adopted technique in this regard. LLaVA [25] is the first attempt to use pure language GPT-4 [22] to generate multimodal language-image instructions following data. They are based on the captions and bounding boxes on the COCO dataset [54]. InstructBLIP [46] and MultiModal GPT [49] also proposed to match the corresponding image descriptions to create instruction fine-tuning data. Using these data, LLMs are trained, resulting in a significant improvement in dialogue performance. However, LLaMA-Adapter v2 [47] and MiniGPT4 [26] only use ready-made image captioning datasets for multimodal instruction tuning, potentially resulting in relatively weak image understanding capabilities. Therefore, it is crucial to curate diverse datasets that cover various tasks and scenarios, providing rich contextual information to support the model in deep reasoning. If the examples in the dataset are too single or simple, the model may learn to produce short and uninformative responses. In summary, high-quality instruction following data is pivotal for enabling effective conversations [53,55].
MLLMs have demonstrated a formidable capacity in bridging various modes of human communication and understanding. These models are adept at processing multiple data types, paving the way for innovative applications across diverse fields. This is particularly evident in tasks involving the VQoSS, where the application of MLLMs is especially critical. The visual quality of street spaces not only impacts the quality of life for residents but is also intricately linked to urban planning and sustainable development. Traditionally, assessing the visual quality of street spaces relies on manual annotations and subjective evaluations, a process that is both time-consuming and inefficient. Against this backdrop, the introduction of MLLMs, such as GPT-4 [22], to automate the assessment of street space visual quality is revolutionary. Firstly, by analyzing street view images from different time periods, MLLMs can identify and track urban features that change over time, offering insights into the evolving visual quality of street spaces. Secondly, MLLMs are capable of processing and integrating data from various sources, such as GIS data, social media inputs, and urban planning records, to provide a more comprehensive assessment of street space visual quality. Additionally, the integration of MLLMs helps to overcome the limitations of subjective evaluations, yielding more objective and consistent assessment results.
Currently, GPT-4 stands as one of the most powerful MLLMs, albeit accessible only through its official API and associated with high costs in large-scale applications. Therefore, we have introduced the SQ-GPT model, which achieves near GPT-4 performance through efficient knowledge distillation. The development of SQ-GPT not only signifies wider accessibility and reduced costs but also represents a more effective use of advanced MLLMs technology in the VQoSS domain. It supports urban planning and community development with data-driven insights, ushering in a new chapter for sustainable urban development.
3. Data and Method
3.1. Data
3.1.1. Data Collection
Our dataset is acquired from Baidu Street View and encompasses a total of 10,598 data points from the center of Nanjing, Gulou district, with each point paired with corresponding geographical coordinates. Figure 1 depicts our study area, the Gulou District of Nanjing. The Gulou District of Nanjing is a vital administrative region situated in the center of Nanjing City, Jiangsu Province. It covers an area of approximately 56.57 square kilometers and has a permanent resident population of about 940,400. Geographically, the district is bordered by the Yangtze River to the north, Qinhuai River to the south, Qinhuai and Pukou districts to the east, Xuanwu and Jianye districts to the south, and is adjacent to Yuhuatai District to the west and Qixia District to the north. As the core area of the city, Gulou District boasts a wealth of historical and cultural heritage, such as the Drum Tower and the Confucius Temple, and serves as Nanjing’s center for commerce, culture, and tourism, with multiple commercial districts and cultural institutions. It offers convenient transportation with several subway lines and major roads running through it. In terms of education, the district houses numerous universities and research institutions, making it one of the most concentrated areas of scientific and technological resources in China. The Gulou District also enjoys Nanjing’s 11-kilometer prime Yangtze River coastline, features diverse terrain, and has a distinct four-season climate, marking it as a region with a long history and profound cultural heritage.
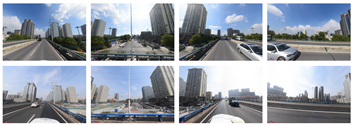
This dataset captures images from two different periods: the previous period, denoted as p, is from September 2017, and the latter period, denoted as l, is from September 2020. In both periods, we collected four images per data point, corresponding to the four cardinal directions (0°, 90°, 180°, and 270°). Therefore, we refer to our dataset as , and an individual image within this dataset is represented by , where d stands for the direction, i is the data point index, and s indicates the time period (either p or l). We show a sample of our collection in Figure 2.
To progress with our method and evaluation pipeline, we randomly selected approximately 10% (1,060) of the data points from our dataset to distill knowledge via GPT-4. We denote these split data as . For the purpose of user evaluation, we further randomly chose 200 data points from the remaining dataset to quantify and compare the performance between GPT-4 and our developed model, SQ-GPT.
3.1.2. Estimation Settings
In Figure 3, it can be observed that our pipeline comprises 4 distinct categories, encompassing a total of 9 individual tasks () designed for estimating VQoSS changes. These tasks serve as pivotal criteria for quantifying these changes, providing a comprehensive assessment. For each task, we set three levels of evaluation results: A: Positive Changes, B: Negative Changes, and C: No Changes. Our definitions for these tasks draw inspiration from the work of [4] (some samples are showing in Figure 4), and we elaborate on their specific definitions as follows (we make a concise definition so that models can use them as prompt efficiently during questioning):
Task A: Facade Color. In this task, the focus is on assessing the color schemes used on building facades along a street. It involves evaluating the aesthetic and visual appeal of the colors employed and considering any changes or improvements to enhance the overall quality of the street space.
Task B: Facade Material or Decoration. Task B revolves around evaluating and potentially modifying the materials or decorative elements used in building facades within the street environment. The aim is to enhance the visual and tactile qualities of facades, potentially by introducing new materials or decorations that contribute to the overall street space quality.
Task C: Road Damage. This task refers to any defects or deterioration in the street surface, such as potholes, cracks, rutting, weathering, surface defects, and debris, which impair both the functionality and the appearance of the roadway.
Task D: Lane Refinement. Task G involves assessing and refining the layout and design of lanes within the street. This may include modifications to lane width, markings, or traffic flow to enhance safety, traffic management, and overall street quality.
Task E: Signboards. In this task, the emphasis is on evaluating and optimizing the presence and design of signboards within the street space. This may involve assessing the placement, size, and aesthetics of signboards to improve the overall quality and functionality of the street.
Task F: Surrounding greenery and Facilities Construction. In Task I, the scope extends beyond the street itself to encompass the construction and improvement of greenery and facilities in the surrounding area. This can include parks, plazas, or other amenities that contribute to the quality and attractiveness of the street space and its immediate surroundings.
Task G: Parking Improvement. Task E focuses on evaluating and implementing improvements to parking facilities within the street area. This includes considerations for parking space design, accessibility, and any enhancements that can contribute to the overall quality of the street space.
Task H: Street Furniture Increases. In Task F, the objective is to check the quantity and quality of street furniture. This may involve adding benches, lighting fixtures, waste bins, or other elements that improve the comfort and usability of the street space.
Task I: Greenery Improvement. Task H focuses on evaluating and enhancing the presence of greenery, such as trees, shrubs, or plantings, within the street environment. The goal is to improve aesthetics, air quality, and the overall ambiance of the street.
Each of these tasks is associated with a distinctive question that necessitates a MLLM to provide an answer. Our objective is for the MLLM to effectively discern the differences between images captured during two periods p and l. The question format for each task adheres to the following structure:
where D is the description of input images as "The first four images are street view images taken from four different directions of the street. The last four images are taken from the same location and the same four directions but at a different period." T is the task defined above and C is a multiple choice question as "and finally you must give me a choice from: A: Positive B: Negative, C: No Changes. Make your statement concise". We also demonstrate a sample of question and answer in Table 1.
3.2. Overview of Our Pipeline
The architecture of our pipeline is illustrated in Figure 5. Initially, we distill knowledge from GPT-4 by inputting street-view images from a data point along with corresponding prompts and questions to elicit high-quality answers. This procedure is applied across all 1,060 split data points, generating a new dataset to fine-tune our own model. SQ-GPT comprises a frozen image encoder, a frozen QFormer [23] for image-to-text alignment, a Linear plus Reduction stage for additional refinement, and a frozen LLMs framework for the final answer output. The fine-tuning process is informed by insights drawn from GPT-4, ensuring that the output of SQ-GPT is improved by the distilled knowledge. We provide a detailed description of each component in the subsequent sections.
3.3. Knowledge Distillation From GPT-4
We utilize the GPT-4 API for distillation processes to generate a new dataset for the fine-tuning of our model. Table 1 presents a sample that illustrates the generation pipeline. It can be observed that GPT-4 can describe the details of input images and compare two periods from multiple aspects.
We sequentially feed GPT-4 four images from a data point’s period p, aligned at 0°, 90°, 180°, and 270°. This is followed by four images from period l in the same input order. Subsequently, for a given task, the pertinent question formulated in Equation 1 is inputted (Note that we also set the definition of the corresponding task as the input prompt). To augment the dataset with a diverse set of question-answer pairs, we adjust the temperature to 0.1 and perform iterations of answer generation, ensuring consistency in the choices for a particular data point in a certain task. We employ GPT-4 configured with an 8k token context length. The pricing structure is as follows: $ 0.03 per 1K tokens for input and $ 0.06 per 1K tokens for output. Our calculations indicate that generating a single question-answer pair costs approximately $ 0.07. This cost becomes prohibitive for large-scale operations, underlining the importance and economic value of our research.
For a better understanding, we formulated the generation of new data set as:
where ∮ stands the input images in order for period and direction of a data point, ∫ is the repeat generation for k times, I is the data point number in split , represent all images for a data point, and t is the index for all tasks T.
contains 47,700 data triads, each consisting of image sequences, corresponding questions, and high quality answers. This rich dataset will be instrumental in the fine-tuning process of our model, SQ-GPT. The fine-tuning will be executed with a specific focus on improving the model’s ability to understand and generate contextually relevant responses based on sequential visual inputs, to achieve knowledge distillation of GPT-4.
3.4. SQ-GPT
As depicted in Figure 5’s lower branch, our SQ-GPT is trained in an end-to-end manner. To commence this process, we employ a frozen image encoder , which extracts image features from all images , corresponding to a given data point i. This process can be succinctly described as follows:
where h and w represent the spatial dimensions of the image features obtained after encoding, while c stands for the feature dimension. During this stage, we independently process the previous four images and the later four images. We stack them in the same period order and direction order as outlined in the GPT-4 distillation 3.3.
Next, we leverage a frozen QFormer architecture (shown in Figure 6), as introduced [23], to facilitate image-text alignment. The choice of QFormer is crucial in our approach, as it excels in capturing intricate dependencies between textual and visual information, enabling us to establish a more robust and meaningful connection between the two modalities. This alignment step is fundamental to the overall effectiveness of our method, as it forms the basis for subsequent fusion and comprehension of image and text data. Except the learned queries in the original QFormer, we add a set of learnable queries for better ability of alignment of image and text. Thus, the calculation of QFormer is as follows:
where each image feature of serves as K and V in cross-attention [56]. is a trainable simple one-layer Fully Connection (FC) layer that can further adjust the output features from QFormer.
After the process of image-text alignment, we further reduce the volume of each image and concatenate them as a visual token entirety as follows:
where the reduction operation takes the form of a convolution layer with stride of 2, which effectively reduces the dimensions of the features to one-fourth of their original size. The concatenation of all images is represented as , and the resulting total number of visual tokens is denoted as z. The inclusion of the reduction step serves a critical purpose: it shortens the length of visual tokens, mitigating the potential adverse effects of overly long visual tokens on the computations of a frozen LLM. The importance of this reduction step has been substantiated in a prior study [24].
Next we concatenate the visual tokens (as prefix) with text tokens encoded from question corresponding to a certain task. Then, a frozen LLM will take then as input and generate the answer. It can be formulated as follows:
The output answer of will calculate loss with one of the high quality answer . Through this knowledge distillation training, our SQ-GPT can achieve performance levels close to those of GPT-4.
4. Results
4.1. Experimental Settings
Our training pipeline is adapted from LLaVA-1.5 13B [25], with modifications that involve freezing both its image encoder and its LLM components. Additionally, we incorporate a pre-trained QFormer, sourced from BLIP-V2 [23], to enhance the capabilities of our model in handling image-text tasks. We also adopt instruction tuning as LLaMA-Adapter v2 [47] and MiniGPT4 [26] during training. Only ready-made image captioning in is utilized, and no extra tuning data [25] is needed for annotation. We train all 9 tasks together to enhance the generalization of the model. The training is completed within 1 day on a GPU server with 4 Nvidia A40.
To evaluate the performance of our SQ-GPT model and benchmark it against other models, we refer to Section 4.2 where a human-centric evaluation was conducted on 200 data points as mentioned in 3.1.1. We utilized LLaVA-1.5, SQ-GPT, and GPT-4 to generate answers for all nine tasks, employing the corresponding questions. During this process, we set the generation temperature to 0 to ensure precise and deterministic outputs. We enlisted three distinct groups of evaluators—50 laypeople, 30 architecture students, and 10 urban environment experts—to assess the quality of responses from all three models. Evaluators were instructed to cast a binary vote on whether the generated answers accurately addressed the task as defined in 3.1.2. Consequently, we define our metric of agreement based on these binary votes as follows:
where g is the group, m is the model, is the number of person in a group, and O is the number of generate answer for a certain model and task.
In Section 4.3, we also provide the visual analysis by mapping the answer results of all data point to the city map. We generate answers using SQ-GPT for all 9 tasks. The answer of A: Positive, B: Negative, and C: No Changes are translated to the value of 1, 2, and 3.
4.2. Answer Quality Analysis
As shown in Figure 7, we analyze the result for human-centric evaluation in all 9 tasks. The data compares the agreement with three models: LLaVA-1.5, SQ-GPT, and GPT-4. Across all tasks, GPT-4 consistently gains the highest agreement rates from all respondent groups, indicative of its superior performance or alignment with human judgment. Our SQ-GPT also has a performance very close to GPT-4, which verifies the effect of our knowledge distillation. In addition, laypeople demonstrate the highest levels of agreement with the models, suggesting AI outputs are more in tune with their evaluations. Conversely, experts consistently show the lowest agreement rates, which may reflect a disparity in understanding or knowledge relative to the models and other groups. LLaVA-1.5 is consistently the model with the lowest agreement rates among all respondents, hinting at it being the least accurate or aligned with human judgment. This pattern suggests that advancements in AI, as seen with GPT-4, although not perfect, are increasingly recognized by common sense.
Among all tasks, A and B seem to be difficult. Experts give a low agreement even for the most powerful GPT-4. We find the most possible reason is the brightness difference when capturing images from two periods. This difference may affect the analysis of models as they can capture the color changes without discriminating the condition of weather. Models perform well in tasks like C ("Road Damage"), G ("Parking Improvement"), and I ("Greenery Improvement"). These tasks pay more attention to some obvious visual forms and layout features, which are what deep models are good at. In general, MLLMs can complete most VQoSS tasks well and is a good means to implement urban analysis. In particular, our SQ-GPT has obtained matching performance after distilling the knowledge of GPT-4, and can be used as a tool for large-scale evaluation.
We also offer some samples of answer comparison between LLaVA-1.5, SQ-GPT, and GPT-4. However, due to the length restriction, only two samples for discriminating changes of "Road Refinement" and "Greenery Improvement" are provided in this manuscript. Referencing Table 2, we tasked the models with interpreting "Road Refinement" based on images from varying periods. The later-period images visibly display faded road markings and numerous repair patches. All models unanimously indicated deterioration with option B: Negative. GPT-4 observed "The roads show signs of heavier use," which corroborates our visual assessment. Interestingly, SQ-GPT’s analysis parallels GPT-4’s but goes a step further by considering the condition of traffic signs, stating, "Despite a consistent presence of traffic signs, the overall impression hints at a deterioration in the road’s organization." This suggests SQ-GPT’s nuanced attention to detail. LLaVA-1.5, while also noting a negative change, linked it to an uptick in transportation in the later period—an associative leap that, although not incorrect, strays from the task definition provided in 3.1.2. Such findings not only demonstrate each model’s unique approach to the analysis of visual changes but also underscore the variability in interpreting contextual information, offering valuable insights into the current capabilities and limitations of MLLMs-based image interpretation.
Referencing Table 3, we tasked the models with interpreting "Greenery Improvement" based on images from varying periods. The first set of images is taken on a sunny day, while the later set are take from the day with clouds. At first glance, there seems to be no obvious greenery improvement changes exist between images from two periods. LLaVA-1.5 analyse two periods in a very fairly good way and give an answer as C: No Changes. However, GPT-4 and our SQ-GPT give the answer as Positive changes. They all concern about "the later images, the trees appear more mature and fuller, indicating growth and increased leaf density, which contributes to a lusher streetscape". When we look closely at these two periods, we can find that the trees in the latter period are indeed more vigorous and the green of the bushes is more obvious. This shows that GPT-4’s attention is more detailed, and our model distills the knowledge of GPT-4 and obtains similar capabilities.
4.3. Visualization of VQoSS Estimation
Our analysis of tasks B, C, and E reveals a persistent blue tone, suggesting that these tasks of urban development have remained relatively stable over the past three years. While stability might imply effective management in these areas, it could also signal a lack of innovation or improvement that warrants further investigation. Task G’s "Parking Improvement" stands in stark contrast with a striking red spectrum dominating the visual data. This is a clear indicator of escalating urban congestion, primarily due to a surge in vehicle ownership. The density of parked cars has outpaced the availability of parking spaces, highlighting a critical area for urban policy intervention. The city must consider implementing multifaceted solutions, such as expanding public transportation, increasing parking infrastructure, and encouraging carpooling to alleviate parking pressures.
The evaluation of Task A presents an intricate scenario, with a balanced mix of colors denoting a complex and uncertain outcome. This color distribution suggests that the strategies employed are not yielding clear results. The task’s low agreement, referenced in Figure 7, corroborates the ineffectiveness of current efforts. This warrants a reevaluation of the task’s goals and methods to better serve the city’s interests. Other tasks reflected by green shades indicate positive strides in the city’s Visual Quality of Service Standards. These improvements are promising, demonstrating successful initiatives that enhance the city’s visual appeal and functionality. However, it is crucial to maintain this momentum with continuous monitoring and updating of urban planning strategies to ensure sustained progress.
While the overall trend points towards an improvement in the city’s visual quality, the looming shadow of increased congestion due to population growth cannot be ignored. This presents a paradox where the city is improving in visual standards while simultaneously grappling with the challenges of density and overuse of urban infrastructure. To address this, city planners and policymakers need to adopt a holistic approach. The above result analysis highlights the actual effect of our SQ-GPT on VQoSS tasks, indicating that our method is significant for future urban planning.
5. Discussion
We verified that using MLLMs, like GPT-4, which are originally designed to understand and generate human-like text, can also be adoptted to interpret visual information. When applied to the estimation of VQoSS, these models can analyze photographic or multi-aspects street-view images to assess various quality indicators such as cleanliness, state of repair, signage clarity, and overall visual appeal. The estimation of VQoSS involves evaluating these images to rate or categorize the street space’s condition and visual characteristics. This could be used for urban planning, maintenance scheduling, or to improve navigational aids by providing more detailed information about the environment. In traditional machine learning, human annotation is necessary to annotate a dataset, which the model then uses to learn and make predictions. For instance, humans might need to annotate images of streets with descriptors like "poorly maintained" or "clean" to train a model to recognize these qualities. However, with MLLMs, the AI can learn from vast amounts of unlabeled data, recognizing patterns and making inferences without explicit human-supervision. This capability is particularly advantageous because it reduces the time and resources needed to prepare data, making it easier to scale up and apply these models to large-scale tasks, such as those needed for assessing the VQoSS across different cities or regions. In addition, we can further use MLLMs with both street imagery and possibly accompanying textual data (like metadata, annotations, or descriptions) to form an assessment of the street’s visual quality, which could inform various urban development and management decisions.
A distillation pipeline is also provided aimed at enhancing cost-efficiency. Given that GPT-4 is not currently free, direct API utilization for large-scale VQoSS estimation is not feasible. Our experiments with the proposed SQ-GPT demonstrated that, after distillation, our model can achieve performance comparable to GPT-4 at a reduced cost. This allows for its application in large-scale estimation tasks across various tasks for VQoSS. As the field of MLLMs evolves rapidly, GPT-4, despite its effectiveness in numerous tasks, may be superseded in the future. Consequently, our pipeline is significant for users wishing to elevate their models to state-of-the-art MLLM technology.
The current version of SQ-GPT presents some limitations. Specifically, the integration of several frozen modules from prior research may hinder performance optimization during fine-tuning. While methodologies such as Lora [51] offer pathways for efficient training, our attempts in this direction yielded suboptimal results. Adjustments to the image encoder or LLMs adversely affected the quality of the generated answers. This could be attributed to data constraints, as the distilled dataset available for fine-tuning may be insufficient for the extensive modules in question. Addressing these issues will be a primary focus in our forthcoming research endeavors.
Furthermore, our analysis indicates that SQ-GPT’s performance in tasks such as "Facade Color" recognition is not good enough, which can be primarily attributed to the challenges posed by varying light intensities and angles during image capturing. These environmental factors can significantly alter the perceived color, leading to inaccuracies in the model’s answering. To counteract these issues, future version of the pipeline could incorporate advanced pre-processing algorithms that normalize lighting conditions or employ more sophisticated techniques for color constancy. Additionally, enhancing the dataset with a wider array of images captured under diverse lighting conditions may improve the model’s robustness to such environmental variables. By addressing these nuances, we can refine SQ-GPT’s capabilities for more accurate and reliable analysis.
An aspect for further investigation is the generalizability of SQ-GPT, as well as our entire pipeline, for estimation tasks to other city areas. Specifically, it would be valuable to assess the adaptability of our methods to diverse urban environments. The unique characteristics and data profiles of different cities may present varying challenges to the robustness and accuracy of our model. Future research should focus on the scalability of our pipeline, ensuring that it maintains high performance across a range of geographically and culturally distinct cities. This expansion could potentially lead to a more versatile and universally applicable tool for urban data analysis and planning.
6. Conclusion
In this paper, we proposed SQ-GPT, aimed at assessing the visual quality of street spaces using the capabilities of MLLMs like GPT-4. We also proposed our own model SQ-GPT which comprises several key components: an image encoder, a QFormer for aligning images with text, and a refinement stage to fine-tune the process. Through efficient knowledge distillation, SQ-GPT manages to closely mirror GPT-4’s performance while significantly cutting down on costs, thereby democratizing the technology for broader use. We utilized a dataset from Baidu Street View in Nanjing, Gulou district, capturing images from two distinct time frames to monitor changes over time.
We also assessed the model’s performance through both human-centric evaluation and visual analysis, which confirmed its effectiveness in various tasks. Nevertheless, we recognized the model’s limitations, such as the challenge of inconsistent lighting conditions affecting color recognition, and proposed future improvements, including the development of sophisticated pre-processing algorithms. In conclusion, we showed that SQ-GPT can perform on par with GPT-4 in quality assessments but at a more affordable rate, which is highly beneficial for large-scale urban planning and quality assessment projects. We also acknowledged the necessity for ongoing research to surmount the existing limitations and to boost the model’s adaptability and sturdiness across various urban settings. We believe that this paper could be a pioneer work that inspires researchers using MLLMs for the future efficient and high-quality urban planning.
Author Contributions
Conceptualization, H.L. B.W. and J.Z.; methodology, H.L. and J.Z.; software, B.W., Z.Z. and Y.L.; validation, H.L. B.W. and J.Z.; formal analysis, B.W., Z.Z. and Y.L.; investigation, B.W.; resources, H.L. and B.W.; data curation, H.L.; writing—original draft preparation, H.L.; writing—review and editing, J.Z. and B.W.; visualization, B.W.; supervision, J.Z.; project administration, J.Z.; funding acquisition, H.L. All authors have read and agreed to the published version of the manuscript.
Funding
This work is supported by Jiangxi Province Compact Residential Lot Detailed Planning and Architectural Design Research Project 2011ZBBH80014. This work also is partly supported by JSPS KAKENHI Grant Number 19K10662, 20K23343, 21K17764, and 22H03353.
Institutional Review Board Statement
Not applicable.
Informed Consent Statement
Not applicable.
Data Availability Statement
Our implementation code is available by contacting the corresponding author with a reasonable request.
Conflicts of Interest
The authors declare no conflict of interest.
References
- Mouratidis, K. Urban planning and quality of life: A review of pathways linking the built environment to subjective well-being. Cities 2021, 115, 103229. [Google Scholar] [CrossRef]
- Meyrick, K.; Newman, P. Exploring the potential connection between place capital and health capital in the post COVID-19 city. npj Urban Sustain. 2023, 3, 44. [Google Scholar] [CrossRef]
- Sharifi, A.; Khavarian-Garmsir, A.R. The COVID-19 pandemic: Impacts on cities and major lessons for urban planning, design, and management. Sci. Total Environ. 2020, 749, 142391. [Google Scholar] [CrossRef] [PubMed]
- Tang, J.; Long, Y. Measuring visual quality of street space and its temporal variation: Methodology and its application in the Hutong area in Beijing. Landsc. Urban Plan. 2019, 191, 103436. [Google Scholar] [CrossRef]
- Whyte, W.H.; others. The social life of small urban spaces; Conservation Foundation: Washington, DC, USA, 1980. [Google Scholar]
- Balogun, A.L.; Marks, D.; Sharma, R.; Shekhar, H.; Balmes, C.; Maheng, D.; Arshad, A.; Salehi, P. Assessing the potentials of digitalization as a tool for climate change adaptation and sustainable development in urban centres. Sustain. Cities Soc. 2020, 53, 101888. [Google Scholar] [CrossRef]
- Biljecki, F.; Ito, K. Street view imagery in urban analytics and GIS: A review. Landsc. Urban Plan. 2021, 215, 104217. [Google Scholar] [CrossRef]
- Wang, M.; He, Y.; Meng, H.; Zhang, Y.; Zhu, B.; Mango, J.; Li, X. Assessing street space quality using street view imagery and function-driven method: The case of Xiamen, China. ISPRS Int. J. Geo-Inf. 2022, 11, 282. [Google Scholar] [CrossRef]
- Toth, C.; Jóźków, G. Remote sensing platforms and sensors: A survey. ISPRS J. Photogramm. Remote Sens. 2016, 115, 22–36. [Google Scholar] [CrossRef]
- Cheng, G.; Xie, X.; Han, J.; Guo, L.; Xia, G.S. Remote sensing image scene classification meets deep learning: Challenges, methods, benchmarks, and opportunities. IEEE J. Sel. Top. Appl. Earth Obs. Remote Sens. 2020, 13, 3735–3756. [Google Scholar] [CrossRef]
- LeCun, Y.; Bengio, Y.; Hinton, G. Deep learning. Nature 2015, 521, 436–444. [Google Scholar] [CrossRef]
- Goodfellow, I.; Bengio, Y.; Courville, A. Deep Learning, MIT press, 2016.
- Gong, Z.; Ma, Q.; Kan, C.; Qi, Q. Classifying street spaces with street view images for a spatial indicator of urban functions. Sustainability 2019, 11, 6424. [Google Scholar] [CrossRef]
- Li, Y.; Yabuki, N.; Fukuda, T. Measuring visual walkability perception using panoramic street view images, virtual reality, and deep learning. Sustain. Cities Soc. 2022, 86, 104140. [Google Scholar] [CrossRef]
- Pan, S.J.; Yang, Q. A survey on transfer learning. IEEE Trans. Knowl. Data Eng. 2009, 22, 1345–1359. [Google Scholar] [CrossRef]
- Tan, C.; Sun, F.; Kong, T.; Zhang, W.; Yang, C.; Liu, C. A survey on deep transfer learning. In Proceedings of the Artificial Neural Networks and Machine Learning–ICANN 2018: 27th International Conference on Artificial Neural Networks, Rhodes, Greece, 4–7 October 2018; Proceedings, Part III 27. Springer, 2018; pp. 270–279. [Google Scholar]
- Aurigi, A.; Odendaal, N. From “smart in the box” to “smart in the city”: Rethinking the socially sustainable smart city in context. In Sustainable Smart City Transitions; Routledge, 2022; pp. 53–68. [Google Scholar]
- Wang, J.; Wang, X.; Shen, T.; Wang, Y.; Li, L.; Tian, Y.; Yu, H.; Chen, L.; Xin, J.; Wu, X.; others. Parallel vision for long-tail regularization: Initial results from IVFC autonomous driving testing. IEEE Trans. Intell. Veh. 2022, 7, 286–299. [Google Scholar] [CrossRef]
- Zhao, W.X.; Zhou, K.; Li, J.; Tang, T.; Wang, X.; Hou, Y.; Min, Y.; Zhang, B.; Zhang, J.; Dong, Z.; Du, Y.; Yang, C.; Chen, Y.; Chen, Z.; Jiang, J.; Ren, R.; Li, Y.; Tang, X.; Liu, Z.; Liu, P.; Nie, J.Y.; Wen, J.R. A Survey of Large Language Models. arXiv 2023, arXiv:2303.18223. [Google Scholar]
- OpenAI, n. OpenAI. "ChatGPT." 2023 https://www.openai.com/research/chatgpt.
- Yin, S.; Fu, C.; Zhao, S.; Li, K.; Sun, X.; Xu, T.; Chen, E. A Survey on Multimodal Large Language Models. arXiv 2023, arXiv:2306.13549. [Google Scholar]
- OpenAI. GPT-4 Technical Report. arXiv 2023. [Google Scholar]
- Li, J.; Li, D.; Savarese, S.; Hoi, S. Blip-2: Bootstrapping language-image pre-training with frozen image encoders and large language models. arXiv 2023, arXiv:2301.12597. [Google Scholar]
- Li, K.; He, Y.; Wang, Y.; Li, Y.; Wang, W.; Luo, P.; Wang, Y.; Wang, L.; Qiao, Y. VideoChat: Chat-Centric Video Understanding. arXiv 2023, arXiv:2305.06355. [Google Scholar]
- Liu, H.; Li, C.; Wu, Q.; Lee, Y.J. Visual Instruction Tuning. NeurIPS, 2023.
- Zhu, D.; Chen, J.; Shen, X.; Li, X.; Elhoseiny, M. MiniGPT-4: Enhancing Vision-Language Understanding with Advanced Large Language Models. arXiv 2023, arXiv:2304.10592. [Google Scholar]
- Nori, H.; King, N.; McKinney, S.M.; Carignan, D.; Horvitz, E. Capabilities of gpt-4 on medical challenge problems. arXiv 2023, arXiv:2303.13375. [Google Scholar]
- Chen, P.; Liu, S.; Zhao, H.; Jia, J. Distilling knowledge via knowledge review. In Proceedings of the IEEE/CVF Conference on Computer Vision and Pattern Recognition; 2021; pp. 5008–5017. [Google Scholar]
- Gou, J.; Yu, B.; Maybank, S.J.; Tao, D. Knowledge distillation: A survey. Int. J. Comput. Vis. 2021, 129, 1789–1819. [Google Scholar] [CrossRef]
- Wei, C.; Meng, J.; Zhu, L.; Han, Z. Assessing progress towards sustainable development goals for Chinese urban land use: A new cloud model approach. J. Environ. Manag. 2023, 326, 116826. [Google Scholar] [CrossRef] [PubMed]
- Liu, M.; Zhang, B.; Luo, T.; Liu, Y.; Portnov, B.A.; Trop, T.; Jiao, W.; Liu, H.; Li, Y.; Liu, Q. Evaluating street lighting quality in residential areas by combining remote sensing tools and a survey on pedestrians’ perceptions of safety and visual comfort. Remote Sens. 2022, 14, 826. [Google Scholar] [CrossRef]
- Ye, N.; Wang, B.; Kita, M.; Xie, M.; Cai, W. Urban Commerce Distribution Analysis Based on Street View and Deep Learning. IEEE Access 2019, 7, 162841–162849. [Google Scholar] [CrossRef]
- Li, Y.; Yabuki, N.; Fukuda, T. Integrating GIS, deep learning, and environmental sensors for multicriteria evaluation of urban street walkability. Landsc. Urban Plan. 2023, 230, 104603. [Google Scholar] [CrossRef]
- Mahabir, R.; Schuchard, R.; Crooks, A.; Croitoru, A.; Stefanidis, A. Crowdsourcing street view imagery: A comparison of mapillary and OpenStreetCam. ISPRS Int. J. Geo-Inf. 2020, 9, 341. [Google Scholar] [CrossRef]
- Zhang, J.; Yu, Z.; Li, Y.; Wang, X. Uncovering Bias in Objective Mapping and Subjective Perception of Urban Building Functionality: A Machine Learning Approach to Urban Spatial Perception. Land 2023, 12, 1322. [Google Scholar] [CrossRef]
- Wang, B.; Zhang, J.; Zhang, R.; Li, Y.; Li, L.; Nakashima, Y. Improving Facade Parsing with Vision Transformers and Line Integration. arXiv 2023, arXiv:2309.15523. [Google Scholar] [CrossRef]
- Clifton, K.; Ewing, R.; Knaap, G.J.; Song, Y. Quantitative analysis of urban form: a multidisciplinary review. J. Urban. 2008, 1, 17–45. [Google Scholar] [CrossRef]
- Zhang, J.; Fukuda, T.; Yabuki, N. Automatic generation of synthetic datasets from a city digital twin for use in the instance segmentation of building facades. J. Comput. Des. Eng. 2022, 9, 1737–1755. [Google Scholar] [CrossRef]
- Zhang, J.; Fukuda, T.; Yabuki, N. Development of a city-scale approach for façade color measurement with building functional classification using deep learning and street view images. ISPRS Int. J. Geo-Inf. 2021, 10, 551. [Google Scholar] [CrossRef]
- Badrinarayanan, V.; Kendall, A.; Cipolla, R. Segnet: A deep convolutional encoder-decoder architecture for image segmentation. IEEE Trans. Pattern Anal. Mach. Intell. 2017, 39, 2481–2495. [Google Scholar] [CrossRef] [PubMed]
- Li, X.; Li, Y.; Jia, T.; Zhou, L.; Hijazi, I.H. The six dimensions of built environment on urban vitality: Fusion evidence from multi-source data. Cities 2022, 121, 103482. [Google Scholar] [CrossRef]
- Koo, B.W.; Guhathakurta, S.; Botchwey, N. How are neighborhood and street-level walkability factors associated with walking behaviors? A big data approach using street view images. Environ. Behav. 2022, 54, 211–241. [Google Scholar] [CrossRef]
- Hoffmann, E.J.; Wang, Y.; Werner, M.; Kang, J.; Zhu, X.X. Model fusion for building type classification from aerial and street view images. Remote Sens. 2019, 11, 1259. [Google Scholar] [CrossRef]
- Gebru, T.; Krause, J.; Wang, Y.; Chen, D.; Deng, J.; Aiden, E.L.; Fei-Fei, L. Using deep learning and Google Street View to estimate the demographic makeup of neighborhoods across the United States. Proc. Natl. Acad. Sci. USA 2017, 114, 13108–13113. [Google Scholar] [CrossRef]
- Baltrušaitis, T.; Ahuja, C.; Morency, L.P. Multimodal machine learning: A survey and taxonomy. IEEE Trans. Pattern Anal. Mach. Intell. 2018, 41, 423–443. [Google Scholar] [CrossRef] [PubMed]
- Dai, W.; Li, J.; Li, D.; Tiong, A.M.H.; Zhao, J.; Wang, W.; Li, B.; Fung, P.; Hoi, S. InstructBLIP: Towards General-purpose Vision-Language Models with Instruction Tuning. arXiv 2023, arXiv:2305.06500. [arXiv:cs.CV/2305.06500]. [Google Scholar]
- Zhang, R.; Han, J.; Zhou, A.; Hu, X.; Yan, S.; Lu, P.; Li, H.; Gao, P.; Qiao, Y. LLaMA-Adapter: Efficient Fine-tuning of Language Models with Zero-init Attention. arXiv 2023, arXiv:2303.16199. [Google Scholar]
- Gao, P.; Han, J.; Zhang, R.; Lin, Z.; Geng, S.; Zhou, A.; Zhang, W.; Lu, P.; He, C.; Yue, X.; Li, H.; Qiao, Y. LLaMA-Adapter V2: Parameter-Efficient Visual Instruction Model. arXiv 2023, arXiv:2304.15010. [Google Scholar]
- Gong, T.; Lyu, C.; Zhang, S.; Wang, Y.; Zheng, M.; Zhao, Q.; Liu, K.; Zhang, W.; Luo, P.; Chen, K. 2023; arXiv:2305.04790.
- Su, Y.; Lan, T.; Li, H.; Xu, J.; Wang, Y.; Cai, D. PandaGPT: One Model To Instruction-Follow Them All. arXiv 2023, arXiv:2305.16355. [Google Scholar]
- Hu, E.J.; Shen, Y.; Wallis, P.; Allen-Zhu, Z.; Li, Y.; Wang, S.; Wang, L.; Chen, W. LoRA: Low-Rank Adaptation of Large Language Models. International Conference on Learning Representations, 2022.
- Awadalla, A.; Gao, I.; Gardner, J.; Hessel, J.; Hanafy, Y.; Zhu, W.; Marathe, K.; Bitton, Y.; Gadre, S.; Sagawa, S.; Jitsev, J.; Kornblith, S.; Koh, P.W.; Ilharco, G.; Wortsman, M.; Schmidt, L. OpenFlamingo: An Open-Source Framework for Training Large Autoregressive Vision-Language Models. arXiv 2023, arXiv:2308.01390. [Google Scholar]
- Xu, Z.; Shen, Y.; Huang, L. Multiinstruct: Improving multi-modal zero-shot learning via instruction tuning. arXiv 2022, arXiv:2212.10773. [Google Scholar]
- Lin, T.Y.; Maire, M.; Belongie, S.; Hays, J.; Perona, P.; Ramanan, D.; Dollár, P.; Zitnick, C.L. Microsoft coco: Common objects in context. In Proceedings of the Computer Vision–ECCV 2014: 13th European Conference, Zurich, Switzerland, 6–12 September 2014; Proceedings, Part V 13. Springer, 2014; pp. 740–755. [Google Scholar]
- Mukherjee, S.; Mitra, A.; Jawahar, G.; Agarwal, S.; Palangi, H.; Awadallah, A. Orca: Progressive learning from complex explanation traces of gpt-4. arXiv 2023, arXiv:2306.02707. [Google Scholar]
- Vaswani, A.; Shazeer, N.; Parmar, N.; Uszkoreit, J.; Jones, L.; Gomez, A.N.; Kaiser, Ł.; Polosukhin, I. Attention is all you need. Adv. Neural Inf. Process. Syst. 2017, 30. [Google Scholar]
Figure 1.
Research area of this study. All data point are collected from Gulou district (d), Nanjing (c), Jiangsu province (b), China (a).
Figure 1.
Research area of this study. All data point are collected from Gulou district (d), Nanjing (c), Jiangsu province (b), China (a).
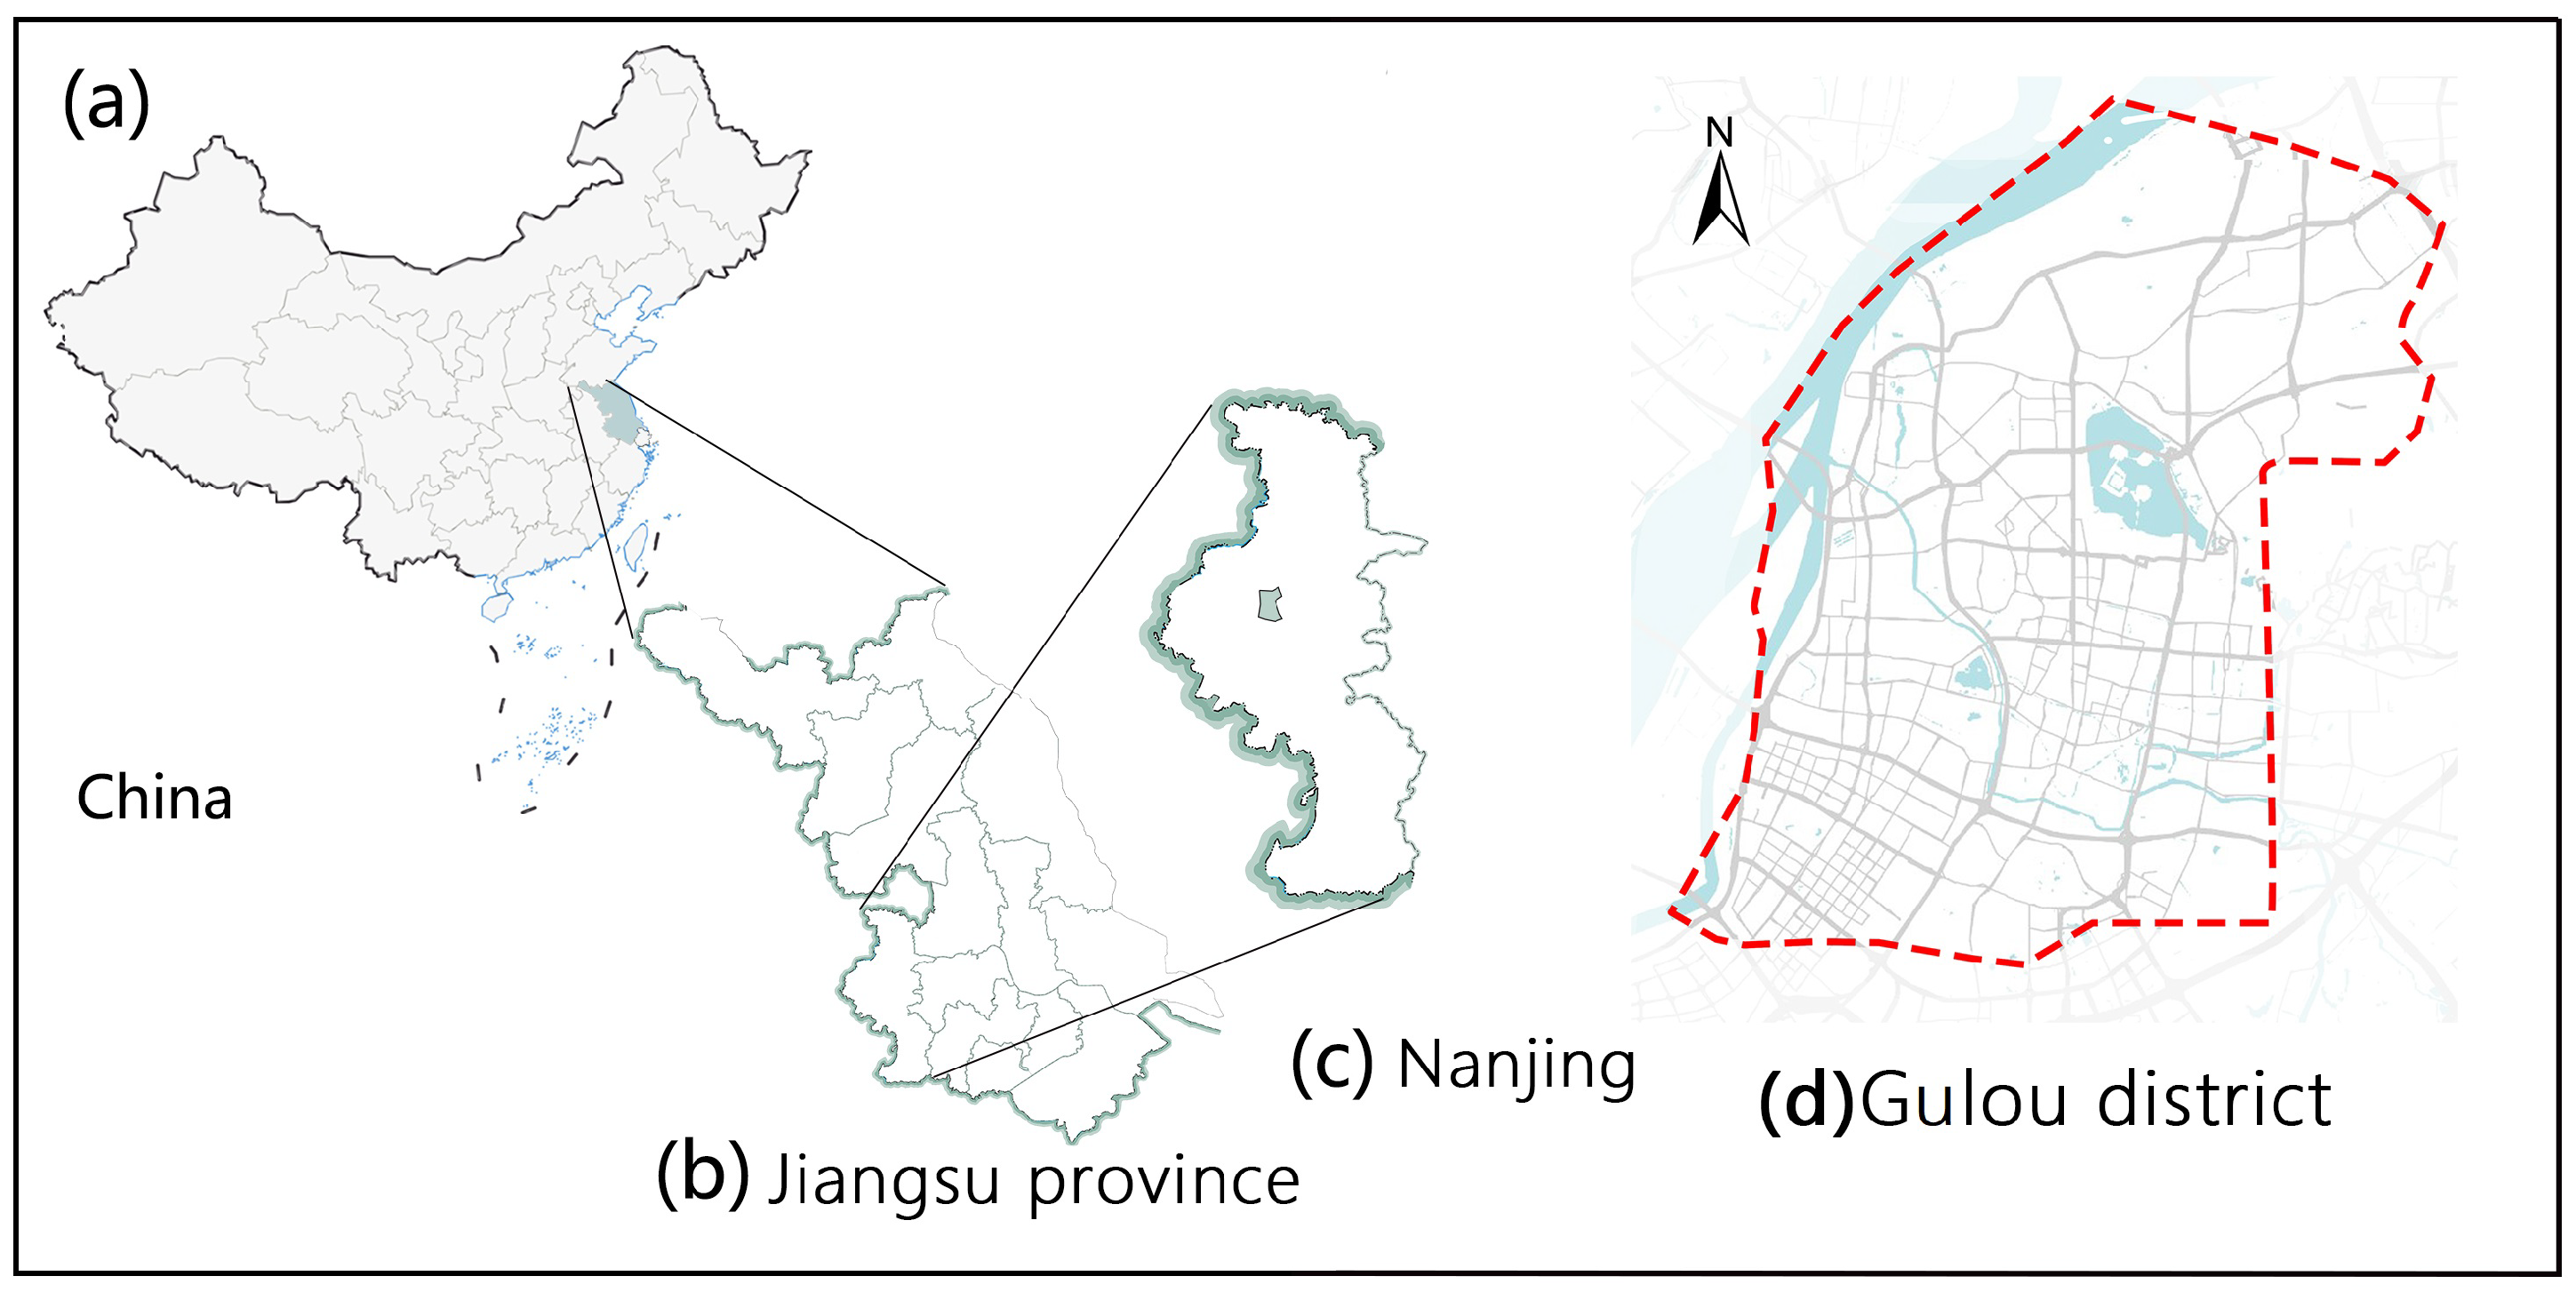
Figure 2.
The study area’s specific location at Longitude 118.7490° E, Latitude 32.0869° N has street view images from 2017 and 2020 in all four cardinal directions.
Figure 2.
The study area’s specific location at Longitude 118.7490° E, Latitude 32.0869° N has street view images from 2017 and 2020 in all four cardinal directions.

Figure 3.
The settings for VQoSS evaluation. We totally defined 4 categories and 9 tasks for the VQoSS evaluation. These tasks can comprehensively evaluate street visual quality.
Figure 3.
The settings for VQoSS evaluation. We totally defined 4 categories and 9 tasks for the VQoSS evaluation. These tasks can comprehensively evaluate street visual quality.
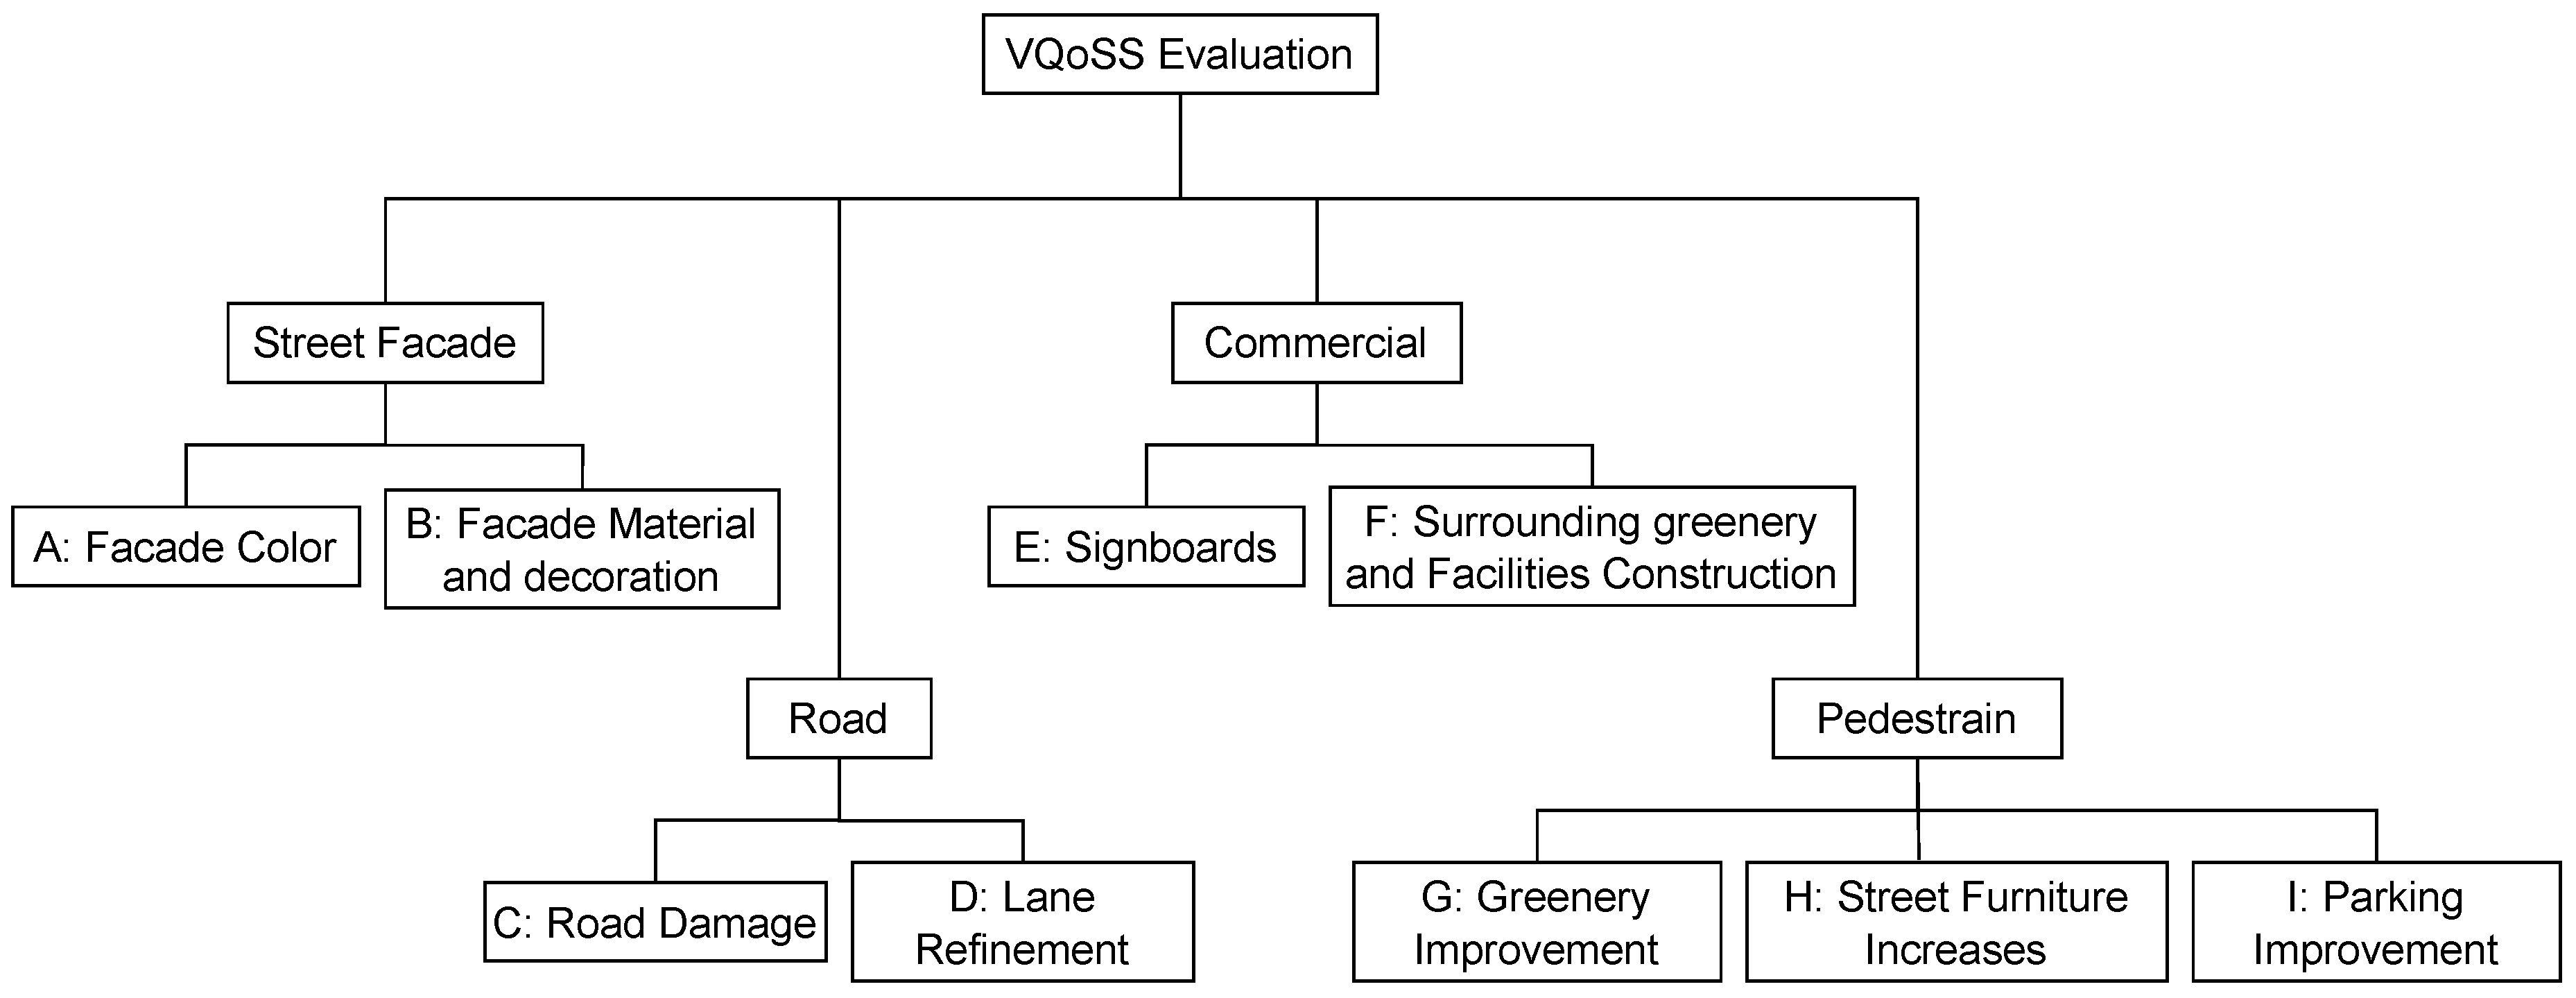
Figure 4.
Samples for 9 tasks of VQoSS changes evaluation.
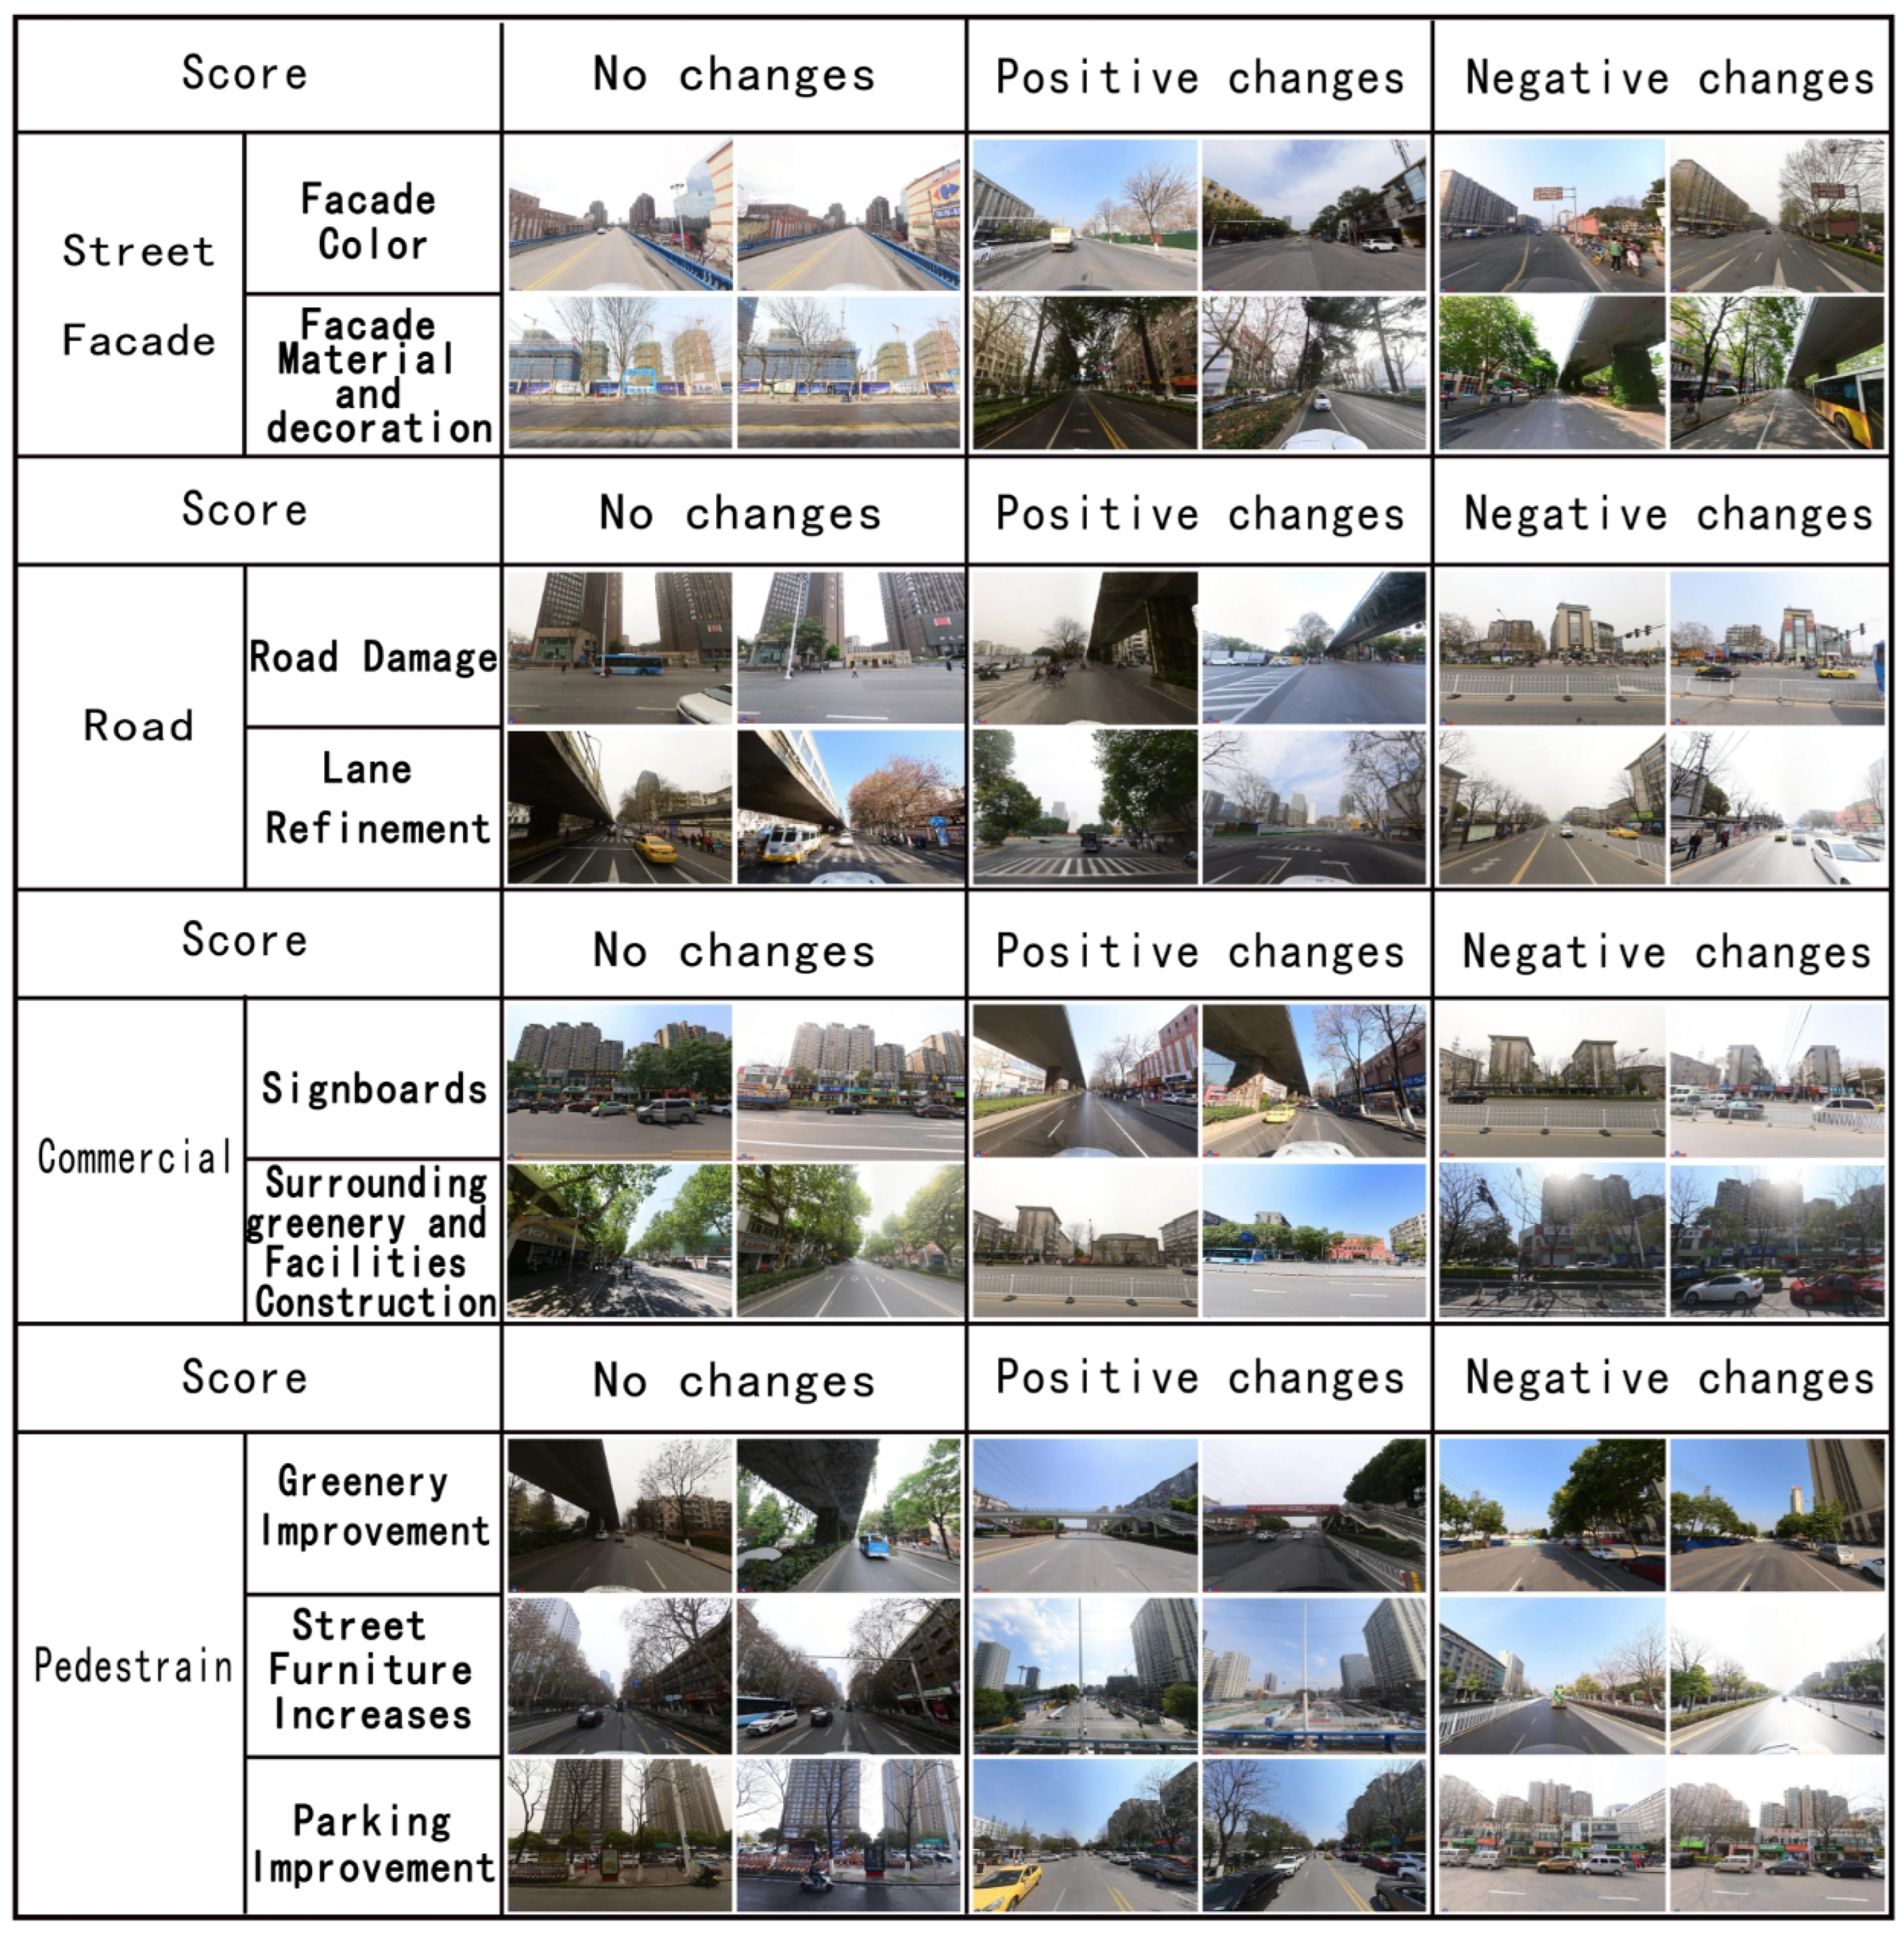
Figure 5.
Overview of our proposed SQ-GPT. In the upper part, we first distill the knowledge in GPT-4 through split data points and generate a new dataset . Then, in the lower part, we fine-tune our SQ-GPT by the supervision of high-quality answers from GPT-4.
Figure 5.
Overview of our proposed SQ-GPT. In the upper part, we first distill the knowledge in GPT-4 through split data points and generate a new dataset . Then, in the lower part, we fine-tune our SQ-GPT by the supervision of high-quality answers from GPT-4.
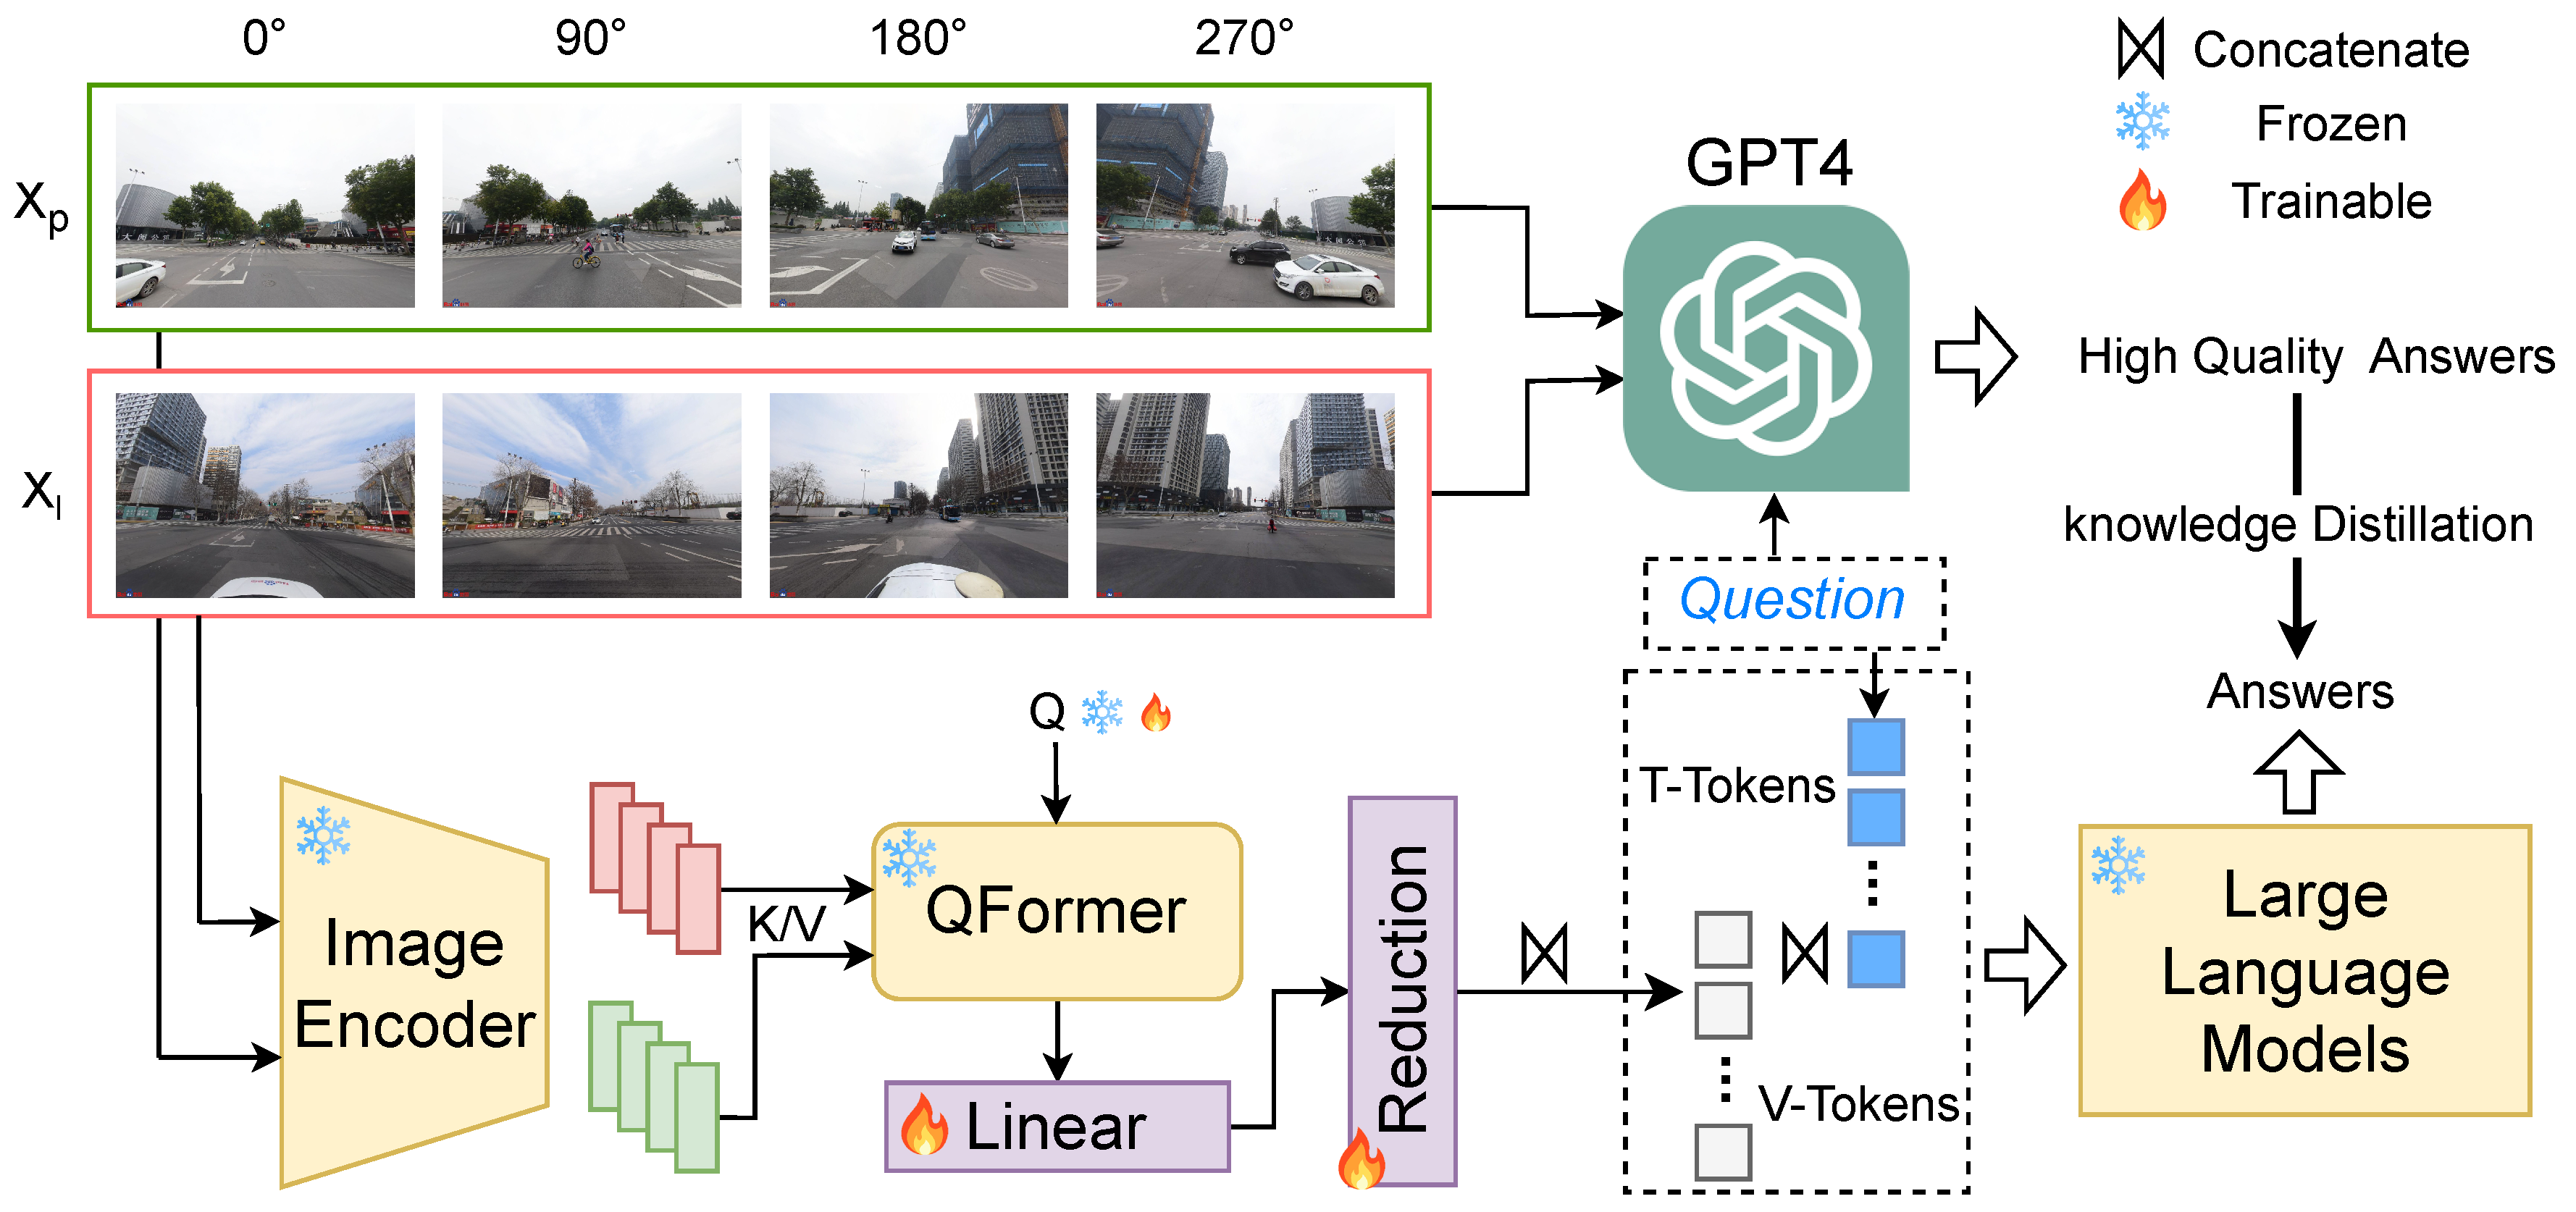
Figure 6.
The inference pipeline of a frozen QFormer. It is a N time transformer [56] blocks and we adopted a learnable query besides the original learned query.
Figure 6.
The inference pipeline of a frozen QFormer. It is a N time transformer [56] blocks and we adopted a learnable query besides the original learned query.
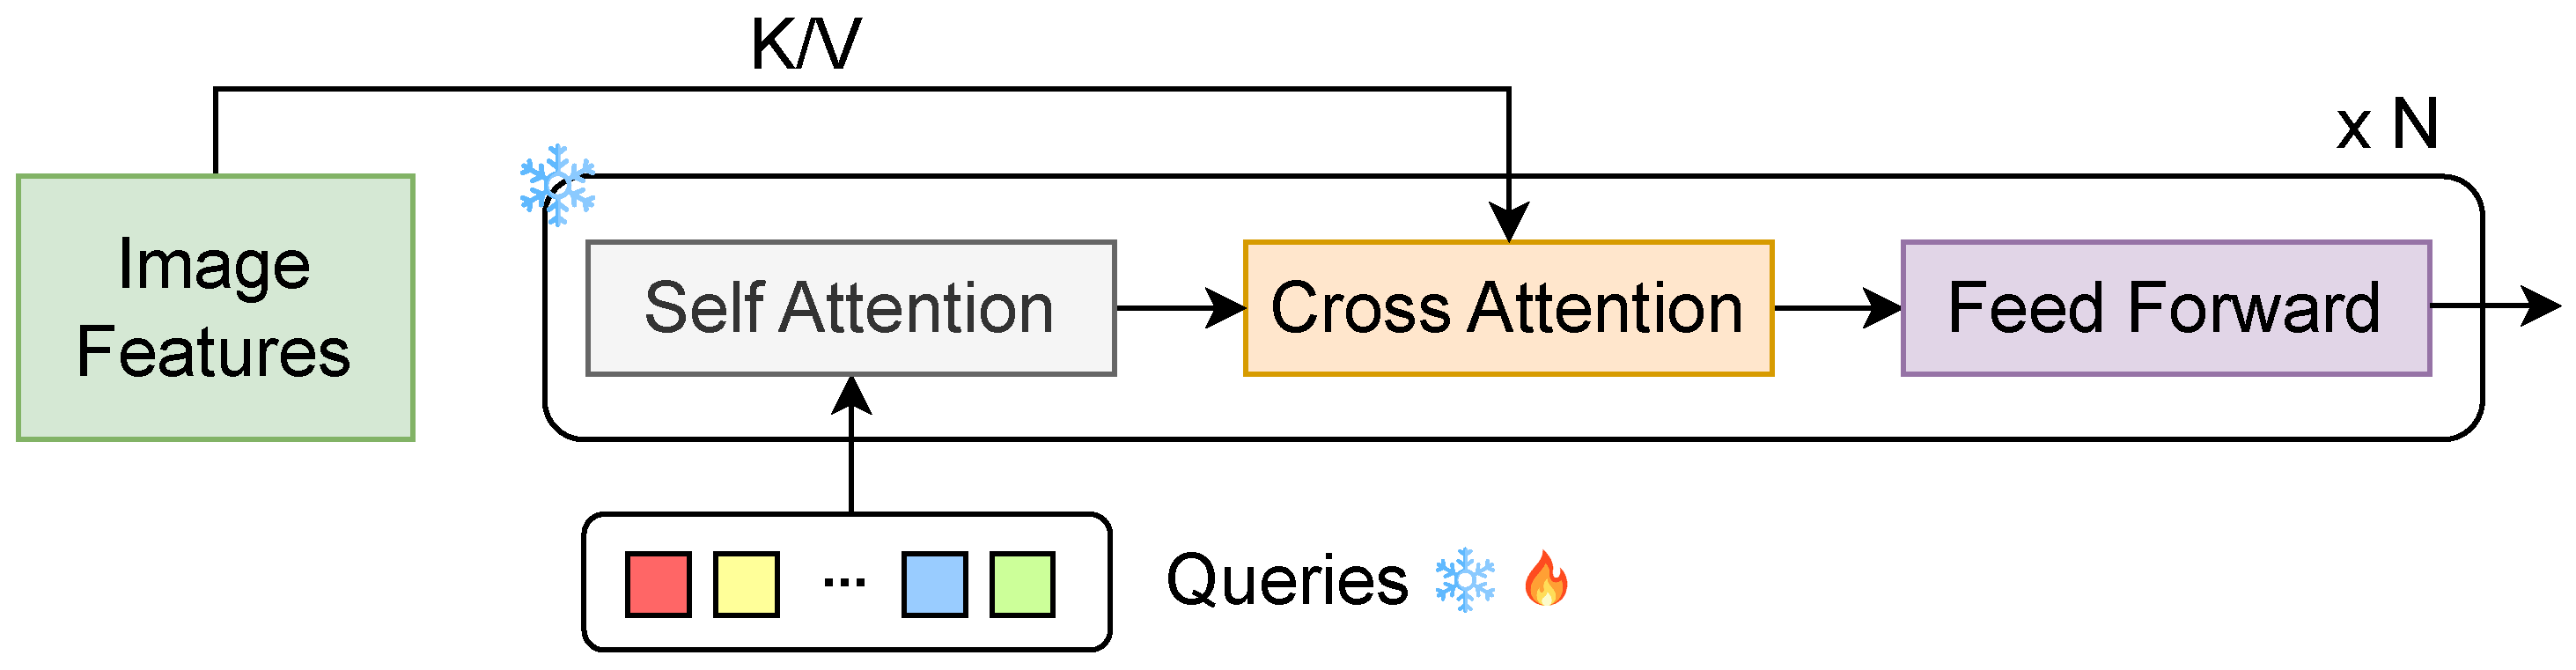
Figure 7.
Human-centric evaluation among LLaVA-1.5, SQ-GPT, and GPT-4. We adopt the agreement testing for 200 data points and all 9 tasks. We employed three groups of people (50 laypeople, 30 architecture students, and 10 urban environment experts) for the quantitative evaluation.
Figure 7.
Human-centric evaluation among LLaVA-1.5, SQ-GPT, and GPT-4. We adopt the agreement testing for 200 data points and all 9 tasks. We employed three groups of people (50 laypeople, 30 architecture students, and 10 urban environment experts) for the quantitative evaluation.
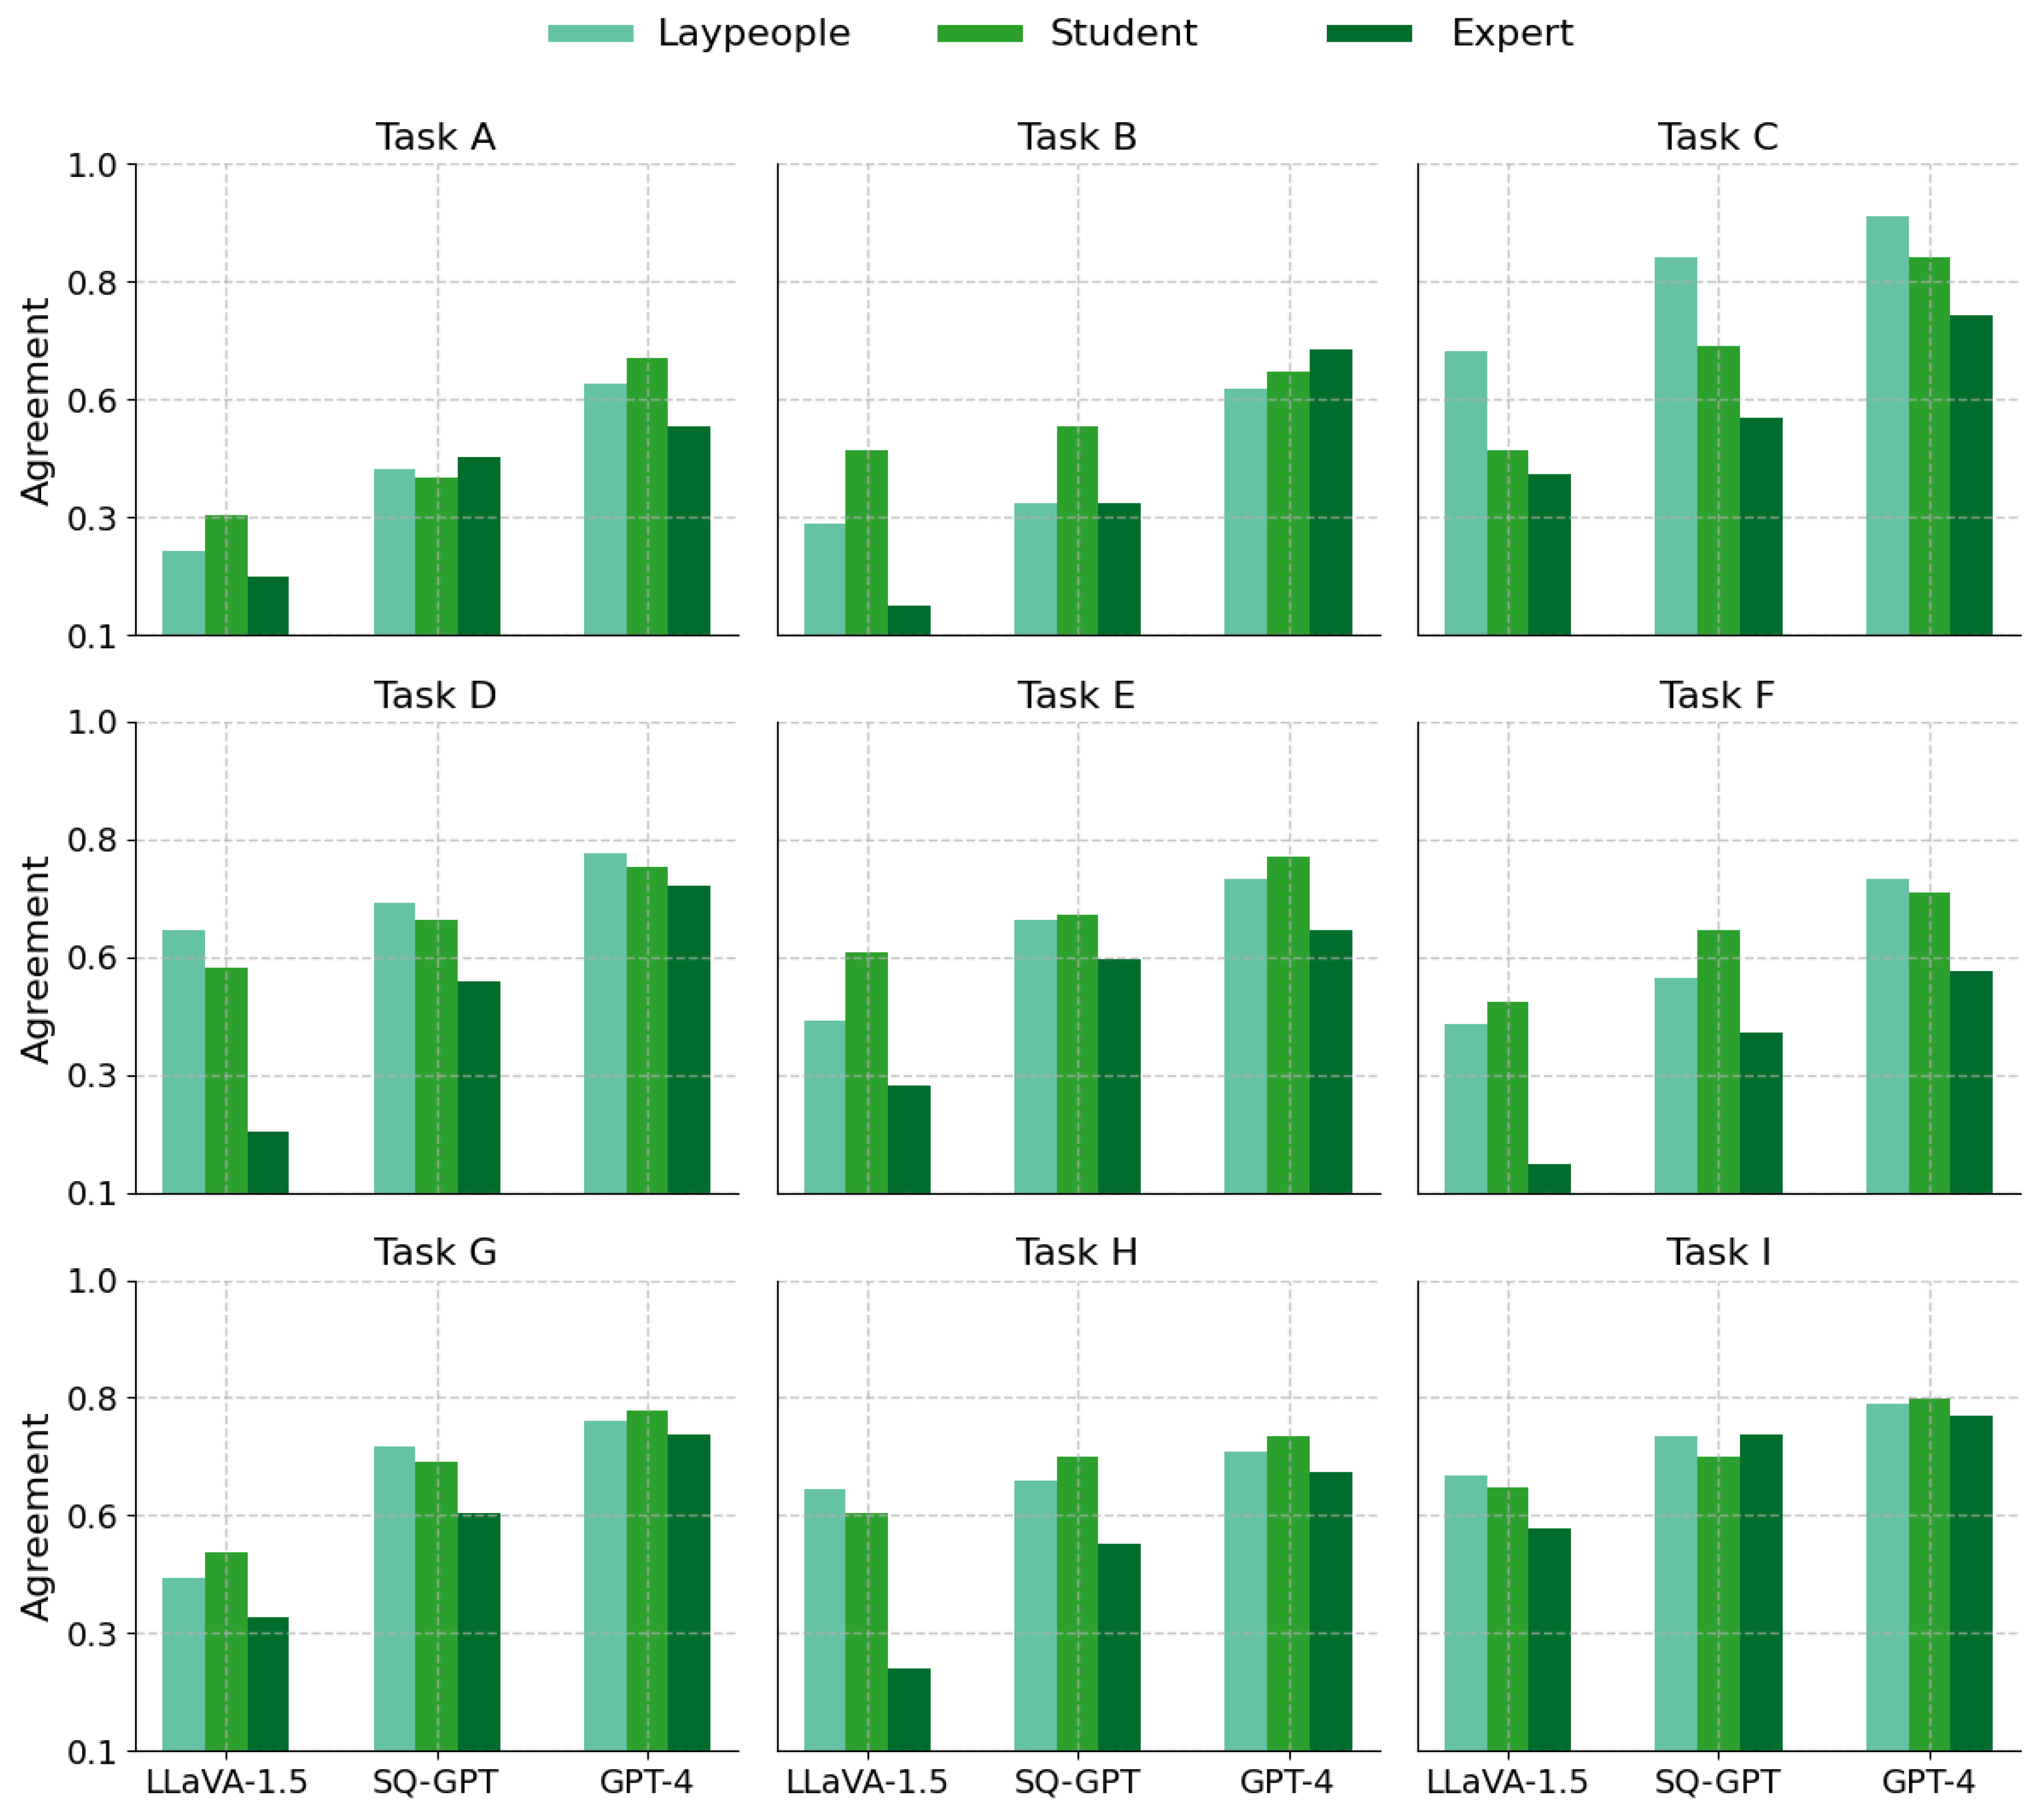
Figure 8.
Visualizations on a city map for all 9 VQoSS tasks. We use green point, red point, and blue point to represent positive changes, negative changes, and no changes, respectively. Sub-figure (a–j), (a) Facade Color; (b) Facade Material or Decoration.; (c) Road Damage; (d) Lane Refinement; (e) Signboards; (f) Surrounding greenery and Facilities Construction; (g) Parking Improvement; (h) Street Furniture Increases; (i) Greenery Improvement.
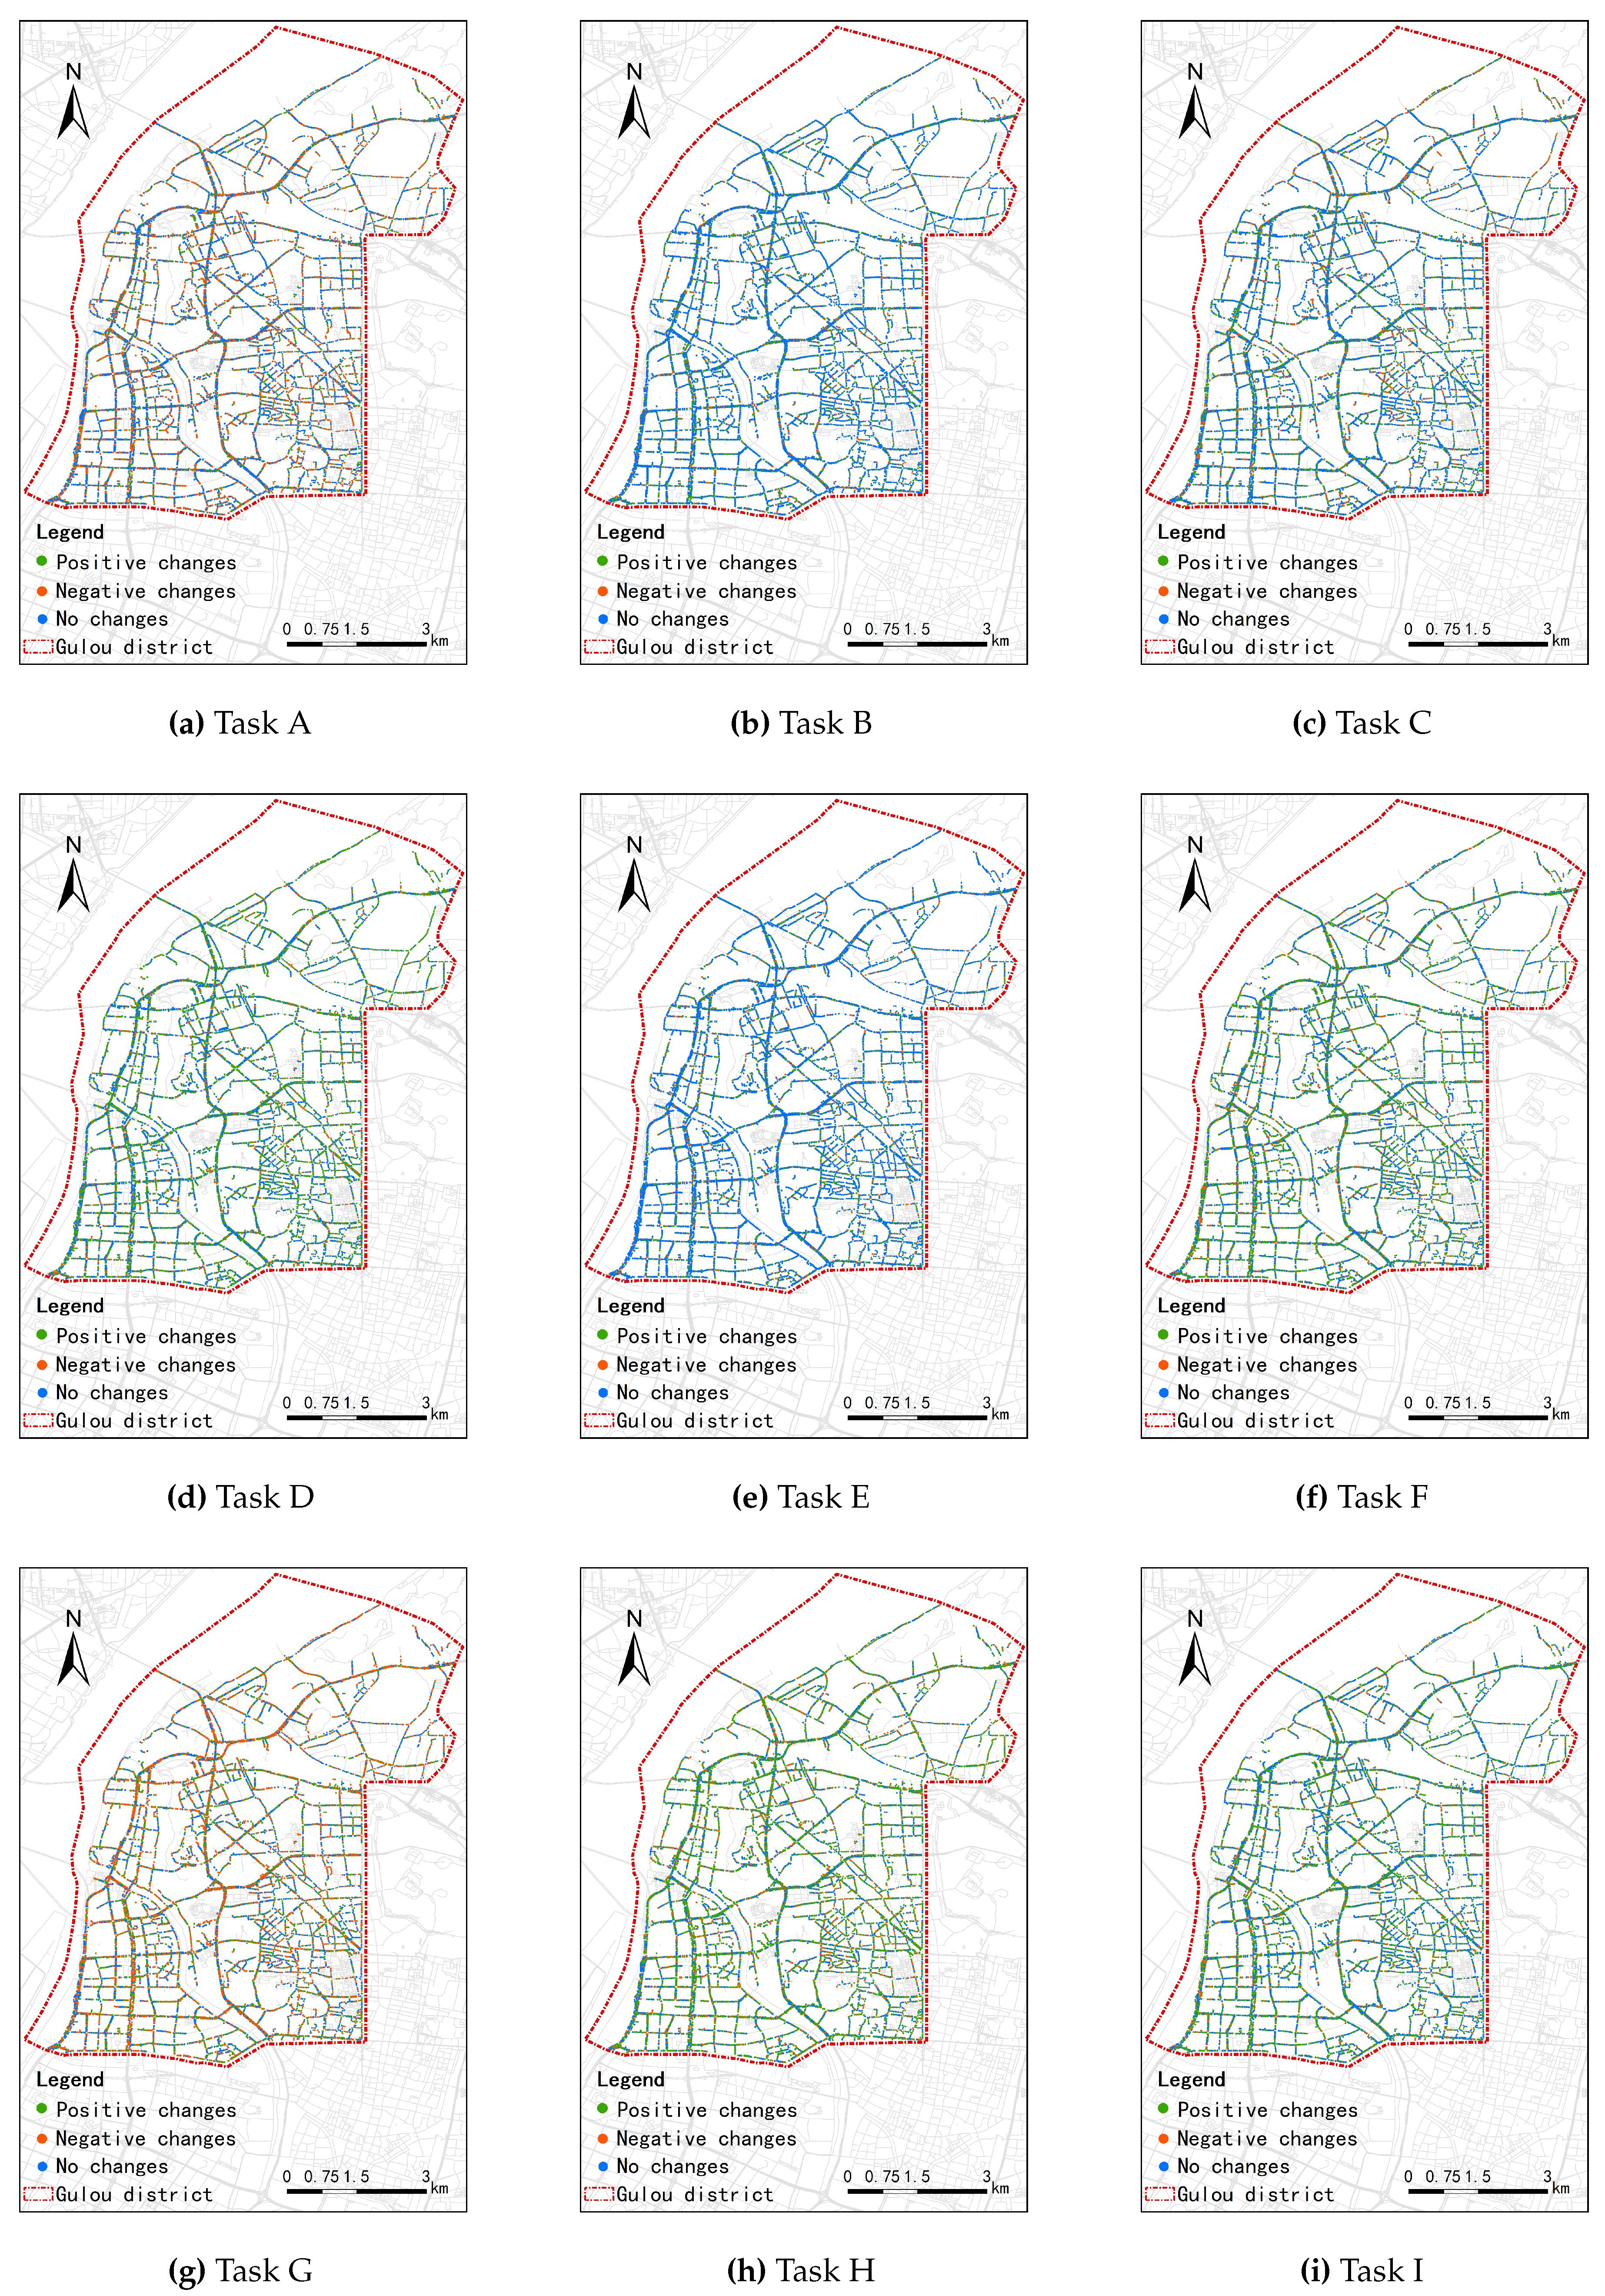

Table 1.
To show how we distill knowledge from GPT-4, we demonstrate an answer sample from GPT-4 in discriminating the color of the facade. We input four direction images of a data point for previous and later periods, respectively. Then, we ask GPT-4 to describe the color difference between two periods and select a choice from the given options.
| Visual Input Example, Question for "Facade Color" | |
|---|---|
 |
|
| Question | The first four images are street view images taken from four different directions of the street. The last four images are taken from the same location and the same four directions but at a different period. Analyze the facade color changes of different periods and finally you must give me a choice from: A: Positive, B: Negative, C: No Changes. Make your statement concise. |
| Answer | Based on the provided images, we can observe the following changes in the building facades’ color over the two different time periods. Initial Period (First Four Images): The building facades are predominantly neutral-toned with a mix of whites, beiges, and light gray hues. The overall color palette is muted and uniform, with little variation in color saturation or brightness. The buildings have a clean and modern appearance, with the color of the construction materials clearly visible. Later Period (Last Four Images): The facades exhibit a similar color scheme with no significant changes in the hues. However, there may be slight variations in brightness due to differences in the time of day or weather conditions when the photos were taken. There is no evidence of major renovation or repainting that has altered the color palette of the buildings significantly. Considering these observations, the most accurate response would be: C: No Changes. . |
Table 2.
Comparison of answer samples among LLaVA-1.5, SQ-GPT, and GPT-4 for the question of discriminating changes of "Road Refinement".
Table 2.
Comparison of answer samples among LLaVA-1.5, SQ-GPT, and GPT-4 for the question of discriminating changes of "Road Refinement".
| Visual Input Comparison Examples, Question for "Lane Refinement" | |
|---|---|
| Question | 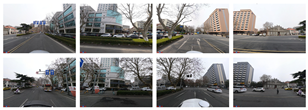 |
| {D} + "Describe changes in road refinement between two periods." + {C} | |
| Answer GPT-4 | After reviewing the images from two different periods, it is noticeable that there has been some wear in the road markings and a general decline in lane visibility in the later images. The roads show signs of heavier use, and the increased clutter along the curbside could suggest changes in traffic or parking patterns that may not be as orderly as before. These factors contribute to a slight negative impact on lane refinement, indicating a decrease in the clarity and maintenance of traffic lanes over time. Hence, the assessment concludes with a negative change in lane refinement. Therefore, my feeling towards these changes would be option B: Negative. |
| Answer SQ-GPT | It’s evident that lane refinement has seen a decline over time. Initially, clear lane markings in the first period have become less discernible in the second, likely as a result of wear and inadequate maintenance. This degradation in lane visibility can have serious implications, potentially compromising lane divisions’ clarity and introducing confusion among drivers. Despite a consistent presence of traffic signs, the overall impression hints at a deterioration in the road’s organization. Taking these factors into account, it becomes increasingly apparent that the changes in lane refinement lean towards a negative impact, aligning with Option B: Negative. |
| Answer LLaVA-1.5 | The changes in lane refinement between the two periods are evident in the increased number of cars on the street, which suggests that the area is more congested. I feel that the changes in lane refinement are negative, as the increased number of cars on the street indicates a higher level of traffic congestion. This can lead to longer travel times, increased air pollution, and a higher risk of accidents. The increased traffic can also be a sign of urbanization and economic growth, which is a positive aspect of the city’s development. However, the negative impacts on the environment and the quality of life for the residents must be considered. The final option is B. |
Table 3.
Comparison of answer samples among LLaVA-1.5, SQ-GPT, and GPT-4 for the question of discriminating changes of "Greenery Improvement"".
Table 3.
Comparison of answer samples among LLaVA-1.5, SQ-GPT, and GPT-4 for the question of discriminating changes of "Greenery Improvement"".
| Visual Input Comparison Examples, Question for "Greenery Improvement" | |
|---|---|
| Question | 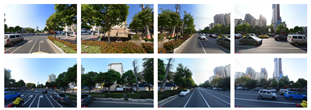 |
| {D} + "Describe changes in greenery improvement between two periods." + {C} | |
| Answer GPT-4 | Upon examining the eight street view images you provided, they depict the same location from four cardinal directions, captured at two different time periods. The comparison shows visible differences in the greenery between the two periods. Initially, the area has smaller trees and less dense foliage. In the later images, the trees appear more mature and fuller, indicating growth and increased leaf density, which contributes to a lusher streetscape. Additionally, the vegetation in the median strips and along the sidewalks seems to be better maintained, suggesting an enhancement in the overall greenery management. This qualitative assessment of the vegetative growth and maintenance suggests a positive change in the greenery of the area. Therefore, based on the visual evidence from the images provided, the choice would be: A: Positive. |
| Answer SQ-GPT | From the images you’ve provided, it’s evident that there have been changes in the greenery between the two periods. In the earlier images, the trees appear less mature and the foliage is sparser, while in the latter images, the trees show more growth, with denser canopies, indicating positive development in the greenery. Additionally, the bushes and the underplanting in the median strips and along the sidewalks seem to be better maintained and more abundant in the later images. This suggests a concerted effort to enhance the urban green spaces. These improvements contribute to a healthier, more aesthetically pleasing environment and potentially better air quality for the area. Thus, it is a positive change (Option A). |
| Answer LLaVA-1.5 | Upon analyzing the images from the two different periods, the following observations can be made: The tree canopies seem consistent in size and density, indicating that the trees are mature and have been maintained. There is no significant removal or reduction of trees or plants. The color and vigor of the greenery appear similar across both periods, suggesting good health. No major landscaping additions or enhancements are visible that would suggest an intentional effort to increase green spaces. Considering these points, it can be concluded that there have been no significant changes in the greenery between the two periods depicted in the images. The urban greenery maintenance appears to be stable. Therefore, the assessment is: C: No Changes. |
Disclaimer/Publisher’s Note: The statements, opinions and data contained in all publications are solely those of the individual author(s) and contributor(s) and not of MDPI and/or the editor(s). MDPI and/or the editor(s) disclaim responsibility for any injury to people or property resulting from any ideas, methods, instructions or products referred to in the content. |
© 2023 by the authors. Licensee MDPI, Basel, Switzerland. This article is an open access article distributed under the terms and conditions of the Creative Commons Attribution (CC BY) license (http://creativecommons.org/licenses/by/4.0/).
Copyright: This open access article is published under a Creative Commons CC BY 4.0 license, which permit the free download, distribution, and reuse, provided that the author and preprint are cited in any reuse.
Submitted:
22 November 2023
Posted:
23 November 2023
You are already at the latest version
Alerts
A peer-reviewed article of this preprint also exists.
This version is not peer-reviewed
Submitted:
22 November 2023
Posted:
23 November 2023
You are already at the latest version
Alerts
Abstract
Estimating Visual Quality of Street Space (VQoSS) is pivotal for urban design, environmental sustainability, civic engagement, etc. Recent advancements, notably in deep learning, have enabled large-scale analysis. However, traditional deep learning approaches are hampered by extensive data annotation requirements and limited adaptability across diverse VQoSS tasks. Multimodal Large Language Models (MLLMs) have recently demonstrated proficiency in various computer vision tasks, positioning them as promising tools for automated VQoSS assessment. In this paper, we pioneer the application of MLLMs to VQoSS change estimation, with our empirical findings affirming their effectiveness. In addition, we introduce Street Quality GPT (SQ-GPT), a model that distills knowledge from the current most powerful but inaccessible (not free) GPT-4, requiring no human efforts. SQ-GPT approaches GPT-4’s performance and is viable for large-scale VQoSS change estimation. In a case study of Nanjin, we showcase the practicality of SQ-GPT and knowledge distillation pipeline. Our work promises to be a valuable asset for future urban studies research.
Keywords:
Subject: Computer Science and Mathematics - Artificial Intelligence and Machine Learning
1. Introduction
Urban landscapes, encompassing a tapestry of streets, parks, and public squares, are more than mere channels of movement; they are the lifeblood of city vibrancy and communal interaction. Within this urban fabric, the aesthetic, functional, and social dimensions of street spaces emerge as pivotal to public well-being and community cohesion [1]. They are not just static structures but vibrant stages where the urban narrative unfolds over time. The temporal evolution of street spaces is critical to understanding and fostering urban vitality, as they are the sites where the past converses with the present and shapes the future [2]. This recognition has sparked a series of urban design initiatives [3], underscoring the global movement towards enhancing the Visual Quality of Street Space (VQoSS) [4].
The concept of VQoSS is not a contemporary invention. Its origin can be traced back to the advocacy for community-centric urban design in the mid-20th century [5]. Despite their contributions, historical limitations in data collection confined such research to the realm of small-scale studies, impeding the development of empirically grounded urban design principles that could be applied broadly. Urban planners face the complex challenge of estimating VQoSS changes as they endeavor to shape environments that align with human experiences amid the continuous progression of urban development [6].
In an era where technological advancements have revolutionized data accessibility and analytical capabilities, tools like Geographic Information Systems (GIS) for street-view images [7,8], remote sensing technologies [9,10], and deep learning based methods [11,12] present new opportunities for comprehensive urban analysis. They introduce a refined methodology for evaluating the visual quality of street spaces, both in their current state and across temporal shifts, quantifying and analyzing the temporal changes of VQoSS with unprecedented precision. By leveraging image processing and machine learning, we can dissect the physical and perceived visual qualities of urban thoroughfares, even applying our techniques to the storied alleyways of historic districts. People can examine the past, present, and potential futures of urban streets, laying the groundwork for methodologies that blend tradition with innovation in pursuit of urban spaces that are not only functional but also inviting.
Previous works [4,13,14] incorporate the ability of deep learning in computer vision, offering solutions for a variety task of VQoSS. However, current deep learning technologies face several limitations. One of the primary challenges is the inherent difficulty in capturing the subjective elements of aesthetics and social vibrancy that constitute the essence of street quality. Moreover, deep learning models require vast amounts of labeled data to learn effectively [15,16]. The labor-intensive process of gathering and annotating temporal visual data from urban environments can be prohibitive, often resulting in models that may not generalize well across different cities or cultural contexts [17]. Lastly, environmental and seasonal variations, along with the dynamic nature of urban life, introduce a level of complexity that deep learning models, with their need for stable and consistent patterns, struggle to accommodate. It seems that only using vision-related technology can not satisfy the real-world demands of VQoSS tasks [18]. This leads to a question: Can we design a method that can efficiently and accurately realize the large-scale VQoSS change estimation tasks without any manual annotation?
Recently, Large Language Models (LLMs) [19,20] have shown their power in a variety of complex language understanding and generation tasks, fundamentally altering the landscape of natural language processing. These models, trained on expansive corpora of text, excel at grasping the nuances of human language, from writing and summarizing articles to generating coherent and contextually relevant text. This ability has been further extended to Multimodal Large Language Models (MLLMs) [21], achieving outstanding accomplishments. Models like GPT-4 [22] can now not only understand and generate text but also interpret and analyze visual data. This integration of vision and language processing enables them to provide answers to questions about the content of images, effectively bridging the gap between visual perception and linguistic expression [23,24]. By processing and understanding complex visual scenes, these models can identify objects, recognize patterns, and even infer emotions or actions depicted in images [24,25,26]. We can directly use them for the purpose of VQoSS estimation. Although GPT-4 is powerful, using its API is expensive [27], and its structure is still unknown, which makes it impossible for large-scale VQoSS change estimation.
In this study, we investigate the potential for automating the estimation of VQoSS changes using street-view imagery and MLLMs. Our analysis is centered on the urban center of Nanjing, China. We collected a dataset of 10,598 data points along main thoroughfares, capturing images from four cardinal directions (0°, 90°, 180°, and 270°) at each location for two different periods. We also set 9 different VQoSS change evaluation tasks to quantify the performance of MLLMs. Our findings indicate that models such as GPT-4 exhibit remarkable proficiency in discerning temporal street variations for VQoSS evaluation. Moreover, as GPT-4 is not free in use, in order to reduce the cost for large-scale estimation, we introduce the Street Quality GPT (SQ-GPT) for VQoSS change estimation, which can efficiently distill [28,29] GPT-4’s knowledge. Through rigorous experimentation, we demonstrate that the performance of SQ-GPT is close to GPT-4, validating its utility as a cost-effective instrument for large-scale urban street quality surveillance.
We summarized our contributions as follows: (1) Our study pioneers the integration of MLLMs into the automation process for estimating changes in the VQoSS, offering a significant tool for urban research advancements. (2) We have identified 9 critical VQoSS tasks and have rigorously evaluated the effectiveness of MLLMs through both quantitative measures and qualitative analysis. (3) We introduce SQ-GPT, an innovative model that demonstrates performance on par with GPT-4, providing an alternative for large-scale VQoSS estimation tasks.
2. Related Works
2.1. Visual Quality of Street Space
The requirements to quantify the VQoSS changes in urban spaces date back to the latter half of the 20th century. Pioneering works [5] emphasized the importance of street life and social interactions in urban spaces. They underscored the need for empirical studies to connect physical appearance with social attributes. Early efforts were largely qualitative due to the challenges of quantitative data collection over large areas [30].
In the end of last century, there seems to be a shift towards more systematic methodologies for assessing the visual quality of street spaces [31,32]. Researchers began employing a mix of subjective assessments, systematic observations, and technological advancements such as GIS [33] for more objective measurements. Studies offered structured approaches to evaluate the physical and perceptual dimensions of urban spaces. Recent years have marked the introduction of advanced technologies into the realm of urban space assessment. The utilization of Street View Imagery (SVI) [7,34,35] and deep learning algorithms [4,13,14,36], for instance, has allowed for large-scale quantitative analyses [37]. This integration has propelled the field from qualitative descriptions to data-driven, automated evaluations, as evidenced in works [38] that leveraged SVI for extensive urban analysis [39].
Tang and Long [4] built upon this progression by offering a comprehensive methodology that combines physical and perceived evaluations of visual quality using machine learning (SegNet [40]), GIS analysis, and systematic user-based assessments. Their work stands at the intersection of urban planning, computer science, and psychology, showcasing a multifaceted approach to understanding the temporal dynamics of street space quality in historical areas like Beijing’s Hutongs. The current trajectory of research suggests a continuous refinement of methodologies with an increasing emphasis on integrating user perceptions and technological sophistication [1,7]. Upcoming studies will likely focus on enhancing the objectivity in measuring visual quality [41,42], fine-tuning algorithmic approaches [43], and incorporating real-time data to capture the ever-evolving nature of urban spaces [44]. This evolution reflects a broader trend in urban planning towards smart, data-informed decision-making that prioritizes both the physical attributes and the experiential qualities of urban environments. Although previous studies have achieved promising results, large-scale estimation of VQoSS changes is still labor-intensive. Especially methods based on deep learning, their accuracy requires a large amount of data annotation.
2.2. Multimodal Large Language Models
In recent years, the field of multimodal learning [21,45] has experienced rapid development, with researchers striving to construct artificial intelligence models capable of comprehending and generating multiple types of data, including text, images, videos, and more. In this section, we provide a concise overview of the relevant literature that informs our work.
To empower LLMs with the ability to interpret images and engage in user interactions based on visual inputs, a multitude of methods have emerged. These methods aim to establish connections between frozen visual encoders and LLMs while keeping the number of trainable parameters minimal. Prominent approaches in this category encompass BLIP-2 [23], InstructBLIP [46], LLaMA-Adapter [47], LLaMA-Adapter V2 [48], LLaVA [25], MiniGPT-4 [26], MultiModal-GPT [49], and PandaGPT [50]. These models introduce additional trainable parameters between the frozen image encoder (or multimodal encoder in the case of PandaGPT) and the LLMs. For instance, BLIP-2 [23] utilizes a lightweight Transformer (Q-Former) as a bridge between the image encoder and the LLMs. LLaMA-Adapter and LLaMA-Adapter V2 introduce adaptation prompts that are pre-added to higher converter layer inputs, along with new teaching cues injected into LLaMA via a zero-gated zero-initial attention mechanism. MultiModal-GPT leverages low-rank adapters (LoRA) [51] for efficient fine-tuning of OpenFlamingo [52]. MiniGPT-4 and LLaVA simply add Linear layers between the frozen visual encoder and frozen LLMs.
A critical objective in developing LLMs is to ensure that they produce coherent and extended natural language responses, enabling more human-like conversations. Multimodal instruction tuning [53] is a widely adopted technique in this regard. LLaVA [25] is the first attempt to use pure language GPT-4 [22] to generate multimodal language-image instructions following data. They are based on the captions and bounding boxes on the COCO dataset [54]. InstructBLIP [46] and MultiModal GPT [49] also proposed to match the corresponding image descriptions to create instruction fine-tuning data. Using these data, LLMs are trained, resulting in a significant improvement in dialogue performance. However, LLaMA-Adapter v2 [47] and MiniGPT4 [26] only use ready-made image captioning datasets for multimodal instruction tuning, potentially resulting in relatively weak image understanding capabilities. Therefore, it is crucial to curate diverse datasets that cover various tasks and scenarios, providing rich contextual information to support the model in deep reasoning. If the examples in the dataset are too single or simple, the model may learn to produce short and uninformative responses. In summary, high-quality instruction following data is pivotal for enabling effective conversations [53,55].
MLLMs have demonstrated a formidable capacity in bridging various modes of human communication and understanding. These models are adept at processing multiple data types, paving the way for innovative applications across diverse fields. This is particularly evident in tasks involving the VQoSS, where the application of MLLMs is especially critical. The visual quality of street spaces not only impacts the quality of life for residents but is also intricately linked to urban planning and sustainable development. Traditionally, assessing the visual quality of street spaces relies on manual annotations and subjective evaluations, a process that is both time-consuming and inefficient. Against this backdrop, the introduction of MLLMs, such as GPT-4 [22], to automate the assessment of street space visual quality is revolutionary. Firstly, by analyzing street view images from different time periods, MLLMs can identify and track urban features that change over time, offering insights into the evolving visual quality of street spaces. Secondly, MLLMs are capable of processing and integrating data from various sources, such as GIS data, social media inputs, and urban planning records, to provide a more comprehensive assessment of street space visual quality. Additionally, the integration of MLLMs helps to overcome the limitations of subjective evaluations, yielding more objective and consistent assessment results.
Currently, GPT-4 stands as one of the most powerful MLLMs, albeit accessible only through its official API and associated with high costs in large-scale applications. Therefore, we have introduced the SQ-GPT model, which achieves near GPT-4 performance through efficient knowledge distillation. The development of SQ-GPT not only signifies wider accessibility and reduced costs but also represents a more effective use of advanced MLLMs technology in the VQoSS domain. It supports urban planning and community development with data-driven insights, ushering in a new chapter for sustainable urban development.
3. Data and Method
3.1. Data
3.1.1. Data Collection
Our dataset is acquired from Baidu Street View and encompasses a total of 10,598 data points from the center of Nanjing, Gulou district, with each point paired with corresponding geographical coordinates. Figure 1 depicts our study area, the Gulou District of Nanjing. The Gulou District of Nanjing is a vital administrative region situated in the center of Nanjing City, Jiangsu Province. It covers an area of approximately 56.57 square kilometers and has a permanent resident population of about 940,400. Geographically, the district is bordered by the Yangtze River to the north, Qinhuai River to the south, Qinhuai and Pukou districts to the east, Xuanwu and Jianye districts to the south, and is adjacent to Yuhuatai District to the west and Qixia District to the north. As the core area of the city, Gulou District boasts a wealth of historical and cultural heritage, such as the Drum Tower and the Confucius Temple, and serves as Nanjing’s center for commerce, culture, and tourism, with multiple commercial districts and cultural institutions. It offers convenient transportation with several subway lines and major roads running through it. In terms of education, the district houses numerous universities and research institutions, making it one of the most concentrated areas of scientific and technological resources in China. The Gulou District also enjoys Nanjing’s 11-kilometer prime Yangtze River coastline, features diverse terrain, and has a distinct four-season climate, marking it as a region with a long history and profound cultural heritage.
This dataset captures images from two different periods: the previous period, denoted as p, is from September 2017, and the latter period, denoted as l, is from September 2020. In both periods, we collected four images per data point, corresponding to the four cardinal directions (0°, 90°, 180°, and 270°). Therefore, we refer to our dataset as , and an individual image within this dataset is represented by , where d stands for the direction, i is the data point index, and s indicates the time period (either p or l). We show a sample of our collection in Figure 2.
To progress with our method and evaluation pipeline, we randomly selected approximately 10% (1,060) of the data points from our dataset to distill knowledge via GPT-4. We denote these split data as . For the purpose of user evaluation, we further randomly chose 200 data points from the remaining dataset to quantify and compare the performance between GPT-4 and our developed model, SQ-GPT.
3.1.2. Estimation Settings
In Figure 3, it can be observed that our pipeline comprises 4 distinct categories, encompassing a total of 9 individual tasks () designed for estimating VQoSS changes. These tasks serve as pivotal criteria for quantifying these changes, providing a comprehensive assessment. For each task, we set three levels of evaluation results: A: Positive Changes, B: Negative Changes, and C: No Changes. Our definitions for these tasks draw inspiration from the work of [4] (some samples are showing in Figure 4), and we elaborate on their specific definitions as follows (we make a concise definition so that models can use them as prompt efficiently during questioning):
Task A: Facade Color. In this task, the focus is on assessing the color schemes used on building facades along a street. It involves evaluating the aesthetic and visual appeal of the colors employed and considering any changes or improvements to enhance the overall quality of the street space.
Task B: Facade Material or Decoration. Task B revolves around evaluating and potentially modifying the materials or decorative elements used in building facades within the street environment. The aim is to enhance the visual and tactile qualities of facades, potentially by introducing new materials or decorations that contribute to the overall street space quality.
Task C: Road Damage. This task refers to any defects or deterioration in the street surface, such as potholes, cracks, rutting, weathering, surface defects, and debris, which impair both the functionality and the appearance of the roadway.
Task D: Lane Refinement. Task G involves assessing and refining the layout and design of lanes within the street. This may include modifications to lane width, markings, or traffic flow to enhance safety, traffic management, and overall street quality.
Task E: Signboards. In this task, the emphasis is on evaluating and optimizing the presence and design of signboards within the street space. This may involve assessing the placement, size, and aesthetics of signboards to improve the overall quality and functionality of the street.
Task F: Surrounding greenery and Facilities Construction. In Task I, the scope extends beyond the street itself to encompass the construction and improvement of greenery and facilities in the surrounding area. This can include parks, plazas, or other amenities that contribute to the quality and attractiveness of the street space and its immediate surroundings.
Task G: Parking Improvement. Task E focuses on evaluating and implementing improvements to parking facilities within the street area. This includes considerations for parking space design, accessibility, and any enhancements that can contribute to the overall quality of the street space.
Task H: Street Furniture Increases. In Task F, the objective is to check the quantity and quality of street furniture. This may involve adding benches, lighting fixtures, waste bins, or other elements that improve the comfort and usability of the street space.
Task I: Greenery Improvement. Task H focuses on evaluating and enhancing the presence of greenery, such as trees, shrubs, or plantings, within the street environment. The goal is to improve aesthetics, air quality, and the overall ambiance of the street.
Each of these tasks is associated with a distinctive question that necessitates a MLLM to provide an answer. Our objective is for the MLLM to effectively discern the differences between images captured during two periods p and l. The question format for each task adheres to the following structure:
where D is the description of input images as "The first four images are street view images taken from four different directions of the street. The last four images are taken from the same location and the same four directions but at a different period." T is the task defined above and C is a multiple choice question as "and finally you must give me a choice from: A: Positive B: Negative, C: No Changes. Make your statement concise". We also demonstrate a sample of question and answer in Table 1.
3.2. Overview of Our Pipeline
The architecture of our pipeline is illustrated in Figure 5. Initially, we distill knowledge from GPT-4 by inputting street-view images from a data point along with corresponding prompts and questions to elicit high-quality answers. This procedure is applied across all 1,060 split data points, generating a new dataset to fine-tune our own model. SQ-GPT comprises a frozen image encoder, a frozen QFormer [23] for image-to-text alignment, a Linear plus Reduction stage for additional refinement, and a frozen LLMs framework for the final answer output. The fine-tuning process is informed by insights drawn from GPT-4, ensuring that the output of SQ-GPT is improved by the distilled knowledge. We provide a detailed description of each component in the subsequent sections.
3.3. Knowledge Distillation From GPT-4
We utilize the GPT-4 API for distillation processes to generate a new dataset for the fine-tuning of our model. Table 1 presents a sample that illustrates the generation pipeline. It can be observed that GPT-4 can describe the details of input images and compare two periods from multiple aspects.
We sequentially feed GPT-4 four images from a data point’s period p, aligned at 0°, 90°, 180°, and 270°. This is followed by four images from period l in the same input order. Subsequently, for a given task, the pertinent question formulated in Equation 1 is inputted (Note that we also set the definition of the corresponding task as the input prompt). To augment the dataset with a diverse set of question-answer pairs, we adjust the temperature to 0.1 and perform iterations of answer generation, ensuring consistency in the choices for a particular data point in a certain task. We employ GPT-4 configured with an 8k token context length. The pricing structure is as follows: $ 0.03 per 1K tokens for input and $ 0.06 per 1K tokens for output. Our calculations indicate that generating a single question-answer pair costs approximately $ 0.07. This cost becomes prohibitive for large-scale operations, underlining the importance and economic value of our research.
For a better understanding, we formulated the generation of new data set as:
where ∮ stands the input images in order for period and direction of a data point, ∫ is the repeat generation for k times, I is the data point number in split , represent all images for a data point, and t is the index for all tasks T.
contains 47,700 data triads, each consisting of image sequences, corresponding questions, and high quality answers. This rich dataset will be instrumental in the fine-tuning process of our model, SQ-GPT. The fine-tuning will be executed with a specific focus on improving the model’s ability to understand and generate contextually relevant responses based on sequential visual inputs, to achieve knowledge distillation of GPT-4.
3.4. SQ-GPT
As depicted in Figure 5’s lower branch, our SQ-GPT is trained in an end-to-end manner. To commence this process, we employ a frozen image encoder , which extracts image features from all images , corresponding to a given data point i. This process can be succinctly described as follows:
where h and w represent the spatial dimensions of the image features obtained after encoding, while c stands for the feature dimension. During this stage, we independently process the previous four images and the later four images. We stack them in the same period order and direction order as outlined in the GPT-4 distillation 3.3.
Next, we leverage a frozen QFormer architecture (shown in Figure 6), as introduced [23], to facilitate image-text alignment. The choice of QFormer is crucial in our approach, as it excels in capturing intricate dependencies between textual and visual information, enabling us to establish a more robust and meaningful connection between the two modalities. This alignment step is fundamental to the overall effectiveness of our method, as it forms the basis for subsequent fusion and comprehension of image and text data. Except the learned queries in the original QFormer, we add a set of learnable queries for better ability of alignment of image and text. Thus, the calculation of QFormer is as follows:
where each image feature of serves as K and V in cross-attention [56]. is a trainable simple one-layer Fully Connection (FC) layer that can further adjust the output features from QFormer.
After the process of image-text alignment, we further reduce the volume of each image and concatenate them as a visual token entirety as follows:
where the reduction operation takes the form of a convolution layer with stride of 2, which effectively reduces the dimensions of the features to one-fourth of their original size. The concatenation of all images is represented as , and the resulting total number of visual tokens is denoted as z. The inclusion of the reduction step serves a critical purpose: it shortens the length of visual tokens, mitigating the potential adverse effects of overly long visual tokens on the computations of a frozen LLM. The importance of this reduction step has been substantiated in a prior study [24].
Next we concatenate the visual tokens (as prefix) with text tokens encoded from question corresponding to a certain task. Then, a frozen LLM will take then as input and generate the answer. It can be formulated as follows:
The output answer of will calculate loss with one of the high quality answer . Through this knowledge distillation training, our SQ-GPT can achieve performance levels close to those of GPT-4.
4. Results
4.1. Experimental Settings
Our training pipeline is adapted from LLaVA-1.5 13B [25], with modifications that involve freezing both its image encoder and its LLM components. Additionally, we incorporate a pre-trained QFormer, sourced from BLIP-V2 [23], to enhance the capabilities of our model in handling image-text tasks. We also adopt instruction tuning as LLaMA-Adapter v2 [47] and MiniGPT4 [26] during training. Only ready-made image captioning in is utilized, and no extra tuning data [25] is needed for annotation. We train all 9 tasks together to enhance the generalization of the model. The training is completed within 1 day on a GPU server with 4 Nvidia A40.
To evaluate the performance of our SQ-GPT model and benchmark it against other models, we refer to Section 4.2 where a human-centric evaluation was conducted on 200 data points as mentioned in 3.1.1. We utilized LLaVA-1.5, SQ-GPT, and GPT-4 to generate answers for all nine tasks, employing the corresponding questions. During this process, we set the generation temperature to 0 to ensure precise and deterministic outputs. We enlisted three distinct groups of evaluators—50 laypeople, 30 architecture students, and 10 urban environment experts—to assess the quality of responses from all three models. Evaluators were instructed to cast a binary vote on whether the generated answers accurately addressed the task as defined in 3.1.2. Consequently, we define our metric of agreement based on these binary votes as follows:
where g is the group, m is the model, is the number of person in a group, and O is the number of generate answer for a certain model and task.
In Section 4.3, we also provide the visual analysis by mapping the answer results of all data point to the city map. We generate answers using SQ-GPT for all 9 tasks. The answer of A: Positive, B: Negative, and C: No Changes are translated to the value of 1, 2, and 3.
4.2. Answer Quality Analysis
As shown in Figure 7, we analyze the result for human-centric evaluation in all 9 tasks. The data compares the agreement with three models: LLaVA-1.5, SQ-GPT, and GPT-4. Across all tasks, GPT-4 consistently gains the highest agreement rates from all respondent groups, indicative of its superior performance or alignment with human judgment. Our SQ-GPT also has a performance very close to GPT-4, which verifies the effect of our knowledge distillation. In addition, laypeople demonstrate the highest levels of agreement with the models, suggesting AI outputs are more in tune with their evaluations. Conversely, experts consistently show the lowest agreement rates, which may reflect a disparity in understanding or knowledge relative to the models and other groups. LLaVA-1.5 is consistently the model with the lowest agreement rates among all respondents, hinting at it being the least accurate or aligned with human judgment. This pattern suggests that advancements in AI, as seen with GPT-4, although not perfect, are increasingly recognized by common sense.
Among all tasks, A and B seem to be difficult. Experts give a low agreement even for the most powerful GPT-4. We find the most possible reason is the brightness difference when capturing images from two periods. This difference may affect the analysis of models as they can capture the color changes without discriminating the condition of weather. Models perform well in tasks like C ("Road Damage"), G ("Parking Improvement"), and I ("Greenery Improvement"). These tasks pay more attention to some obvious visual forms and layout features, which are what deep models are good at. In general, MLLMs can complete most VQoSS tasks well and is a good means to implement urban analysis. In particular, our SQ-GPT has obtained matching performance after distilling the knowledge of GPT-4, and can be used as a tool for large-scale evaluation.
We also offer some samples of answer comparison between LLaVA-1.5, SQ-GPT, and GPT-4. However, due to the length restriction, only two samples for discriminating changes of "Road Refinement" and "Greenery Improvement" are provided in this manuscript. Referencing Table 2, we tasked the models with interpreting "Road Refinement" based on images from varying periods. The later-period images visibly display faded road markings and numerous repair patches. All models unanimously indicated deterioration with option B: Negative. GPT-4 observed "The roads show signs of heavier use," which corroborates our visual assessment. Interestingly, SQ-GPT’s analysis parallels GPT-4’s but goes a step further by considering the condition of traffic signs, stating, "Despite a consistent presence of traffic signs, the overall impression hints at a deterioration in the road’s organization." This suggests SQ-GPT’s nuanced attention to detail. LLaVA-1.5, while also noting a negative change, linked it to an uptick in transportation in the later period—an associative leap that, although not incorrect, strays from the task definition provided in 3.1.2. Such findings not only demonstrate each model’s unique approach to the analysis of visual changes but also underscore the variability in interpreting contextual information, offering valuable insights into the current capabilities and limitations of MLLMs-based image interpretation.
Referencing Table 3, we tasked the models with interpreting "Greenery Improvement" based on images from varying periods. The first set of images is taken on a sunny day, while the later set are take from the day with clouds. At first glance, there seems to be no obvious greenery improvement changes exist between images from two periods. LLaVA-1.5 analyse two periods in a very fairly good way and give an answer as C: No Changes. However, GPT-4 and our SQ-GPT give the answer as Positive changes. They all concern about "the later images, the trees appear more mature and fuller, indicating growth and increased leaf density, which contributes to a lusher streetscape". When we look closely at these two periods, we can find that the trees in the latter period are indeed more vigorous and the green of the bushes is more obvious. This shows that GPT-4’s attention is more detailed, and our model distills the knowledge of GPT-4 and obtains similar capabilities.
4.3. Visualization of VQoSS Estimation
Our analysis of tasks B, C, and E reveals a persistent blue tone, suggesting that these tasks of urban development have remained relatively stable over the past three years. While stability might imply effective management in these areas, it could also signal a lack of innovation or improvement that warrants further investigation. Task G’s "Parking Improvement" stands in stark contrast with a striking red spectrum dominating the visual data. This is a clear indicator of escalating urban congestion, primarily due to a surge in vehicle ownership. The density of parked cars has outpaced the availability of parking spaces, highlighting a critical area for urban policy intervention. The city must consider implementing multifaceted solutions, such as expanding public transportation, increasing parking infrastructure, and encouraging carpooling to alleviate parking pressures.
The evaluation of Task A presents an intricate scenario, with a balanced mix of colors denoting a complex and uncertain outcome. This color distribution suggests that the strategies employed are not yielding clear results. The task’s low agreement, referenced in Figure 7, corroborates the ineffectiveness of current efforts. This warrants a reevaluation of the task’s goals and methods to better serve the city’s interests. Other tasks reflected by green shades indicate positive strides in the city’s Visual Quality of Service Standards. These improvements are promising, demonstrating successful initiatives that enhance the city’s visual appeal and functionality. However, it is crucial to maintain this momentum with continuous monitoring and updating of urban planning strategies to ensure sustained progress.
While the overall trend points towards an improvement in the city’s visual quality, the looming shadow of increased congestion due to population growth cannot be ignored. This presents a paradox where the city is improving in visual standards while simultaneously grappling with the challenges of density and overuse of urban infrastructure. To address this, city planners and policymakers need to adopt a holistic approach. The above result analysis highlights the actual effect of our SQ-GPT on VQoSS tasks, indicating that our method is significant for future urban planning.
5. Discussion
We verified that using MLLMs, like GPT-4, which are originally designed to understand and generate human-like text, can also be adoptted to interpret visual information. When applied to the estimation of VQoSS, these models can analyze photographic or multi-aspects street-view images to assess various quality indicators such as cleanliness, state of repair, signage clarity, and overall visual appeal. The estimation of VQoSS involves evaluating these images to rate or categorize the street space’s condition and visual characteristics. This could be used for urban planning, maintenance scheduling, or to improve navigational aids by providing more detailed information about the environment. In traditional machine learning, human annotation is necessary to annotate a dataset, which the model then uses to learn and make predictions. For instance, humans might need to annotate images of streets with descriptors like "poorly maintained" or "clean" to train a model to recognize these qualities. However, with MLLMs, the AI can learn from vast amounts of unlabeled data, recognizing patterns and making inferences without explicit human-supervision. This capability is particularly advantageous because it reduces the time and resources needed to prepare data, making it easier to scale up and apply these models to large-scale tasks, such as those needed for assessing the VQoSS across different cities or regions. In addition, we can further use MLLMs with both street imagery and possibly accompanying textual data (like metadata, annotations, or descriptions) to form an assessment of the street’s visual quality, which could inform various urban development and management decisions.
A distillation pipeline is also provided aimed at enhancing cost-efficiency. Given that GPT-4 is not currently free, direct API utilization for large-scale VQoSS estimation is not feasible. Our experiments with the proposed SQ-GPT demonstrated that, after distillation, our model can achieve performance comparable to GPT-4 at a reduced cost. This allows for its application in large-scale estimation tasks across various tasks for VQoSS. As the field of MLLMs evolves rapidly, GPT-4, despite its effectiveness in numerous tasks, may be superseded in the future. Consequently, our pipeline is significant for users wishing to elevate their models to state-of-the-art MLLM technology.
The current version of SQ-GPT presents some limitations. Specifically, the integration of several frozen modules from prior research may hinder performance optimization during fine-tuning. While methodologies such as Lora [51] offer pathways for efficient training, our attempts in this direction yielded suboptimal results. Adjustments to the image encoder or LLMs adversely affected the quality of the generated answers. This could be attributed to data constraints, as the distilled dataset available for fine-tuning may be insufficient for the extensive modules in question. Addressing these issues will be a primary focus in our forthcoming research endeavors.
Furthermore, our analysis indicates that SQ-GPT’s performance in tasks such as "Facade Color" recognition is not good enough, which can be primarily attributed to the challenges posed by varying light intensities and angles during image capturing. These environmental factors can significantly alter the perceived color, leading to inaccuracies in the model’s answering. To counteract these issues, future version of the pipeline could incorporate advanced pre-processing algorithms that normalize lighting conditions or employ more sophisticated techniques for color constancy. Additionally, enhancing the dataset with a wider array of images captured under diverse lighting conditions may improve the model’s robustness to such environmental variables. By addressing these nuances, we can refine SQ-GPT’s capabilities for more accurate and reliable analysis.
An aspect for further investigation is the generalizability of SQ-GPT, as well as our entire pipeline, for estimation tasks to other city areas. Specifically, it would be valuable to assess the adaptability of our methods to diverse urban environments. The unique characteristics and data profiles of different cities may present varying challenges to the robustness and accuracy of our model. Future research should focus on the scalability of our pipeline, ensuring that it maintains high performance across a range of geographically and culturally distinct cities. This expansion could potentially lead to a more versatile and universally applicable tool for urban data analysis and planning.
6. Conclusion
In this paper, we proposed SQ-GPT, aimed at assessing the visual quality of street spaces using the capabilities of MLLMs like GPT-4. We also proposed our own model SQ-GPT which comprises several key components: an image encoder, a QFormer for aligning images with text, and a refinement stage to fine-tune the process. Through efficient knowledge distillation, SQ-GPT manages to closely mirror GPT-4’s performance while significantly cutting down on costs, thereby democratizing the technology for broader use. We utilized a dataset from Baidu Street View in Nanjing, Gulou district, capturing images from two distinct time frames to monitor changes over time.
We also assessed the model’s performance through both human-centric evaluation and visual analysis, which confirmed its effectiveness in various tasks. Nevertheless, we recognized the model’s limitations, such as the challenge of inconsistent lighting conditions affecting color recognition, and proposed future improvements, including the development of sophisticated pre-processing algorithms. In conclusion, we showed that SQ-GPT can perform on par with GPT-4 in quality assessments but at a more affordable rate, which is highly beneficial for large-scale urban planning and quality assessment projects. We also acknowledged the necessity for ongoing research to surmount the existing limitations and to boost the model’s adaptability and sturdiness across various urban settings. We believe that this paper could be a pioneer work that inspires researchers using MLLMs for the future efficient and high-quality urban planning.
Author Contributions
Conceptualization, H.L. B.W. and J.Z.; methodology, H.L. and J.Z.; software, B.W., Z.Z. and Y.L.; validation, H.L. B.W. and J.Z.; formal analysis, B.W., Z.Z. and Y.L.; investigation, B.W.; resources, H.L. and B.W.; data curation, H.L.; writing—original draft preparation, H.L.; writing—review and editing, J.Z. and B.W.; visualization, B.W.; supervision, J.Z.; project administration, J.Z.; funding acquisition, H.L. All authors have read and agreed to the published version of the manuscript.
Funding
This work is supported by Jiangxi Province Compact Residential Lot Detailed Planning and Architectural Design Research Project 2011ZBBH80014. This work also is partly supported by JSPS KAKENHI Grant Number 19K10662, 20K23343, 21K17764, and 22H03353.
Institutional Review Board Statement
Not applicable.
Informed Consent Statement
Not applicable.
Data Availability Statement
Our implementation code is available by contacting the corresponding author with a reasonable request.
Conflicts of Interest
The authors declare no conflict of interest.
References
- Mouratidis, K. Urban planning and quality of life: A review of pathways linking the built environment to subjective well-being. Cities 2021, 115, 103229. [Google Scholar] [CrossRef]
- Meyrick, K.; Newman, P. Exploring the potential connection between place capital and health capital in the post COVID-19 city. npj Urban Sustain. 2023, 3, 44. [Google Scholar] [CrossRef]
- Sharifi, A.; Khavarian-Garmsir, A.R. The COVID-19 pandemic: Impacts on cities and major lessons for urban planning, design, and management. Sci. Total Environ. 2020, 749, 142391. [Google Scholar] [CrossRef] [PubMed]
- Tang, J.; Long, Y. Measuring visual quality of street space and its temporal variation: Methodology and its application in the Hutong area in Beijing. Landsc. Urban Plan. 2019, 191, 103436. [Google Scholar] [CrossRef]
- Whyte, W.H.; others. The social life of small urban spaces; Conservation Foundation: Washington, DC, USA, 1980. [Google Scholar]
- Balogun, A.L.; Marks, D.; Sharma, R.; Shekhar, H.; Balmes, C.; Maheng, D.; Arshad, A.; Salehi, P. Assessing the potentials of digitalization as a tool for climate change adaptation and sustainable development in urban centres. Sustain. Cities Soc. 2020, 53, 101888. [Google Scholar] [CrossRef]
- Biljecki, F.; Ito, K. Street view imagery in urban analytics and GIS: A review. Landsc. Urban Plan. 2021, 215, 104217. [Google Scholar] [CrossRef]
- Wang, M.; He, Y.; Meng, H.; Zhang, Y.; Zhu, B.; Mango, J.; Li, X. Assessing street space quality using street view imagery and function-driven method: The case of Xiamen, China. ISPRS Int. J. Geo-Inf. 2022, 11, 282. [Google Scholar] [CrossRef]
- Toth, C.; Jóźków, G. Remote sensing platforms and sensors: A survey. ISPRS J. Photogramm. Remote Sens. 2016, 115, 22–36. [Google Scholar] [CrossRef]
- Cheng, G.; Xie, X.; Han, J.; Guo, L.; Xia, G.S. Remote sensing image scene classification meets deep learning: Challenges, methods, benchmarks, and opportunities. IEEE J. Sel. Top. Appl. Earth Obs. Remote Sens. 2020, 13, 3735–3756. [Google Scholar] [CrossRef]
- LeCun, Y.; Bengio, Y.; Hinton, G. Deep learning. Nature 2015, 521, 436–444. [Google Scholar] [CrossRef]
- Goodfellow, I.; Bengio, Y.; Courville, A. Deep Learning, MIT press, 2016.
- Gong, Z.; Ma, Q.; Kan, C.; Qi, Q. Classifying street spaces with street view images for a spatial indicator of urban functions. Sustainability 2019, 11, 6424. [Google Scholar] [CrossRef]
- Li, Y.; Yabuki, N.; Fukuda, T. Measuring visual walkability perception using panoramic street view images, virtual reality, and deep learning. Sustain. Cities Soc. 2022, 86, 104140. [Google Scholar] [CrossRef]
- Pan, S.J.; Yang, Q. A survey on transfer learning. IEEE Trans. Knowl. Data Eng. 2009, 22, 1345–1359. [Google Scholar] [CrossRef]
- Tan, C.; Sun, F.; Kong, T.; Zhang, W.; Yang, C.; Liu, C. A survey on deep transfer learning. In Proceedings of the Artificial Neural Networks and Machine Learning–ICANN 2018: 27th International Conference on Artificial Neural Networks, Rhodes, Greece, 4–7 October 2018; Proceedings, Part III 27. Springer, 2018; pp. 270–279. [Google Scholar]
- Aurigi, A.; Odendaal, N. From “smart in the box” to “smart in the city”: Rethinking the socially sustainable smart city in context. In Sustainable Smart City Transitions; Routledge, 2022; pp. 53–68. [Google Scholar]
- Wang, J.; Wang, X.; Shen, T.; Wang, Y.; Li, L.; Tian, Y.; Yu, H.; Chen, L.; Xin, J.; Wu, X.; others. Parallel vision for long-tail regularization: Initial results from IVFC autonomous driving testing. IEEE Trans. Intell. Veh. 2022, 7, 286–299. [Google Scholar] [CrossRef]
- Zhao, W.X.; Zhou, K.; Li, J.; Tang, T.; Wang, X.; Hou, Y.; Min, Y.; Zhang, B.; Zhang, J.; Dong, Z.; Du, Y.; Yang, C.; Chen, Y.; Chen, Z.; Jiang, J.; Ren, R.; Li, Y.; Tang, X.; Liu, Z.; Liu, P.; Nie, J.Y.; Wen, J.R. A Survey of Large Language Models. arXiv 2023, arXiv:2303.18223. [Google Scholar]
- OpenAI, n. OpenAI. "ChatGPT." 2023 https://www.openai.com/research/chatgpt.
- Yin, S.; Fu, C.; Zhao, S.; Li, K.; Sun, X.; Xu, T.; Chen, E. A Survey on Multimodal Large Language Models. arXiv 2023, arXiv:2306.13549. [Google Scholar]
- OpenAI. GPT-4 Technical Report. arXiv 2023. [Google Scholar]
- Li, J.; Li, D.; Savarese, S.; Hoi, S. Blip-2: Bootstrapping language-image pre-training with frozen image encoders and large language models. arXiv 2023, arXiv:2301.12597. [Google Scholar]
- Li, K.; He, Y.; Wang, Y.; Li, Y.; Wang, W.; Luo, P.; Wang, Y.; Wang, L.; Qiao, Y. VideoChat: Chat-Centric Video Understanding. arXiv 2023, arXiv:2305.06355. [Google Scholar]
- Liu, H.; Li, C.; Wu, Q.; Lee, Y.J. Visual Instruction Tuning. NeurIPS, 2023.
- Zhu, D.; Chen, J.; Shen, X.; Li, X.; Elhoseiny, M. MiniGPT-4: Enhancing Vision-Language Understanding with Advanced Large Language Models. arXiv 2023, arXiv:2304.10592. [Google Scholar]
- Nori, H.; King, N.; McKinney, S.M.; Carignan, D.; Horvitz, E. Capabilities of gpt-4 on medical challenge problems. arXiv 2023, arXiv:2303.13375. [Google Scholar]
- Chen, P.; Liu, S.; Zhao, H.; Jia, J. Distilling knowledge via knowledge review. In Proceedings of the IEEE/CVF Conference on Computer Vision and Pattern Recognition; 2021; pp. 5008–5017. [Google Scholar]
- Gou, J.; Yu, B.; Maybank, S.J.; Tao, D. Knowledge distillation: A survey. Int. J. Comput. Vis. 2021, 129, 1789–1819. [Google Scholar] [CrossRef]
- Wei, C.; Meng, J.; Zhu, L.; Han, Z. Assessing progress towards sustainable development goals for Chinese urban land use: A new cloud model approach. J. Environ. Manag. 2023, 326, 116826. [Google Scholar] [CrossRef] [PubMed]
- Liu, M.; Zhang, B.; Luo, T.; Liu, Y.; Portnov, B.A.; Trop, T.; Jiao, W.; Liu, H.; Li, Y.; Liu, Q. Evaluating street lighting quality in residential areas by combining remote sensing tools and a survey on pedestrians’ perceptions of safety and visual comfort. Remote Sens. 2022, 14, 826. [Google Scholar] [CrossRef]
- Ye, N.; Wang, B.; Kita, M.; Xie, M.; Cai, W. Urban Commerce Distribution Analysis Based on Street View and Deep Learning. IEEE Access 2019, 7, 162841–162849. [Google Scholar] [CrossRef]
- Li, Y.; Yabuki, N.; Fukuda, T. Integrating GIS, deep learning, and environmental sensors for multicriteria evaluation of urban street walkability. Landsc. Urban Plan. 2023, 230, 104603. [Google Scholar] [CrossRef]
- Mahabir, R.; Schuchard, R.; Crooks, A.; Croitoru, A.; Stefanidis, A. Crowdsourcing street view imagery: A comparison of mapillary and OpenStreetCam. ISPRS Int. J. Geo-Inf. 2020, 9, 341. [Google Scholar] [CrossRef]
- Zhang, J.; Yu, Z.; Li, Y.; Wang, X. Uncovering Bias in Objective Mapping and Subjective Perception of Urban Building Functionality: A Machine Learning Approach to Urban Spatial Perception. Land 2023, 12, 1322. [Google Scholar] [CrossRef]
- Wang, B.; Zhang, J.; Zhang, R.; Li, Y.; Li, L.; Nakashima, Y. Improving Facade Parsing with Vision Transformers and Line Integration. arXiv 2023, arXiv:2309.15523. [Google Scholar] [CrossRef]
- Clifton, K.; Ewing, R.; Knaap, G.J.; Song, Y. Quantitative analysis of urban form: a multidisciplinary review. J. Urban. 2008, 1, 17–45. [Google Scholar] [CrossRef]
- Zhang, J.; Fukuda, T.; Yabuki, N. Automatic generation of synthetic datasets from a city digital twin for use in the instance segmentation of building facades. J. Comput. Des. Eng. 2022, 9, 1737–1755. [Google Scholar] [CrossRef]
- Zhang, J.; Fukuda, T.; Yabuki, N. Development of a city-scale approach for façade color measurement with building functional classification using deep learning and street view images. ISPRS Int. J. Geo-Inf. 2021, 10, 551. [Google Scholar] [CrossRef]
- Badrinarayanan, V.; Kendall, A.; Cipolla, R. Segnet: A deep convolutional encoder-decoder architecture for image segmentation. IEEE Trans. Pattern Anal. Mach. Intell. 2017, 39, 2481–2495. [Google Scholar] [CrossRef] [PubMed]
- Li, X.; Li, Y.; Jia, T.; Zhou, L.; Hijazi, I.H. The six dimensions of built environment on urban vitality: Fusion evidence from multi-source data. Cities 2022, 121, 103482. [Google Scholar] [CrossRef]
- Koo, B.W.; Guhathakurta, S.; Botchwey, N. How are neighborhood and street-level walkability factors associated with walking behaviors? A big data approach using street view images. Environ. Behav. 2022, 54, 211–241. [Google Scholar] [CrossRef]
- Hoffmann, E.J.; Wang, Y.; Werner, M.; Kang, J.; Zhu, X.X. Model fusion for building type classification from aerial and street view images. Remote Sens. 2019, 11, 1259. [Google Scholar] [CrossRef]
- Gebru, T.; Krause, J.; Wang, Y.; Chen, D.; Deng, J.; Aiden, E.L.; Fei-Fei, L. Using deep learning and Google Street View to estimate the demographic makeup of neighborhoods across the United States. Proc. Natl. Acad. Sci. USA 2017, 114, 13108–13113. [Google Scholar] [CrossRef]
- Baltrušaitis, T.; Ahuja, C.; Morency, L.P. Multimodal machine learning: A survey and taxonomy. IEEE Trans. Pattern Anal. Mach. Intell. 2018, 41, 423–443. [Google Scholar] [CrossRef] [PubMed]
- Dai, W.; Li, J.; Li, D.; Tiong, A.M.H.; Zhao, J.; Wang, W.; Li, B.; Fung, P.; Hoi, S. InstructBLIP: Towards General-purpose Vision-Language Models with Instruction Tuning. arXiv 2023, arXiv:2305.06500. [arXiv:cs.CV/2305.06500]. [Google Scholar]
- Zhang, R.; Han, J.; Zhou, A.; Hu, X.; Yan, S.; Lu, P.; Li, H.; Gao, P.; Qiao, Y. LLaMA-Adapter: Efficient Fine-tuning of Language Models with Zero-init Attention. arXiv 2023, arXiv:2303.16199. [Google Scholar]
- Gao, P.; Han, J.; Zhang, R.; Lin, Z.; Geng, S.; Zhou, A.; Zhang, W.; Lu, P.; He, C.; Yue, X.; Li, H.; Qiao, Y. LLaMA-Adapter V2: Parameter-Efficient Visual Instruction Model. arXiv 2023, arXiv:2304.15010. [Google Scholar]
- Gong, T.; Lyu, C.; Zhang, S.; Wang, Y.; Zheng, M.; Zhao, Q.; Liu, K.; Zhang, W.; Luo, P.; Chen, K. 2023; arXiv:2305.04790.
- Su, Y.; Lan, T.; Li, H.; Xu, J.; Wang, Y.; Cai, D. PandaGPT: One Model To Instruction-Follow Them All. arXiv 2023, arXiv:2305.16355. [Google Scholar]
- Hu, E.J.; Shen, Y.; Wallis, P.; Allen-Zhu, Z.; Li, Y.; Wang, S.; Wang, L.; Chen, W. LoRA: Low-Rank Adaptation of Large Language Models. International Conference on Learning Representations, 2022.
- Awadalla, A.; Gao, I.; Gardner, J.; Hessel, J.; Hanafy, Y.; Zhu, W.; Marathe, K.; Bitton, Y.; Gadre, S.; Sagawa, S.; Jitsev, J.; Kornblith, S.; Koh, P.W.; Ilharco, G.; Wortsman, M.; Schmidt, L. OpenFlamingo: An Open-Source Framework for Training Large Autoregressive Vision-Language Models. arXiv 2023, arXiv:2308.01390. [Google Scholar]
- Xu, Z.; Shen, Y.; Huang, L. Multiinstruct: Improving multi-modal zero-shot learning via instruction tuning. arXiv 2022, arXiv:2212.10773. [Google Scholar]
- Lin, T.Y.; Maire, M.; Belongie, S.; Hays, J.; Perona, P.; Ramanan, D.; Dollár, P.; Zitnick, C.L. Microsoft coco: Common objects in context. In Proceedings of the Computer Vision–ECCV 2014: 13th European Conference, Zurich, Switzerland, 6–12 September 2014; Proceedings, Part V 13. Springer, 2014; pp. 740–755. [Google Scholar]
- Mukherjee, S.; Mitra, A.; Jawahar, G.; Agarwal, S.; Palangi, H.; Awadallah, A. Orca: Progressive learning from complex explanation traces of gpt-4. arXiv 2023, arXiv:2306.02707. [Google Scholar]
- Vaswani, A.; Shazeer, N.; Parmar, N.; Uszkoreit, J.; Jones, L.; Gomez, A.N.; Kaiser, Ł.; Polosukhin, I. Attention is all you need. Adv. Neural Inf. Process. Syst. 2017, 30. [Google Scholar]
Figure 1.
Research area of this study. All data point are collected from Gulou district (d), Nanjing (c), Jiangsu province (b), China (a).
Figure 1.
Research area of this study. All data point are collected from Gulou district (d), Nanjing (c), Jiangsu province (b), China (a).
Figure 2.
The study area’s specific location at Longitude 118.7490° E, Latitude 32.0869° N has street view images from 2017 and 2020 in all four cardinal directions.
Figure 2.
The study area’s specific location at Longitude 118.7490° E, Latitude 32.0869° N has street view images from 2017 and 2020 in all four cardinal directions.
Figure 3.
The settings for VQoSS evaluation. We totally defined 4 categories and 9 tasks for the VQoSS evaluation. These tasks can comprehensively evaluate street visual quality.
Figure 3.
The settings for VQoSS evaluation. We totally defined 4 categories and 9 tasks for the VQoSS evaluation. These tasks can comprehensively evaluate street visual quality.
Figure 4.
Samples for 9 tasks of VQoSS changes evaluation.
Figure 5.
Overview of our proposed SQ-GPT. In the upper part, we first distill the knowledge in GPT-4 through split data points and generate a new dataset . Then, in the lower part, we fine-tune our SQ-GPT by the supervision of high-quality answers from GPT-4.
Figure 5.
Overview of our proposed SQ-GPT. In the upper part, we first distill the knowledge in GPT-4 through split data points and generate a new dataset . Then, in the lower part, we fine-tune our SQ-GPT by the supervision of high-quality answers from GPT-4.
Figure 6.
The inference pipeline of a frozen QFormer. It is a N time transformer [56] blocks and we adopted a learnable query besides the original learned query.
Figure 6.
The inference pipeline of a frozen QFormer. It is a N time transformer [56] blocks and we adopted a learnable query besides the original learned query.
Figure 7.
Human-centric evaluation among LLaVA-1.5, SQ-GPT, and GPT-4. We adopt the agreement testing for 200 data points and all 9 tasks. We employed three groups of people (50 laypeople, 30 architecture students, and 10 urban environment experts) for the quantitative evaluation.
Figure 7.
Human-centric evaluation among LLaVA-1.5, SQ-GPT, and GPT-4. We adopt the agreement testing for 200 data points and all 9 tasks. We employed three groups of people (50 laypeople, 30 architecture students, and 10 urban environment experts) for the quantitative evaluation.
Figure 8.
Visualizations on a city map for all 9 VQoSS tasks. We use green point, red point, and blue point to represent positive changes, negative changes, and no changes, respectively. Sub-figure (a–j), (a) Facade Color; (b) Facade Material or Decoration.; (c) Road Damage; (d) Lane Refinement; (e) Signboards; (f) Surrounding greenery and Facilities Construction; (g) Parking Improvement; (h) Street Furniture Increases; (i) Greenery Improvement.
Table 1.
To show how we distill knowledge from GPT-4, we demonstrate an answer sample from GPT-4 in discriminating the color of the facade. We input four direction images of a data point for previous and later periods, respectively. Then, we ask GPT-4 to describe the color difference between two periods and select a choice from the given options.
| Visual Input Example, Question for "Facade Color" | |
|---|---|
|
|
| Question | The first four images are street view images taken from four different directions of the street. The last four images are taken from the same location and the same four directions but at a different period. Analyze the facade color changes of different periods and finally you must give me a choice from: A: Positive, B: Negative, C: No Changes. Make your statement concise. |
| Answer | Based on the provided images, we can observe the following changes in the building facades’ color over the two different time periods. Initial Period (First Four Images): The building facades are predominantly neutral-toned with a mix of whites, beiges, and light gray hues. The overall color palette is muted and uniform, with little variation in color saturation or brightness. The buildings have a clean and modern appearance, with the color of the construction materials clearly visible. Later Period (Last Four Images): The facades exhibit a similar color scheme with no significant changes in the hues. However, there may be slight variations in brightness due to differences in the time of day or weather conditions when the photos were taken. There is no evidence of major renovation or repainting that has altered the color palette of the buildings significantly. Considering these observations, the most accurate response would be: C: No Changes. . |
Table 2.
Comparison of answer samples among LLaVA-1.5, SQ-GPT, and GPT-4 for the question of discriminating changes of "Road Refinement".
Table 2.
Comparison of answer samples among LLaVA-1.5, SQ-GPT, and GPT-4 for the question of discriminating changes of "Road Refinement".
| Visual Input Comparison Examples, Question for "Lane Refinement" | |
|---|---|
| Question | |
| {D} + "Describe changes in road refinement between two periods." + {C} | |
| Answer GPT-4 | After reviewing the images from two different periods, it is noticeable that there has been some wear in the road markings and a general decline in lane visibility in the later images. The roads show signs of heavier use, and the increased clutter along the curbside could suggest changes in traffic or parking patterns that may not be as orderly as before. These factors contribute to a slight negative impact on lane refinement, indicating a decrease in the clarity and maintenance of traffic lanes over time. Hence, the assessment concludes with a negative change in lane refinement. Therefore, my feeling towards these changes would be option B: Negative. |
| Answer SQ-GPT | It’s evident that lane refinement has seen a decline over time. Initially, clear lane markings in the first period have become less discernible in the second, likely as a result of wear and inadequate maintenance. This degradation in lane visibility can have serious implications, potentially compromising lane divisions’ clarity and introducing confusion among drivers. Despite a consistent presence of traffic signs, the overall impression hints at a deterioration in the road’s organization. Taking these factors into account, it becomes increasingly apparent that the changes in lane refinement lean towards a negative impact, aligning with Option B: Negative. |
| Answer LLaVA-1.5 | The changes in lane refinement between the two periods are evident in the increased number of cars on the street, which suggests that the area is more congested. I feel that the changes in lane refinement are negative, as the increased number of cars on the street indicates a higher level of traffic congestion. This can lead to longer travel times, increased air pollution, and a higher risk of accidents. The increased traffic can also be a sign of urbanization and economic growth, which is a positive aspect of the city’s development. However, the negative impacts on the environment and the quality of life for the residents must be considered. The final option is B. |
Table 3.
Comparison of answer samples among LLaVA-1.5, SQ-GPT, and GPT-4 for the question of discriminating changes of "Greenery Improvement"".
Table 3.
Comparison of answer samples among LLaVA-1.5, SQ-GPT, and GPT-4 for the question of discriminating changes of "Greenery Improvement"".
| Visual Input Comparison Examples, Question for "Greenery Improvement" | |
|---|---|
| Question | |
| {D} + "Describe changes in greenery improvement between two periods." + {C} | |
| Answer GPT-4 | Upon examining the eight street view images you provided, they depict the same location from four cardinal directions, captured at two different time periods. The comparison shows visible differences in the greenery between the two periods. Initially, the area has smaller trees and less dense foliage. In the later images, the trees appear more mature and fuller, indicating growth and increased leaf density, which contributes to a lusher streetscape. Additionally, the vegetation in the median strips and along the sidewalks seems to be better maintained, suggesting an enhancement in the overall greenery management. This qualitative assessment of the vegetative growth and maintenance suggests a positive change in the greenery of the area. Therefore, based on the visual evidence from the images provided, the choice would be: A: Positive. |
| Answer SQ-GPT | From the images you’ve provided, it’s evident that there have been changes in the greenery between the two periods. In the earlier images, the trees appear less mature and the foliage is sparser, while in the latter images, the trees show more growth, with denser canopies, indicating positive development in the greenery. Additionally, the bushes and the underplanting in the median strips and along the sidewalks seem to be better maintained and more abundant in the later images. This suggests a concerted effort to enhance the urban green spaces. These improvements contribute to a healthier, more aesthetically pleasing environment and potentially better air quality for the area. Thus, it is a positive change (Option A). |
| Answer LLaVA-1.5 | Upon analyzing the images from the two different periods, the following observations can be made: The tree canopies seem consistent in size and density, indicating that the trees are mature and have been maintained. There is no significant removal or reduction of trees or plants. The color and vigor of the greenery appear similar across both periods, suggesting good health. No major landscaping additions or enhancements are visible that would suggest an intentional effort to increase green spaces. Considering these points, it can be concluded that there have been no significant changes in the greenery between the two periods depicted in the images. The urban greenery maintenance appears to be stable. Therefore, the assessment is: C: No Changes. |
Disclaimer/Publisher’s Note: The statements, opinions and data contained in all publications are solely those of the individual author(s) and contributor(s) and not of MDPI and/or the editor(s). MDPI and/or the editor(s) disclaim responsibility for any injury to people or property resulting from any ideas, methods, instructions or products referred to in the content. |
© 2023 by the authors. Licensee MDPI, Basel, Switzerland. This article is an open access article distributed under the terms and conditions of the Creative Commons Attribution (CC BY) license (http://creativecommons.org/licenses/by/4.0/).
Copyright: This open access article is published under a Creative Commons CC BY 4.0 license, which permit the free download, distribution, and reuse, provided that the author and preprint are cited in any reuse.
Google Street View and Machine Learning—Useful Tools for a Street-Level Remote Survey: A Case Study in Ho Chi Minh, Vietnam and Ichikawa, Japan
Duy Ta
et al.
Land,
2022
Quantifying Ecological Landscape Quality of Urban Street by Open Street View Images: A Case Study of Xiamen Island, China
Dongxin Wen
et al.
Remote Sensing,
2022
People Flow Trend Estimation Approach and Quantitative Explanation Based on the Scene Level Deep Learning of Street View Images
Chenbo Zhao
et al.
Remote Sensing,
2023


MDPI Initiatives
Important Links
© 2024 MDPI (Basel, Switzerland) unless otherwise stated