1. Introduction
In the last decade attention towards energy and environment has grown extensively and many international and national policies have been developed to achieve a more sustainable future for the environment while also focusing on reducing the cost of energy. Everywhere in the world, buildings seem to consume the most energy. In Europe, 40% of the total energy utilization is attributed to building sector 1. The United State Energy Information Administration (EIA) estimated that about 39% (or about 38 quadrillion British Thermal units) of total US energy consumption was consumed by the residential and commercial building sector in 2017 2. Residential building has more than 50 percent share of the total building energy utilization in the United States.
One way to reduce this vast amount of energy utilization in building, which will lower the cost of energy utilization and reduction in the greenhouse effect 3–5 is to engage in energy saving practices. Energy savings are implemented through energy efficiency practices and judicious use of energy available to our residential building envelope. Since a considerable amount of energy consumption in residential building are expended in HVAC systems 6,7, windows and door insulation 8,9, thermal bridges losses 10 and external wall 11,12, any design or material improvement in terms of energy utilization would lead to an energy efficient housing.
The development of the external wall has greatly contributed to a large amount of energy savings and presents chance for research opportunities in the development of new and advanced insulation materials. Future building external wall insulation should guarantee optimum performance throughout the whole life circle of the building. Other non-thermal considerations in choosing insulation materials are the environmental safety of the material 13, fire resistivity 14, sound shielding 15,16 and mechanical impact tolerance and cost effective 17.
While inroads have been made in newer innovative building insulation such as Vacuum Insulation Panels (VIP), Gas Filled Panels (GFP), Phase Change Materials (PCM), dynamic insulator etc. in meeting the goal of saving more energy than the conventional insulating materials such as glass wool, cellulose, polystyrene etc., the conventional insulation is still very popular in old and recent residential building due to high cost and advanced manufacturing processing of the innovative insulating materials 18.
The work explored alternative material design that would extend energy savings. We have selected Polypropylene material for potentially providing a mix of good insulation with impact resistance and recyclability. Polypropylene exhibits good building insulator characteristics outlined in Al-Homoud 19. Polypropylene board insulation edge over conventional insulation like blanket and batt, blown and spray insulations is its eco-friendliness and posing no harm to human and animal under service. Its high impact resistance property 20,21 has the potential to enhanced hail-storm resistance of buildings.
A multi-hollowed Polypropylene plastic is manufactured by 3D printing to create a foam-like macrostructure. Efficient Thermal insulation of polar bear’s hollow hair 22–25 is, in part, explained by their hollow macrostructural hairs. Hollow hair reduces thermal conductivity in severe cold weather thereby enhancing thermal insulation. Dohrn et al. 26 pointed that the insulation capacity of the PUR form is primarily due to the containing gases in the foam, which significantly improve thermal insulation associated with vacuum insulations.
Effective thermal conductivity represents the mean thermal conductivity value for a composite material or porous media. Effective thermal conductivity is an important heat transfer property of materials. Kulkani and Doraiswamy 27 found that the effective thermal conductivity of a porous material is influenced by the thermal conductivities of the solid, gas, porosity, emissivity of particles’ surface and the temperature. Similarly, other researches 28–30 established that the effective thermal conductivity is determined by factors such as properties of the particles, properties of the matrix and the microstructure of a composite polymer. The effective thermal conductivity could be calculated analytically 31,32, assessed through numerical simulation 33,34 or measured experimentally 35,36. In this paper, an experimental method was used to measure the effective thermal conductivity of multi-hollowed polypropylene board using the DTC-25 and hot box testing. Thermal conductivity measurements of samples were obtained by means of DTC-25 conductivity meter of TA instrument uses the guarded heat flow method to obtain thermal conductivity measurement of samples 37. The hot box test follows the ASTM C1046 38 standard practice for in-situ measurement of heat flux and temperature on building envelope components. The method involves the heat flux measurements through localized materials and between the hot box’s internal and external environmental temperatures using heat flux transducers (HFTs) and temperature transducers (TTs). While the Hot Box Test Method can provide accurate measurement of thermal conductivity of building material under real-world usage 39, it requires an understanding of a complex data logging tool for post-test data processing.
2. Theory
Wang et al.
40 define a hollow structure as a solid structure with voids. The existence of voids breaks the continuity of heat-transport pathways in the hollow-structured materials
41.
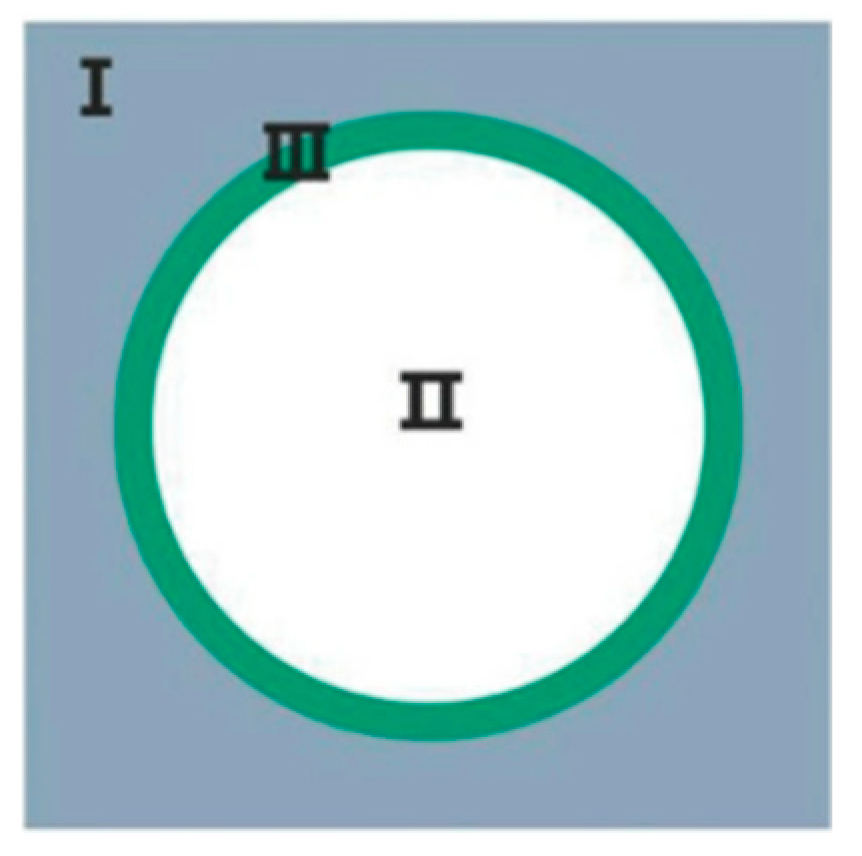
Figure 1. shows the morphology of a hollow structured material with three immiscibe phases. Phase I is a solid for continuous heat transport pathway, phase II is the void. Phase III is an interfacial bridge which could be a solid component. The multi-hollow polypropylene polymer was modelled as a pore structure. Pore defects in polymer composite are capable of lowering the effective thermal conductivities of polymers
28 and improving their insulation property.
Many researchers have developed several models to explain the effective thermal conductivity of porous materials
36,42–46.The multi-hollow polypropylene polymer was modelled as a pore structure. Pore defects in polymer composite are capable of lowering the effective thermal conductivities of polymers
28 and improving their insulation property. Wang and Pan
47 reviewed the effective thermal conductivity models that apply to multiphase material according to the size and structure of the pores. The basic structural model includes the series, parallel, the Maxwell-Euken and effective medium theory (EMT) models shown in equation 1- 4, respectively. The series and parallel models assume the simplest structure with heat flow. In the series model, heat flows across the pore while the parallel model assumes heat from along the porous media. The Maxwell-Eucken model proposes a spherical dispersed phase in a continuous solid phase with no contact, the EMT model supposes that a void or filler is surrounded by a homogeneous effective medium.
Where is the effective thermal conductivity of the porous medium; and is the thermal conductivity and phase volume respectively of the solid medium, and and is the thermal conductivity and volume fraction respectively of the fluid medium.
Utilizing local thermal equilibrium hypothesis that supposes the temperature T is the same for both the solid and the fluid phase, the heat transfer equation is derived from the solid and fluid energy mixture. The energy quantity present in the fluid and solid phases is given by equations 6 and equation 7.
Where
The term
vanishes for a steady state problem. Since the heat flow in series across the porous medium, with all the heat flux passing through both solid and fluid, the effective thermal conductivity refers to the weighted harmonic mean of conductivities
and
.
Equation 7 provides a lower bound for effective thermal conductivity of the porous media. Equation 7 is a modification of equation 1 which considers the impact of porosity and convection in the fluid-porous media.
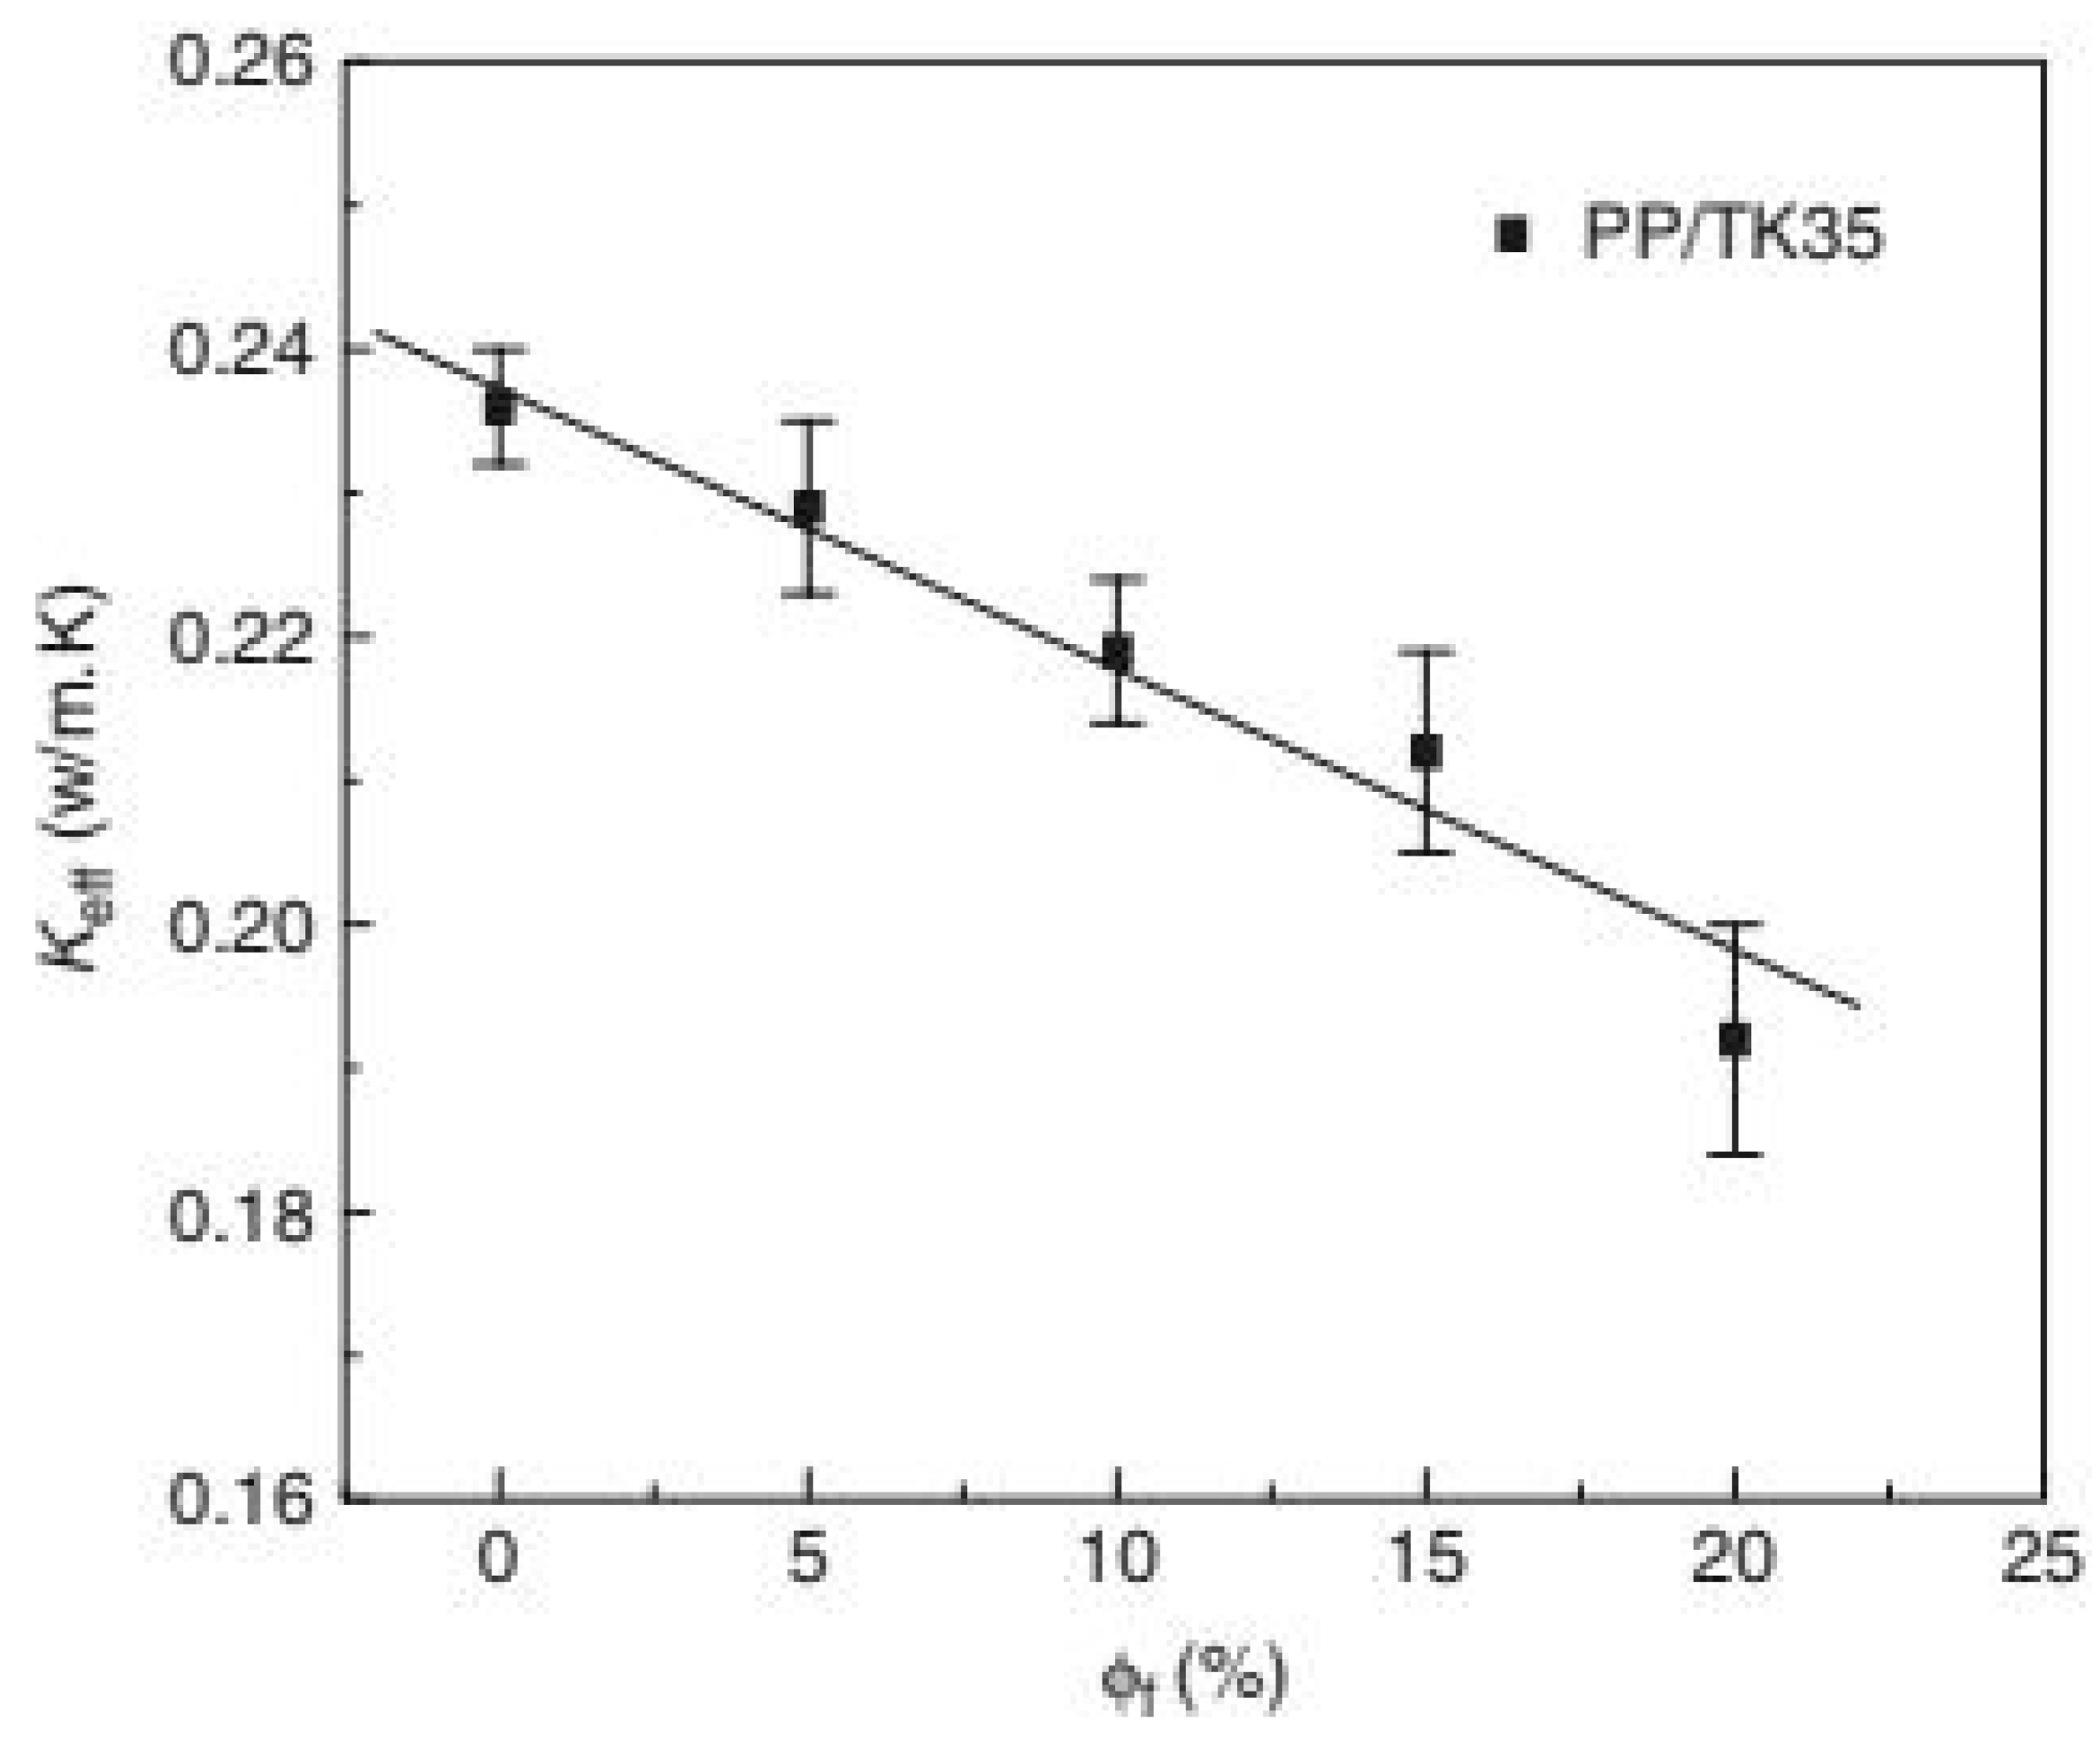
Experiment performed by Liang
36 to measure the thermal conductivity for polypropylene-hollow glass bead composites underscores that the effective thermal conductivity decreases linearly with increase of volume fraction of hollow glass bead (HGB). Other materials also display similar behavior. For example, Nait-Ali et al.
48 determined the thermal conductivity of highly porous zirconia ceramic with nanometric sized grains and found out its effective thermal conductivity decreases as the pore volume fraction increases. The finding of Liang’s experiment demonstrates that creating void in polymer composites could decrease the thermal conductivity of the polymer concerned.
Figure 2. shows the correlation between the effective thermal conductivity (
) and the volume fraction (
) of a Polypropylene-Hollow Glass Beads (HGB) composite (PP/TK35) supplied by Molus company in Germany
36. From the plot, it can be observed that the effective thermal conductivity
and volume fraction
of HGB show inverse relationship.
3. Methodology
3.1. Experimental Methods
We measured the effective thermal conductivity of multi-hollow polypropylene board by employing the discovery thermal conductivity tester (DTC-25) manufactured by TA instruments and the hot box built in Dr. Sanjeev’s laboratory at the University of Missouri. DTC-25 is suited for quality control and determination of thermal conductivity of polymers, metals, ceramics, composites, glass, rubber and graphite products accurately in the laboratory.
The hot box test follows the ASTM C1046 standard practice for in-situ measurement of heat flux and temperature on building envelope components. This hot box is a more robust measurement of thermal conductivity of building material as it mirrors close to reality in application. The method involves the heat flux measurements through localized materials and the hot box’s internal/external environmental temperatures with heat flux transducers (HFTs) and temperature transducers (TTs), respectively. Heat flux is the heat energy transfer rate through a given material. It is defined as the energy flow per unit area per unit time. The SI unit is given by watts per square meter(W/m
2). The heat flux determination through the PP insulation board using the hot box test provides a basis for the calculation of the thermal conductivity of the porous PP board at steady state via the Fourier’s law of heat transfer formula given by equation 8.
3.2. Method for DTC-25 Test
The three-step procedure in the DTC-25 test includes sample preparation, sample loading and experimental test. We prepared a multi-hollow polypropylene sample measured 50mm in diameter and 10mm in thickness for the experimental measurement of thermal conductivity. The sample,
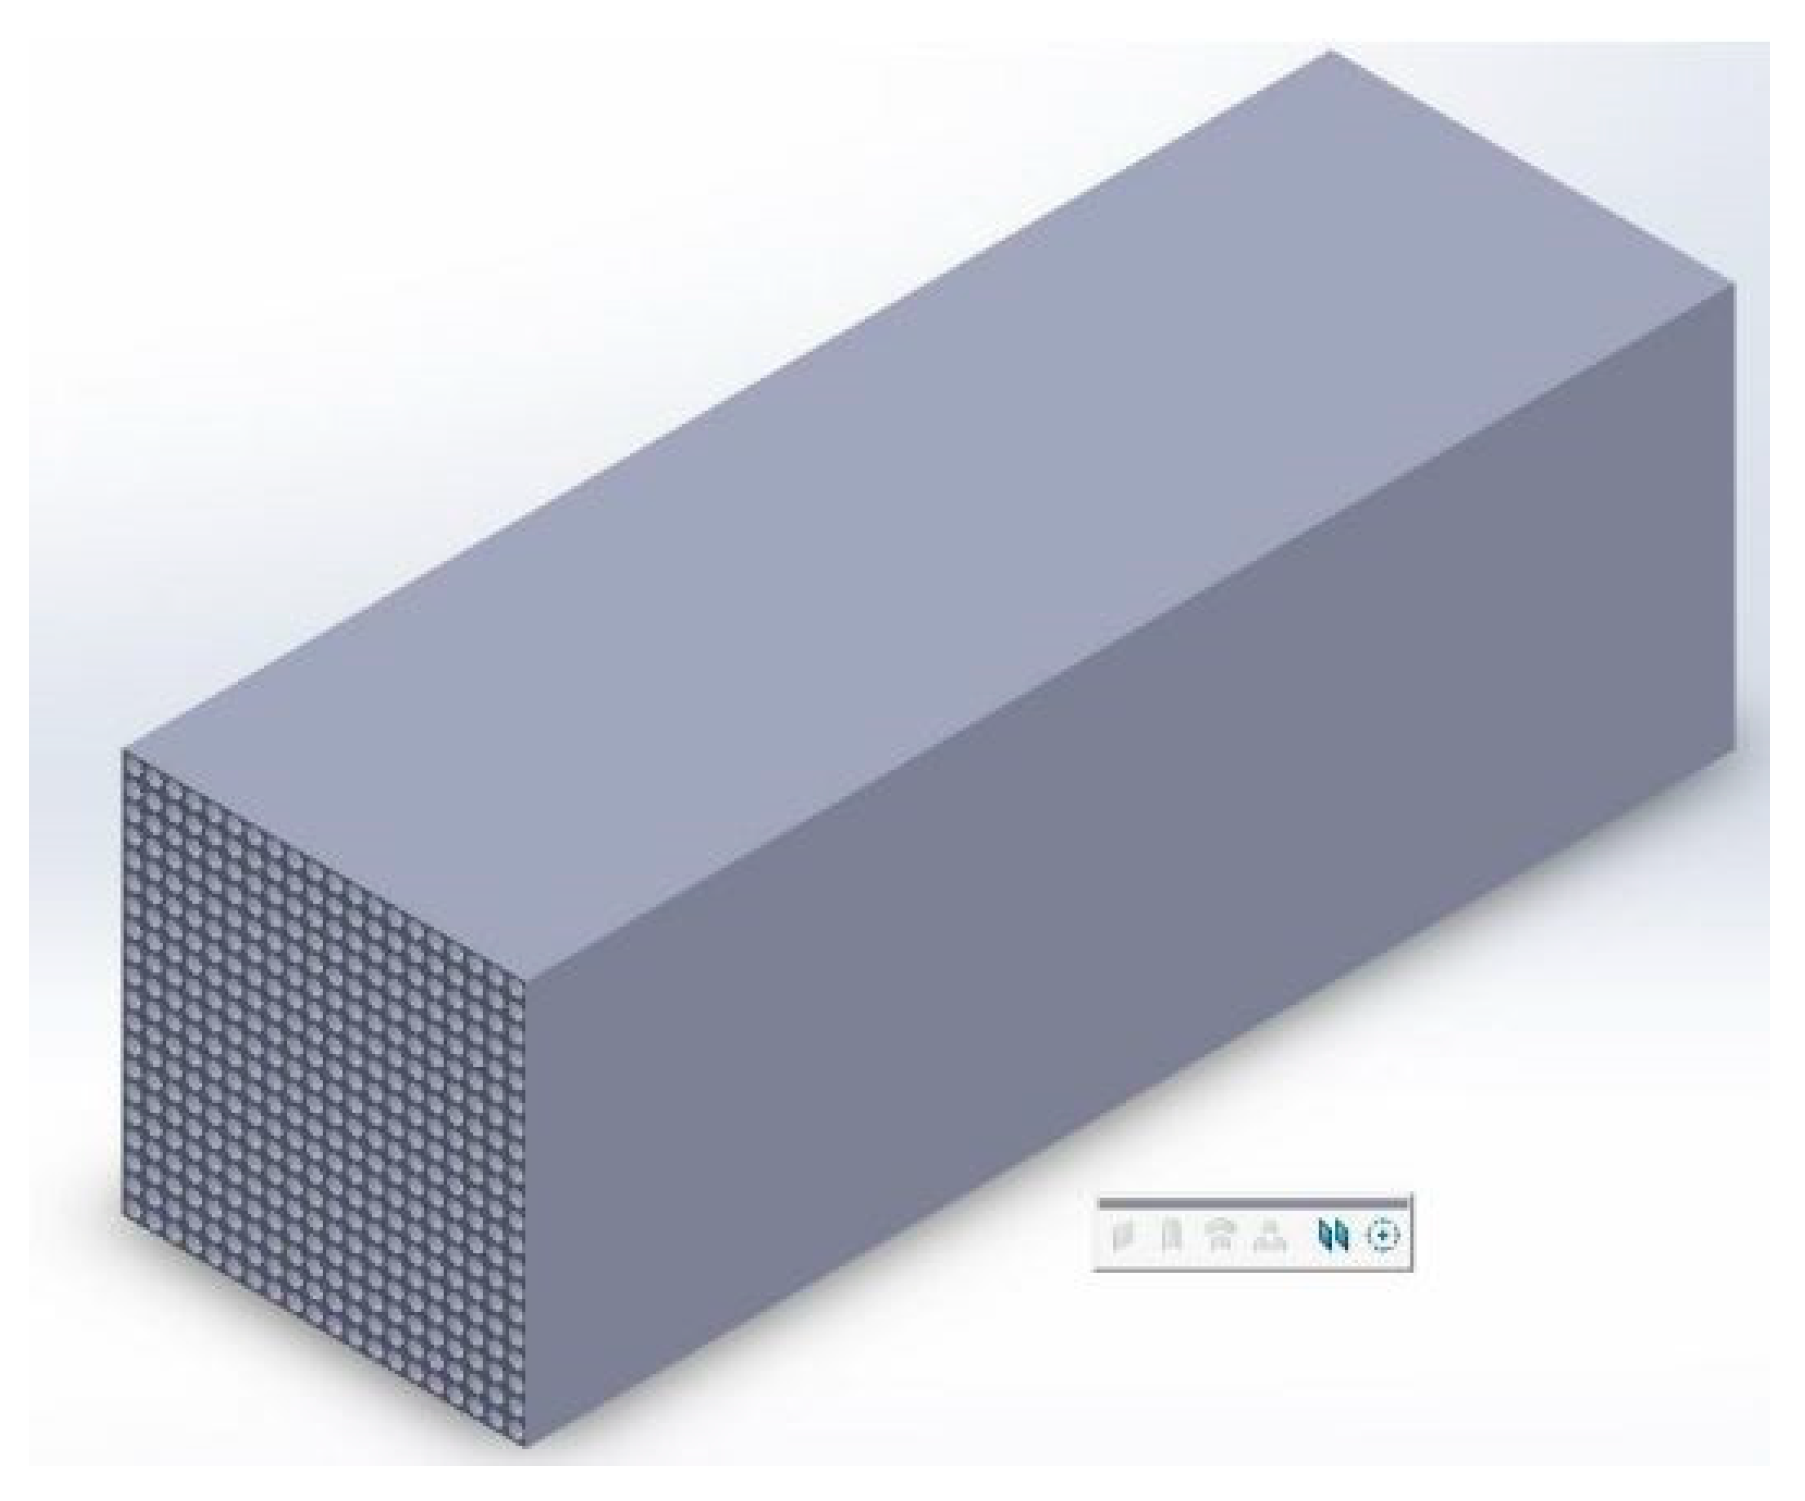
Figure 3, was cut away from a 3D printed hollow structured PP block shown in
Figure 4. The different hole sizes were produced for this experimental test – 4mm, 2.5mm and 1mm hole samples. through the material. It is necessary that test samples must be smooth and flat on both surfaces. Before beginning the experimental run, a heat sink compound or thermal paste should be applied to both surfaces to maximize heat transfer and dissipation between the test stack carrying heat and the polypropylene board. Silicone paste was used as a thermal paste for this test. The sample is loaded into the test stack with the aid of free/move switch on the electronic enclosure which allows for the UP/DOWN movement of the stack rod. The test pressure should be kept between 40- 60 psi and ensure the sample is in line with the top and bottom sample plate before it is locked for testing.
The temperature controller setpoint should be maintained at 45 degree C and should be adjusted whenever it deviates from the required temperature. Experimental reading takes 30 minutes which allows the voltages on the LCD display to reach equilibrium. The thermistor output voltages taken for experimental analysis include Reference Voltage, Upper Voltage, Lower Voltage, Heat Sink Voltage. The voltages are converted to temperature in degree Celsius with help from computer software.
3.3. Method for Hot Box Test
Thermal conductivity is known to be affected by thermal bridging, changes in material property with temperature, airflow in and through building envelop, internal convection, phase changes and hygric storage effect
49 especially in contemporary insulation materials in ways they control heat flow. To get a more accurate predictive thermal conductivity of material, a physical facility is needed to replicate field usage conditions. A hot box was deployed for the experimental measurement of the hollowed structured PP thermal conductivity. A hot box apparatus is generally large and expensive
49,50. A few of them are found in U.S. National Laboratories. The hot box utilized was constructed in Professor Sanjeev Khanna’s laboratory at the University of Missouri by a group of students in 2015.
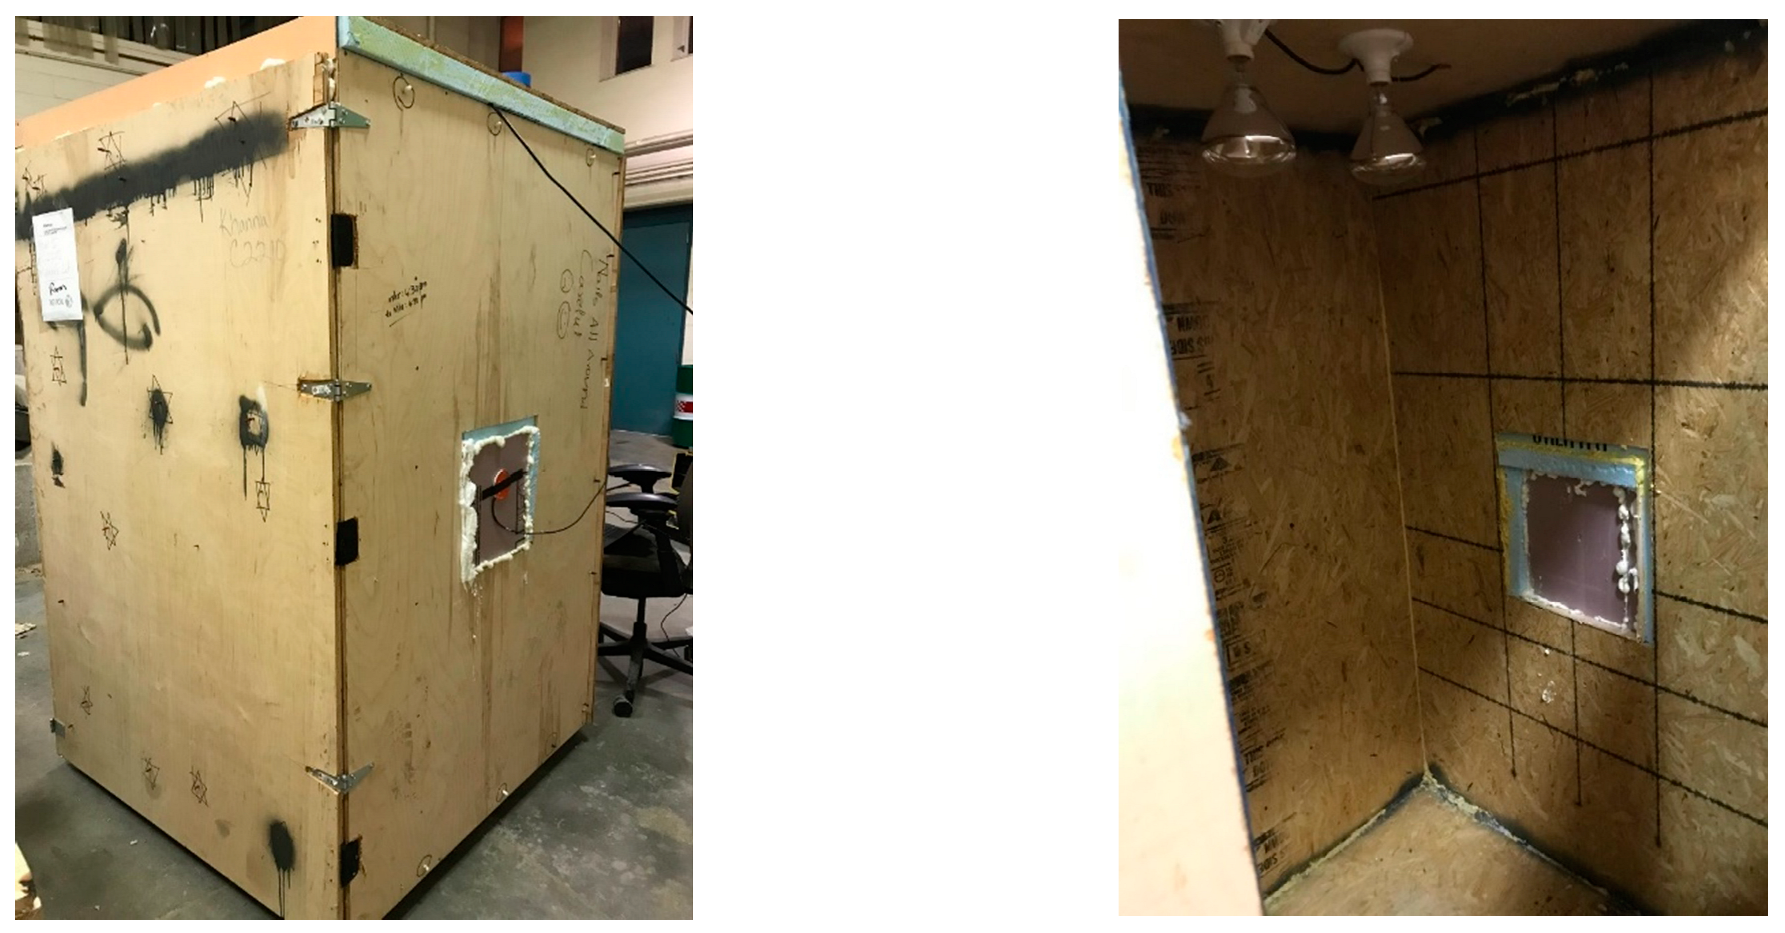
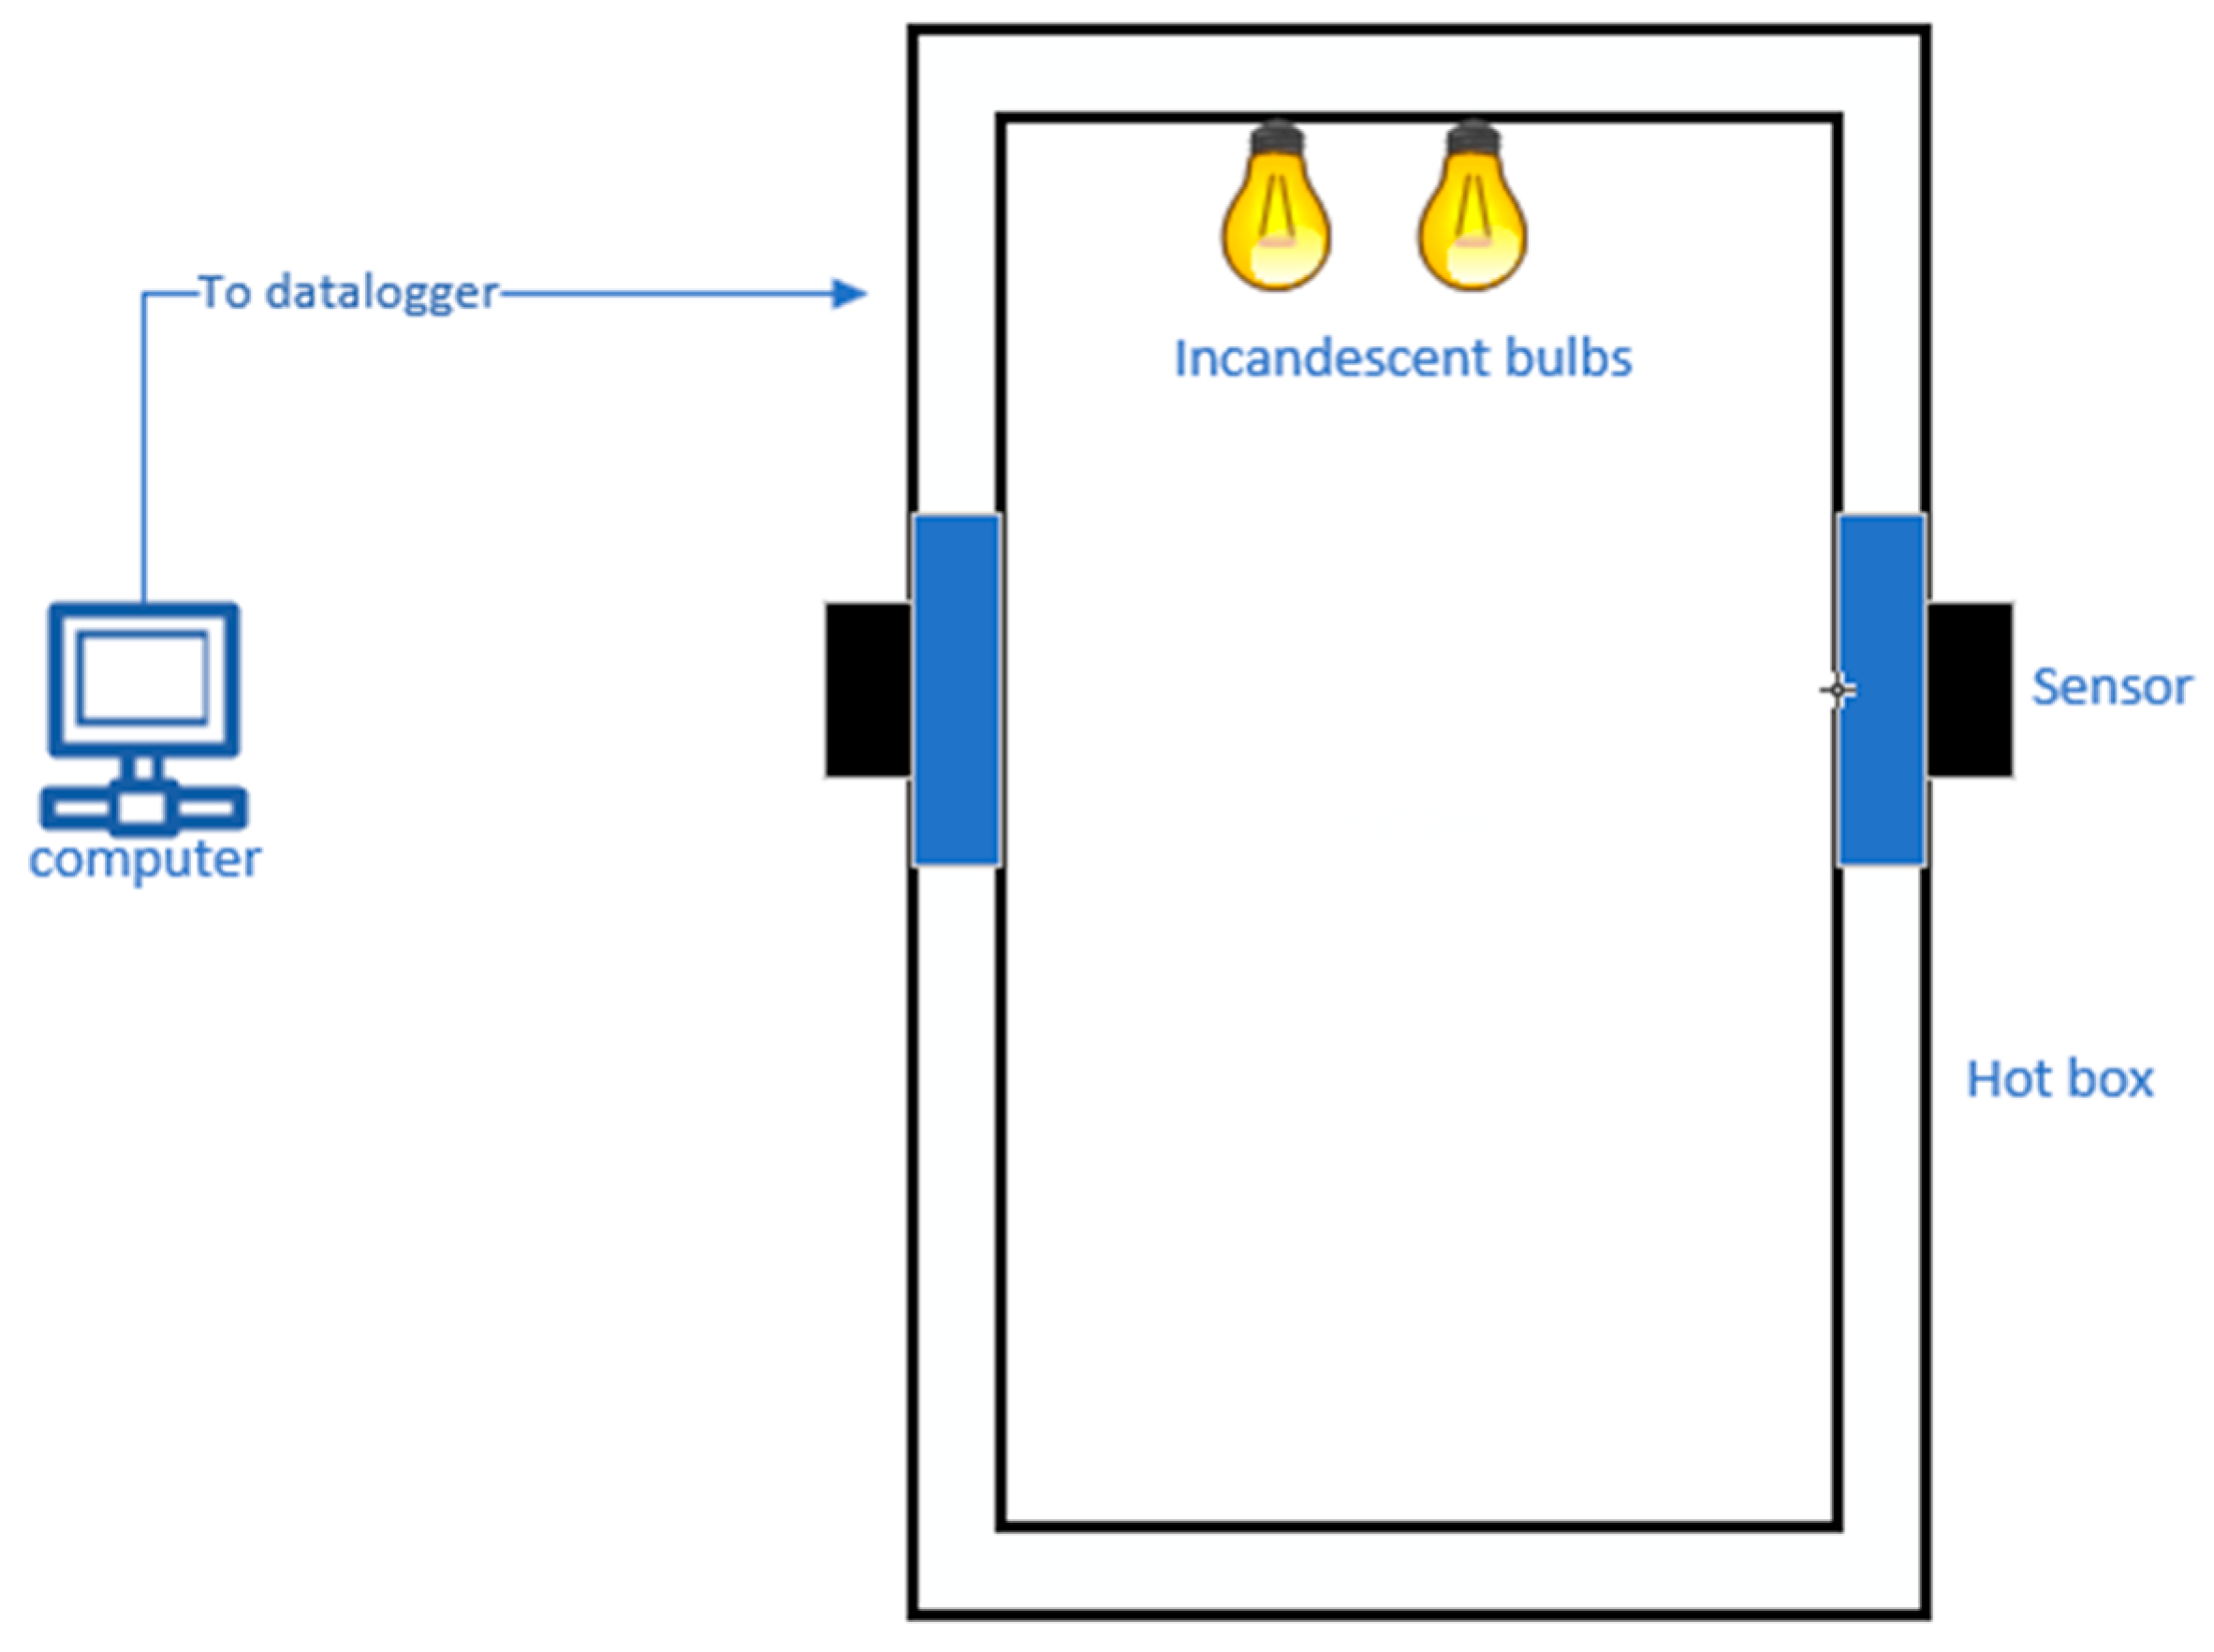
Figure 5 shows the constructed hot box for measuring the heat flux through building materials. It measures 50 in length by 50 in width by 75 in height and is completely insulated except for two metering windows which allow for heat flux measurement passing through materials. Two incandescent light sources provide the heating of the enclosure. A datalogger, CR1000, manufactured by Campbell Scientific, provides a connection for measuring the heat flux and the hot box’s internal and external environmental temperature. A datalogger software, PC400, accompanies the RC1000 for post-processing recorded measurements.
The hot box is well insulated with two windows measuring 14 in by 14 in on both sides of the building envelope enclosure. An extruded polystyrene (XPS) insulator with a known thermal conductivity is placed on one window while the other window is covered with porous PP material. We are able to establish the PP’s thermal conductivity if the sensors and data logging system correctly determine the known thermal conductivity value of XPS insulator. Cai et al 51 reviewed the thermal conductivities of XPS to be 0.026 – 0.040 W/Mk. These thermal conductivity values were confirmed by a technical report on the comparison of expanded and extruded foam polystyrene insulation in roadway and airport embankments 52.
Two incandescent light bulbs heat the hot box enclosure. One HFP01 sensor is attached to the outer surface of the XPS insulator, labelled HF_1. Similarly, the other HFP01 sensor, labelled HF_2, is attached to the outer surface of the PP’s insulation. Figure 30 shows the hot box enclosure. Campbell Scientific data logger system with connected heat flux and temperature sensors is depicted in Figure 31. Figure 32 shows the Hukseflux’s HFP01 sensor attached to the porous PP to measure its heat flux.
Circling back to equation 8, XPS and hollow structured PP thermal conductivity can be calculated when the heat flux is measured by the sensors.
Figure 6 shows a schematic of the experimental setup.
Figure 7 illustrates the physical laboratory test.
4. Result and Discussion
For DTC-25, The thermistor output voltages are converted to temperature using a DTC-25 computer software with an algorithm to calculate the thermal conductivity of porous PP. The result is tabulated in
Figure 7. These values compare with the porous media models described in Wang and Pan
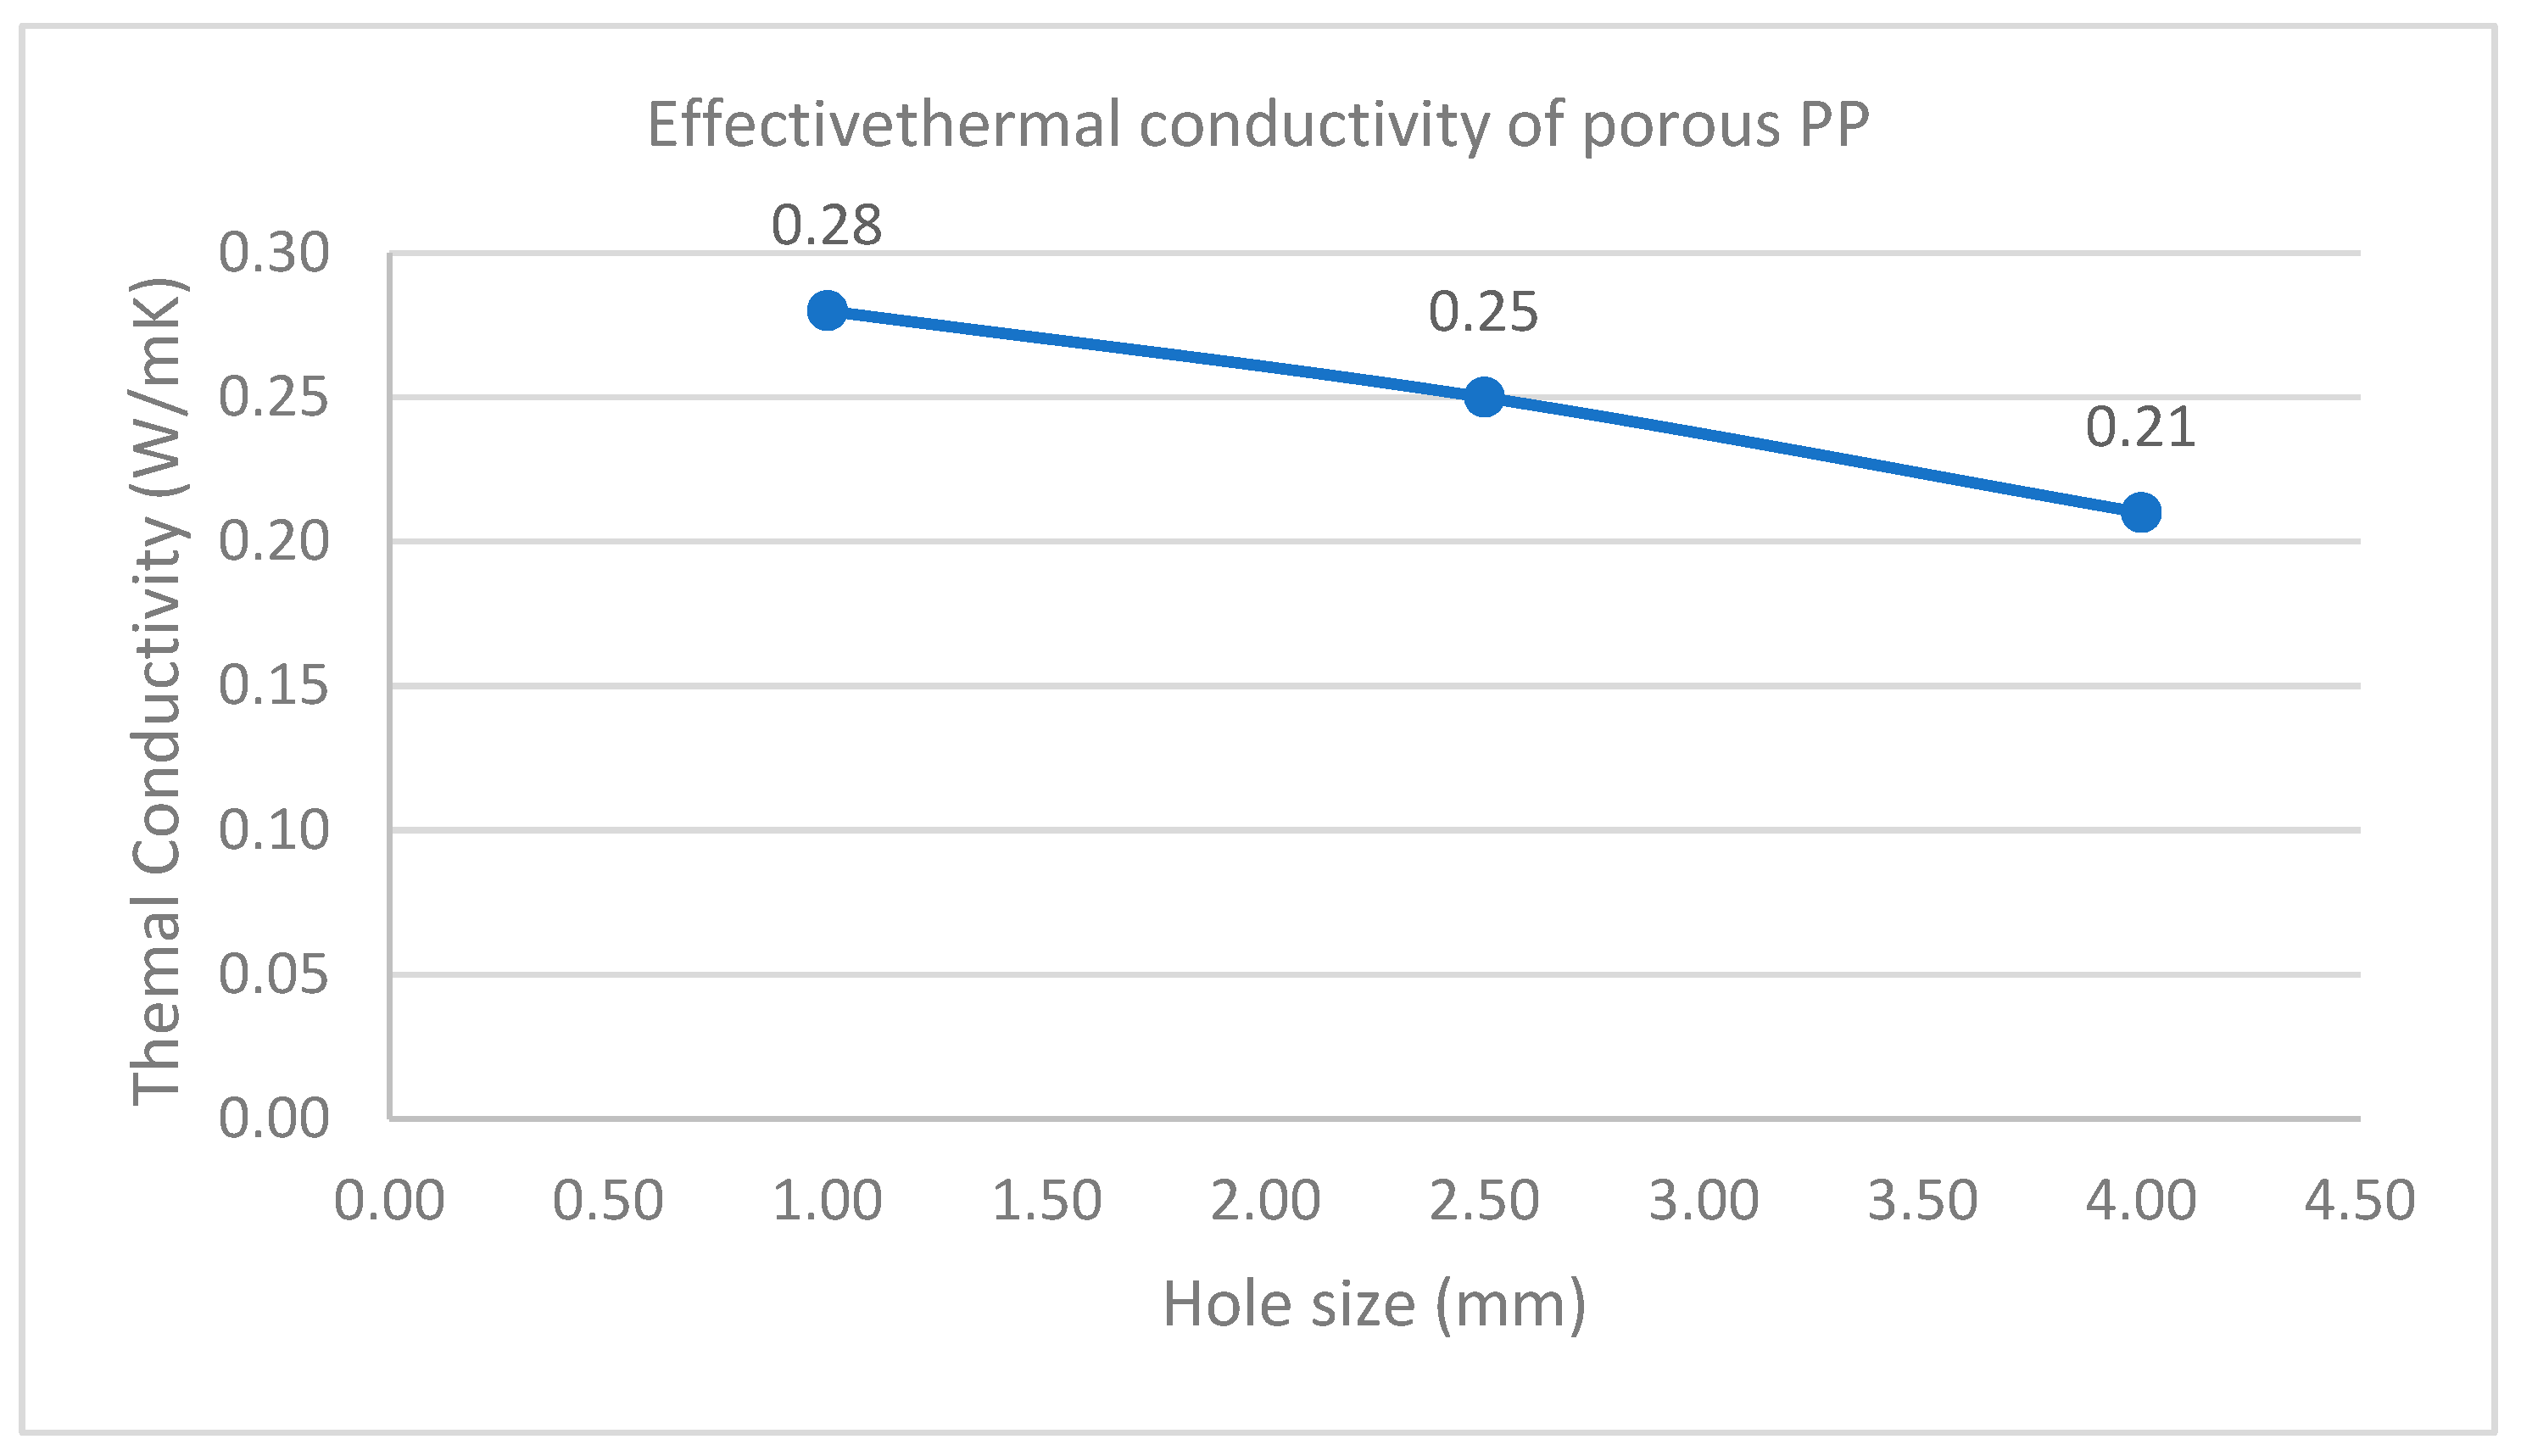
47 that an increase of the volume fraction of the material lowers the thermal conductivity of the material. A graph of thermal conductivity of porous PP versus the hole size contained in the material is shown in
Figure 8.
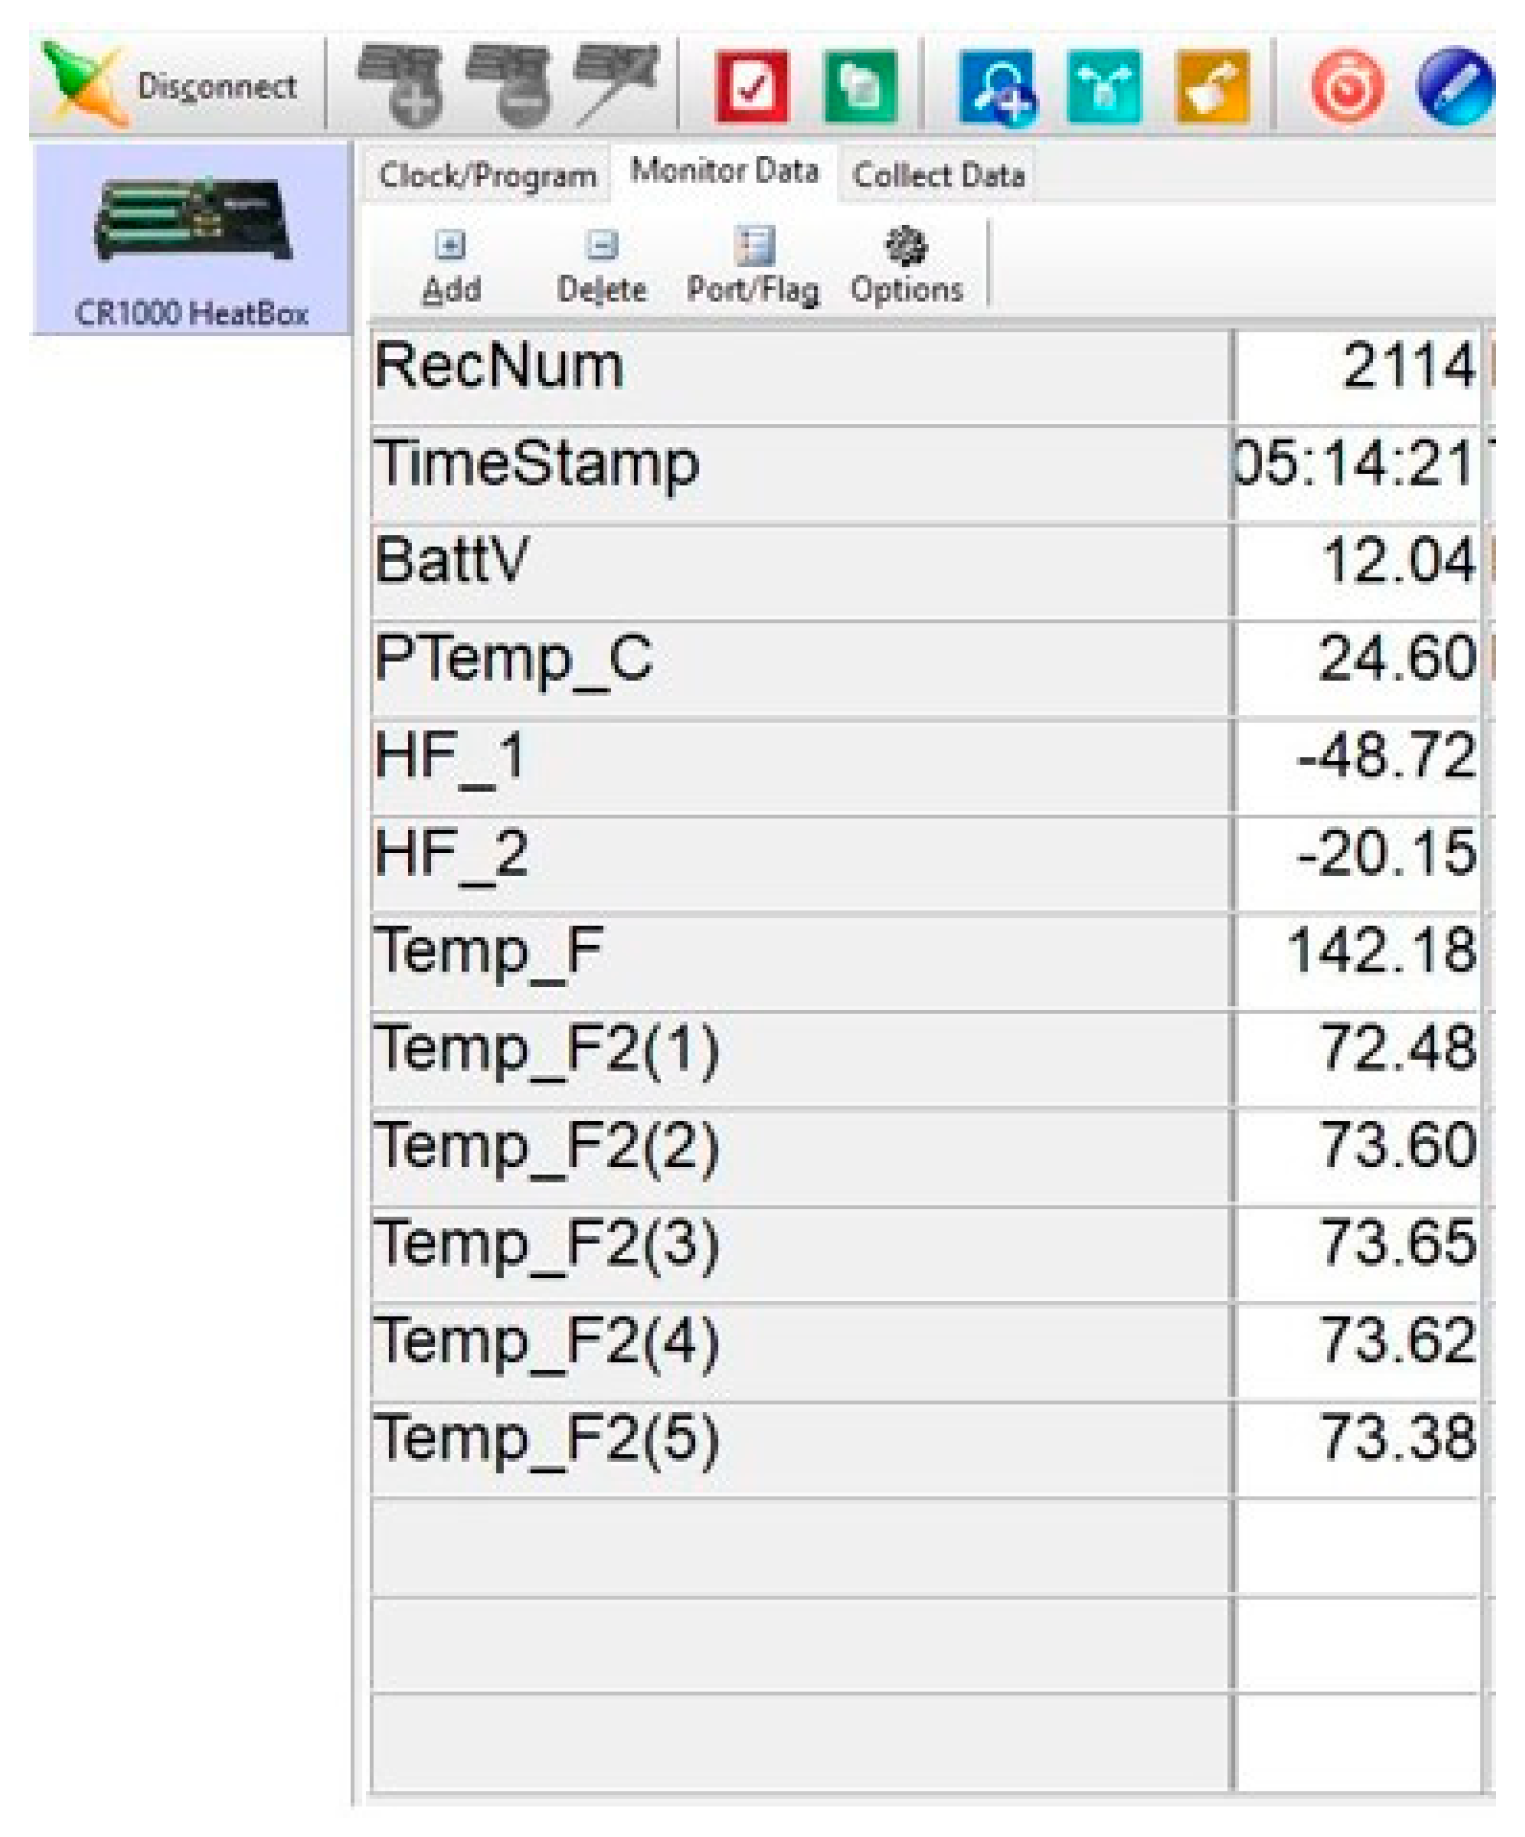
To use the hot box, processing of the sensors’ measurements in the datalogger is done in the Campbell Scientific PC400 software. The datalogger logs measurement every 5 seconds. A snapshot of the sensors’ measurements is shown in
Figure 9 after 5 hours.
From the result, the heat flux through the PP board is -48.72 W/m
2K while the heat flux through the extruded polystyrene is -20.15 W/m
2K. The negative values of the heat flux indicate heat is flowing from a high to low temperature. The hot box’s interior temperature reading is 142.18 F (61.21
oC) and the average outer temperature reading is 73.35 F (22.97
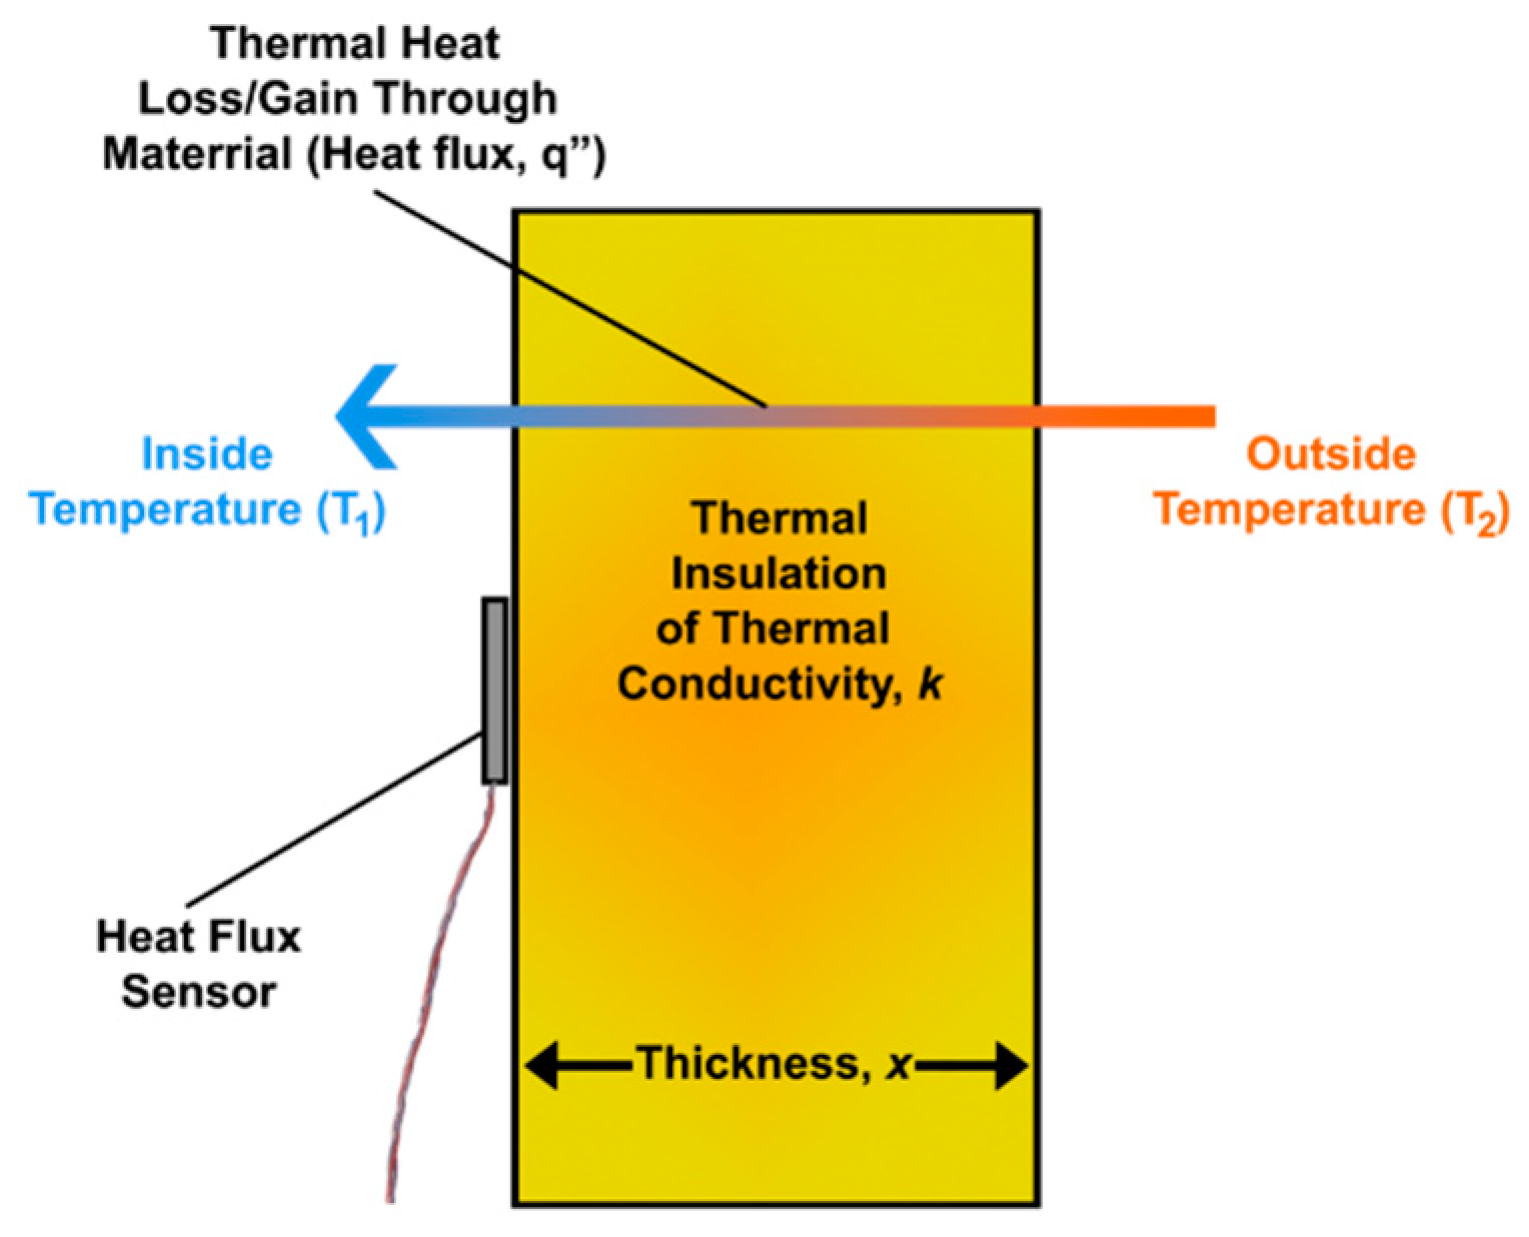
oC). The PP’s board thickness is 50 mm. Using the Fourier’s equation of conduction heat transfer in equation 8, the thermal conductivity of the XPS specimen can be deduced.
Figure 10 illustrates the heat flow through the XPS insulation board. In this case, the measured heat transfer is the heat conduction through both the solid and fluid phases. As noted in varied publications of heat transfer through metal and insulating foams
53–57, convection and radiation heat transfer have been considered negligible to the extent conduction is the only heat transfer mechanism.
Thermal conductivity of XPS = = 0.0263 W/mK
The thermal conductivity value of the extruded polystyrene (XPS) in the hot box test corresponds to the reviewed values in Cai et al 51 and Connor (2019)
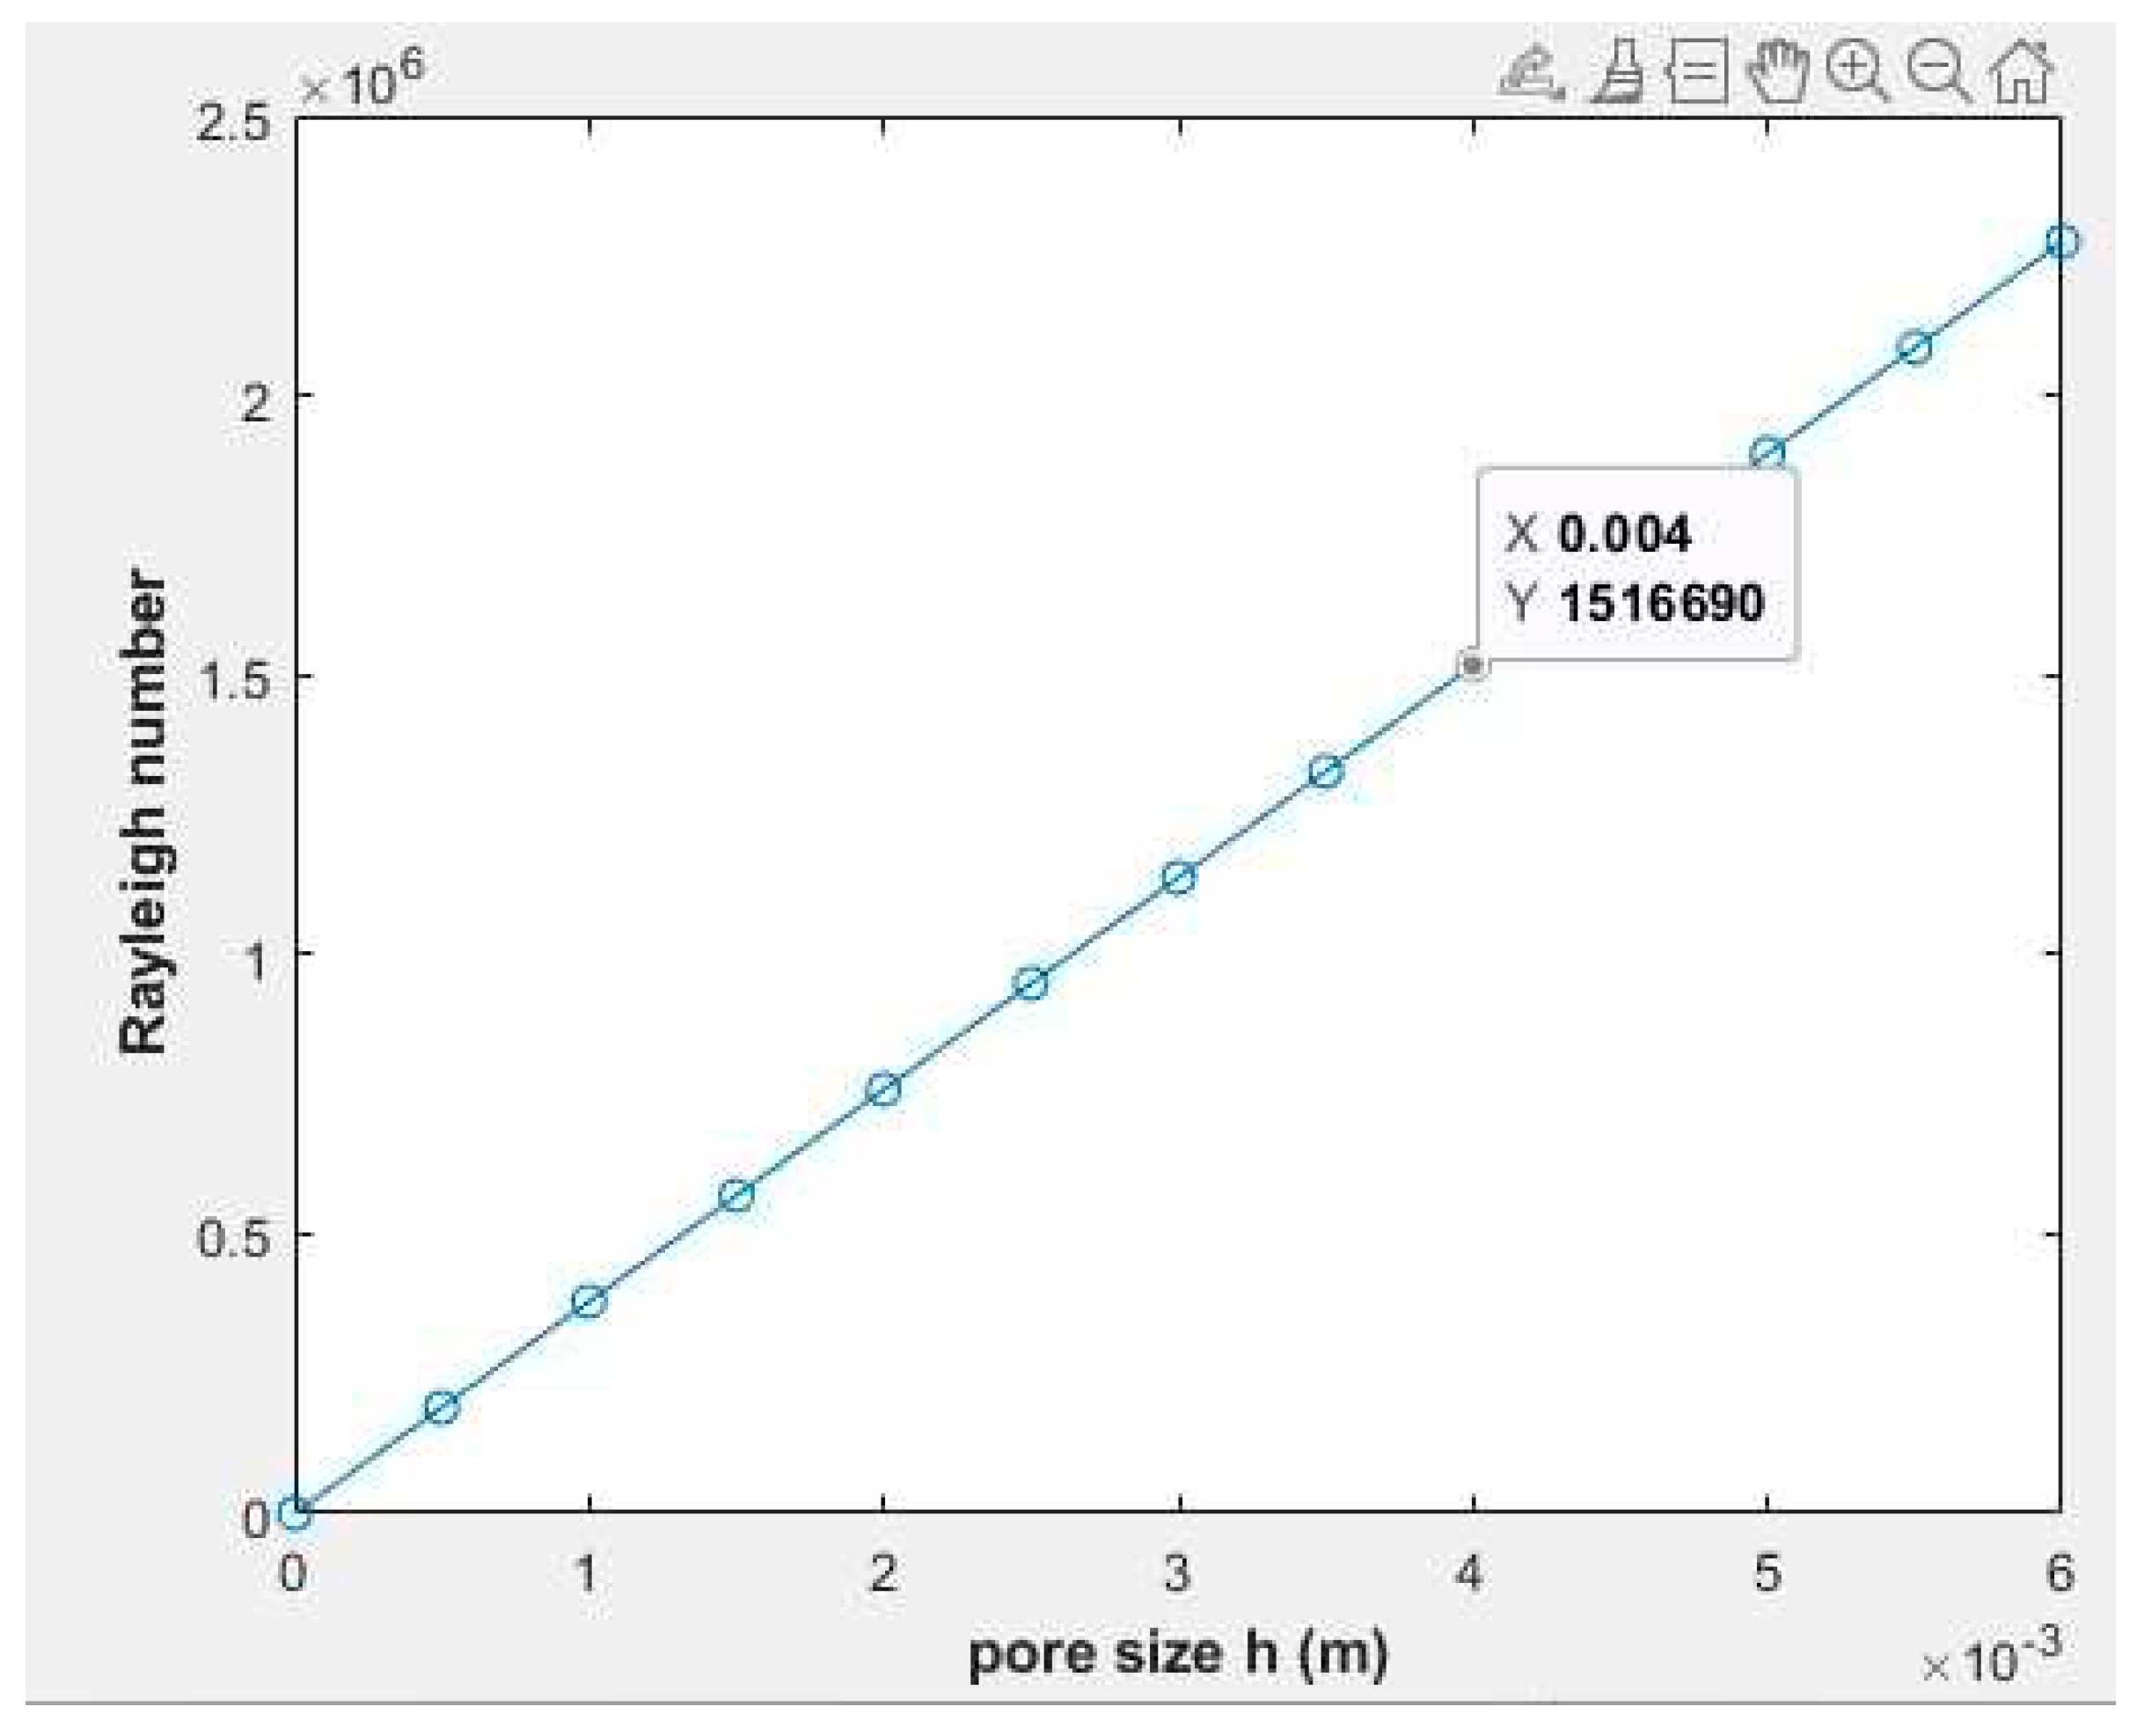
With some innovative porous media, the effect of convective heat transfer plays a crucial role in the overall heat transfer through the media, i.e., the total heat transfer is a summation of conductive heat transfer through the solid and convective heat transfer through the pores. Such materials must surpass a critical Rayleigh number for convective heat transfer to take influence. Rayleigh number is a dimensionless number that assesses how the effects of buoyancy forces and the effects of viscosity forces compare to conductive heat transfer. Harold Jeffreys
58 first calculated the critical Rayleigh number for a layer of fluid to be 1708 in the year 1926 in his widely published original article titled "the stability of a layer of fluid heated below”. Determination of the Rayleigh number will tell whether the heat transfer mode in the pore of the porous PP is conduction or convection. Equation 9 is a depiction of Rayleigh number
problem highlighted in Nygard and Tyvand
59–61 . A graph of pore size against Reyleigh number is shown in
Figure 11.
implies that the critical Rayleigh number is exceeded, and convection must take precedence in the porous PP. The analysis infers that a two-dimensional heat transfer mode, conduction and convection, are present in the PP porous media if we consider the effect of radiative heat transfer negligible. From the foregoing, Fourier’s conduction heat transfer equation is insufficient to model the total heat transfer through the porous PP media to determine the thermal conductivity of the hollow structured material. The guarded heat flow technique utilizes the Fourier steady heat transfer model to measure thermal conductivity of materials in many laboratory apparatuses such as DTC-25. With porous media, a critical Rayleigh number for the fluid media must be determined to understand if the heat flow in the pores is conduction or convection. There is a potential measurement error in determining the thermal conductivity of porous media when the total heat flow through the material is a combination of conduction and convection. A more accurate model for such porous media was put forward by Adrian Bejan
62,
63. Bejan model demonstrates how the heat flux relate to the Rayleigh number in the porous medium shown in equation 10.
The effective thermal conductivity
of the porous PP can be backed out of the above equation and determined to be
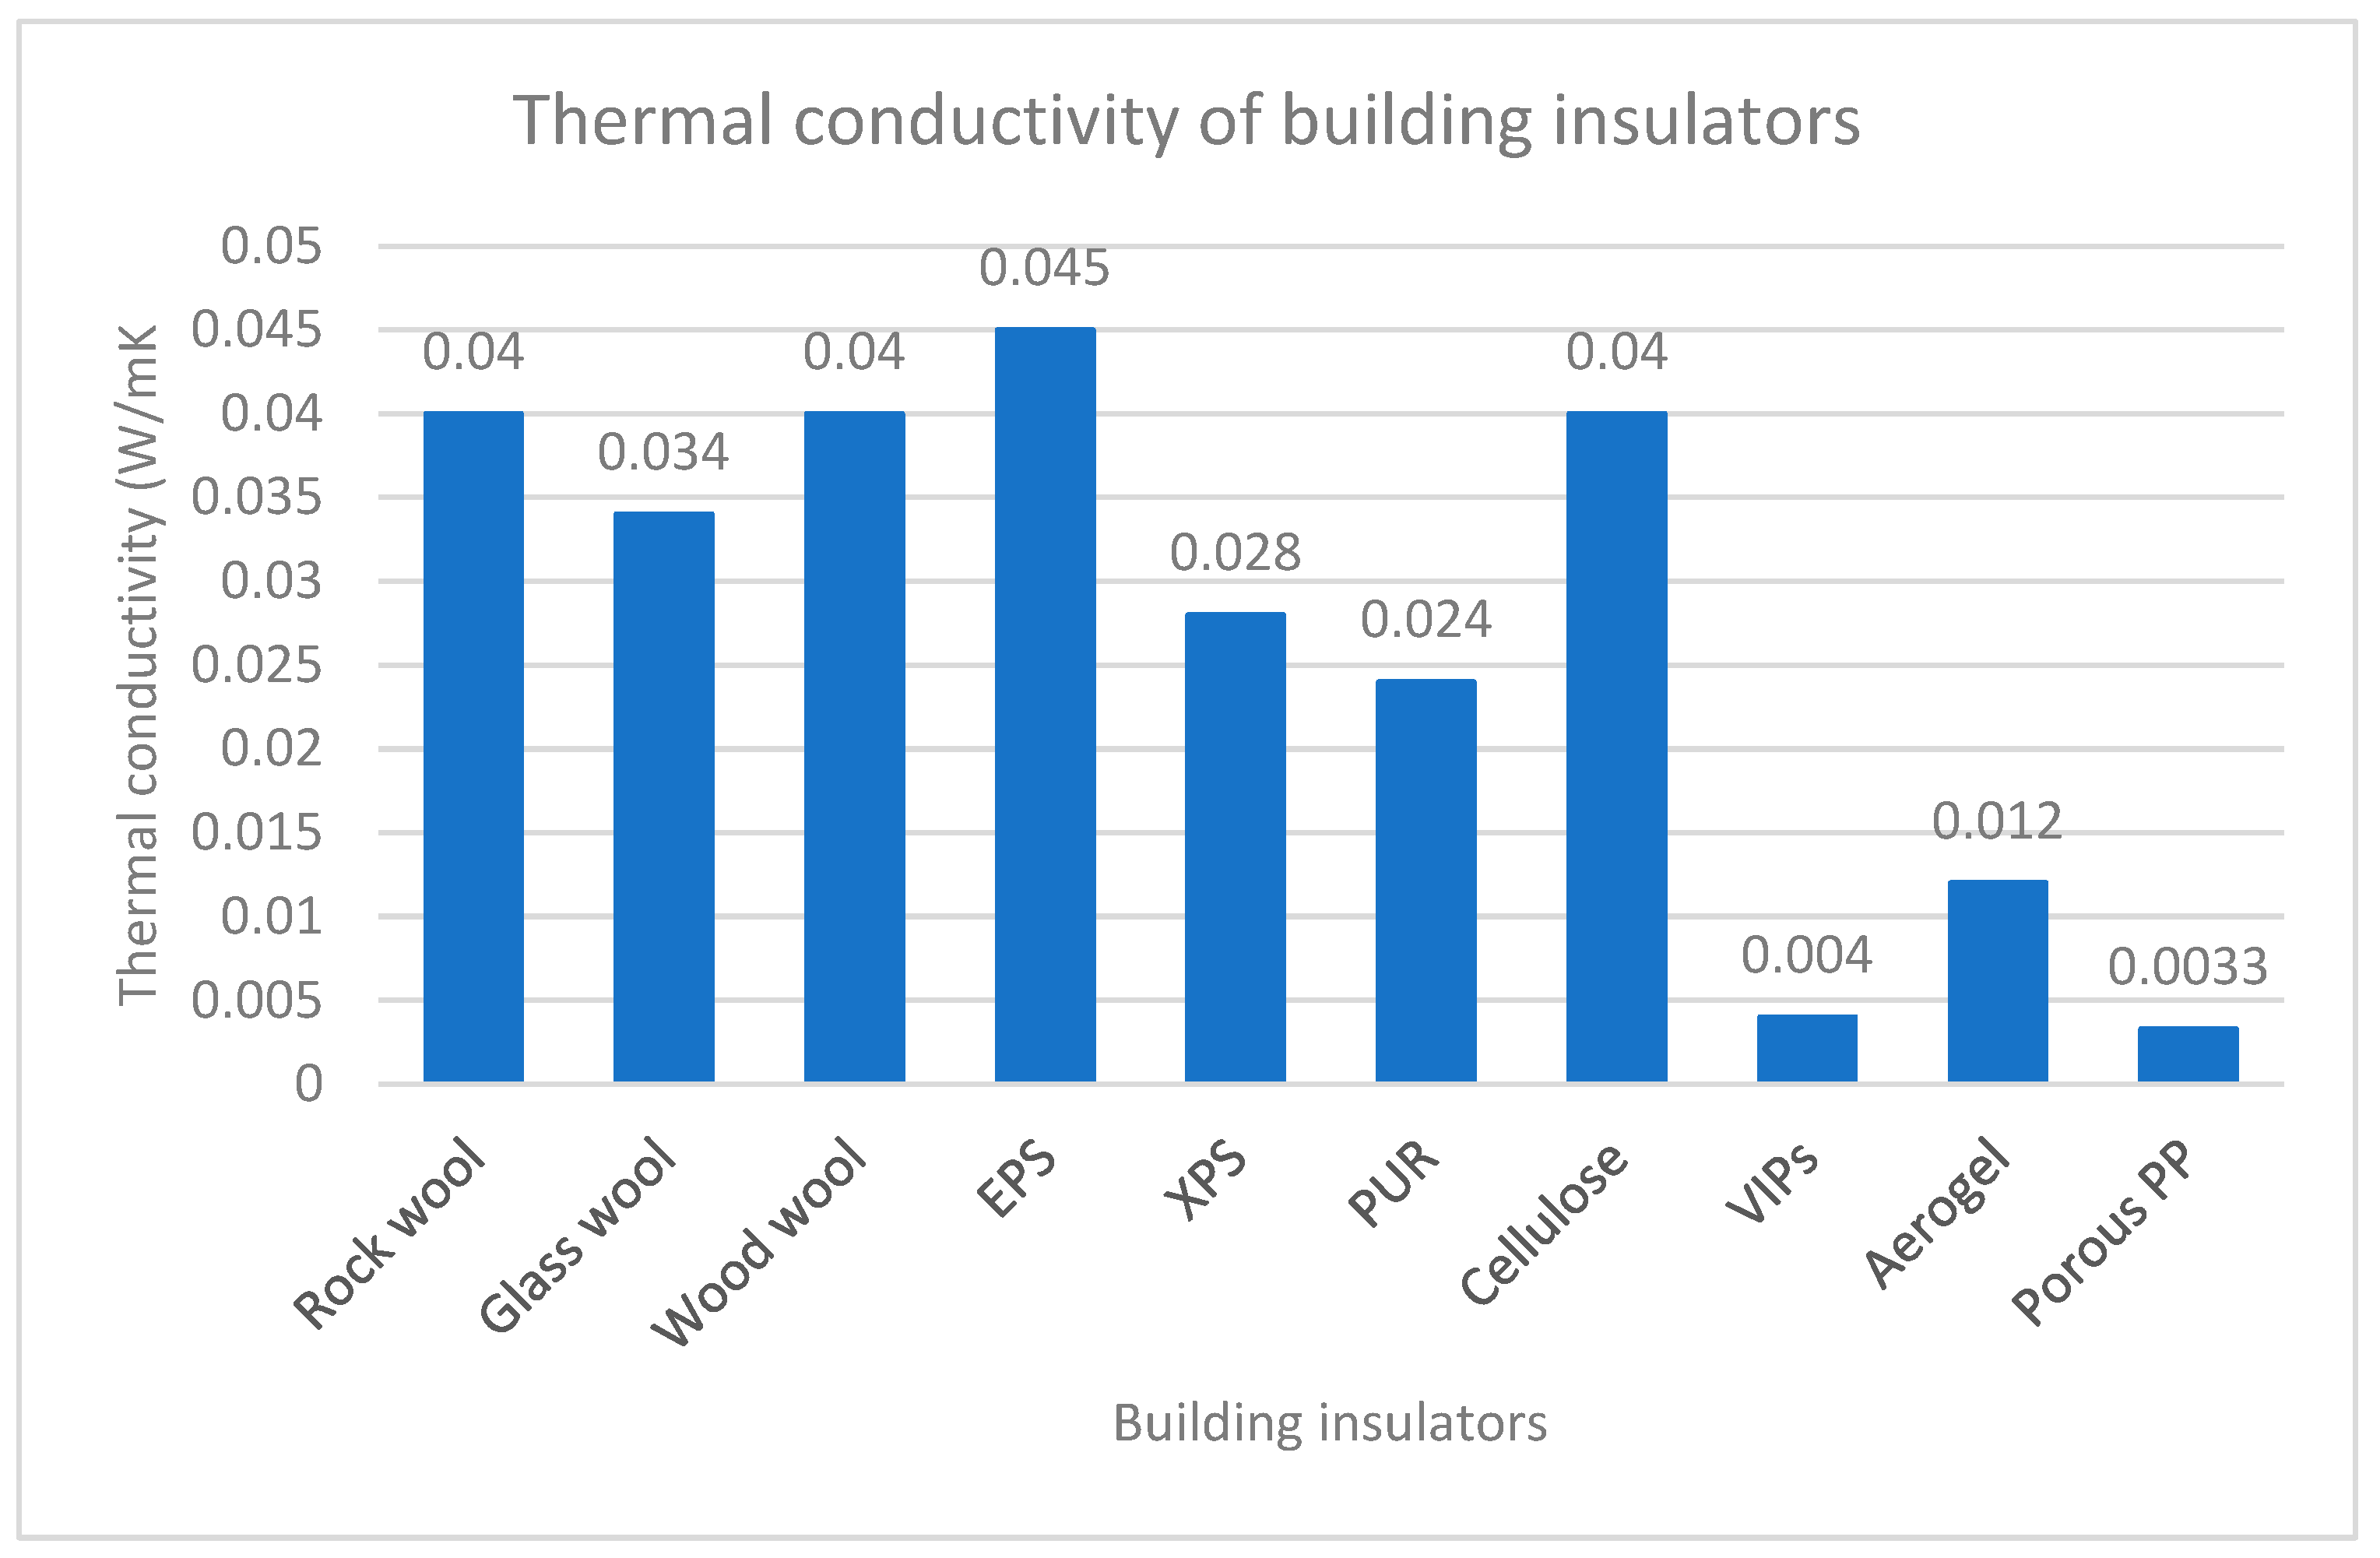
. This effective thermal conductivity value of porous PP is eight times less than the thermal conductivity of and about ten times less than conventional building insulators.
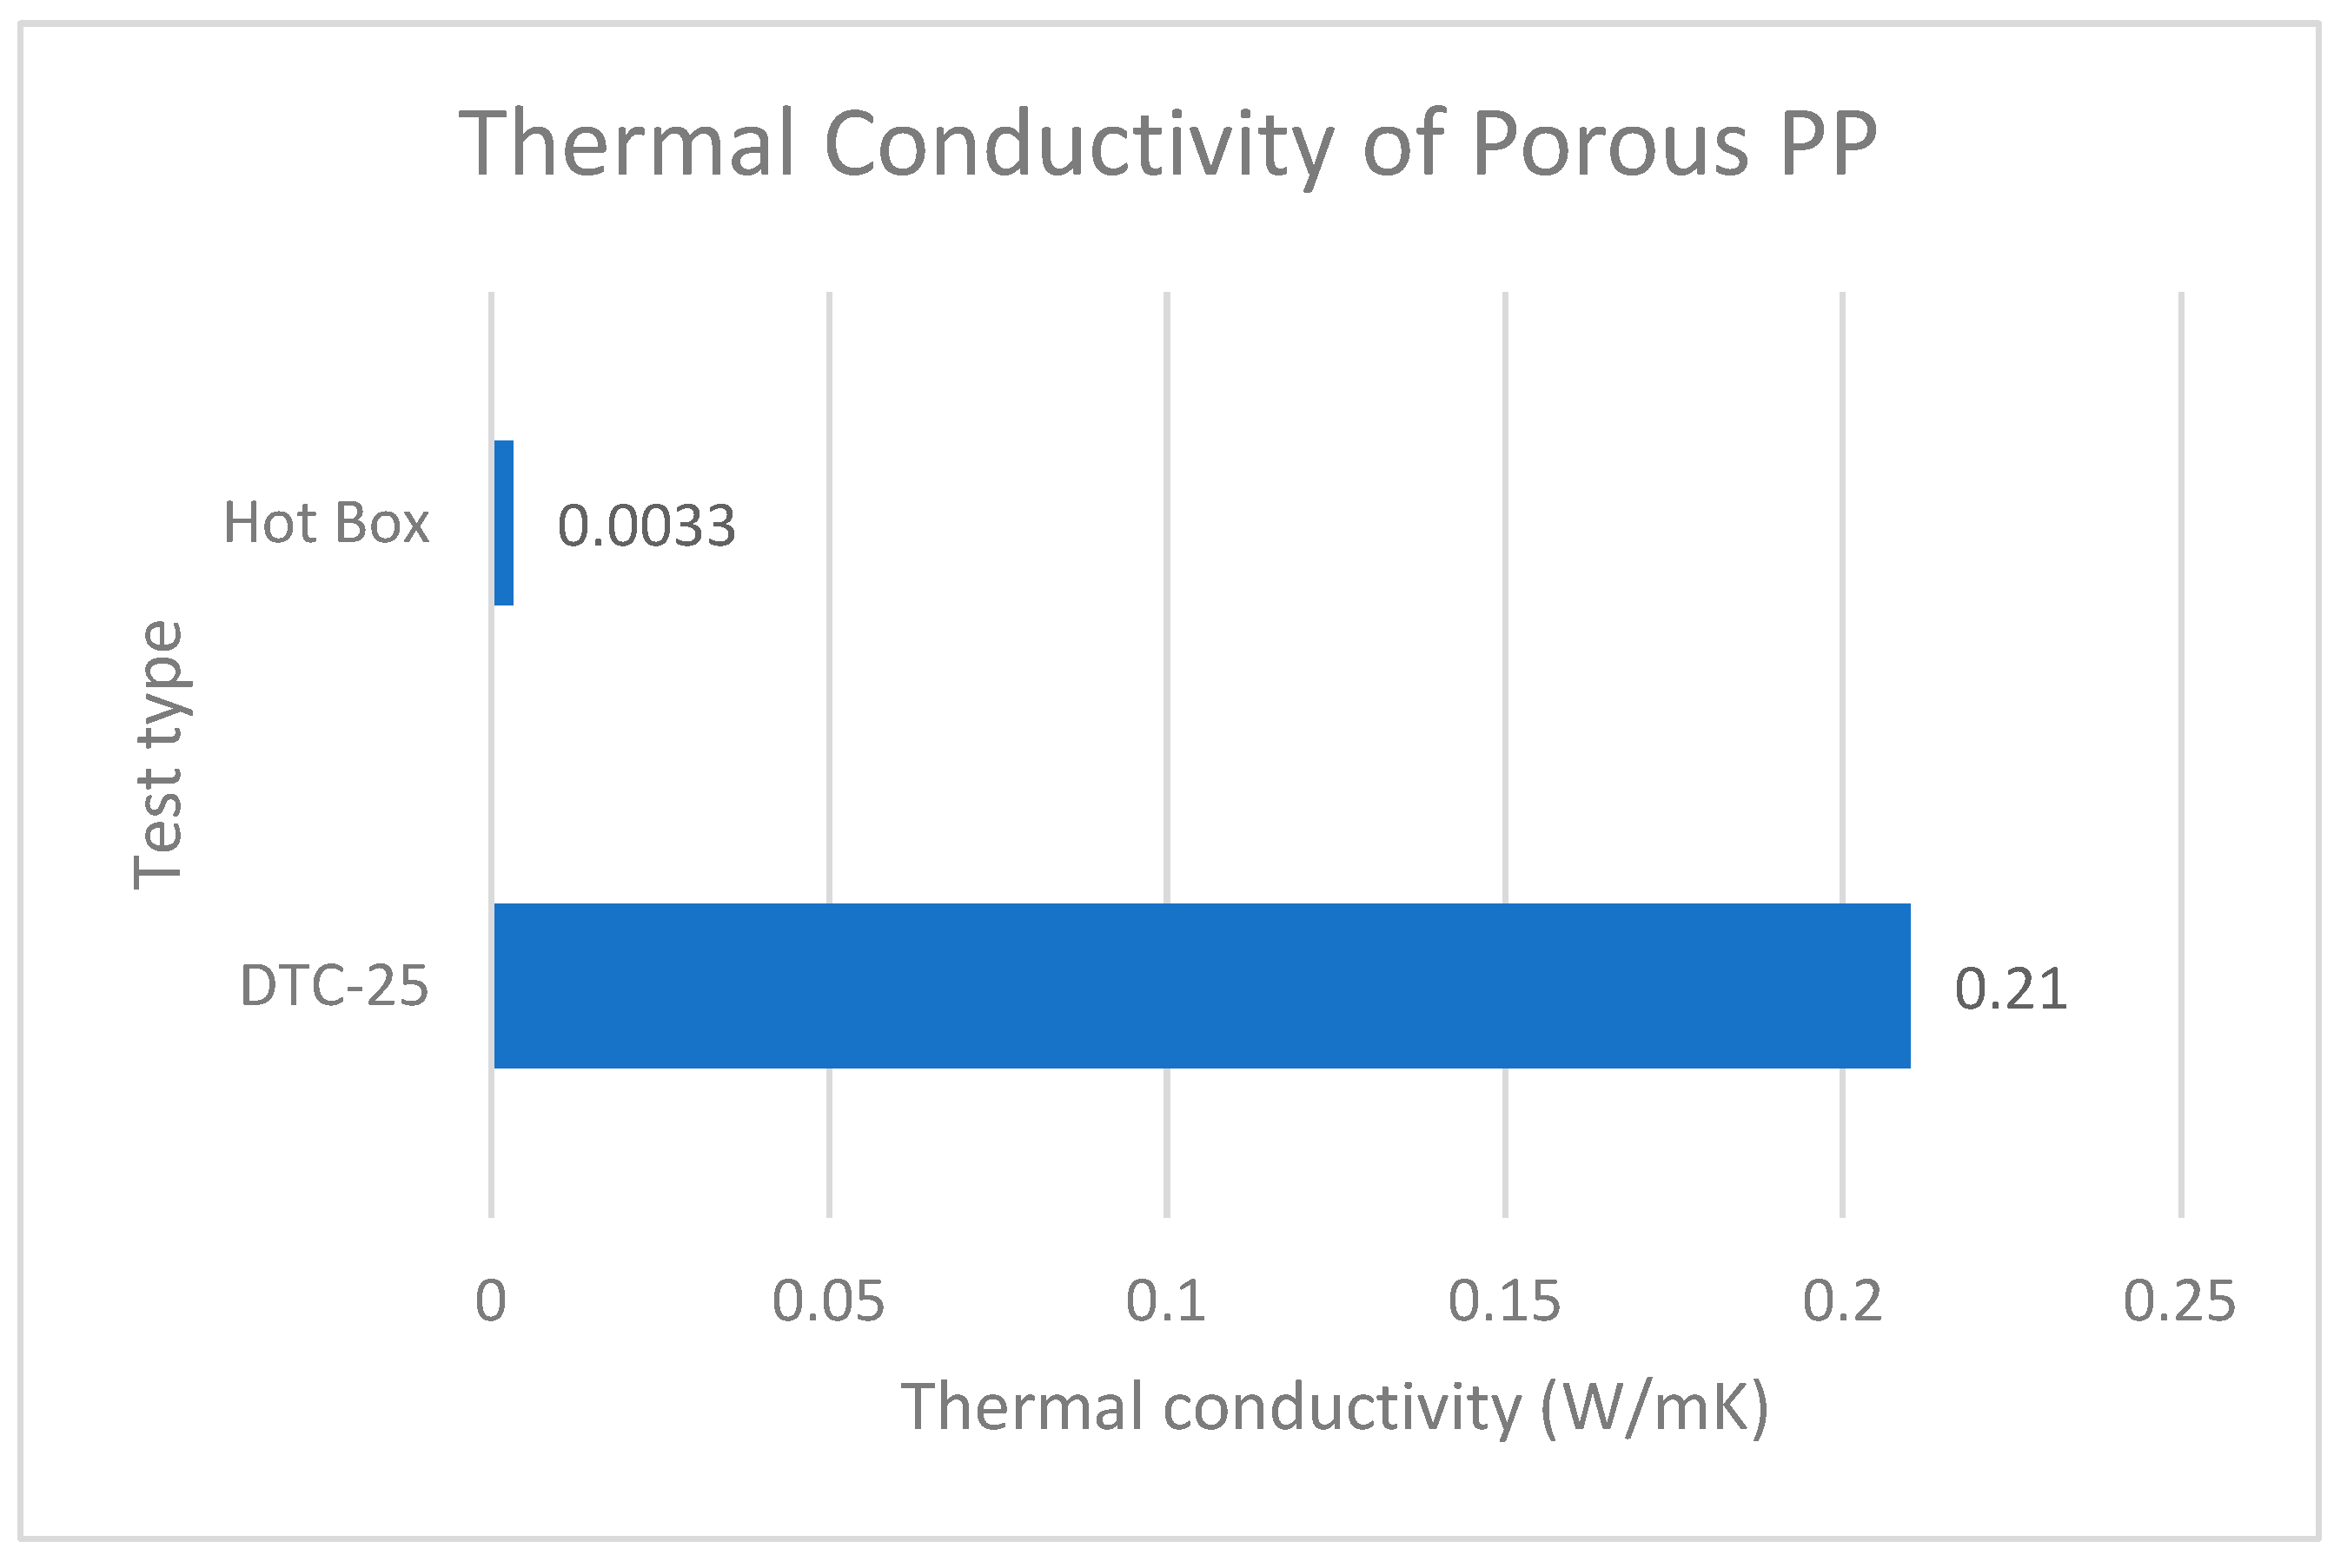
Figure 11 compares experimental thermal conductivity test by DTC-25 and hot box.
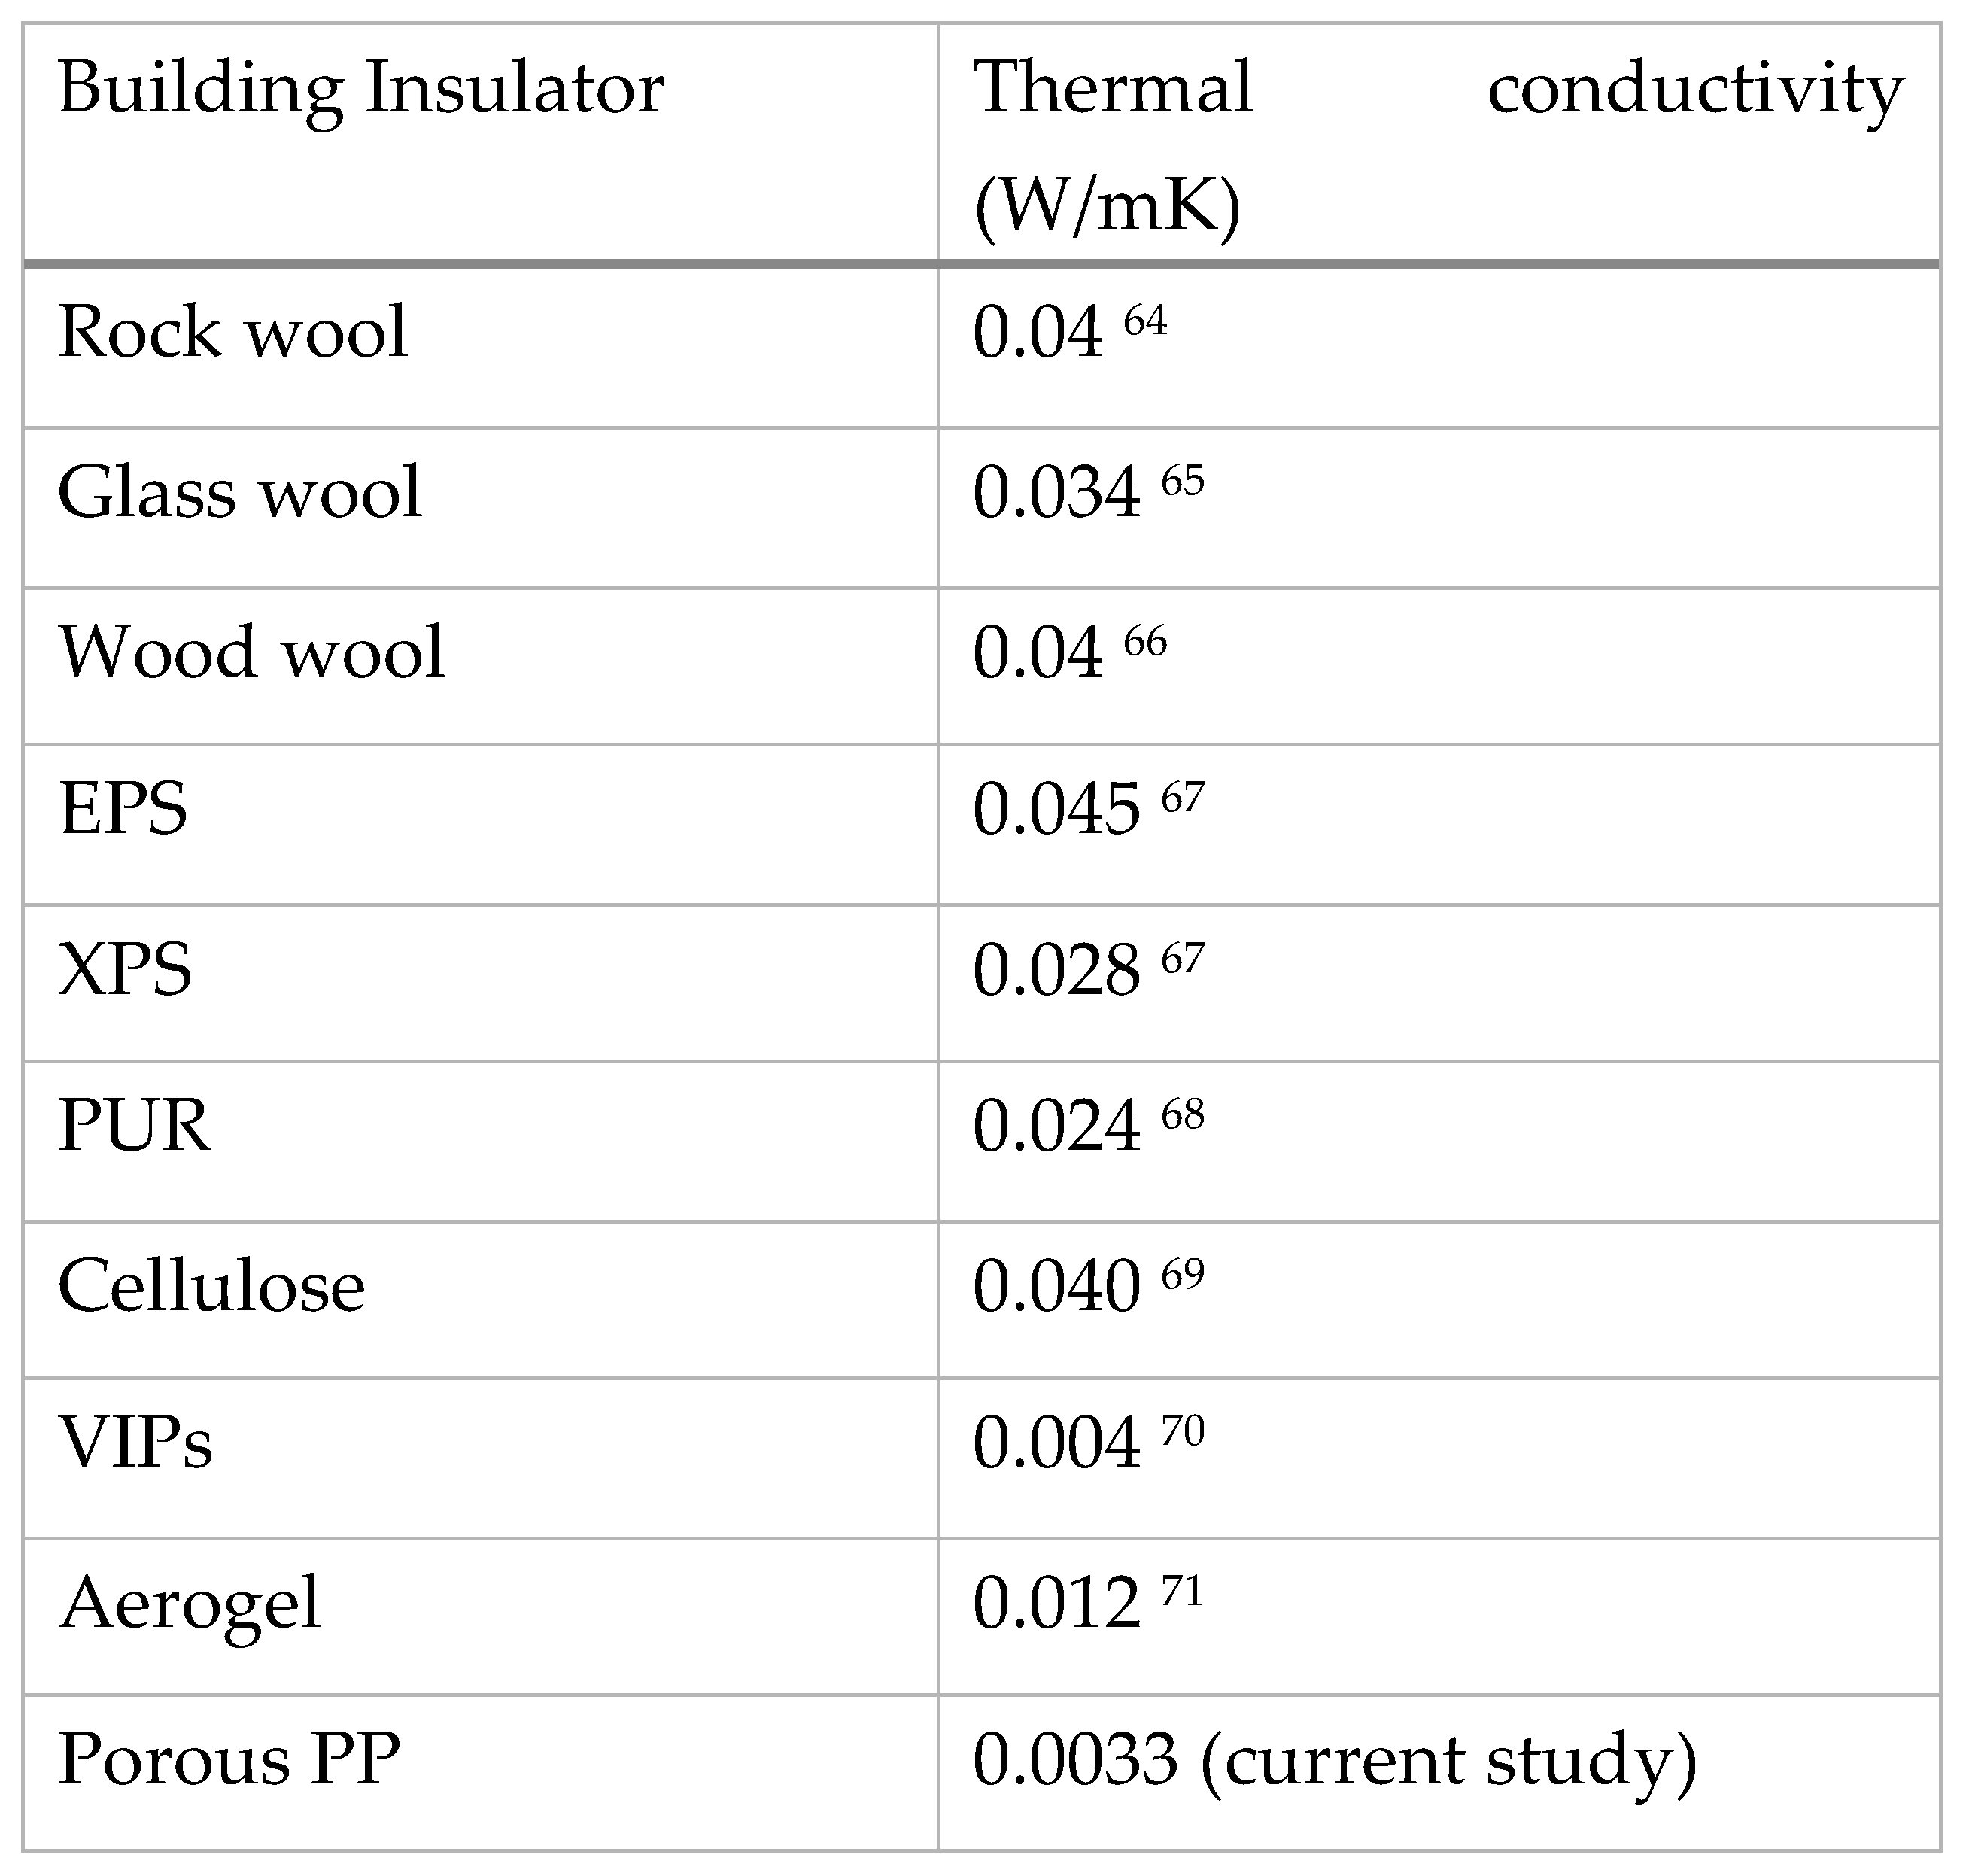
There is a marked difference in the effective thermal conductivity measurement of porous PP between the DTC-25 and hot box test. The hot box thermal conductivity measurement is of the order of 70 times less than DTC-25. The difference is due to the exclusion of convective heat transfer in the porous pp when it is in fact present when using the DTC-25. The guarded heat flow method that considers only conductive heat flow through the solid and fluid phase is the operational principle of the DTC-25. Whereas the hot box allows us to consider the influence of convective heat flow through the porous PP media as demonstrated in our approach. Selected building insulators’ thermal conductivities are compared with the thermal conductivity of our porous PP in
Figure 13. We made a bar chart of the table for better data visualization in
Figure 14.
5. Conclusion
Experimental measurement of porous PP using the DTC-25 TA laboratory equipment and hot box test has been compared. The thermal conductivity of materials indicates the insulation capability of building materials. Excellent building materials will have a lower thermal conductivities value as well as other building insulator performance metrics. While results show that increasing the volume fraction of fluid in the porous PP has an inverse association with the thermal conductivity of the material as predicted by porous media theories
47, there is a marked difference in the measured values of the thermal conductivity using the two methods. The DTC-25 test utilizes the Fourier’s guarded heat flow model which assumes conductive heat transfer throughout the multiphase material. Assessment of the Rayleigh number of the fluid phase confirmed a critical Rayleigh number has been exceeded. When the Rayleigh number is below a critical value for a fluid, there is no flow of heat and heat is transferred purely by conduction which is sufficient for the operation of the DTC-25 device. A deviation from the pure conductive heat model is attained beyond a critical Rayleigh number which kicks in heat transfer by natural convection. Our porous PP media is an example of material that has high Rayleigh number. An accurate model developed by the famous thermodynamics and heat transfer guru, Andrian Bejan to predict a combined heat transfer by conduction and convection in the porous PP was employed in the studies. The combined heat flow model was applied in the hot box test. The thermal conductivity value of the porous PP arrived from the heat flux measurement in the hot box experiment was 0.0033 W/mK. The value exceeds the performance of conventional building insulators compared in
Figure 14. The insulating metric exceeds the performance of traditional building insulators by a multiple of eight and compares favorably with the most innovative insulators, vacuum insulation panels (VIPs). Porous PP materials exhibit superior thermal insulation attributes due to the presence of convective porous structure that inhibits the direct flow of heat across the porous PP board. Results demonstrate that porous PP has efficient thermal insulation capability. There exists a potential to use hollow structured polypropylene as building insulators. They can save more energy cost than the conventional insulators and are more environmentally friendly.
Funding
This research received no specific grant from any funding agency in the public, commercial, or not-for-profit sectors.
DECLARATION OF CONFLICTING INTERESTS
The Authors declare that there is no conflict of interest.
References
- Schiavoni, S.; D׳Alessandro, F.; Bianchi, F.; Asdrubali, F. Insulation Materials for the Building Sector: A Review and Comparative Analysis. Renew. Sustain. Energy Rev. 2016, 62, 988–1011. [Google Scholar] [CrossRef]
- Monthly Energy Review – April 2018. 2018, 244.
- Khan, M. Z. A. Causes and Consequences of Greenhouse Effect & Its Catastrophic Problems for Earth. Int. J. Sustain. Manag. Inf. Technol. 2017, 3, 34. [Google Scholar] [CrossRef]
- Santamaría, J.; Campano, M. A.; Girón, S. Method for the Economic Profitability of Energy Rehabilitation Operations: Application to Residential Dwellings in Seville. Procedia Comput. Sci. 2016, 83. [Google Scholar] [CrossRef]
- Sierra-Pérez, J.; Boschmonart-Rives, J.; Gabarrell, X. Environmental Assessment of Façade-Building Systems and Thermal Insulation Materials for Different Climatic Conditions. 2016. [CrossRef]
- Abu Bakar, N. N.; Hassan, M. Y.; Abdullah, H.; Rahman, H. A.; Abdullah, M. P.; Hussin, F.; Bandi, M. Energy Efficiency Index as an Indicator for Measuring Building Energy Performance: A Review. Renew. Sustain. Energy Rev. 2015, 44, 1–11. [Google Scholar] [CrossRef]
- Kassai, M. Prediction of the HVAC Energy Demand and Consumption of a Single Family House with Different Calculation Methods. Energy Procedia 2017, 112, 585–594. [Google Scholar] [CrossRef]
- Baldinelli, G.; Asdrubali, F.; Baldassarri, C.; Bianchi, F.; D’Alessandro, F.; Schiavoni, S.; Basilicata, C. Energy and Environmental Performance Optimization of a Wooden Window: A Holistic Approach. Energy Build. 2014, 79, 114–131. [Google Scholar] [CrossRef]
- Gugliermetti, F.; Bisegna, F. Saving Energy in Residential Buildings: The Use of Fully Reversible Windows. Energy 2007, 32, 1235–1247. [Google Scholar] [CrossRef]
- Ascione, F.; Bianco, N.; De Masi, R. F.; Mauro, G. M.; Musto, M.; Vanoli, G. P. Experimental Validation of a Numerical Code by Thin Film Heat Flux Sensors for the Resolution of Thermal Bridges in Dynamic Conditions. Appl. Energy 2014, 124, 213–222. [Google Scholar] [CrossRef]
- Asdrubali, F.; D’Alessandro, F.; Baldinelli, G.; Bianchi, F. Evaluating in Situ Thermal Transmittance of Green Buildings Masonries—A Case Study. 2014. [CrossRef]
- Sim, J.; Sim, J. The Effect of External Walls on Energy Performance of a Korean Traditional Building. Sustain. Cities Soc. 2016, 24, 10–19. [Google Scholar] [CrossRef]
- Densley Tingley, D.; Hathway, A.; Davison, B. An Environmental Impact Comparison of External Wall Insulation Types. Build. Environ. 2015, 85, 182–189. [Google Scholar] [CrossRef]
- Iringova, A. Revitalisation of External Walls in Listed Buildings in the Context of Fire Protection. Procedia Eng. 2017, 195, 163–170. [Google Scholar] [CrossRef]
- Galbrun, L.; Scerri, L. Sound Insulation of Lightweight Extensive Green Roofs. Build. Environ. 2017, 116, 130–139. [Google Scholar] [CrossRef]
- Hongisto, V.; Mäkilä, M.; Suokas, M. Satisfaction with Sound Insulation in Residential Dwellings – The Effect of Wall Construction. Build. Environ. 2015, 85, 309–320. [Google Scholar] [CrossRef]
- INCA-Technical-Guide-02-Impact-Resistance-of-EWI-Systems.Pdf. https://jrmpl2t1z5gzqpmv2vjf0mqh-wpengine.netdna-ssl.com/wp-content/uploads/2017/07/INCA-Technical-Guide-02-Impact-Resistance-of-EWI-Systems.pdf (accessed 2021-12-10).
-
Aerogel Insulation: The Materials Science of Empty Space. Energy.gov. https://www.energy.gov/eere/amo/articles/aerogel-insulation-materials-science-empty-space (accessed 2021-12-10).
- Al-Homoud, Dr. M. S. Performance Characteristics and Practical Applications of Common Building Thermal Insulation Materials. Build. Environ. 2005, 40, 353–366. [Google Scholar] [CrossRef]
- Furlan, L. G.; Ferreira, C. I.; Dal Castel, C.; Santos, K. S.; Mello, A. C. E.; Liberman, S. A.; Oviedo, M. A. S.; Mauler, R. S. Effect of Processing Conditions on the Mechanical and Thermal Properties of High-Impact Polypropylene Nanocomposites. Mater. Sci. Eng. A 2011, 528, 6715–6718. [Google Scholar] [CrossRef]
- Kozderka, M.; Rose, B.; Bahlouli, N.; Kočí, V.; Caillaud, E. Recycled High Impact Polypropylene in the Automotive Industry - Mechanical and Environmental Properties. Int. J. Interact. Des. Manuf. IJIDeM 2017, 11, 737–750. [Google Scholar] [CrossRef]
- Jia, H.; Guo, J.; Zhu, J. Comparison of the Photo-Thermal Energy Conversion Behavior of Polar Bear Hair and Wool of Sheep. J. Bionic Eng. 2017, 14, 616–621. [Google Scholar] [CrossRef]
- Simonis, P.; Ratta, M.; Oualim, E. M.; Mouhse, A.; Vigneron, J.-P. Radiative Contribution to Thermal Conductance in Animal Furs and Other Woolly Insulators. Opt. Express 2014, 22, 1940–1951. [Google Scholar] [CrossRef] [PubMed]
- Metwally, S.; Martínez Comesaña, S.; Zarzyka, M.; Szewczyk, P. K.; Karbowniczek, J. E.; Stachewicz, U. Thermal Insulation Design Bioinspired by Microstructure Study of Penguin Feather and Polar Bear Hair. Acta Biomater. 2019, 91, 270–283. [Google Scholar] [CrossRef]
- Cui, Y.; Gong, H.; Wang, Y.; Li, D.; Bai, H. A Thermally Insulating Textile Inspired by Polar Bear Hair. Adv. Mater. 2018, 30, 1706807. [Google Scholar] [CrossRef]
- Dohrn, R.; Fonseca, J. M.; Albers, R.; Kušan-Bindels, J.; Marrucho, I. M. Thermal Conductivity of Polyurethane Foam Cell Gases: Improved Transient Hot Wire Cell – Data of Isopentane + n-Pentane Mixtures – Extended Wassiljewa-Model. Fluid Phase Equilibria 2007, 261, 41–49. [Google Scholar] [CrossRef]
- Kulkarni, B. D.; Doraiswamy, L. K. Estimation of Effective Transport Properties in Packed Bed Reactors. Catal. Rev. 1980, 22, 431–483. [Google Scholar] [CrossRef]
- Zhai, S.; Zhang, P.; Xian, Y.; Zeng, J.; Shi, B. Effective Thermal Conductivity of Polymer Composites: Theoretical Models and Simulation Models. Int. J. Heat Mass Transf. 2018, 117, 358–374. [Google Scholar] [CrossRef]
- Han, Z.; Fina, A. Thermal Conductivity of Carbon Nanotubes and Their Polymer Nanocomposites: A Review. Prog. Polym. Sci. 2011, 36, 914–944. [Google Scholar] [CrossRef]
- Cao, J.-P.; Zhao, X.; Zhao, J.; Zha, J.-W.; Hu, G.-H.; Dang, Z.-M. Improved Thermal Conductivity and Flame Retardancy in Polystyrene/Poly(Vinylidene Fluoride) Blends by Controlling Selective Localization and Surface Modification of SiC Nanoparticles. ACS Appl. Mater. Interfaces 2013, 5, 6915–6924. [Google Scholar] [CrossRef] [PubMed]
- Sadati, S. E.; Rahbar, N.; Kargarsharifabad, H.; KhalesiDoost, A. Low Thermal Conductivity Measurement Using Thermoelectric Technology - Mathematical Modeling and Experimental Analysis. Int. Commun. Heat Mass Transf. 2021, 127, 105534. [Google Scholar] [CrossRef]
- Islam, S.; Md. Mominul Alam, S.; Akter, S. Mathematical Investigation of the Thermal Conductivity of Fabrics Using Thermal Equation. Mater. Today Proc. 2021, 46, 413–424. [Google Scholar] [CrossRef]
- Jacquot, A.; Lenoir, B.; Dauscher, A.; Stölzer, M.; Meusel, J. Numerical Simulation of the 3ω Method for Measuring the Thermal Conductivity. J. Appl. Phys. 2002, 91, 4733–4738. [Google Scholar] [CrossRef]
- Zhang, Y.-F.; Zhao, Y.-H.; Bai, S.-L.; Yuan, X. Numerical Simulation of Thermal Conductivity of Graphene Filled Polymer Composites. Compos. Part B Eng. 2016, 106, 324–331. [Google Scholar] [CrossRef]
- Chung, K. M.; Zeng, J.; Adapa, S. R.; Feng, T.; Bagepalli, M. V.; Loutzenhiser, P. G.; Albrecht, K. J.; Ho, C. K.; Chen, R. Measurement and Analysis of Thermal Conductivity of Ceramic Particle Beds for Solar Thermal Energy Storage. Sol. Energy Mater. Sol. Cells 2021, 230, 111271. [Google Scholar] [CrossRef]
- Liang, J.-Z. Estimation of Thermal Conductivity for Polypropylene/Hollow Glass Bead Composites. Compos. Part B Eng. 2014, 56, 431–434. [Google Scholar] [CrossRef]
- Yüksel, N. The Review of Some Commonly Used Methods and Techniques to Measure the Thermal Conductivity of Insulation Materials; IntechOpen, 2016. [CrossRef]
-
ASTM C1046: Standard Practice for In-Situ Measurement of Heat Flux and Temperature on Building Envelope Components. https://www.astm.org/c1046-95r21.html (accessed 2022-08-26).
- Lu, X.; Memari, A. M. Comparison of the Experimental Measurement Methods for Building Envelope Thermal Transmittance. Buildings 2022, 12, 282. [Google Scholar] [CrossRef]
- Wang, X.; Feng, J.; Bai, Y.; Zhang, Q.; Yin, Y. Synthesis, Properties, and Applications of Hollow Micro-/Nanostructures. Chem. Rev. 2016, 116, 10983–11060. [Google Scholar] [CrossRef] [PubMed]
- Hu, F.; Wu, S.; Sun, Y. Hollow-Structured Materials for Thermal Insulation. Adv. Mater. 2019, 31, 1801001. [Google Scholar] [CrossRef] [PubMed]
- Loeb, A. L. Thermal Conductivity: VIII, A Theory of Thermal Conductivity of Porous Materials. J. Am. Ceram. Soc. 1954, 37, 96–99. [Google Scholar] [CrossRef]
- Mishra, D.; Satapathy, A. Development of Theoretical Model for Effective Thermal Conductivity of Glass Microsphere Filled Polymer Composites. Plast. Polym. Technol. 2013, 2, 9. [Google Scholar]
- Agari, Y.; Tanaka, M.; Nagai, S.; Uno, T. Thermal Conductivity of a Polymer Composite Filled with Mixtures of Particles. J. Appl. Polym. Sci. 1987, 34, 1429–1437. [Google Scholar] [CrossRef]
-
Thermal conductivity of composites with a filler of hollow spherical corundum granules | S. A. Suvorov; V. N. Fishchev; S. N. Kapustina; S. V. Kopylova; M. G. Nekhlopochina | download. https://ur.booksc.eu/book/6507799/7461db (accessed 2021-12-09).
- Cheng, S. C.; Vachon, R. A Technique for Predicting the Thermal Conductivity of Suspensions, Emulsions and Porous Materials. 1970. [CrossRef]
- Wang, M.; Pan, N. Predictions of Effective Physical Properties of Complex Multiphase Materials. Mater. Sci. Eng. R Rep. 2008, 63, 1–30. [Google Scholar] [CrossRef]
- Nait-Ali, B.; Haberko, K.; Vesteghem, H.; Absi, J.; Smith, D. S. Thermal Conductivity of Highly Porous Zirconia. J. Eur. Ceram. Soc. 2006, 26, 3567–3574. [Google Scholar] [CrossRef]
- Schumacher, C.; Straube, J.; Ober, D.; Grin, A. Development of a New Hot Box Apparatus to Measure Building Enclosure Thermal Performance. RDH Building Science. https://www.rdh.com/resource/development-of-a-new-hot-box-apparatus-to-measure-building-enclosure-thermal-performance/ (accessed 2022-08-28).
- Seitz, S.; Macdougall, C. Design of an Affordable Hot Box Testing Apparatus. NOCMAT 2015 - Constr. Sustain. - Green Mater. Technol. Winn. Can. 2015.
- Cai, S.; Zhu, W.; Cremaschi, L. Pipe Insulation Thermal Conductivity under Dry and Wet Condensing Conditions with Moisture Ingress A Critical Review, 2016.
- Connor, B. Comparison of Polystyrene Expanded and Extruded Foam Insulation in Roadway and Airport Embankments; University of Alaska, 2019; p 37.
- Bhattacharya, A.; Calmidi, V. V.; Mahajan, R. L. Thermophysical Properties of High Porosity Metal Foams. Int. J. Heat Mass Transf. 2002, 45, 1017–1031. [Google Scholar] [CrossRef]
- Paek, J.; Kang, B.; Kim, S.; Hyun, J. Effective Thermal Conductivity and Permeability of Aluminum Foam Materials 1. Int. J. Thermophys. - INT J THERMOPHYS 2000, 21, 453–464. [Google Scholar] [CrossRef]
- Calmidi, V. V.; Mahajan, R. L. The Effective Thermal Conductivity of High Porosity Fibrous Metal Foams. J. Heat Transf. 1999, 121, 466–471. [Google Scholar] [CrossRef]
- Dyga, R.; Witczak, S. Investigation of Effective Thermal Conductivity Aluminum Foams. Procedia Eng. 2012, 42, 1088–1099. [Google Scholar] [CrossRef]
- Boomsma, K.; Poulikakos, D. On the Effective Thermal Conductivity of a Three-Dimensionally Structured Fluid-Saturated Metal Foam. Int. J. Heat Mass Transf. 2001, 44, 827–836. [Google Scholar] [CrossRef]
- Jeffreys, H. LXXVI. The Stability of a Layer of Fluid Heated Below. Lond. Edinb. Dublin Philos. Mag. J. Sci. 1926, 2, 833–844. [Google Scholar] [CrossRef]
- Nygård, H. S.; Tyvand, P. A. Onset of Thermal Convection in a Vertical Porous Cylinder with a Partly Conducting and Partly Penetrative Cylinder Wall. Transp. Porous Media 2011, 86, 229–241. [Google Scholar] [CrossRef]
- Nygård, H. S.; Tyvand, P. A. Onset of Convection in a Porous Rectangle with Buoyancy Along an Open Sidewall. Transp. Porous Media 2011, 90, 403–420. [Google Scholar] [CrossRef]
- Nygård, H.; Tyvand, P. Onset of Convection in a Porous Box with Partly Conducting and Partly Penetrative Sidewalls. Transp. Porous Media - TRANS POROUS MEDIA 2010, 84, 55–73. [Google Scholar] [CrossRef]
- Adrian, B. Convection Heat Transfer, 4th Edition | Wiley. Wiley.com. https://www.wiley.com/en-us/Convection+Heat+Transfer%2C+4th+Edition-p-9780470900376 (accessed 2022-01-21).
- Nield, D. A.; Bejan, A. Heat Transfer Through a Porous Medium. In Convection in Porous Media; Nield, D. A., Bejan, A., Eds.; Springer: New York, NY, 2013; pp. 31–46. [Google Scholar] [CrossRef]
-
Thermal conductivity coefficient of rock wool. پشم سن گ ويلا. https://www.vilainsulgroup.com/thermalconductivity-coefficient-of-rock-wool/?lang=en (accessed 2023-02-03).
- Jeon, C.-K.; Lee, J.-S.; Chung, H.; Kim, J.-H.; Park, J.-P. A Study on Insulation Characteristics of Glass Wool and Mineral Wool Coated with a Polysiloxane Agent. Adv. Mater. Sci. Eng. 2017, 2017, e3938965. [Google Scholar] [CrossRef]
- Bianco, L.; Pollo, R.; Serra, V. Wood Fiber vs Synthetic Thermal Insulation for Roofs Energy Retrofit: A Case Study in Turin, Italy. Energy Procedia 2017, 111, 347–356. [Google Scholar] [CrossRef]
-
XPS and EPS comparison. https://www.karplus.com.tr/EN/xpsandepscomparison.html (accessed 2023-02-03).
- Gravit, M.; Kuleshin, A.; Khametgalieva, E.; Karakozova, I. Technical Characteristics of Rigid Sprayed PUR and PIR Foams Used in Construction Industry. IOP Conf. Ser. Earth Environ. Sci. 2017, 90, 012187. [Google Scholar] [CrossRef]
- 5 - Performance of the Bio-Based Materials. In Performance of Bio-based Building Materials; Jones, D., Brischke, C., Eds.; Woodhead Publishing, 2017; pp 249–333. [CrossRef]
- Simmler, H.; Brunner, S.; Heinemann, U.; Schwab, H.; Kumaran, K.; Mukhopadhyaya, P.; Quenard, D.; Sallee, H.; Noller, K.; Kuecuekpinar-Niarchos, E.; Stramm, C.; Tenpierik, M.; Cauberg, H.; Erb, M. Vacuum Insulation Panels - Study on VIP-Components and Panels for Service Life Prediction of VIP in Building Applications (Subtask A). 2005.
- Yang, W.; Liu, J.; Wang, Y.; Gao, S. Experimental Study on the Thermal Conductivity of Aerogel-Enhanced Insulating Materials under Various Hygrothermal Environments. Energy Build. 2020, 206, 109583. [Google Scholar] [CrossRef]
|
Disclaimer/Publisher’s Note: The statements, opinions and data contained in all publications are solely those of the individual author(s) and contributor(s) and not of MDPI and/or the editor(s). MDPI and/or the editor(s) disclaim responsibility for any injury to people or property resulting from any ideas, methods, instructions or products referred to in the content. |
© 2023 by the authors. Licensee MDPI, Basel, Switzerland. This article is an open access article distributed under the terms and conditions of the Creative Commons Attribution (CC BY) license (http://creativecommons.org/licenses/by/4.0/).
