Submitted:
22 November 2023
Posted:
23 November 2023
You are already at the latest version
Abstract
Keywords:
1. Introduction
2. Materials and Methods
2.1. Fungal Material and Inoculum Preparation
2.2. Pathogenicity Test
2.3. Evaluation of Resistance
2.4. Greenhouse Data Collection
2.5. Fungal Isolation from Field Samples
2.6. DNA Extraction, PCR Amplification and Sanger Sequencing
2.7. Phylogenetic Analysis
2.8. Data Analysis
3. Results
3.1. Pathogenicity Test
3.2. Cultivar Resistance Evaluation
3.3. Fusarium Spp. Identification
3.4. Phylogenetic Analysis
4. Discussion
5. Conclusions
Supplementary Materials
Author Contributions
Funding
Institutional Review Board Statement
Informed Consent Statement
Data Availability Statement
Acknowledgments
Conflicts of Interest
References
- Michelfelder, A.J. Soy: A Complete Source of Protein. afp 2009, 79, 43–47. [Google Scholar]
- Voora, V.; Larrea, C.; Bermúdez, S. Global Market Report: Soybeans. 2020.
- Shahbandeh, M. Production of Soybeans in Leading Countries Worldwide, 2012-2023. Available online: https://www.statista.com/statistics/263926/soybean-production-in-selected-countries-since-1980/ (accessed on 25 April 2023).
- Government of Canada, S.C. Estimated Areas, Yield, Production, Average Farm Price and Total Farm Value of Principal Field Crops, in Metric and Imperial Units. Available online: https://www150.statcan.gc.ca/t1/tbl1/en/tv.action?pid=3210035901 (accessed on 17 April 2023).
- Barthet, V.J.; Puvirajah, A. Quality of Canadian Oilseed-Type Soybeans 2022. 2022.
- Canada, A. and A.-F. Canada: Outlook for Principal Field Crops, 2022-11-18. Available online: https://agriculture.canada.ca/en/sector/crops/reports-statistics/canada-outlook-principal-field-crops-2022-11-18 (accessed on 25 April 2023).
- Hartman, G.L.; Sinclair, J.B.; Rupe, J.C. Compendium of Soybean Diseases, 4th Edn, Ed. G. L. HARTMAN, J. B. SINCLAIR & J. C. RUPE. Vi+100 Pp. St. Paul, Minnesota: APS Press (1999). $37.00 (Paperback). ISBN 0 89054 238 4. The Journal of Agricultural Science 2000, 135, 95–100. [Google Scholar] [CrossRef]
- Bradley, C.A.; Allen, T.W.; Sisson, A.J.; Bergstrom, G.C.; Bissonnette, K.M.; Bond, J.; Byamukama, E.; Chilvers, M.I.; Collins, A.A.; Damicone, J.P.; et al. Soybean Yield Loss Estimates Due to Diseases in the United States and Ontario, Canada, from 2015 to 2019. Plant Health Progress 2021, 22, 483–495. [Google Scholar] [CrossRef]
- Hafez, M.; Abdelmagid, A.; Aboukhaddour, R.; Adam, L.R.; Daayf, F. Fusarium Root Rot Complex in Soybean: Molecular Characterization, Trichothecene Formation, and Cross-Pathogenicity. Phytopathology® 2021, 111, 2287–2302. [Google Scholar] [CrossRef] [PubMed]
- Arias, M.M.D.; Munkvold, G.P.; Ellis, M.L.; Leandro, L.F.S. Distribution and Frequency of Fusarium Species Associated with Soybean Roots in Iowa. Plant Disease 2013, 97, 1557–1562. [Google Scholar] [CrossRef] [PubMed]
- Arias, M.; Leandro, L.; Munkvold, G. Frequency of Isolation, Aggressiveness, and Impact on Yield of Fusarium Root Rot Species in Soybean in Iowa; 2012; p. 30.
- Michielse, C.B.; Rep, M. Pathogen Profile Update: Fusarium Oxysporum. Molecular Plant Pathology 2009, 10, 311–324. [Google Scholar] [CrossRef] [PubMed]
- Armstrong, G.M.; Armstrong, J.K. Biological races of the Fusarium causing wilt of Cowpea and Soybeans. Phytopathology 1950, 40. [Google Scholar]
- Zhou, Q.; Li, N.; Chang, K.-F.; Hwang, S.-F.; Strelkov, S.E.; Conner, R.L.; McLaren, D.L.; Fu, H.; Harding, M.W.; Turnbull, G.D. Genetic Diversity and Aggressiveness of Fusarium Species Isolated from Soybean in Alberta, Canada. Crop Protection 2018, 105, 49–58. [Google Scholar] [CrossRef]
- Chang, K.F.; Hwang, S.F.; Conner, R.L.; Ahmed, H.U.; Zhou, Q.; Turnbull, G.D.; Strelkov, S.E.; McLaren, D.L.; Gossen, B.D. First Report of Fusarium Proliferatum Causing Root Rot in Soybean (Glycine Max L.) in Canada. Crop Protection 2015, 67, 52–58. [Google Scholar] [CrossRef]
- Abdelmagid, A.; Hafez, M.; Soliman, A.; Adam, L.R.; Daayf, F. First Report of Fusarium Sporotrichioides Causing Root Rot of Soybean in Canada and Detection of the Pathogen in Host Tissues by PCR. Canadian Journal of Plant Pathology 2021, 43, 527–536. [Google Scholar] [CrossRef]
- Yang, X.B.; Feng, F. Ranges and Diversity of Soybean Fungal Diseases in North America. Phytopathology® 2001, 91, 769–775. [Google Scholar] [CrossRef] [PubMed]
- Pioli, R.N.; Mozzoni, L.; Morandi, E.N. First Report of Pathogenic Association Between Fusarium Graminearum and Soybean. Plant Disease 2004, 88, 220–220. [Google Scholar] [CrossRef]
- Zhao, L.; Wei, X.; Zheng, T.; Gou, Y.-N.; Wang, J.; Deng, J.-X.; Li, M. Evaluation of Pathogenic Fusarium Spp. Associated with Soybean Seed (Glycine Max L.) in Hubei Province, China. Plant Dis 2022. [Google Scholar] [CrossRef]
- Abdelmagid, A.; Hafez, M.; Lawley, Y.; Adam, L.R.; Daayf, F. First Report of Fusarium Cerealis Causing Root Rot on Soybean. Plant Disease 2018, 102, 2638. [Google Scholar] [CrossRef]
- Hartman, G.L. Compendium of Soybean Diseases and Pests; Fifth edition.; APS Press, The American Phytopathological Society, 2015. ISBN 978-0-89054-473-0.
- Ellis, M.L.; Arias, M.M.D.; Leandro, L.F.; Munkvold, G.P. First Report of Fusarium Armeniacum Causing Seed Rot and Root Rot on Soybean (Glycine Max) in the United States. Plant Disease 2012, 96, 1693–1693. [Google Scholar] [CrossRef]
- Ellis, M.L.; Arias, M.M.D.; Jimenez, D.R.C.; Munkvold, G.P.; Leandro, L.F. First Report of Fusarium Commune Causing Damping-off, Seed Rot, and Seedling Root Rot on Soybean (Glycine Max) in the United States. Plant Dis 2013, 97, 284. [Google Scholar] [CrossRef]
- Killebrew, J.F. Greenhouse and Field Evaluation of Fusarium Solani Pathogenicity to Soybean Seedlings. Plant Dis. 1988, 72, 1067. [Google Scholar] [CrossRef]
- Cruz Jimenez, D.R.; Ellis, M.L.; Munkvold, G.P.; Leandro, L.F.S. Isolate–Cultivar Interactions, In Vitro Growth, and Fungicide Sensitivity of Fusarium Oxysporum Isolates Causing Seedling Disease on Soybean. Plant Disease 2018, 102, 1928–1937. [Google Scholar] [CrossRef] [PubMed]
- Chang, X.; Dai, H.; Wang, D.; Zhou, H.; He, W.; Fu, Y.; Ibrahim, F.; Zhou, Y.; Gong, G.; Shang, J.; et al. Identification of Fusarium Species Associated with Soybean Root Rot in Sichuan Province, China. Eur J Plant Pathol 2018, 151, 563–577. [Google Scholar] [CrossRef]
- Zhang, J.X.; Xue, A.G.; Cober, E.R.; Morrison, M.J.; Zhang, H.J.; Zhang, S.Z.; Gregorich, E. Prevalence, Pathogenicity and Cultivar Resistance of Fusarium and Rhizoctonia Species Causing Soybean Root Rot. cjps 2013, 93, 221–236. [Google Scholar] [CrossRef]
- Leslie, J.F.; Summerell, B.A. The Fusarium Laboratory Manual; John Wiley & Sons, 2008. ISBN 978-0-470-27646-4.
- Vujanovic, V.; Hamel, C.; Yergeau, E.; St-Arnaud, M. Biodiversity and Biogeography of Fusarium Species from Northeastern North American Asparagus Fields Based on Microbiological and Molecular Approaches. Microb Ecol 2006, 51, 242–255. [Google Scholar] [CrossRef] [PubMed]
- Feng, J.; Hwang, R.; Chang, K.F.; Hwang, S.F.; Strelkov, S.E.; Gossen, B.D.; Conner, R.L.; Turnbull, G.D. Genetic Variation in Fusarium Avenaceum Causing Root Rot on Field Pea. Plant Pathology 2010, 59, 845–852. [Google Scholar] [CrossRef]
- van Diepeningen, A.D.; Brankovics, B.; Iltes, J.; van der Lee, T.A.J.; Waalwijk, C. Diagnosis of Fusarium Infections: Approaches to Identification by the Clinical Mycology Laboratory. Curr Fungal Infect Rep 2015, 9, 135–143. [Google Scholar] [CrossRef] [PubMed]
- Porter, T.M.; Brian Golding, G. Are Similarity- or Phylogeny-Based Methods More Appropriate for Classifying Internal Transcribed Spacer (ITS) Metagenomic Amplicons? New Phytologist 2011, 192, 775–782. [Google Scholar] [CrossRef] [PubMed]
- White, T.; Bruns, T.; Lee, S.; Taylor, J.; Innis, M.; Gelfand, D.; Sninsky, J. Amplification and Direct Sequencing of Fungal Ribosomal RNA Genes for Phylogenetics. In Pcr Protocols: a Guide to Methods and Applications,; 1990; Vol. 31, pp. 315–322.
- Wang, M.; Chen, Q.; Diao, Y.; Duan, W.; Cai, L. Fusarium Incarnatum-Equiseti Complex from China. Persoonia 2019, 43, 70–89. [Google Scholar] [CrossRef]
- Kalman, B.; Abraham, D.; Graph, S.; Perl-Treves, R.; Meller Harel, Y.; Degani, O. Isolation and Identification of Fusarium Spp., the Causal Agents of Onion (Allium Cepa) Basal Rot in Northeastern Israel. Biology (Basel) 2020, 9, 69. [Google Scholar] [CrossRef] [PubMed]
- Chen, Y.; Zhou, Q.; Strelkov, S.E.; Hwang, S.-F. Genetic Diversity and Aggressiveness of Fusarium Spp. Isolated from Canola in Alberta, Canada. Plant Disease 2014, 98, 727–738. [Google Scholar] [CrossRef] [PubMed]
- Kashyap, P.L.; Rai, S.; Kumar, S.; Srivastava, A.K.; Anandaraj, M.; Sharma, A.K. Mating Type Genes and Genetic Markers to Decipher Intraspecific Variability among Fusarium Udum Isolates from Pigeonpea: Diversity Analysis of Fusarium Udum Isolates. J. Basic Microbiol. 2015, 55, 846–856. [Google Scholar] [CrossRef]
- O’Donnell, K.; Rooney, A.P.; Proctor, R.H.; Brown, D.W.; McCormick, S.P.; Ward, T.J.; Frandsen, R.J.N.; Lysøe, E.; Rehner, S.A.; Aoki, T.; et al. Phylogenetic Analyses of RPB1 and RPB2 Support a Middle Cretaceous Origin for a Clade Comprising All Agriculturally and Medically Important Fusaria. Fungal Genetics and Biology 2013, 52, 20–31. [Google Scholar] [CrossRef]
- Torres-Cruz, T.J.; Whitaker, B.K.; Proctor, R.H.; Broders, K.; Laraba, I.; Kim, H.-S.; Brown, D.W.; O’Donnell, K.; Estrada-Rodríguez, T.L.; Lee, Y.-H.; et al. FUSARIUM-ID v.3.0: An Updated, Downloadable Resource for Fusarium Species Identification. Plant Disease 2022, 106, 1610–1616. [Google Scholar] [CrossRef] [PubMed]
- Dash, A.; Gurdaswani, V.; D’Souza, J.; Ghag, S. Functional Characterization of an Inducible Bidirectional Promoter from Fusarium Oxysporum f. Sp. Cubense. Scientific Reports 2020, 10. [Google Scholar] [CrossRef]
- Khuna, S.; Kumla, J.; Thitla, T.; Nuangmek, W.; Lumyong, S.; Suwannarach, N. Morphology, Molecular Identification, and Pathogenicity of Two Novel Fusarium Species Associated with Postharvest Fruit Rot of Cucurbits in Northern Thailand. J Fungi (Basel) 2022, 8, 1135. [Google Scholar] [CrossRef] [PubMed]
- Spanic, V.; Lemmens, M.; Drezner, G. Morphological and Molecular Identification of Fusarium Species Associated with Head Blight on Wheat in East Croatia. Eur J Plant Pathol 2010, 128, 511–516. [Google Scholar] [CrossRef]
- Parikh, L.; Kodati, S.; Eskelson, M.J.; Adesemoye, A.O. Identification and Pathogenicity of Fusarium Spp. in Row Crops in Nebraska. Crop Protection 2018, 108, 120–127. [Google Scholar] [CrossRef]
- Moparthi, S.; Burrows, M.; Mgbechi-Ezeri, J.; Agindotan, B. Fusarium Spp. Associated With Root Rot of Pulse Crops and Their Cross-Pathogenicity to Cereal Crops in Montana. Plant Disease 2021, 105, 548–557. [Google Scholar] [CrossRef] [PubMed]
- Shabeer, S.; Tahira, R.; Jamal, A. Fusarium Spp. Mycotoxin Production, Diseases and Their Management: An Overview. PJAR 2021, 34. [Google Scholar] [CrossRef]
- Safarieskandari, S.; Chatterton, S.; Hall, L.M. Pathogenicity and Host Range of Fusarium Species Associated with Pea Root Rot in Alberta, Canada. Canadian Journal of Plant Pathology 2021, 43, 162–171. [Google Scholar] [CrossRef]
- Ellis, M.L.; Munkvold, G.P. Trichothecene Genotype of Fusarium Graminearum Isolates from Soybean (Glycine Max) Seedling and Root Diseases in the United States. Plant Dis 2014, 98, 1012. [Google Scholar] [CrossRef] [PubMed]
- Cruz, D.R.; Leandro, L.F.S.; Mayfield, D.A.; Meng, Y.; Munkvold, G.P. Effects of Soil Conditions on Root Rot of Soybean Caused by Fusarium Graminearum. Phytopathology® 2020, 110, 1693–1703. [Google Scholar] [CrossRef]
- Gaspar, A.P.; Marburger, D.A.; Mourtzinis, S.; Conley, S.P. Soybean Seed Yield Response to Multiple Seed Treatment Components across Diverse Environments. Agronomy Journal 2014, 106, 1955–1962. [Google Scholar] [CrossRef]
- Esker, P.D.; Conley, S.P. Probability of Yield Response and Breaking Even for Soybean Seed Treatments. Crop Science 2012, 52, 351–359. [Google Scholar] [CrossRef]
- McKenzie-Gopsill, A.; Beaton, A.; Foster, A.J. Investigating the Effects of Seed Treatments on the Economically Optimal Seeding Rate of Conventional Soybean in Atlantic Canada. cjps 2022, 103, 201–213. [Google Scholar] [CrossRef]
- Nyandoro, R.; Chang, K.F.; Hwang, S.F.; Ahmed, H.U.; Turnbull, G.D.; Strelkov, S.E. Management of Root Rot of Soybean in Alberta with Fungicide Seed Treatments and Genetic Resistance. Can. J. Plant Sci. 2019, 99, 499–509. [Google Scholar] [CrossRef]
- Zhang, J.X.; Xue, A.G.; Tambong, J.T. Evaluation of Seed and Soil Treatments with Novel Bacillus Subtilis Strains for Control of Soybean Root Rot Caused by Fusarium Oxysporum and F. Graminearum. Plant Disease 2009, 93, 1317–1323. [Google Scholar] [CrossRef] [PubMed]
- Wang, J.; Jacobs, J.L.; Roth, M.G.; Chilvers, M.I. Temporal Dynamics of Fusarium Virguliforme Colonization of Soybean Roots. Plant Disease 2019, 103, 19–27. [Google Scholar] [CrossRef]
- Herman, T.K.; Bowen, R.; Mahan, A.L.; Hartman, G.L. Evaluation of Soybean Germplasm for Resistance to Fusarium Virguliforme, the Major Pathogen Causing Sudden Death Syndrome of Soybean in the United States. Crop Science 2023, 63, 1344–1353. [Google Scholar] [CrossRef]
- Kazi, S.; Shultz, J.; Afzal, J.; Johnson, J.; Njiti, V.N.; Lightfoot, D.A. Separate Loci Underlie Resistance to Root Infection and Leaf Scorch during Soybean Sudden Death Syndrome. Theor Appl Genet 2008, 116, 967–977. [Google Scholar] [CrossRef]
- Acharya, B.; Lee, S.; Rouf Mian, M.A.; Jun, T.-H.; McHale, L.K.; Michel, A.P.; Dorrance, A.E. Identification and Mapping of Quantitative Trait Loci (QTL) Conferring Resistance to Fusarium Graminearum from Soybean PI 567301B. Theor Appl Genet 2015, 128, 827–838. [Google Scholar] [CrossRef]
- Swaminathan, S.; Abeysekara, N.S.; Liu, M.; Cianzio, S.R.; Bhattacharyya, M.K. Quantitative Trait Loci Underlying Host Responses of Soybean to Fusarium Virguliforme Toxins That Cause Foliar Sudden Death Syndrome. Theor Appl Genet 2016, 129, 495–506. [Google Scholar] [CrossRef]
- Almeida-Silva, F.; Venancio, T.M. Integration of Genome-Wide Association Studies and Gene Coexpression Networks Unveils Promising Soybean Resistance Genes against Five Common Fungal Pathogens. Sci Rep 2021, 11, 24453. [Google Scholar] [CrossRef] [PubMed]
- Weinig, C.; Schmitt, J. Environmental Effects on the Expression of Quantitative Trait Loci and Implications for Phenotypic Evolution. BioScience 2004, 54, 627–635. [Google Scholar] [CrossRef]
- Li, S.; Wang, J.; Zhang, L. Inclusive Composite Interval Mapping of QTL by Environment Interactions in Biparental Populations. PLOS ONE 2015, 10, e0132414. [Google Scholar] [CrossRef]
- Luckew, A.S.; Cianzio, S.R.; Leandro, L.F. Screening Method for Distinguishing Soybean Resistance to Fusarium Virguliforme in Resistant × Resistant Crosses. Crop Science 2012, 52, 2215–2223. [Google Scholar] [CrossRef]
- Zhang, J.X.; Xue, A.G.; Zhang, H.J.; Nagasawa, A.E.; Tambong, J.T. Response of Soybean Cultivars to Root Rot Caused by Fusarium Species. Can. J. Plant Sci. 2010, 90, 767–776. [Google Scholar] [CrossRef]
- Kim, Y.M.; McLaren, D.; Conner, R.; Henriquez, M.A.; Abdelmagid, A.; Wu, L.; Hwang, S.; Strelkov, S.; Chatterton, S.; Wally, O. The Fusarium Root Rot Complex of Soybean, Dry Bean and Field Pea in Manitoba, Canada. In book of Abstracts, The 12th International congress of Plant Pathology. Lyon, France, August 20-25, 2023. pp. 1124-1125.
- O’Donnell, K.; Cigelnik, E. Two Divergent Intragenomic rDNA ITS2 Types within a Monophyletic Lineage of the FungusFusariumAre Nonorthologous. Molecular Phylogenetics and Evolution 1997, 7, 103–116. [Google Scholar] [CrossRef] [PubMed]
- Hall, T. BioEdit: A User-Friendly Biological Sequence Alignment Editor and Analysis Program for Windows 95/98/NT. Nucleic Acids Symposium Series 1999, 41, 95–98. [Google Scholar] [CrossRef]
- R Core Team R: A Language and Environment for Statistical Computing 2022.
- Moreira, G.M.; Machado, F.J.; Pereira, C.B.; Neves, D.L.; Tessmann, D.J.; Ward, T.J.; Del Ponte, E.M. First Report of the Fusarium Tricinctum Species Complex Causing Fusarium Head Blight of Wheat in Brazil. Plant Disease 2020, 104, 586–586. [Google Scholar] [CrossRef]
- Crous, P.W.; Hernández-Restrepo, M.; van Iperen, A.L.; Starink-Willemse, M.; Sandoval-Denis, M.; Groenewald, J.Z. Citizen Science Project Reveals Novel Fusarioid Fungi (Nectriaceae, Sordariomycetes) from Urban Soils. Fungal Syst Evol 2021, 8, 101–127. [Google Scholar] [CrossRef] [PubMed]
- Paugh, K.R.; Del Castillo Múnera, J.; Swett, C.L. First Report of Fusarium Falciforme (FSSC 3 + 4) Causing Rot of Industrial Hemp (Cannabis Sativa) in California. Plant Disease 2022, 106, 1753. [Google Scholar] [CrossRef]
- Xu, X.; Zhang, L.; Yang, X.; Shen, G.; Wang, S.; Teng, H.; Yang, C.; Liu, X.; Wang, X.; Zhao, J.; et al. Fusarium Species Associated with Maize Leaf Blight in Heilongjiang Province, China. Journal of Fungi 2022, 8, 1170. [Google Scholar] [CrossRef] [PubMed]
- Dongzhen, F.; Xilin, L.; Xiaorong, C.; Wenwu, Y.; Yunlu, H.; Yi, C.; Jia, C.; Zhimin, L.; Litao, G.; Tuhong, W.; et al. Fusarium Species and Fusarium Oxysporum Species Complex Genotypes Associated With Yam Wilt in South-Central China. Front Microbiol 2020, 11, 1964. [Google Scholar] [CrossRef]
- Pfordt, A.; Ramos Romero, L.; Schiwek, S.; Karlovsky, P.; von Tiedemann, A. Impact of Environmental Conditions and Agronomic Practices on the Prevalence of Fusarium Species Associated with Ear- and Stalk Rot in Maize. Pathogens 2020, 9, 236. [Google Scholar] [CrossRef] [PubMed]
- Pramunadipta, S.; Widiastuti, A.; Wibowo, A.; Suga, H.; Priyatmojo, A. Identification and Pathogenicity of Fusarium Spp. Associated with the Sheath Rot Disease of Rice (Oryza Sativa) in Indonesia. J Plant Pathol 2022, 104, 251–267. [Google Scholar] [CrossRef]
- Achari, S.R.; Kaur, J.; Dinh, Q.; Mann, R.; Sawbridge, T.; Summerell, B.A.; Edwards, J. Phylogenetic Relationship between Australian Fusarium Oxysporum Isolates and Resolving the Species Complex Using the Multispecies Coalescent Model. BMC Genomics 2020, 21, 248. [Google Scholar] [CrossRef] [PubMed]
- Escamilla, D.; Rosso, M.L.; Zhang, B. Identification of Fungi Associated with Soybeans and Effective Seed Disinfection Treatments. Food Sci Nutr 2019, 7, 3194–3205. [Google Scholar] [CrossRef] [PubMed]
- Okello, P.N.; Petrović, K.; Kontz, B.; Mathew, F.M. Eight Species of Fusarium Cause Root Rot of Corn (Zea Mays) in South Dakota. Plant Health Progress 2019, 20, 38–43. [Google Scholar] [CrossRef]
- Singha, I.M.; Kakoty, Y.; Unni, B.G.; Das, J.; Kalita, M.C. Identification and Characterization of Fusarium Sp. Using ITS and RAPD Causing Fusarium Wilt of Tomato Isolated from Assam, North East India. Journal of Genetic Engineering and Biotechnology 2016, 14, 99–105. [Google Scholar] [CrossRef]
- O’Donnell, K.; Sutton, D.A.; Rinaldi, M.G.; Gueidan, C.; Crous, P.W.; Geiser, D.M. Novel Multilocus Sequence Typing Scheme Reveals High Genetic Diversity of Human Pathogenic Members of the Fusarium Incarnatum-F. Equiseti and F. Chlamydosporum Species Complexes within the United States. J Clin Microbiol 2009, 47, 3851–3861. [Google Scholar] [CrossRef]
- Nosratabadi, M.; Kachuei, R.; Rezaie, S.; Harchegani, A.B. Beta-Tubulin Gene in the Differentiation of Fusarium Species by PCR-RFLP Analysis. Infez Med 2018, 26, 52–60. [Google Scholar]
- O’Donnell, K.; Gräfenhan, T.; Laraba, I.; Busman, M.; Proctor, R.H.; Kim, H.-S.; Wiederhold, N.P.; Geiser, D.M.; Seifert, K.A. Fusarium Abutilonis and F. Guadeloupense, Two Novel Species in the Fusarium Buharicum Clade Supported by Multilocus Molecular Phylogenetic Analyses. Mycologia 2022, 114, 682–696. [Google Scholar] [CrossRef]
- O’Donnell, K.; Whitaker, B.K.; Laraba, I.; Proctor, R.H.; Brown, D.W.; Broders, K.; Kim, H.-S.; McCormick, S.P.; Busman, M.; Aoki, T.; et al. DNA Sequence-Based Identification of Fusarium: A Work in Progress. Plant Disease 2022, 106, 1597–1609. [Google Scholar] [CrossRef]
- Tian, Y.H.; Hou, Y.Y.; Peng, C.Y.; Wang, Y.Y.; He, B.L.; Gao, K.X. [Genetic diversity and phylogenetic analysis of Fusarium oxysporium strains isolated from the Cucurbitaceae hosts revealed by SRAPs]. Ying Yong Sheng Tai Xue Bao 2017, 28, 947–956. [Google Scholar] [CrossRef] [PubMed]
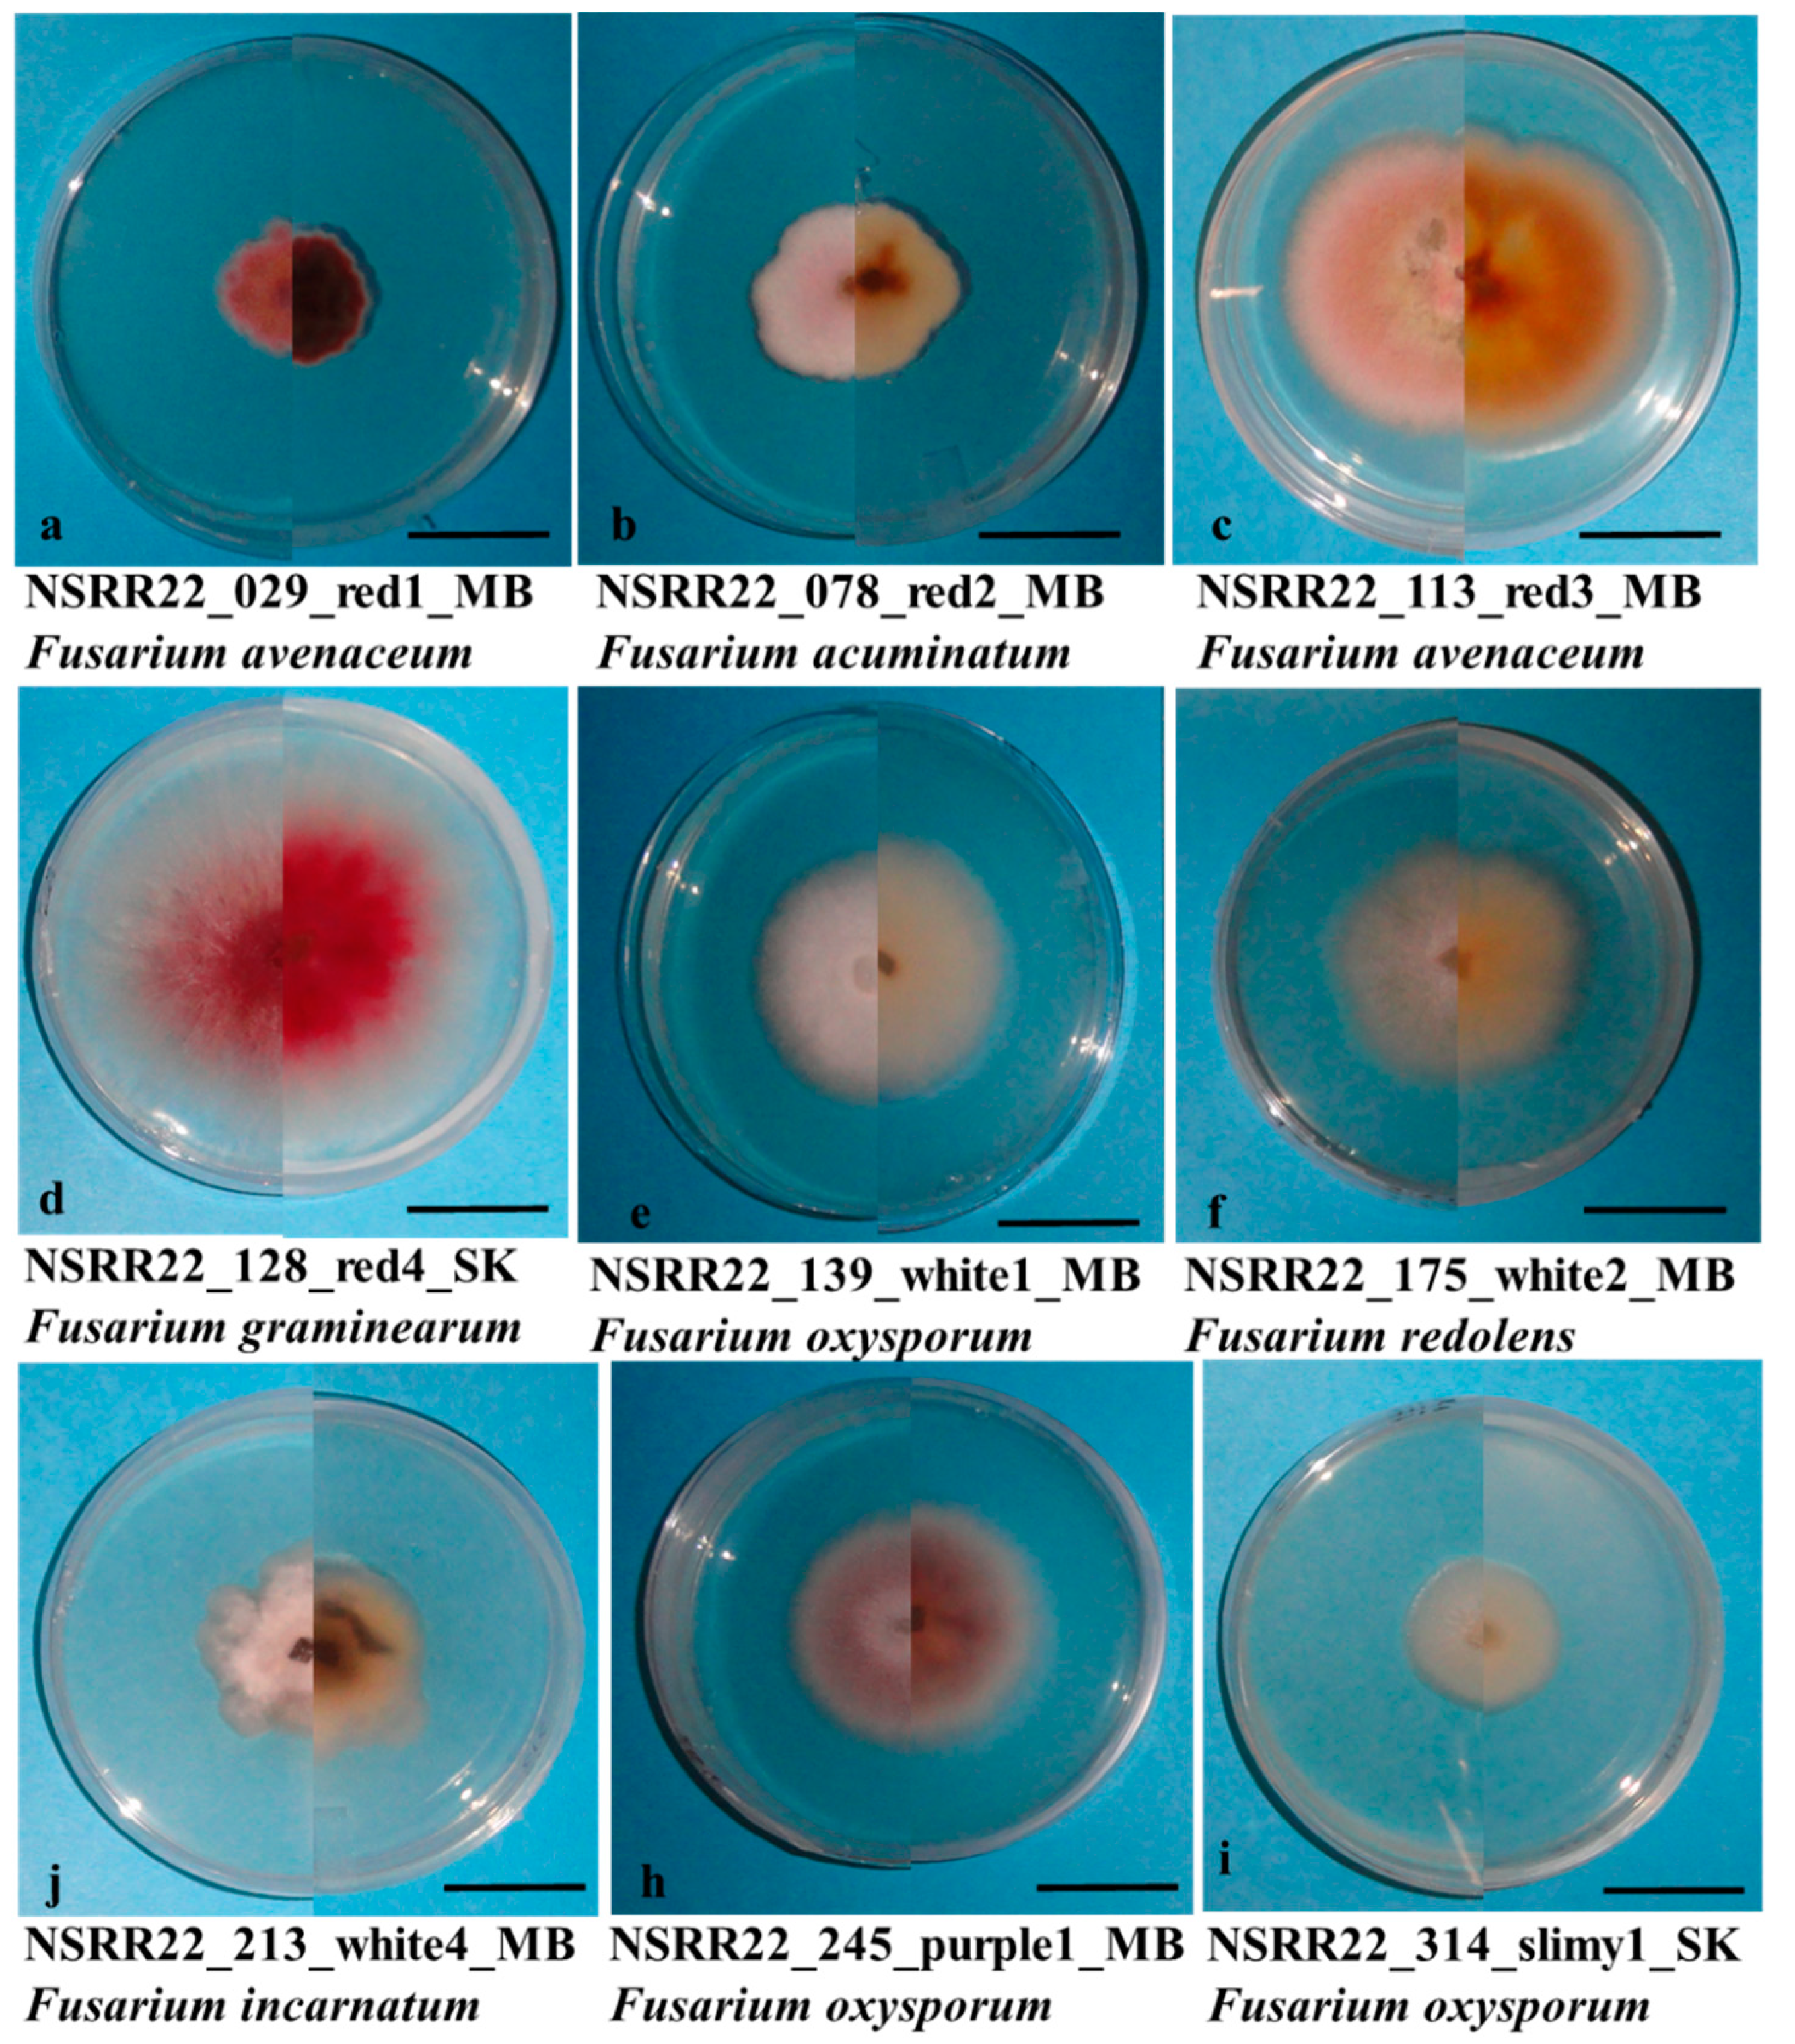

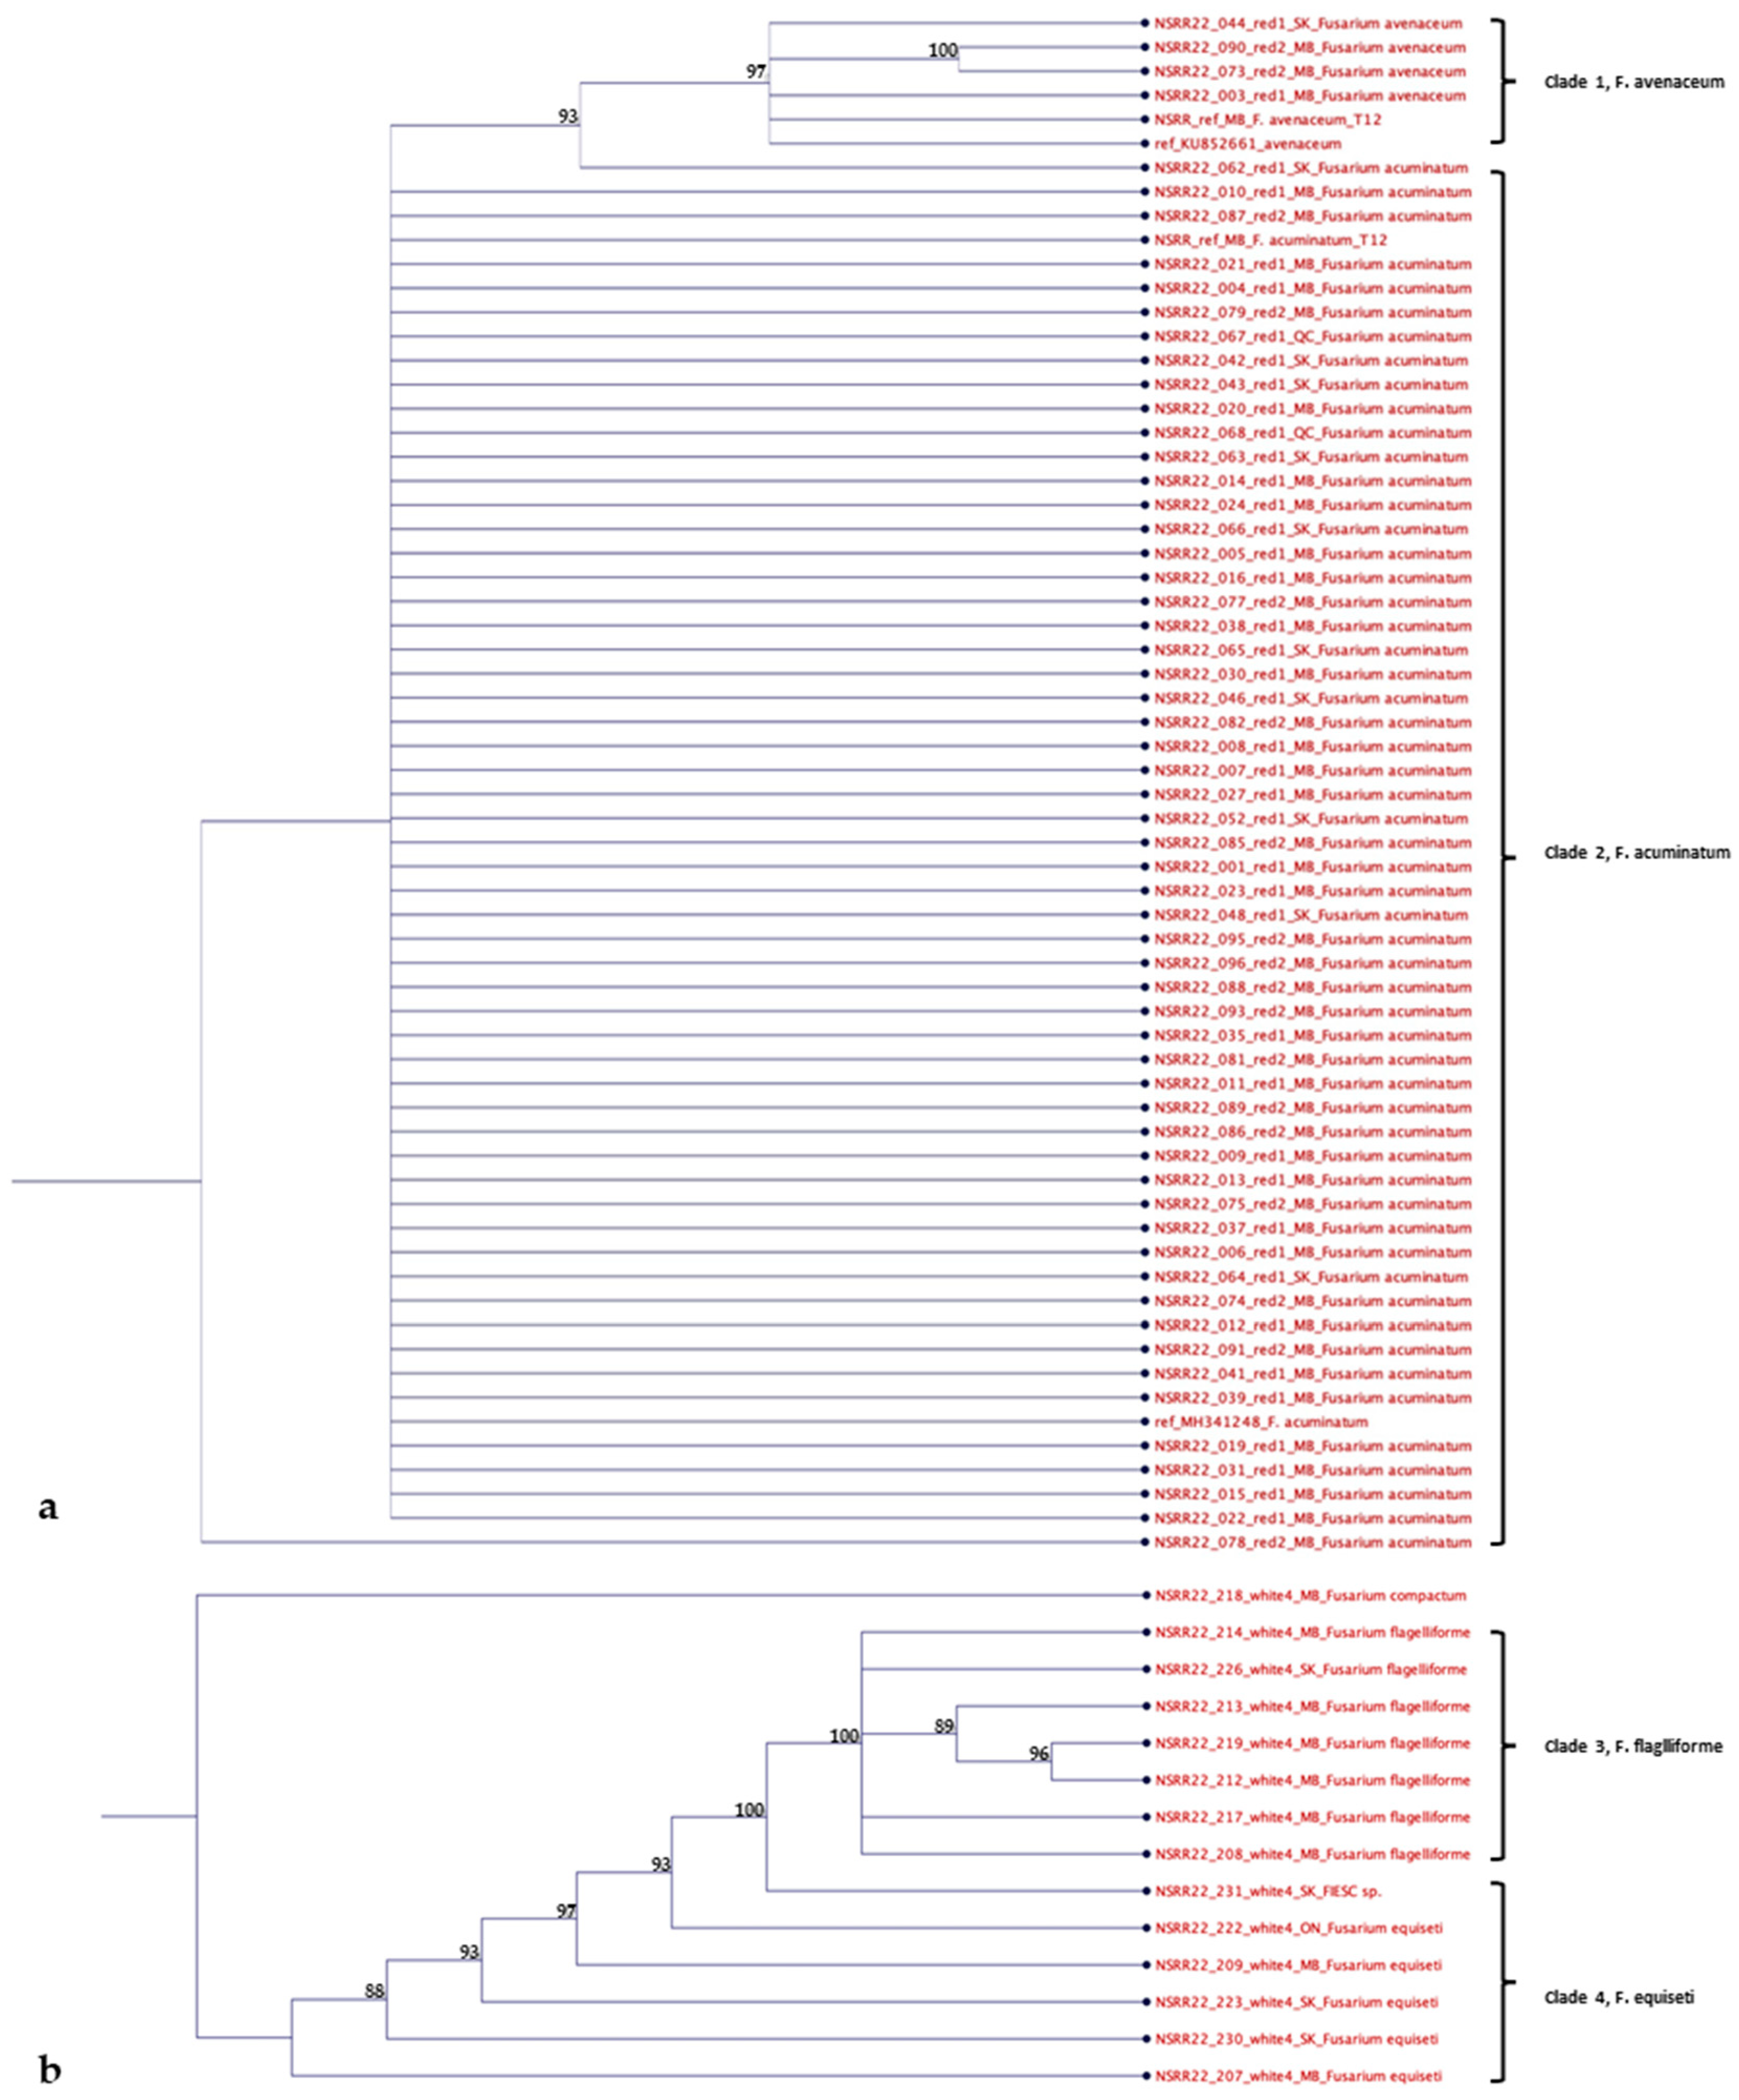
| Source of Variance | Df | Mean square | |||||||
| Count1 | Count2 | Count3 | Height | DS1 | DS2 | Shoot | Root | ||
| F.spp1 | 12 | 10.4*2 | 4.1* | 4.7* | 25.5* | 9.7* | 11* | 4.3* | 0.2* |
| CV1 | 1 | 128.8* | 70.1* | 57.3* | 261.4* | 2.9* | 10.7* | 175.9* | 9.5* |
| Repeat1 | 1 | 0.2 | 1.4 | 0.3 | 0.3 | 0.0 | 0.0 | 0.1 | 0.1 |
| F.spp:CV | 12 | 3.8* | 2.6* | 2.0* | 4.3* | 0.7* | 1.0* | 0.9* | 0.1* |
| F.spp:Repeat | 12 | 1.5 | 0.8 | 1.0 | 0.8 | 0.1 | 0.2 | 0.3 | 0.0 |
| CV:Repeat | 1 | 1.7 | 0.9 | 0.4 | 0.0 | 0.0 | 0.0 | 0.5 | 0.1 |
| F.spp:CV:Repeat | 12 | 0.8 | 0.9 | 1.0 | 1.0 | 0.1 | 0.2 | 0.2 | 0.0 |
| Residuals | 208 | 1.0 | 0.6 | 0.6 | 1.1 | 0.1 | 0.1 | 0.2 | 0.0 |
| Source of Variance | Df | Mean square | |||||||
| Count1 | Count2 | Count3 | Height | DS1 | DS2 | Shoot | Root | ||
| F.spp1 | 6 | 643.2*2 | 657.1* | 709* | 1597.9* | 139.4* | 227.1* | 28.9* | 2.12* |
| CV1 | 19 | 28.0* | 26.8* | 25.8* | 106.4* | 2.3* | 2.0* | 2.2* | 0.18* |
| Repeat1 | 1 | 0.1 | 0.1 | 0.0 | 10.3 | 0.1 | 0.3 | 0.0 | 0.00 |
| CV:F.spp | 114 | 3.1* | 2.8* | 3.1* | 15* | 0.9* | 0.5* | 0.2* | 0.02* |
| CV:Repeat | 19 | 0.6 | 0.6 | 0.6 | 5.3 | 0.5 | 0.2 | 0.0 | 0.00 |
| F.spp:Repeat | 6 | 1.0 | 1.7 | 1.3 | 0.7 | 0.1 | 0.5 | 0.0 | 0.00 |
| CV:F.spp:Repeat | 114 | 0.8 | 0.7 | 0.7 | 4.3 | 0.4 | 0.2 | 0.0 | 0.00 |
| Residuals | 839 | 1.6 | 1.6 | 1.5 | 7.7 | 0.6 | 0.3 | 0.1 | 0.01 |
| F. acu | F. ave | FTSC | F. oxy | FOSC | F. gra | FSSC | F. equ | FIESC | F. sol | F. red | |
| MB | 13.6 | 15.8 | 31.2 | 11.3 | 12.2 | 0.0 | 1.8 | 5.0 | 6.3 | 0.0 | 4.5 |
| SK | 4.1 | 7.7 | 12.7 | 2.7 | 2.7 | 1.4 | 3.2 | 2.3 | 4.5 | 0.0 | 4.1 |
| Western | 17.6 | 23.5 | 43.9 | 14.0 | 14.9 | 1.4 | 5.0 | 7.2 | 10.9 | 0.0 | 8.6 |
| ON | 0.0 | 0.0 | 0.0 | 3.6 | 4.1 | 0.0 | 0.0 | 0.5 | 0.9 | 1.4 | 0.0 |
| QC | 0.0 | 2.7 | 2.7 | 1.4 | 1.4 | 0.0 | 0.9 | 0.0 | 0.0 | 0.0 | 0.0 |
| Eastern | 0.0 | 2.7 | 2.7 | 5.0 | 5.4 | 0.0 | 0.9 | 0.5 | 0.9 | 0.0 | 0.0 |
| Total | 17.6 | 26.2 | 46.6 | 19.0 | 20.4 | 1.4 | 5.9 | 7.7 | 11.8 | 1.4 | 8.6 |
Disclaimer/Publisher’s Note: The statements, opinions and data contained in all publications are solely those of the individual author(s) and contributor(s) and not of MDPI and/or the editor(s). MDPI and/or the editor(s) disclaim responsibility for any injury to people or property resulting from any ideas, methods, instructions or products referred to in the content. |
© 2023 by the authors. Licensee MDPI, Basel, Switzerland. This article is an open access article distributed under the terms and conditions of the Creative Commons Attribution (CC BY) license (http://creativecommons.org/licenses/by/4.0/).


