Submitted:
24 November 2023
Posted:
24 November 2023
You are already at the latest version
Abstract
Keywords:
1. Introduction
2. Materials and Methods
2.1. Sample characterization
2.2. Experimental methods
2.3. Pore-network modeling
3. Results and discussion
3.1. Change in pore space due to rock dissolution
| Sample name | Mass concentration of HCl, % | Flow rate, ml/min | Permeability after HCl injection, µm2 | Permeability ratio | Breakthrough pore volumes, PV |
|---|---|---|---|---|---|
| #1 | 18 | 2 | 0.98 | 3.38 | 2.9 |
| #2 | 18 | 8 | 3.79 | 8.81 | 2.4 |
| #3 | 12 | 8 | 3.85 | 5.42 | 4.2 |
| #4 | 12 | 4 | 4.10 | 9.11 | 4.4 |
3.2. Connected vs. total porosity
3.3. Permeability vs. porosities
3.4. Permeability vs. tortuosity and specific surface area
3.5. Permeability vs. mean pore radius
4. Conclusions
Supplementary Materials
Author Contributions
Funding
Data Availability Statement
Conflicts of Interest
References
- Carman PC (1997) Fluid flow through granular beds. Chem Eng Res Des 75:S32–S48. [CrossRef]
- Eichheimer P, Thielmann M, Fujita W, Golabek GJ, Nakamura M, Okumura S, Nakatani T, Kottwitz MO (2020) Combined numerical and experimental study of microstructure and permeability in porous granular media. Solid Earth 11:1079–1095. [CrossRef]
- Latief FDE, Fauzi U (2012) Kozeny–Carman and empirical formula for the permeability of computer rock models. Int J Rock Mech Min Sci 50:117–123. [CrossRef]
- Martys NS, Torquato S, Bentz DP (1994) Universal scaling of fluid permeability for sphere packings. Phys Rev E 50:403–408. [CrossRef]
- Blunt MJ, Bijeljic B, Dong H, Gharbi O, Iglauer S, Mostaghimi P, Paluszny A, Pentland C (2013) Pore-scale imaging and modelling. Adv Water Resour 51:197–216. [CrossRef]
- Zhang S, Paterson MS, Cox SF (1994) Porosity and permeability evolution during hot isostatic pressing of calcite aggregates. J Geophys Res 99:15741. [CrossRef]
- Bernabe Y, Brace WF, Evans B (1982) Permeability, porosity and pore geometry of hot-pressed calcite. Mech Mater 1:173–183. [CrossRef]
- Mavko G, Nur A (1997) The effect of a percolation threshold in the Kozeny-Carman relation. GEOPHYSICS 62:1480–1482. [CrossRef]
- Rodriguez E, Giacomelli F, Vazquez A (2004) Permeability-Porosity Relationship in RTM for Different Fiberglass and Natural Reinforcements. J Compos Mater 38:259–268. [CrossRef]
- Xu P, Yu B (2008) Developing a new form of permeability and Kozeny–Carman constant for homogeneous porous media by means of fractal geometry. Adv Water Resour 31:74–81. [CrossRef]
- Luquot L, Rodriguez O, Gouze P (2014) Experimental Characterization of Porosity Structure and Transport Property Changes in Limestone Undergoing Different Dissolution Regimes. Transp Porous Media 101:507–532. [CrossRef]
- Menke HP, Bijeljic B, Blunt MJ (2017) Dynamic reservoir-condition microtomography of reactive transport in complex carbonates: Effect of initial pore structure and initial brine pH. Geochim Cosmochim Acta 204:267–285. [CrossRef]
- Noiriel C (2004) Investigation of porosity and permeability effects from microstructure changes during limestone dissolution. Geophys Res Lett 31:L24603. [CrossRef]
- Smith MM, Sholokhova Y, Hao Y, Carroll SA (2013) CO2-induced dissolution of low permeability carbonates. Part I: Characterization and experiments. Adv Water Resour 62:370–387. [CrossRef]
- Voltolini M, Ajo-Franklin J (2019) The effect of CO2-induced dissolution on flow properties in Indiana Limestone: An in situ synchrotron X-ray micro-tomography study. Int J Greenh Gas Control 82:38–47. [CrossRef]
- Koponen A, Kataja M, Timonen J (1997) Permeability and effective porosity of porous media. Phys Rev E 56:3319–3325. [CrossRef]
- Luquot L, Gouze P (2009) Experimental determination of porosity and permeability changes induced by injection of CO2 into carbonate rocks. Chem Geol 265:148–159. [CrossRef]
- Maus S, Schneebeli M, Wiegmann A (2021) An X-ray micro-tomographic study of the pore space, permeability and percolation threshold of young sea ice. Cryosph 15:4047–4072. [CrossRef]
- Meredith PG, Main IG, Clint OC, Li L (2012) On the threshold of flow in a tight natural rock. Geophys Res Lett 39:n/a-n/a. [CrossRef]
- Revil A, Kessouri P, Torres-Verdín C (2014) Electrical conductivity, induced polarization, and permeability of the Fontainebleau sandstone. GEOPHYSICS 79:D301–D318. [CrossRef]
- Sueyoshi K, Yokoyama T, Katayama I (2020) Experimental Measurement of the Transport Flow Path Aperture in Thermally Cracked Granite and the Relationship between Pore Structure and Permeability. Geofluids 2020:1–10. [CrossRef]
- Arns C, Knackstedt M, Martys N (2005) Cross-property correlations and permeability estimation in sandstone. Phys Rev E 72:046304. [CrossRef]
- Bernabé Y (1995) The transport properties of networks of cracks and pores. J Geophys Res Solid Earth 100:4231–4241. [CrossRef]
- Martys N, Garboczi EJ (1992) Length scales relating the fluid permeability and electrical conductivity in random two-dimensional model porous media. Phys Rev B 46:6080–6090. [CrossRef]
- Nishiyama N, Yokoyama T (2017) Permeability of porous media: Role of the critical pore size. J Geophys Res Solid Earth 122:6955–6971. [CrossRef]
- Schwartz LM, Martys N, Bentz DP, Garboczi EJ, Torquato S (1993) Cross-property relations and permeability estimation in model porous media. Phys Rev E 48:4584–4591. [CrossRef]
- Lamy-Chappuis B, Angus D, Fisher Q, Grattoni C, Yardley BWD (2014) Rapid porosity and permeability changes of calcareous sandstone due to CO 2 -enriched brine injection. Geophys Res Lett 41:399–406. [CrossRef]
- Rötting TS, Luquot L, Carrera J, Casalinuovo DJ (2015) Changes in porosity, permeability, water retention curve and reactive surface area during carbonate rock dissolution. Chem Geol 403:86–98. [CrossRef]
- Nogues JP, Fitts JP, Celia MA, Peters CA (2013) Permeability evolution due to dissolution and precipitation of carbonates using reactive transport modeling in pore networks. Water Resour Res 49:6006–6021. [CrossRef]
- Katz AJ, Thompson AH (1986) Quantitative prediction of permeability in porous rock. Phys Rev B 34:8179–8181. [CrossRef]
- Bolysbek DA, Kuljabekov AB, Uzbekaliyev KS, Assilbekov BK (2023) Effect of Rock Dissolution on Two-Phase Relative Permeabilities: Pore-Scale Simulations Based on Experimental Data. Appl Sci 13:11385. [CrossRef]
- Thermo Fisher Scientific (2019) User’s Guide Avizo Software. 2019.
- Li Y, Chi Y, Han S, Zhao C, Miao Y (2021) Pore-throat structure characterization of carbon fiber reinforced resin matrix composites: Employing Micro-CT and Avizo technique. PLoS One 16:e0257640. [CrossRef]
- Zhao Y, Zhu G, Zhang C, Liu S, Elsworth D, Zhang T (2018) Pore-Scale Reconstruction and Simulation of Non-Darcy Flow in Synthetic Porous Rocks. J Geophys Res Solid Earth 123:2770–2786. [CrossRef]
- Akasheva Z, Bolysbek D, Assilbekov B (2023) STUDY OF CARBONATE ROCK DISSOLUTION USING X-RAY MICROCOMPUTED TOMOGRAPHY: IMPACT OF ACID FLOW RATE. NEWS Natl Acad Sci Repub Kazakhstan Ser Geol Tech Sci 1:20–32.
- Navarre-Sitchler A, Steefel CI, Yang L, Tomutsa L, Brantley SL (2009) Evolution of porosity and diffusivity associated with chemical weathering of a basalt clast. J Geophys Res 114:F02016. [CrossRef]
- Hommel J, Coltman E, Class H (2018) Porosity–Permeability Relations for Evolving Pore Space: A Review with a Focus on (Bio-)geochemically Altered Porous Media. Transp Porous Media 124:589–629. [CrossRef]
- Manmath, N. Panda LWL (2) (1994) Estimation of Single-Phase Permeability from Parameters of Particle-Size Distribution. Am Assoc Pet Geol Bull 78:. [CrossRef]
- Yin P, Song H, Ma H, Yang W, He Z, Zhu X (2022) The modification of the Kozeny-Carman equation through the lattice Boltzmann simulation and experimental verification. J Hydrol 609:127738. [CrossRef]
- LI T, LI M, JING X, XIAO W, CUI Q (2019) Influence mechanism of pore-scale anisotropy and pore distribution heterogeneity on permeability of porous media. Pet Explor Dev 46:594–604. [CrossRef]
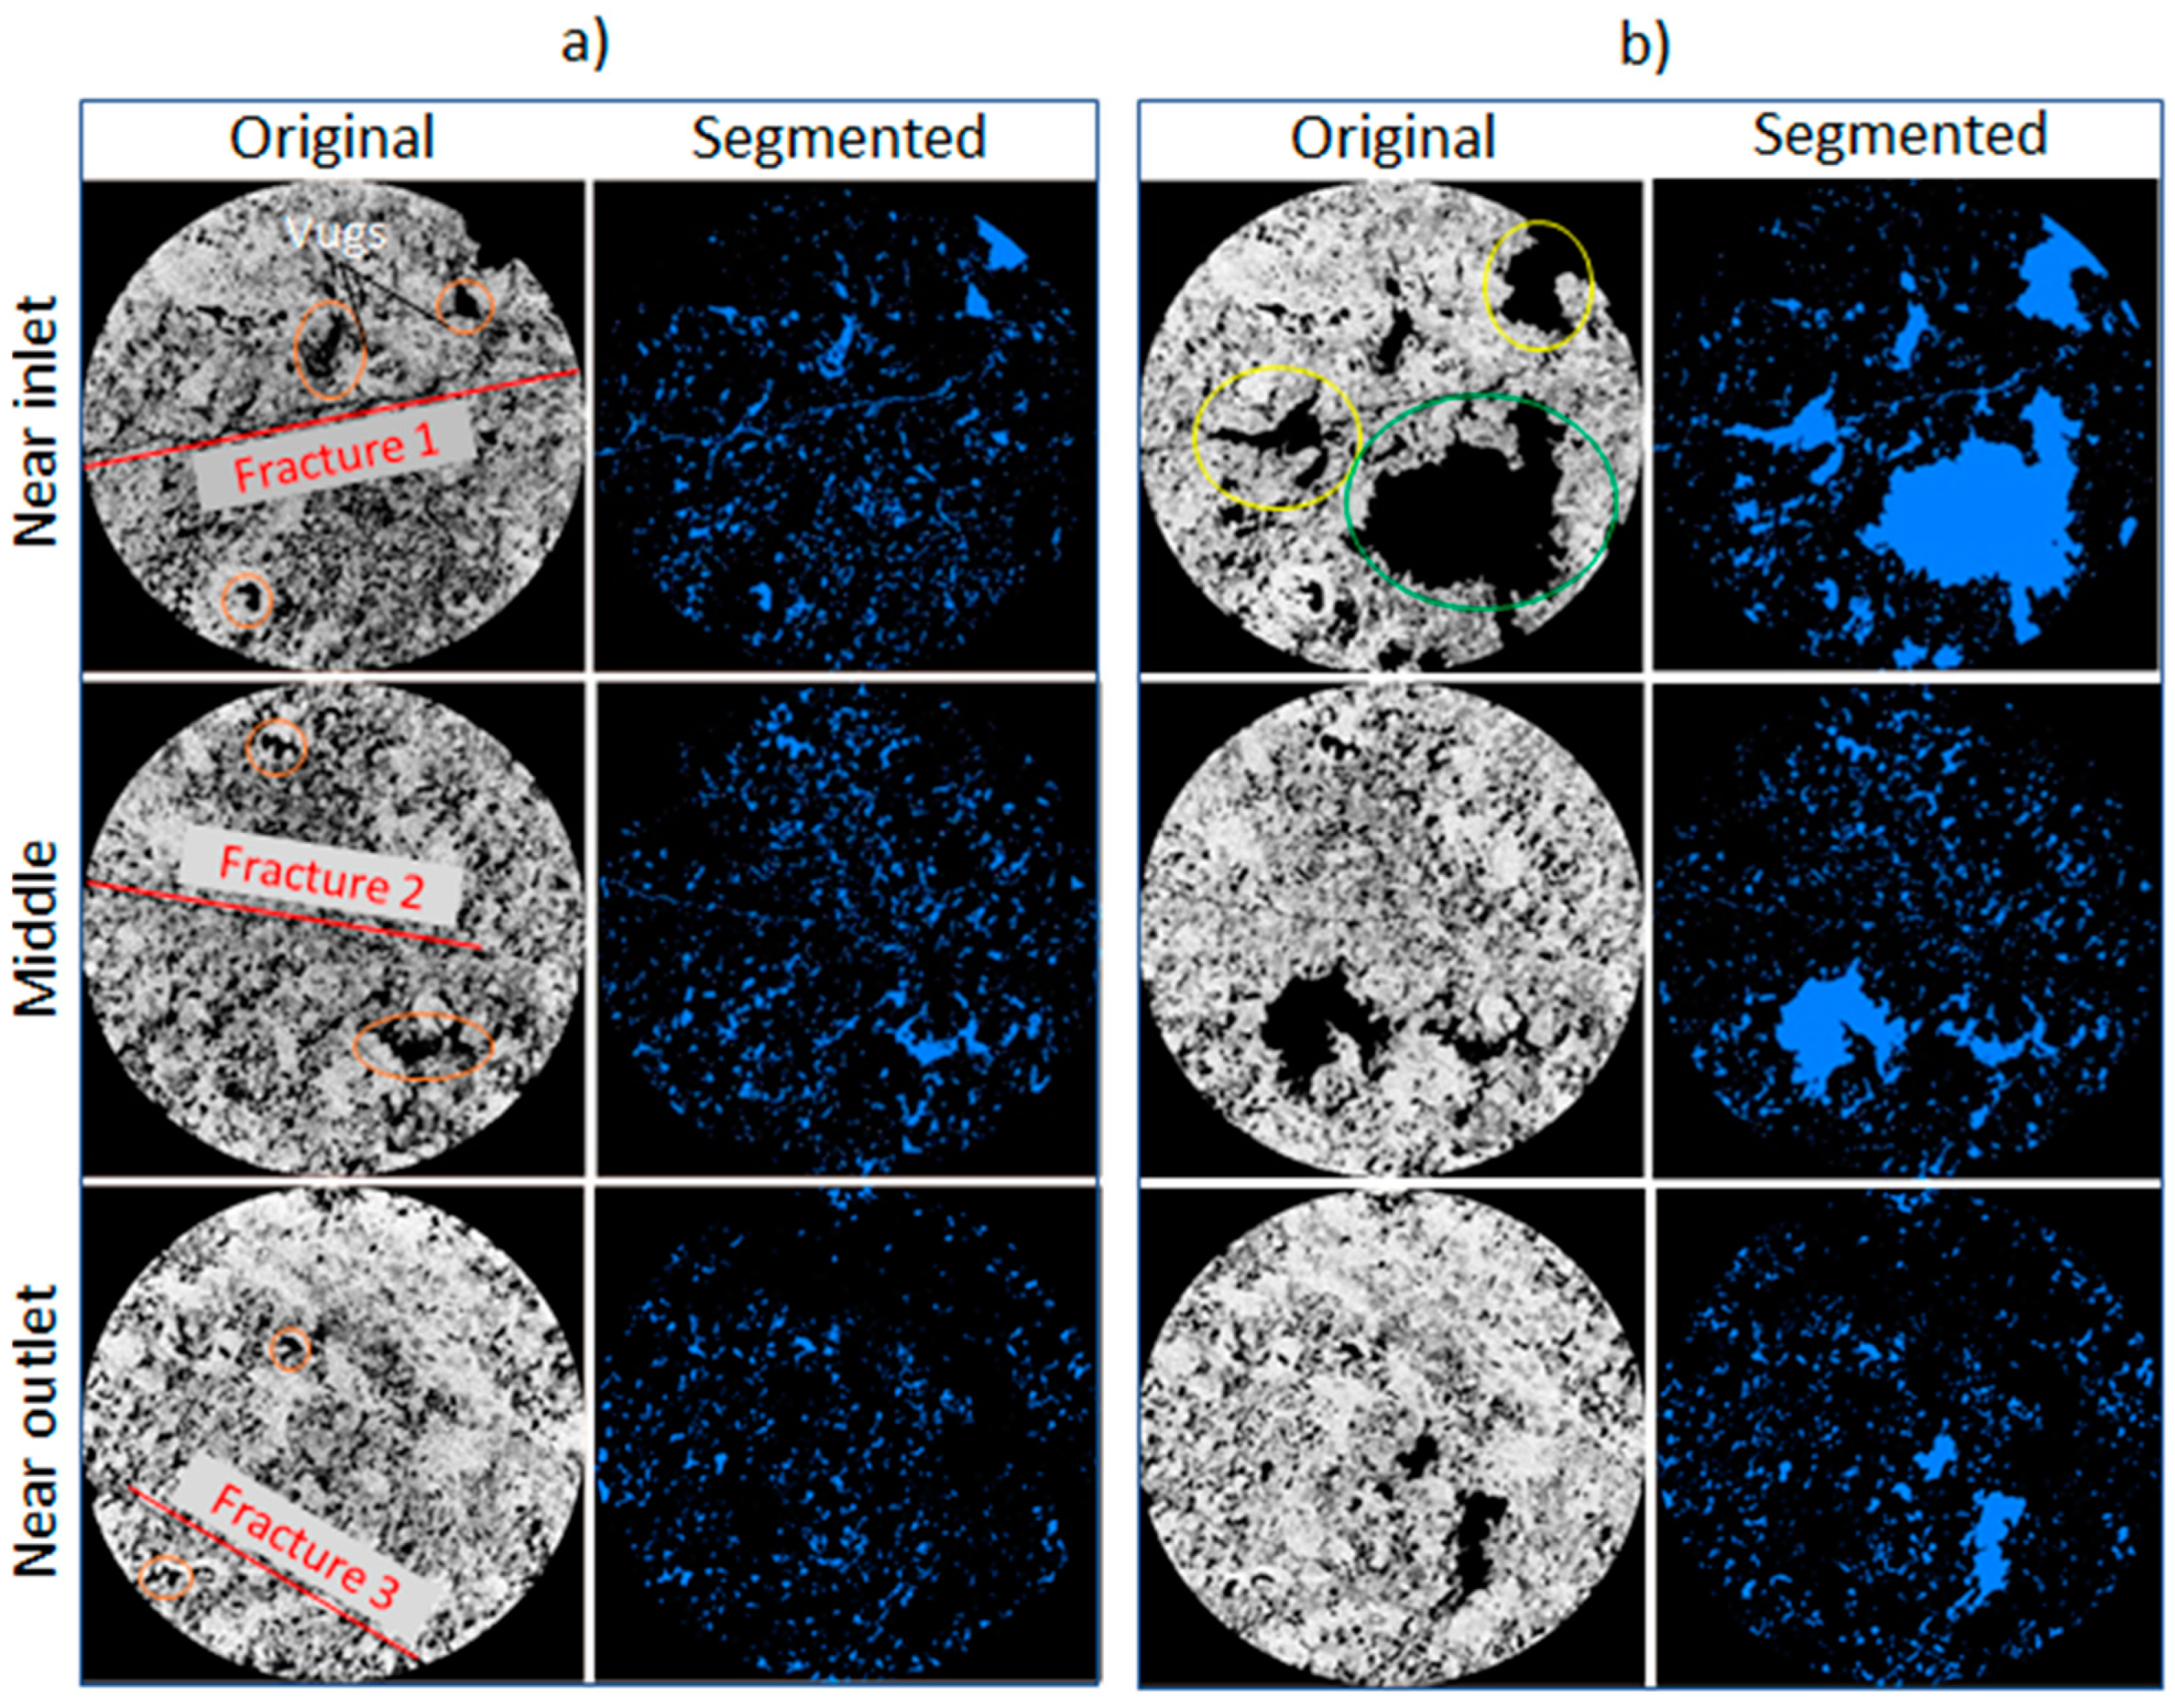
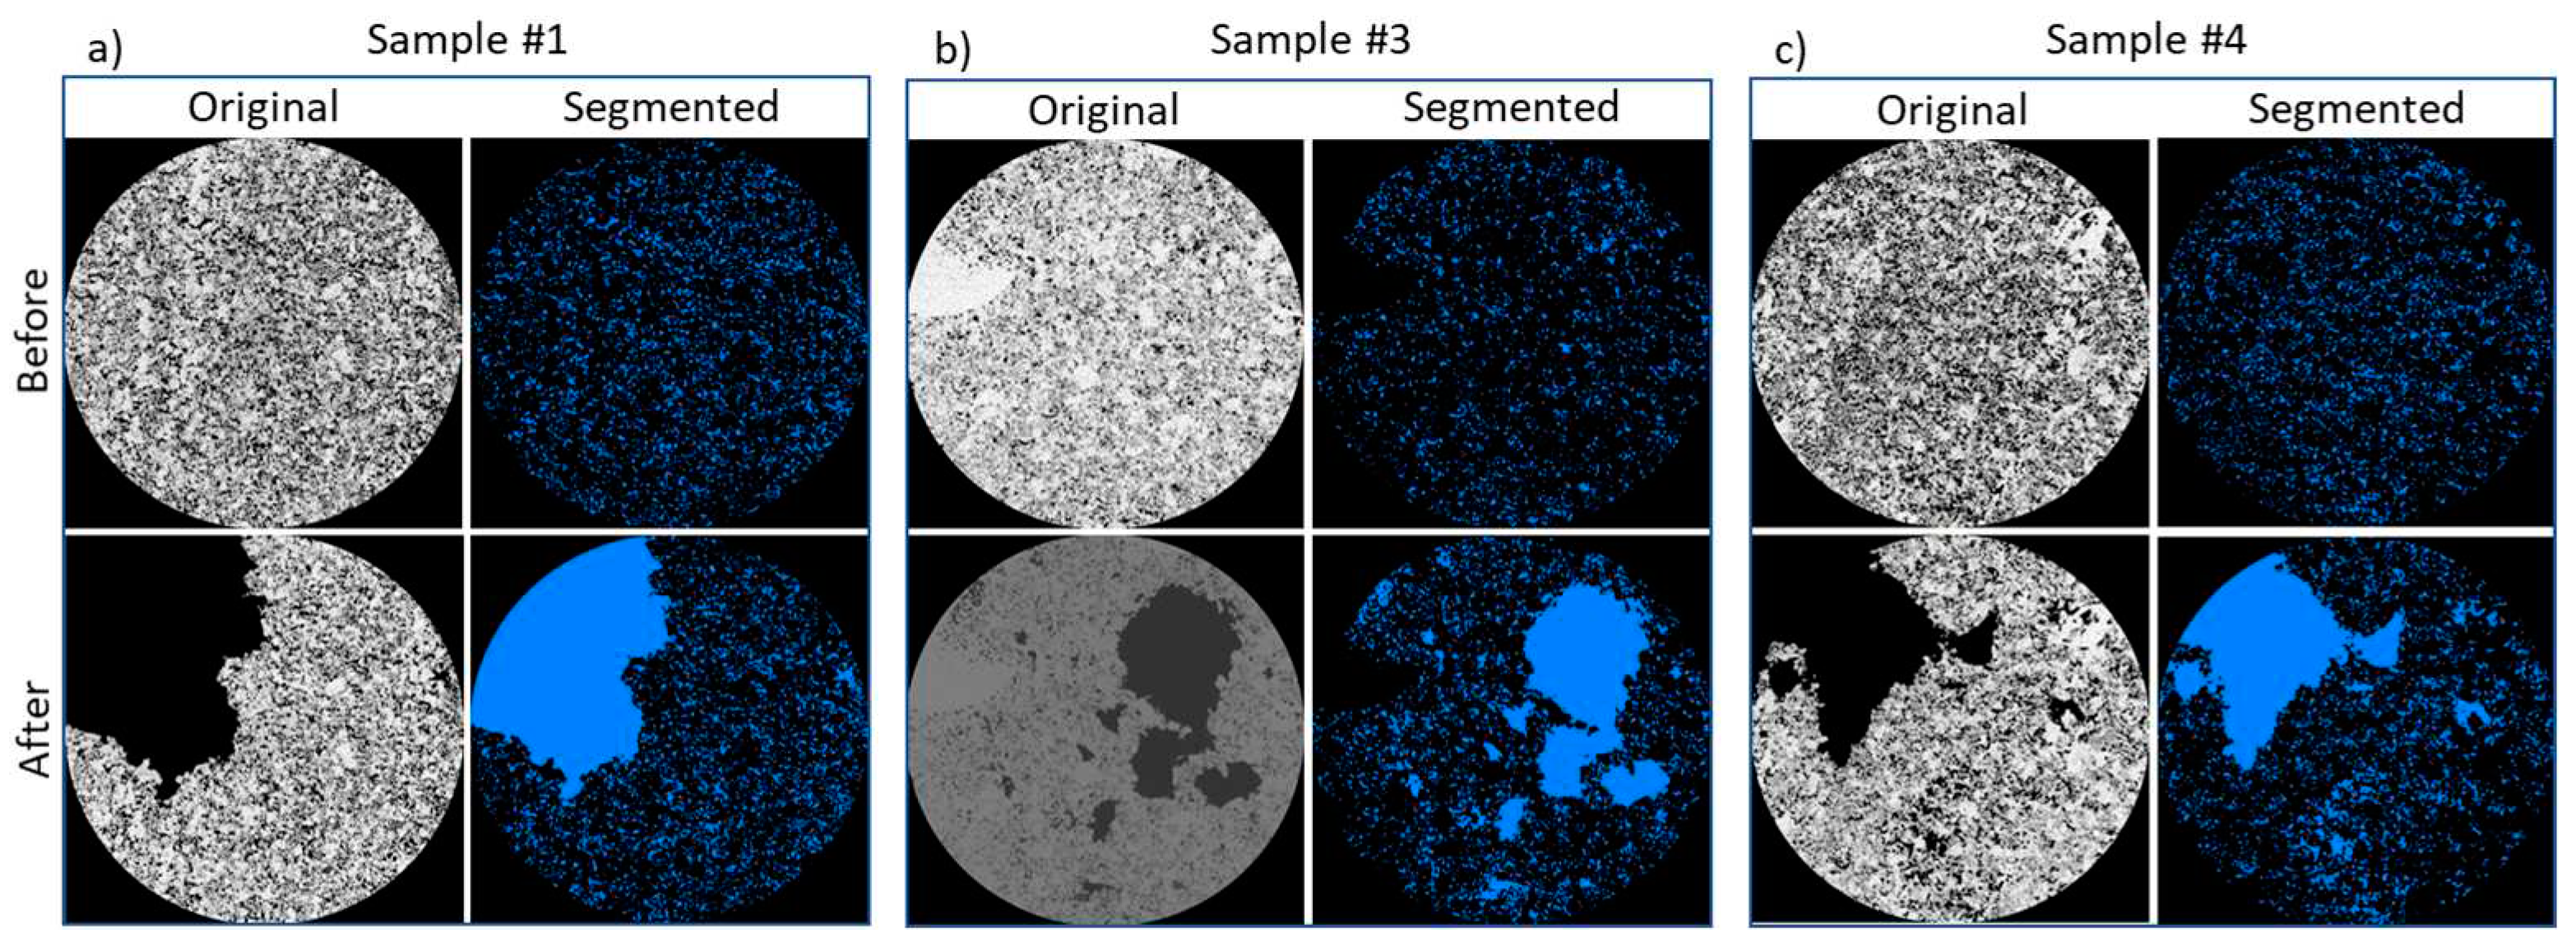

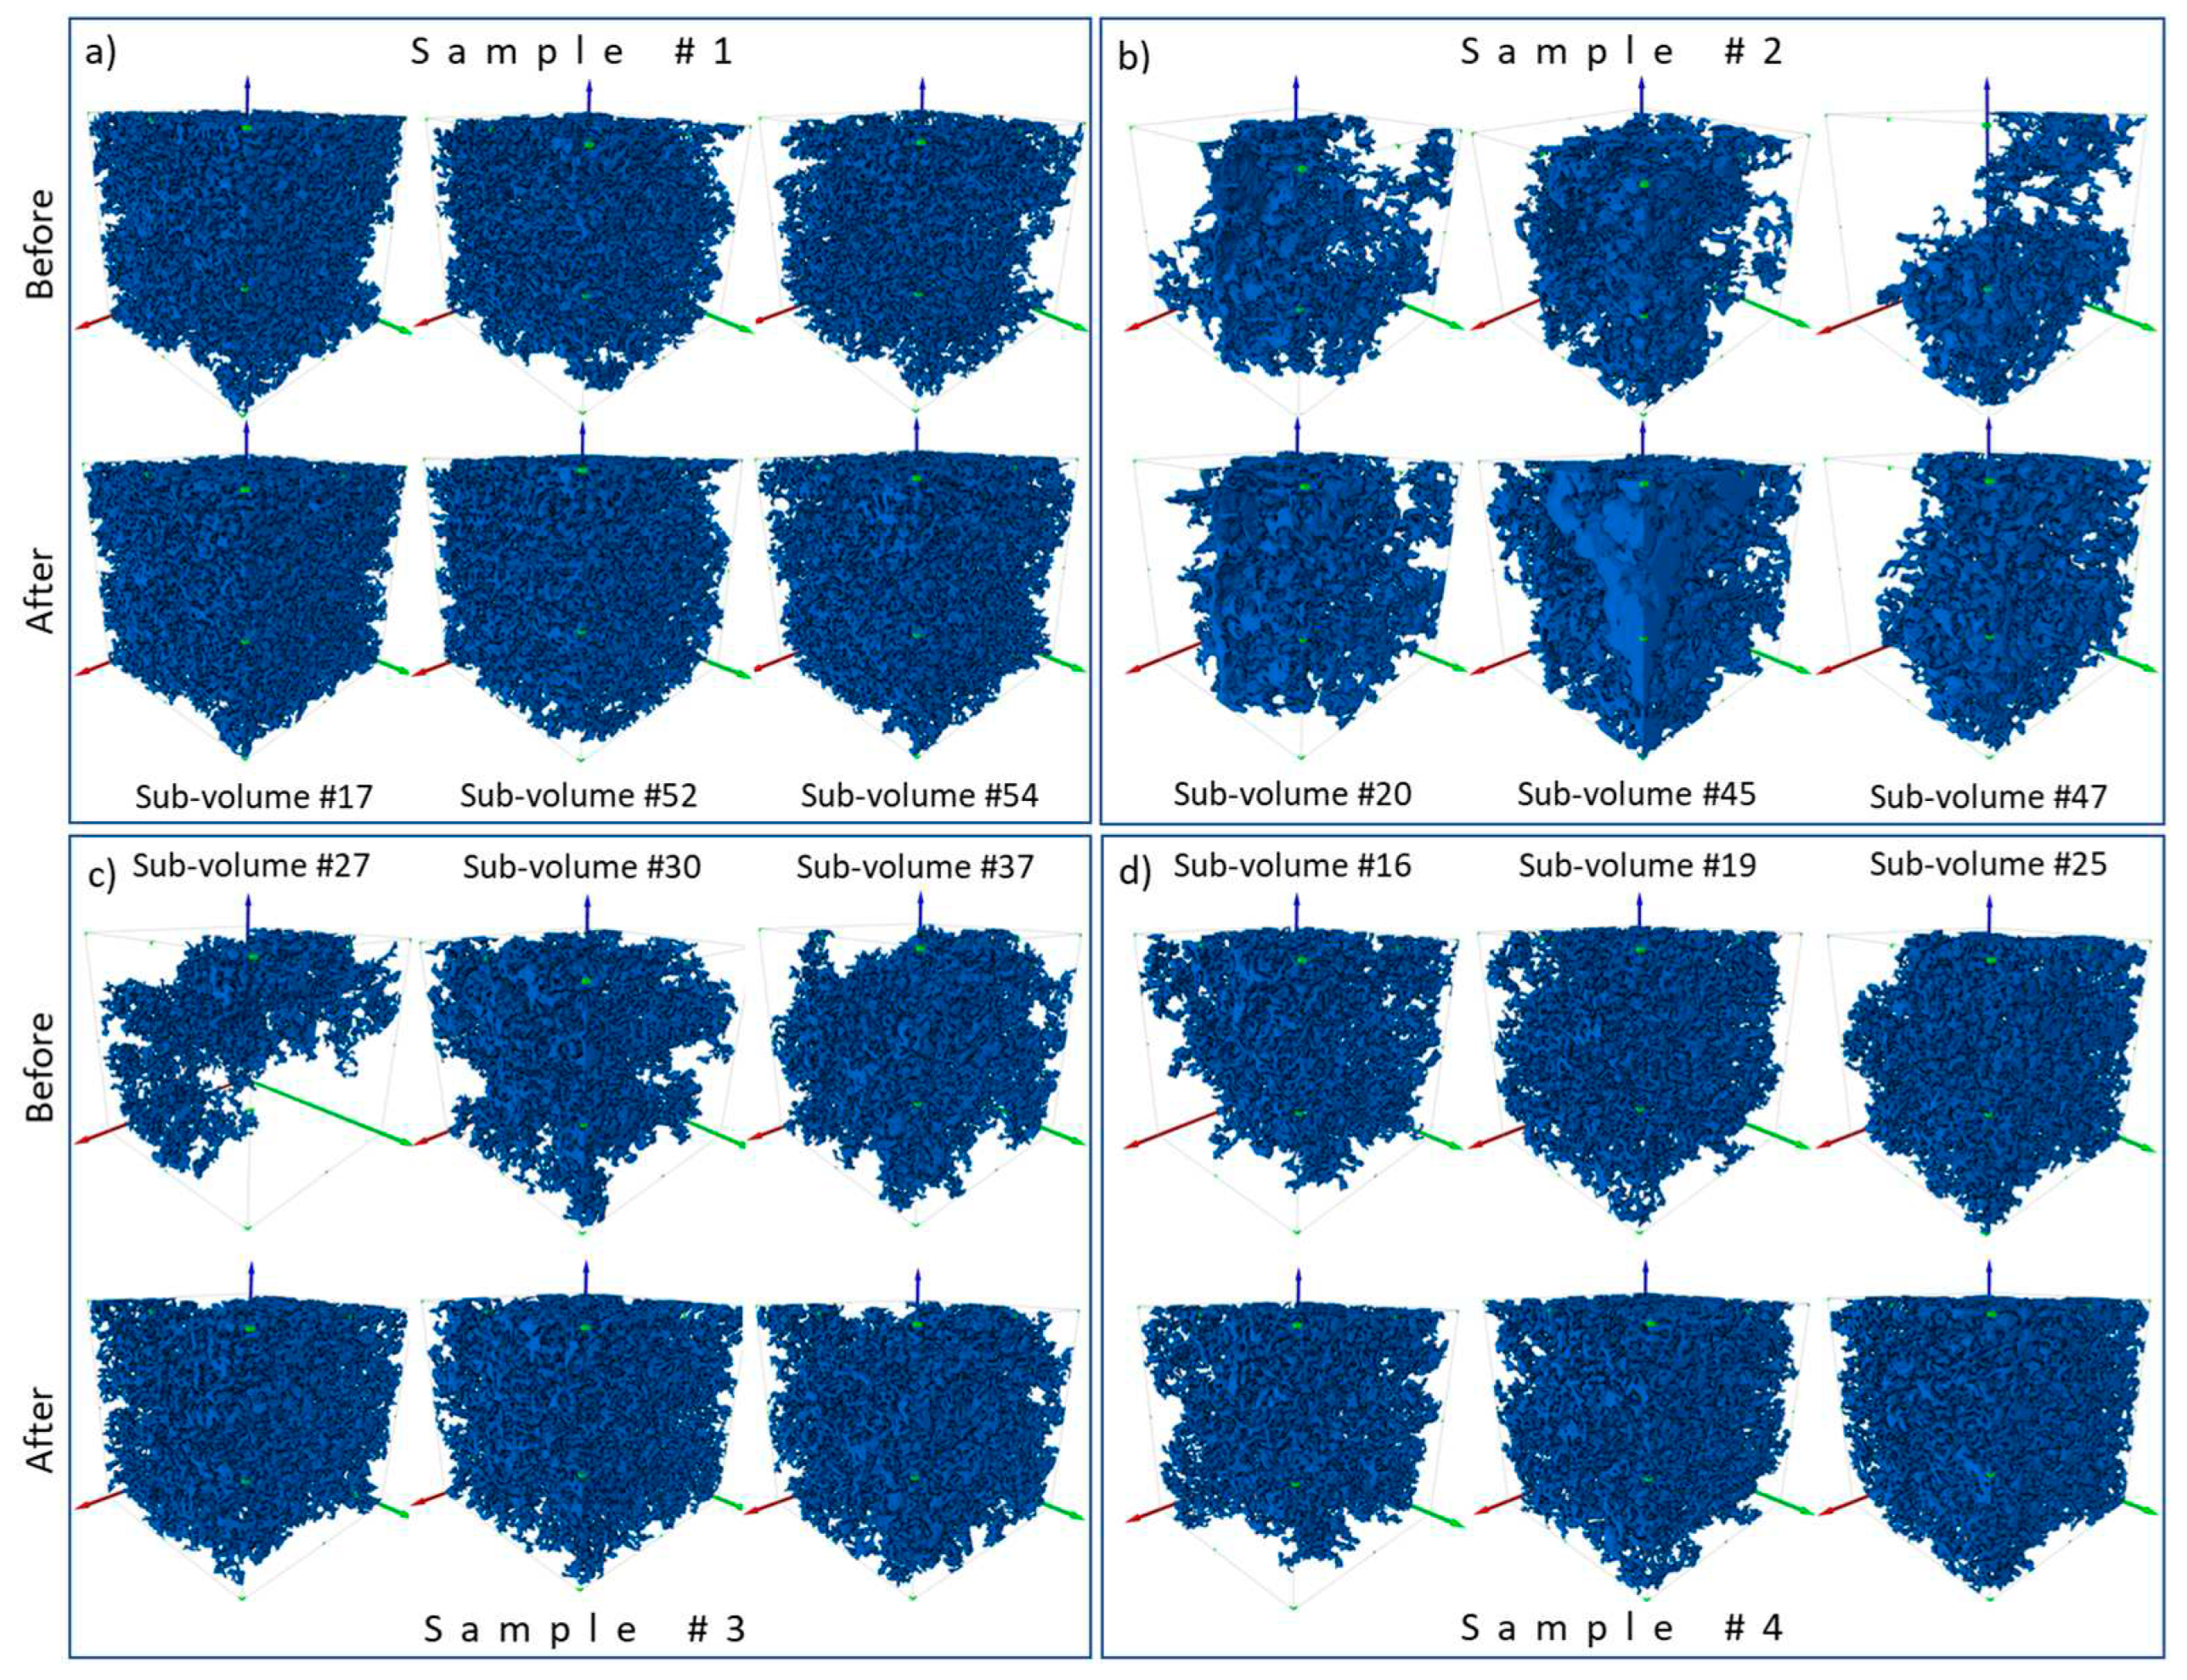
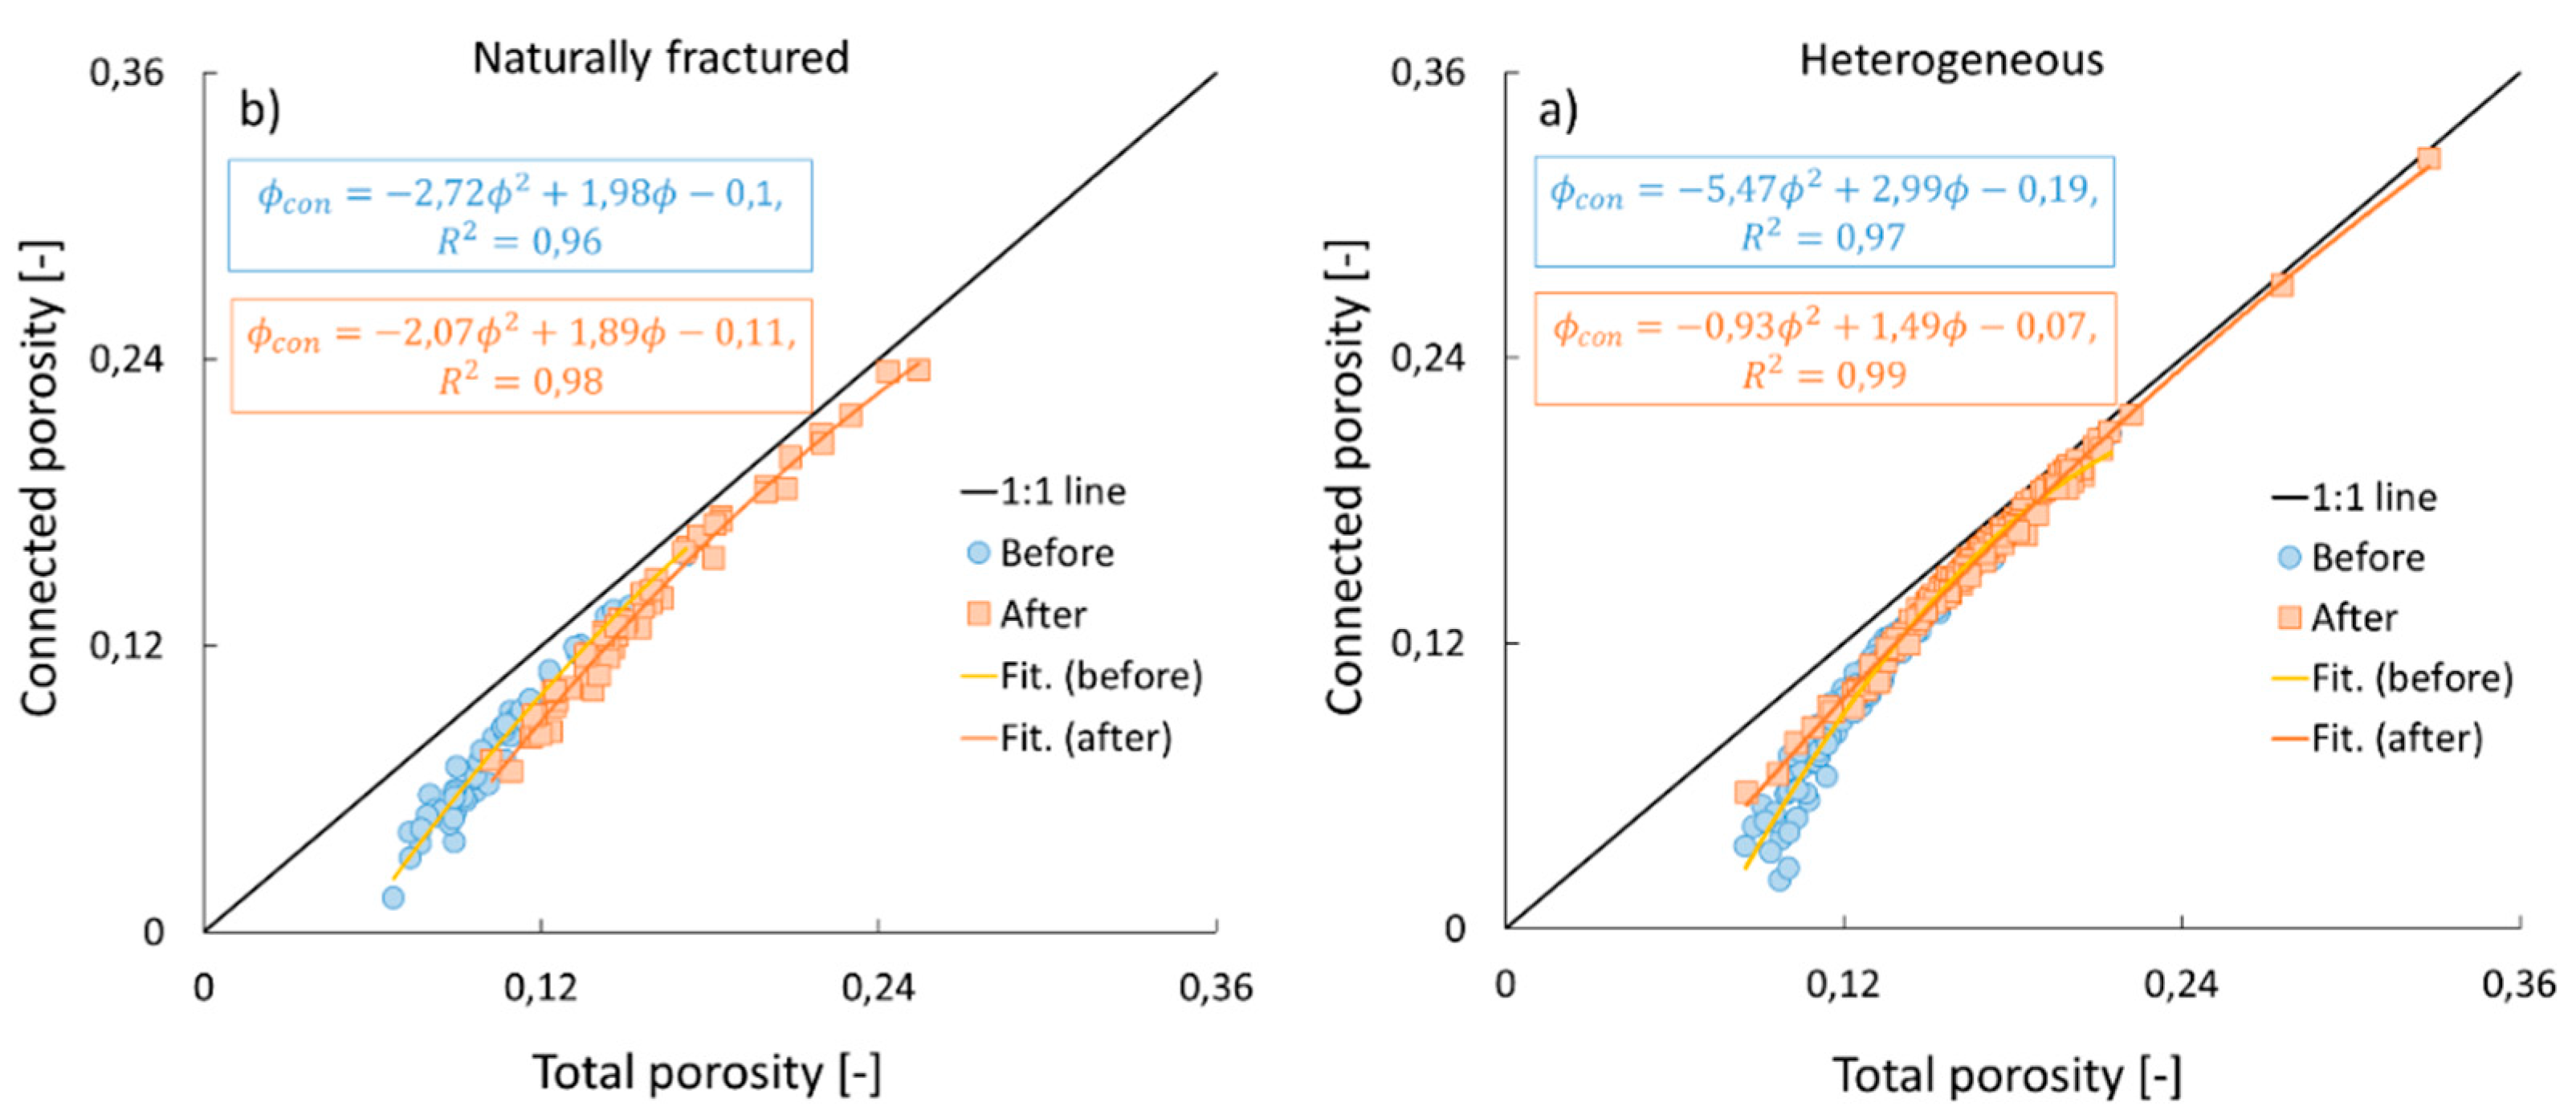
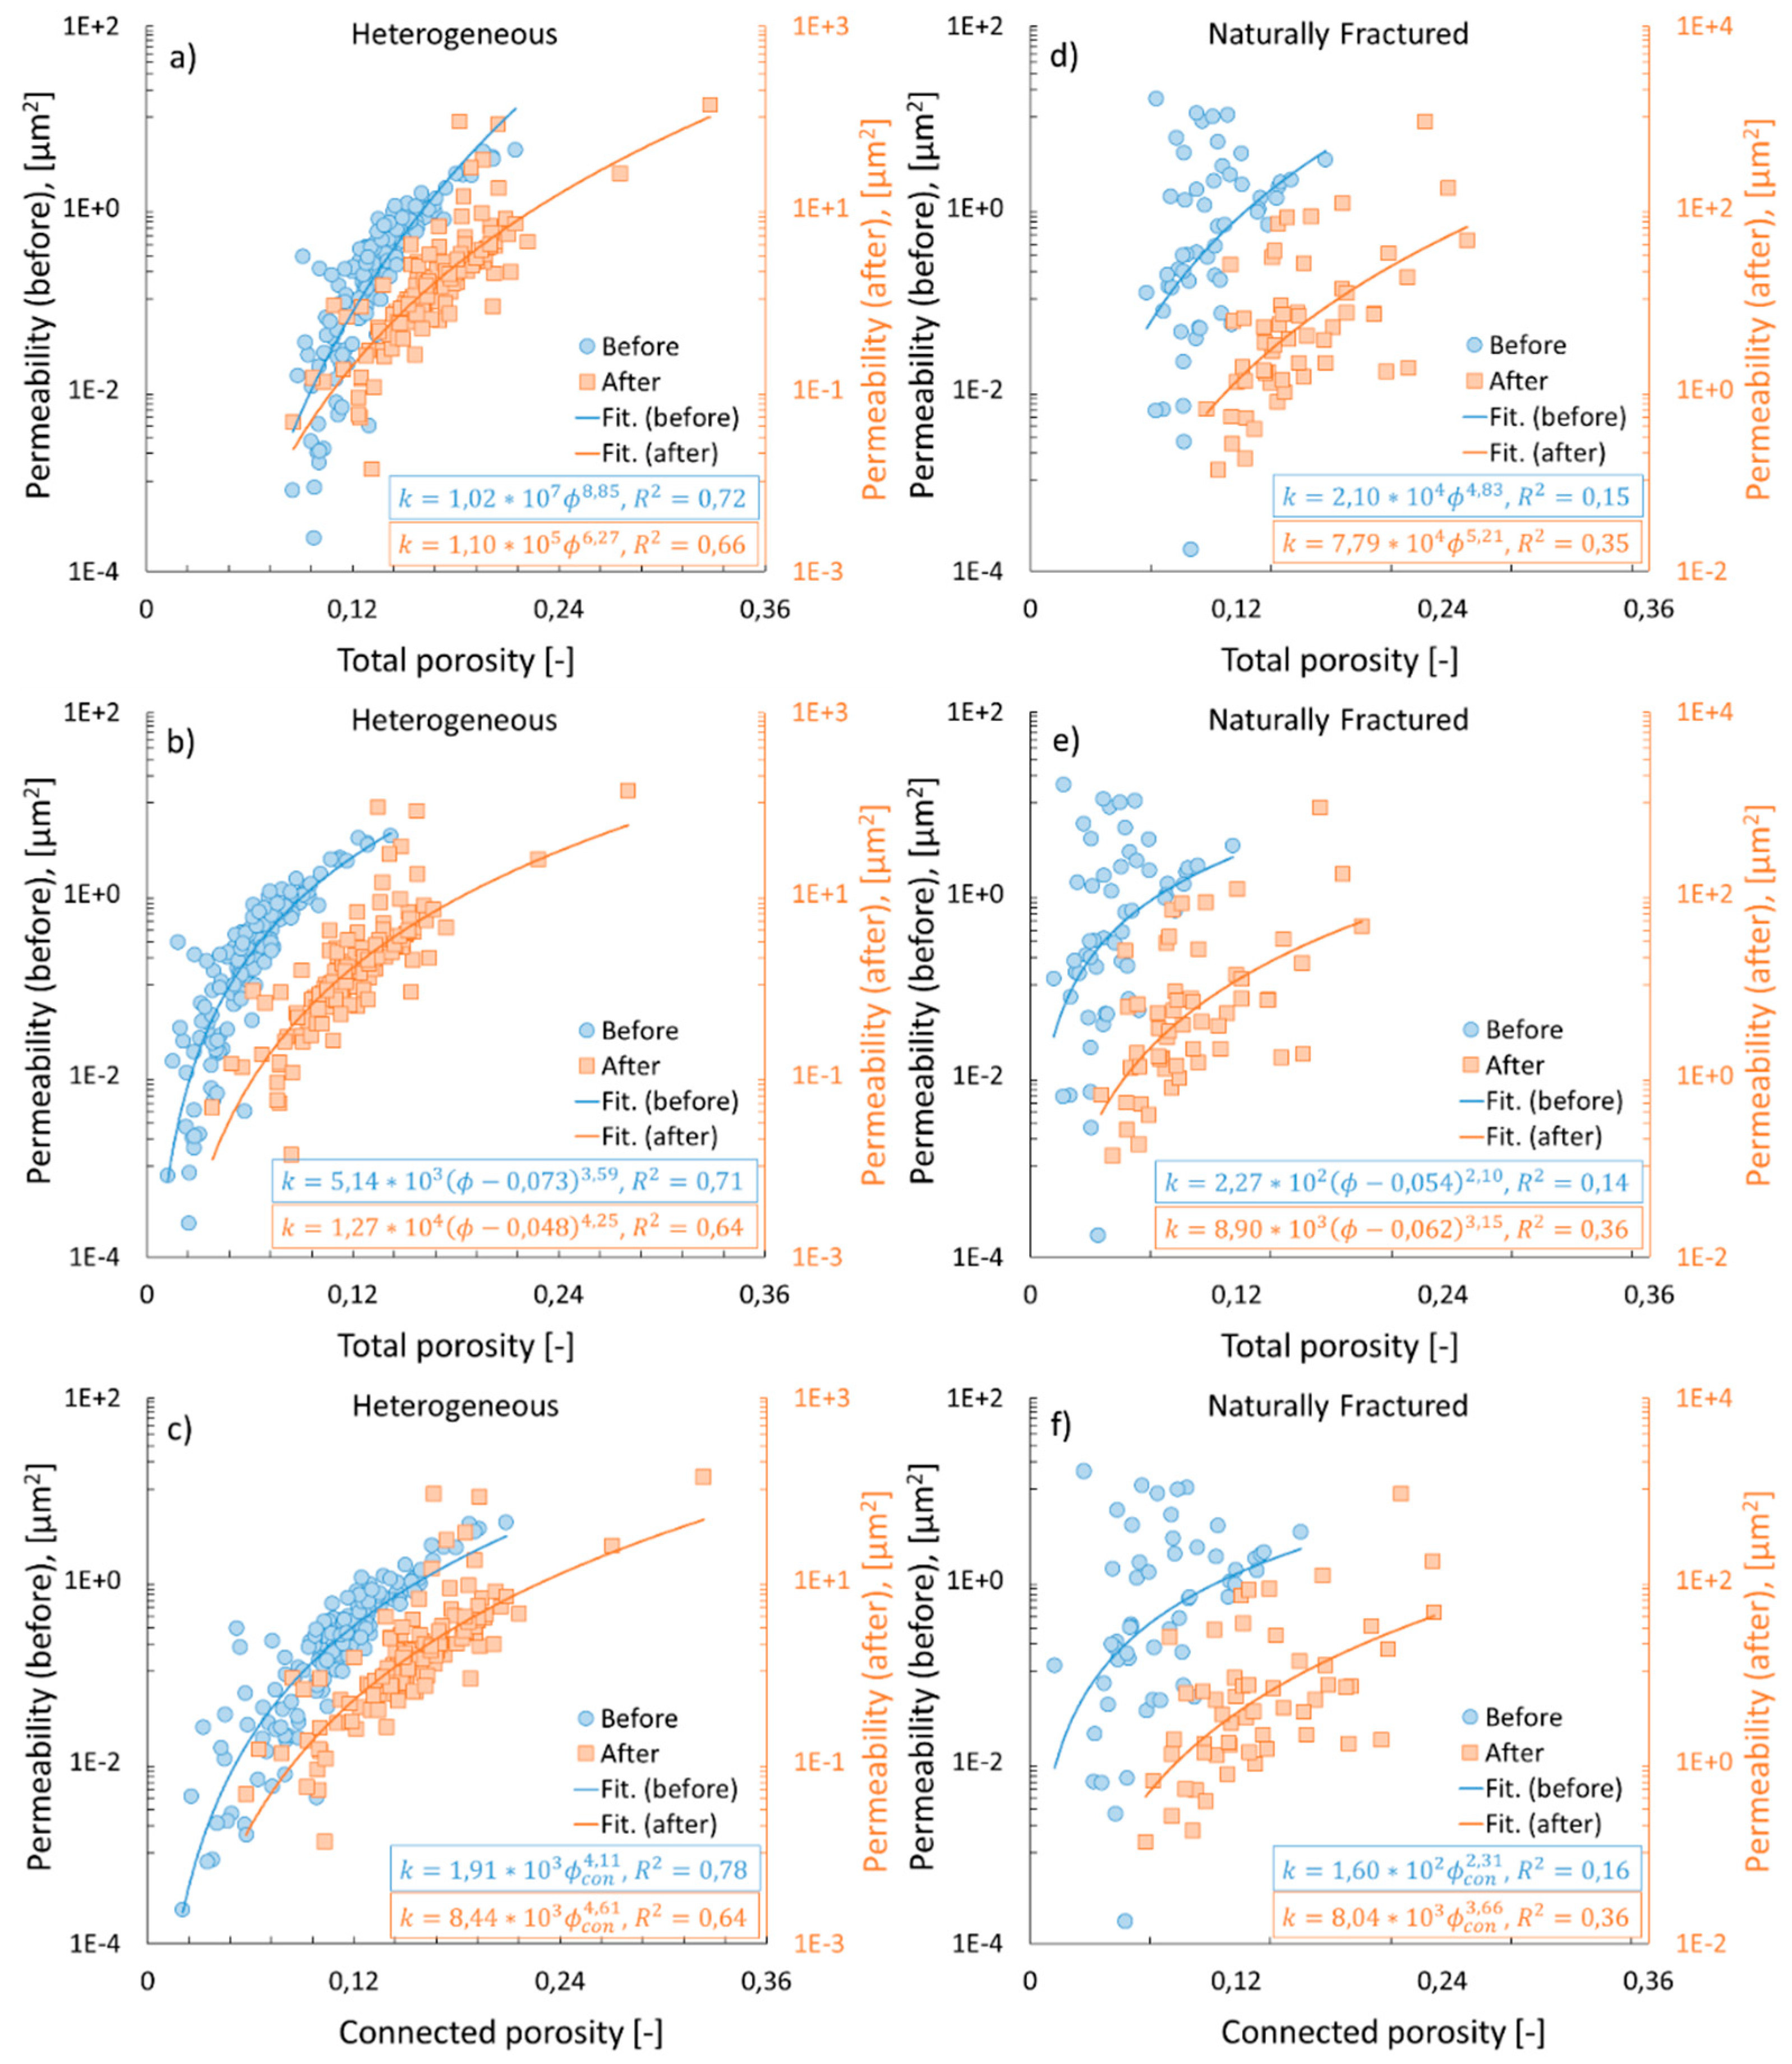

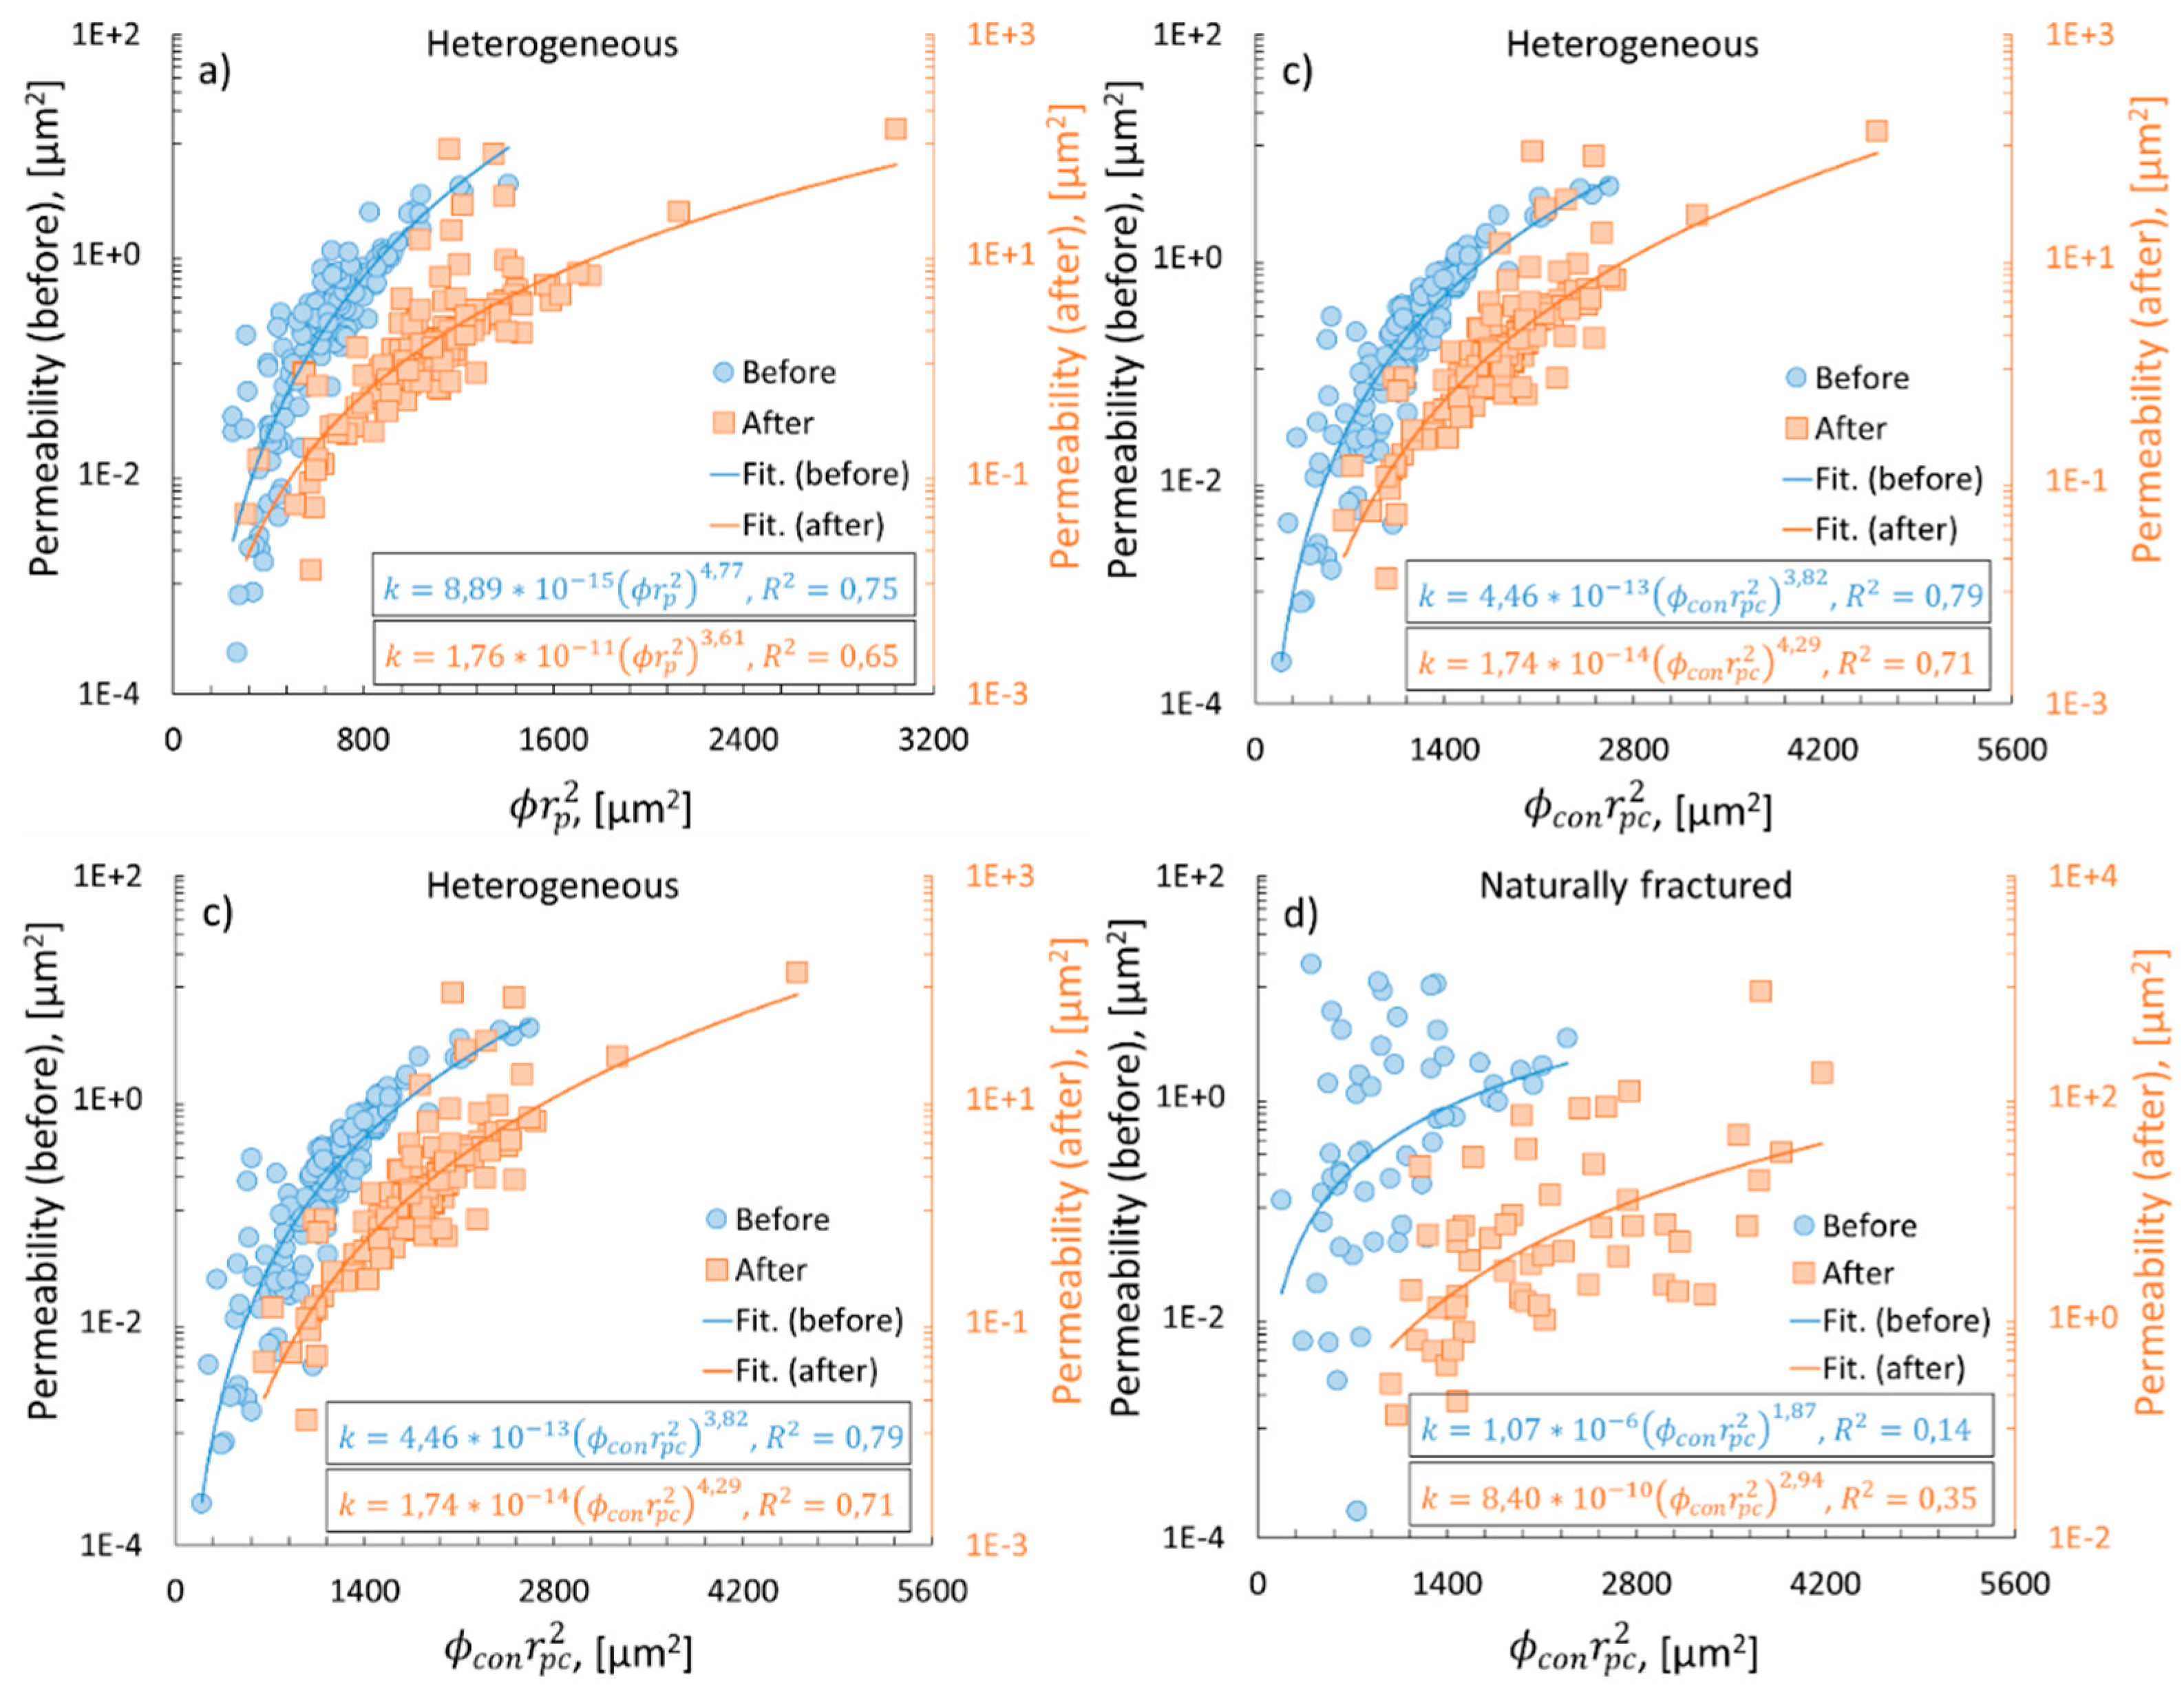
| Sample name | Porosity,% | Permeability, µm2 | Composition, % | ||
| Calcite | Dolomite | Quartz | |||
| #1 | 19.0 | 0.29 | 99 | - | 1 |
| #2 | 20.6 | 0.43 | 100 | - | - |
| #3 | 20.9 | 0.71 | 99 | - | 1 |
| #4 | 20.0 | 0.45 | 100 | - | - |
| Name of cylindrical sample | #1 | #2 | #3 | #4 | |
|---|---|---|---|---|---|
| Number of sub-volumes extracted | Before injection | 59 | 56 | 52 | 37 |
| After injection | 59 | 56 | 52 | 37 | |
| Reference | , % | Porous material | determination |
|---|---|---|---|
| [4] | 3, 9 | Sphere packing, sintered porous media | |
| [6] | 4 | Hot-pressed calcite | |
| [8] | 2.5, 3.5, 4.5 | Fontainebleau sandstone, fused glass beads, hot-pressed calcite | |
| [16] | 33 | Randomly placed squares | |
| [36] | 9-14 | Basalt clasts | |
| [17] | 5.9 | Carbonate rocks | |
| [19] | 0.85 | Microgranite | |
| [20] | 1.9 | Fontainebleau sandstone | |
| [21] | 0.855 | Granite | |
| [18] | 2.4 | Young sea ice | |
| This study (before) Heterogeneous Naturally fractured |
7.3 5.4 |
Carbonate rocks |
|
| This study (after) Heterogeneous Naturally fractured |
4.8 6.2 |
Carbonate rocks |
Disclaimer/Publisher’s Note: The statements, opinions and data contained in all publications are solely those of the individual author(s) and contributor(s) and not of MDPI and/or the editor(s). MDPI and/or the editor(s) disclaim responsibility for any injury to people or property resulting from any ideas, methods, instructions or products referred to in the content. |
© 2023 by the authors. Licensee MDPI, Basel, Switzerland. This article is an open access article distributed under the terms and conditions of the Creative Commons Attribution (CC BY) license (http://creativecommons.org/licenses/by/4.0/).


