1. Introduction
Flow with high turbulence intensity over a lightweight fixed-wing UAV at transitional Reynolds numbers is investigated in this study through wind tunnel experiments. The Albatross electric powered UAV used in this study has a 3 m wingspan with a wing aspect ratio of 13.6, which is considered a slender wing. The maximum takeoff weight is 10 kg, with a cruise speed of 68 km/h[
1]. Though there are several existing studies that describe the design and configurations of fixed-wing UAVs, little to no effort is made in optimizing the aerodynamic or structural dynamic performance of the vehicles [
2]. Aircraft control laws are often developed in the absence of significant turbulence, since flight tests are often conducted in remote test ranges and on days with benign atmospheric conditions[
3]. The result of such low turbulence intensity conditions for UAV testing fails to provide sufficient excitation to evaluate the disturbance rejection capability of control systems. High aspect ratio wings exhibit aeroservoelastic problems. Further work still needs to be conducted to identify aeroelastic instabilities that may occur in the control surfaces[
4]. Experimental tests are required to provide valuable insight to reinforce the non-linear aeroelastic behaviour captured in various computational works developed and provide a valuable insight to the physical phenomena uncovered in these numerical models. This paper aims to address these gaps, with the goal of studying the effect of a control surface (e.g., aileron) in extremely turbulent flow and suggest solutions which is likely to use multiple control surfaces on the aircraft structure including the wing.
Fixed-wing light aircraft which operate within the atmospheric boundary layer encounter regular turbulence intensities in the range of ≈ 5-7%. The presence of turbulent winds has emerged as a significant impediment to achieving a successful flight[
5]. This underscores the necessity for designing and studying methods to alleviate atmospheric turbulence loads. Fezans et al.[
6] investigated prediction of disturbance loads resulting from atmospheric turbulence for compensation through counteractive feedforward deflections of an aircraft’s flight control surfaces. Mohamed et al.[
7] investigated a method for mitigating the effect of turbulence on fixed-wing micro aerial vehicles (MAVs) by improving the sensing and response time of its on-board attitude control system. Ayele & Maldonado(2023)[
8] modified the simplified Bernoulli-Euler beam model equation to include the fluctuating aerodynamic lift, and hence the effect of change in wind direction (gust) and flow turbulence of the Martian atmosphere to compute effective angle of attack and wing tip displacement of an inflatable wing robotic ground-aerial vehicle. Georgios et al.(2020) [
9] show strong dependency of aircraft structure flexibility between the selected turbulence model and aeroelastic response through comparison of load envelopes and spectral content. This is mainly due to the presence of large flow structures at low altitudes that have comparable dimensions to the vehicle, and which despite the relatively small wind speeds within the Earth boundary layer, result in overall high load events for slow-moving vehicles. The lifting potential of the wing depends on the nature of the airflow around its surrounding. However, the link between the aerodynamic derivatives responsible for lift production and the dynamics of the airflow characteristics is still under investigation[
10]. In practical application areas, adverse weather operation capabilities of UAVs is one of the challenges identified in using them to gather atmospheric data for weather management systems[
11].
A study by Maldonado et al. [
12] showed that freestream turbulence with an intensity of ≈ 6.14% substantially increases the lift coefficient and lift force over a fixed wind turbine S809 airfoil section at a Reynolds number of 2.08x10
, particularly in the stall region of the airfoil. Another study by Maldonado et al. [
13] implemented active flow control techniques with synthetic jets in a three-bladed rotor with a diameter of 2.58 m to mitigate blade structural vibration. The isolated rotor was operated inside a large laboratory without freestream turbulence. However, the three-dimensional unsteady nature of the flow and inherent bending motion vibration of a rotating rotor system operating at a rotor speed of 1,000 revolutions per-minute produced extreme wall-normal turbulence intensities of up to ≈26% less than 1 mm from the blade tip surface. Synthetic jets were shown to delay flow separation by providing momentum to the boundary layer, which reduces the size of the separated recirculating flow region in the trailing edge region of the blade. In the process, the unsteady forcing of the blade, particularly in the blade tip region, is reduced which mitigates the amplitude of blade bending vibration.
Since the early 1980s, experimental fluid mechanics has undergone a revolutionary development with research in particle image velocimetry (PIV)[
14]. Three dimensional particle tracking velocimetry is a technique based on reconstruction of single particle trajectories over long sequences, and it allows an accurate evaluation of the Lagrangian properties [
15] unlike the 3D PIV technique which estimates the average velocity of particles in an Euler frame with the spatial-correlation method [
16]. In this study, flow measurement is done using the ‘Shake-The-Box’ (STB) particle tracking algorithm technique. The STB method represents an advanced particle tracking scheme that incorporates the recent advancements of both 3D PTV and tomographic particle image velocimetry [
17], which was first introduced in 2013. In this experimental study, we employ a two-pulse STB particle tracking algorithm to capture volumetric flow measurements. The two-pulse STB confirms the capability to accurately reconstruct individual particle tracks despite the limited time-resolution information offered by two-frame recordings [
18].
1.1. Research Objectives
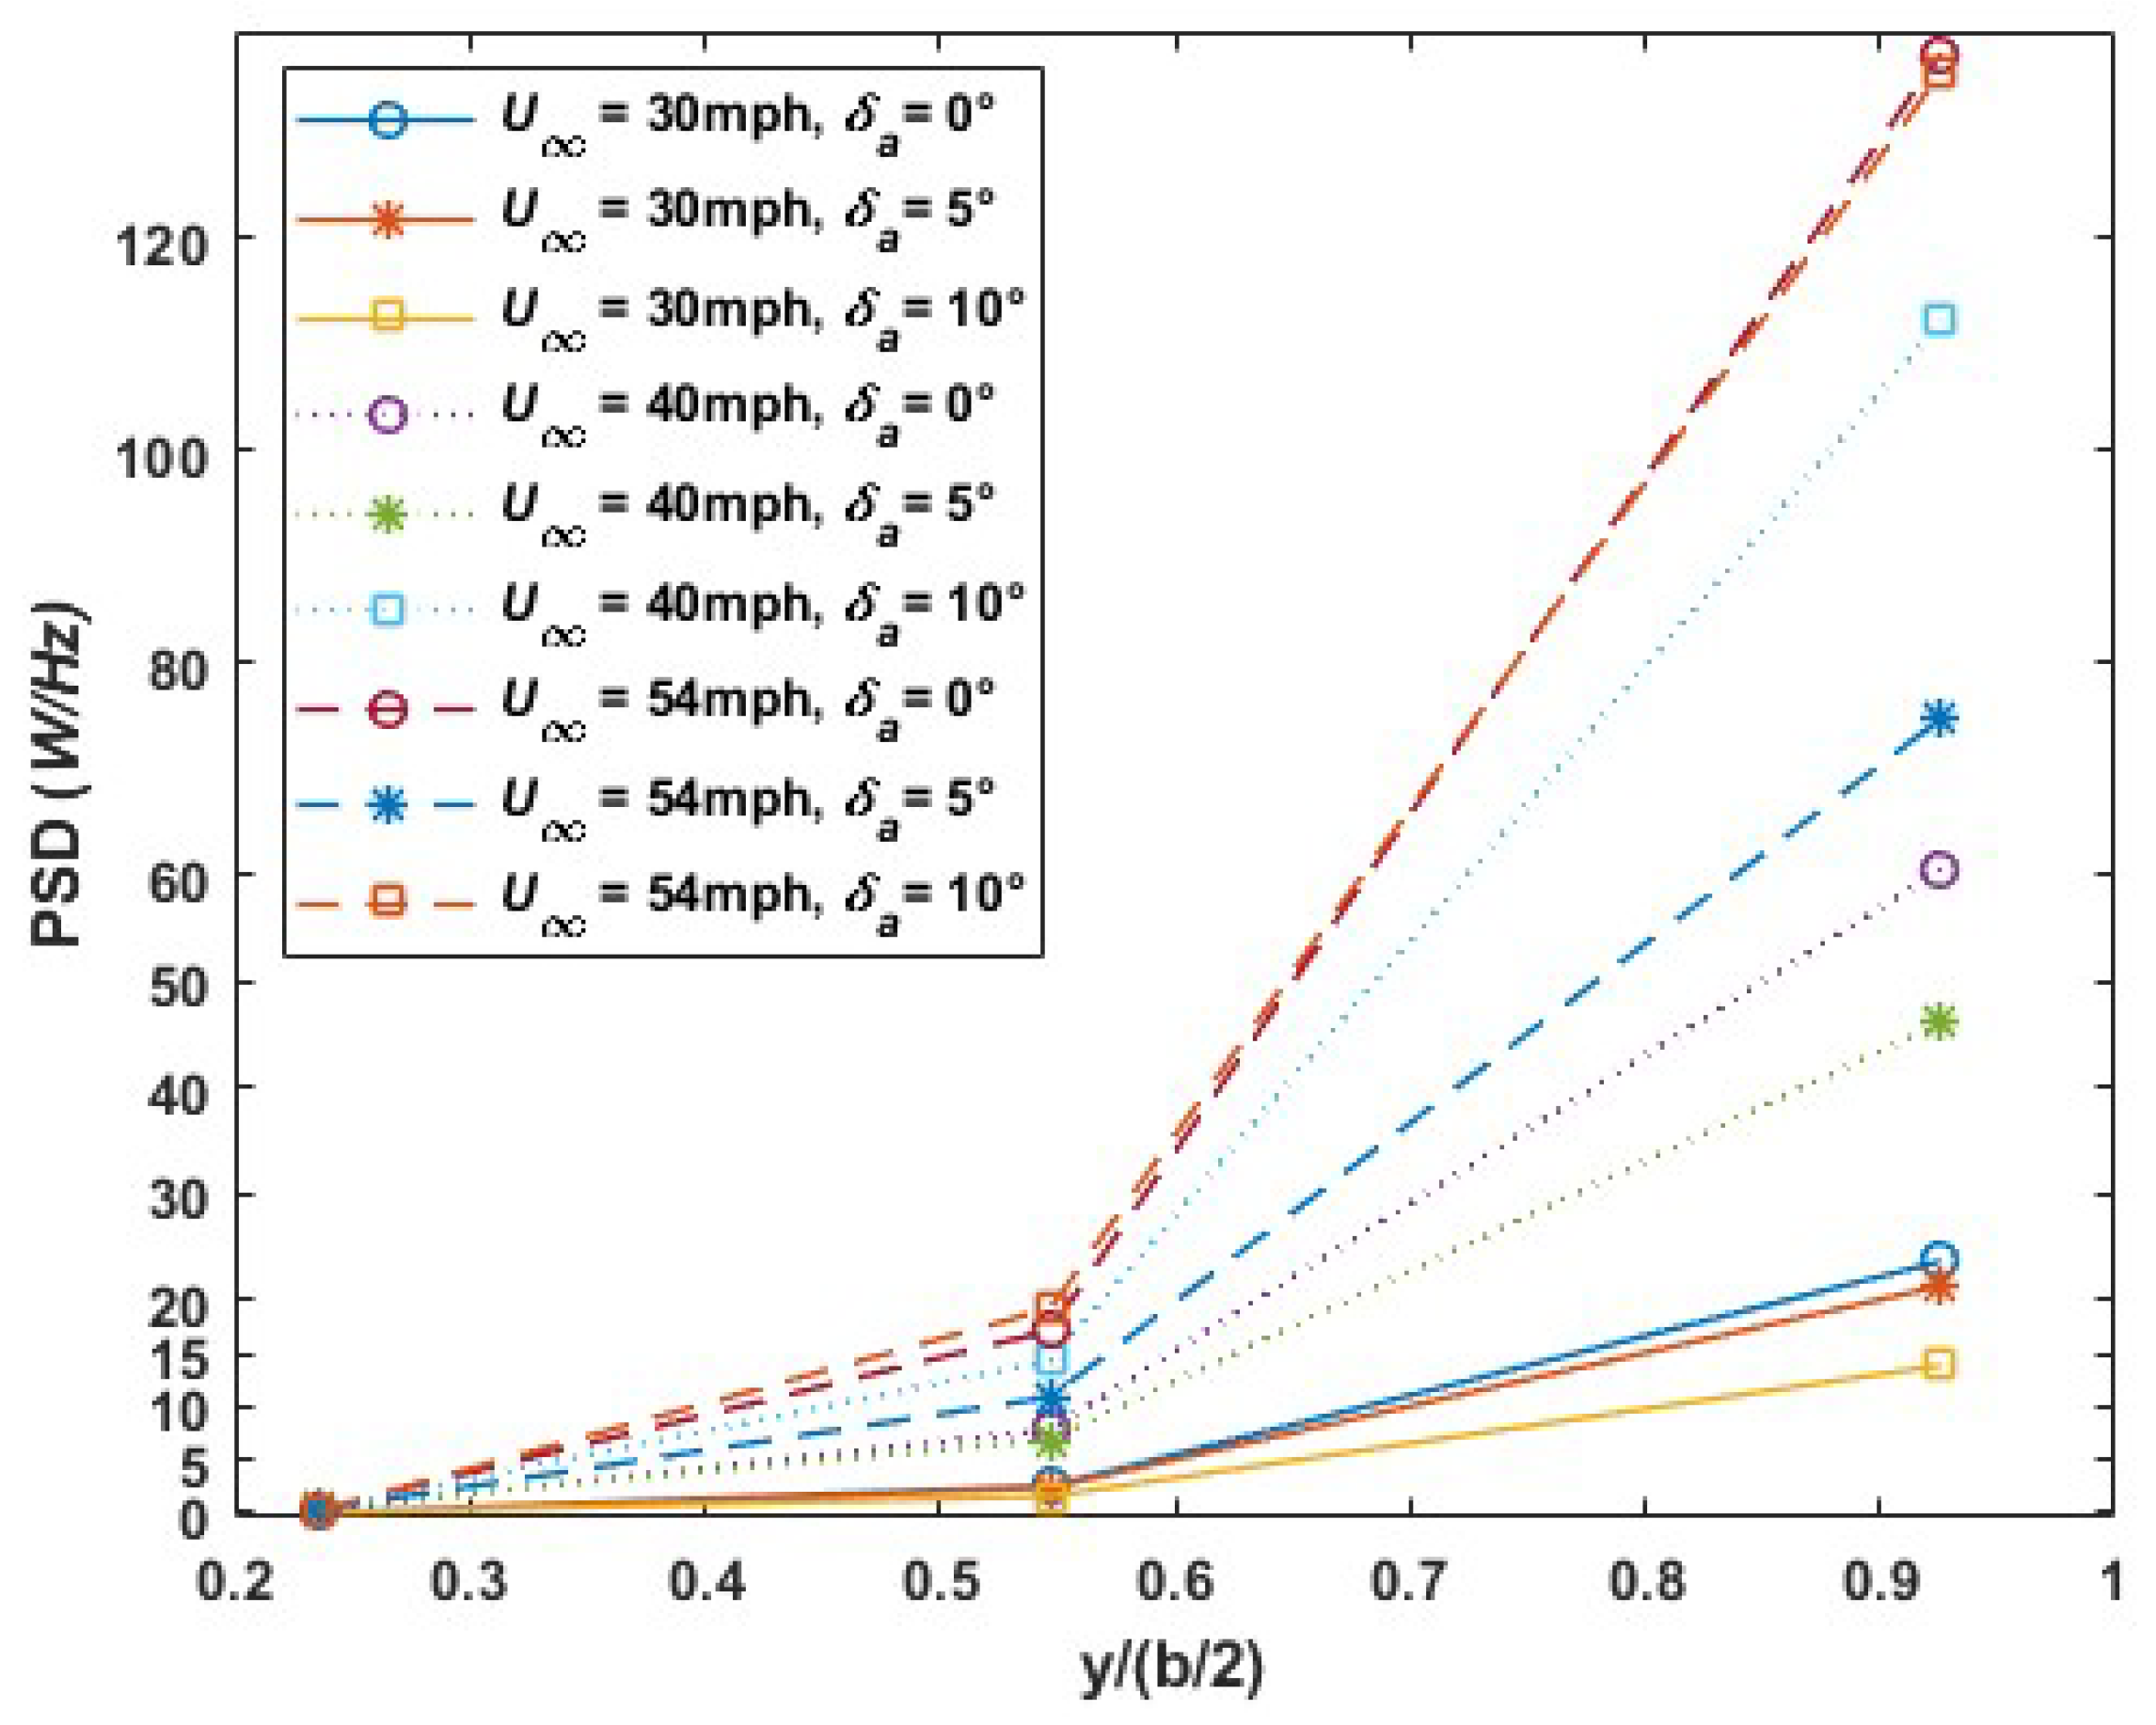
In this study, the goal is to understand how extreme freestream turbulence intensity, ≈10% impacts a commercial unmanned aerial vehicle (UAV) structure, and specifically how large fluctuating loads lead to the structural bending response and energy content of specific frequencies of a slender fixed- wing. The objectives are to study the spectrum of UAV vibration, and determine the power spectral energy (PSD) associated with the structural frequency, , the shedding frequency, , and the frequency due to the integral length scales in the flow, . An aileron on the UAV wing is deflected in order to measure the increase in the mean and fluctuating lift force as well as bending deflection of the wing. This is the first step to understanding how the size and deflection angle, as well as the placement, of a control surface can be used to alleviate or counteract the large fluctuating loads imparted on the UAV by large-scale vortex flow structures. The length scales as well as vorticity and turbulent kinetic energy of these flow structures are computed from volumetric particle image velocimetry (PIV) measurements. A cutting-edge LaVision PIV system was configured and adjusted to capture volumetric measurements through the application of LaVision’s ‘Shake-the-Box’ (STB) particle tracking algorithm. The ’shake-the-box’ technique is employed in particle tracking velocimetry (PTV) to improve the precision of tracking particles in three-dimensional space.It is expected that ultimately this work will lead to designing light aircraft structures such as UAVs that can maintain structural integrity and flight control in extreme wind conditions, such as in hurricanes, to enable real-time video feedback for search & rescue and damage assessment.
2. Experimental Setup
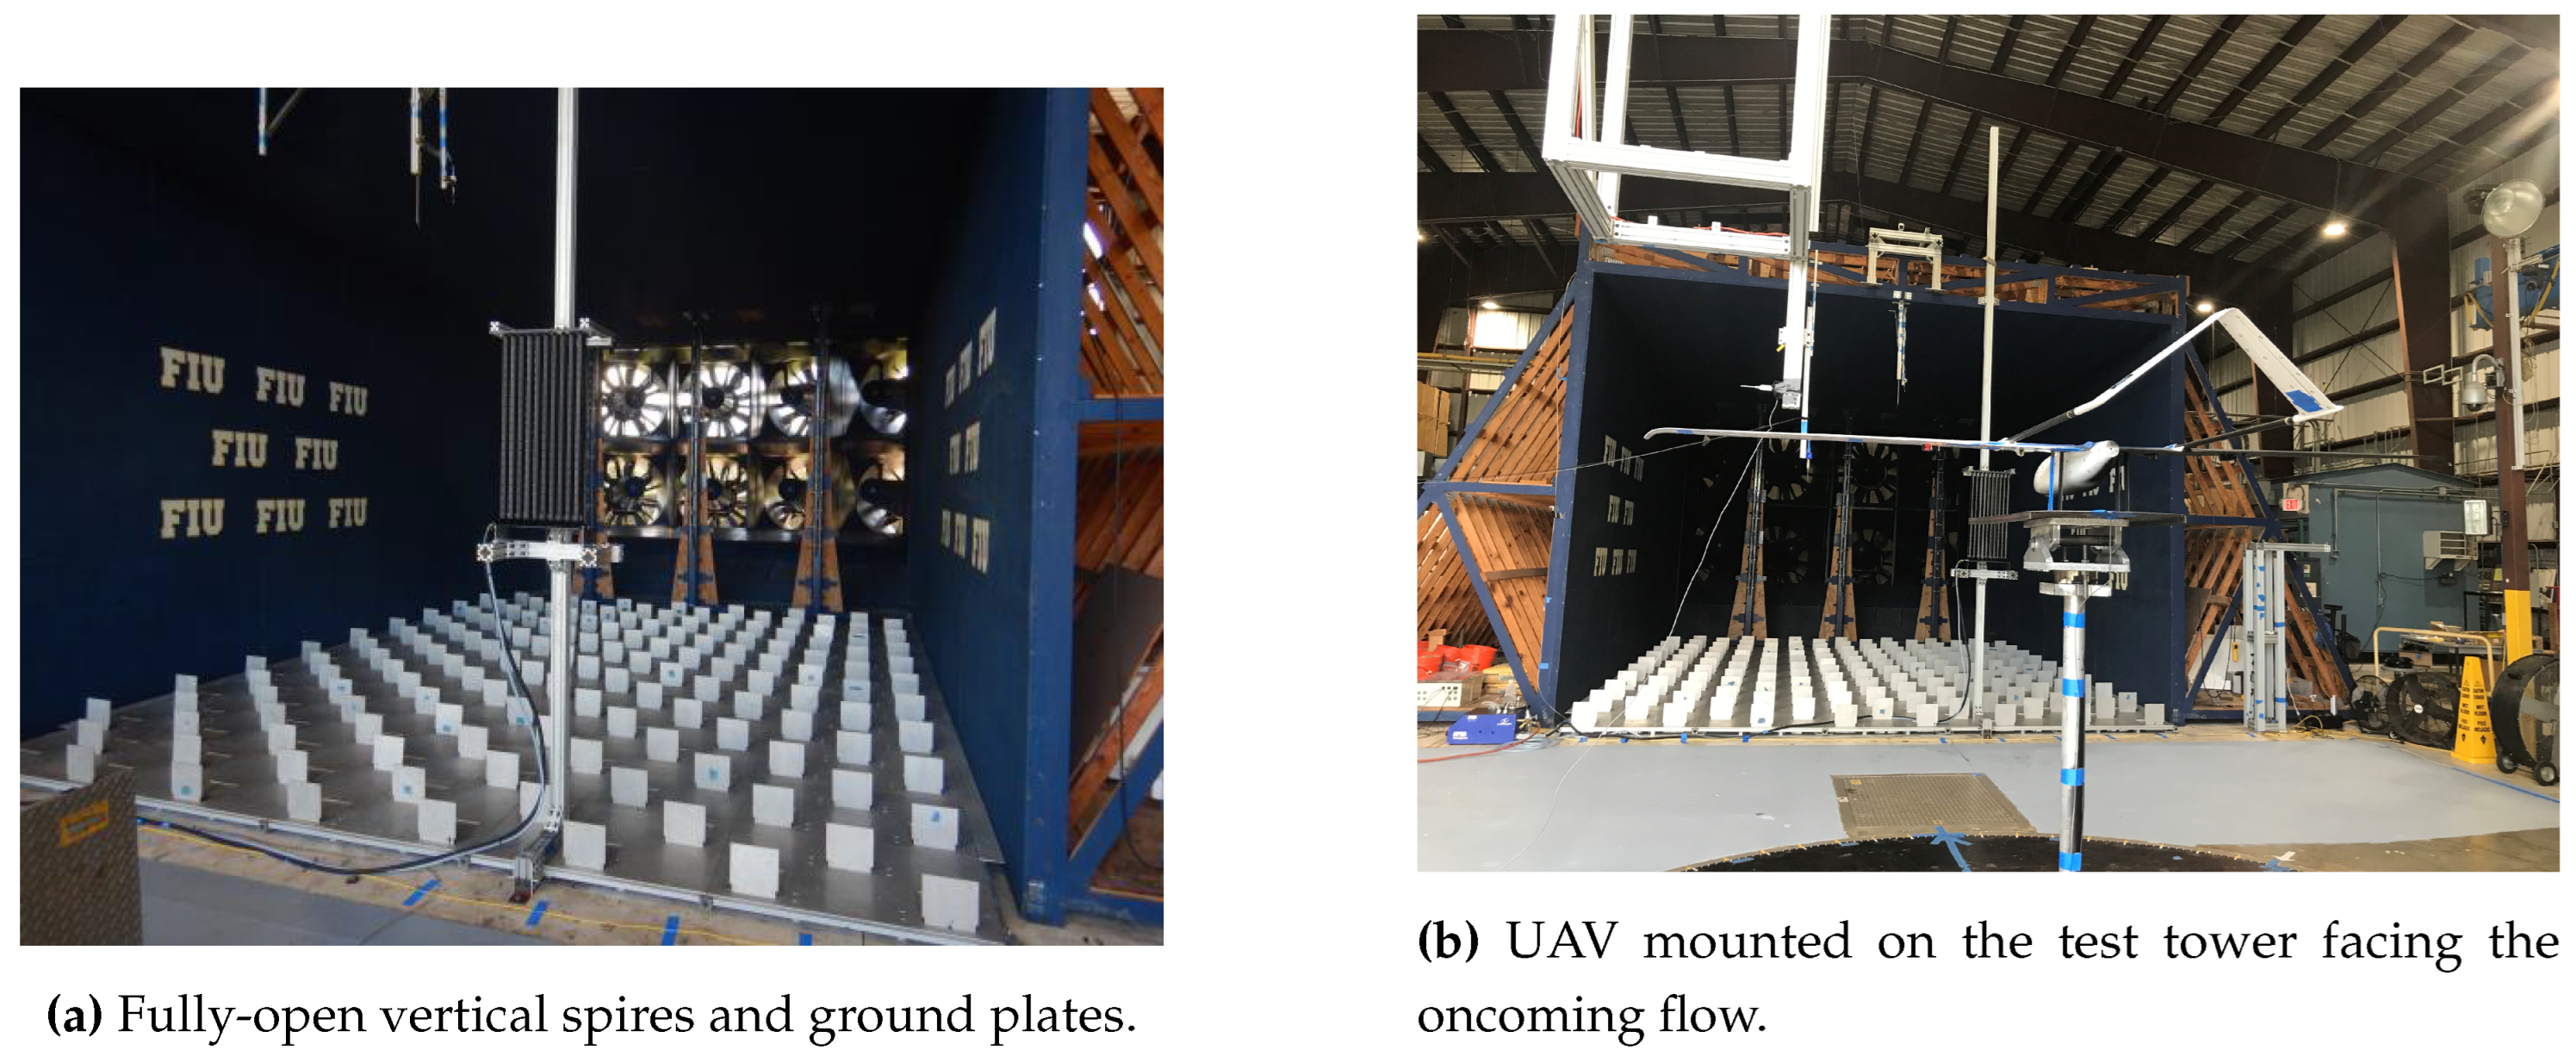
The research experiments were conducted at the Wall-of-Wind Experimental Facility (WOW-EF) located at Florida International University (FIU). This national shared-used facility is designated as part of the Natural Hazards Engineering Research Infrastructure (NHERI) network of facilities across the country. The 12-fan WOW-EF is a large open-return wind tunnel with a 20 ft wide by 14 ft tall test section and wind field, and is capable of producing wind speeds up to hurricane Category 5 (≈ 153 mph maximum). A flow management section is located between the intake fans and the experimental test section (
Figure 1a). The WOW facility is used to test failure modes of full-sized structures such as site-built or manufactured housing and small commercial structures. It has experimental capabilities of high-speed holistic testing at multiple scales, wind-driven rain simulation, and conventional boundary layer wind tunnel testing and full or large-scale aerodynamic/aeroelastic testing in simulated atmospheric boundary layer flows. An extreme turbulent flow profile was implemented in this study with ground spires fully exposed to the freestream, and automated floor roughness plates fully extended to 90 degrees and no roughness blocks on the concrete floor.
An aluminum tower is designed and manufactured to test an Albatross UAV [
1] as shown on
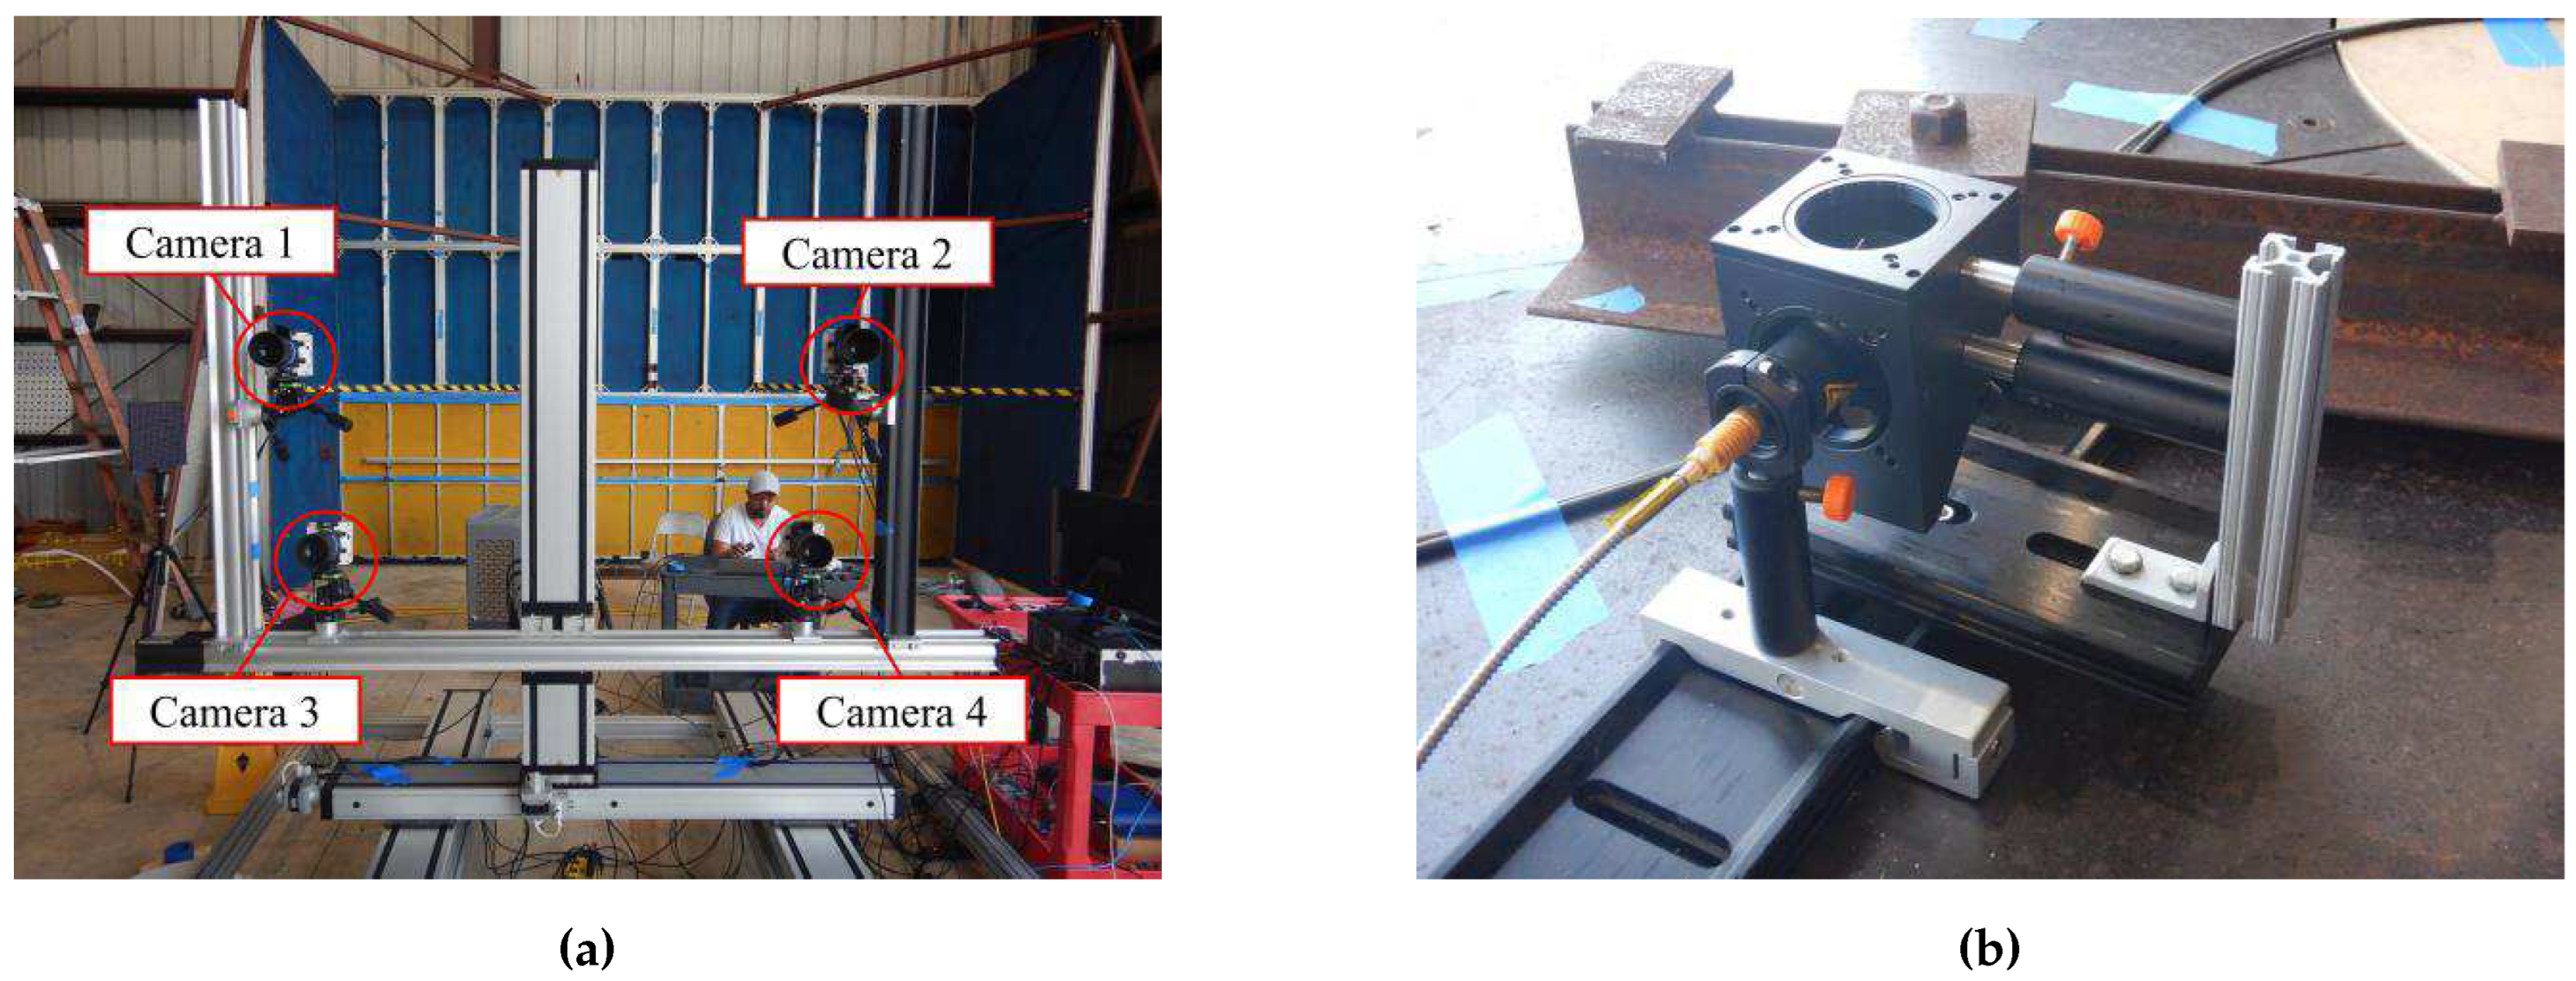
Figure 1b. The tower is mounted on a turntable, and the UAV is mounted to the top of the tower via an adapter assembly with manual adjustable angle of attack. A flat plate is used to isolate the flow and aerodynamic interference between the UAV and adapter as well as an ATI-IA Theta load cell mounted at the base of the tower to measure forces and moments. A state-of-the-art LaVision PIV system was setup and calibrated to acquire volumetric measurements using LaVision’s proprietary ‘Shake-the-Box’ particle tracking algorithm. Four high-speed cameras were installed on the translation stage and the laser optics were adjusted for 3D volumetric images. The laser volume was located around the right wing aileron, which functioned as a control surface during these experiments. The right wing panel and right side of the fuselage were painted flat black to improve PIV image quality during the experiments.
Figure 2a shows the PIV setup for UAV testing. A helium-filled soap bubble generator was installed near the exit of the WOW-EF flow management section and upstream of the UAV. The laser optics were adjusted so that the light volume was directed upward onto the bottom surface of the UAV’s right wing panel.
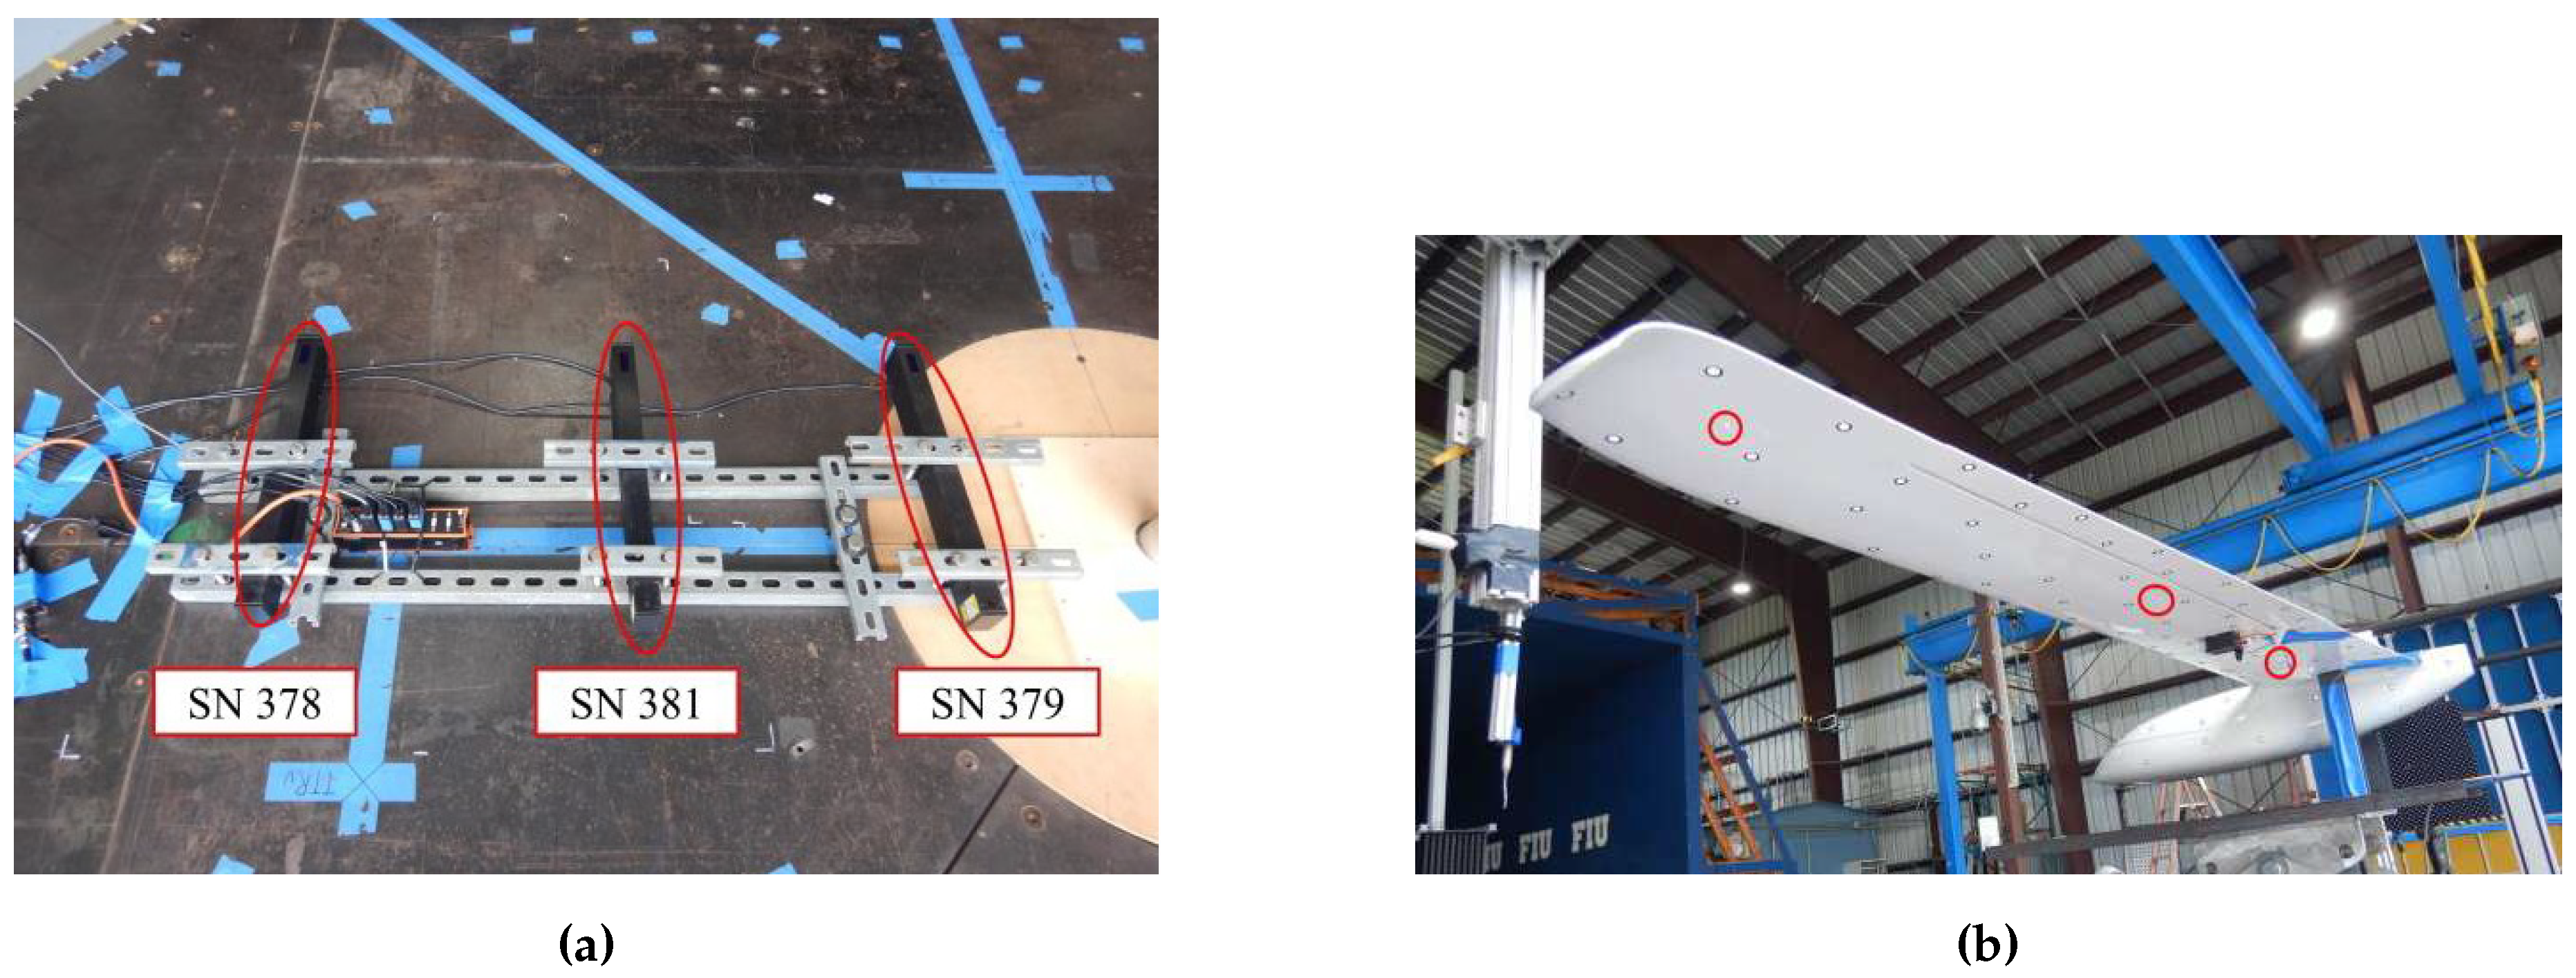
Load cell data was acquired at a sampling rate of 625 Hz for 60 seconds to match other data acquisition, using a National instruments (NI) USB data acquisition (DAQ) device and NI LabView software. Three Acuity AR-700-50 laser displacement sensors were installed to measure deflections of the UAV’s right wing during the experiments (
Figure 3a). The laser displacement sensors were located along the center of the wing chord with the first measurement point near the wing’s tip, the second measurement point near the wing’s center, and the third measurement point near the wing’s connection with the fuselage.
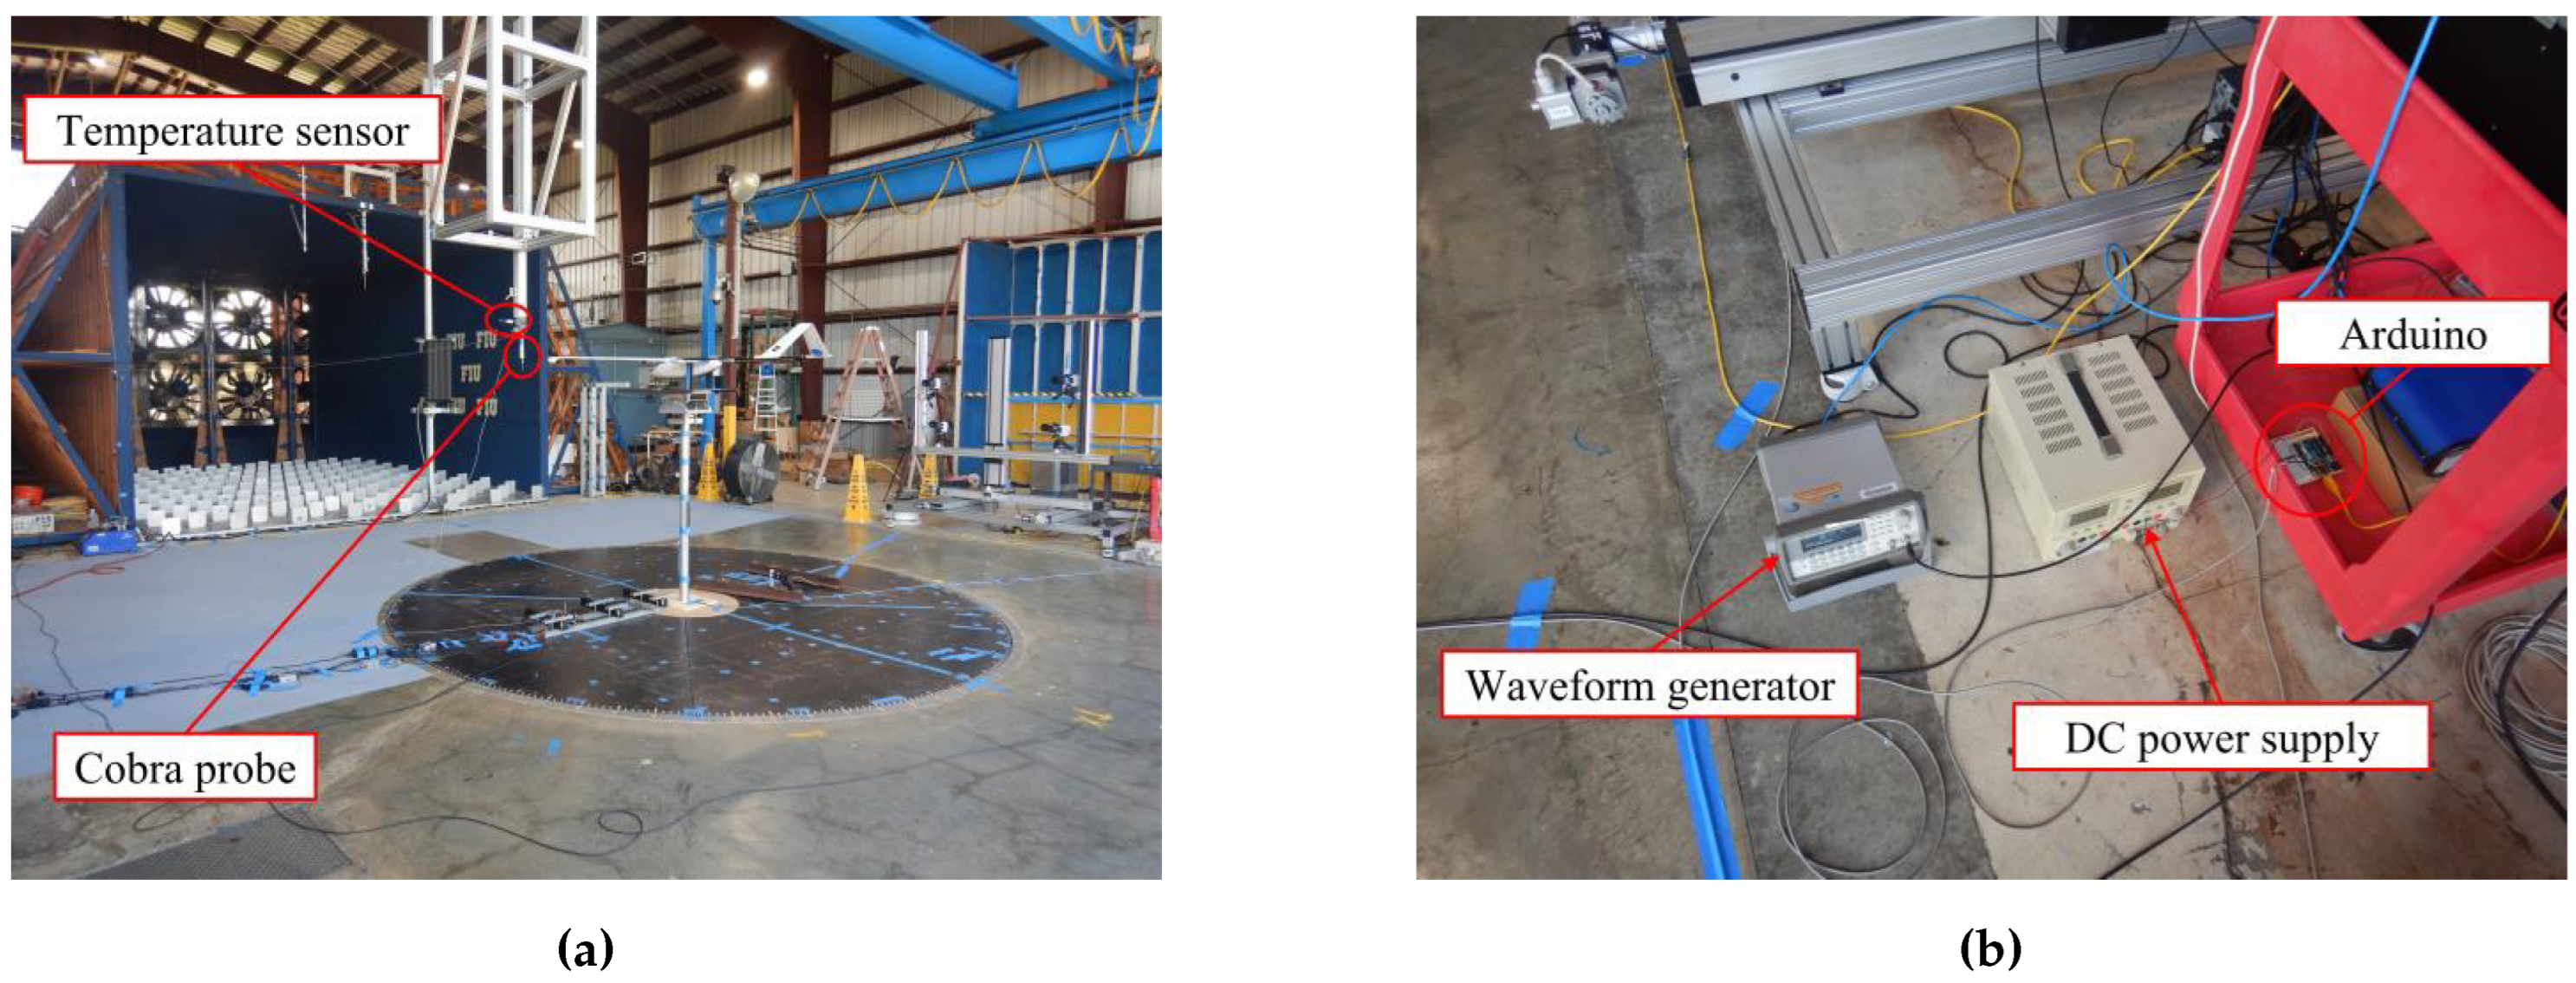
Two TFI cobra probes were installed; one near the WOW-EF flow management exit to measure reference wind flow conditions during the experiments, and a second one (
Figure 4a) just upwind of the UAV’s left wing panel to measure incoming flow conditions at the wing height. An RM Young 41342VF temperature sensor was relocated to a position near the second cobra probe to measure the air temperature impinging the wing.
The temperature sensor and the three laser displacement sensors were wired into the Dewesoft 6xSTG DAQ device. To achieve data synchronization for the data acquisition devices, an analog waveform generator (
Figure 4b) was setup to generate a trigger pulse signal. The trigger pulse started PIV image acquisition, the Dewesoft DAQ device, and the cobra probe NI cDAQ device. Data from all devices was sampled at 625 Hz during the UAV experiments. The PIV system ran in double frame mode due to the WOW-EF wind speeds during the experiments.
To control the UAV aileron angle, an Arduino program developed for servo control was implemented to operate two standard hobby-grade servo motors (
Figure 4b). The servo motors were secured to the underside of the UAV wing with 3D printed mounting panels epoxied to the wing structure. Control horns were epoxied to the ailerons, and metal linkage rods were used to connect the servo arm to the control horn. The servos were powered by a DC power supply with the output set at 6.0V. Once the servos were installed on the UAV model, the Arduino program was used to control servo position and achieve a downward deflection of the aileron at deflection angles,
of 0°, 5°, and 10° with respect to the wing chord line.
5. Time-Averaged Flow Field
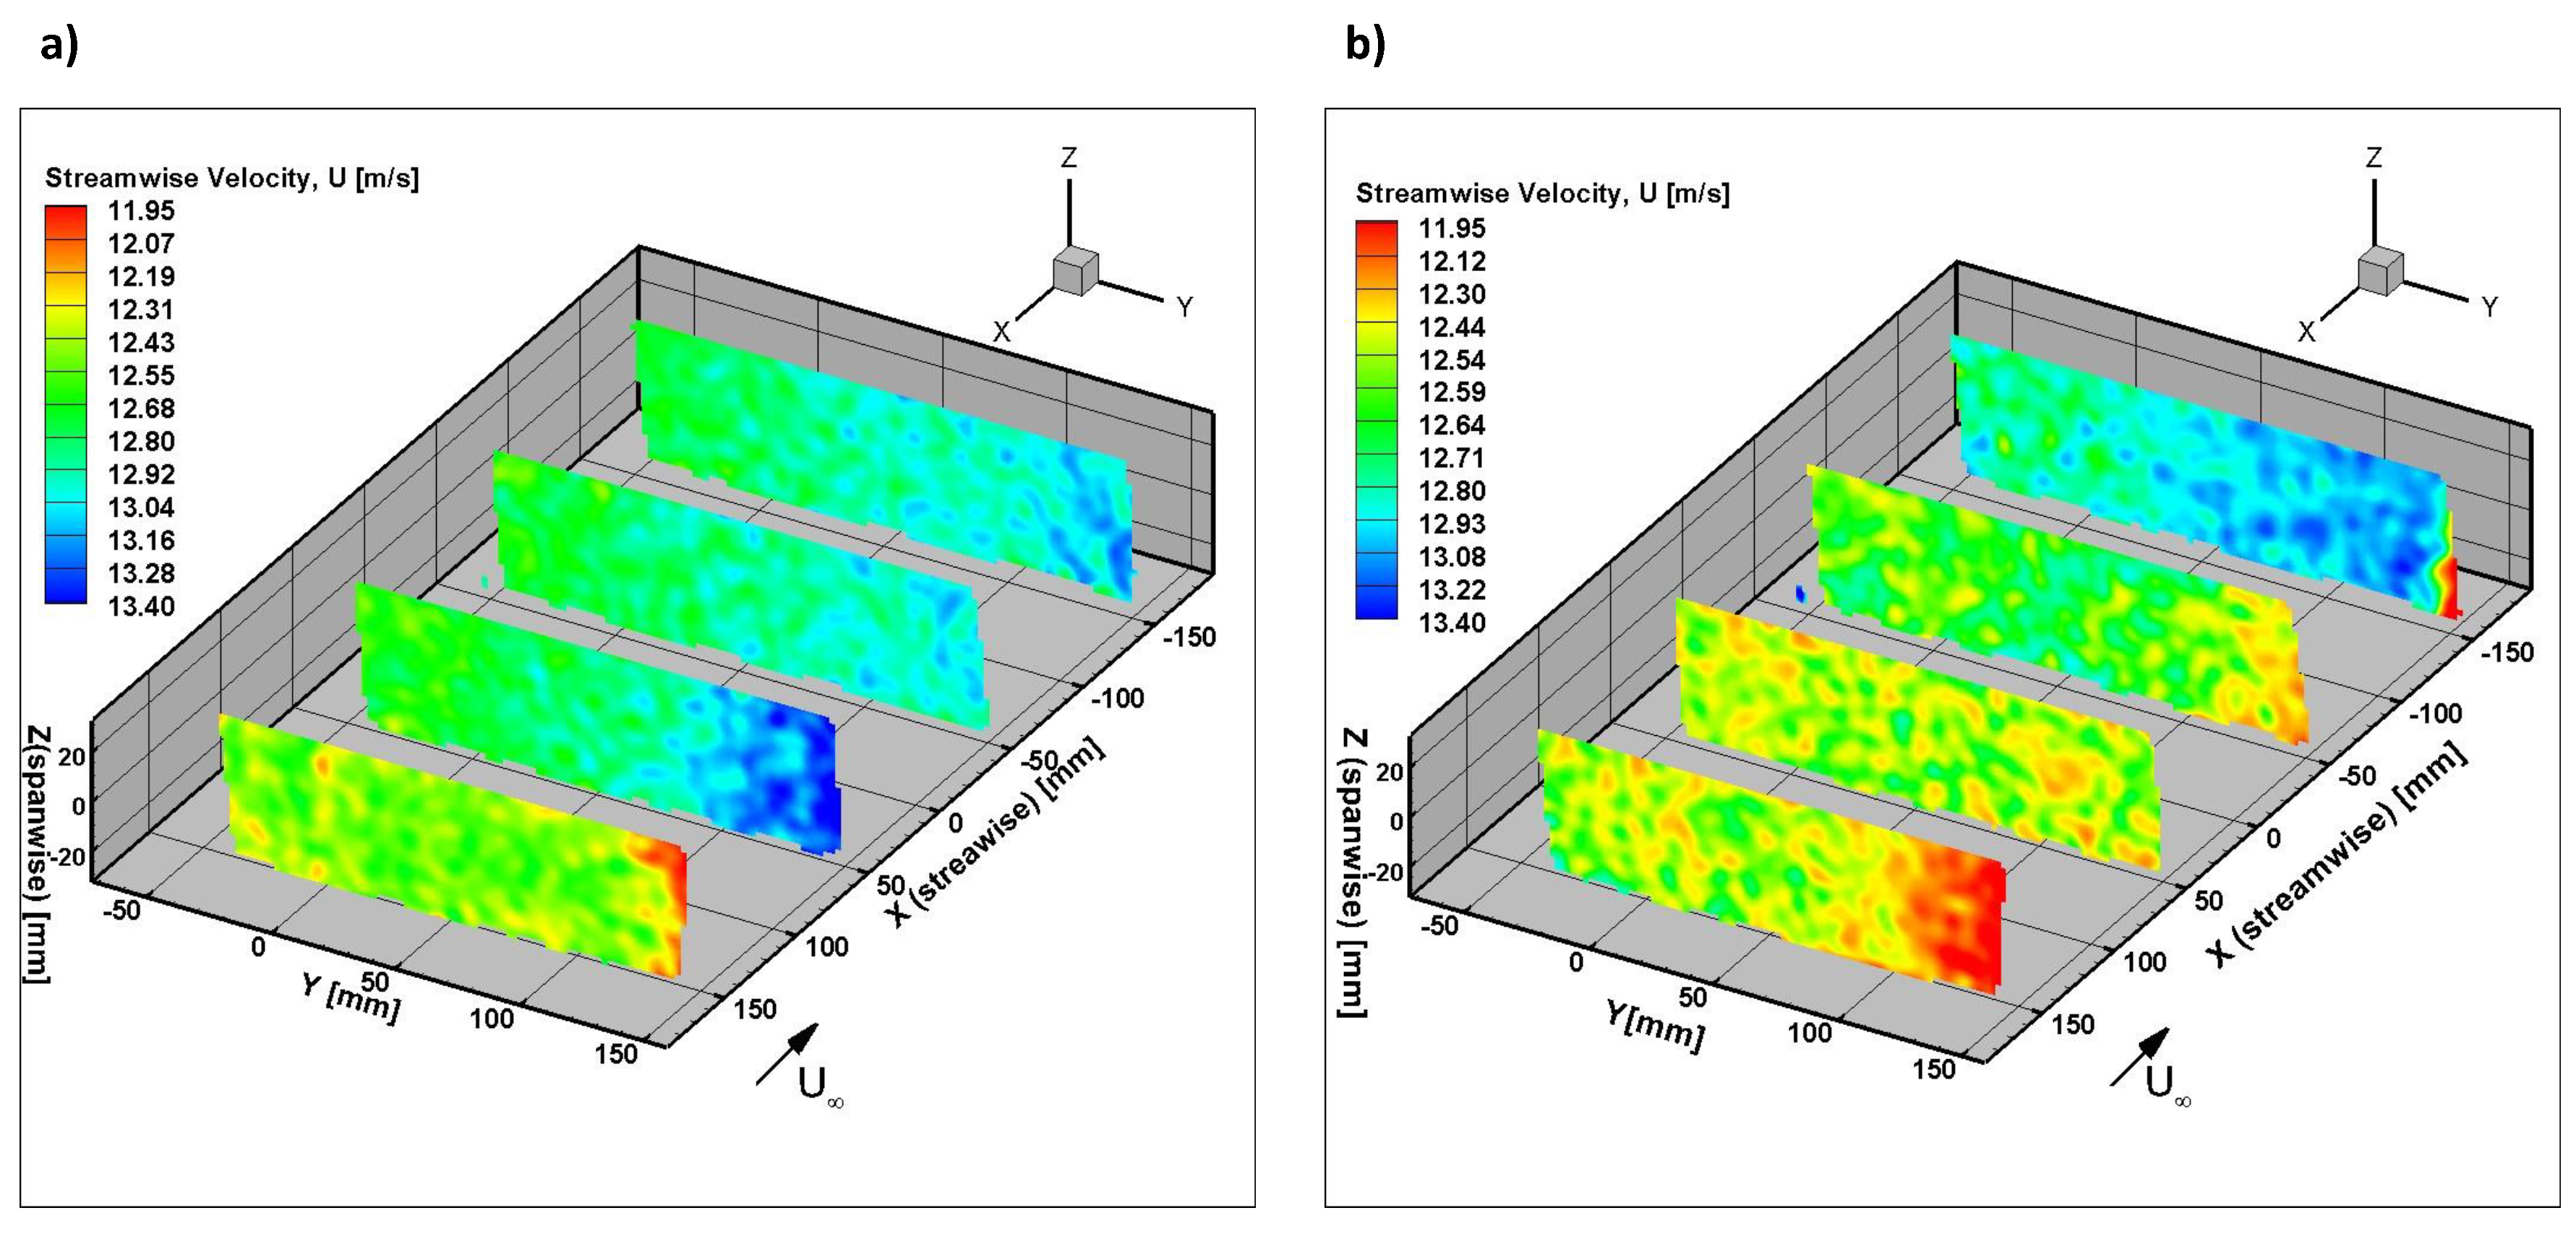
The time-averaged streamwise flow velocity,
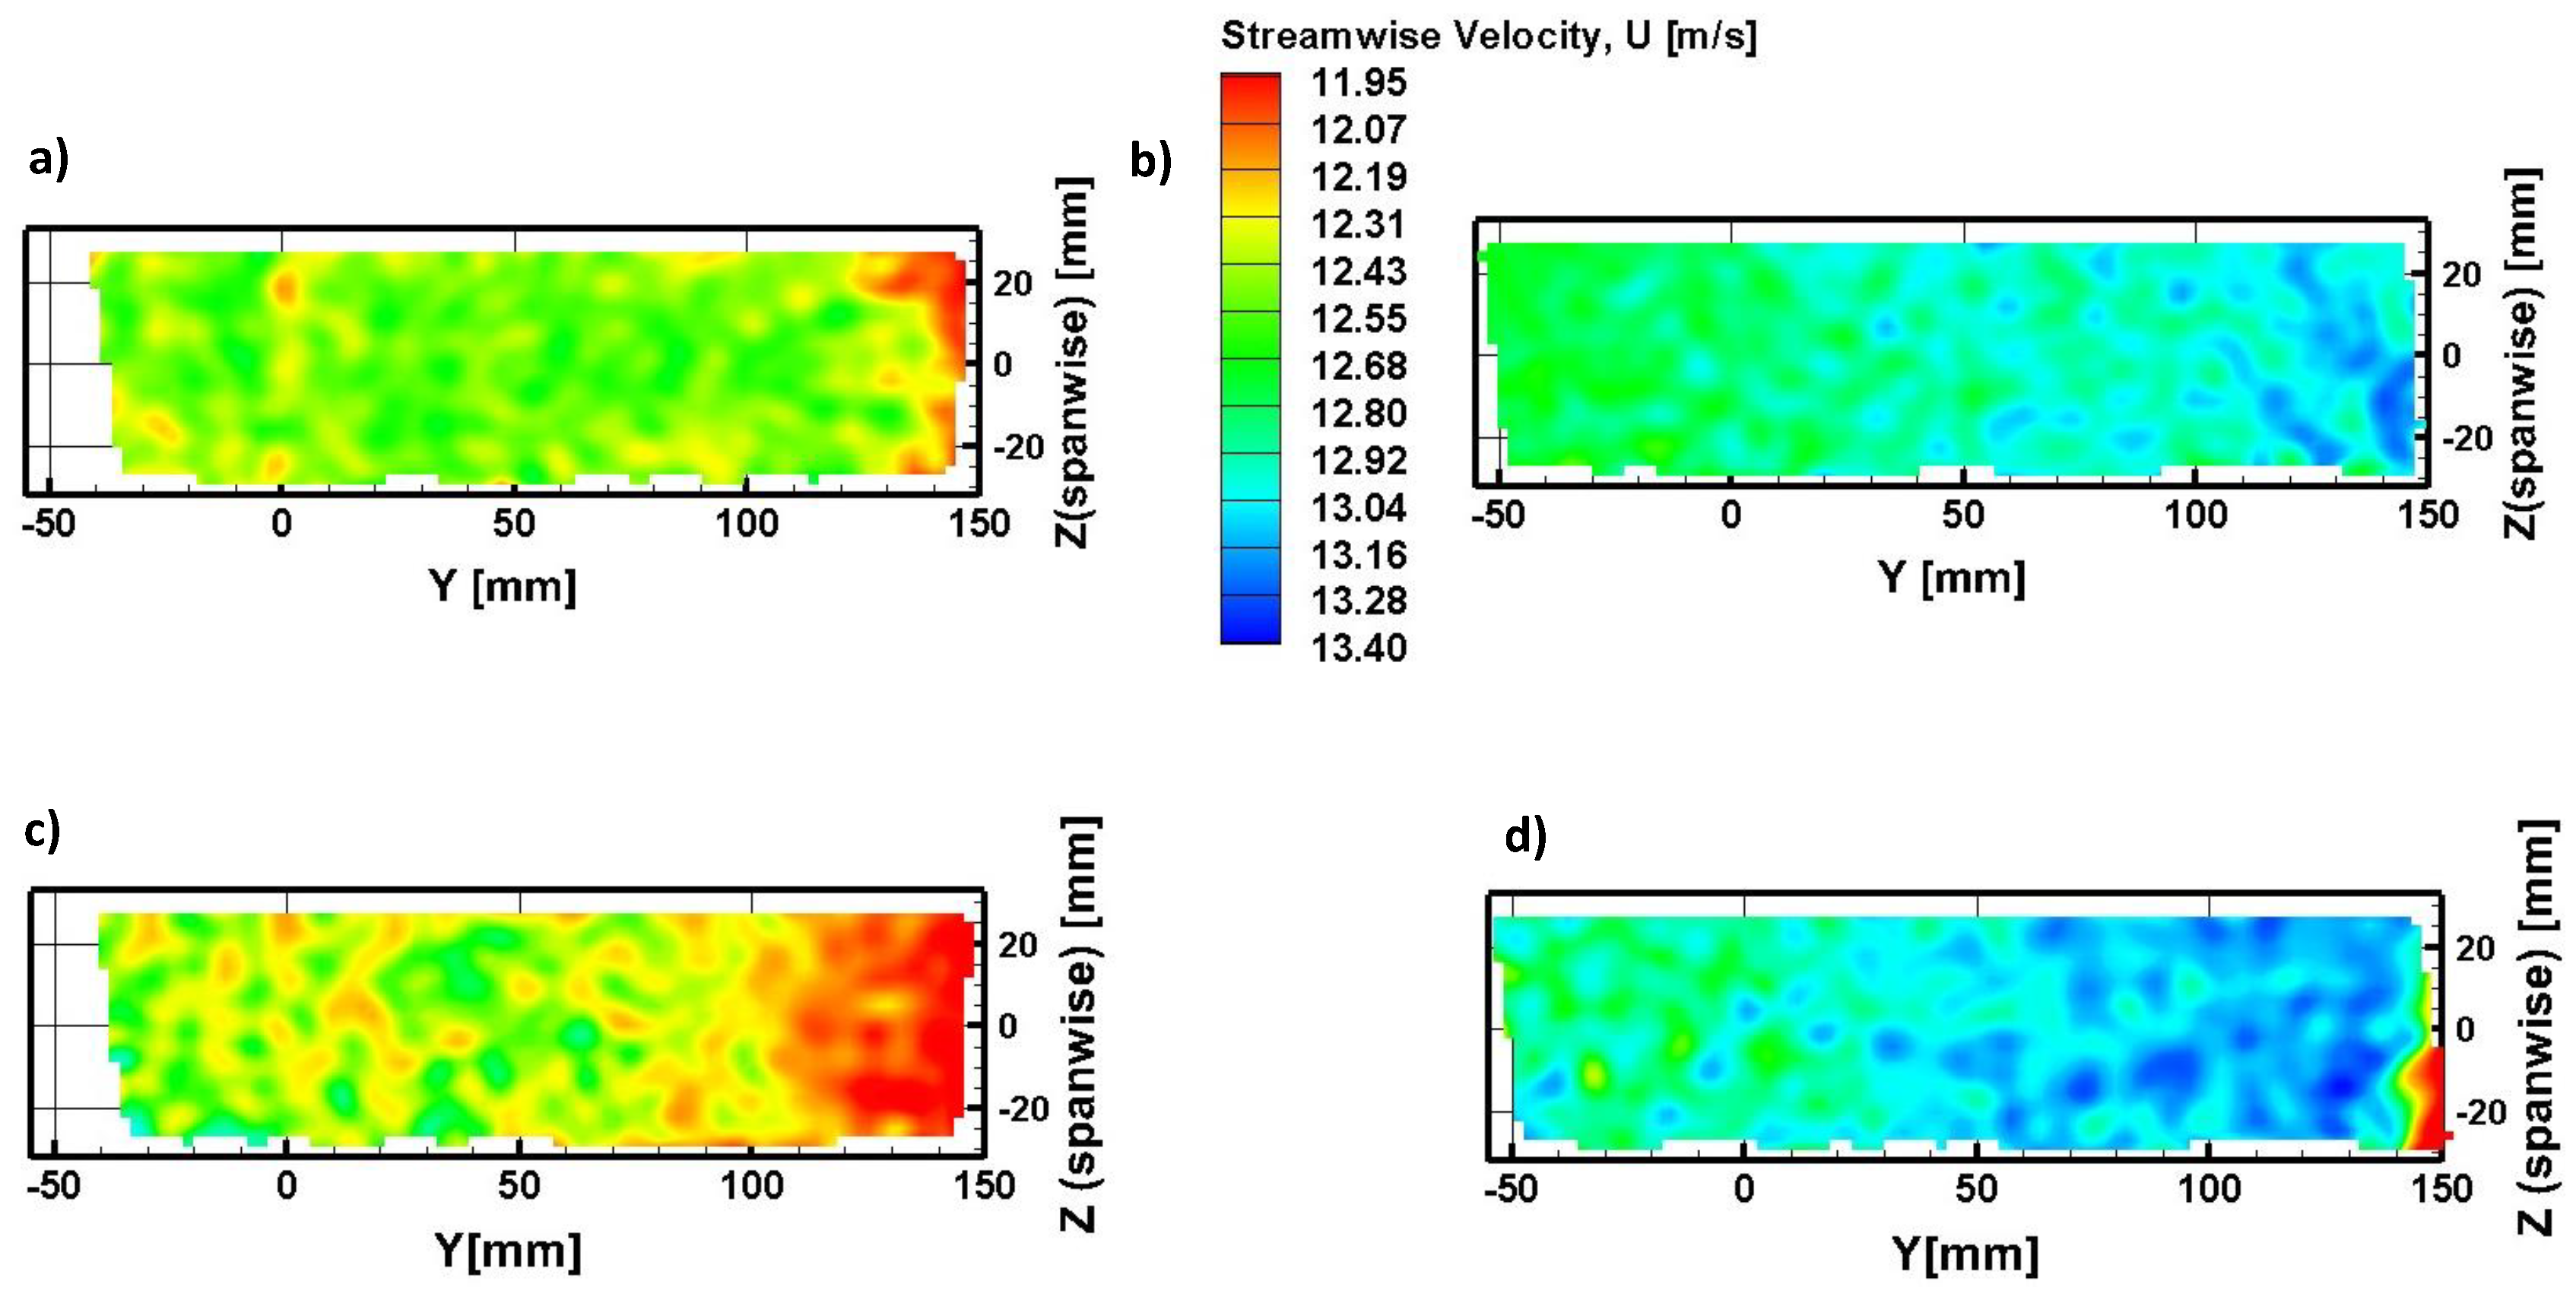
U on the underside of the UAV wing is presented as planes of velocity fields in
Figure 15 and
Figure 16 for a freestream velocity,
= 13.4 m/s and aileron deflection angles,
= 0
(baseline flow) and 10
. The first velocity field at
x = 150 mm (plane 1) is located at the leading edge of the wing. Planes 2 and 3 are located 100 mm and 150 mm downstream of the leading edge respectively. The trailing edge of the wing and aileron is positioned at
x = -100 mm, creating a chord length of 0.25 m. Finally, the last measurement plane 4 located at
x = -155 mm is just 55 mm downstream of the aileron in order to capture its effect on the flow. Note that the hinge or rotating point of the aileron coincides at
x = -50 mm which is close to the location of plane 3 at
x = -55 mm. The chord length of the aileron is therefore 50 mm. The pressure or bottom surface of the wing is aligned along an
plane defined by
y≈ 150 mm. For the baseline flow (
Figure 15(a) and
Figure 16(a) and (b)), the velocity fields for the portion of the flow underneath the wing from
y = 100 mm to 150 mm show a noticeable and gradual increase in velocity from the leading edge (
U≈ 12 m/s) to the trailing edge which tends to the freestream velocity value of 13.4 m/s. However, when the aileron is deflected represented in the velocity fields of
Figure 15(b) and
Figure 16(c) and (d), there is a substantial reduction in velocity represented by light blue contours (
U≈ 13 m/s) to yellow-orange contours (
U≈ 12 m/s) below the aileron hinge area (plane 3 at
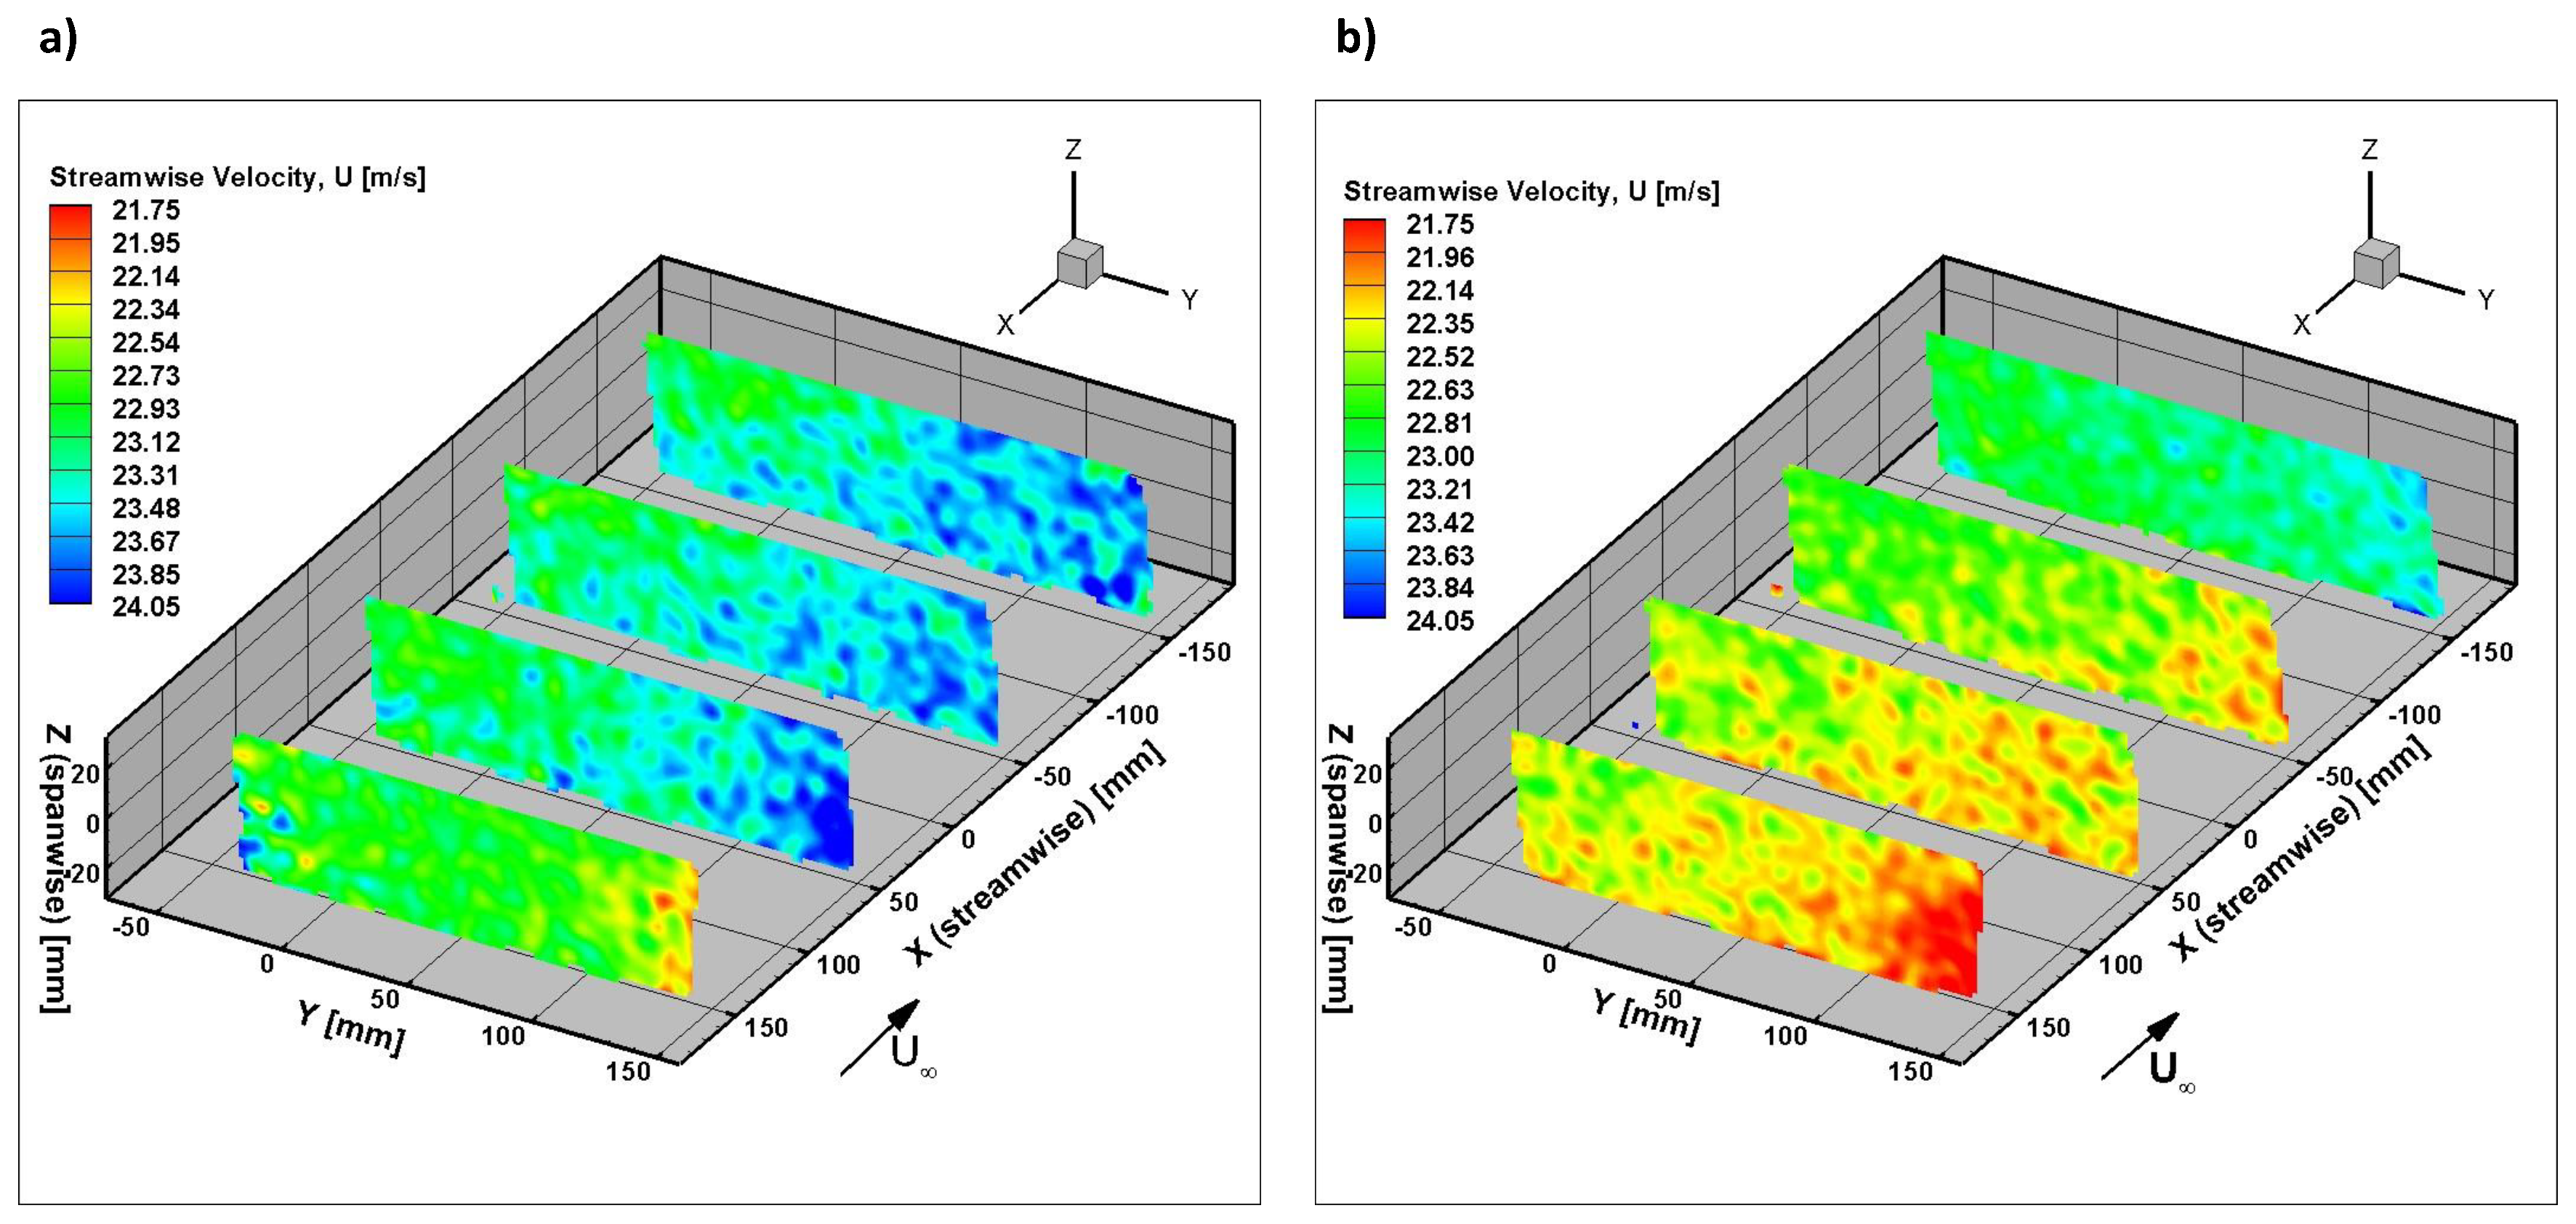
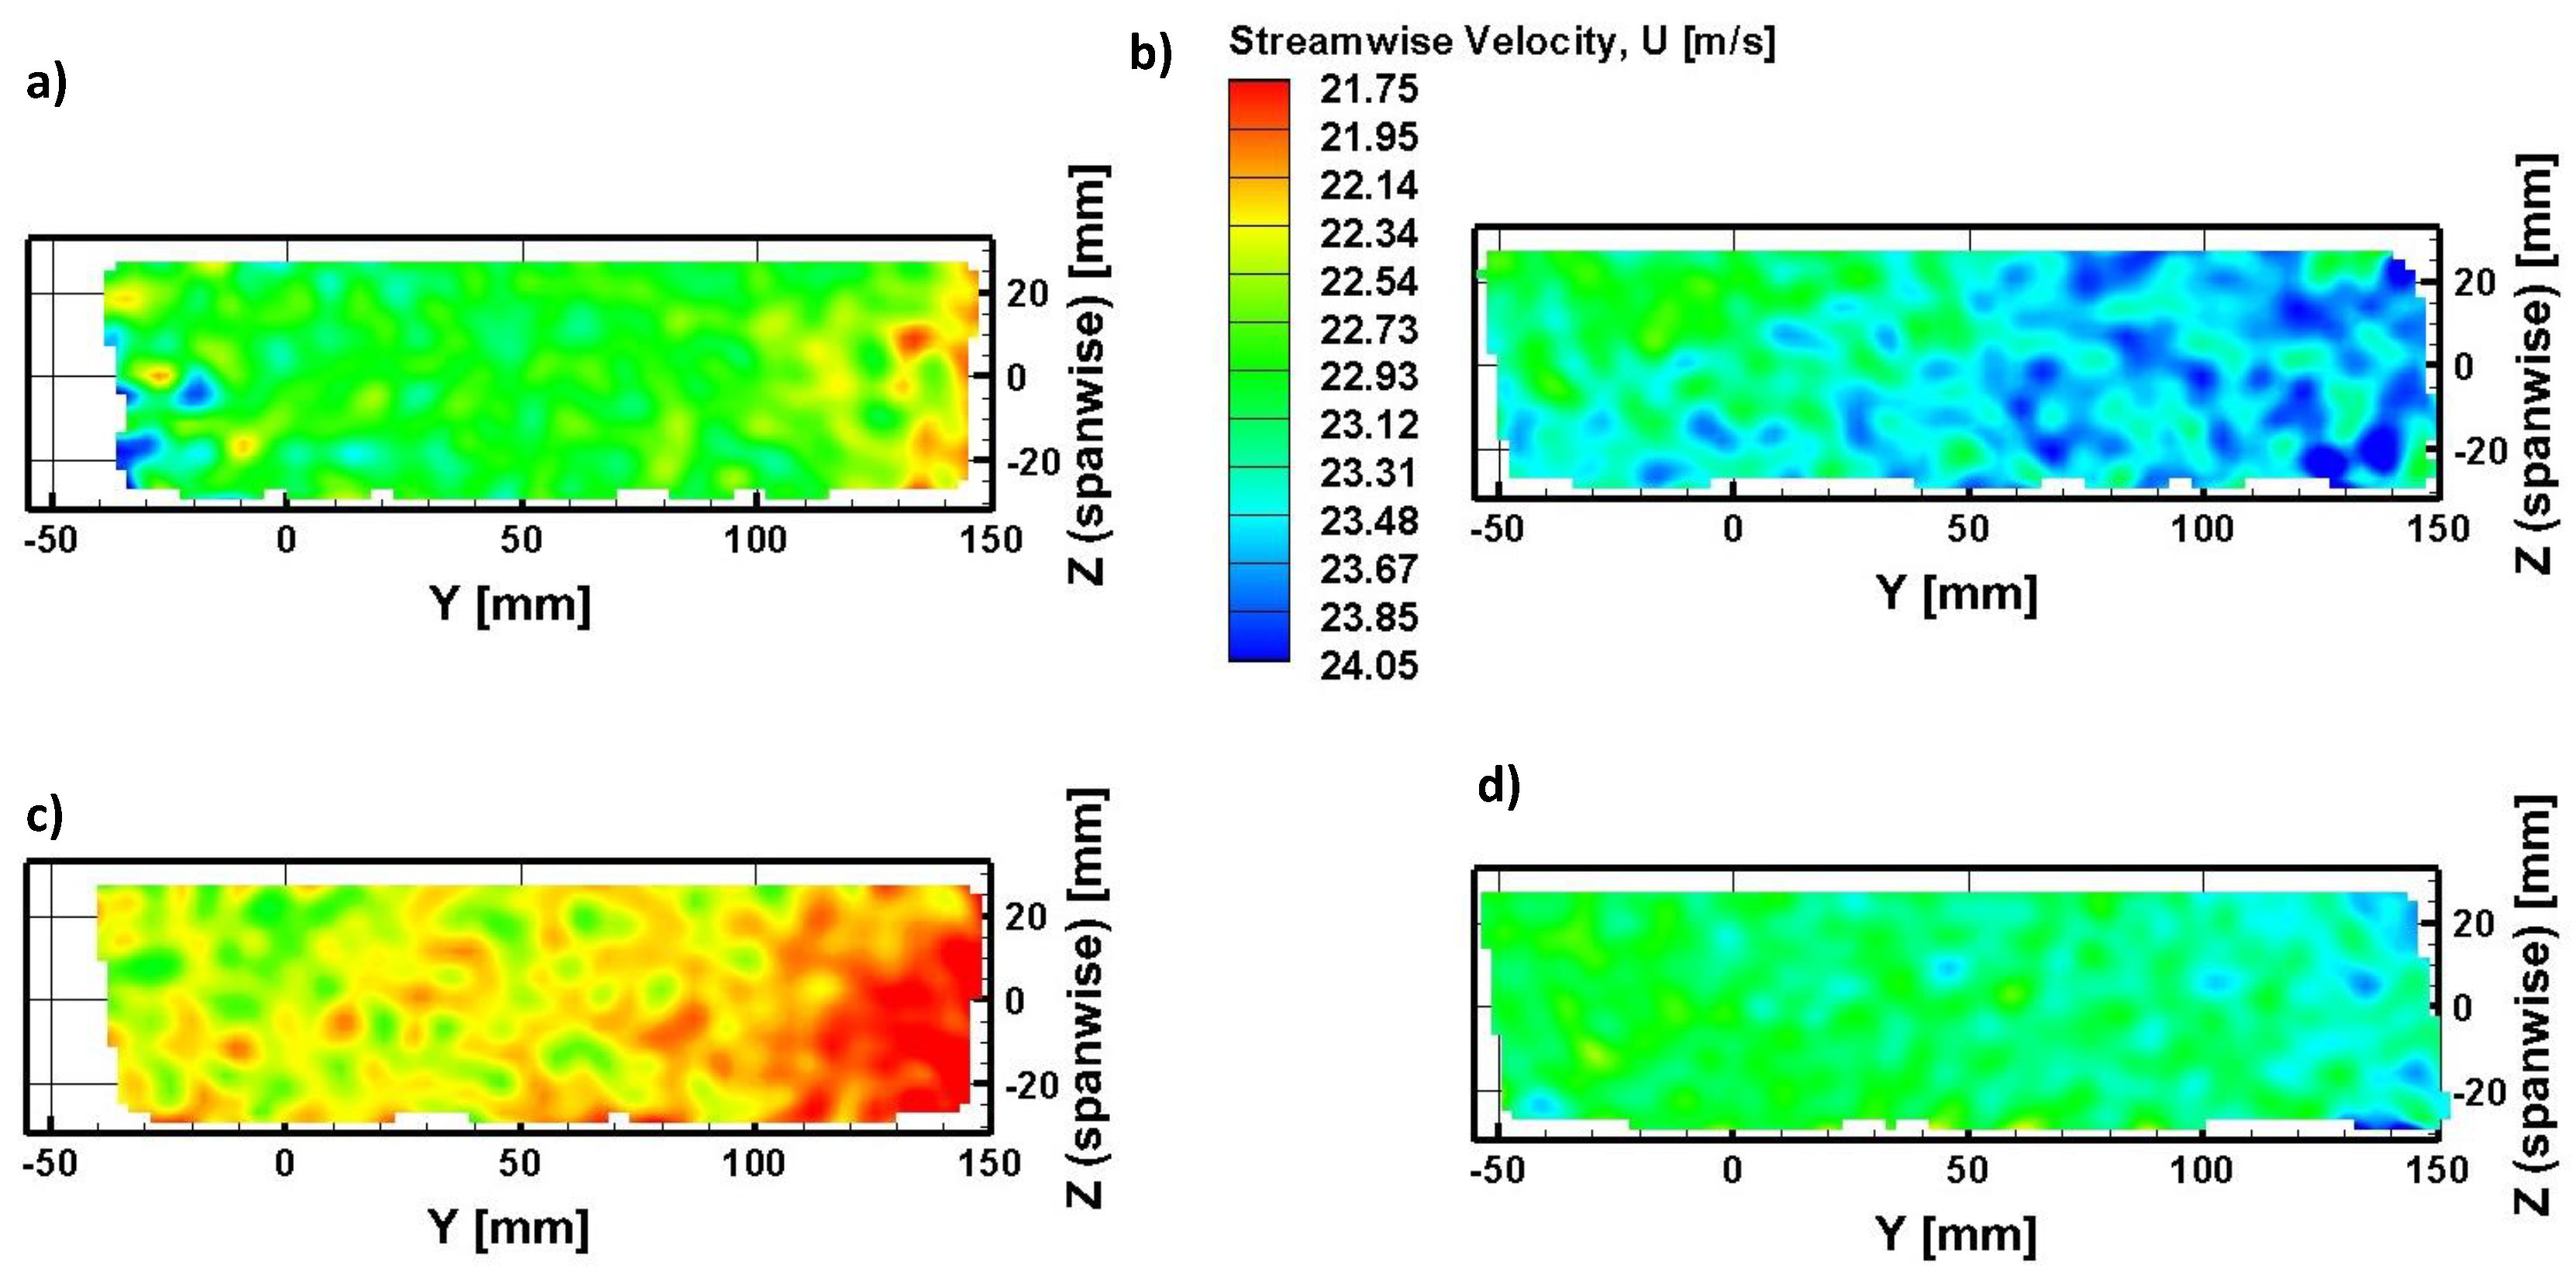
y≈ 100–140 mm) which is indicative of a rise in the pressure coefficient as expected. The flow downstream of the aileron quantified in plane 4, however, shows scattered pockets of higher momentum flow (blue contours) which are likely caused by vortex shedding as the flow rolls away from the trailing edge of the aileron. When the freestream velocity is doubled to 26.8 m/s represented by the velocity fields of
Figure 17(b), the streamwise velocity contours along the underside of the wing are similar to the lower freestream velocity. However, downstream of the aileron in
Figure 17(b) plane 4 and
Figure 18(d) the velocity fields indicate a reduced velocity magnitude which suggest the production of stronger negative vorticity about the spanwise,
z axis from the shed vortex structures. Vorticity transport in the flow and in the vicinity of the flap will be analyzed further. The highly turbulent nature of the flow with a turbulence intensity,
of approximately 10% is appreciated by the large fluctuations in streamwise velocity within each measurement plane and as it flows from the wing leading edge to behind the trailing edge.
The aileron, when deflected down, increases the effective camber of the wing section thus increasing the lift per-unit-span,
produced by the wing section. The aileron deflection also vectors the flow so as to produce downward momentum (along the
axis), where it’s time rate of change inside a control volume that encompasses the wing section can be shown to be equivalent to the change in lift produced by deflecting the flap. The downward velocity magnitude,
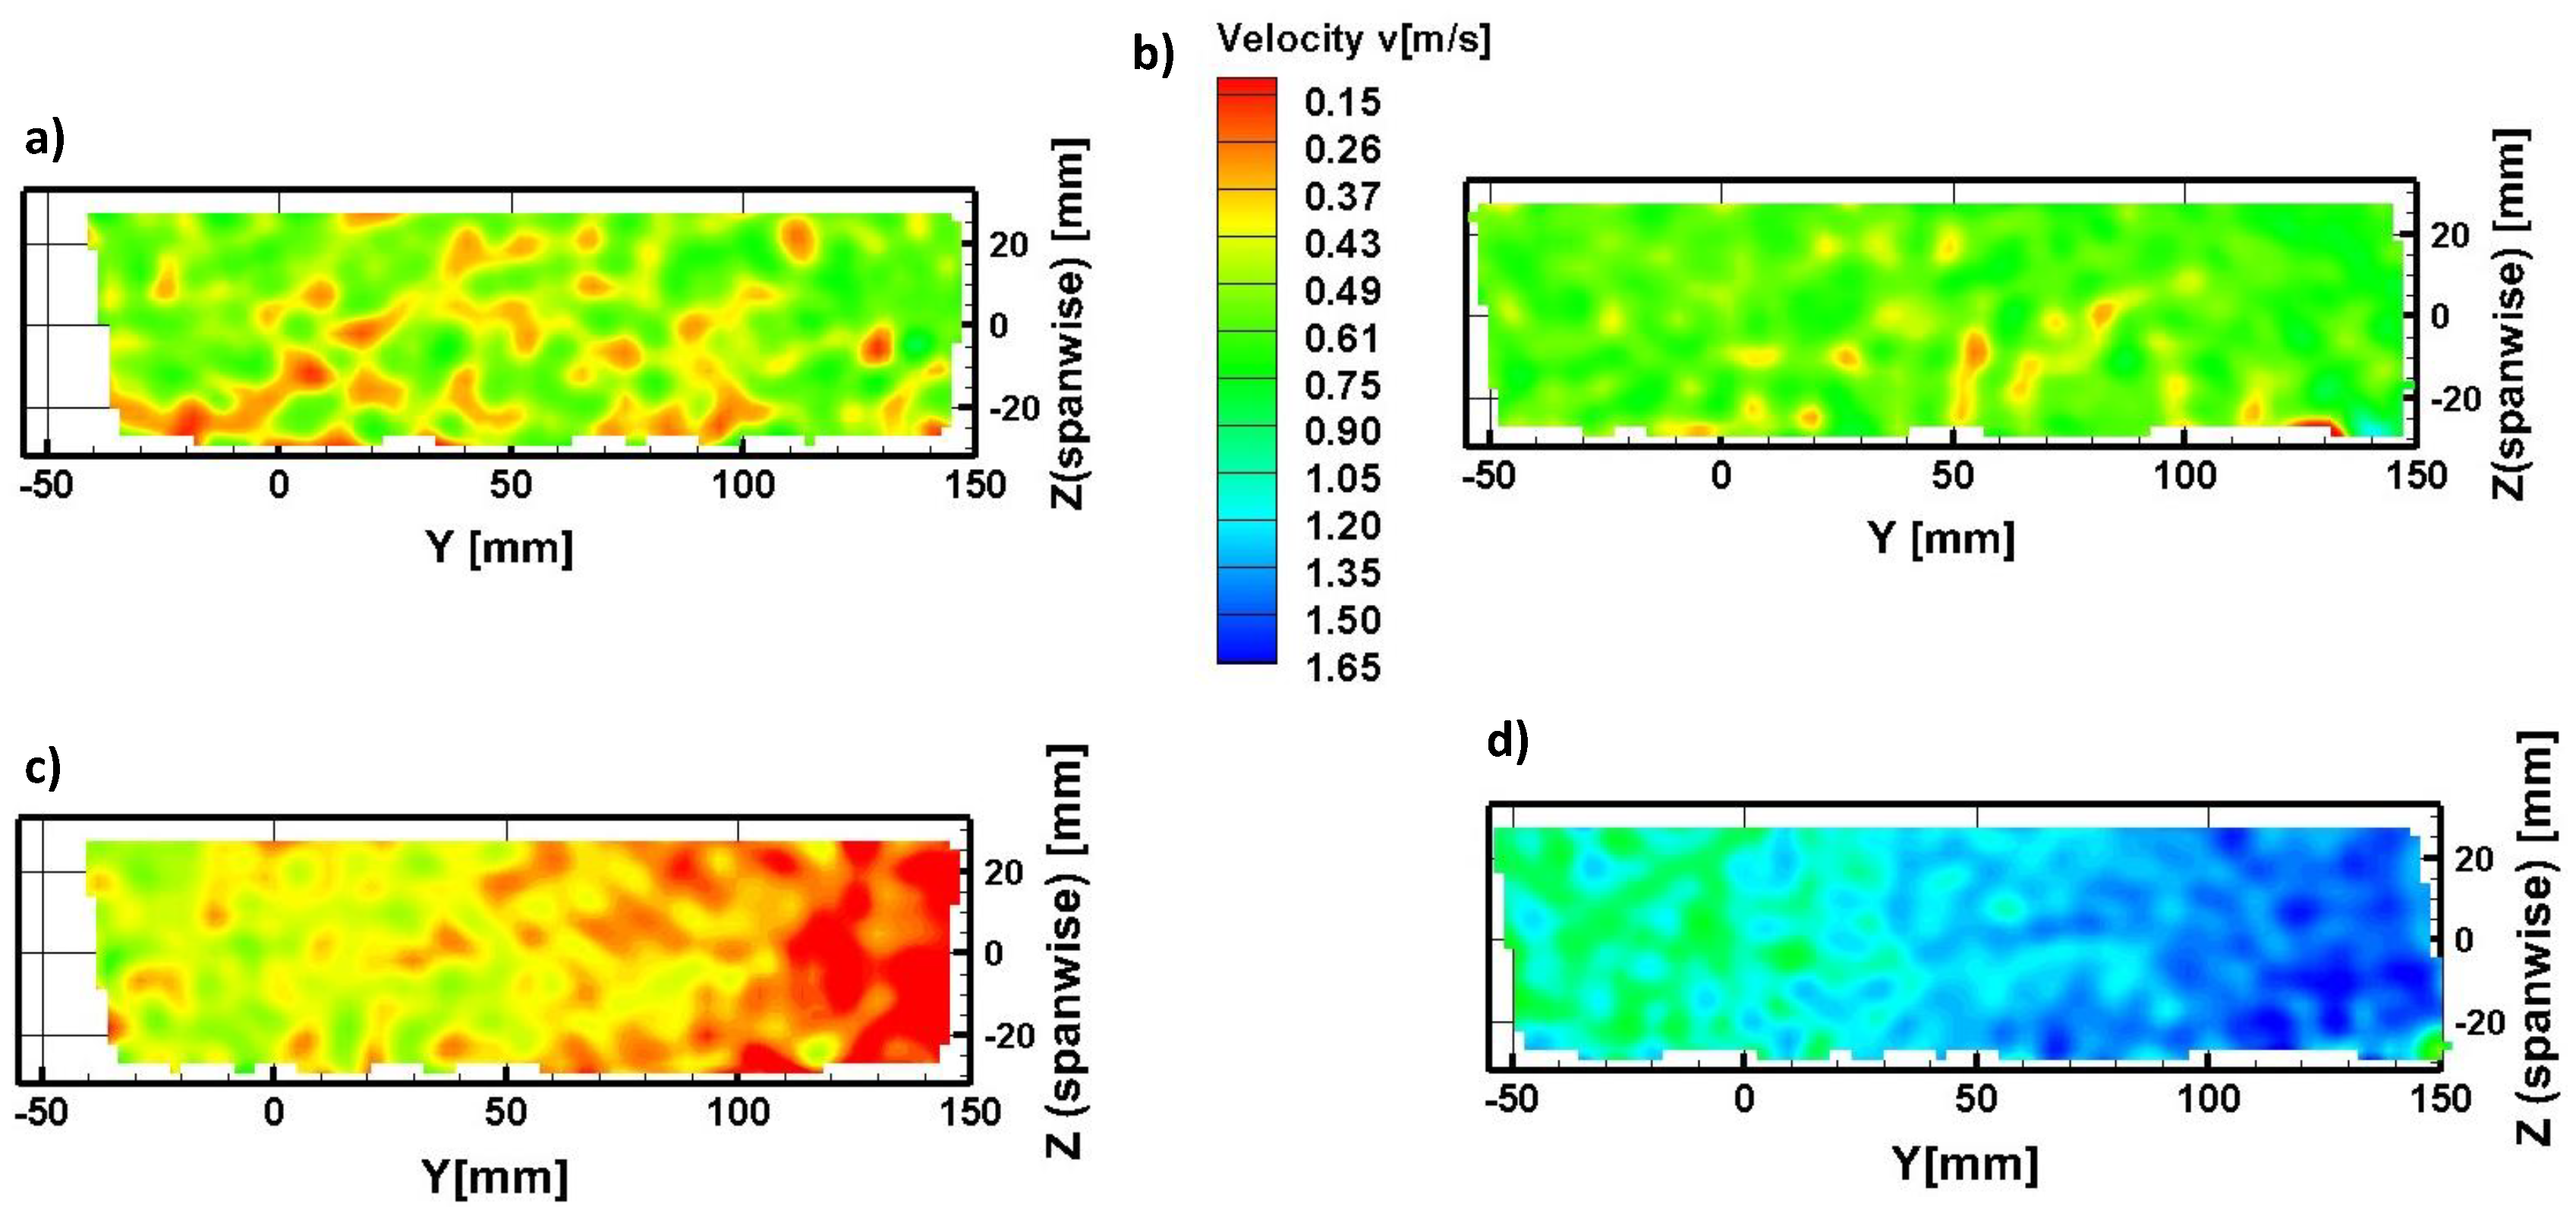
V fields at
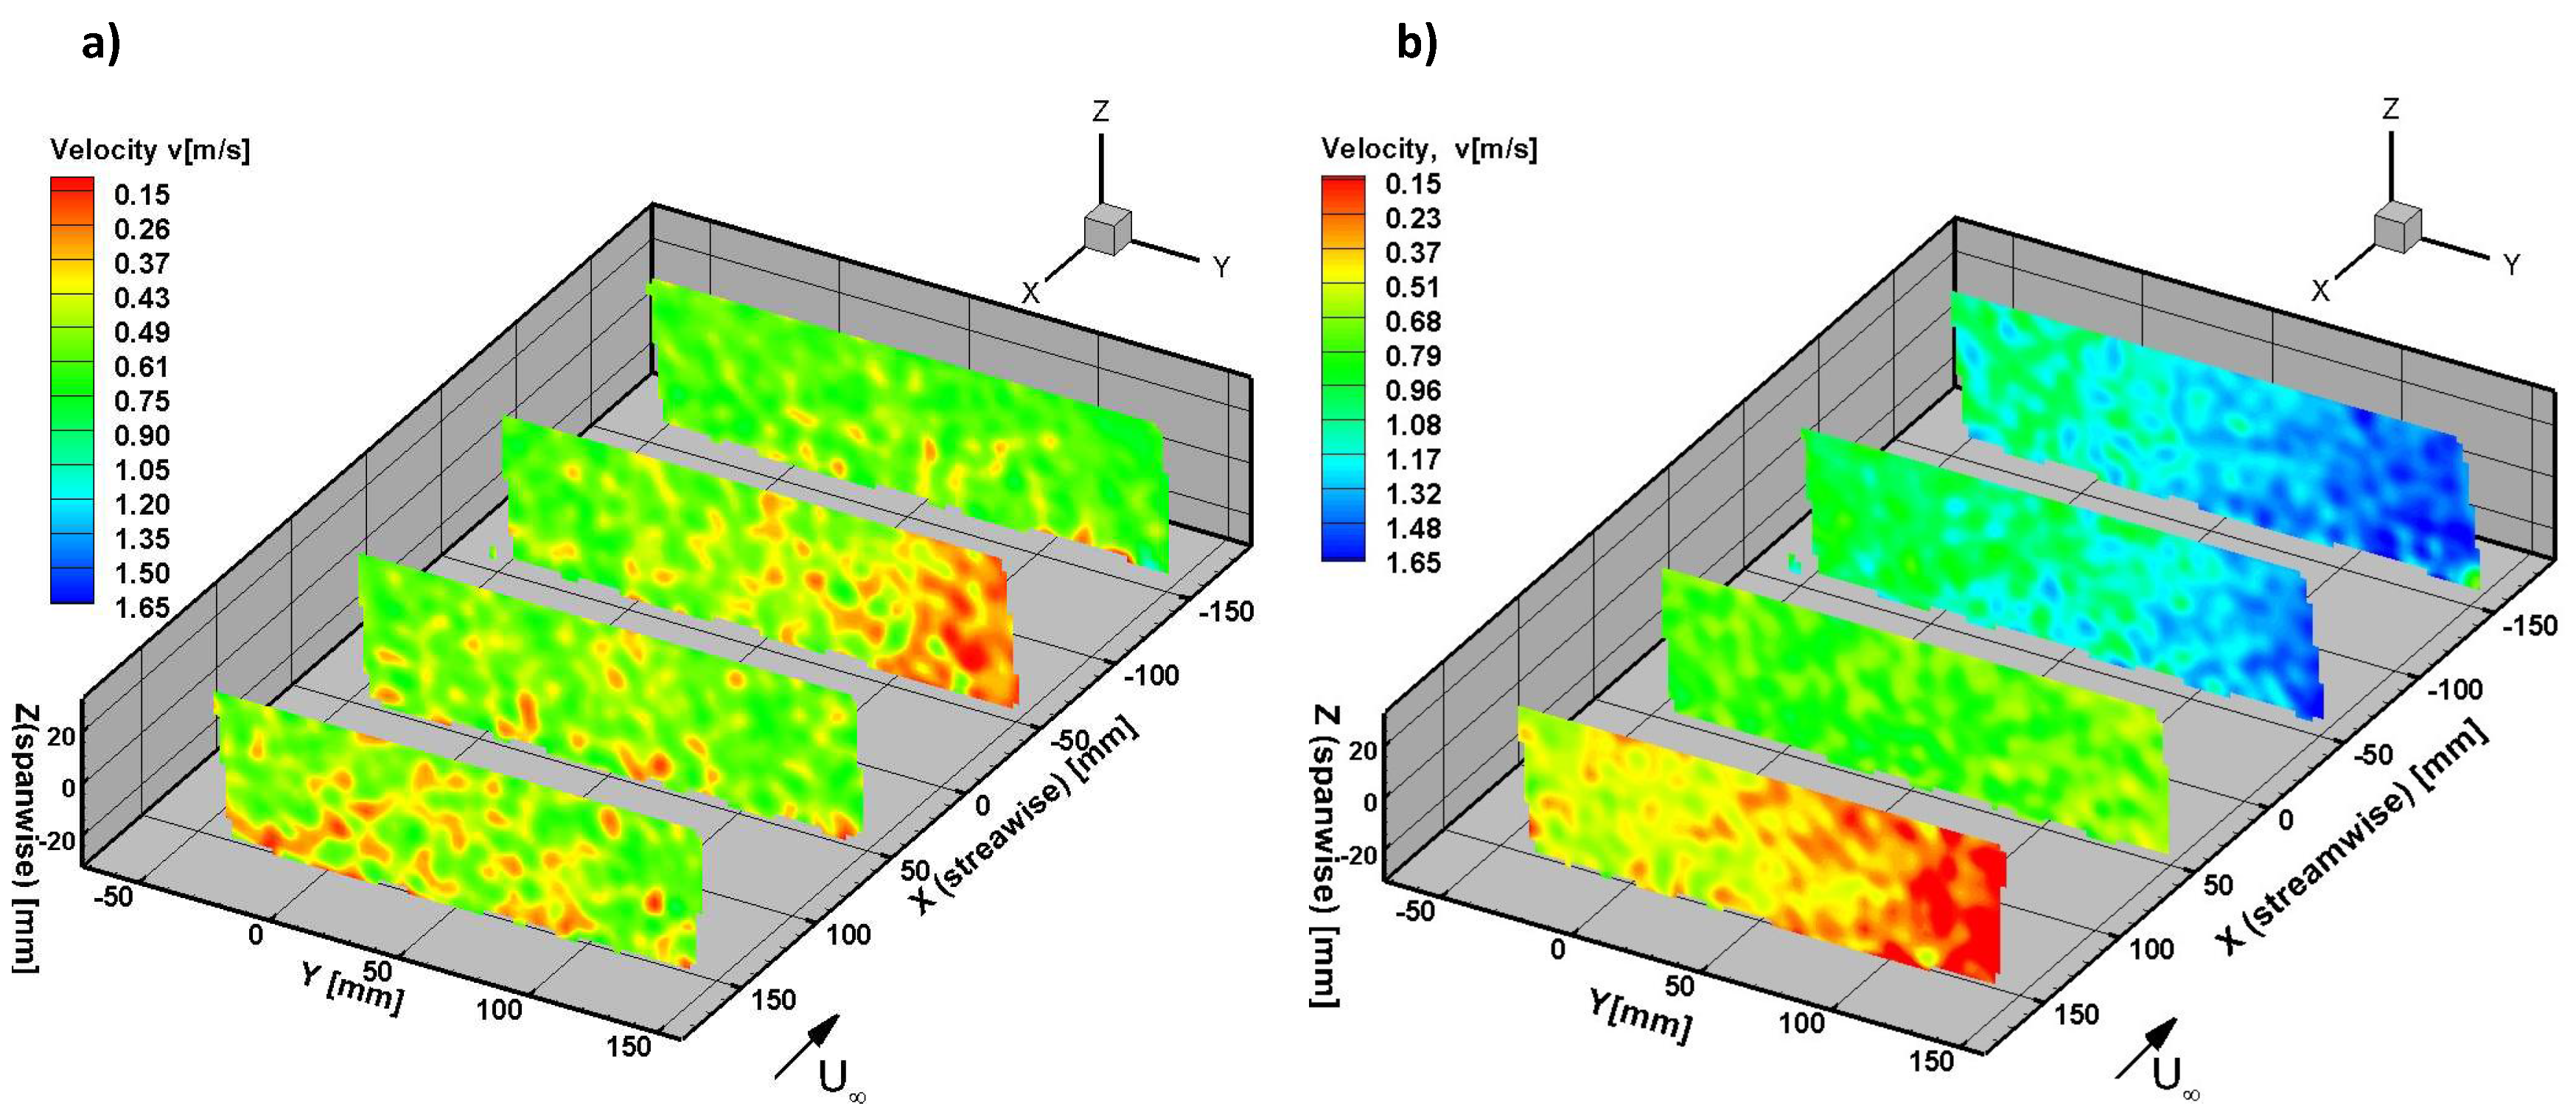
= 13.4 m/s are plotted in
Figure 19 and
Figure 20. For the baseline flow the
V component underneath the wing in plane 2 (
x = 50 mm) to plane 3 (
x = -55 mm) decreases significantly in regions from
V≈ 0.61-0.75 to
V≈ 0.26-0.37. Downstream of the aileron, when
= 0
, the downward velocity increases again to
V≈ 0.80 which is consistent to a small downward redirection of the flow as a result of the cambered airfoil on the wing. The high level of flow turbulence in the
V velocity is apparent by comparing the drastic changes in velocity from the inlet to the outlet of the flow volume at
x = 155 mm to -155 mm. It is hypothesized that the significant unsteady structural displacement of the wing in the bending mode (quantified in Figures 9–11) induces a separate unsteady vertical velocity component in the direction of wing motion close to the surface of the wing. However, this is not evident from the time-averaged PIV velocity fields, which by definition are not phase-averaged to the natural or structural frequency of the wing.
The vorticity in the flow below the wing was computed and must be considered in terms of the turbulent length scales and energy cascade. It is noted from the outset that the UAV and measurement volume is located far downstream, approximately 13 m, from the Wall-of-Wind facility fans where the turbulent flow field is first produced. The flow then passes through a conditioning section with fully open spires and ground plates to generate a wind shear profile and additional length scales with high turbulence intensity. Initially, predominantly energetic large-scale structures up to the integral length scale assumed to be on the order of the WOW fan diameter (∼2 m) are produced by the fans. As the flow travels downstream, these large structures undergo vortex stretching and break down into smaller structures with less kinetic energy due to the effects of viscous shear stress and dissipation. The turbulent flow measured constitutes a snapshot of how the flow has evolved during this process. From the vorticity fields presented in the next figures, it is clear that the turbulence has ‘cascated’ into small scale structures or finer scale turbulence from what is generated close to the fans.
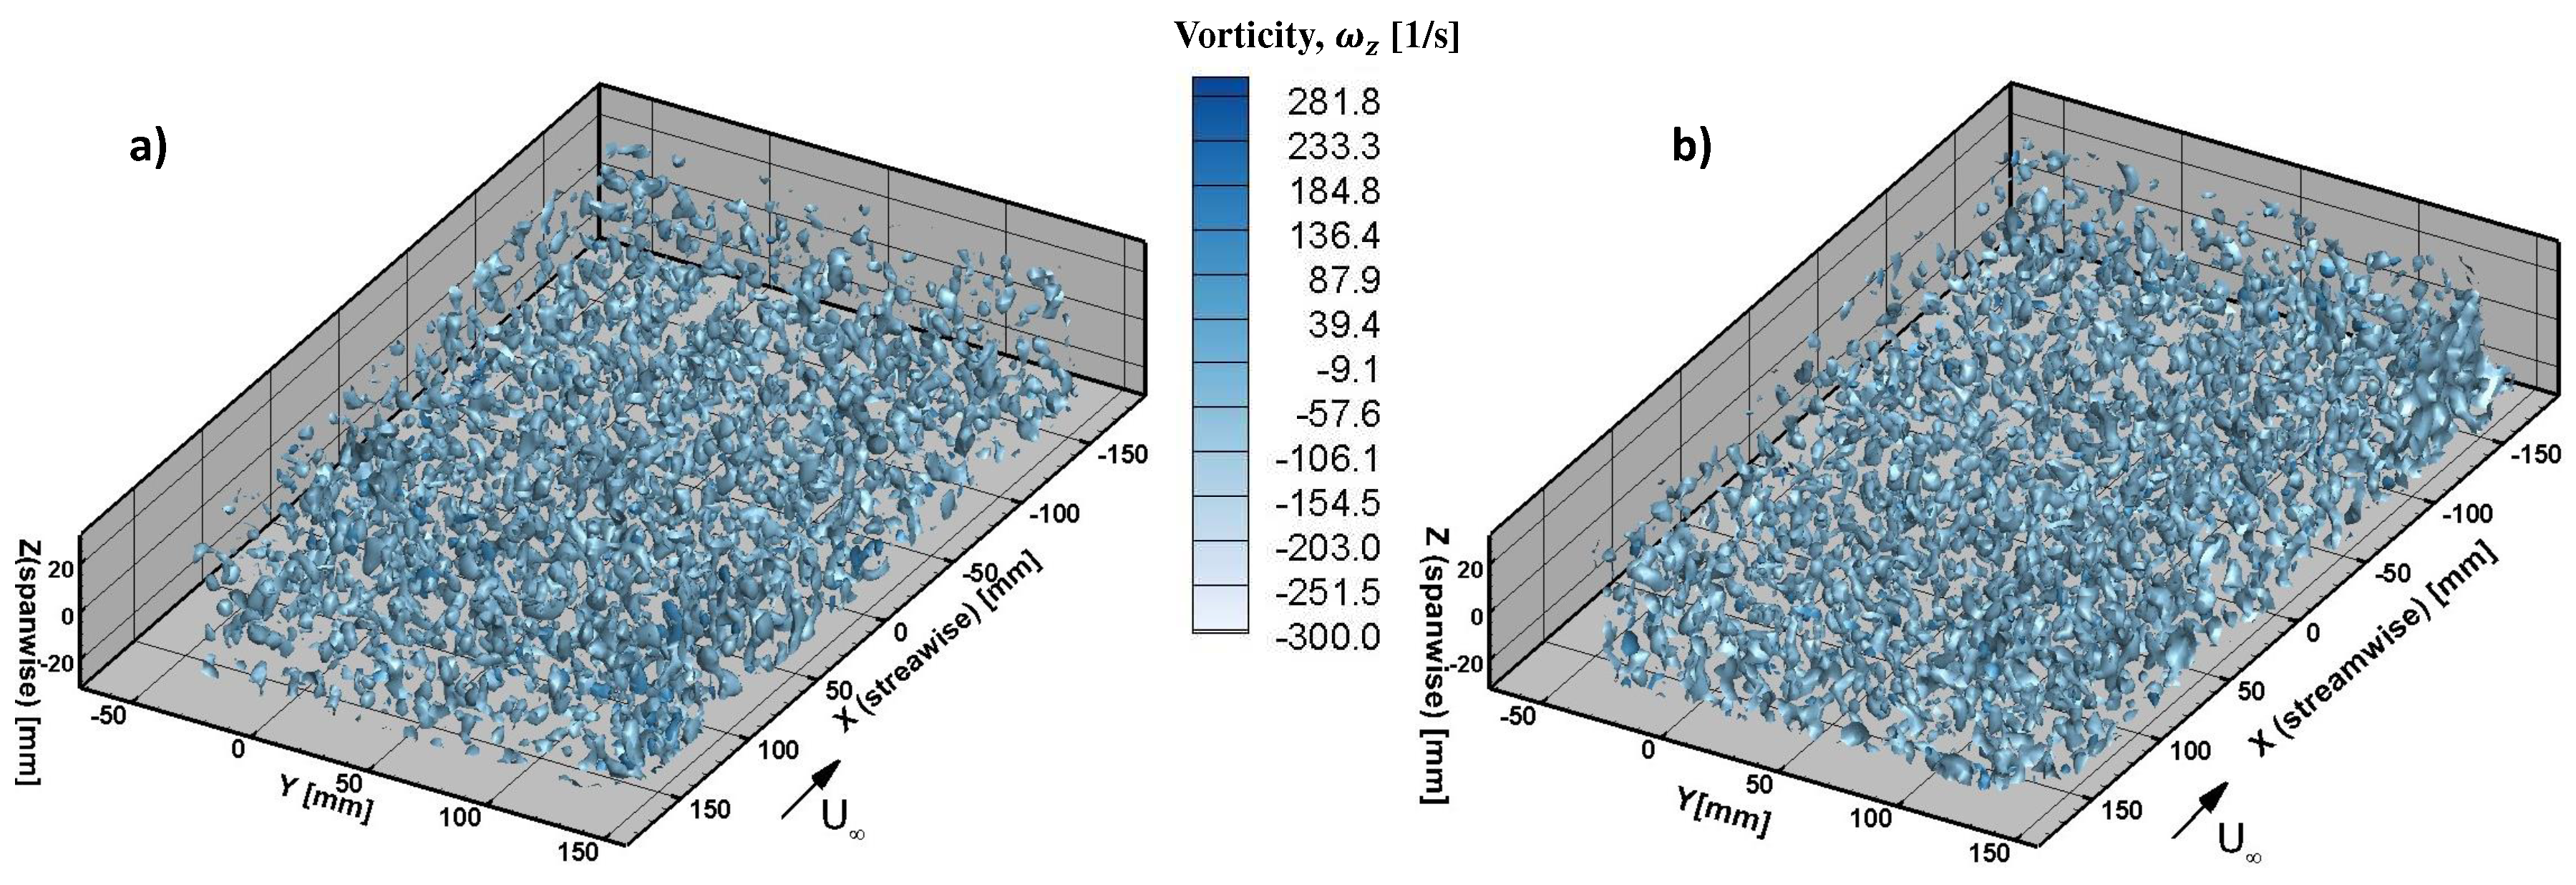
The time-averaged spanwise vorticity,
contours contained in the measurement volume is presented in
Figure 21 for
= 13.4 m/s and aileron deflection,
= 0
and 10
. The nature of the baseline turbulent structures and vorticity in
Figure 21(a) from
x = 155 mm to -155 mm is fairly homogeneous. When the aileron is deflected, vortex shedding produces a collection of larger vortex structures with predominantly positive vorticity immediately behind the aileron in the area formed by
x = -100 mm to 155 mm and
y = 125 mm to 150 mm. The aileron in essence increases the circulation around the wing section, which translates into more vorticity production with the largest vortex length scales that are proportional to the chord length of the aileron or flap. It is estimated from
Figure 21(b) behind the aileron that the largest length scales are on the order of 40–50 mm, which is in fact approximately the chord length of the aileron.
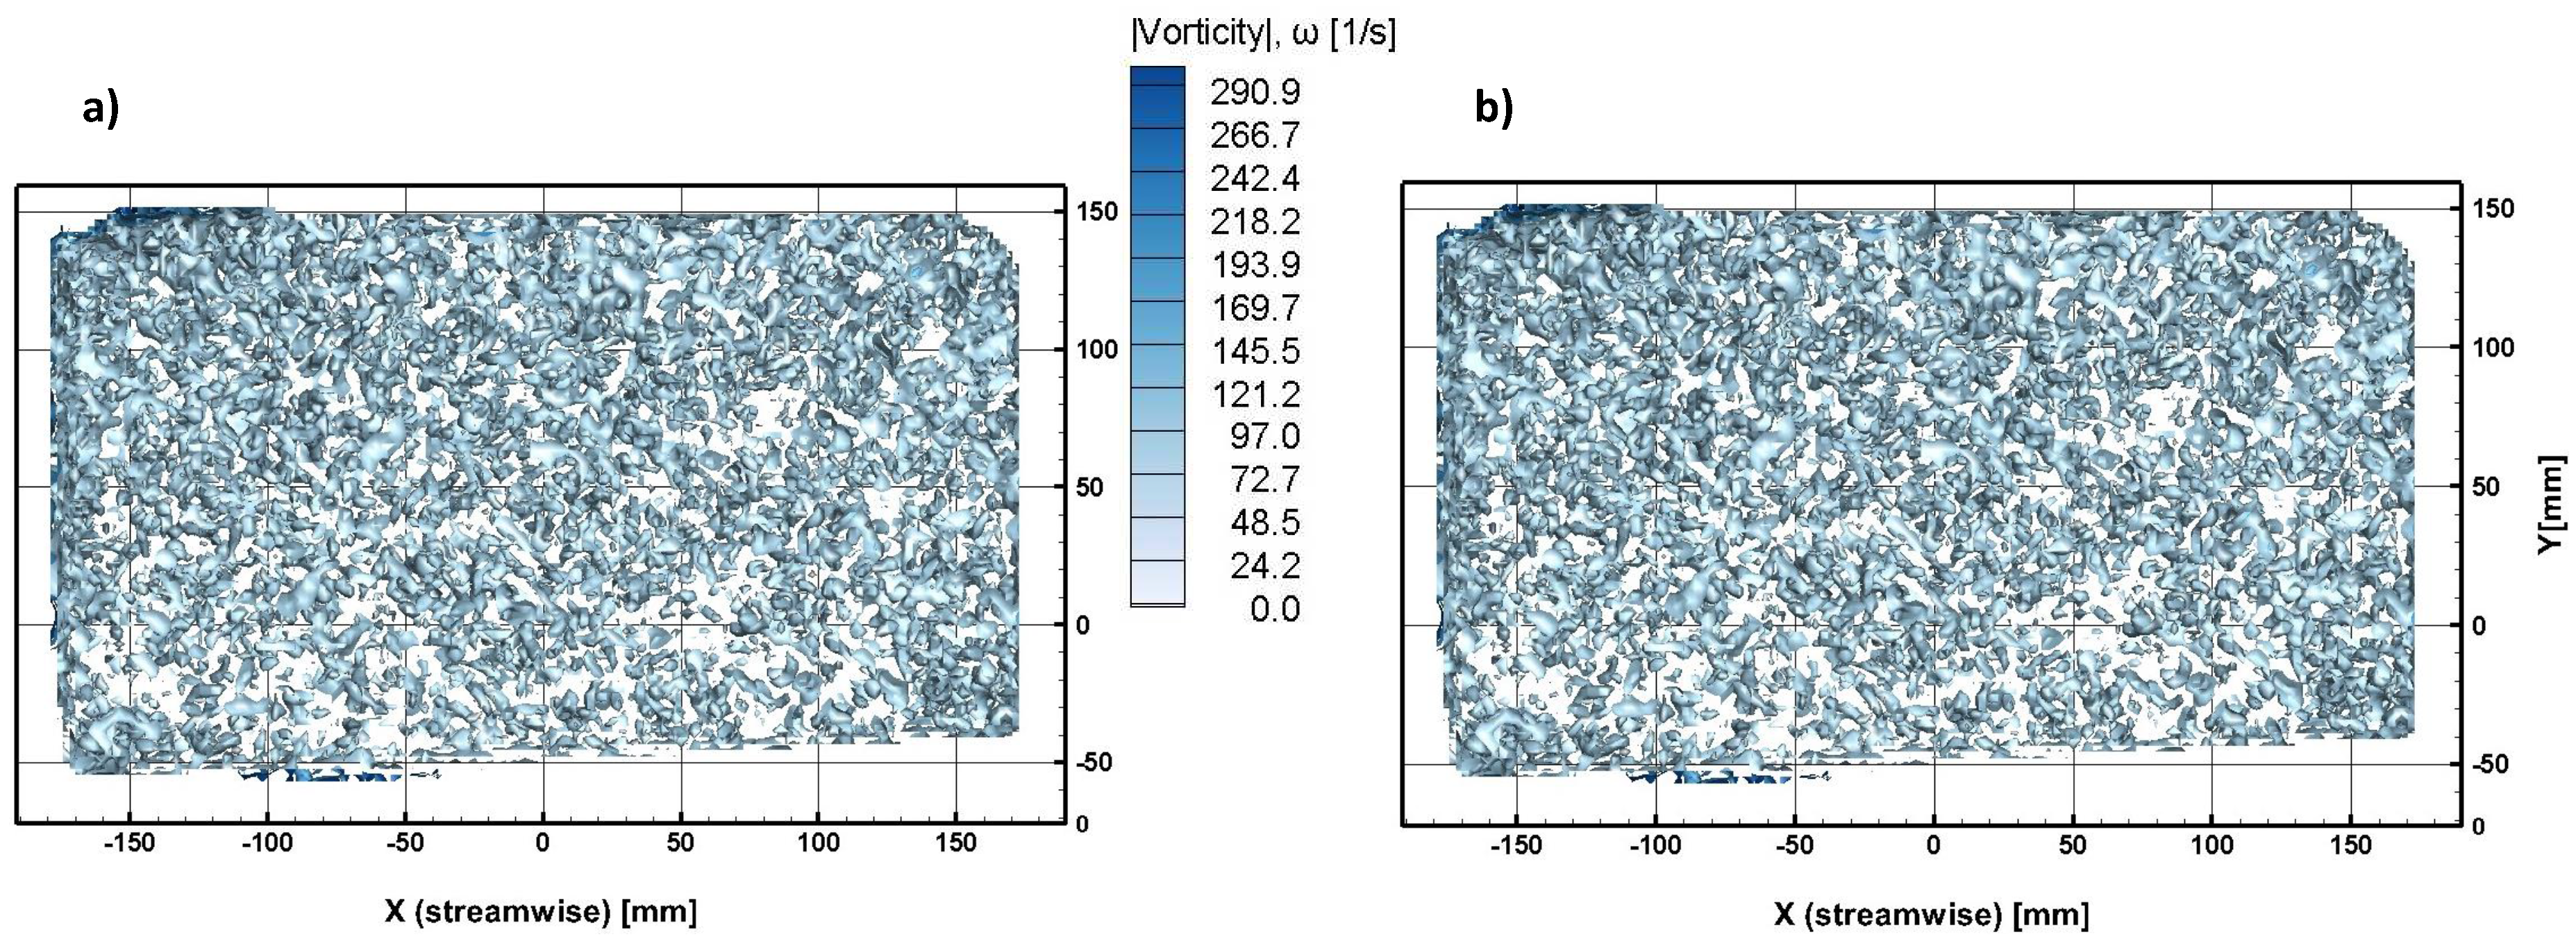
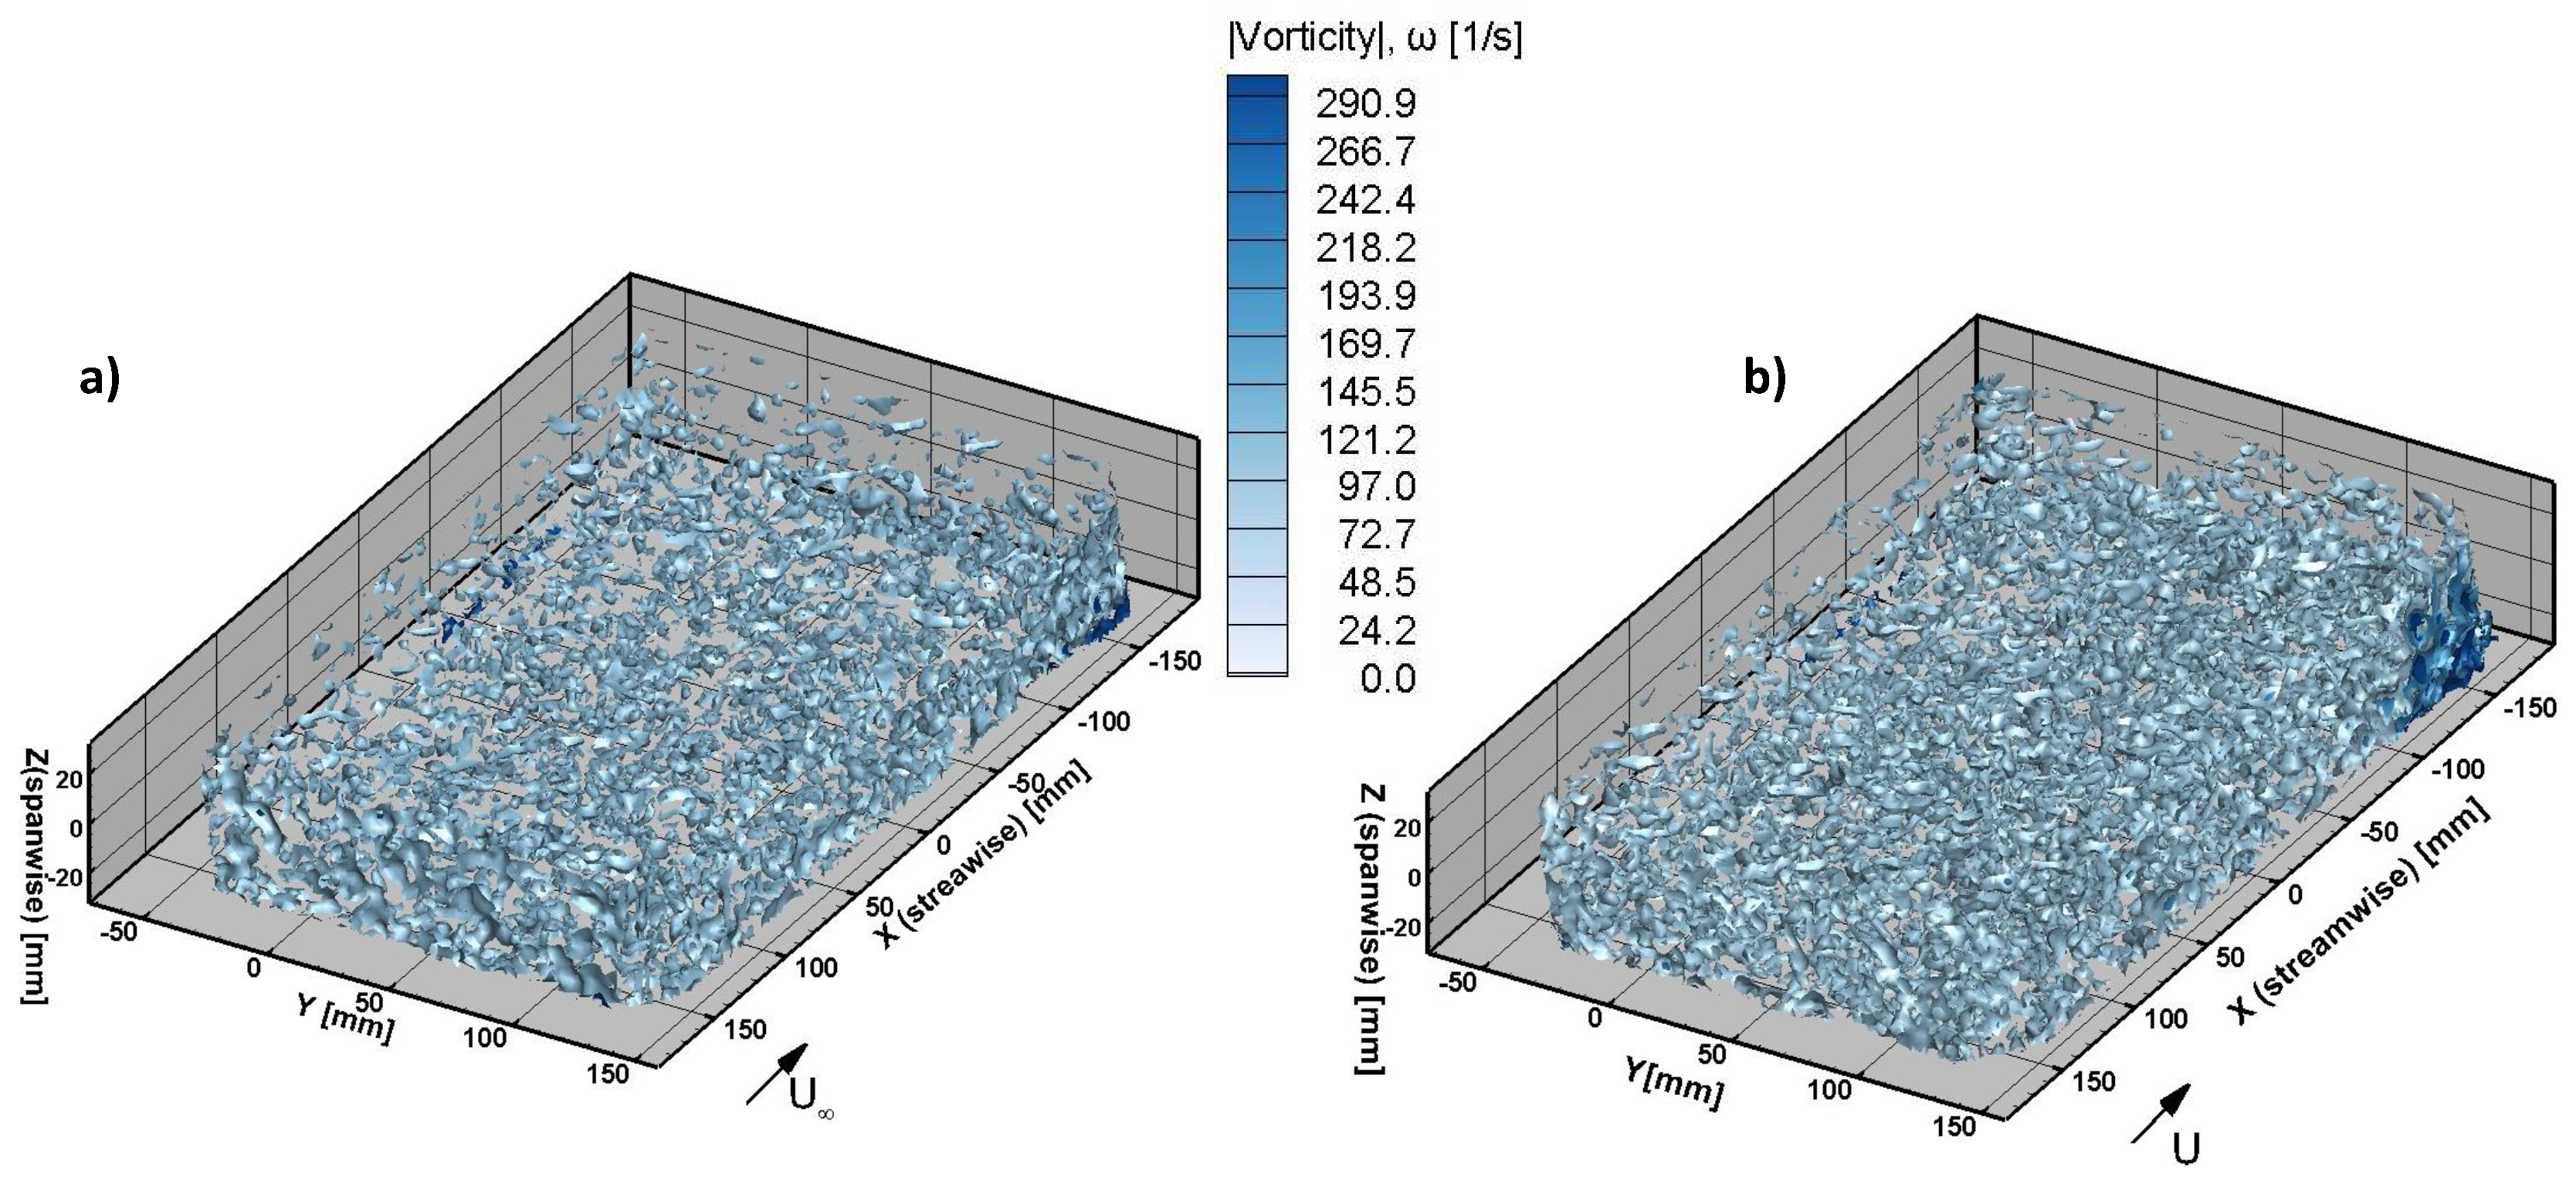
Iso-surfaces of time-averaged total vorticity,
=
at
= 13.4 m/s for the measurement volume are presented on
Figure 22. Elevated values of total vorticity compared to spanwise vorticity are shown throughout the baseline flow on
Figure 22(a). The vortex structures are fairly evenly distributed, and the length scales vary in size between the smallest scales ∼5 mm to the largest approaching ∼50 mm. The effect of aileron deflection is clearly visible in the larger size and strength of the vortices downstream of the aileron. The vorticity in the flow in this region reaches a maximum of
≈ 290/s. The mean vorticity throughout the flow is somewhere in the mid-range of the contour bar equivalent to
≈ 145/s. Iso-surfaces of total vorticity along the
mid-plane of the measurement volume along
z = 0 at the same freestream velocity are presented on
Figure 23. The makeup and distribution of vortex structures may be easier to visualize in a two-dimensional plane, and indicate that the turbulence is virtually indistinguishable between the baseline flow and when the aileron is deflected if the surface of the aileron is perpendicular to the
plane.
The next set of results in
Figure 24 and
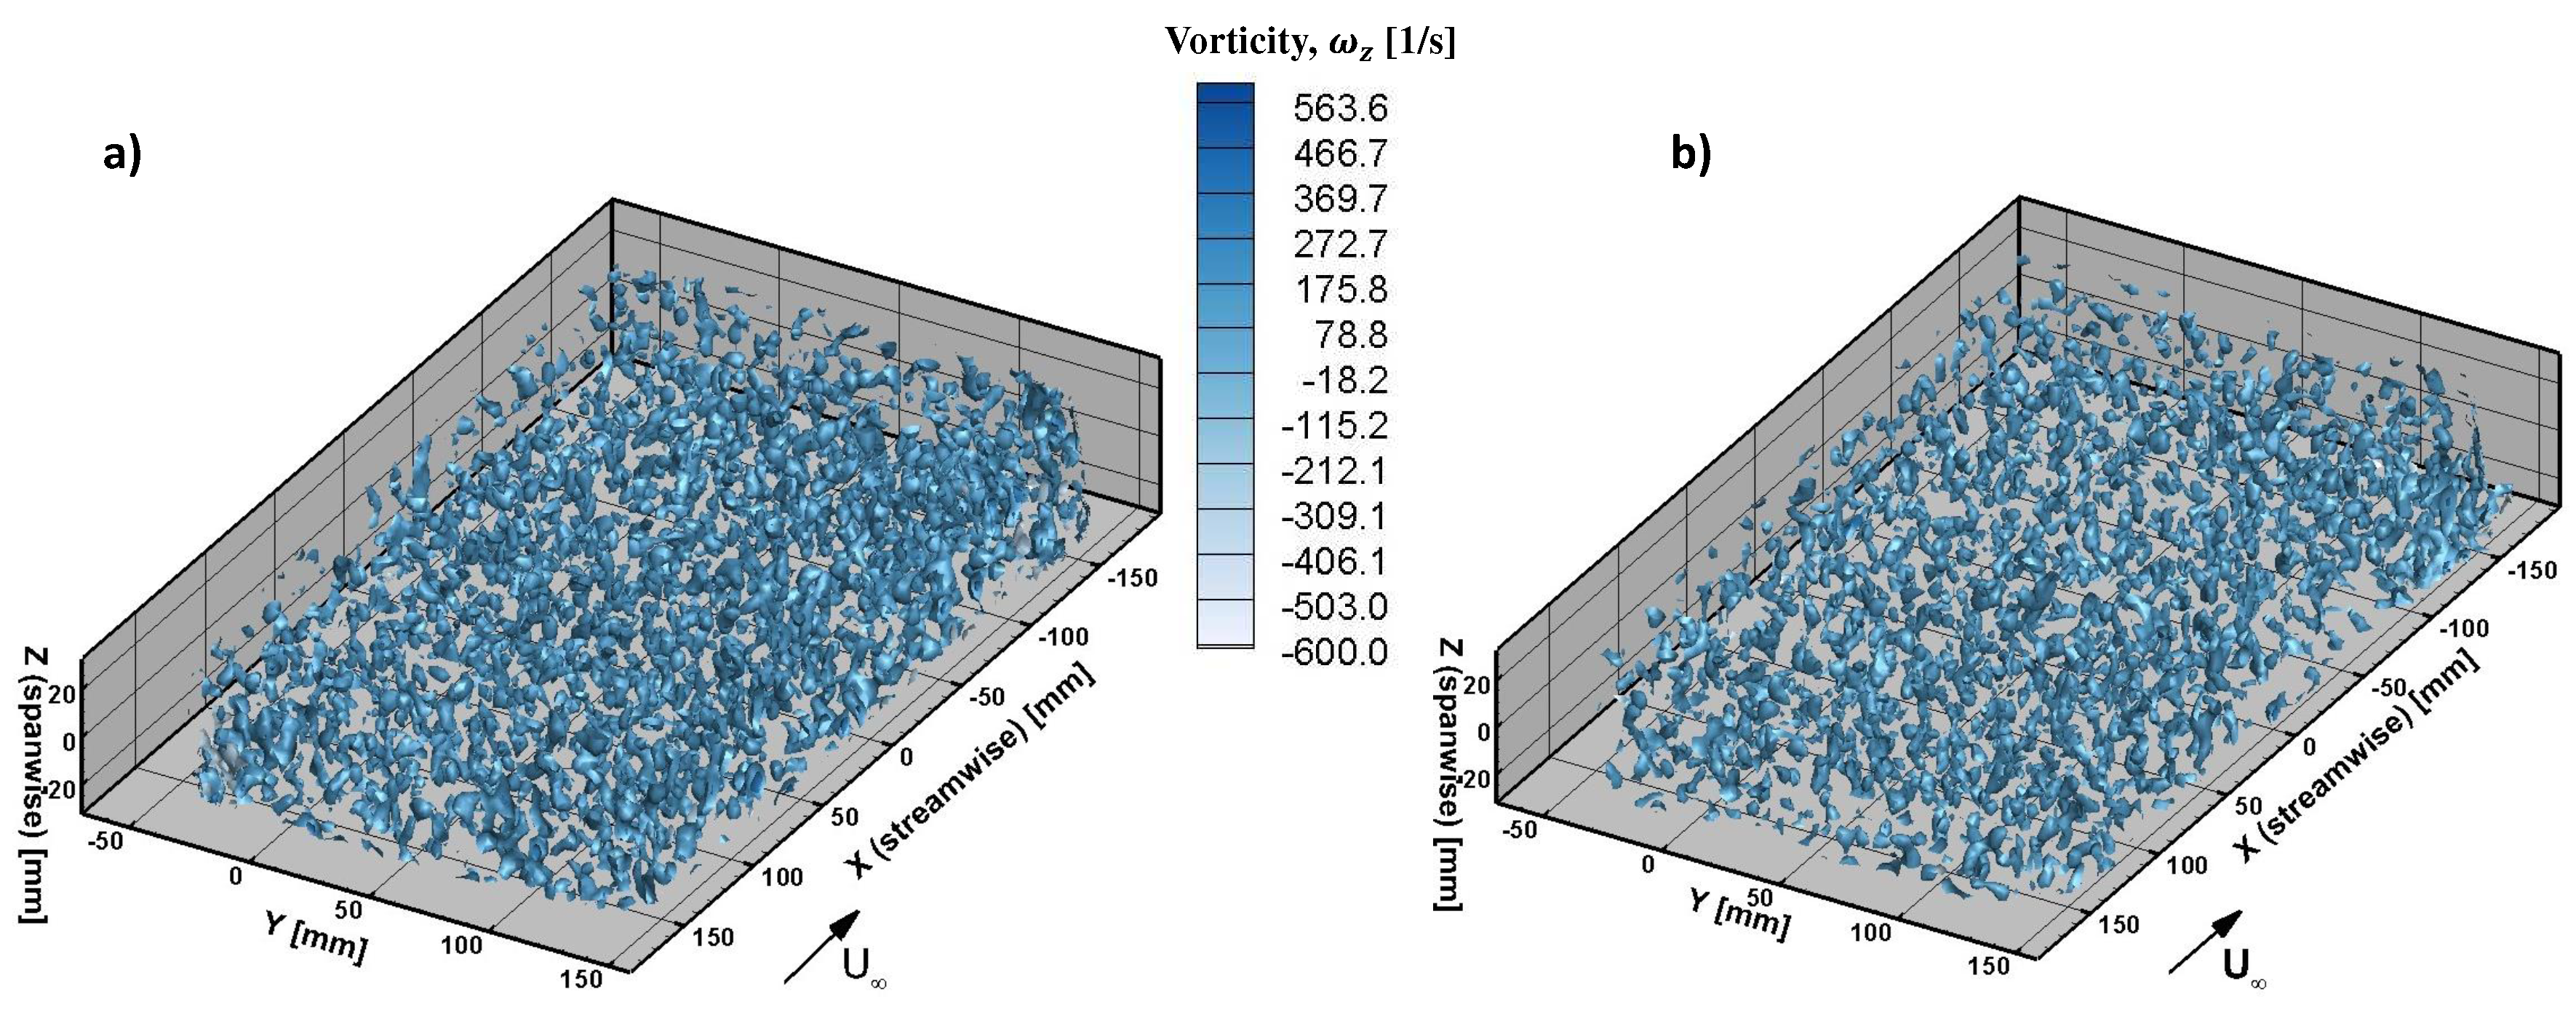
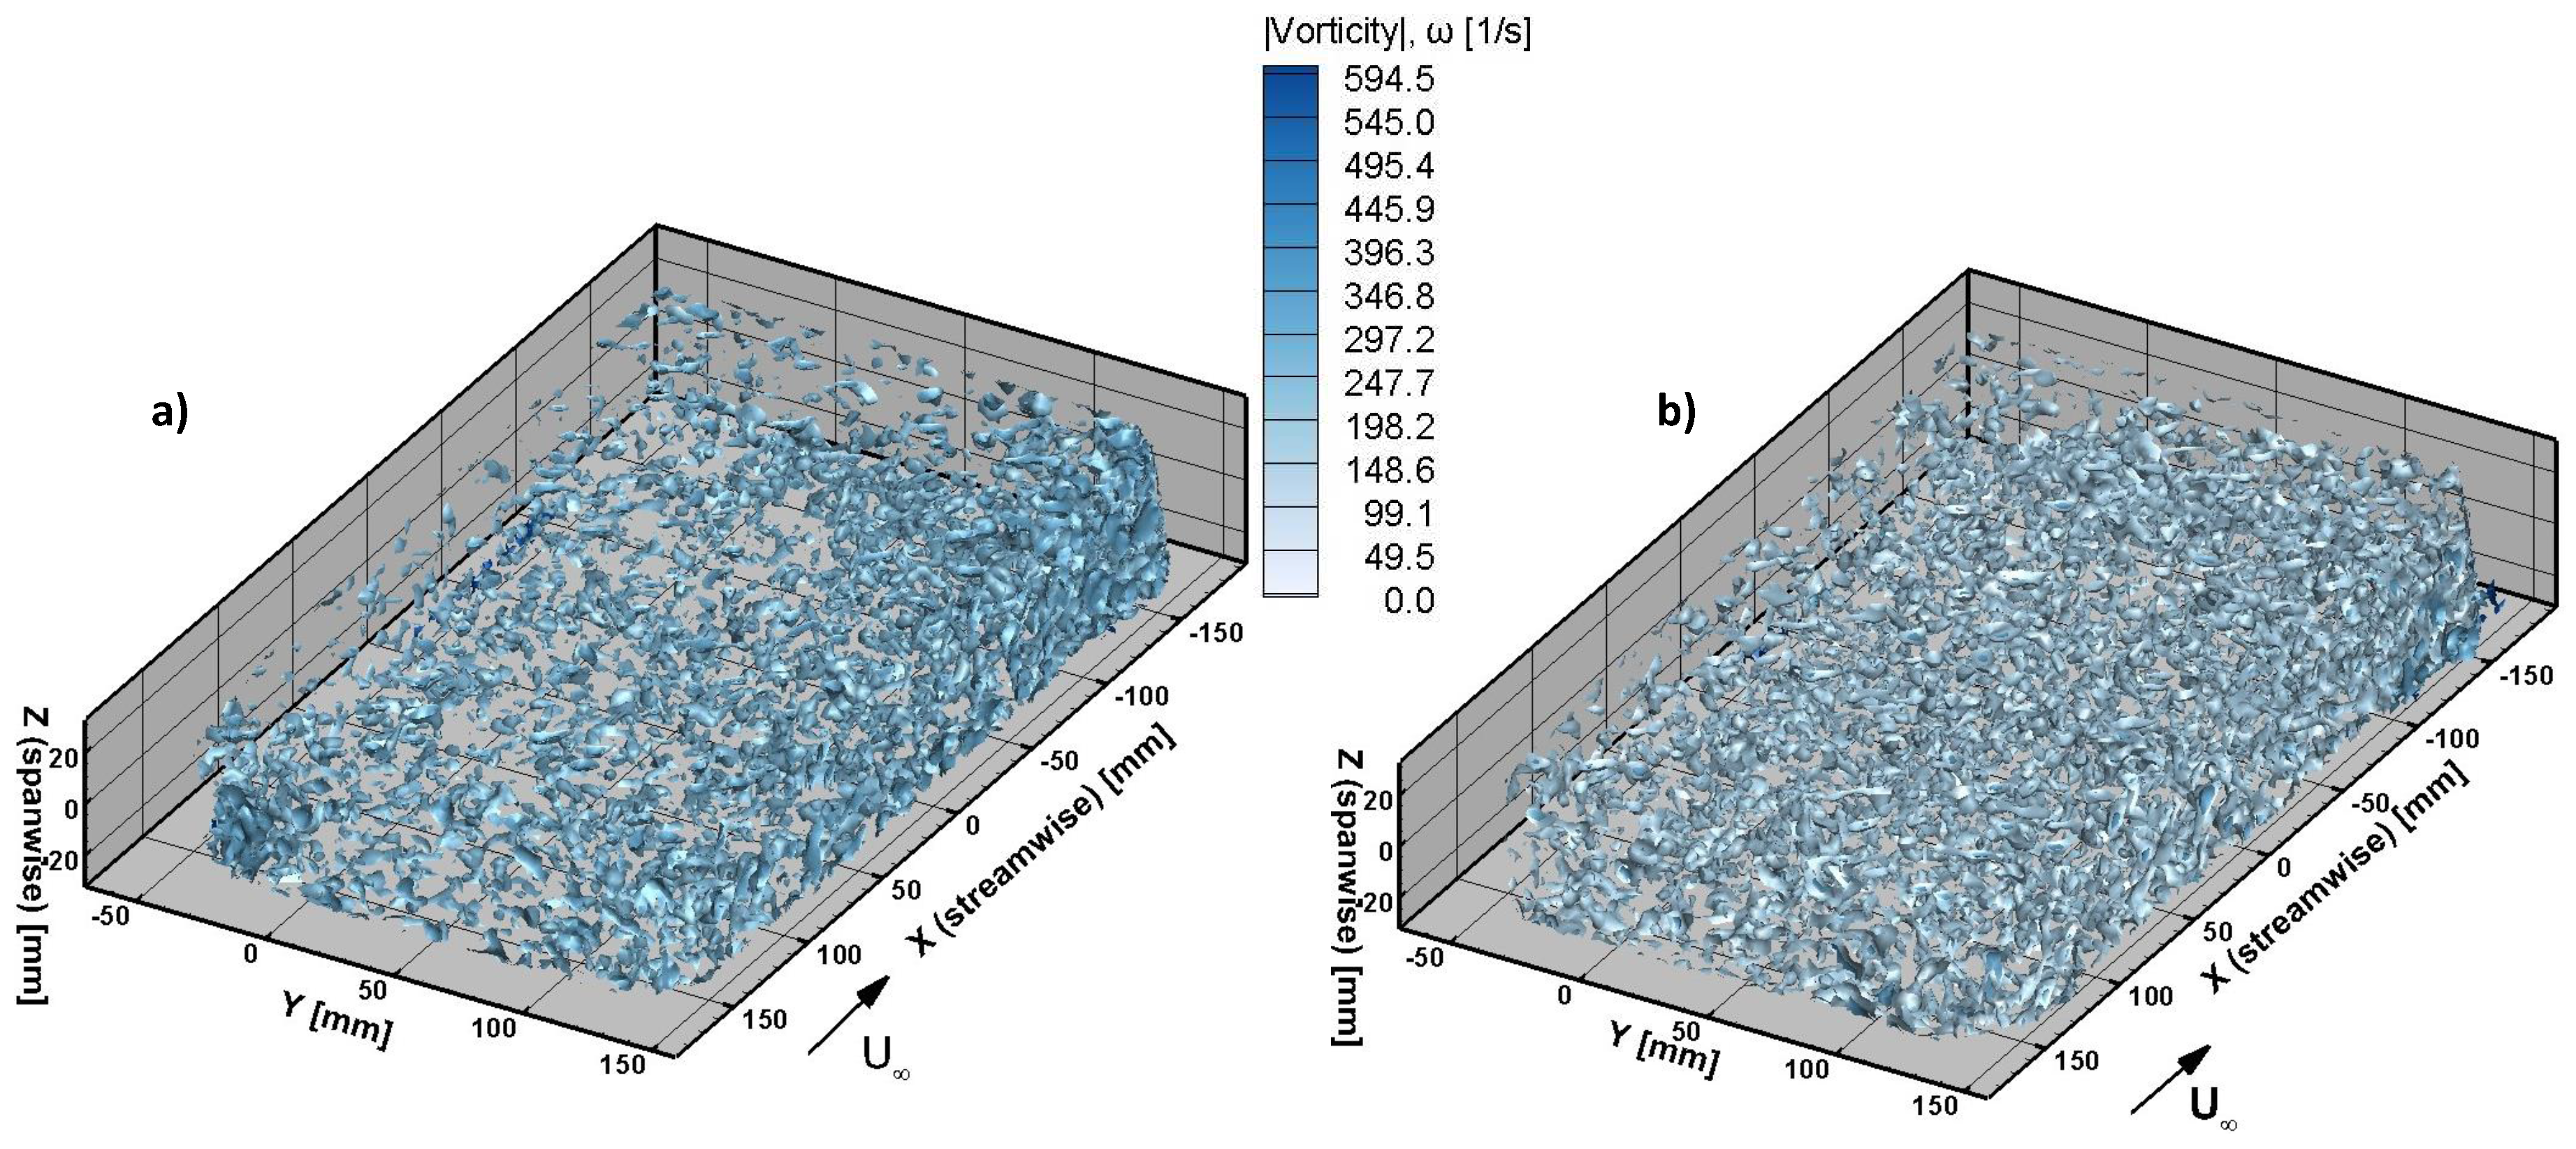
Figure 25 are volumetric plots of iso-surfaces of time-averaged spanwise vorticity,
and total vorticity,
of the flow when the freestream velocity is doubled to
= 26.8 m/s. The range of length scales of the turbulence is similar, however the upper and lower level of ±
has doubled. In the case of spanwise vorticity, a maximum vorticity of
≈ 563/s is reached at various points in the flow, with a mean vorticity throughout the flow which is positive. When the aileron is deflected, the
iso-surfaces downstream of the aileron show no appreciable increase in vorticity as was observed previously when
= 13.4 m/s. At the higher freestream velocity, the total vorticity iso-surfaces shows an increase in the maximum vorticity equal to
≈ 594/s as well as a higher mean vorticity due to stronger velocity gradients in the total vorticity expression
. Deflection of the aileron does not appreciably produce different length scales or additional total vorticity.
Figure 24.
Iso-surfaces of time-averaged total vorticity along the z=0 plane, at = 13.4 m/s for: a) aileron deflection, = 0and b) = 10.
Figure 24.
Iso-surfaces of time-averaged total vorticity along the z=0 plane, at = 13.4 m/s for: a) aileron deflection, = 0and b) = 10.
Figure 25.
Iso-surfaces of time-averaged spanwise vorticity, at = 26.8 m/s for: a) aileron deflection, = 0and b) = 10.
Figure 25.
Iso-surfaces of time-averaged spanwise vorticity, at = 26.8 m/s for: a) aileron deflection, = 0and b) = 10.
Figure 26.
Iso-surfaces of time-averaged total vorticity, at = 26.8 m/s for: a) aileron deflection, = 0and b) = 10.
Figure 26.
Iso-surfaces of time-averaged total vorticity, at = 26.8 m/s for: a) aileron deflection, = 0and b) = 10.
Table 5 displays the mean and RMS values of the lift force for the test wind speeds and aileron deflections. At the lower velocity of
= 13.4 m/s the mean lift force nearly doubles from 21.88 N to 41.4 N when the aileron is deflected to 10
. However, when the freestream velocity is doubled to 26.8 m/s, the aileron produces only a 59% increase in the lift force, indicating a decrease in the effectiveness of the aileron.
Figure 27.
Mean and RMS of Lift force
Figure 27.
Mean and RMS of Lift force
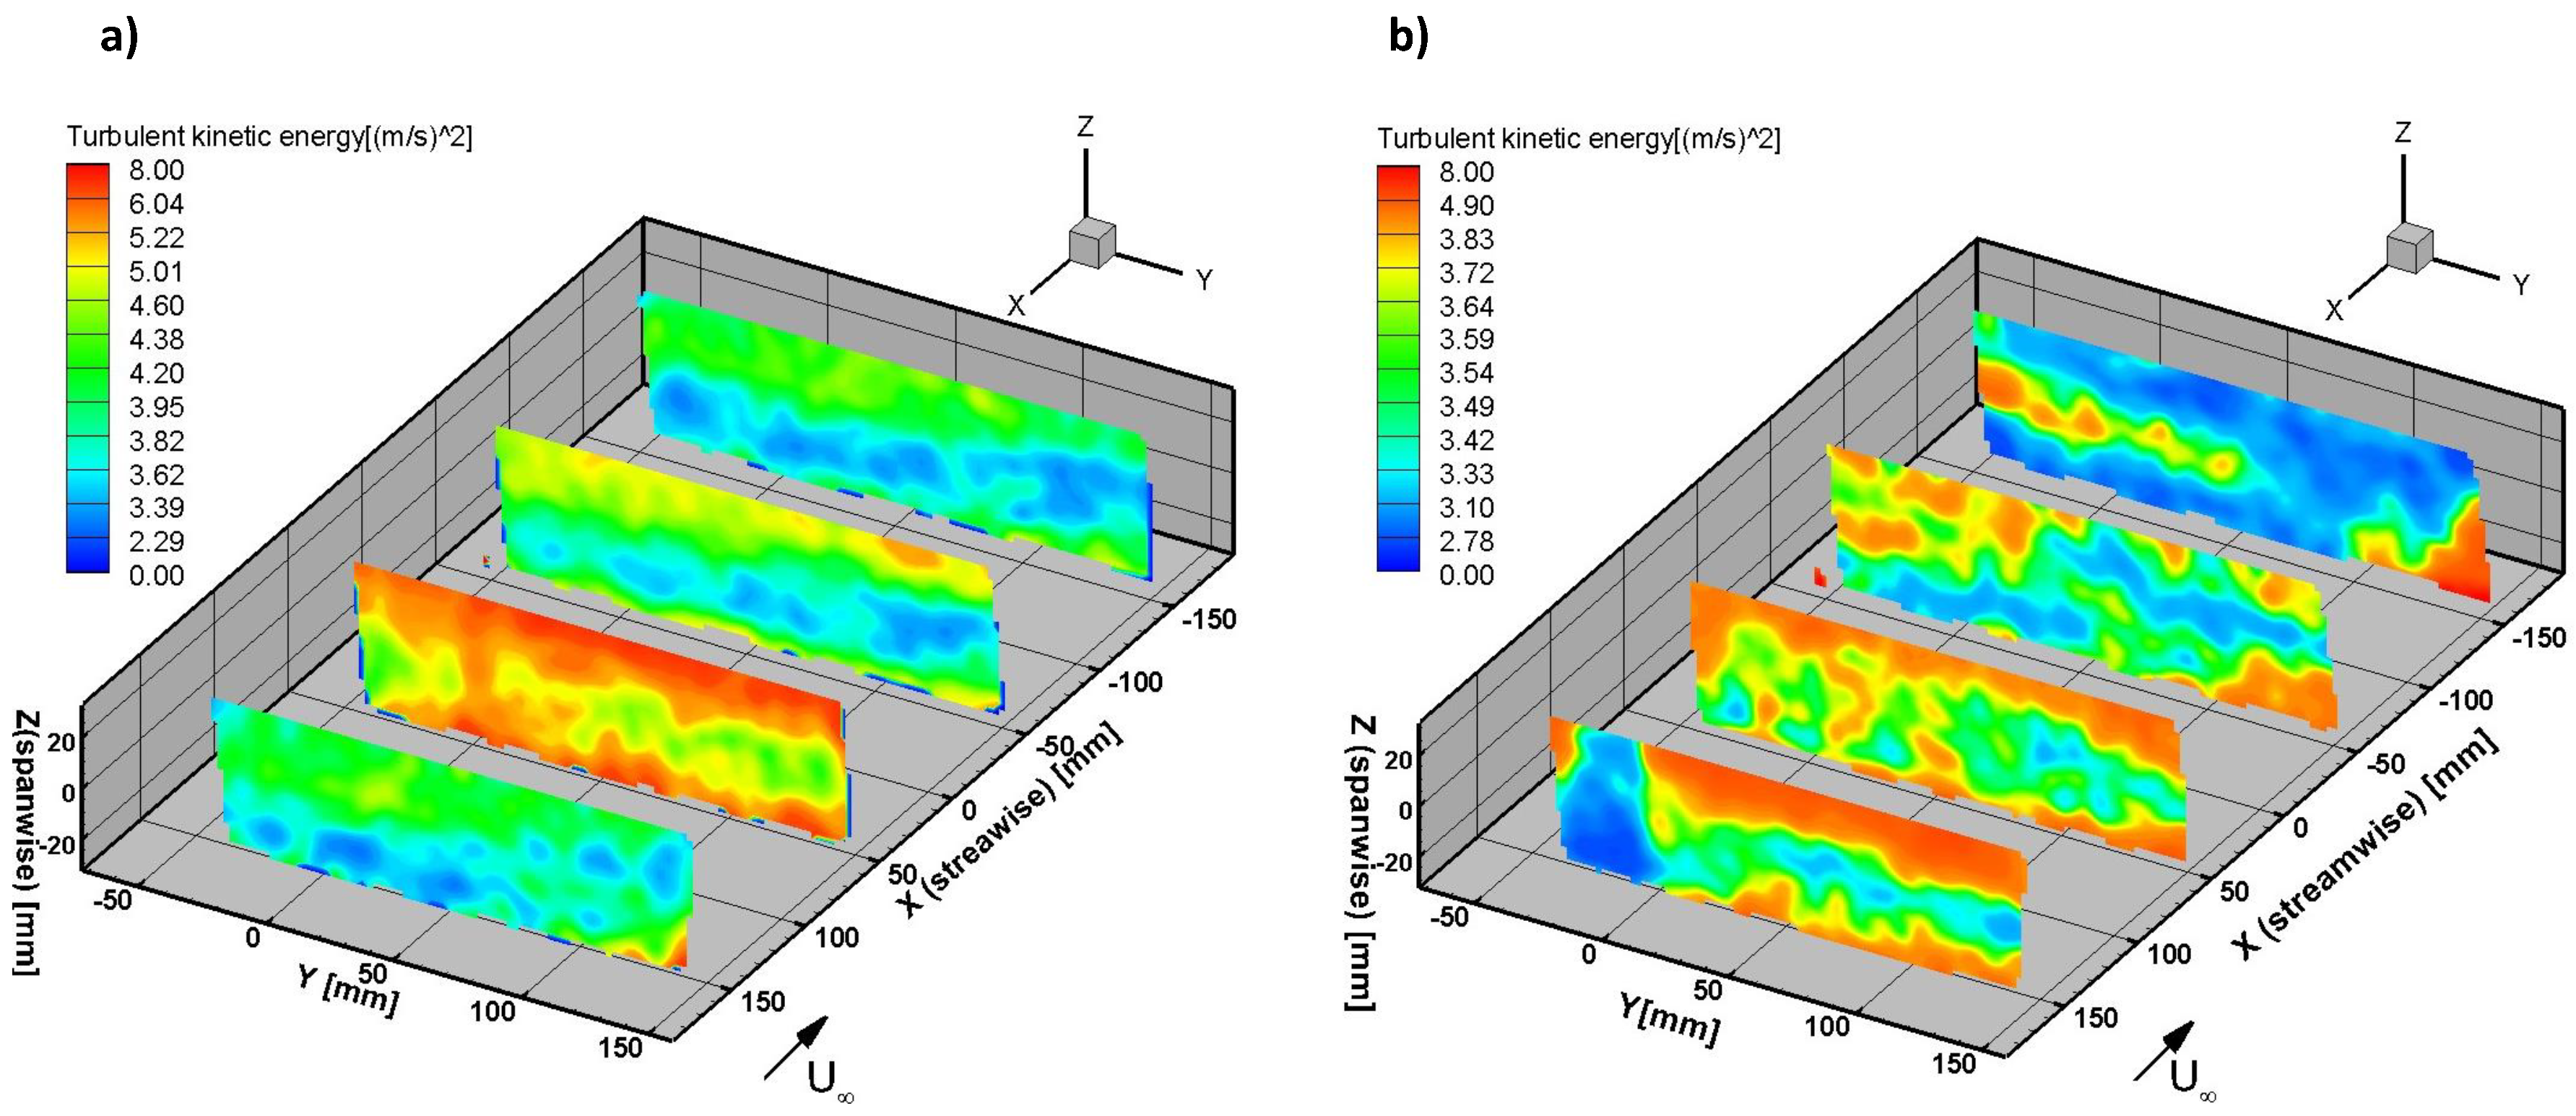
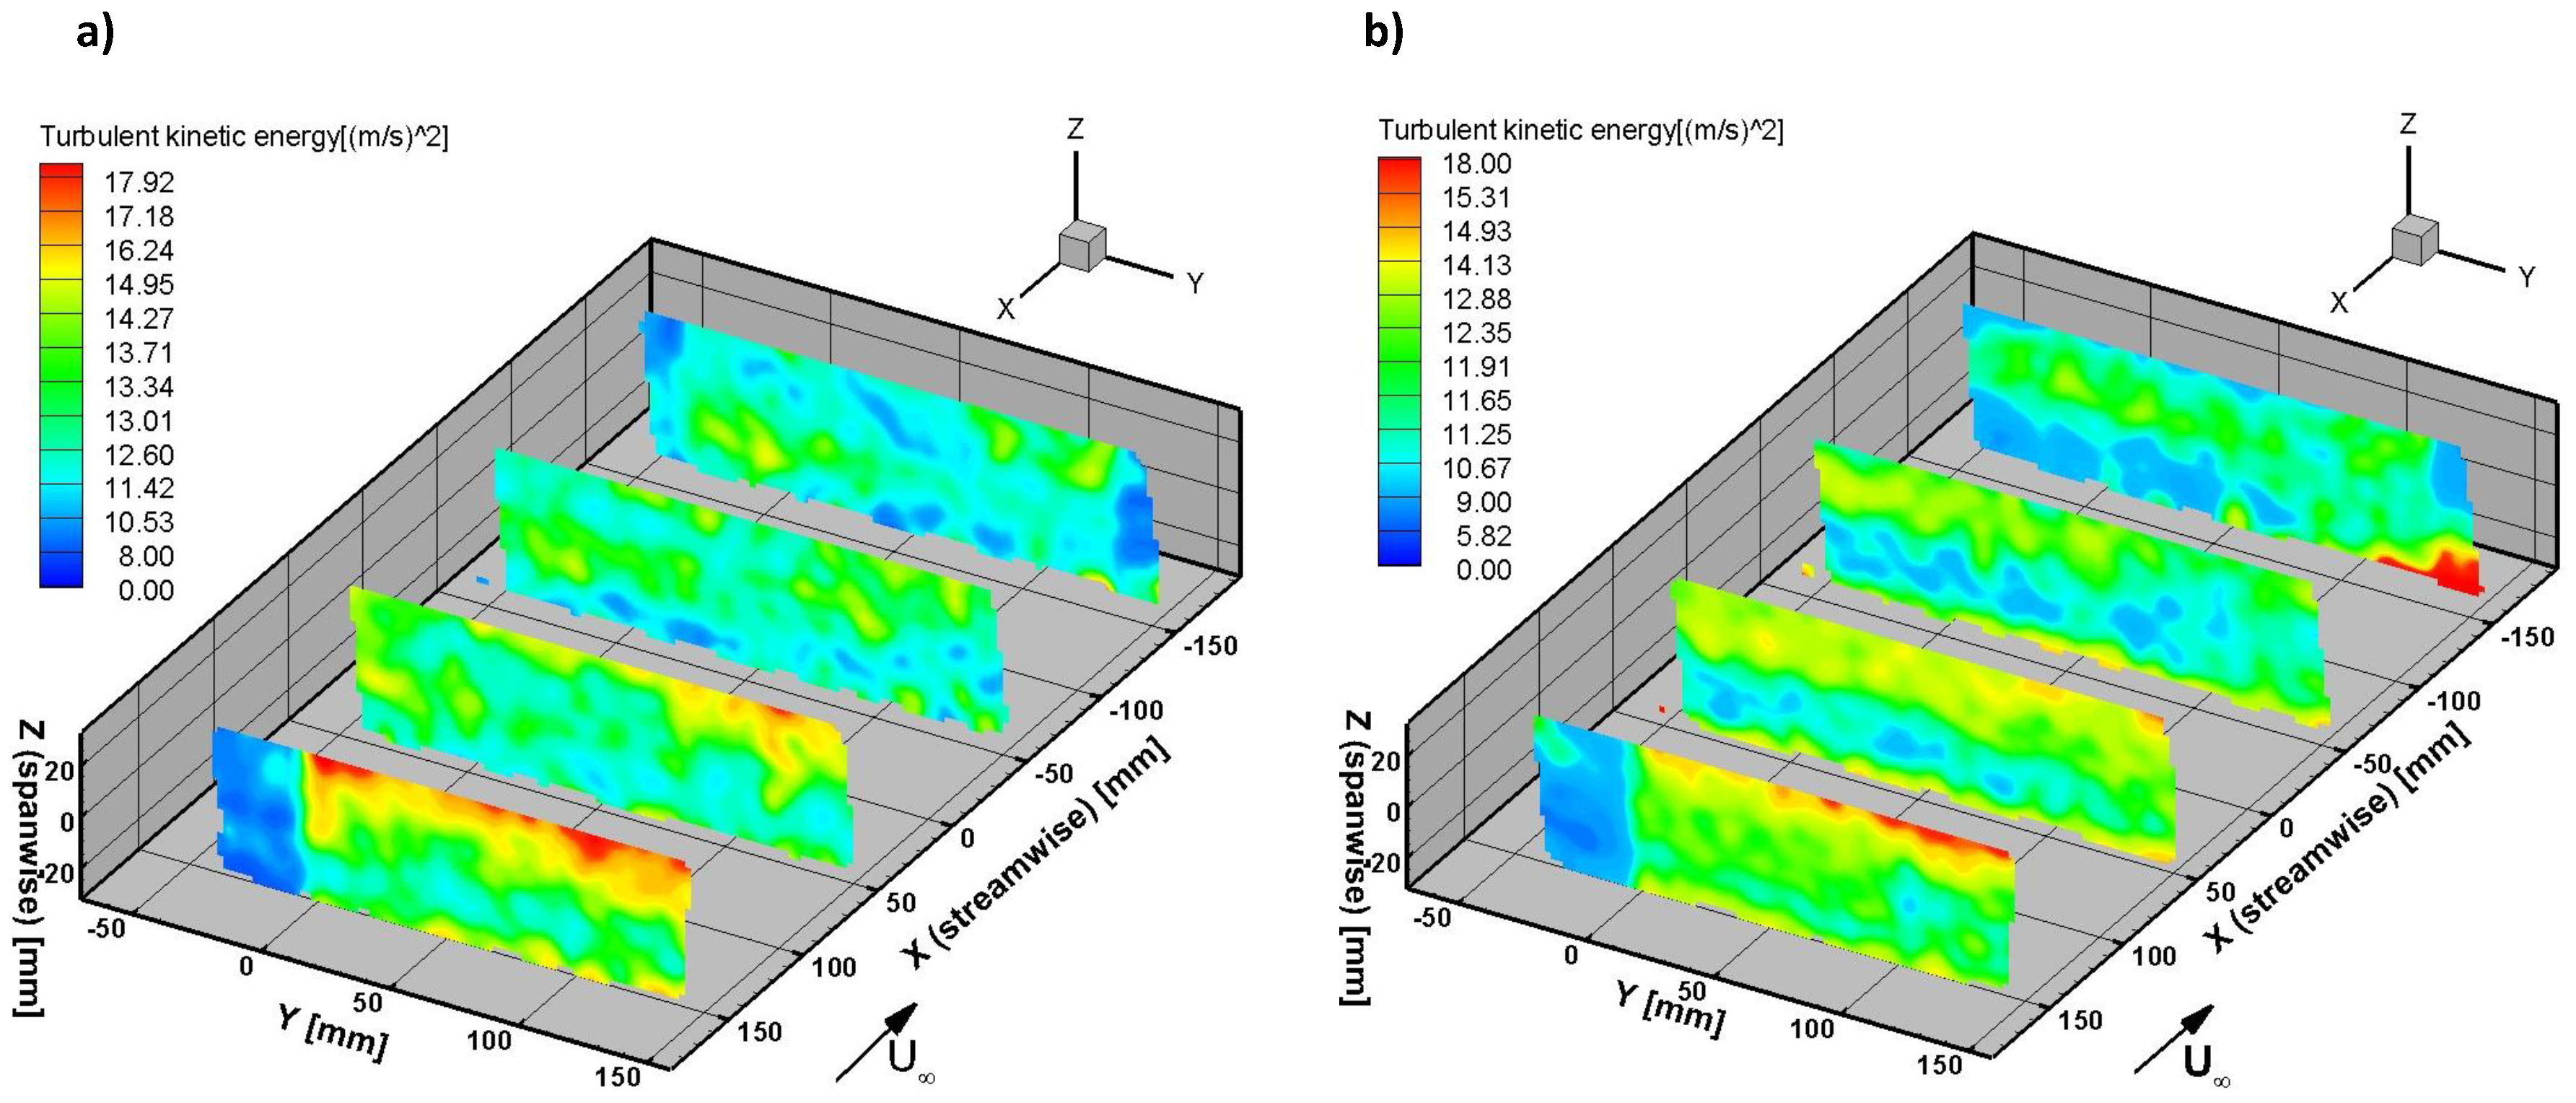
The time-averaged turbulent kinetic energy,
k in the flow volume is presented in
Figure 28 and
Figure 29 for both free stream velocities. This quantity is a measure of the turbulent energy inherent in the flow through the variances in the velocity components as follows,
where
,
, and
are the streamwise, wall-normal, and spanwise fluctuating velocity components. The effect of aileron deflection is to increase the concentration of turbulent kinetic energy in the vicinity and downstream of the aileron. As mentioned previously, the aileron is an active surface that acts as a circulation and vortex production mechanism which increases velocity fluctuations. For the baseline flow in
Figure 28(a) in the area downstream and below of the trailing edge in plane 4, the region of blue and green contours represent a turbulent kinetic energy in the range of
k≈ 3–3.6 (m/s)
. With aileron deflection shown on
Figure 28(b), the orange-red contours on the right corners of planes 3 and 4 (slightly upstream and downstream) of the aileron show enhanced levels of turbulent kinetic energy in the range of
k≈ 4–8 (m/s)
. However, further below the aileron for
y< 100 mm in plane 4, there is a large blue-contour region of low-
k flow with pockets of higher turbulent kinetic energy. This may be due to the high Reynolds stresses of the vortical flow shed from the aileron which promotes breakup into smaller dissipated vortices further down below the aileron. Flow with a higher freestream velocity of
= 26.8 m/s displays a smaller orange-red contour region, where
k≈ 15–18(m/s)
when the aileron is deflected. Based on this observation, there is a less significant increase in turbulent kinetic energy compared to the baseline flow when the aileron is deflected at considerably higher freestream velocity.
This outcome supports the results of time-averaged total vorticity, where the same behaviour was found; flap deflection produces less additional vorticity if the flow already has elevated vorticity due to the doubling of the freestream velocity. As a consequence of diminishing spanwise vorticity which contributes most significantly to the development of the wing trailing vortex sheet (where its intensity is proportional to lift production), there is less additional lift produced by the aileron. This leads to the main theory of this study: in flow with extreme turbulence intensity, in order to compensate for control surfaces that are less effective in varying lift loads on a fixed-wing aircraft, there is a need for larger and/or more control surfaces on the wing in order to respond to and mitigate large structural displacements of the wing and maintain flight control. Moreover, a second point to this theory; a control surface become less effective in producing lift and control moments if the length scales of the largest vortex structures in the flow are on the order of the control surface chord length or larger.
Figure 1.
WOW-EF flow management and UAV setup.
Figure 1.
WOW-EF flow management and UAV setup.
Figure 2.
(a) Four high-speed PIV cameras mounted on the translation stage and (b) Laser volume optics.
Figure 2.
(a) Four high-speed PIV cameras mounted on the translation stage and (b) Laser volume optics.
Figure 3.
(a) Acuity AR-700-50 laser displacement sensors mounted on WOW-EF turntable (NOTE: sensor serial numbers are shown) and (b) Laser displacement measurement locations on the right wing panel at locations; = 0.236, 0.547 and 0.926.
Figure 3.
(a) Acuity AR-700-50 laser displacement sensors mounted on WOW-EF turntable (NOTE: sensor serial numbers are shown) and (b) Laser displacement measurement locations on the right wing panel at locations; = 0.236, 0.547 and 0.926.
Figure 4.
(a) Temperature sensor and additional cobra probe near the UAV (suspended from gantry crane) and (b) Servo control and data synchronization hardware.
Figure 4.
(a) Temperature sensor and additional cobra probe near the UAV (suspended from gantry crane) and (b) Servo control and data synchronization hardware.
Figure 5.
Lift force for the three aileron deflection angles.
Figure 5.
Lift force for the three aileron deflection angles.
Figure 13.
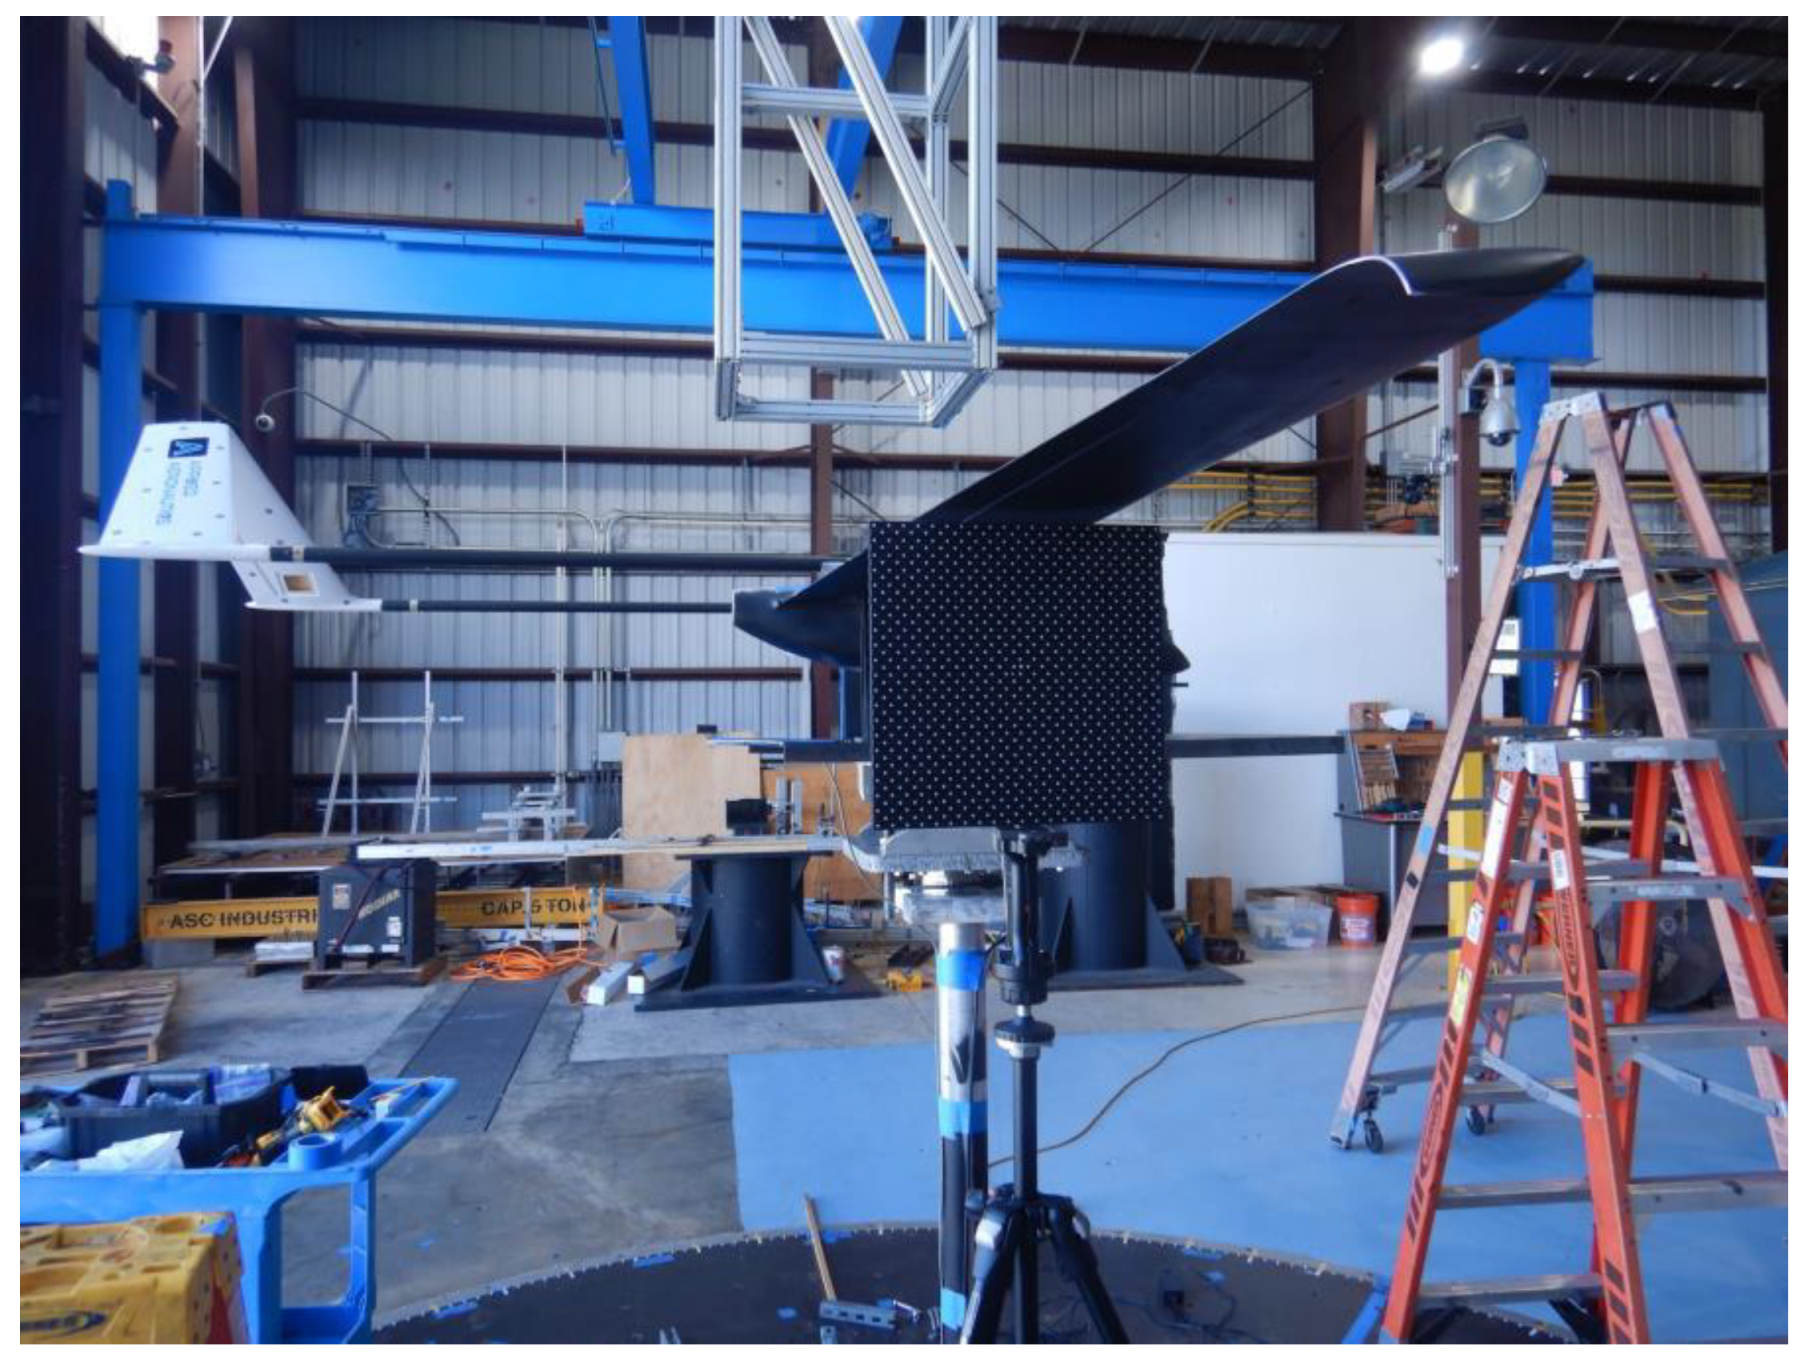
Side-view of the UAV setup during the PIV calibration process.
Figure 13.
Side-view of the UAV setup during the PIV calibration process.
Figure 14.
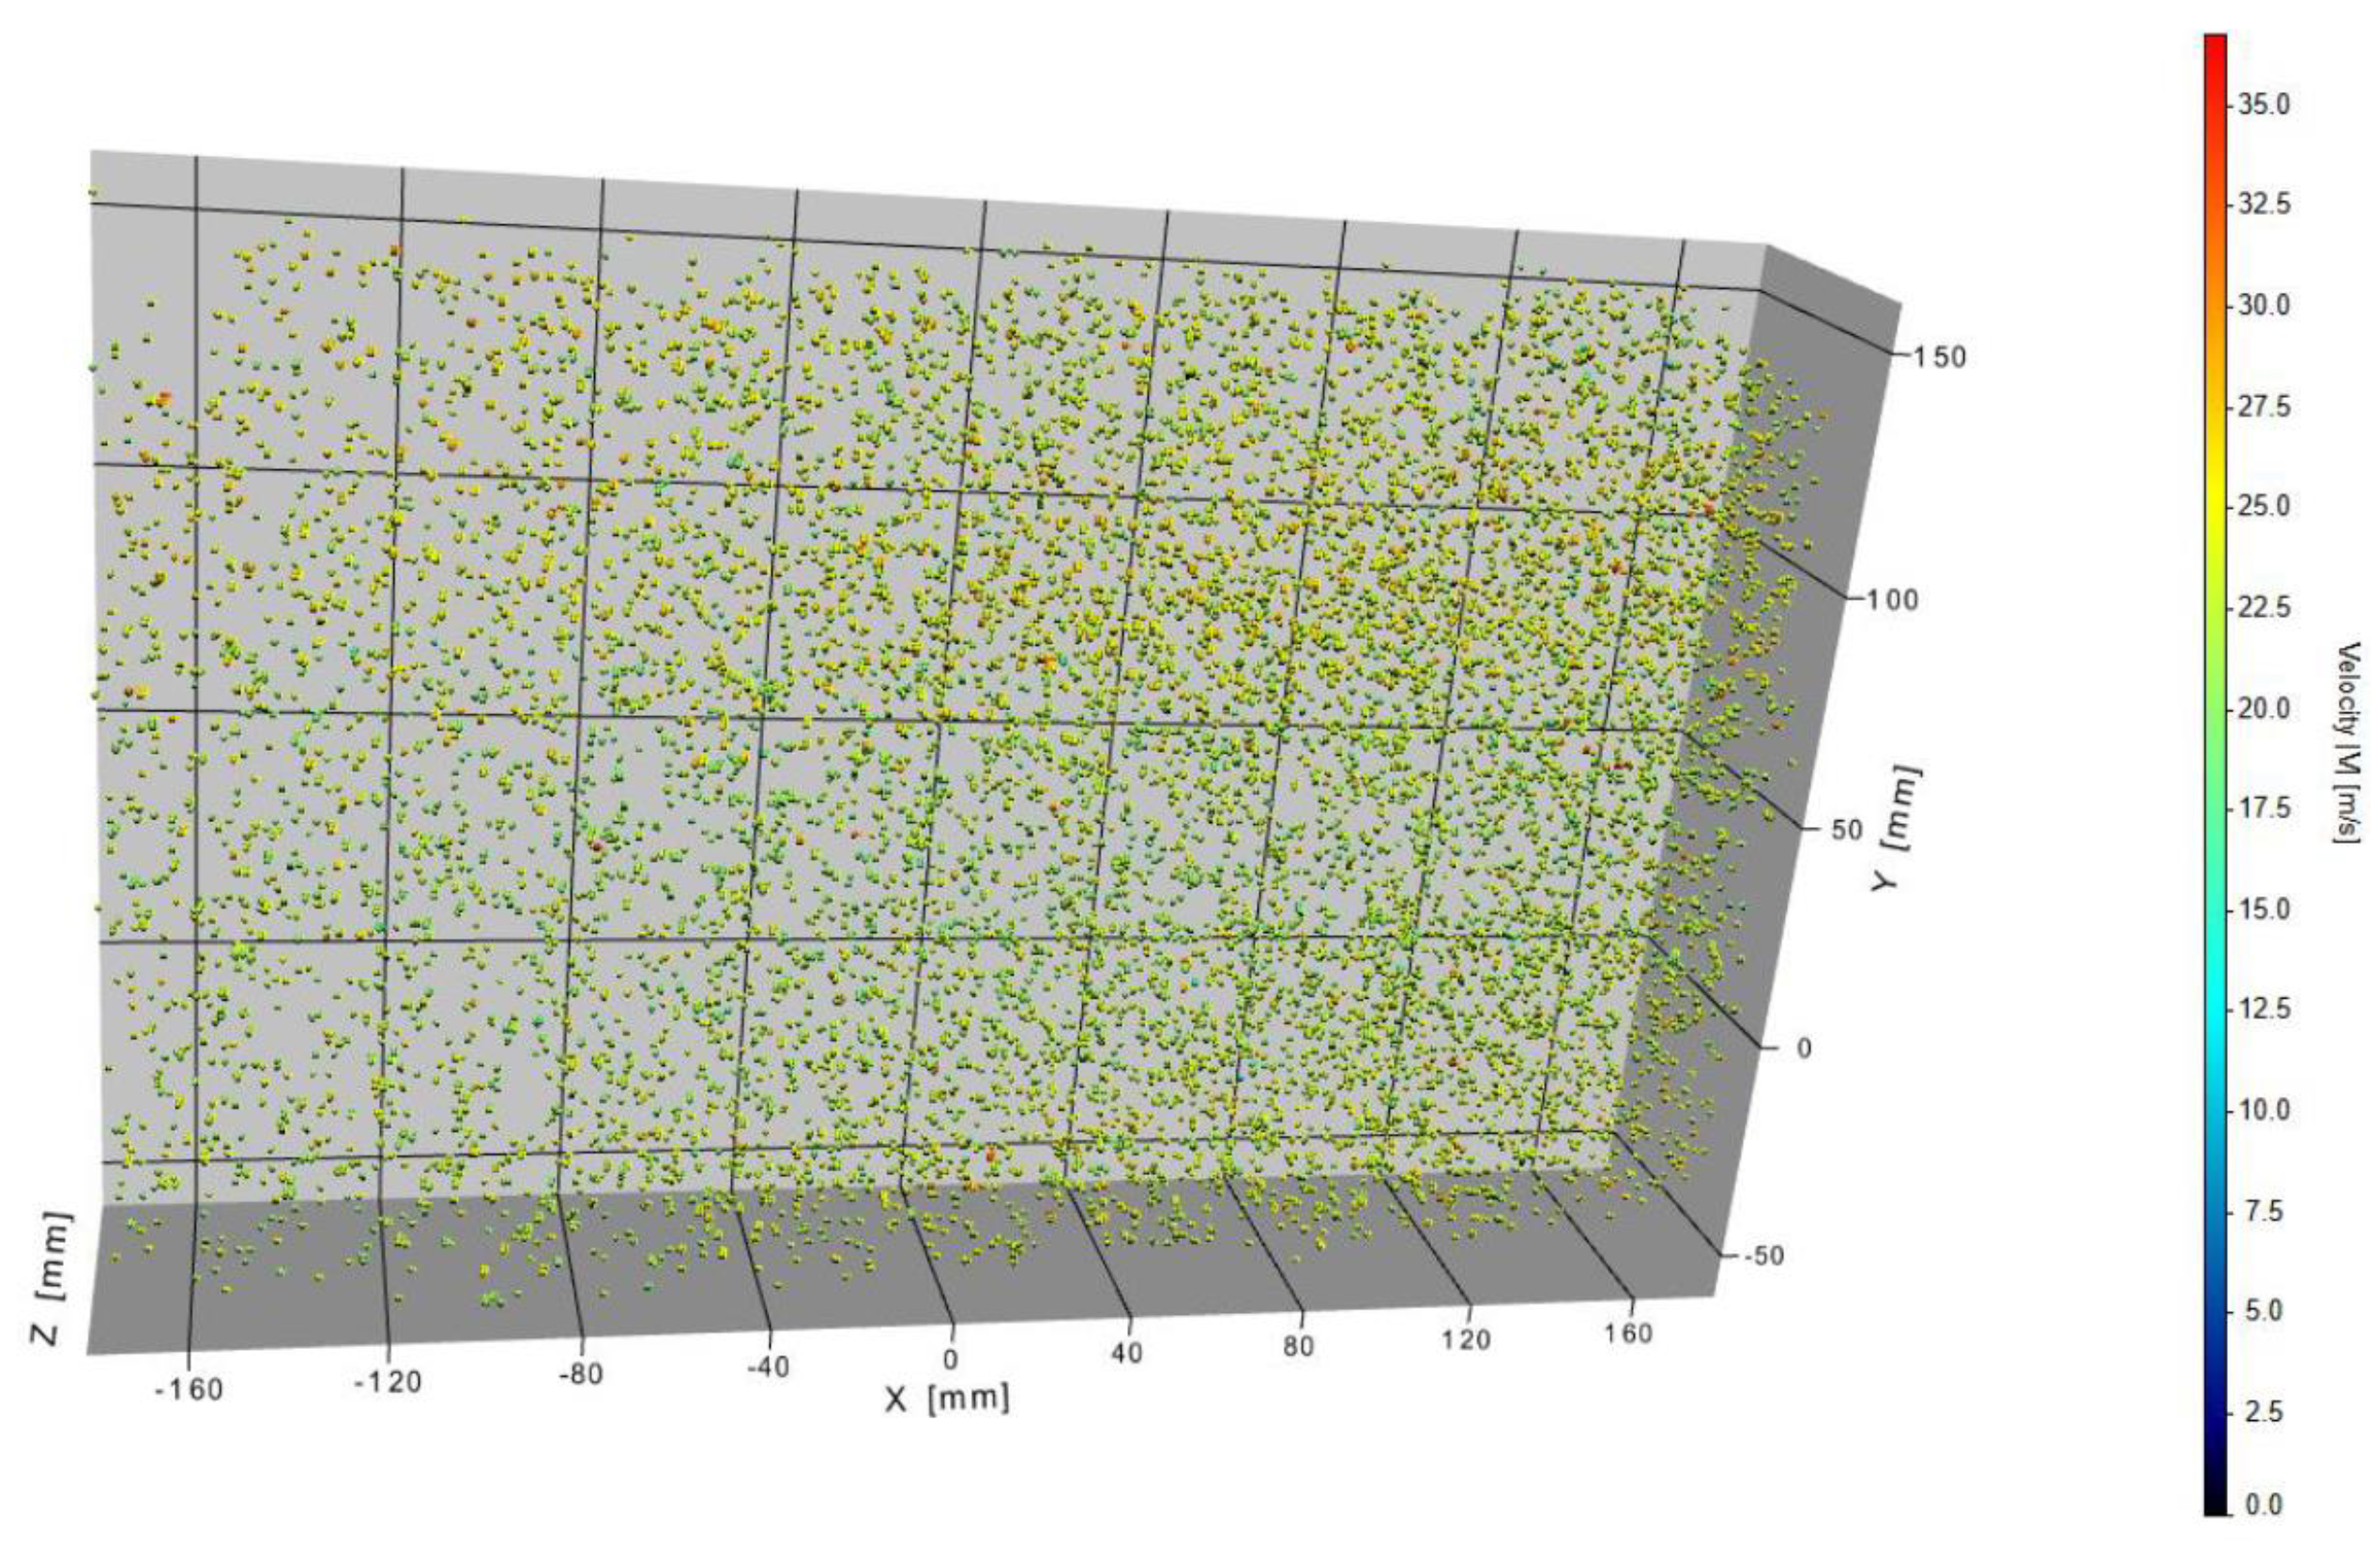
Particles identified in the shake-the-box measurement method; flow is along the direction.
Figure 14.
Particles identified in the shake-the-box measurement method; flow is along the direction.
Figure 15.
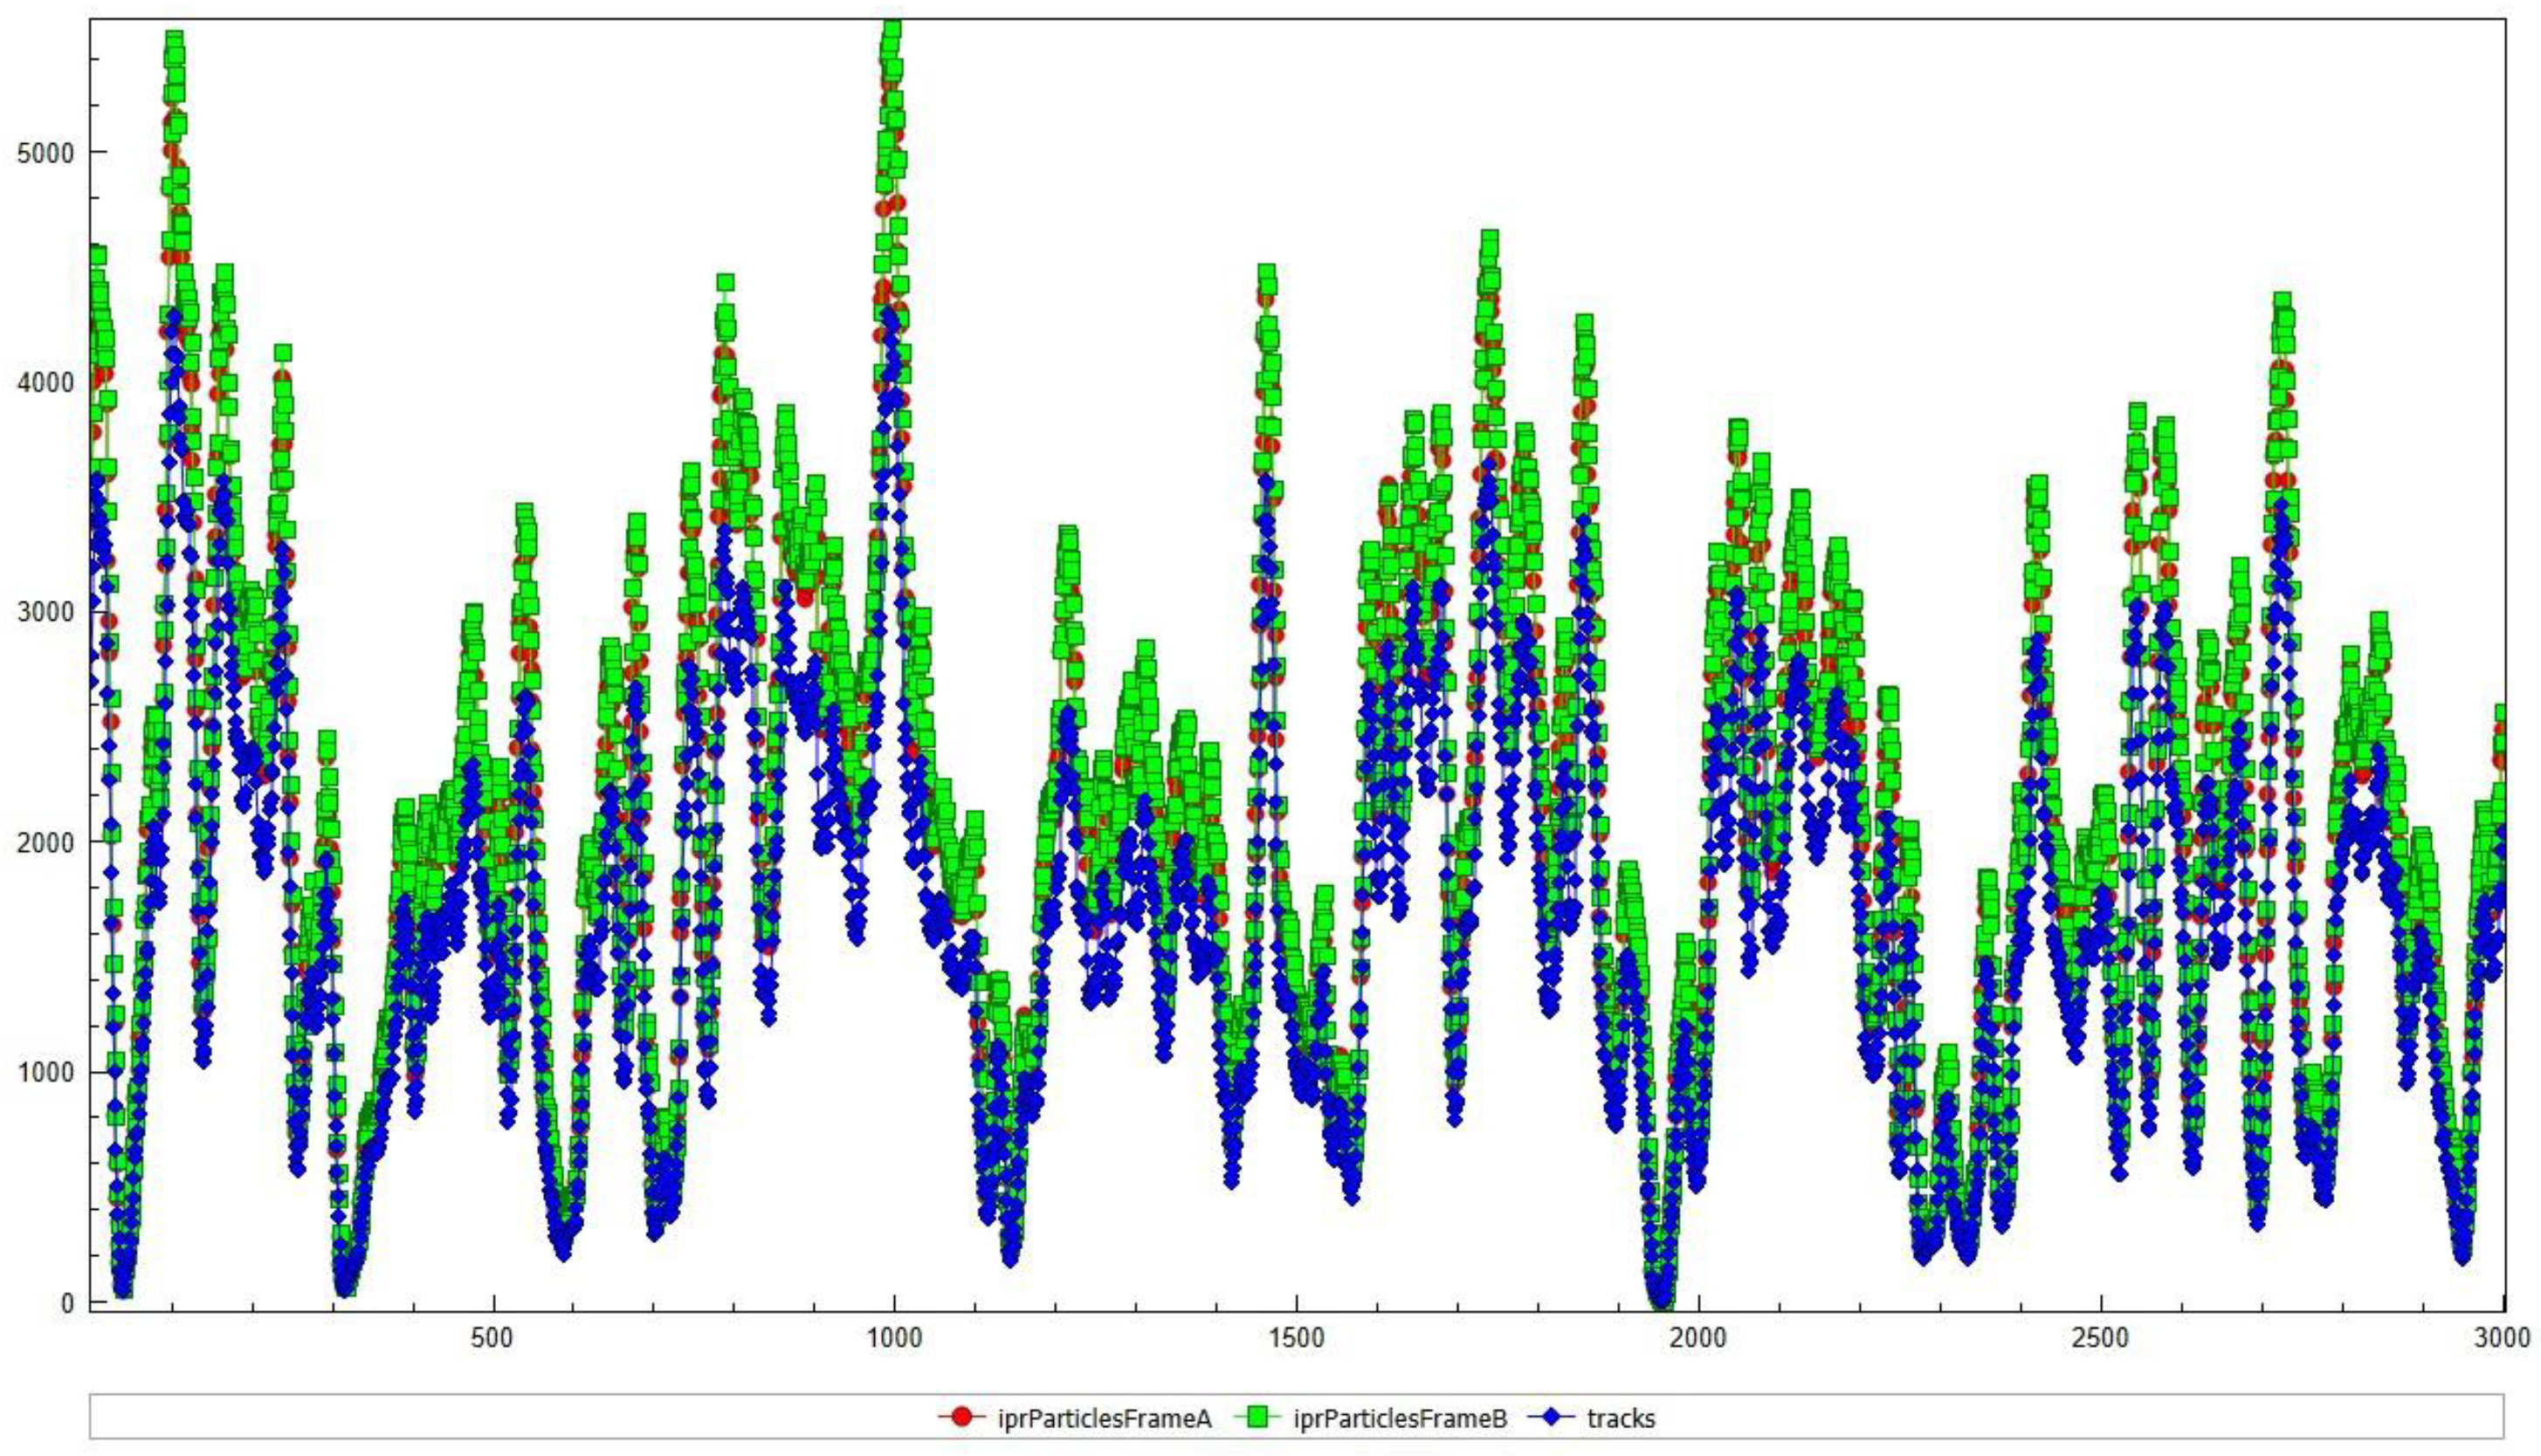
particle tracks calculated using the shake-the-box operation from three-dimensional particle tracking velocimetry (3D-PTV) processing.
Figure 15.
particle tracks calculated using the shake-the-box operation from three-dimensional particle tracking velocimetry (3D-PTV) processing.
Figure 16.
Time-averaged streamwise velocity, U in the flow volume at = 13.4 m/s for: a) aileron deflection, = 0and b) = 10.
Figure 16.
Time-averaged streamwise velocity, U in the flow volume at = 13.4 m/s for: a) aileron deflection, = 0and b) = 10.
Figure 17.
Time-averaged streamwise velocity, U at = 13.4 m/s for: a) plane 1 (at x=155 mm) with aileron deflection, = 0, b) plane 4 (at x=-155 mm) with = 0, c) plane 1 with = 10, and plane 4 with = 10.
Figure 17.
Time-averaged streamwise velocity, U at = 13.4 m/s for: a) plane 1 (at x=155 mm) with aileron deflection, = 0, b) plane 4 (at x=-155 mm) with = 0, c) plane 1 with = 10, and plane 4 with = 10.
Figure 18.
Time-averaged streamwise velocity, U in the flow volume at = 26.8 m/s for: a) aileron deflection, = 0and b) = 10.
Figure 18.
Time-averaged streamwise velocity, U in the flow volume at = 26.8 m/s for: a) aileron deflection, = 0and b) = 10.
Figure 19.
Time-averaged streamwise velocity, U at = 26.8 m/s for: a) plane 1 (at x=155 mm) with aileron deflection, = 0, b) plane 4 (at x=-155 mm) with = 0, c) plane 1 with = 10, and plane 4 with = 10.
Figure 19.
Time-averaged streamwise velocity, U at = 26.8 m/s for: a) plane 1 (at x=155 mm) with aileron deflection, = 0, b) plane 4 (at x=-155 mm) with = 0, c) plane 1 with = 10, and plane 4 with = 10.
Figure 20.
Time-averaged vertical velocity, V in the flow volume at = 13.4 m/s for: a) aileron deflection, = 0and b) = 10.
Figure 20.
Time-averaged vertical velocity, V in the flow volume at = 13.4 m/s for: a) aileron deflection, = 0and b) = 10.
Figure 21.
Time-averaged vertical velocity, V at = 13.4 m/s for: a) plane 1 (at x=155 mm) with aileron deflection, = 0, b) plane 4 (at x=-155 mm) with = 0, c) plane 1 with = 10, and plane 4 with = 10.
Figure 21.
Time-averaged vertical velocity, V at = 13.4 m/s for: a) plane 1 (at x=155 mm) with aileron deflection, = 0, b) plane 4 (at x=-155 mm) with = 0, c) plane 1 with = 10, and plane 4 with = 10.
Figure 22.
Iso-surfaces of time-averaged spanwise vorticity, at = 13.4 m/s for: a) aileron deflection, = 0and b) = 10.
Figure 22.
Iso-surfaces of time-averaged spanwise vorticity, at = 13.4 m/s for: a) aileron deflection, = 0and b) = 10.
Figure 23.
Iso-surfaces of time-averaged total vorticity, at = 13.4 m/s for: a) aileron deflection, = 0and b) = 10.
Figure 23.
Iso-surfaces of time-averaged total vorticity, at = 13.4 m/s for: a) aileron deflection, = 0and b) = 10.
Figure 28.
Turbulent kinetic energy, k at = 13.4 m/s for: a) aileron deflection, = 0and b) = 10.
Figure 28.
Turbulent kinetic energy, k at = 13.4 m/s for: a) aileron deflection, = 0and b) = 10.
Figure 29.
Turbulent kinetic energy, k at = 26.8 m/s for: a) aileron deflection, = 0and b) = 10.
Figure 29.
Turbulent kinetic energy, k at = 26.8 m/s for: a) aileron deflection, = 0and b) = 10.
Table 1.
Natural frequency, RMS and STD for the test wind speed and aileron deflection combinations.
Table 1.
Natural frequency, RMS and STD for the test wind speed and aileron deflection combinations.
Wind speed
(U) |
Aileron
deflection,
|
Structural frequency,
|
Root mean square, RMS |
Standard Deviation, STD |
|
| |
|
D |
Y |
L |
D |
Y |
L |
D |
Y |
L |
|
| 13.4 m/s |
0
|
4.88 |
4.88 |
2.74 |
13.8 |
29.5 |
23.86 |
12.07 |
29.48 |
9.53 |
|
| |
5
|
4.88 |
5.03 |
2.44 |
18.1 |
18.01 |
36.27 |
16.45 |
17.78 |
9.66 |
|
| |
10
|
5.03 |
5.03 |
2.28 |
10.4 |
25.12 |
42.36 |
6.64 |
24.78 |
8.94 |
|
| 17.9 m/s |
0
|
5.03 |
5.03 |
5.03 |
19.84 |
39.6 |
45.89 |
14.65 |
39.59 |
19.61 |
|
| |
5
|
4.88 |
4.88 |
2.74 |
27.56 |
52.21 |
59.55 |
23.7 |
52.2 |
18.09 |
|
| |
10
|
5.03 |
5.03 |
7.02 |
19.7 |
48.65 |
68.7 |
12.12 |
48.61 |
19.3 |
|
| 26.8 m/s |
0
|
4.73 |
5.03 |
4.73 |
35.07 |
69.3 |
85.65 |
24.53 |
69.17 |
36.0 |
|
| |
5
|
4.88 |
5.19 |
5.03? |
38.9 |
55.85 |
110.4 |
29.09 |
59.44 |
35.19 |
|
| |
10
|
4.88 |
4.88 |
3.66 |
50.97 |
45.88 |
127.9 |
44.65 |
45.6 |
35.59 |
|
Table 2.
Shedding frequency, frequency due to integral length scale based on lift measurement, and integral length scale at the location of the UAV for the test wind speeds and aileron deflection combinations.
Table 2.
Shedding frequency, frequency due to integral length scale based on lift measurement, and integral length scale at the location of the UAV for the test wind speeds and aileron deflection combinations.
Wind
Speed, U
|
Shedding
frequency, f
|
Frequency due to
integral length scale, f
|
Integral length, L (m) |
|
| |
|
0
|
5
|
10
|
0
|
5
|
10
|
|
|
|
| 13.4 m/s |
14.86 |
30.06 |
30.37 |
28.23 |
0.44 |
0.44 |
0.47 |
|
|
|
| 17.9 m/s |
19.81 |
28.99 |
30.22 |
29.6 |
0.62 |
0.59 |
0.60 |
|
|
|
| 26.8 m/s |
26.75 |
29.30 |
29.91 |
31.13 |
0.82 |
0.80 |
0.77 |
|
|
|
Table 3.
Power spectral density (PSD) peak of the structural frequency, .
Table 3.
Power spectral density (PSD) peak of the structural frequency, .
Wind speed
(U) |
Aileron deflection
() |
Tip
( = 0.926) |
Mid
( = 0.547) |
Root
( =0.236) |
| 13.4 m/s |
0
|
23.74 |
2.56 |
0.05 |
| |
5
|
21.43 |
2.42 |
0.03 |
| |
10
|
13.93 |
1.61 |
0.05 |
| 17.9 m/s |
0
|
60.63 |
7.87 |
0.26 |
| |
5
|
46.23 |
6.93 |
0.60 |
| |
10
|
112.25 |
14.38 |
0.33 |
| 26.8 m/s |
0
|
137.54 |
17.21 |
0.36 |
| |
5
|
74.86 |
10.94 |
0.34 |
| |
10
|
135.70 |
19.30 |
0.26 |
Table 5.
Mean and RMS of the lift force and wing tip displacement.
Table 5.
Mean and RMS of the lift force and wing tip displacement.
| Wind Speed, U
|
Aileron Def.,
|
Lift, mean [N] |
Lift, RMS [N] |
Wing Tip Disp. [cm] |
| 13.4 m/s |
0
|
21.88 |
23.8 |
1.40 |
| 26.8 m/s |
0
|
77.72 |
85.6 |
5.08 |
| 13.4 m/s |
10
|
41.4 |
42.4 |
2.54 |
| 26.8 m/s |
10
|
123.5 |
127.9 |
7.62 |


