1. Introduction
Bifacial PV, by virtue of its minimal incremental cost compared to monofacial panels, is rapidly becoming the default standard for most utility-scale solar PV installations. Although there is an ever-evolving literature on the research domain of bifacial PV performance modeling, the optical modeling of bifacial PV performance is yet to report a detailed integration of racking and mounting structures, which are supposedly critical for bifacial performance. We utilized the site-specific parameters of tilt, height, and row-to-row spacing of a commercially deployed PV array to pioneer this detailed modeling approach, allowing a more accurate assessment of bifacial performance.
Upon a high-level observation of bifacial PV technology and market growth, we reviewed the existing body of knowledge on bifacial PV performance modeling challenges, including the tools and techniques in practice.
Section 2 discusses the methodology of the work where the detailed site geometry is incorporated into the simulation. The workflow of addressing the relevant research questions is discussed.
Section 3 elaborates on the study of the site and integration of structures into the simulation.
Section 4 presents the simulation results and proposes the site-specific characterization approaches.
Section 5 summarizes the contribution of this work and potential future research directions.
1.1. Bifacial PV: Technology and Market
The obvious purpose of using bifacial solar photovoltaic panels is to capture solar irradiance through the rear surface of the PV modules, thereby converting more solar energy into electricity. The two key terminologies associated with bifacial PV technology are the module bifaciality
and the bifacial gain
, respectively. They are defined as:
and
Due to the design and fabrication limitations, the rear surface of a bifacial PV module does not have the same photovoltaic energy conversion efficiency as the front surface. The module bifaciality denotes the relative rear surface efficiency of power conversion. The Bifacial Energy Gain (BGE) is a system-level parameter indicating how much additional energy the system yields by virtue of being bifacial compared to the monofacial-only scenario. Bifacial PV modules being available at a nominal incremental cost has led to a market outlook where bifacial PV is poised to dominate the share of new PV installations in the coming years. The market forecast, as seen in
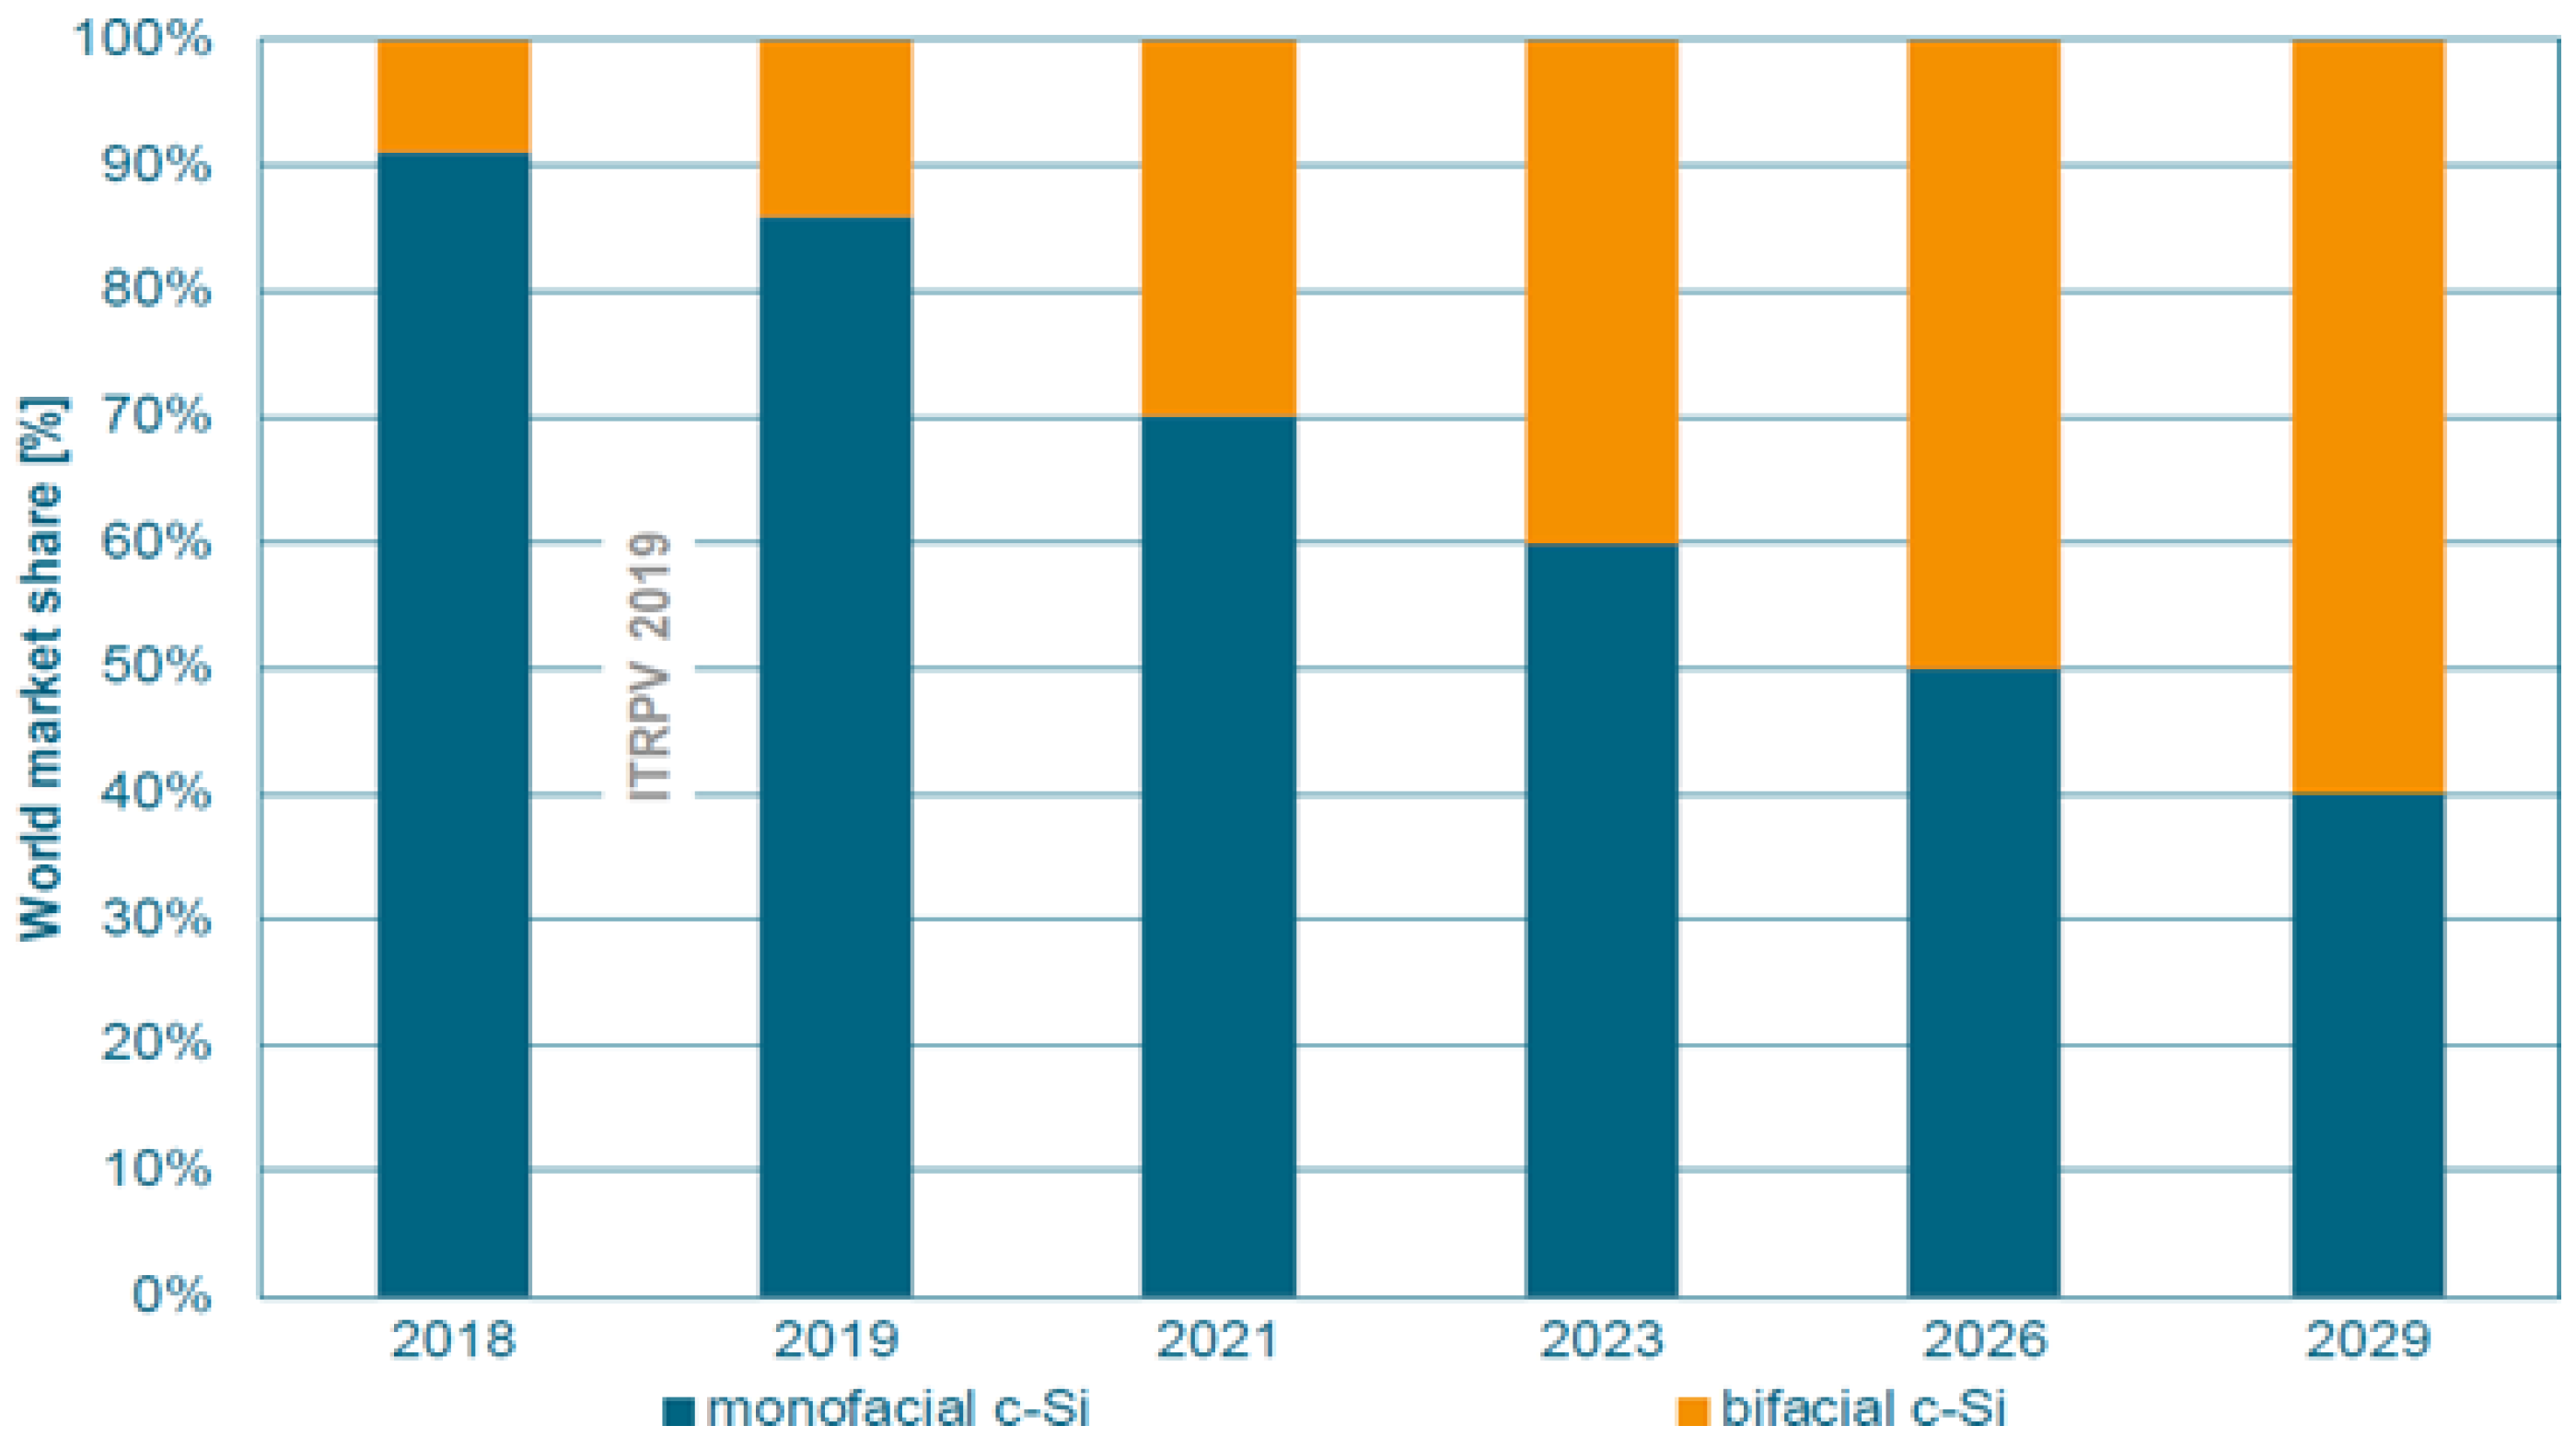
Figure 1, shows that by the year 2026, bifacial PV will exceed 50% of the total PV world market share and shall keep growing in the years to follow.
1.2. State of Research for Bifacial PV Performance Modeling
Bifacial PV’s rapid proliferation in the PV market calls for research in the design, performance modeling, and equipment standardization aspects. One of the critical challenges of bifacial PV is that the rear surface irradiance modeling remains a complex problem due to its dependency on many factors, including ground albedo and array installation geometries such as tilt, height, row-to-row spacing, and row position. The rear surface irradiance is affected by:
Ground reflected irradiance
Sky diffuse irradiance
Structure-reflected irradiance
Direct irradiance on the back surface
Even though the solar industry has started to adopt bifacial PV, the monofacial-focused design best practices remain essentially unchanged. While incident light rays and horizontal diffusion are the major contributors to solar irradiance for the module’s top surface, the rear irradiance of a bifacial module is primarily affected by the reflected irradiation. Ground reflection is significantly inhibited by the mounting structures of the array, which is not accounted for in any of the prevailing modeling approaches.
The rear surface irradiance modeling aspects are well identified and discussed in literature [
2]. The view factor model and the optical ray-tracing model emerge as the two primary methods for rear surface irradiance modeling. The view factor model quantifies the fraction of irradiance reflected from other surfaces, assuming that the irradiance is scattered isotopically. On the other hand, the ray-tracing simulation backtracks from the surface of the collector for all the light rays impinging on it. Reference Ayala Pelaez et al. [
3] compared the methods from a performance and computational expenses standpoint. Literature [
4] supports the industry impression that optical ray-tracing provides more accurate predictions among the methods despite the drawback of being more computationally expensive. There are models proposed which are modified from prevailing models through mathematical approximations [
5]. The view factor model is integrated into many of the commercially used PV system design tools, including PVsyst and System Advisor Model (SAM). The optical ray tracing simulation is implemented through Bifacial Radiance [
6], a python-wrapper application developed by National Renewable Energy Laboratory (NREL), which is built around the open-source UNIX-based software, Radiance [
7].
As an open research area, bifacial performance modeling invites a lot of attention from the experts in the field. Besides the modeling methods evaluation, there are reports that an additional 0.5% to 1% energy gain can be achieved at the system level through optimal 1-axis tracking [
8]. The general sensitivity of the installation parameters is discussed in [
9]. Reference [
10] reports the electrical mismatch effect on bifacial performance, which comes down to 1-2% of the yield. Partly accounting for the mounting structure, [
11] demonstrates the influence of torque tubes on the rear surface irradiance and shading loss. The reported research, while substantial as the foundation for further knowledge creation, is primarily limited to small-scale experimental testbeds. Commercially deployed bifacial sites are not modeled with their full-fledged mounting and racking structure to derive site-specific characterizations. The comparison of alternative racking and mounting structures and their influence on bifacial performance also await investigations and needs a universal approach. In our work, we leverage the existing literature to take a step forward toward addressing some of those unaddressed issues of the bifacial PV world.
1.3. Research Objective
The literature suggests that there is limited study of the bifacial performance of deployment-scale PV considering the influence of mounting and racking structures. In our work, we investigate how the mounting and racking geometry influence the bifacial PV module’s rear surface irradiance sensitivity on vital design and installation parameters such as tilt angle, clearance height, and row-to-row spacing, often known as pitch. Besides proposing and implementing the novel approach of incorporating racking and mounting structure geometry for optical ray-tracing simulation, the questions this work addresses include:
How much impact the mounting and racking structure do have in terms of shading and edge (or boundary) effect in a real-world deployment scenario?
Do the racking and mounting geometries influence the sensitivity trajectory for the installation parameters such as tilt, height, and pitch?
How can the site-specific sensitivity of different installation parameters be captured and used for individual PV array design configurations?
An affirmative and preferably quantified answer to the above research questions would validate the bifacial PV modeling approach of this work as a unified method for bifacial PV array performance modeling for utility-scale arrays.
2. Materials and Methods
The key aspects of the research methodology are:
Model the geometry of the mounting and racking structures in detail.
Apply the optical ray-tracing simulation to quantify the bifacial performance simulation.
Analyze the sensitivity of the various installation parameters for the front and rear surface irradiance.
The steps, altogether, present a novel methodology for site-specific detail modeling of bifacial PV rear surface irradiance with its incorporation of racking geometry. The sensitivity analysis leads to a possible site-specific characterization of different site parameters.
2.1. Building the Site Geometry
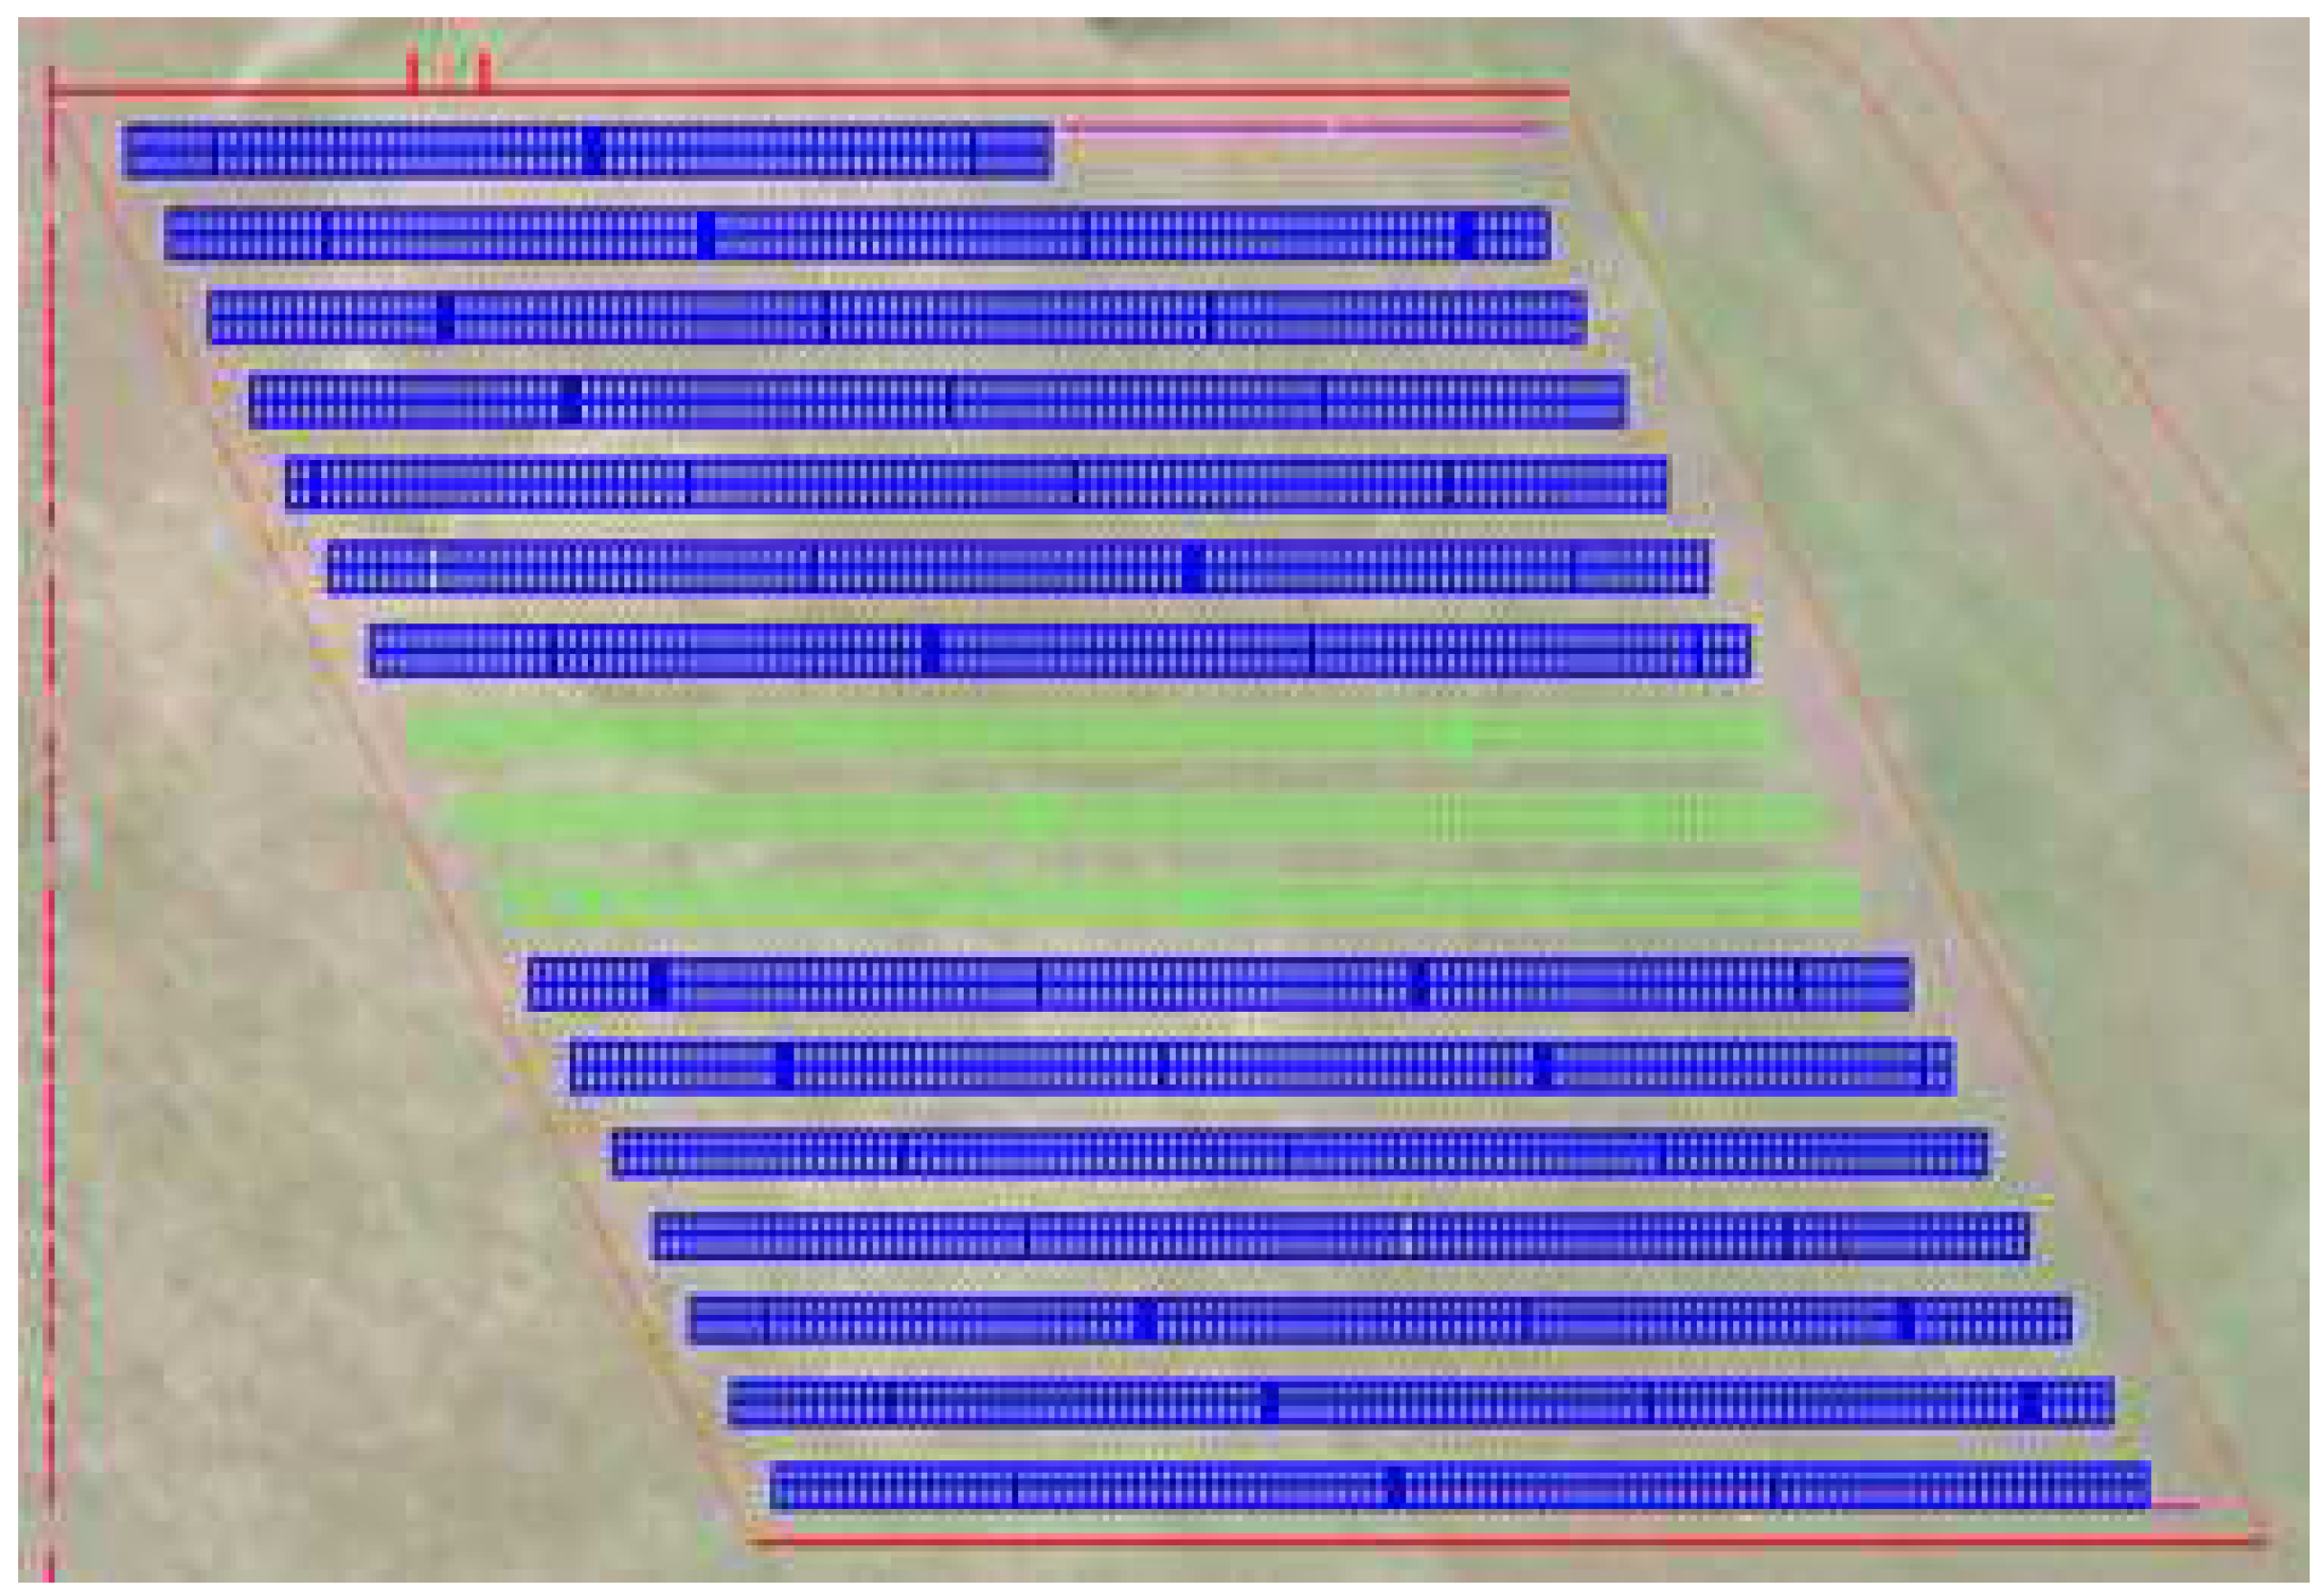
We opted to pursue a site-specific study of bifacial PV performance modeling leveraging the actual racking and mounting design of a commercially deployed and operational 1 MWp Solar PV array located near Cloverdale, California. The array was fixed-tilt having 17 rows of modules with a 2-up portrait configuration. The array layout is shown in
Figure 2:
Our work was scoped to simulate an entire row of 114 x 2 module configurations. As displayed in
Figure 3, the mounting support structure featured vertical posts, longitudinal racking bars, and struts along the full horizontal length of the row. The real on-field dimensions of the members are incorporated in the geometric modeling.
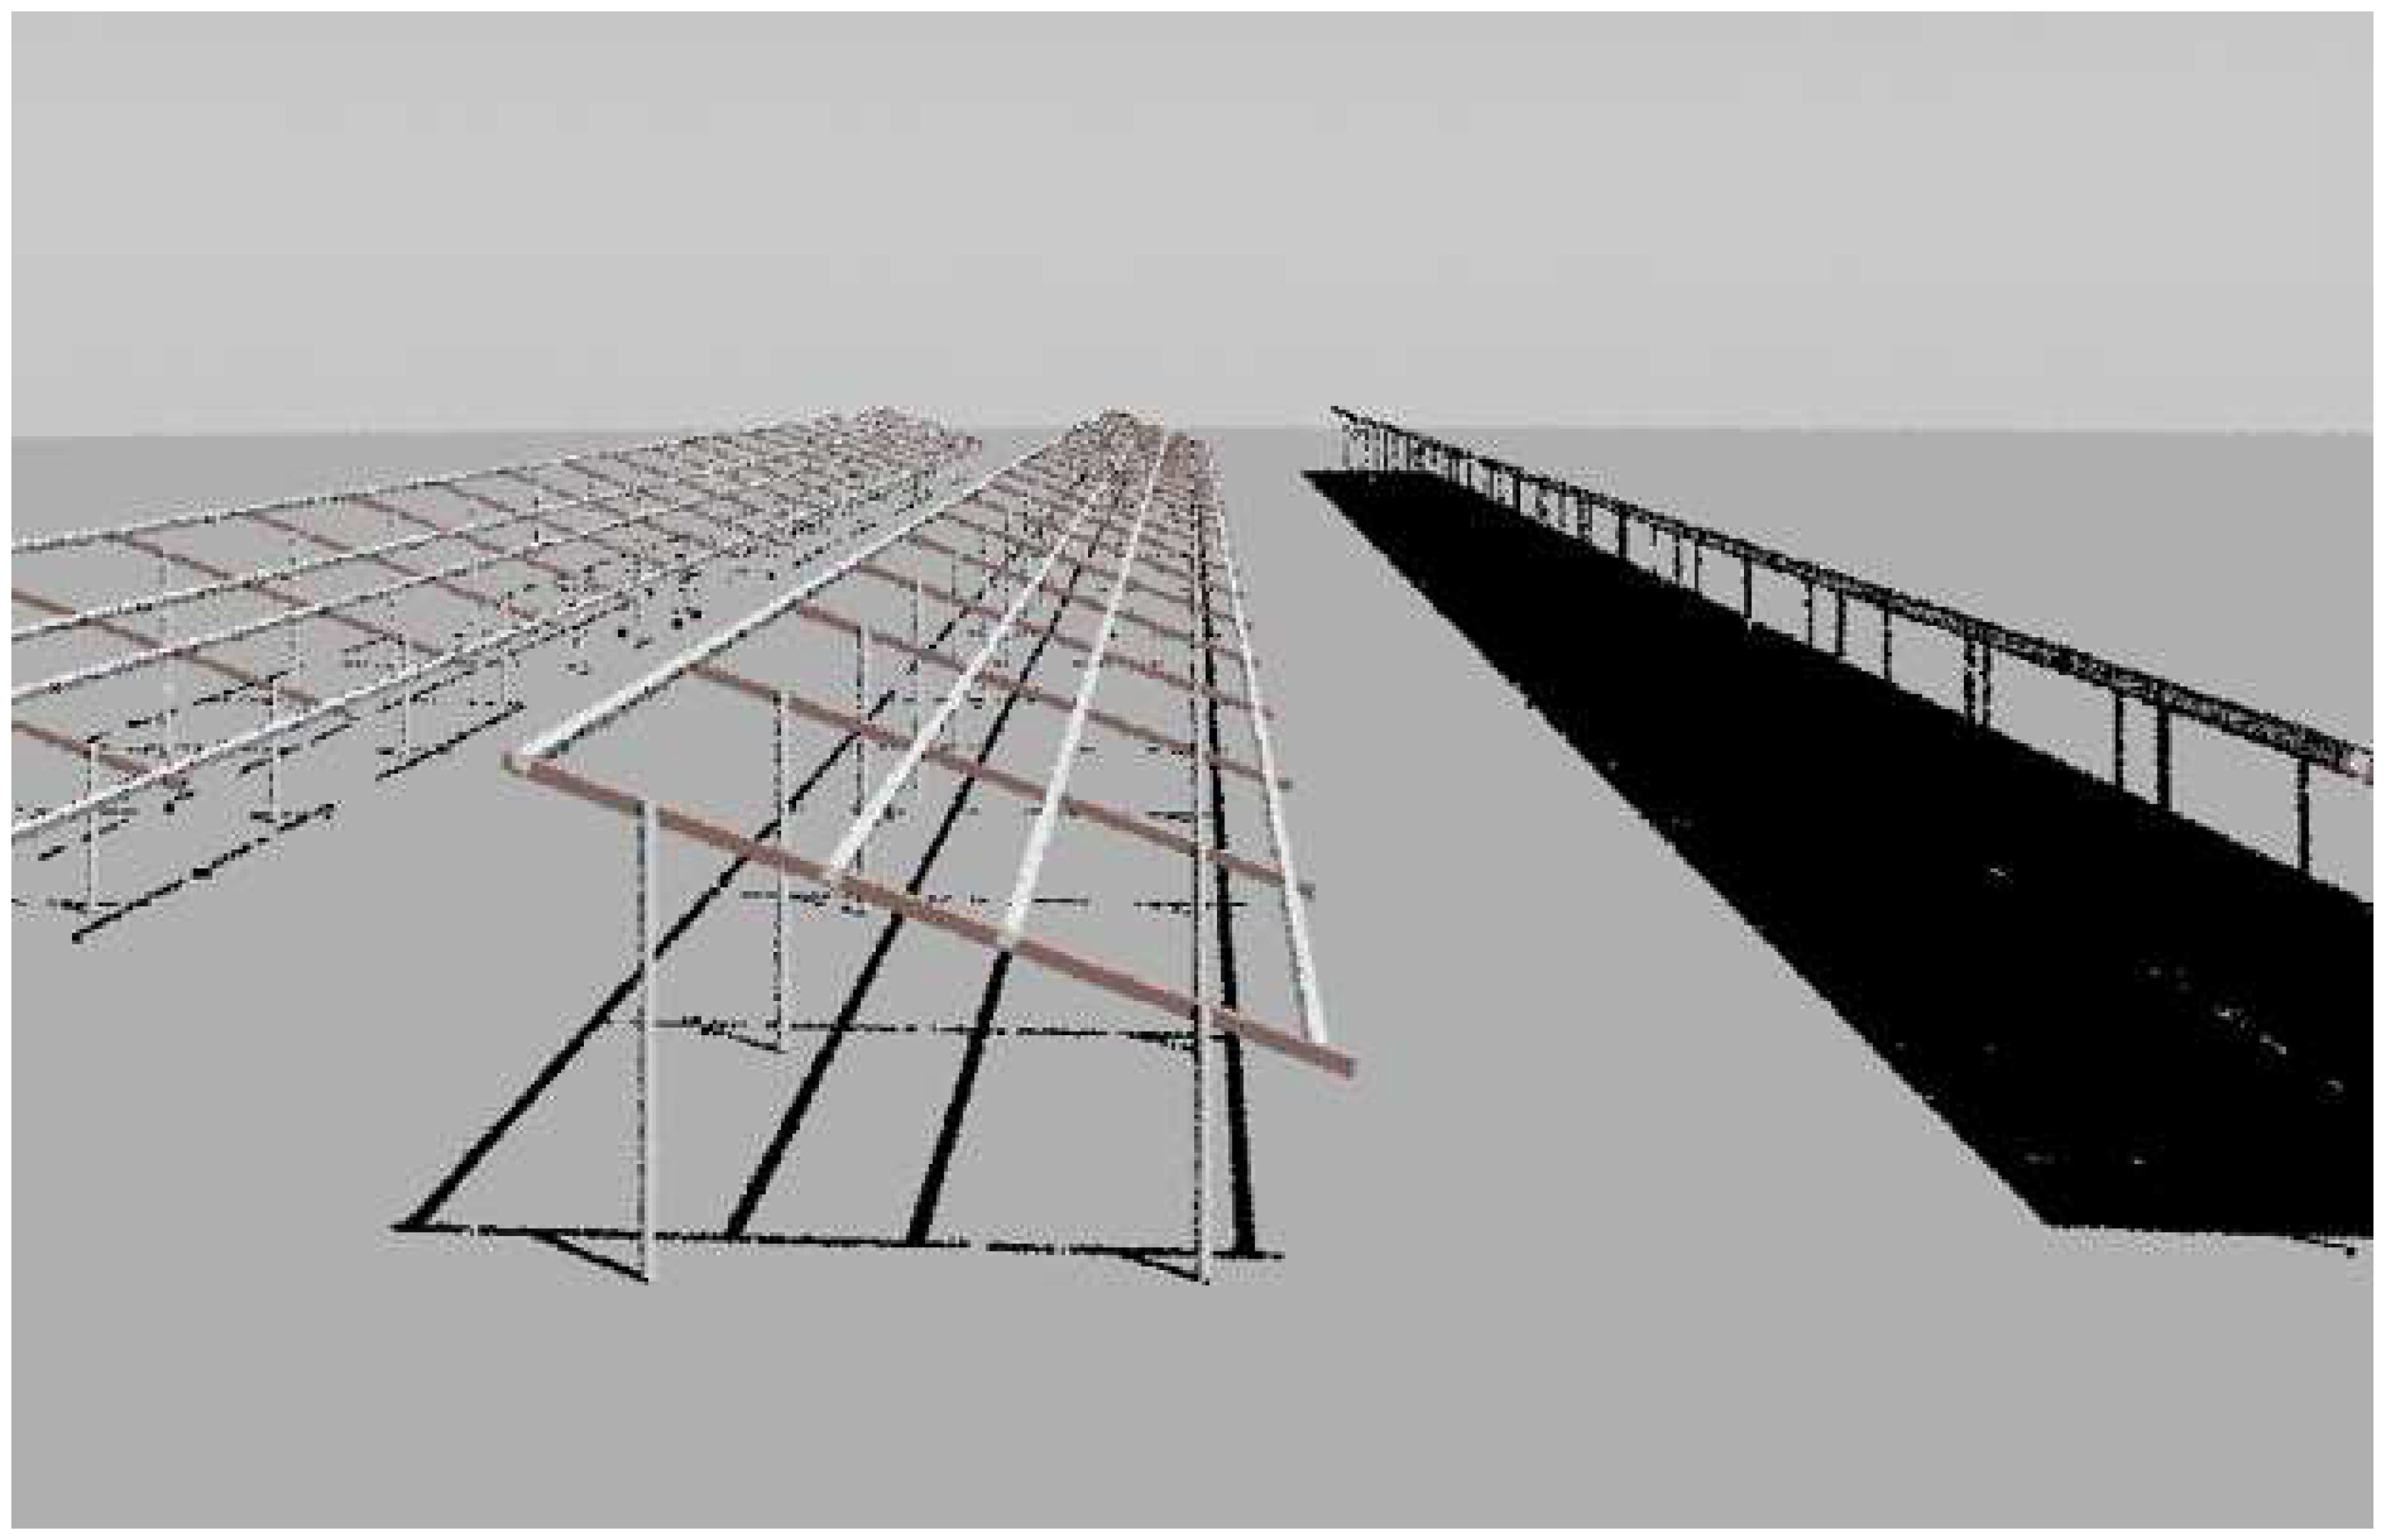
We opted to model the geometry of the entire rows of 114 two-up modules with the detailed mounting and racking specifics as shown in
Figure 4. This Radiance geometry would allow us to apply the optical ray-trace simulation for the rear surface irradiance of the bifacial PV model.
To ensure that we considered the shading effect from the adjacent rows, we created the Radiance geometry of three adjacent rows. We then implemented the optical ray-tracing simulation for the middle row. The scenario is shown in
Figure 5.
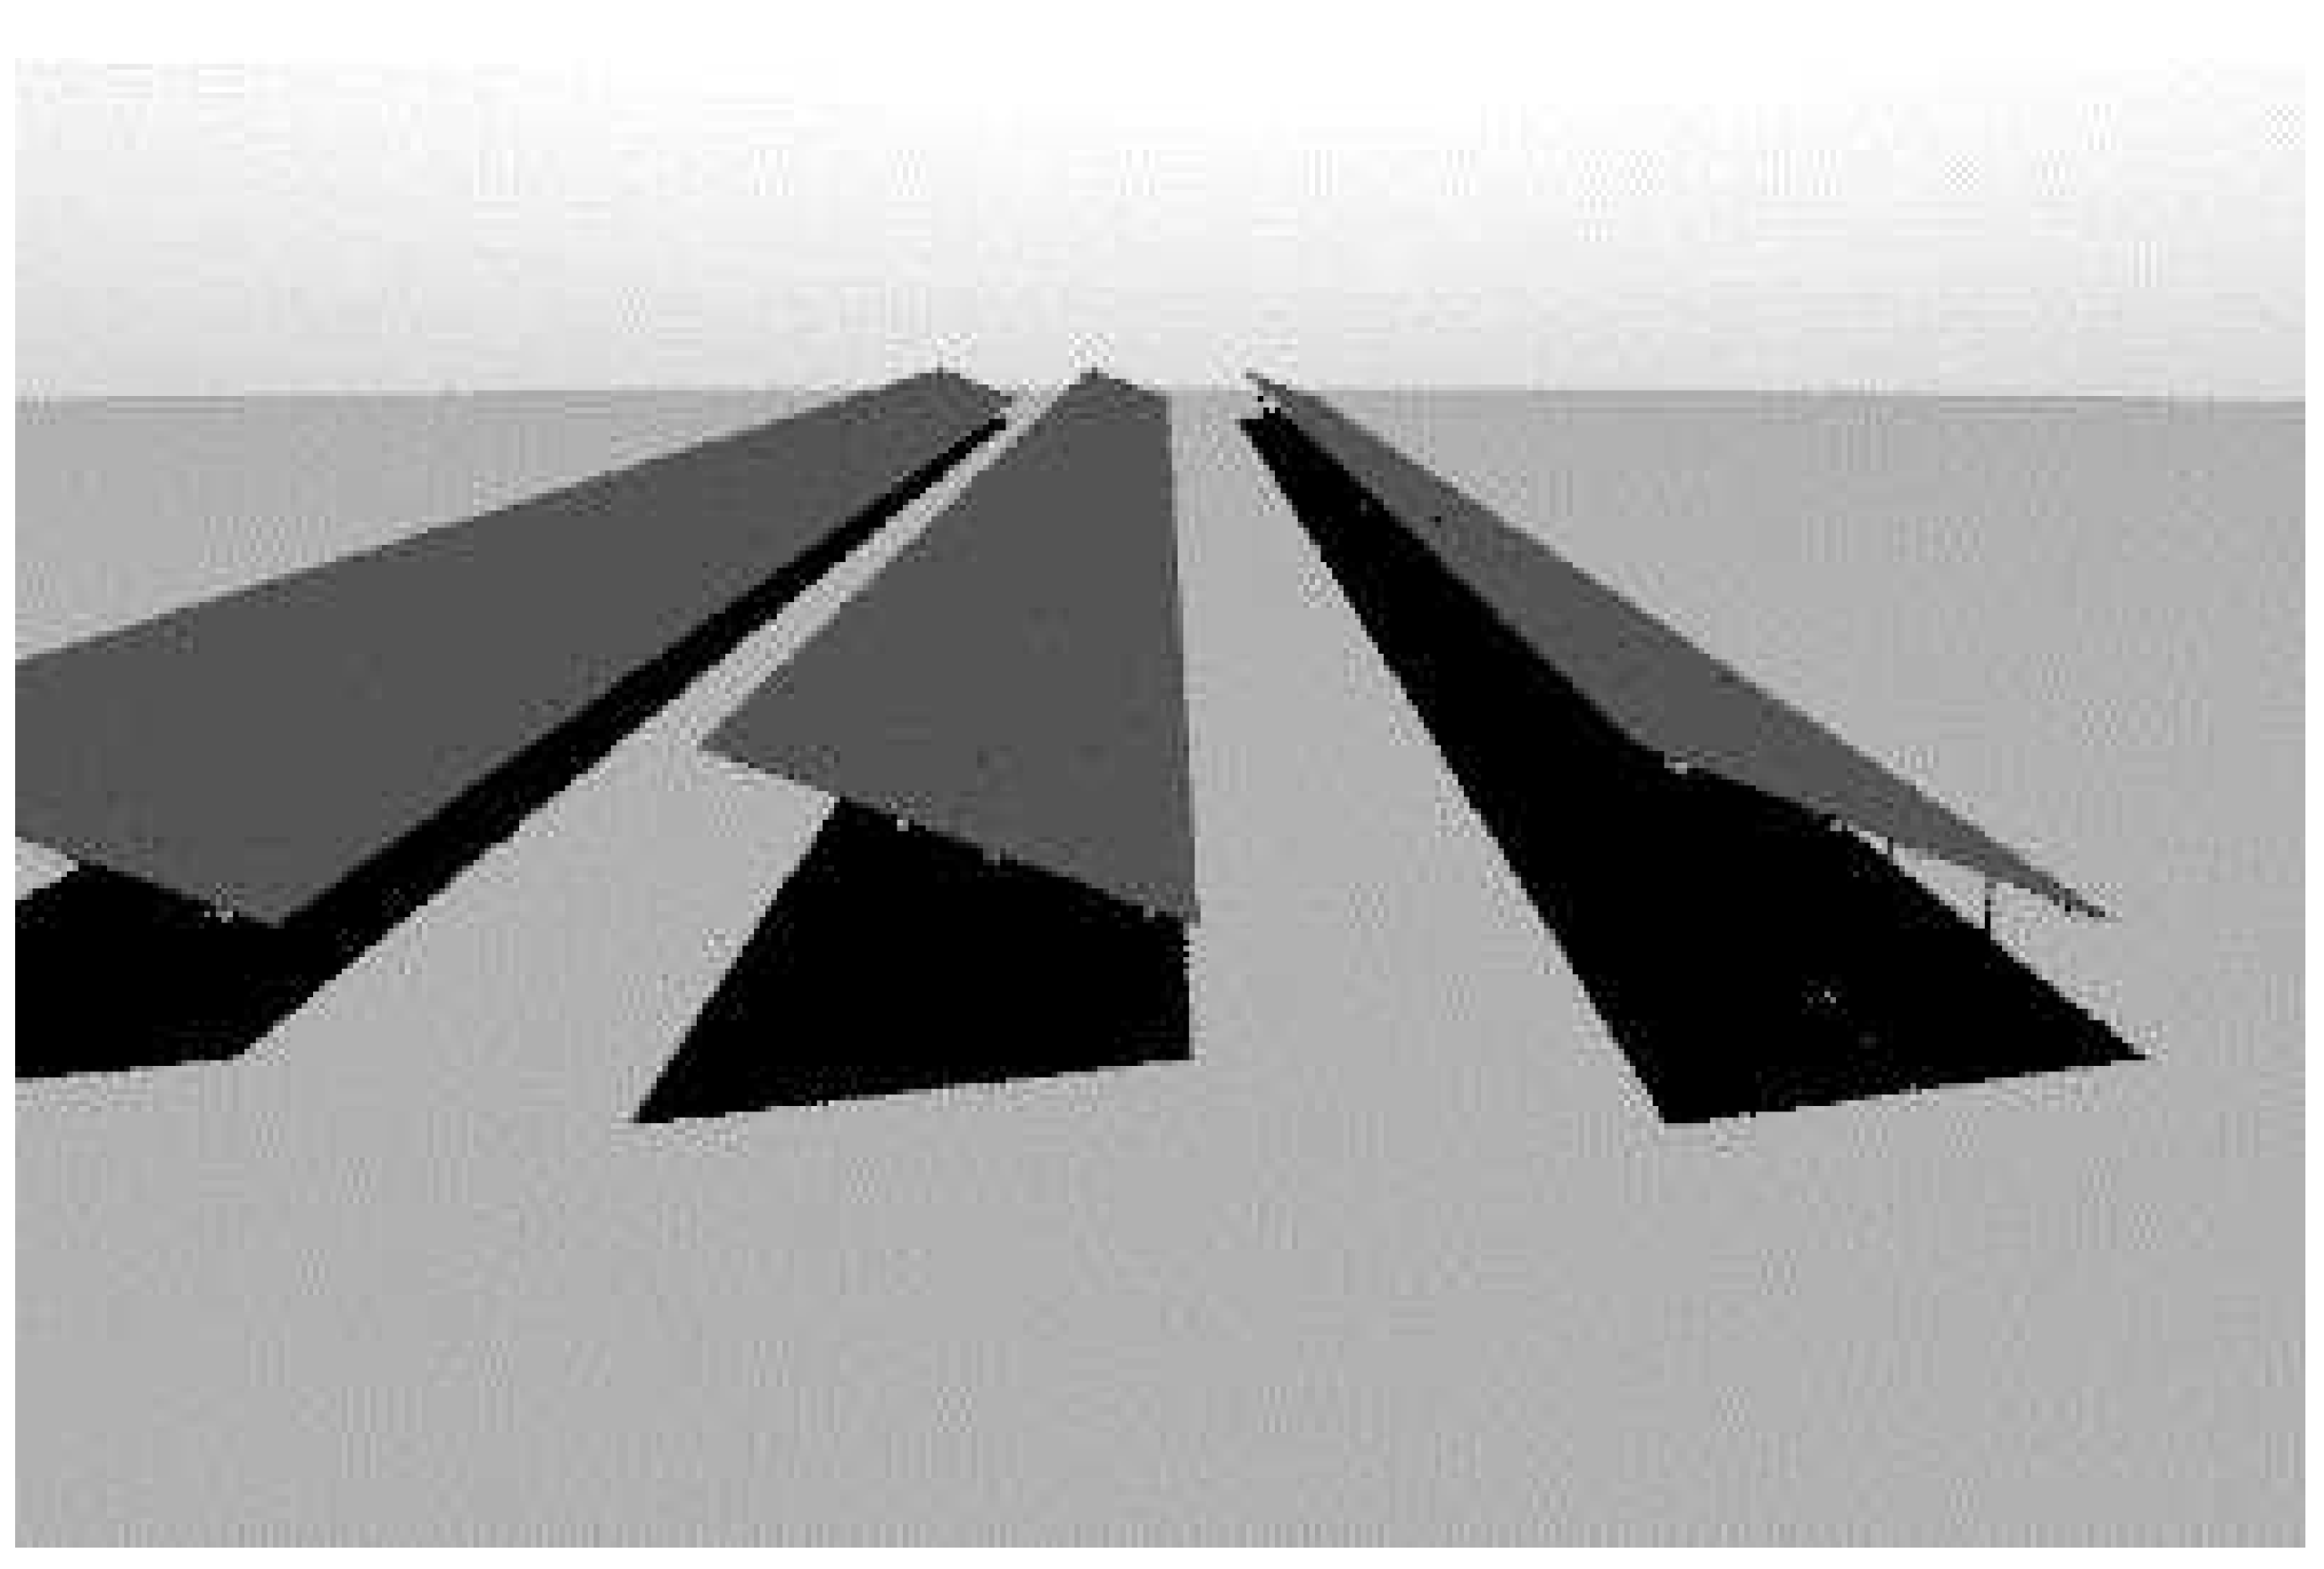
While conducting the optical ray-tracing simulation, we simulated the front and rear surface irradiances for the middle of the three rows to capture all the effects of the field layout. The three rows with panels loaded are shown in
Figure 6.
2.2. Optical Ray-tracing Simulation with Bifacial Radiance
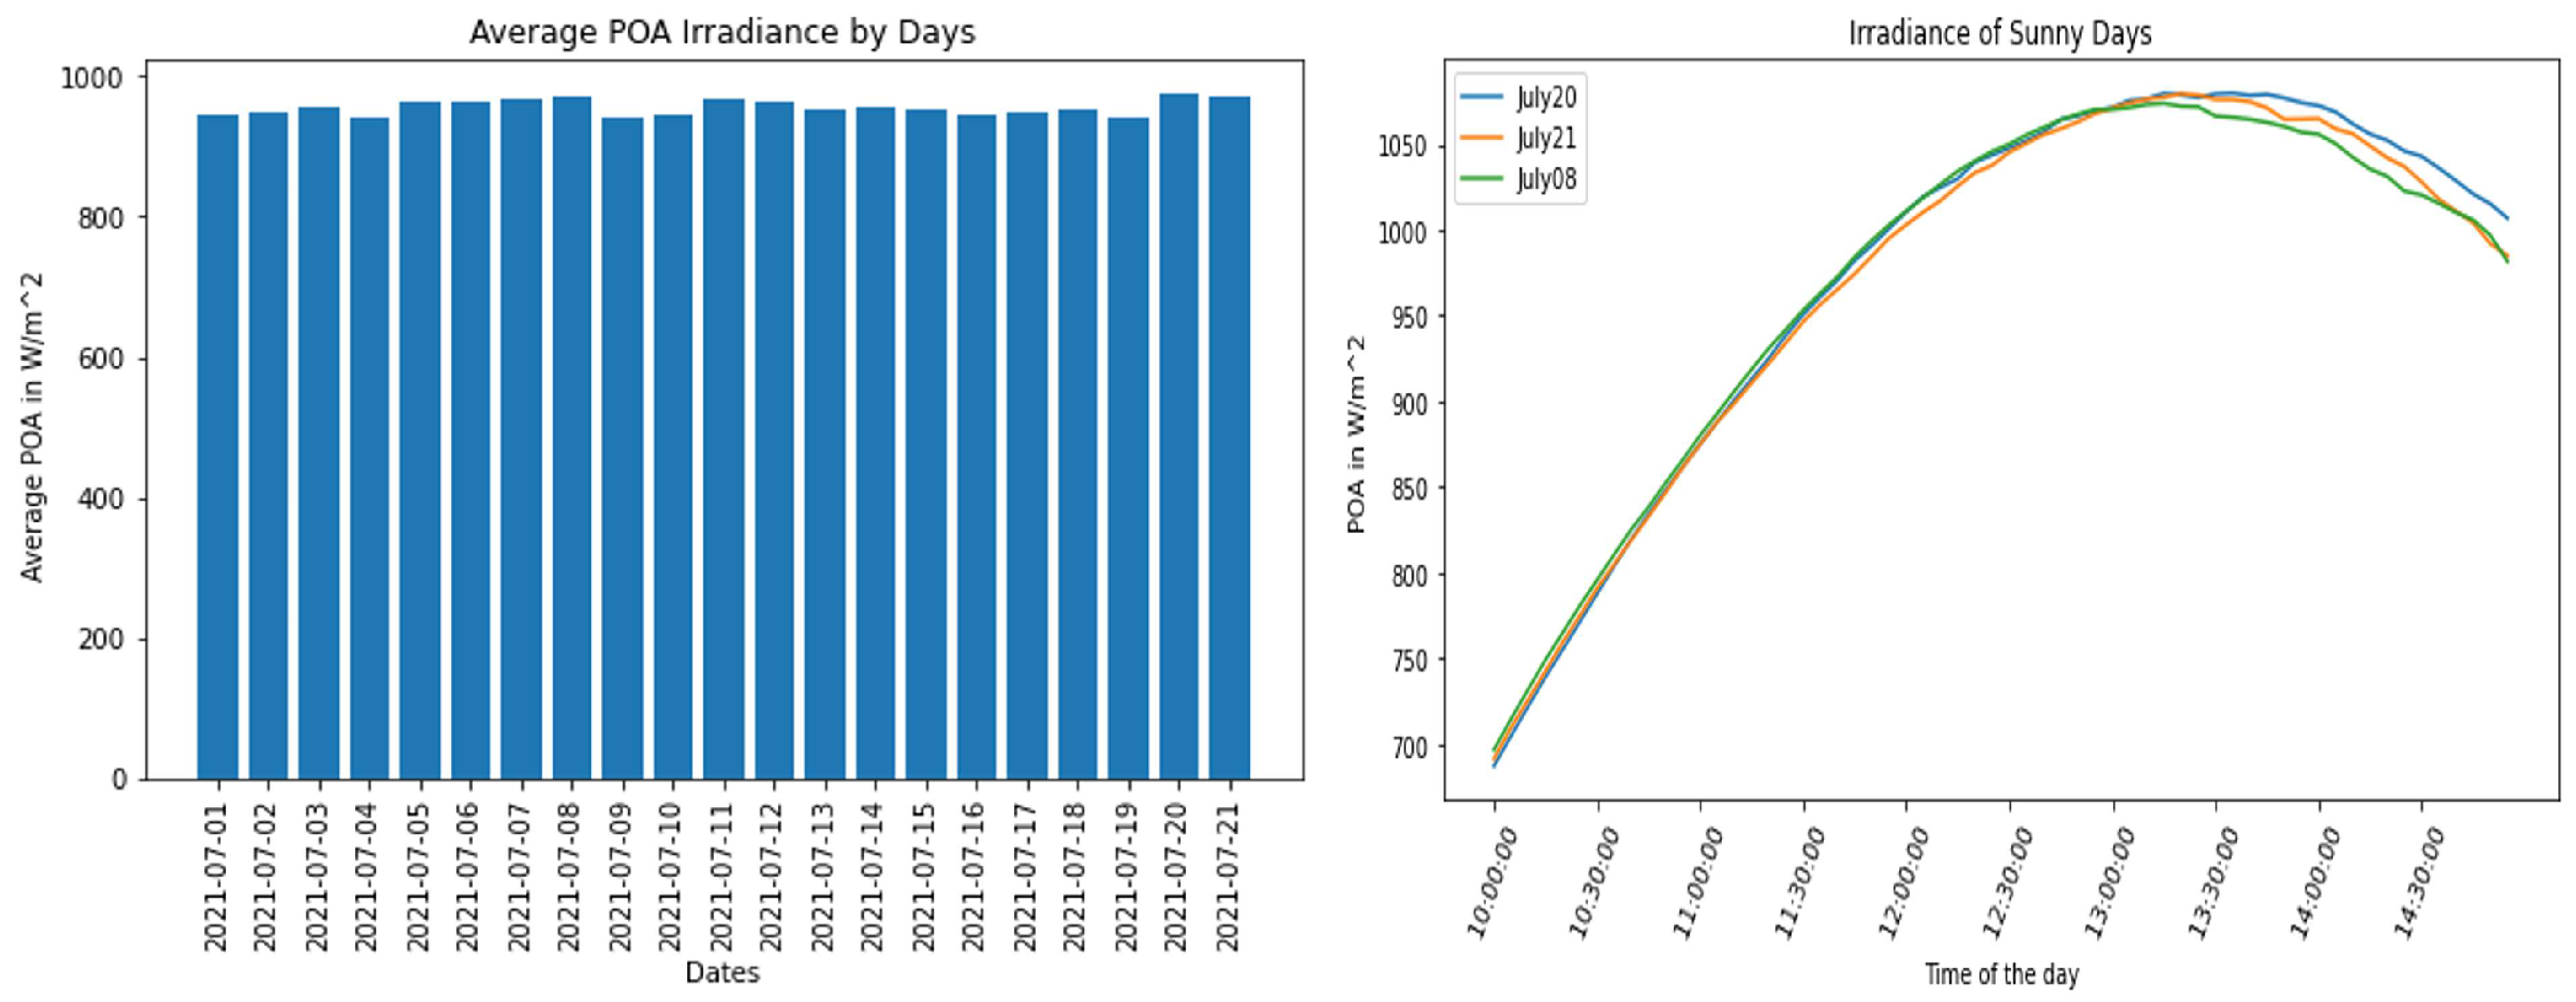
With the detailed radiance geometry in place, implementing the optical ray-trace simulation was the next step. From the available Plane-of-Array irradiance data available from the project owners for three weeks of July 2021 days, we chose to identify a clear-sky sunny day for the simulation.
Figure 7 shows how the sunny day is chosen based on the highest average daily irradiance.
We ran a full-row simulation with the existing field installation parameters of tilt, height, and pitch. The albedo was approximated to be 0.2, a typical value for standard ground.
Figure 8 provides the high-level array design parameters whose influence on bifacial performance was later analyzed. The hub height and pitch are measured in meters, and the tilt is measured in degrees throughout the study.
To implement the optical raytracing simulation, We ran the bifacial radiance gendaylit hourly simulation routine for the whole row for the daytime hours of the sunny day, we obtained the front and rear irradiance for all the 114 module positions from the west to the east for the south-facing (azimuth = 180°) array.
Figure 8.
Typical field installation design parameters.
Figure 8.
Typical field installation design parameters.
We extended the analysis to measure the sensitivity of the system performance based on different installation parameters. While there are previous studies on such sensitivity analysis [
9], we explored the impact of the parameters in the presence of actual mounting and racking structures. While its consistency with the existing knowledge would validate the approach, the observed sensitivities would tell us how the presence of the racking and mounting structures influence the relationship trajectories for a specific scenario of a planned or built PV array. In this research task, we varied the installation parameters of tilt, height, and pitch. In each instance, we measured the:
Front irradiance
Rear irradiance
Total irradiance
Back/Front ratio
Non-uniformity
The total irradiance
and the non-uniformity
are measured by the following equations.
where,
,
, and
are the total, front and rear irradiances respectively.
and are the maximum and minimum irradiances measured among the different measuring points along the PV module. The non-uniformity phenomenon is prevalent in tilted installation situations and is a cause of cell-level mismatch, resulting in reduced output at the module level.
We ran the bifacial radiance
gendaylit hourly simulation for the whole row for the given hours of the sunny day, we obtained the front and rear irradiance for all the 114 module positions from the west to the east for the south-facing array. With a complete row analysis with eight sensors in both vertical and horizontal directions for each of the 114 2-up modules, we had those measures at the module sensor level along the whole row. For the parameters in interest, the measurements for 64 sensors are averaged to get module-level measures. Since characterizing the irradiance model is the goal of the study, we overlooked the cell-level electrical mismatch loss, which accounts for 1-2% of electrical yield [
12] by such averaging at the module level. Reporting the sensitivity enables us to see the irradiance on collectors as a function of those site-specific parameters.
3. Results and Discussion
This section provides the observations from the simulation outcomes and discusses their scientific explanations in the context of the on-site deployment.
3.1. Impact of Mounting and Racking Structures
Since we simulated the middle row of the three rows we created in the scene geometry, the first observation of interest would be the shading contributed by the mounting and racking structures on the rear surface of the modules. Running the optical ray-tracing simulation for the with-racking and without-racking scenarios, we observe the phenomena shown in
Figure 9 for different hours of the day. This representation also validates the edge or boundary effect experienced by the extreme East and West side modules of the row in the morning and evening hours, respectively, when they demonstrate a high back-to-front ratio due to the horizontal irradiance hitting the rear surface. The edge effect also subjectively validates the methodology of incorporating the racking geometry for optical simulation.
For the quantification of shading caused by the racking and mounting structures, a better representation came from plotting the average shading factor for each module, as shown in
Figure 10. In many cases, shading on the rear surface exceeds 30%.
The shading spikes at seemingly patterned intervals shown in
Figure 10 can be explained by the mounting and racking structure commensurate with the mounting legs at regular intervals. Low shading for the east panel in the morning and the west panel in the evening also validates the simulation for the racking geometry.
3.2. Impact of Design Parameters
We, for this site-specific scenario, investigated how design parameters, including tilt, clearance height, row-to-row distance (termed pitch), and albedo influence the bifacial performance. This part of the work builds on the novelty of racking geometry incorporation, as researchers have done similar analyses without considering real-world racking and mounting deployments. We explored the sensitivity of the site design parameters in a situation where we have the field geometries captured in finer detail with racking and mounting structures integrated.
3.2.1. Influence of Tilt Angle as a Design Parameter
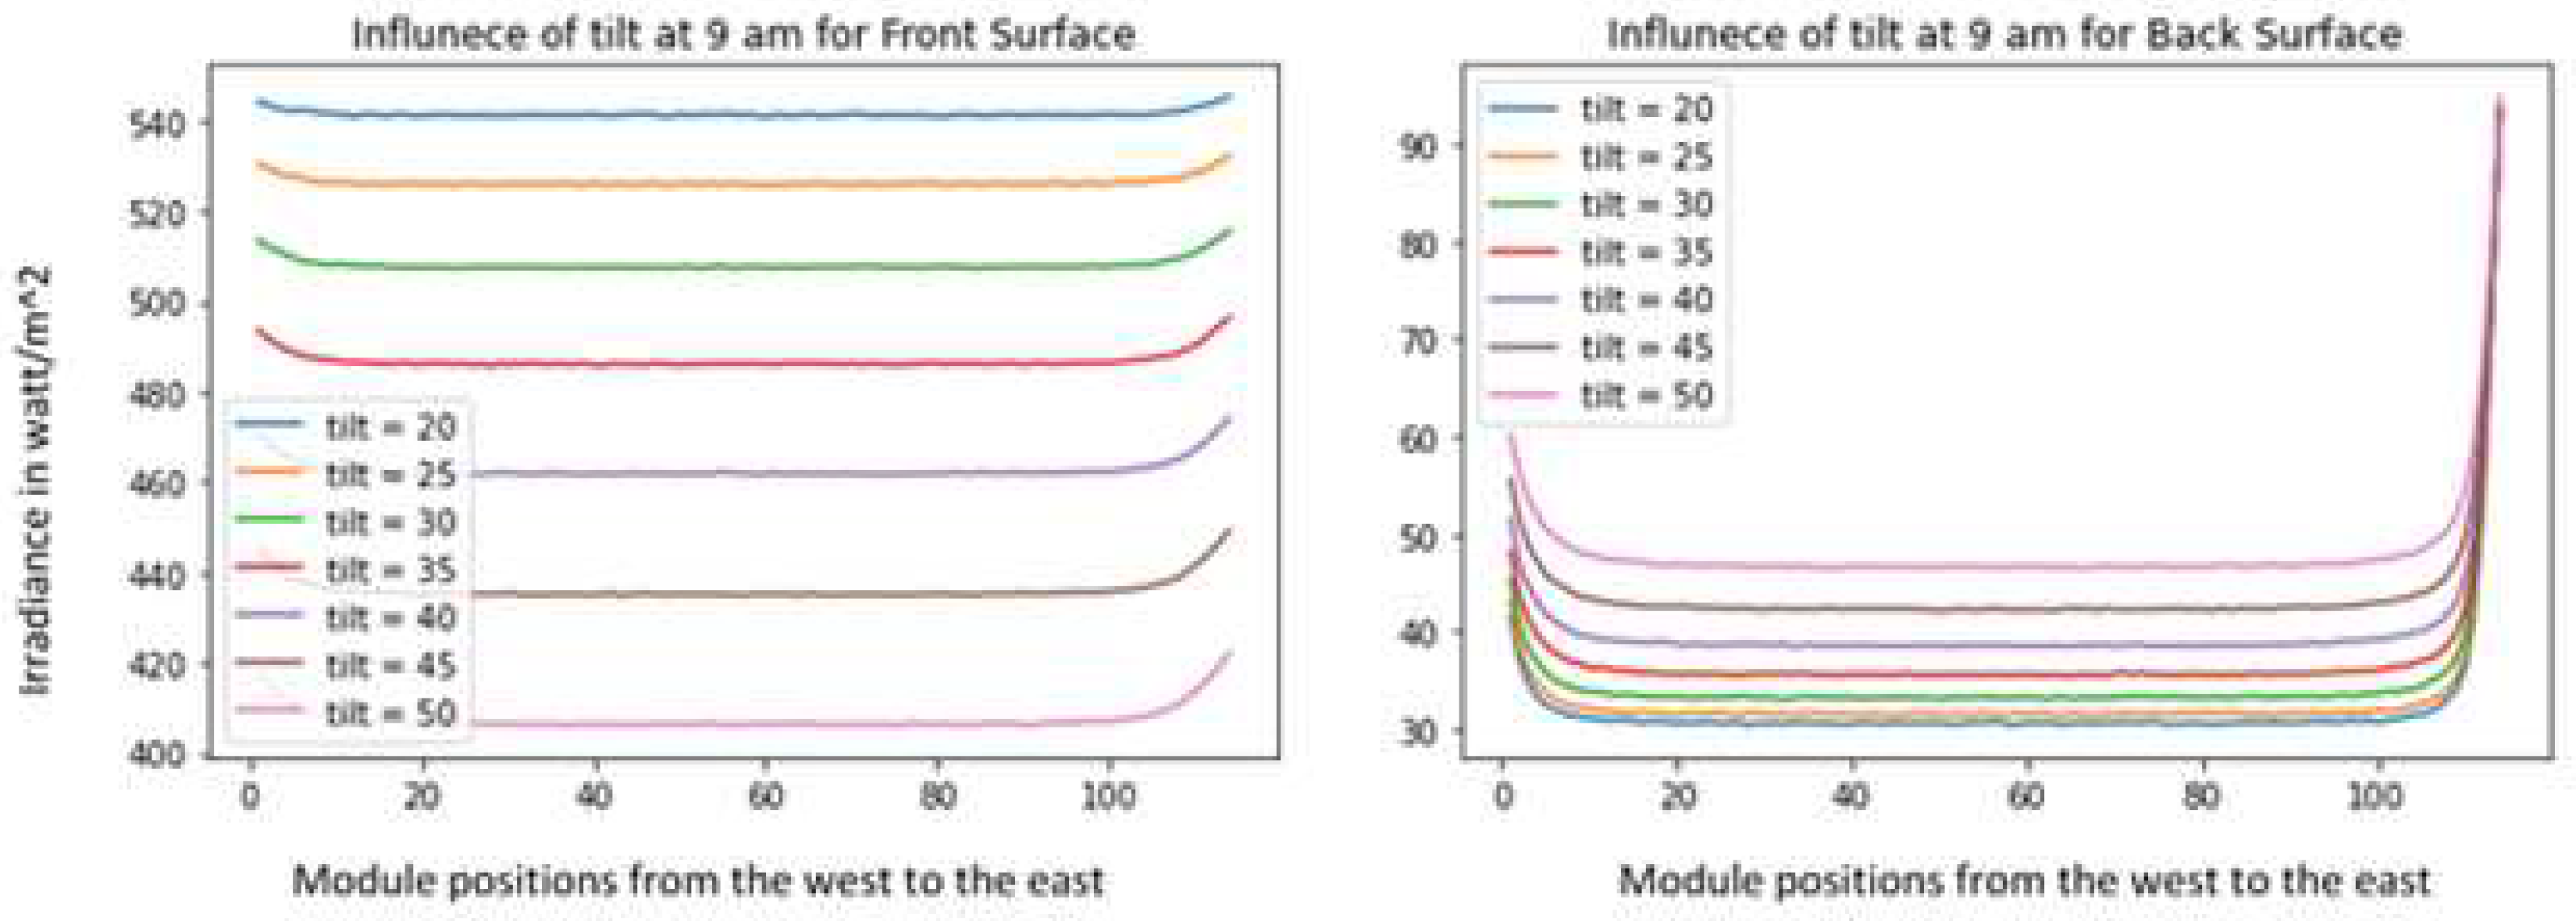
Although the field deployment we simulated is a fixed-tilt system, tilt is a major design parameter influencing the power yield of the array. Whereas the optimum tilt is typically chosen to maximize the direct normal irradiance (DNI) for the front surface of the module, it is observed that the rear surface benefits from the higher tilts because that allows more reflected rays to the bottom surface. The phenomenon was confirmed when we mapped the simulated front and rear surface irradiance at the reference project site for different tilt angles.
Figure 11 shows that whereas the field-deployed tilt of
is the optimum for front surface irradiance, higher tilt angles increase rear surface irradiance.
In most installations, however, the front surface irradiance greatly outweighs the rear surface contribution. Tilt and rear surface irradiance become more relevant for dual-use bifacial PV arrays with 1-axis or 2-axis tracking systems. We will likely see such systems growing applications like agrivoltaics and car charging stations.
It is to be noticed that the rear surfaces are significantly more prone to the edge effect as we see the extreme east panels of the row collect significantly higher (nearly 60% higher) irradiance in the morning hours. At the same time, this phenomenon is valid for the west panels during the evening hours as the sun shifts from the east to the west over the course of the day. Since the edge effect is only prominent for the first few modules in the row, it becomes essential for installations with smaller row sizes depending on their structural and electrical configurations.
3.2.2. Influence of Height as a Design Parameter
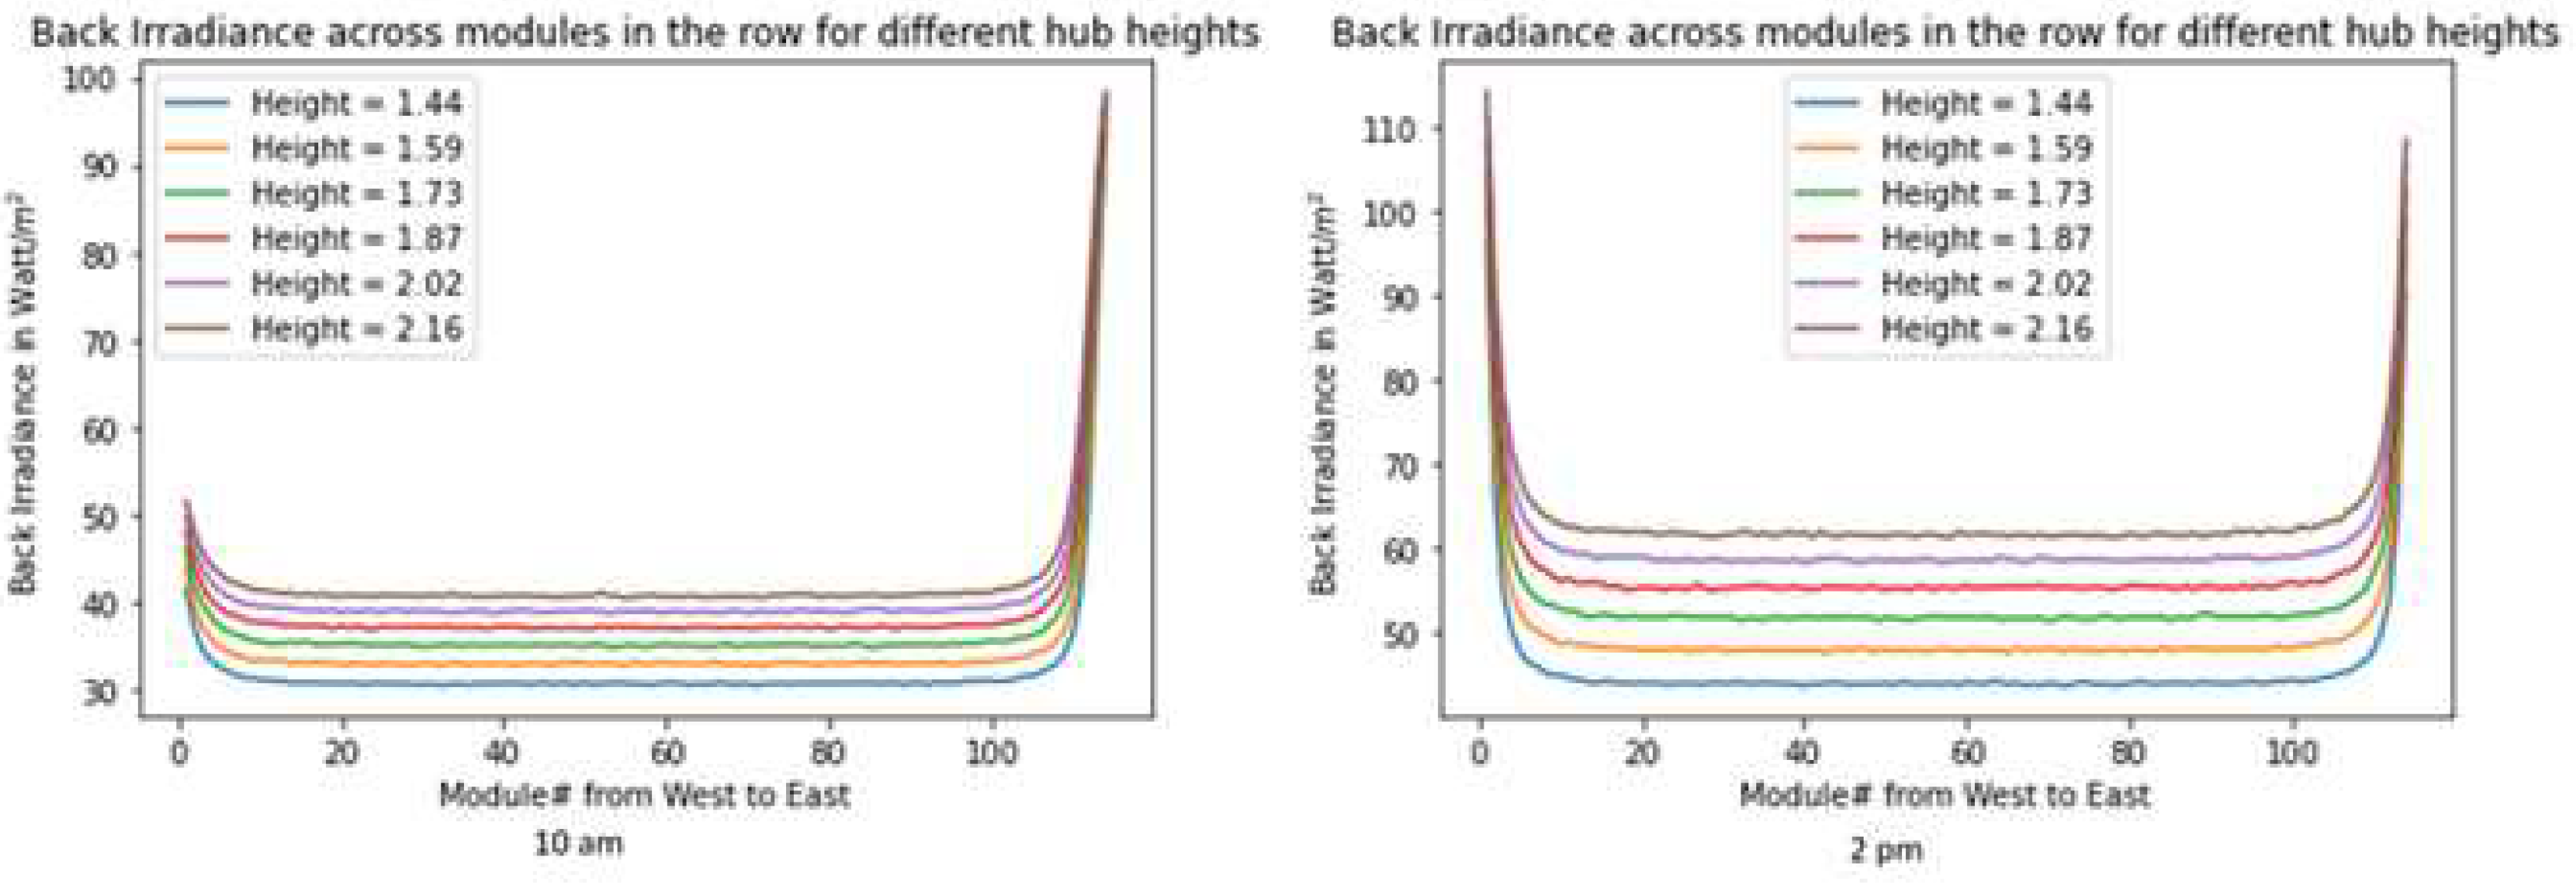
Since the mounting structures elevate the modules some distance above the ground, the clearance height or hub height plays a vital role in the bifacial performance of the array. While the impact of height on the front surface irradiance is minimal,
Figure 12 shows that height induces different degrees of impact on the rear surface irradiance depending on the sun’s position. For the long-row installation, the sensitivity is high for the mid-day hours. A 10% height increase may increase the average rear surface irradiance by about 15%. The rear irradiance gets asymptotic with increases in height. Doubling the clearance height yields about a 60% increase in rear surface irradiance collection. Since increasing the clearance height also involves more material for mounting structures, this site-specific sensitivity observation may play a vital role in the optimal design of bifacial PV arrays.
3.2.3. Influence of Pitch as a Design Parameter
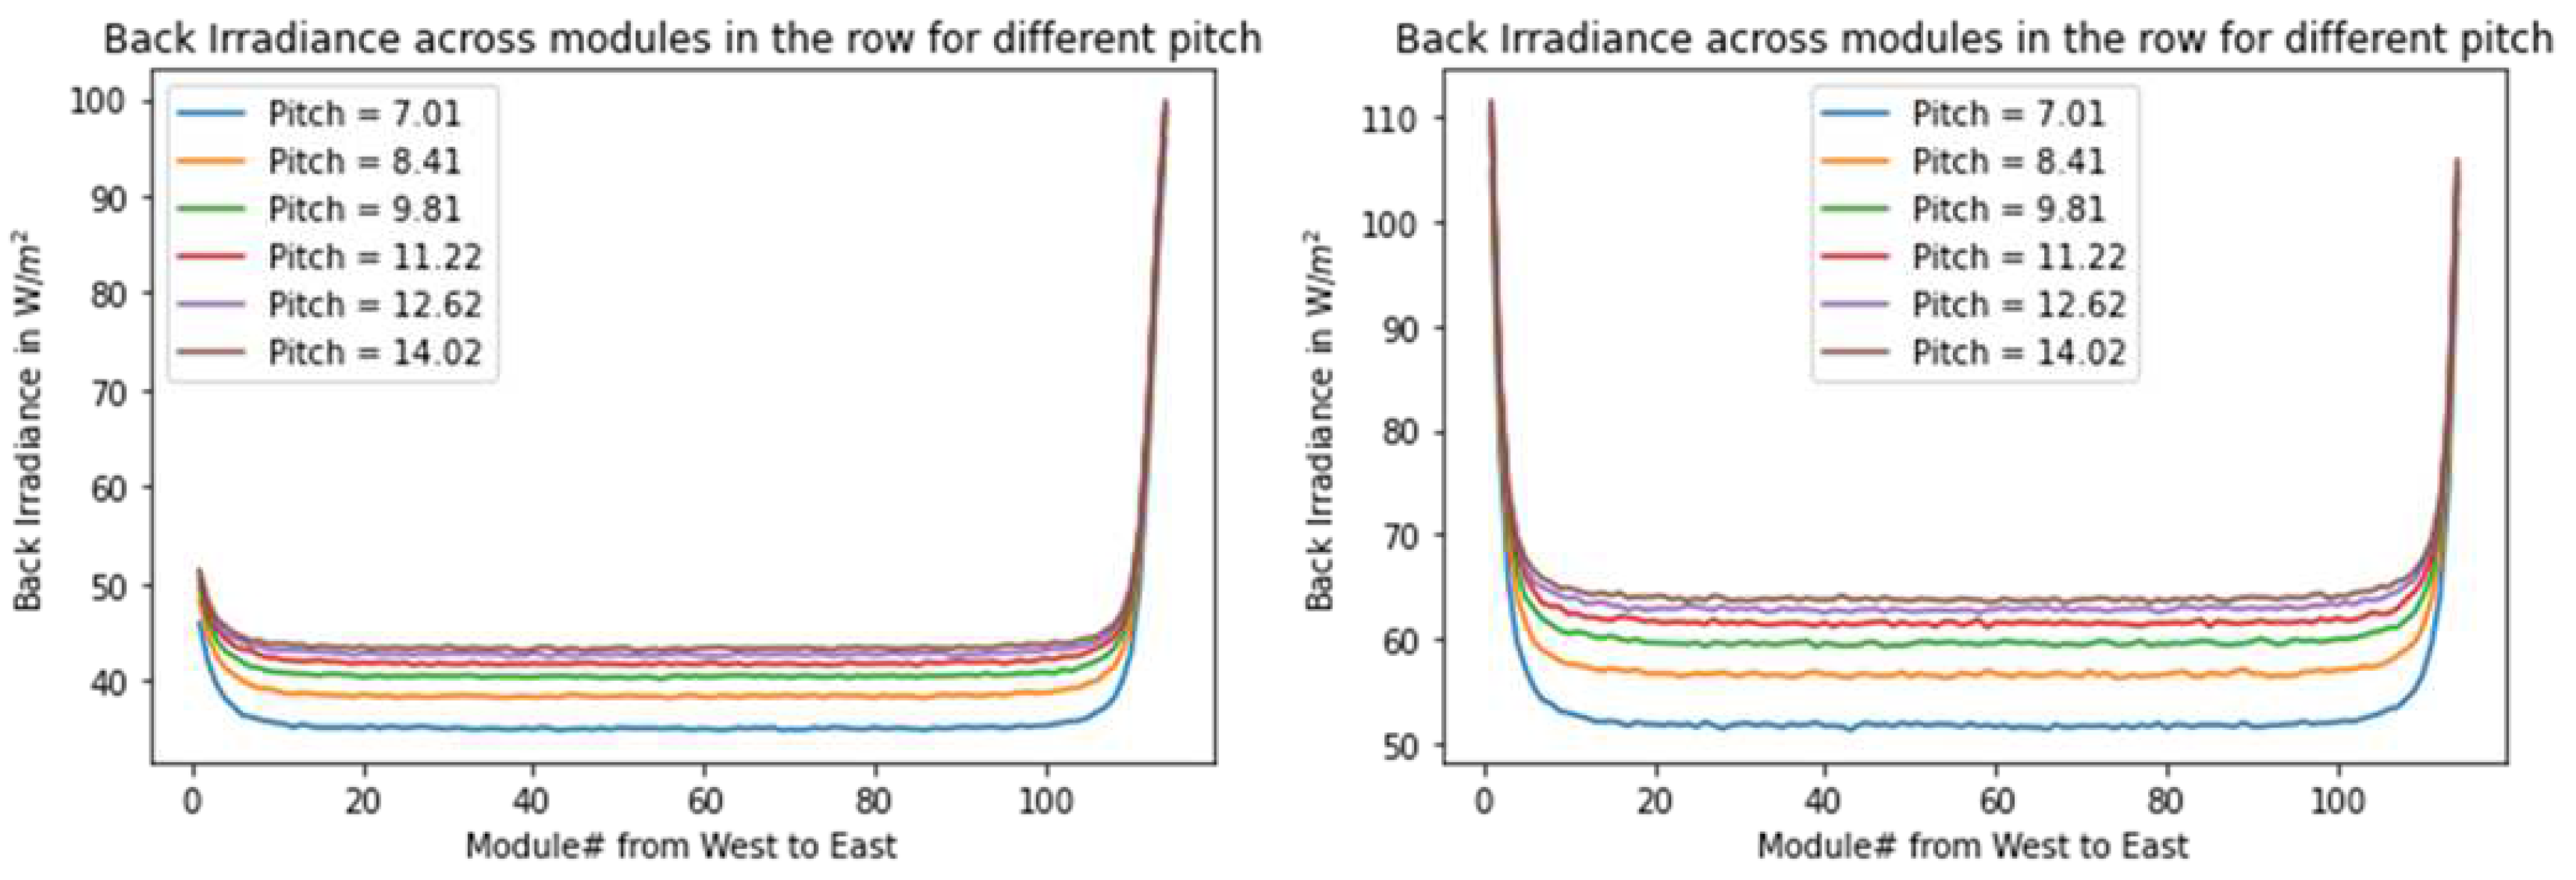
The pitch, defined as the row-to-row distance, is an important design parameter for bifacial PV performance. It is logically conceivable that more distance between rows eliminates shading effects from adjacent rows and provisions more rear irradiance through ground reflection.
Figure 13 shows the sensitivity of pitch on rear surface irradiance, where we observe a nonlinear response to pitch. A 20% increase in pitch will yield nearly an 18% gain in rear surface irradiance. The enhancement of pitch is, however, often restricted by the availability of land. By practice, the large arrays are usually designed with a pitch normalized with collector width. That way, the total yield of the PV plant is not compromised, and still, the design benefits can be obtained.
Figure 14 demonstrates that the back-to-front irradiance ratio is fairly sensitive to pitch. At the same time, non-uniformity seems to improve drastically till the pitch is increased to an extent.
Figure 14(b) shows the sensitivity of non-uniformity as the pitch varies for the field installation. 20% increase in pitch reduces the average non-uniformity by more than 10%. It also reveals that there is a threshold value for pitch for every practical deployment, beyond which the non-uniformity improvement saturates.
Figure 14.
(a) Back/front irradiance ratio at 2 pm (left) and (b) non-uniformity (right) with varying pitch
Figure 14.
(a) Back/front irradiance ratio at 2 pm (left) and (b) non-uniformity (right) with varying pitch
3.3. Consolidated Characterization of Design Parameters
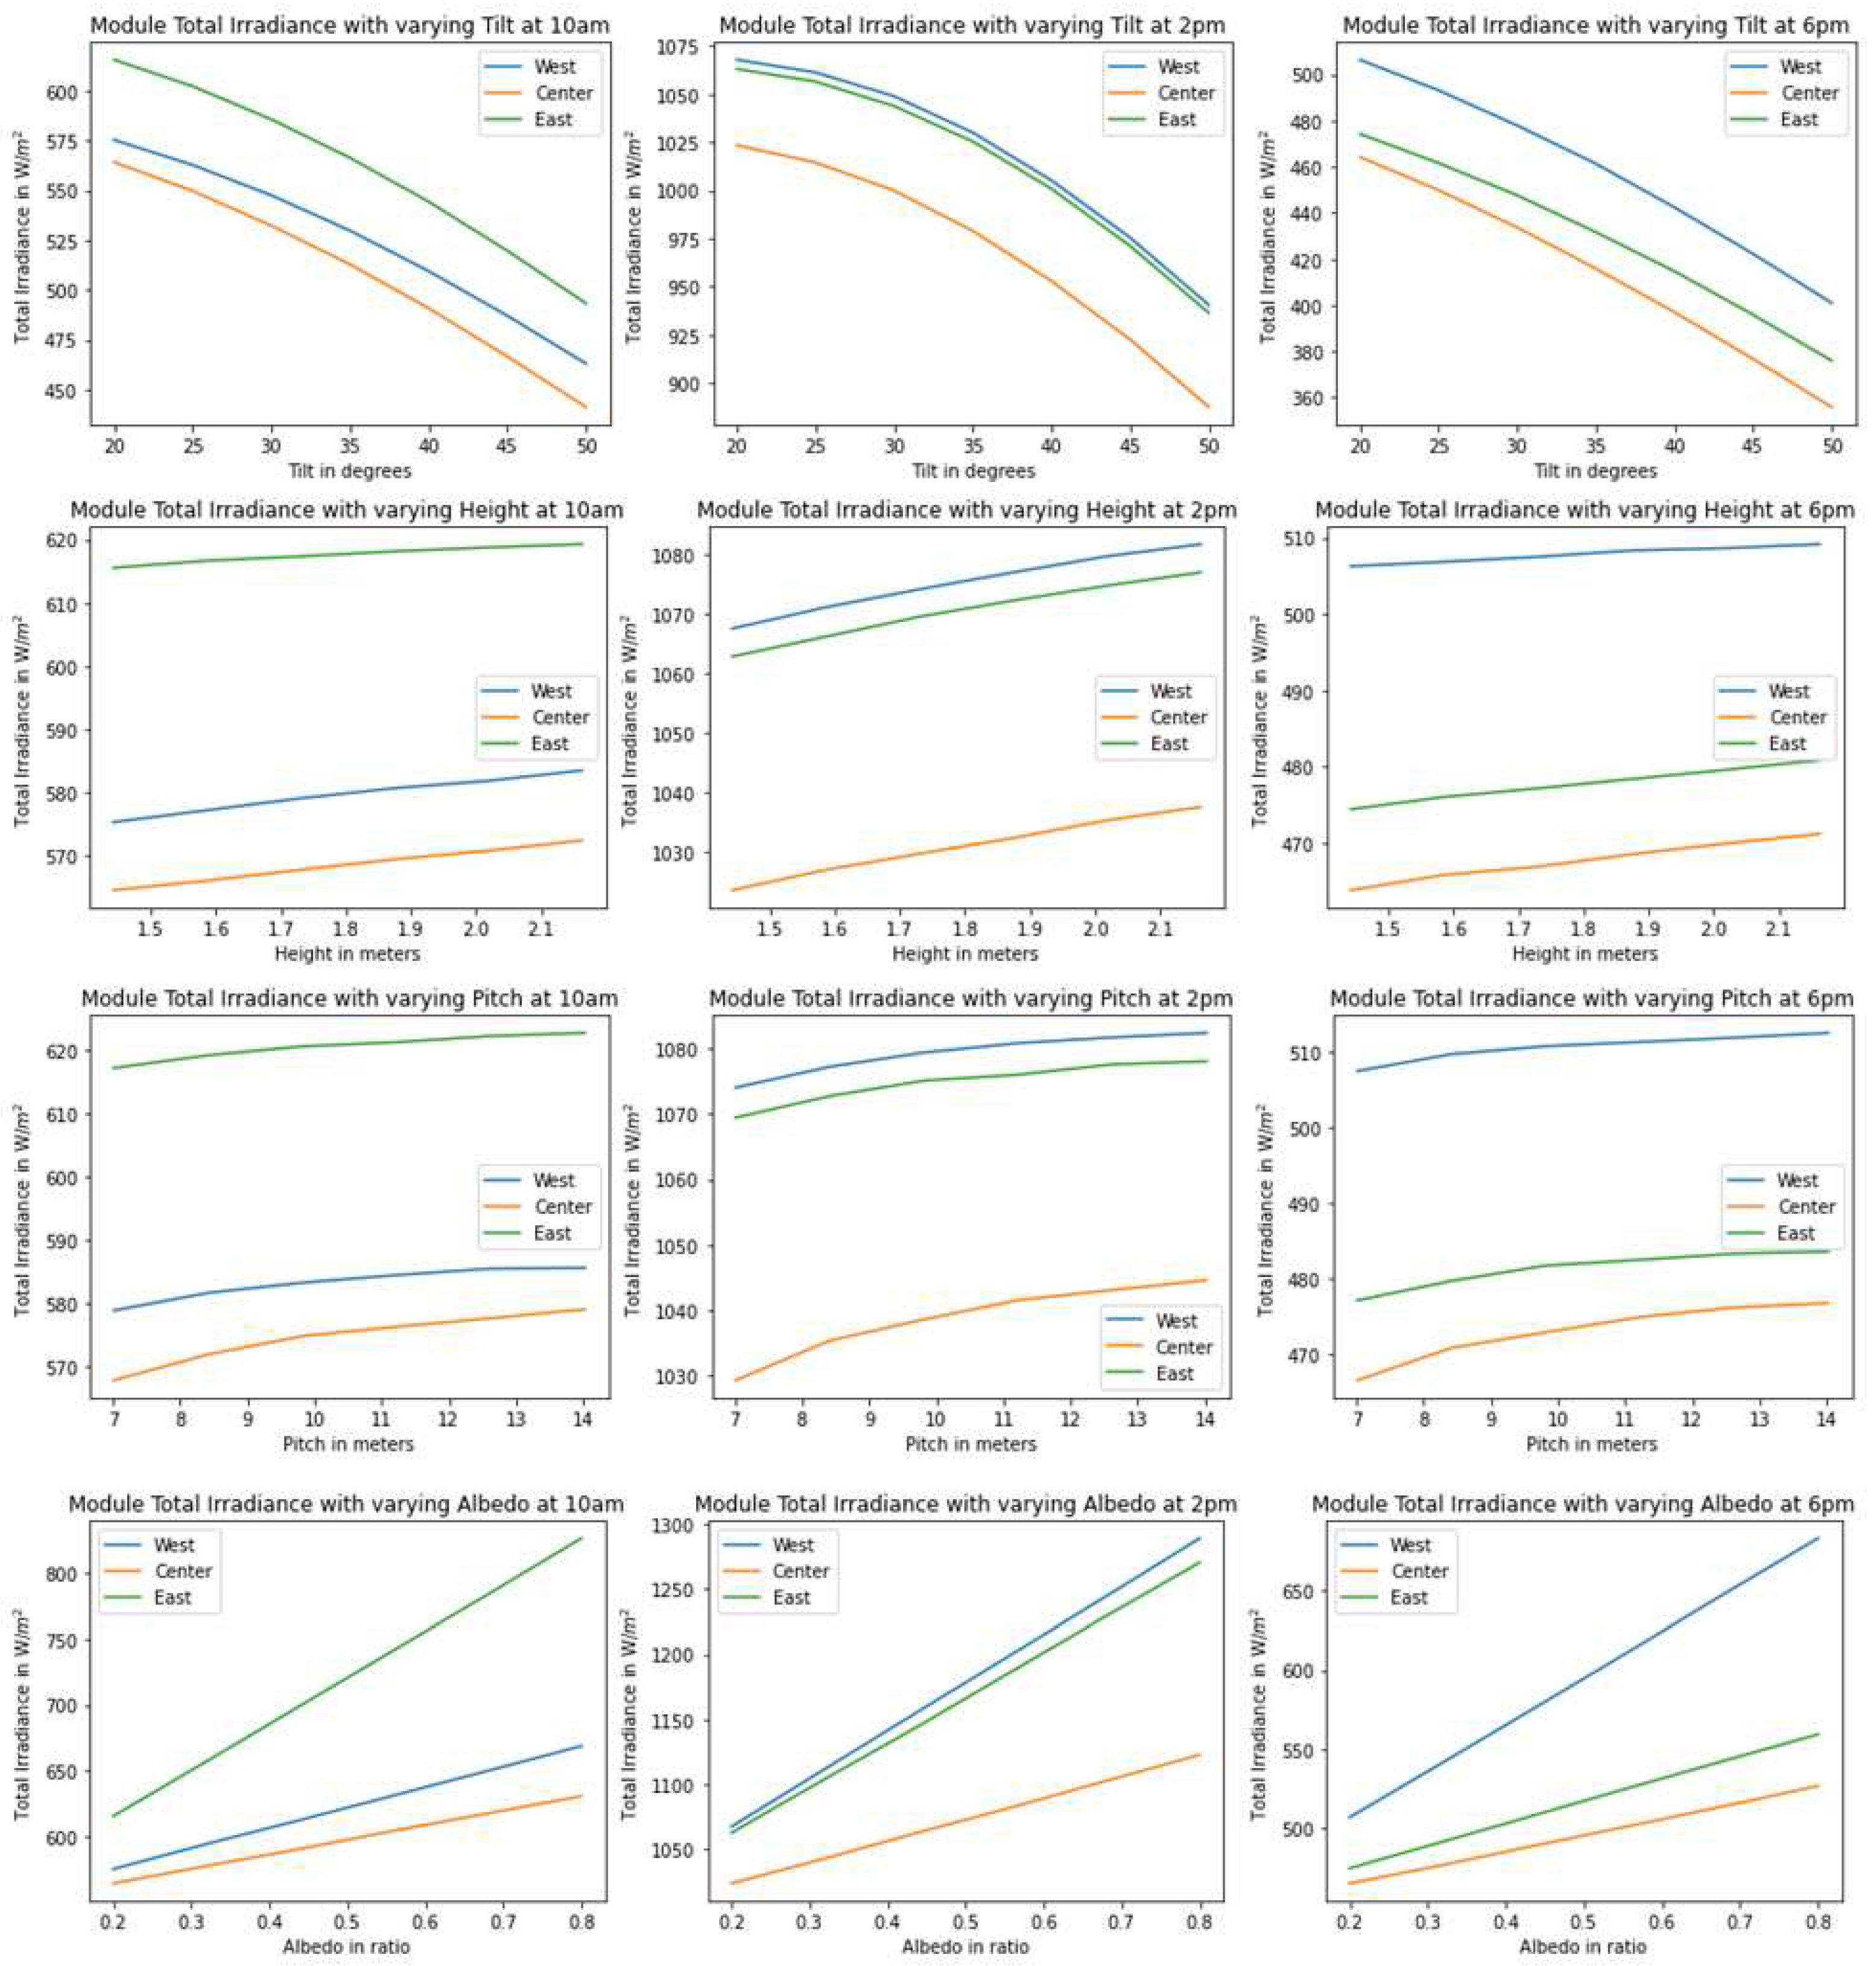
With the detailed simulation of the mounting and racking geometry, the study explored site-specific characterization of the design parameters that influence the rear surface irradiance performance of the bifacial PV array. Although no generalized deterministic equation can be derived to model rear surface irradiance as a tilt, height, and pitch function, the analysis paves the way for necessary function approximations based on site-specific as-planned or as-built design parameters. We pursued the characterization with respect to different module positions in the row and at different hours of the day. The detailed depiction in
Figure 15 reveals that the parameters maintain the logical consistency in their curve while the pattern evolved with the day’s progress.
The key takeaways are:
Tilt shows a slightly nonlinear relationship, especially for the central modules at the mid-day hours
The edge panels are more sensitive to tilt
Height gives a relatively linear relationship for total or rear irradiance. The height sensitivity for the edge panels is high.
Pitch shows a fragmented relationship with a steeper response for the immediate change. This can be very well explained by the fact that the rear surfaces of the modules could benefit from the shading elimination or ground reflections only up to a distance from their presence. Beyond a certain distance, the pitch’s sensitivity diminishes.
Albedo offers a linear relationship as expected, and hence, there is no need for function approximation.
For absolutely deterministic rear surface irradiance modeling for a module at a given site, the module’s position in the row and the time of the day would feature as predictors.
3.4. Function Approximation for Sensitivity of Design Parameters
This computational approach enables us to obtain characteristic curves for the tilt sensitivity for a particular module, identified by its position in the row and the hour of the day. We then attempted to define the sensitivity trajectory as ordinary functions. It is observed that for tilt, we could represent the radiations on the collectors as a function of tilt for a module position at some hour of the day with a second-order polynomial function. For instance, curve-fitting the total irradiance and the rear surface irradiance as a function of tilt are shown for different module positions at an evening hour (6 pm) of a clear, sunny day in
Figure 16.
The coefficients of the fitted functions and their corresponding mean squared errors are shown in
Table 1. Although this is site-specific and obtained for module positions for particular hours of the day, the approach of this site-specific characterization would apply with an acceptable approximation for typical days of a season for a specific bifacial PV array site.
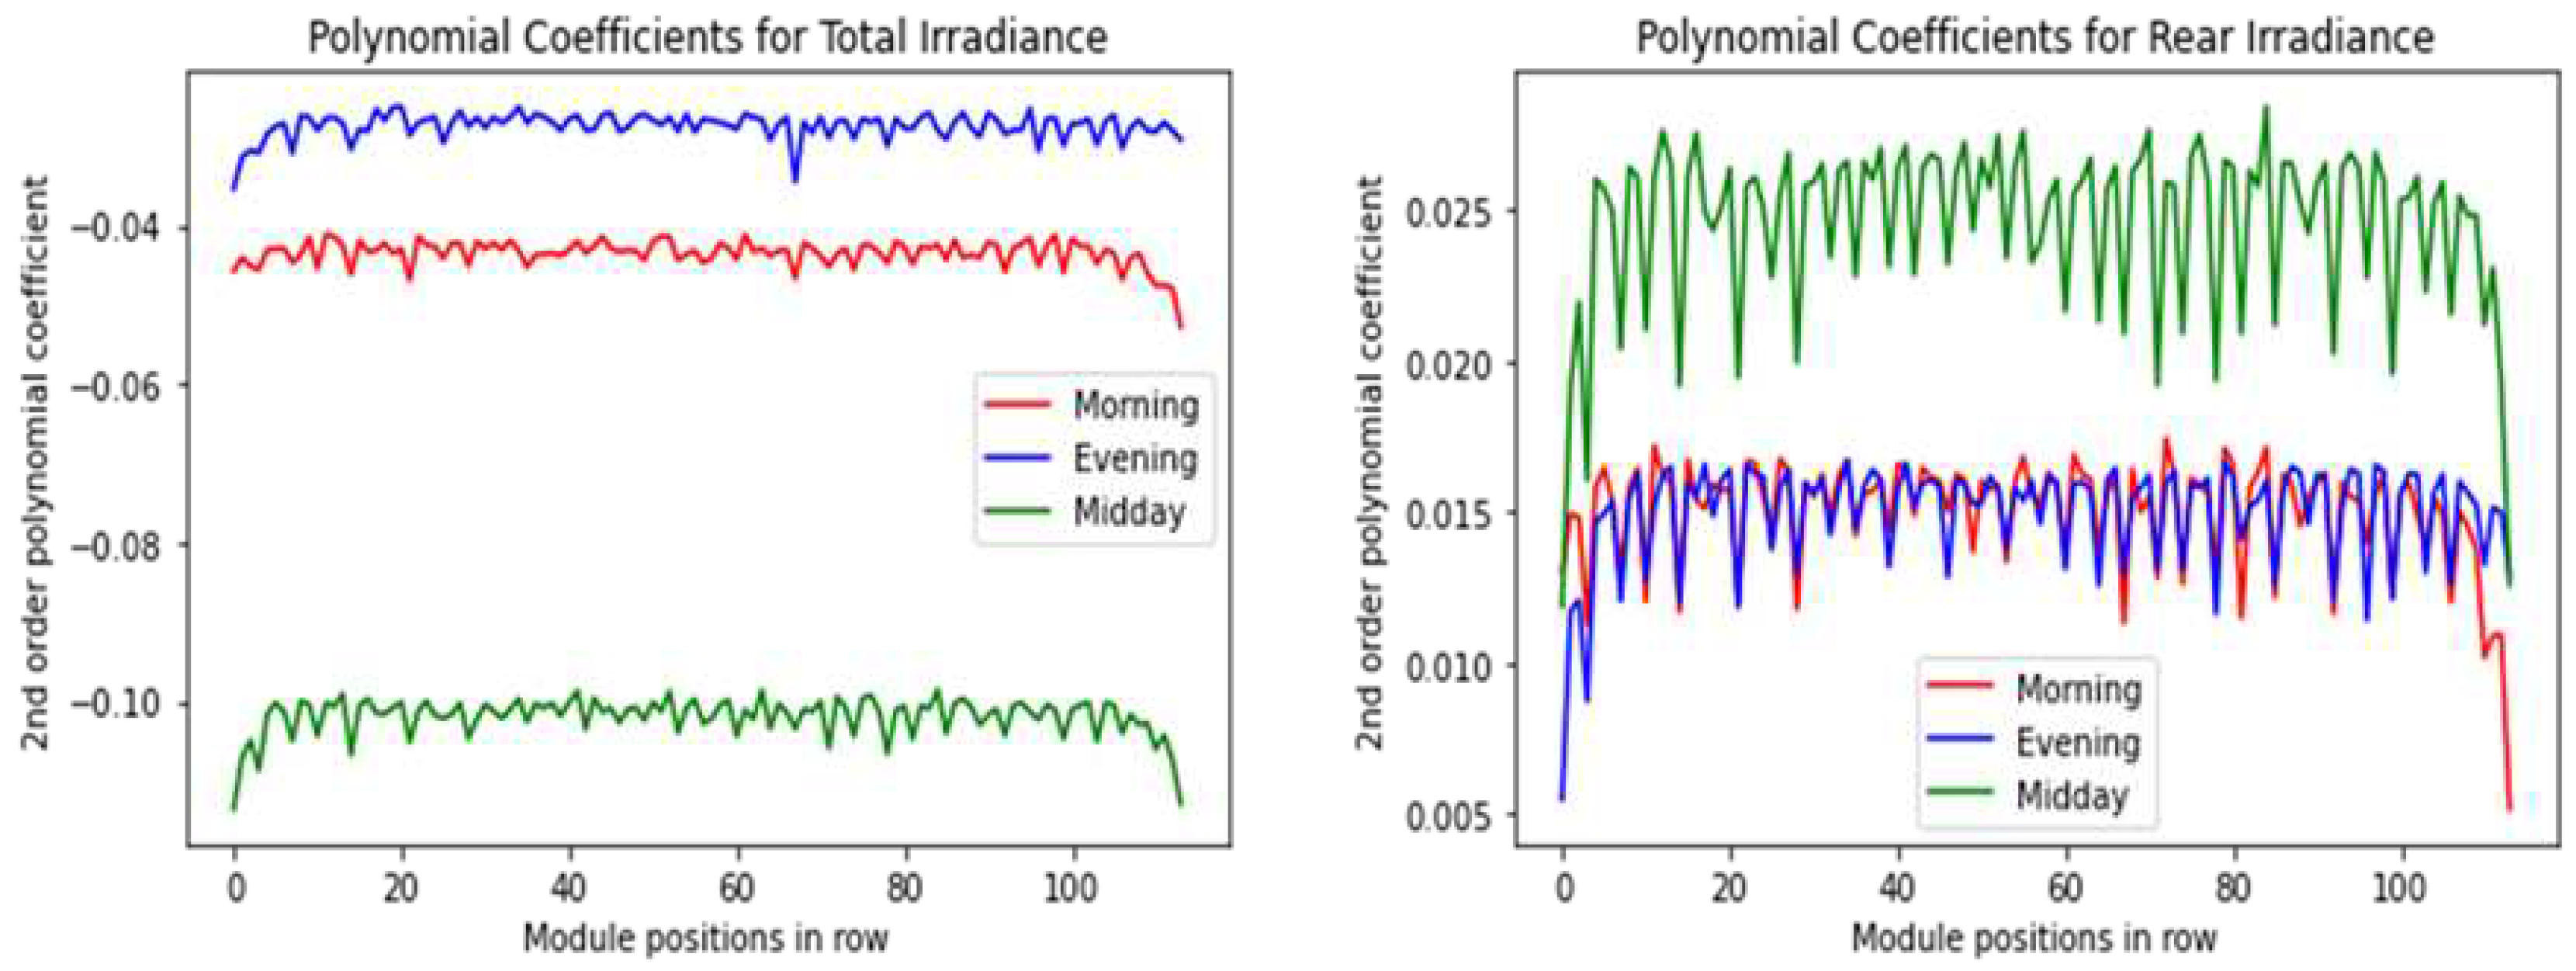
Since the characterization is specific to an hour of the day and module positions in the row, it logically leads to investigating how the function, defined by the coefficients, changes with the variation of those two variables. Looking at the variation of module positions for different hours of the day, we notice that the pattern is heavily influenced by the structure’s legs spaced at regular intervals. Apart from the extreme edge panels, the variation, however, is minimal. On the contrary, the hour of the day evidently influences the function coefficients. Both phenomena are observed in
Figure 17.
We then investigated how the function coefficients move over the hours of the day. The change in 2nd order coefficient for the total and rear irradiances are seen to take a concave and convex shape, respectively, as shown in
Figure 18. The figure also shows that this variation can again be captured with a second-order polynomial function approximation.
The module irradiances can be expressed as a function of tilt, whereas the coefficients of those functions can be expressed as a function of the hour of the day. The expression then becomes:
Since,
In this approach, integrating the mounting and racking structure of a field-deployed bifacial PV array, we can characterize the irradiance model of the site at the module level with significant precision. Having the functional equations derived for 12 to 14 hours of the day when the sun shines and capturing the seasonal variations with two (summer and winter) or four quarterly versions of them [
13] would enable to characterize a site’s sensitivity to installation parameters such as tilt, height, and pitch. Although the approach is demonstrated for tilt in this work, a similar strategy may be followed to derive relationships with other installation parameters, such as height and pitch.
4. Applications and Future Work
Although our study simulated the real-world layout of a fixed-tilt bifacial PV array, the approach combining the integration of racking structure and optical raytracing simulations could be a general design guideline for both fixed-tilt and 1-axis tracking arrays. The sensitivity of tilt, height, and pitch could be helpful in the synergistic applications of bifacial PV systems, such as agrivoltaics [
14] carports with EV (Electric Vehicle) charging facilities since they are often required to accommodate increased height and pitch compared to commercially deployed ground-mounted utility-scale PV arrays. Representing the rear irradiance as a function of the design parameters in site-specific scenarios would enhance the predictability of the energy yield of the arrays. This may also help the utilities better manage the intermittency associated with the solar PV distributed energy resources as they often need to control or curtail the PV generation for grid stability. Such parametric models would help better integrate the solar PV plants, utility-scale energy storage systems, and the existing grid. The data-intensive approach pursued in the work leaves an opportunity to explore possibilities of machine learning or neural network model development for predicting the irradiance or even the power yield directly from the design and weather inputs. We aim to pursue that investigation provided further cooperation from the real-world field deployments can be obtained.
5. Conclusions
While most of the existing scholarly work investigated small-scale experimental test beds, this work studied a commercially operating utility-scale deployment to explore the bifacial PV performance modeling challenge. The full-scale implementation of mounting and racking geometry and analyzing its impact on an entire row of modules in the array is the novel approach contributed by the work. The context-incorporated sensitivity of the impact of installation parameters sheds light on how parameters such as tilt, height, and pitch can become generally relevant for design optimization of fixed-tilt or 1-axis tracking systems. The demonstration of approximating irradiance as a function of design parameters and hour of the day paves the way for site-specific models. This practice can potentially advance the bifacial PV industry. With bifacial PV dominating the present and future market mix of solar PV deployments, even minutely incremental improvements in design practices can make a significant impact on the global scale of solar photovoltaic energy output.
Author Contributions
Conceptualization, S.A. and T.D.; methodology, S.A.; software, S.A. and I.Z.; validation, S.A., and I.Z.; formal analysis, S.A.; investigation, T.D.; resources, T.D.; data curation, S.A.; writing—original draft preparation, S.A.; writing—review and editing, S.A.; visualization, S.A.; supervision, T.D.; project administration, T.D.; All authors have read and agreed to the published version of the manuscript.
Funding
This research received no external funding.
Informed Consent Statement
Not applicable.
Data Availability Statement
The data and code could be made available upon request placed to the corresponding author.
Acknowledgments
We acknowledge Adapture Renewables Inc. for their technical cooperation in this research through sharing the site design and part of the field-measured data.
Conflicts of Interest
The authors declare no conflict of interest.
References
- 2018, I. ITRPV 2018 Report. International Technology Roadmap for Photovoltaic. PV Celltech Conference 2019, Penang Malaysia 2019, 2019.
- MacAlpine, S.; Deline, C.; Marion, B. Progress toward efficient bifacial rear irradiance models. 8th PV Performance Modeling and Monitoring Workshop, 2017, pp. 1–16.
- Ayala Pelaez, S.; Deline, C.; MacAlpine, S.; Marion, B.; Stein, J.S.; Kostuk, R.K. Comparison of bifacial solar irradiance model predictions with field validation. IEEE Journal of Photovoltaics 2019, 9, 82–88. [Google Scholar] [CrossRef]
- Capelle, T.; Araya, F.; Haffner, F.; Sayritupac, J.; Colin, H. A comparison of bifacial PV system modelling tools. 6th BifiPV Workshop, Amsterdam, NL, 2019, pp. 1–21.
- Marion, B.; Macalpine, S.; Deline, C.; Asgharzadeh, A.; Toor, F.; Riley, D.; Stein, J.; Hansen, C. A practical irradiance model for bifacial PV modules. 44th IEEE Photovoltaic Specialists Conference (PVSC), Washington, DC. IEEE, 2017, pp. 1537–1542. [CrossRef]
- Ayala Pelaez, S.; Deline, C. Bifacial_radiance: a python package for modeling bifacial solar photovoltaic systems. Journal of Open Source Software 2020, 5. [Google Scholar] [CrossRef]
- Ward, G.J. The RADIANCE lighting simulation and rendering system. 21st Annual Conference on Computer Graphics and Interactive Techniques, 1994, pp. 459–472. [CrossRef]
- Berrian, D.; Libal, J.; Klenk, M.; Nussbaumer, H.; Kopecek, R. Performance of bifacial PV arrays with fixed tilt and horizontal single-axis tracking: Comparison of simulated and measured data. IEEE Journal of Photovoltaics 2019, 9, 1583–1589. [Google Scholar] [CrossRef]
- Asgharzadeh, A.; Member, S.; Marion, B.; Deline, C.; Hansen, C.; Stein, J.S.; Toor, F. A sensitivity study of the impact of installation parameters and system configuration on the performance of bifacial PV arrays. IEEE Journal of Photovoltaics 2018, 8, 798–805. [Google Scholar] [CrossRef]
- Deline, C.; Ayala Pelaez, S.; MacAlpine, S.; Olalla, C. Bifacial PV system mismatch loss estimation and parameterization. 36th EU PVSEC, Marseille, France, 2019, pp. 1449–1453. [CrossRef]
- Ayala Pelaez, S.; Deline, C.; Stein, J.S.; Marion, B.; Anderson, K.; Muller, M. Effect of torque-tube parameters on rear-irradiance and rear-shading loss for bifacial PV performance on single-axis tracking systems. 46th IEEE Photovoltaic Specialists Conference Proceedings, Chicago IL, 2019. [CrossRef]
- Ayala Pelaez, S.; Deline, C.; MacAlpine, S.; Olalla, C. Bifacial PV system mismatch loss estimation. 6th BifiPV Workshop, Amsterdam, NL, 2019, p. 1.
- Mayer, M.J. Impact of the tilt angle, inverter sizing factor and row spacing on the photovoltaic power forecast accuracy. Applied Energy 2022, 323, 119598. [Google Scholar] [CrossRef]
- Dinesh, H.; Pearce, J.M. The potential of agrivoltaic systems. Renewable and Sustainable Energy Reviews 2016, 54, 299–308. [Google Scholar] [CrossRef]
Figure 1.
The market uptrend for bifacial c-Si PV [
1].
Figure 1.
The market uptrend for bifacial c-Si PV [
1].
Figure 2.
The site plan shows the monofacial module rows in green and bifacial module rows in blue.
Figure 2.
The site plan shows the monofacial module rows in green and bifacial module rows in blue.
Figure 3.
(From top left, clockwise) (a) The unit of the mounting structure showing support legs, longitudinal racking bars, and four horizontal struts (b) The side view of the 2-up module arrangement on the rack (c) The technical key of a full 114x2 bifacial row.
Figure 3.
(From top left, clockwise) (a) The unit of the mounting structure showing support legs, longitudinal racking bars, and four horizontal struts (b) The side view of the 2-up module arrangement on the rack (c) The technical key of a full 114x2 bifacial row.
Figure 4.
Radiance ray trace generated angular view (left) and side view (right) of a row of the field-deployed array, showing the structure geometry.
Figure 4.
Radiance ray trace generated angular view (left) and side view (right) of a row of the field-deployed array, showing the structure geometry.
Figure 5.
Three adjacent rows (two of them shown without panels to demonstrate the detailed racking geometry modeled for Radiance simulation).
Figure 5.
Three adjacent rows (two of them shown without panels to demonstrate the detailed racking geometry modeled for Radiance simulation).
Figure 6.
The three full rows for irradiance simulation of the field deployment.
Figure 6.
The three full rows for irradiance simulation of the field deployment.
Figure 7.
Clear-sky Sunny Day Identification.
Figure 7.
Clear-sky Sunny Day Identification.
Figure 9.
The average rear surface irradiance for different module positions with and without the mounting and racking structure during morning, midday, and evening hours
Figure 9.
The average rear surface irradiance for different module positions with and without the mounting and racking structure during morning, midday, and evening hours
Figure 10.
The rear surface shading at different hours of the day
Figure 10.
The rear surface shading at different hours of the day
Figure 11.
Influence of tilt angles on front and rear surface.
Figure 11.
Influence of tilt angles on front and rear surface.
Figure 12.
Influence of height on back surface irradiance at different hours
Figure 12.
Influence of height on back surface irradiance at different hours
Figure 13.
Impact of pitch on rear surface irradiance at 9 am (left) and 2 pm (right)
Figure 13.
Impact of pitch on rear surface irradiance at 9 am (left) and 2 pm (right)
Figure 15.
Consolidated characterization of design parameters tilt, height, pitch, and albedo for different module positions and different hours of the day
Figure 15.
Consolidated characterization of design parameters tilt, height, pitch, and albedo for different module positions and different hours of the day
Figure 16.
The 2nd order polynomial function fitting for east (top), center (middle), and west (bottom) panels at 6 pm of a sunny day where the total (left) and rear (right) irradiances are expressed as a function of tilt
Figure 16.
The 2nd order polynomial function fitting for east (top), center (middle), and west (bottom) panels at 6 pm of a sunny day where the total (left) and rear (right) irradiances are expressed as a function of tilt
Figure 17.
2nd order polynomial coefficient for different module positions at different time categories of the day
Figure 17.
2nd order polynomial coefficient for different module positions at different time categories of the day
Figure 18.
Variation in 2nd order coefficient for different hours of the day and their fitted curve for total (left) and rear (right) irradiance
Figure 18.
Variation in 2nd order coefficient for different hours of the day and their fitted curve for total (left) and rear (right) irradiance
Table 1.
Curve-fitting coefficients for evening hours of a clear summer day.
Table 1.
Curve-fitting coefficients for evening hours of a clear summer day.
| Case |
Case Description |
Coefficients [2nd order (xe-02), 1st order, intercept] |
Mean Squared Error |
| 1 |
Total Irradiance for East Panel |
[-2.92 -1.23 508] |
0.11 |
| 2 |
Back Irradiance for East Panel |
[ 1.3 -0.135 32.7] |
0.06 |
| 3 |
Total Irradiance for Center Panel |
[-2.67 -1.74 500] |
0.14 |
| 4 |
Back Irradiance for Center Panel |
[ 1.6 -0.417 26.8] |
0.12 |
| 5 |
Total Irradiance for West Panel |
[-3.54 -1.02, 538] |
0.07 |
| 6 |
Back Irradiance for West Panel |
[ 0.55 -0.0613 75] |
0.25 |
|
Disclaimer/Publisher’s Note: The statements, opinions and data contained in all publications are solely those of the individual author(s) and contributor(s) and not of MDPI and/or the editor(s). MDPI and/or the editor(s) disclaim responsibility for any injury to people or property resulting from any ideas, methods, instructions or products referred to in the content. |
© 2023 by the authors. Licensee MDPI, Basel, Switzerland. This article is an open access article distributed under the terms and conditions of the Creative Commons Attribution (CC BY) license (http://creativecommons.org/licenses/by/4.0/).


