Submitted:
24 November 2023
Posted:
27 November 2023
You are already at the latest version
Abstract
Keywords:
1. Introduction
2. Results
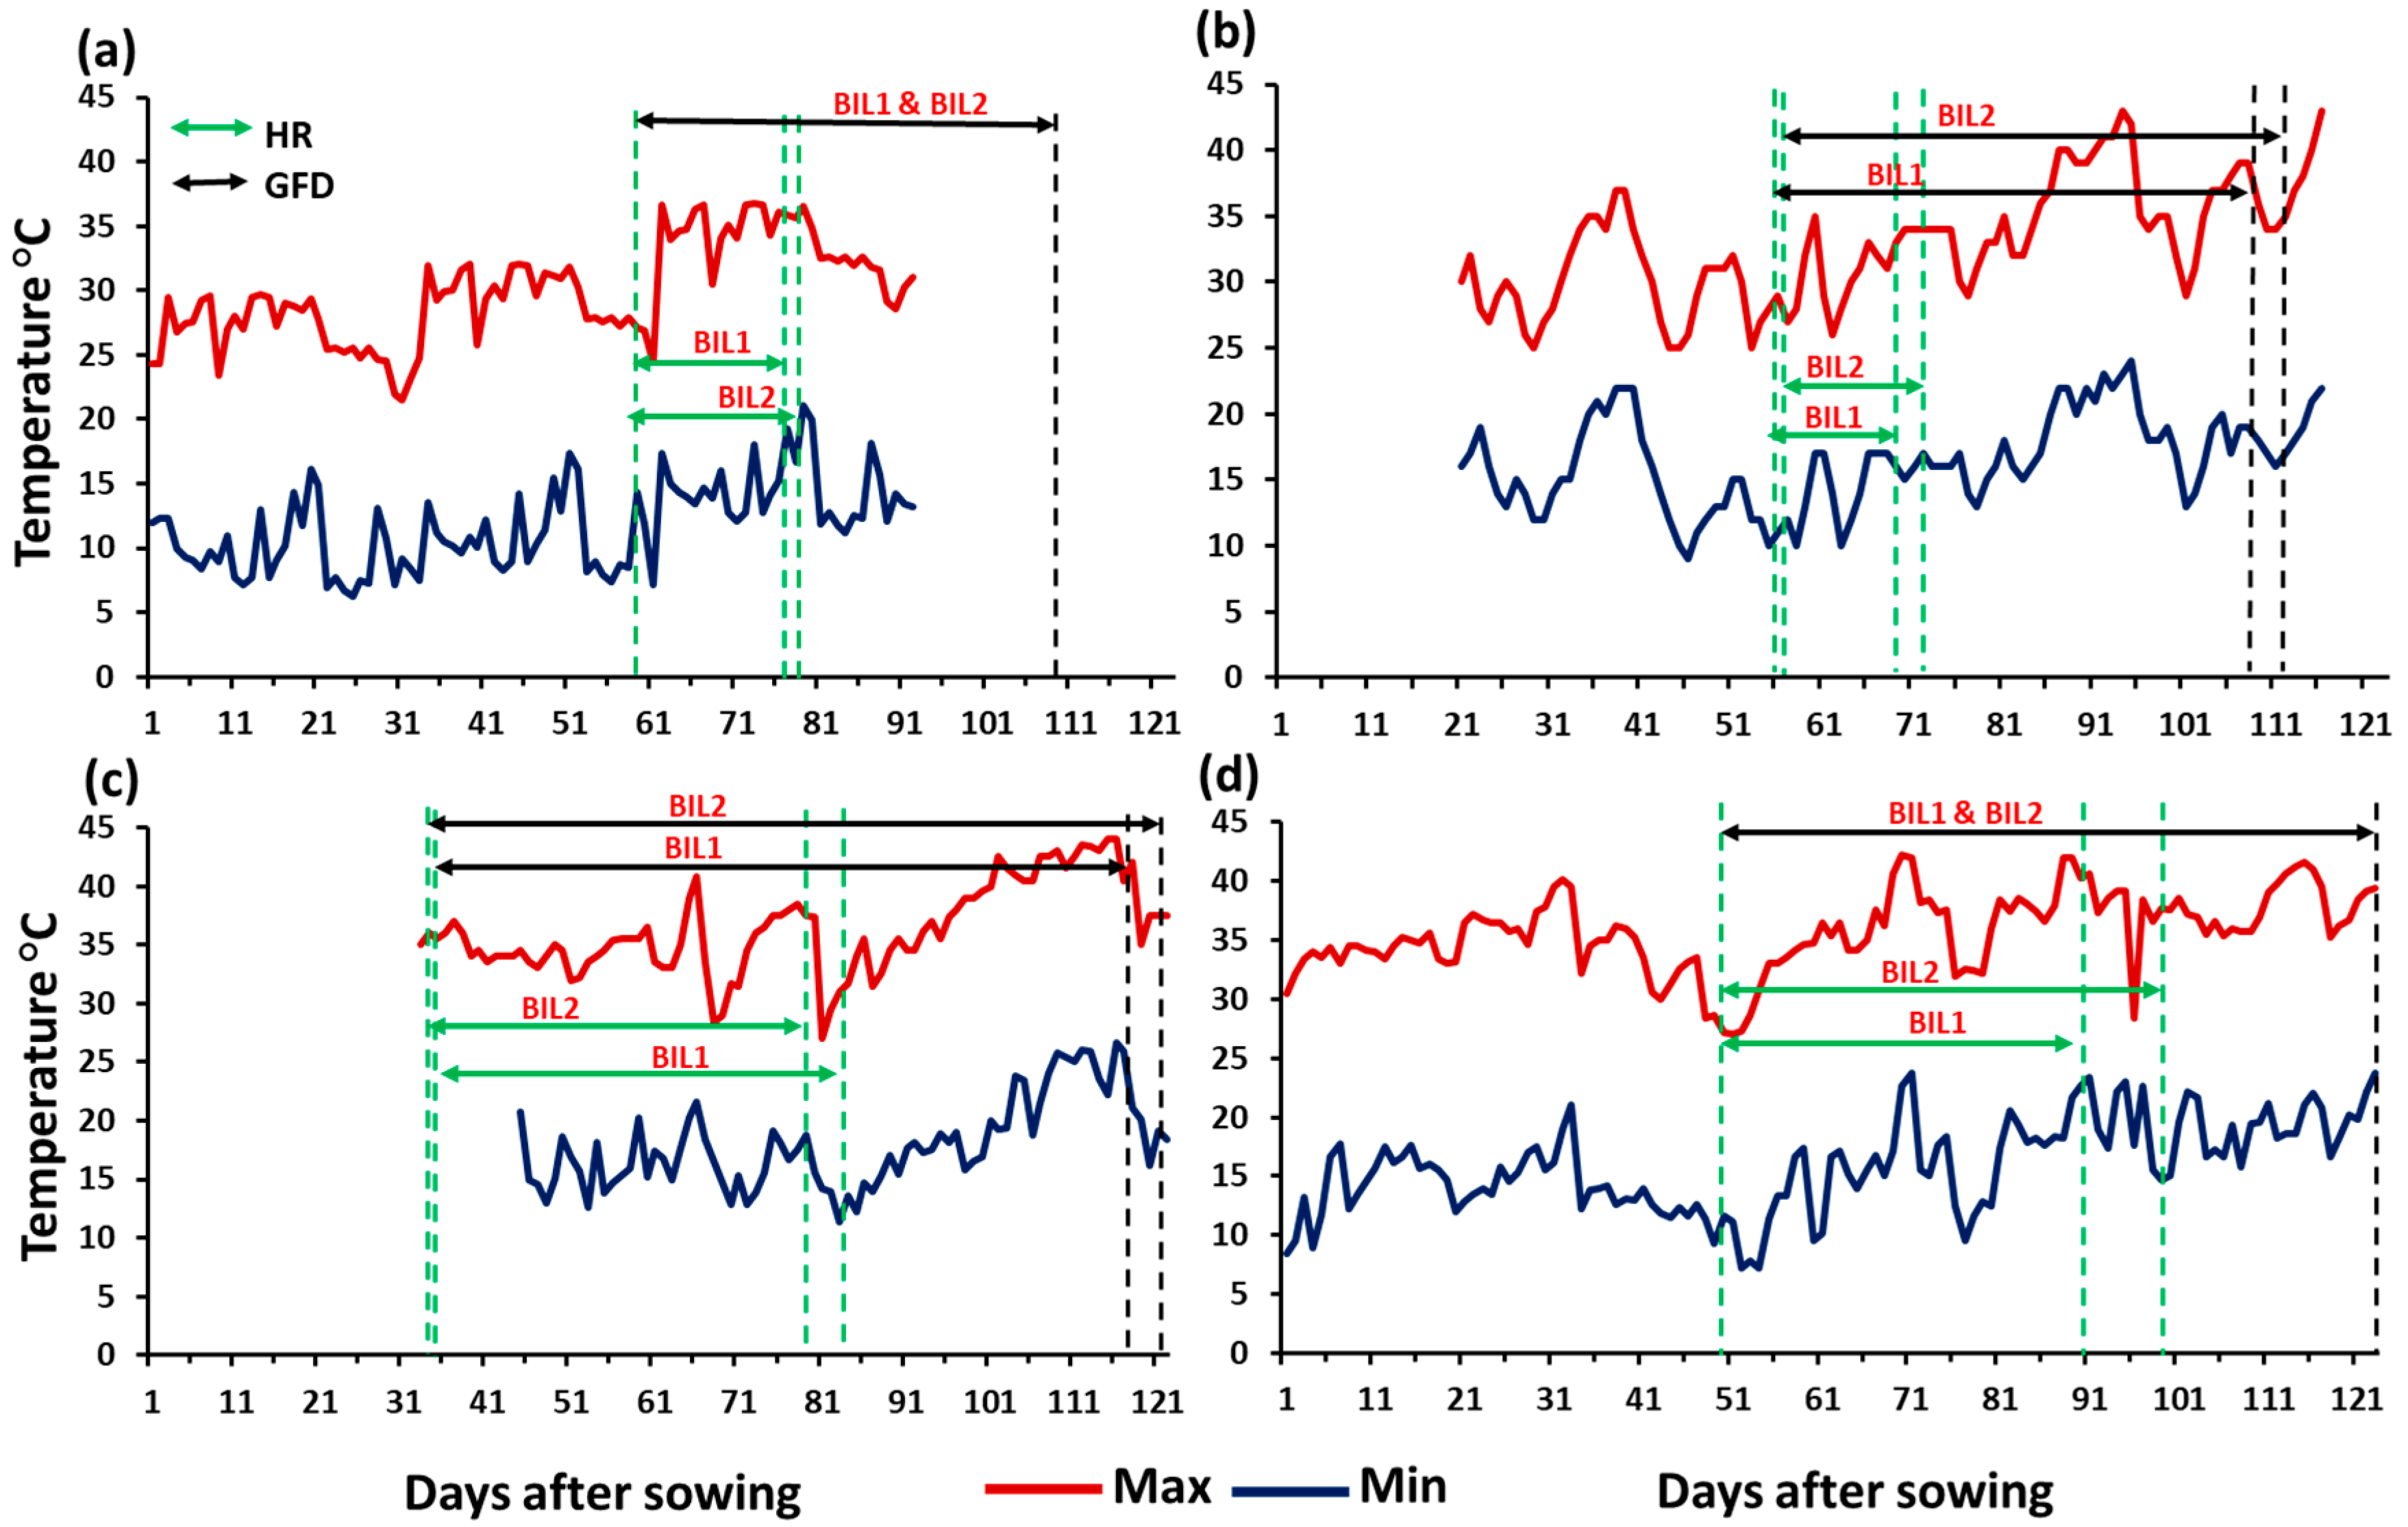
2.1. Climate conditions during the growing seasons
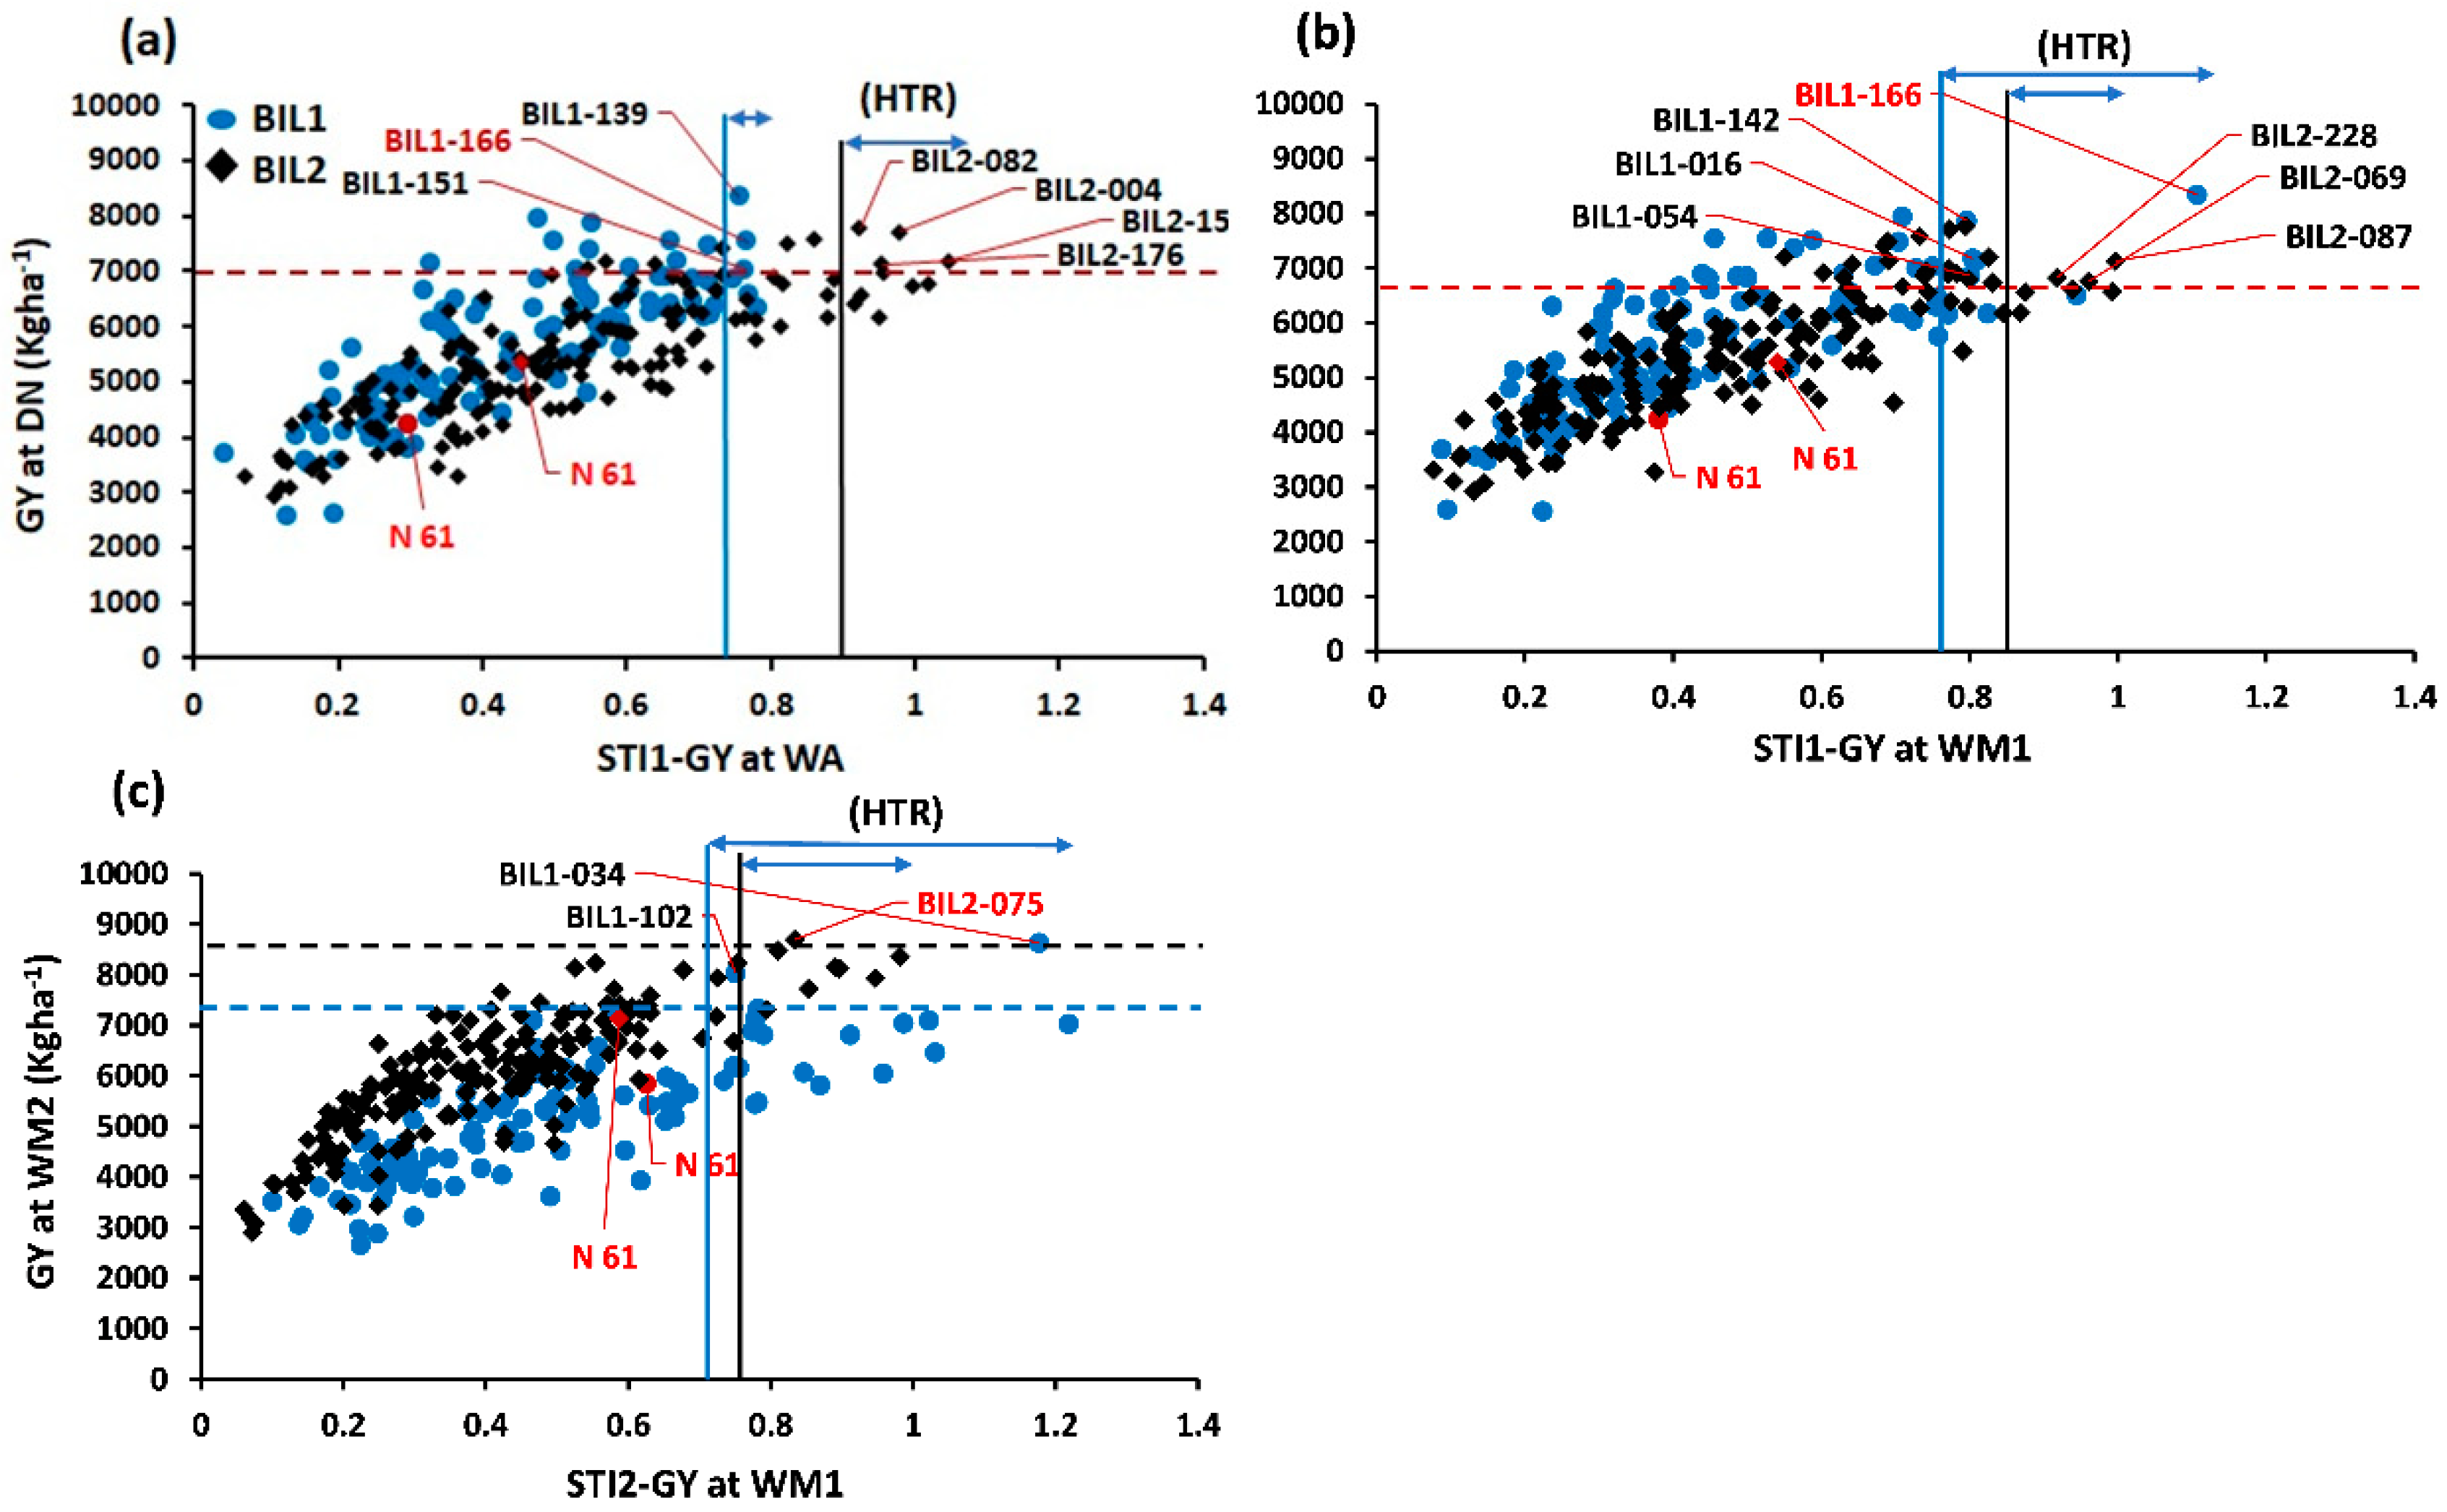
2.2. Impact of heat stress on the BIL populations
2.3. Relationship among traits
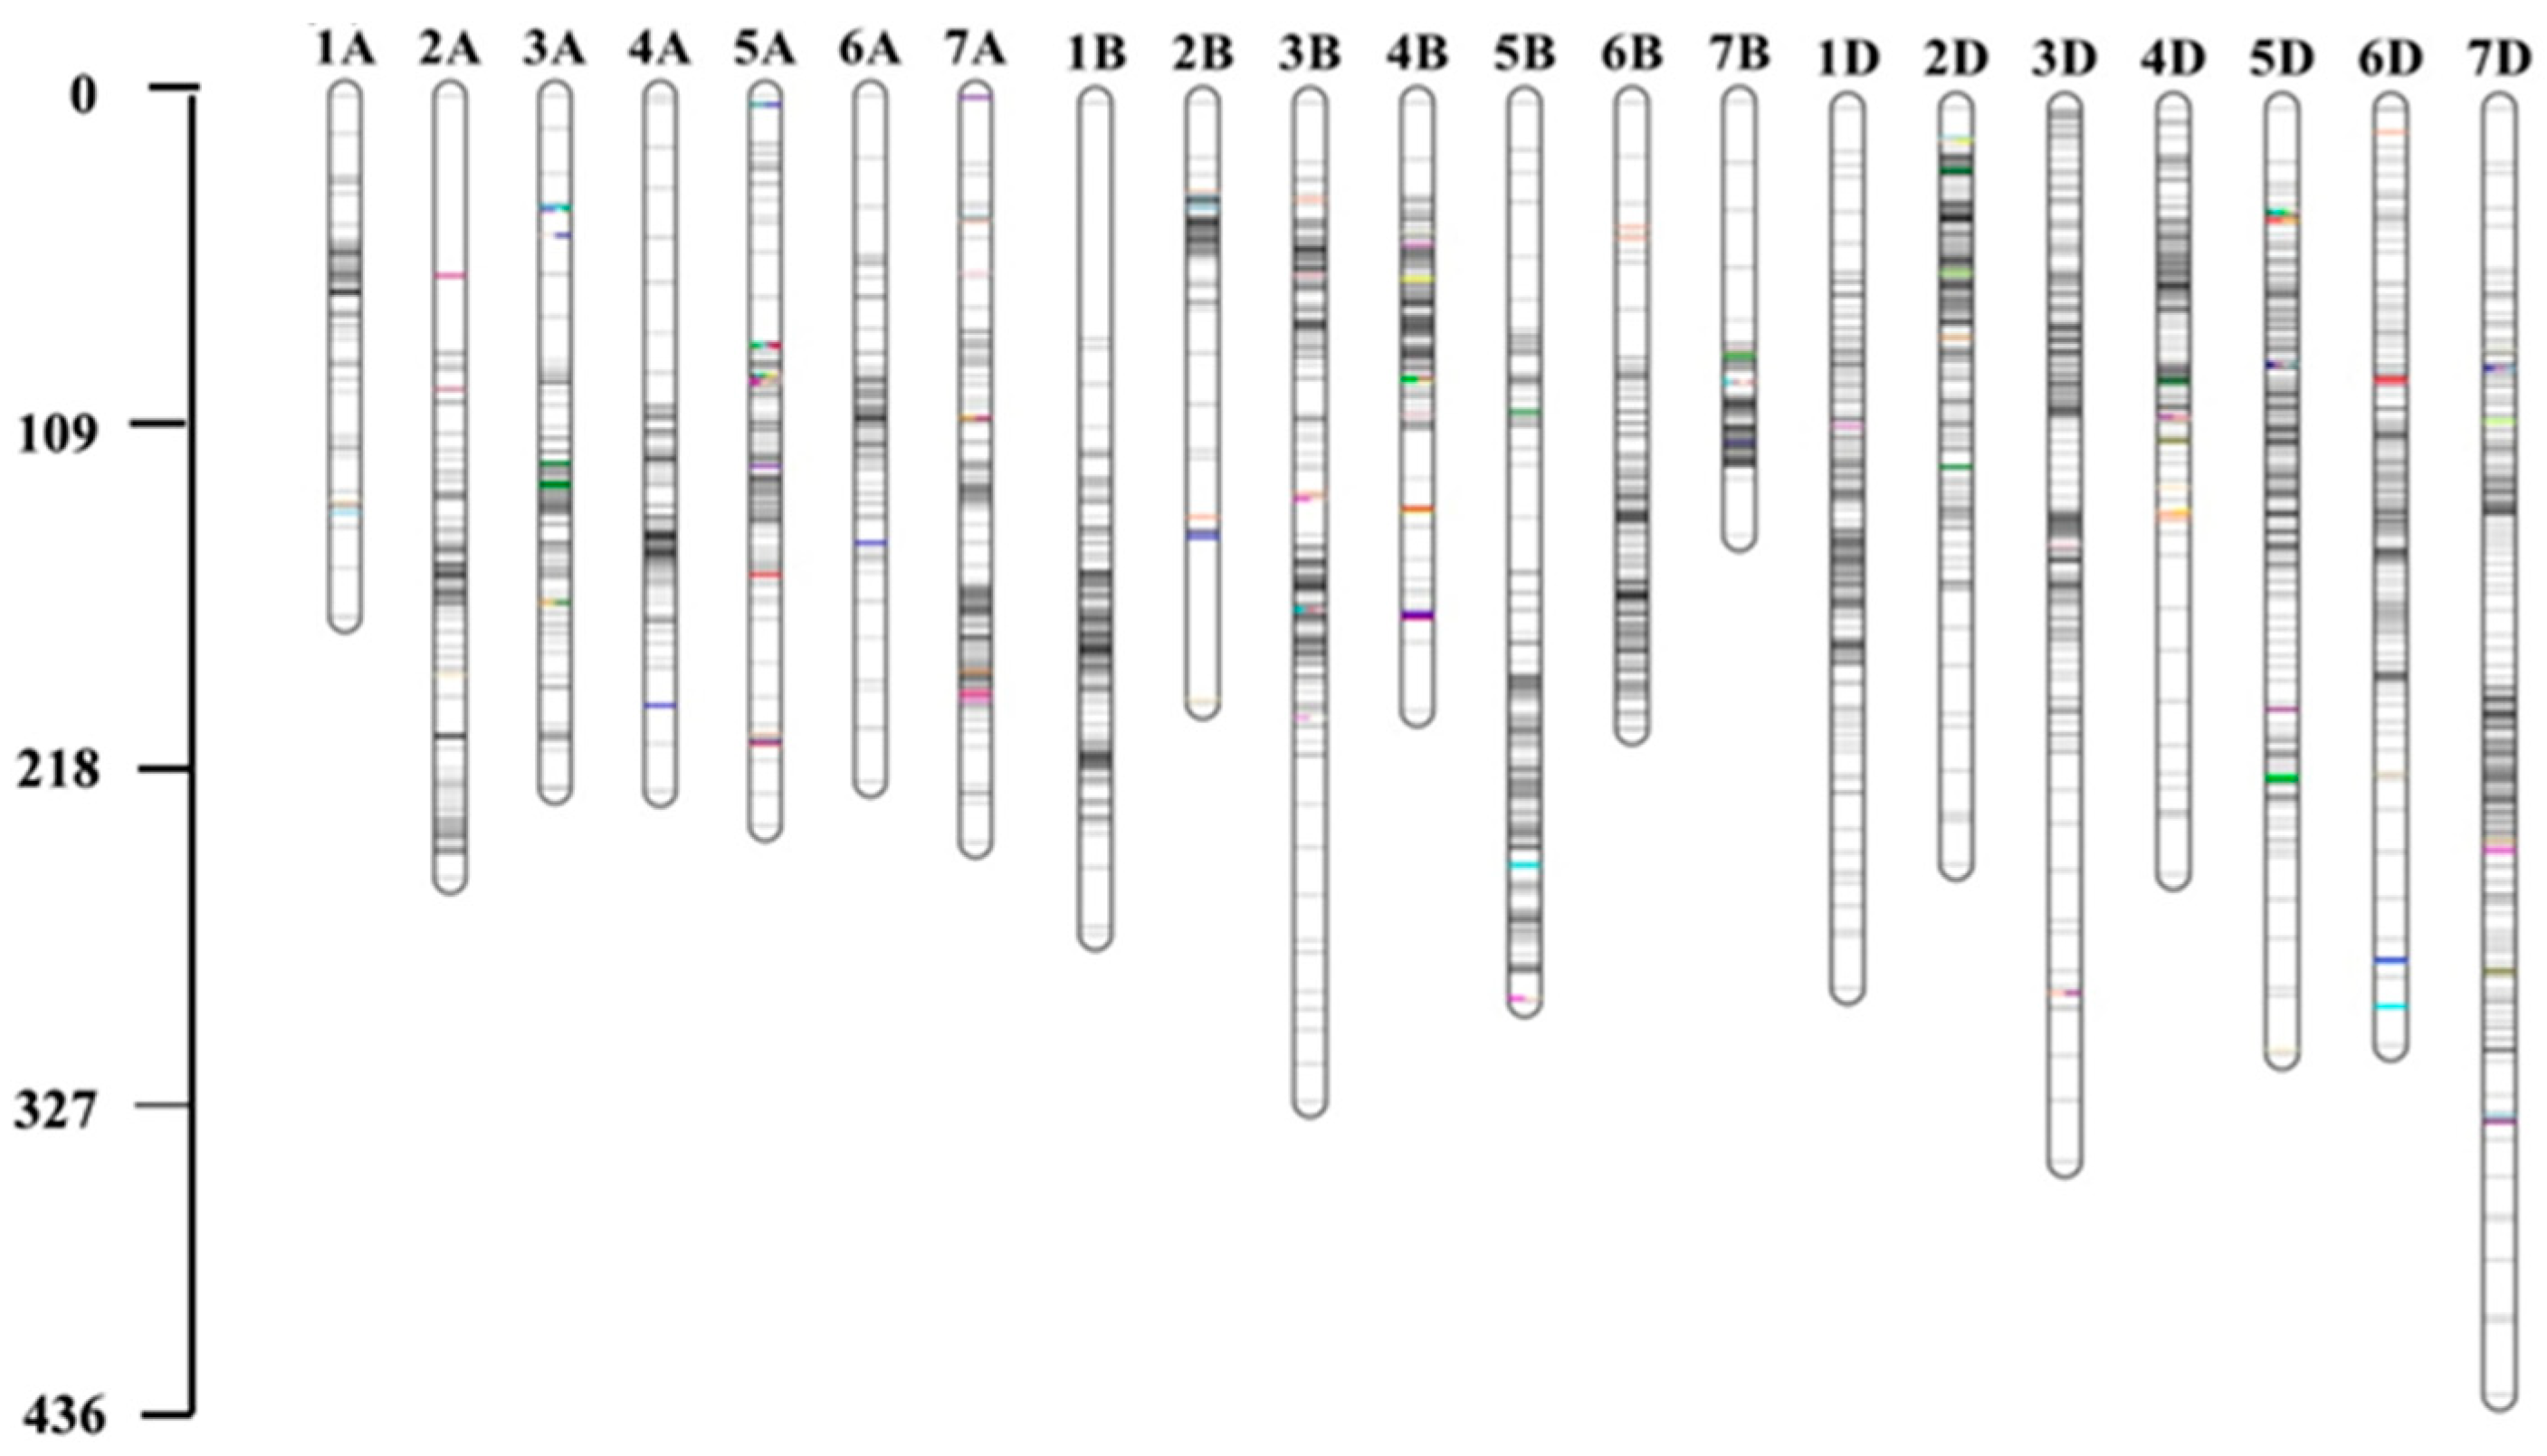
2.4. Linkage maps for the BILs
2.5. Identified QTLs in all environments
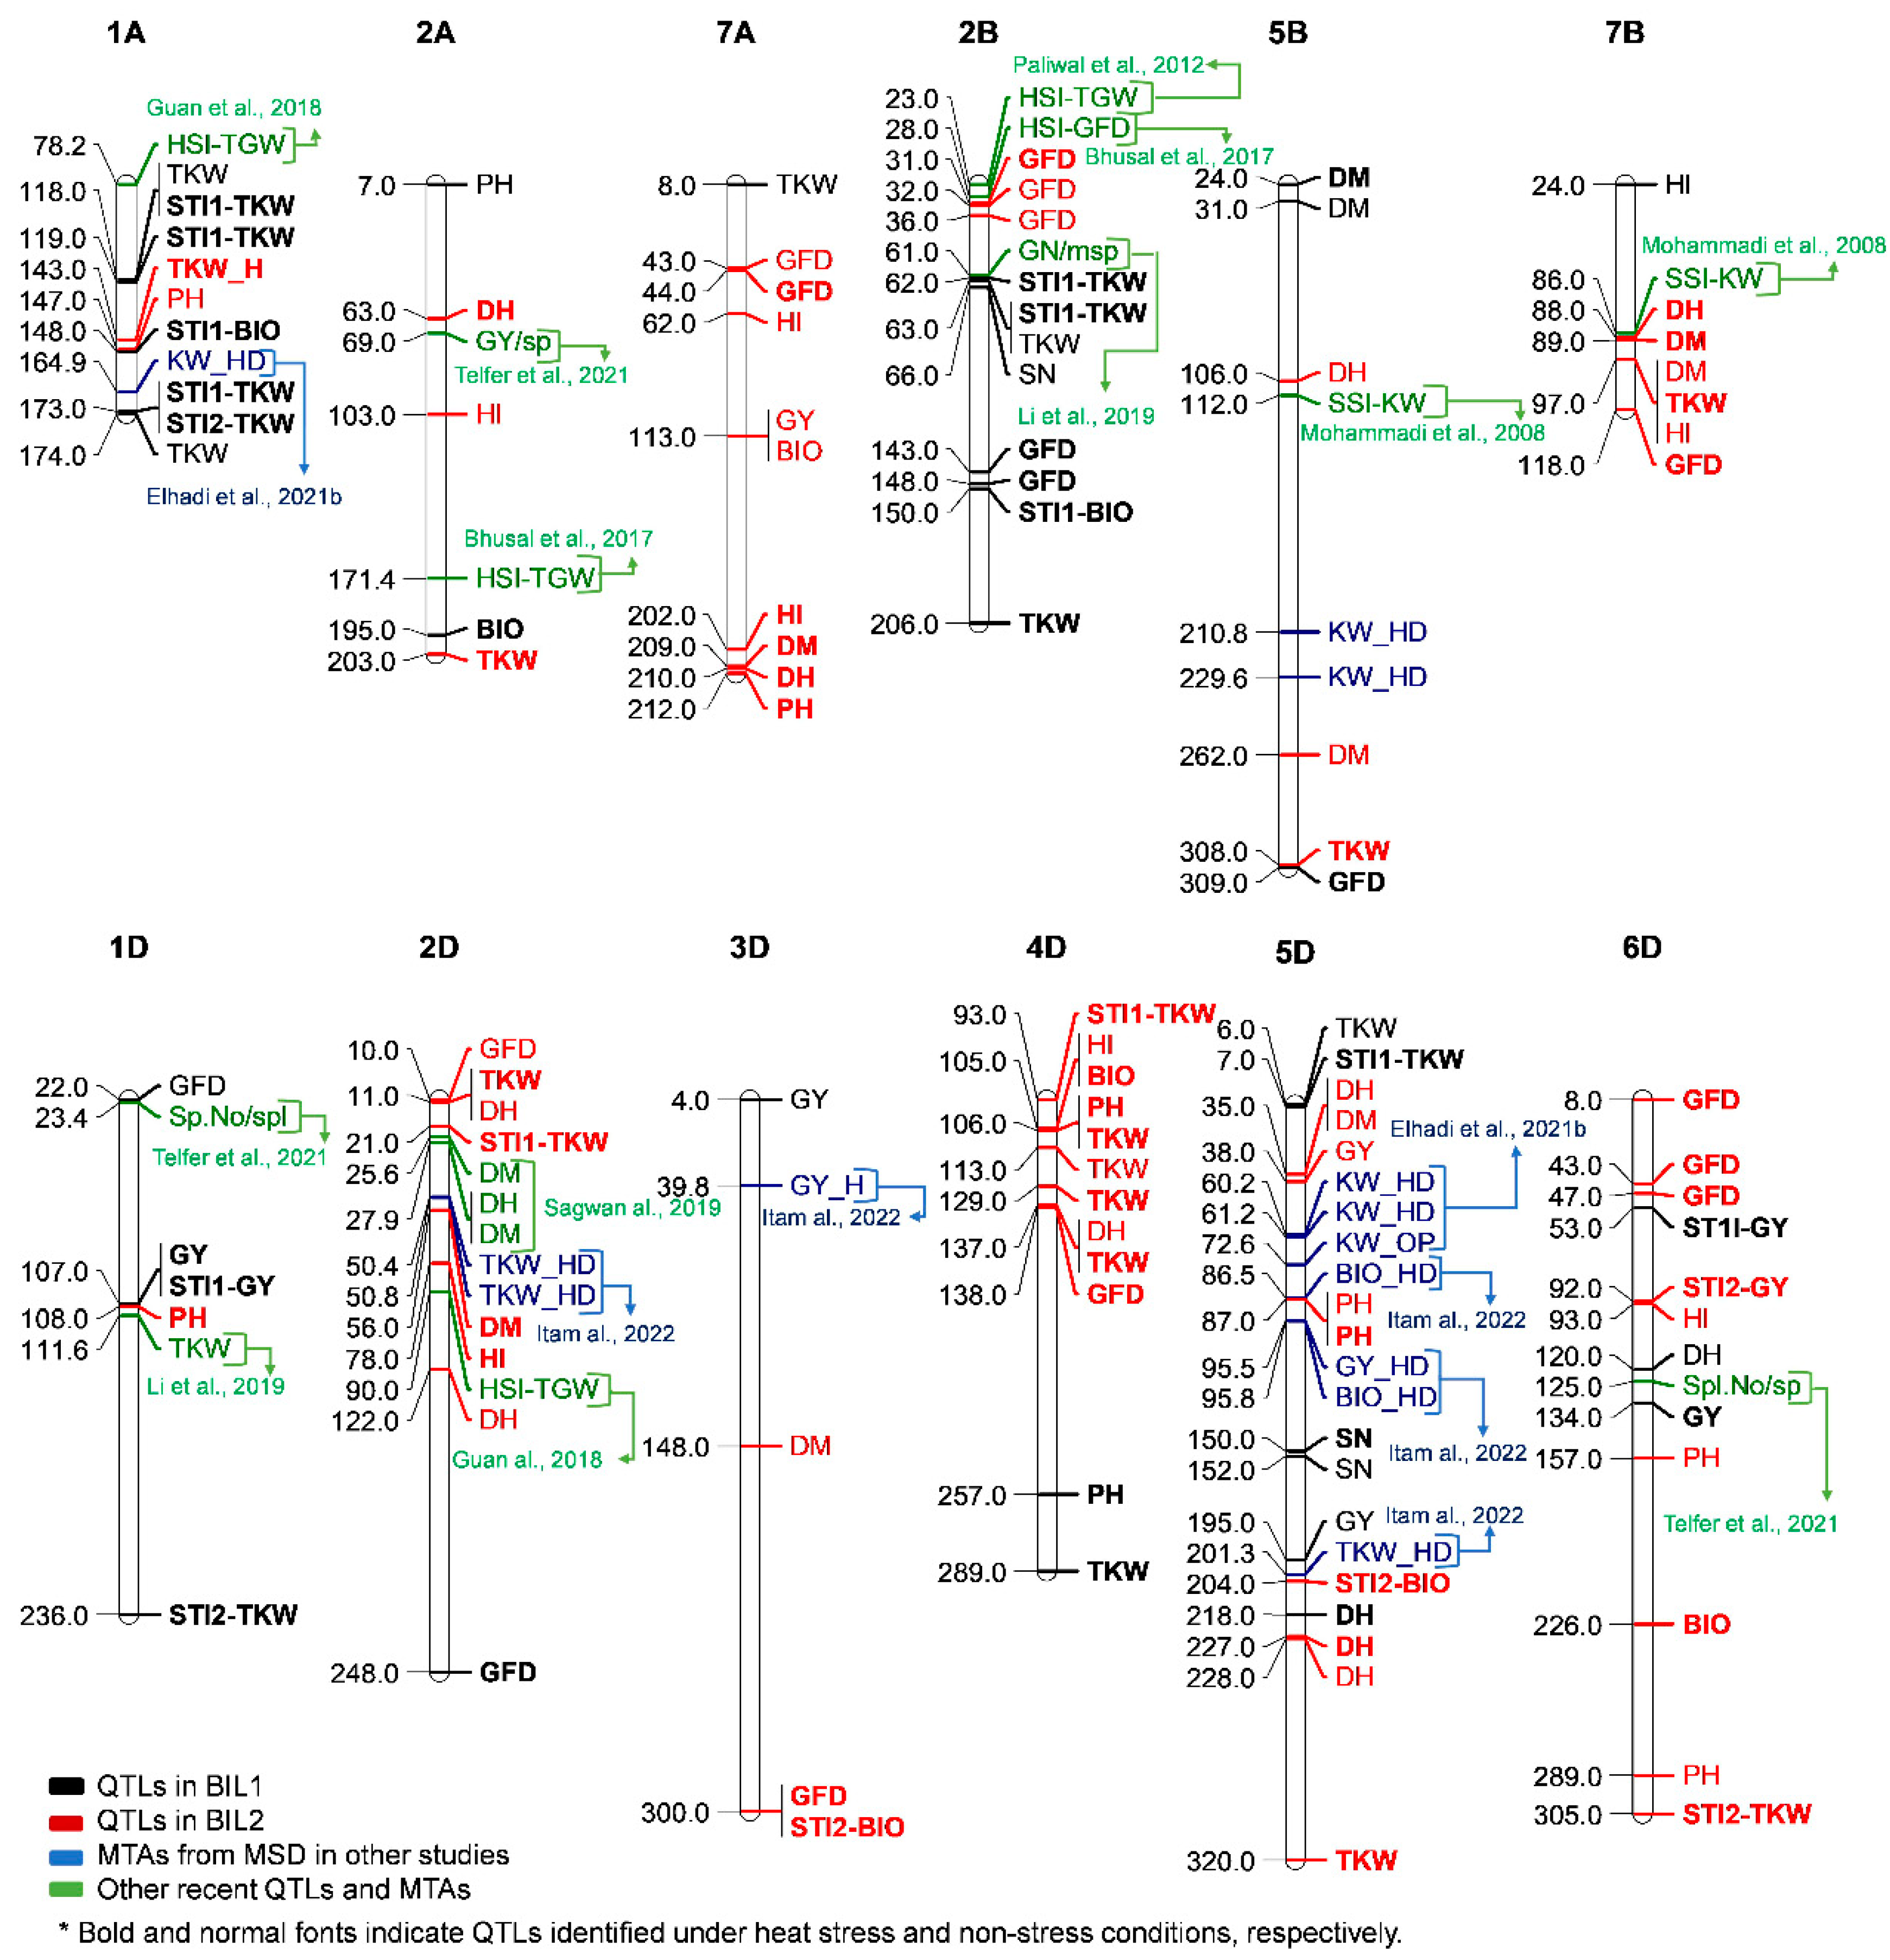
2.5. QTLs associated with heat stress response in both BILs
| Chr1 | Trait | Pop2 | Pos3 (cM) | Left Marker | Right Marker | LOD4 | PVE (%)5 | Add6 | Co-localized with |
|---|---|---|---|---|---|---|---|---|---|
| 1A | STI1-TKW | BIL1 | 119 | AMP0036610 | AMP0034796 | 4.37 | 14.37 | 0.12 | Guan et al., 2011 |
| 1A | STI1-TKW | BIL1 | 173 | AMP0035547 | AMP0004300 | 2.98 | 9.89 | -0.10 | Guan et al., 2011 |
| 1A | STI1-TKW | BIL1 | 118 | AMP0036610 | AMP0034796 | 3.74 | 11.37 | 0.11 | Guan et al., 2011 |
| 1A | STI1-TKW | BIL1 | 173 | AMP0035547 | AMP0004300 | 4.27 | 14.02 | -0.11 | Guan et al., 2011 |
| 1A | STI2-TKW | BIL1 | 173 | AMP0035547 | AMP0004300 | 4.82 | 14.54 | -0.10 | Guan et al., 2011 |
| 1A | STI1-BIO | BIL1 | 148 | AMP0034796 | AMP0020845 | 2.64 | 5.14 | -0.12 | |
| 1B | STI1-GY | BIL1 | 144 | AMP0017578 | AMP0023142 | 2.60 | 7.49 | 0.07 | |
| 1D | STI1-GY | BIL1 | 117 | AMP0027815 | AMP0029085 | 5.23 | 15.44 | -0.10 | |
| 1D | STI2-TKW | BIL1 | 236 | AMP0005955 | AMP0027742 | 3.52 | 10.14 | -0.09 | |
| 2B | STI1-TKW | BIL1 | 63 | AMP0009891 | AMP0006464 | 3.21 | 10.41 | 0.10 | |
| 2B | STI1-TKW | BIL1 | 62 | AMP0009891 | AMP0006464 | 2.95 | 8.66 | 0.08 | Paliwal et al., 2012 |
| 2B | STI1-BIO | BIL2 | 150 | AMP0012513 | AMP0026808 | 2.80 | 3.46 | -0.17 | |
| 2D | STI1-TKW | BIL2 | 21 | AMP0020907 | AMP0024533 | 4.11 | 3.15 | 0.19 | Guan et al., 2018 |
| 3A | STI1-GY | BIL2 | 49 | AMP0010424 | AMP0003988 | 5.33 | 14.20 | 0.10 | |
| 3A | STI1-TKW | BIL2 | 129 | AMP0014988 | AMP0016989 | 18.63 | 15.53 | -0.19 | |
| 3A | STI1-TKW | BIL2 | 137 | AMP0029972 | AMP0030211 | 10.85 | 8.05 | 0.14 | |
| 3A | STI1-TKW | BIL2 | 178 | AMP0007900 | AMP0004728 | 4.15 | 2.82 | -0.07 | |
| 3A | STI2-TKW | BIL2 | 39 | AMP0030786 | AMP0010424 | 2.83 | 6.29 | 0.33 | |
| 3A | STI1-BIO | BIL2 | 49 | AMP0010424 | AMP0003988 | 3.03 | 0.57 | 0.07 | |
| 3D | STI2-BIO | BIL2 | 300 | AMP0001446 | AMP0012860 | 4.58 | 2.97 | -0.31 | |
| 4B | STI2-GY | BIL2 | 140 | AMP0018665 | AMP0020290 | 3.27 | 8.54 | 0.07 | |
| 4B | STI1-BIO | BIL2 | 176 | AMP0025189 | AMP0026555 | 3.92 | 1.12 | -0.28 | |
| 4B | STI2-BIO | BIL2 | 178 | AMP0026555 | AMP0003848 | 5.10 | 2.89 | -0.36 | |
| 4D | STI1-TKW | BIL2 | 93 | AMP0031292 | AMP0028457 | 2.56 | 1.70 | -0.08 | |
| 4D | STI2-BIO | BIL2 | 105 | AMP0009857 | AMP0007548 | 4.21 | 2.01 | -0.41 | |
| 5A | STI1-GY | BIL2 | 88 | AMP0011577 | AMP0030240 | 3.81 | 10.50 | 0.08 | Hassuni et al., 2019 |
| 5A | STI1-BIO | BIL2 | 3 | AMP0003832 | AMP0029058 | 2.75 | 6.20 | 0.20 | |
| 5A | STI2-GY | BIL2 | 88 | AMP0011577 | AMP0030240 | 7.84 | 13.70 | 0.09 | Hassuni et al., 2019 |
| 5A | STI2-GY | BIL2 | 168 | AMP0008559 | AMP0030185 | 3.26 | 5.65 | 0.06 | Hassuni et al., 2019 |
| 5A | STI1-BIO | BIL2 | 3 | AMP0003832 | AMP0029058 | 2.94 | 3.09 | 0.19 | |
| 5A | STI2-BIO | BIL2 | 87 | AMP0025208 | AMP0011577 | 4.14 | 1.12 | 0.08 | |
| 5A | STI2-BIO | BIL2 | 227 | AMP0001406 | AMP0015434 | 5.74 | 2.43 | -0.39 | |
| 5D | STI1-TKW | BIL1 | 7 | AMP0022256 | AMP0000398 | 4.39 | 14.08 | -0.12 | Wang et al., 2021 |
| 5D | STI2-BIO | BIL2 | 204 | AMP0010296 | AMP0028613 | 2.95 | 3.10 | -0.29 | |
| 6D | STI1-GY | BIL1 | 53 | AMP0036794 | AMP0032738 | 3.03 | 8.67 | 0.07 | |
| 6D | STI2-GY | BIL2 | 92 | AMP0016445 | AMP0014713 | 3.90 | 6.84 | 0.07 | |
| 6D | STI2-TKW | BIL2 | 305 | AMP0003394 | AMP0027092 | 2.76 | 5.28 | -0.10 | Guan et al., 2018 |
| 7D | STI2-TKW | BIL1 | 89 | AMP0019618 | AMP0017004 | 2.96 | 8.30 | -0.08 | Paliwal et al., 2012 |
| 7D | STI2-BIO | BIL2 | 343 | AMP0018976 | AMP0002072 | 2.50 | 2.56 | -0.36 |
3. Discussion
3.1. The high-resolution linkage maps
3.2. QTL identified in all environments
3.2.1. Identification of stable major QTL for yield and heat stress tolerance-related traits
3.2.2. Common and Specific regions of detected QTLs in BIL1 and BIL2
4. Materials and Methods
4.1. Plant Materials
4.2. Experimental Sites and Design
4.3. Phenotyping of BIL populations
4.3.1. Traits evaluation
4.3.2. Statistical analysis of phenotypic data
4.4. Genotyping of the BILs, map construction, and QTL analysis
4.4.1. DNA extraction
4.4.2. Maps construction
4.4.3. QTL analysis
5. Conclusions
Author Contributions
Funding
Acknowledgments
Conflicts of Interest
References
- Tilman, D.; Balzer, C.; Hill, J.; Befort, B.L. Global Food Demand and the Sustainable Intensification of Agriculture. Proc Natl Acad Sci U S A 2011, 108, 20260–20264. [Google Scholar] [CrossRef] [PubMed]
- Ortiz, R.; Sayre, K.D.; Govaerts, B.; Gupta, R.; Subbarao, G. V.; Ban, T.; Hodson, D.; Dixon, J.M.; Iván Ortiz-Monasterio, J.; Reynolds, M. Climate Change: Can Wheat Beat the Heat? Agric Ecosyst Environ 2008, 126, 46–58. [Google Scholar] [CrossRef]
- Pinto, R.S.; Molero, G.; Reynolds, M.P. Identification of Heat Tolerant Wheat Lines Showing Genetic Variation in Leaf Respiration and Other Physiological Traits. Euphytica 2017, 213, 1–15. [Google Scholar] [CrossRef]
- Reynolds, M.; Tattaris, M.; Cossani, C.; Ellis, M.; Yamaguchi-Shinozaki, K.; Saint Pierre, C. Exploring Genetic Resources to Increase Adaptation of Wheat to Climate Change. In Advances in wheat genetics: from genome to field; Yasunari, O., Shigeo, T., Hirokazu, H., Eds.; Springer Japan, 2015; pp. 355–368.
- Kishii, M. An Update of Recent Use of Aegilops Species in Wheat Breeding. Front Plant Sci 2019, 10. [Google Scholar] [CrossRef] [PubMed]
- Ogbonnaya, F.C.; Abdalla, O.; Mujeeb-Kazi, A.; Kazi, A.G.; Xu, S.S.; Gosman, N.; Lagudah, E.S.; Bonnett, D.; Sorrells, M.E.; Tsujimoto, H. Synthetic Hexaploids: Harnessing Species of the Primary Gene Pool for Wheat Improvement. Plant Breed Rev 2013, 37, 35–122. [Google Scholar] [CrossRef]
- Pour-Aboughadareh, A.; Kianersi, F.; Poczai, P.; Moradkhani, H. Potential of Wild Relatives of Wheat: Ideal Genetic Resources for Future Breeding Programs. Agronomy 2021, 11, doiorg/103390/agronomy11081656. [Google Scholar] [CrossRef]
- Tsujimoto, H.; Sohail, Q.; Matsuoka, Y. Broadening the Genetic Diversity of Common and Durum Wheat for Abiotic Stress Tolerance Breeding. Advances in Wheat Genetics: From Genome to Field. [CrossRef]
- Mehvish, A.; Aziz, A.; Bukhari, B.; Qayyum, H.; Mahmood, Z.; Baber, M.; Sajjad, M.; Pang, X.; Wang, F. Identification of Single-Nucleotide Polymorphisms (SNPs) Associated with Heat Tolerance at the Reproductive Stage in Synthetic Hexaploid Wheats Using GWAS. Plants 2023, 12. [Google Scholar] [CrossRef] [PubMed]
- Molero, G.; Coombes, B.; Joynson, R.; Pinto, F.; Piñera-Chávez, F.J.; Rivera-Amado, C.; Hall, A.; Reynolds, M.P. Exotic Alleles Contribute to Heat Tolerance in Wheat under Field Conditions. Commun Biol 2023, 6. [Google Scholar] [CrossRef] [PubMed]
- Kaur, A.; Chhuneja, P.; Srivastava, P.; Singh, K.; Kaur, S. Evaluation of Triticum Durum-Aegilops tauschii Derived Primary Synthetics as Potential Sources of Heat Stress Tolerance for Wheat Improvement. Plant Genetic Resources: Characterisation and Utilisation 2021, 19, 74–89. [Google Scholar] [CrossRef]
- Liu, C.; Sukumaran, S.; Claverie, E.; Sansaloni, C.; Dreisigacker, S.; Reynolds, M. Genetic Dissection of Heat and Drought Stress QTLs in Phenology-Controlled Synthetic-Derived Recombinant Inbred Lines in Spring Wheat. Molecular Breeding 2019, 39. [Google Scholar] [CrossRef]
- Afzal, F.; Li, H.; Gul, A.; Subhani, A.; Ali, A.; Mujeeb-Kazi, A.; Ogbonnaya, F.; Trethowan, R.; Xia, X.; He, Z.; et al. Genome-Wide Analyses Reveal Footprints of Divergent Selection and Drought Adaptive Traits in Synthetic-Derived Wheats. G3: Genes, Genomes, Genetics 2019, 9, 1957–1973. [Google Scholar] [CrossRef]
- Gorafi, Y.S.A.; Kim, J.S.; Elbashir, A.A.E.; Tsujimoto, H. A Population of Wheat Multiple Synthetic Derivatives: An Effective Platform to Explore, Harness and Utilize Genetic Diversity of Aegilops tauschii for Wheat Improvement. Theoretical and Applied Genetics 2018, 131, 1615–1626. [Google Scholar] [CrossRef] [PubMed]
- Itam, M.O.; Mega, R.; Gorafi, Y.S.A.; Yamasaki, Y.; Tahir, I.S.A.; Akashi, K.; Tsujimoto, H. Genomic Analysis for Heat and Combined Heat–Drought Resilience in Bread Wheat under Field Conditions. Theoretical and Applied Genetics 2022, 135, 337–350. [Google Scholar] [CrossRef] [PubMed]
- Itam, M.O.; Gorafi, Y.S.A.; Tahir, I.S.A.; Tsujimoto, H. Genetic Variation in Drought Resilience-Related Traits among Wheat Multiple Synthetic Derivative Lines: Insights for Climate Resilience Breeding. Breed Sci 2021, 20162. [Google Scholar] [CrossRef] [PubMed]
- Elhadi, G.M.I.; Kamal, N.M.; Gorafi, Y.S.A.; Yamasaki, Y.; Takata, K.; Tahir, I.S.A.; Itam, M.O.; Tanaka, H.; Tsujimoto, H. Exploitation of Tolerance of Wheat Kernel Weight and Shape-Related Traits from Aegilops tauschii under Heat and Combined Heat-Drought Stresses. Int J Mol Sci 2021, 22. [Google Scholar] [CrossRef] [PubMed]
- Elhadi, G.M.I.; Kamal, N.M.; Gorafi, Y.S.A.; Yamasaki, Y.; Takata, K.; Tahir, I.S.A.; Itam, M.O.; Tanaka, H.; Tsujimoto, H. Exploitation of Tolerance of Wheat Kernel Weight and Shape-Related Traits from Aegilops tauschii under Heat and Combined Heat-Drought Stresses. Int J Mol Sci 2021, 22, 1–21. [Google Scholar] [CrossRef] [PubMed]
- Mohamed, I.E.S.; Kamal, N.M.; Mustafa, H.M.; Abdalla, M.G.A.; Elhashimi, A.M.A.; Gorafi, Y.S.A.; Tahir, I.S.A.; Tsujimoto, H.; Tanaka, H. Identification of Glu-D1 Alleles and Novel Marker–Trait Associations for Flour Quality and Grain Yield Traits under Heat-Stress Environments in Wheat Lines Derived from Diverse Accessions of Aegilops tauschii. Int J Mol Sci 2022, 23. [Google Scholar] [CrossRef] [PubMed]
- Mohamed, I.E.S.; Oe, H.; Kamal, N.M.; Mustafa, H.M.; Gorafi, Y.S.A.; Tahir, I.S.A.; Tsujimoto, H.; Tanaka, H. Enhancing Wheat Flour Quality Through Introgression of High-Molecular-Weight Glutenin Subunits From Aegilops tauschii Accessions. Front Sustain Food Syst 2022, 6. [Google Scholar] [CrossRef]
- Cortés, A.J.; López-Hernández, F. Harnessing Crop Wild Diversity for Climate Change Adaptation. Genes (Basel) 2021, 12, NA. [Google Scholar] [CrossRef] [PubMed]
- Ahmed, M.I.Y.; Gorafi, Y.S.A.; Kamal, N.M.; Balla, M.Y.; Tahir, I.S.A.; Zheng, L.; Kawakami, N.; Tsujimoto, H. Mining Aegilops tauschii genetic diversity in the background of bread wheat revealed a novel qtl for seed dormancy. Front. Plant Sci. 2023, 14. [Google Scholar] [CrossRef] [PubMed]
- Reynolds, M.; Dreccer, F.; Trethowan, R. Drought-Adaptive Traits Derived from Wheat Wild Relatives and Landraces. J Exp Bot 2007, 58, 177–186. [Google Scholar] [CrossRef] [PubMed]
- Elbashir, A.A.E.; Gorafi, Y.S.A.; Tahir, I.S.A.; Elhashimi, A.M.A.; Abdalla, M.G.A.; Tsujimoto, H. Genetic Variation in Heat Tolerance-Related Traits in a Population of Wheat Multiple Synthetic Derivatives. Breed Sci 2017, 67. [Google Scholar] [CrossRef] [PubMed]
- Elhadi, G.M.I.; Kamal, N.M.; Gorafi, Y.S.A.; Yamasaki, Y.; Ban, Y.; Kato, K.; Tahir, I.S.A.; Ishii, T.; Tanaka, H.; Tsujimoto, H. Novel Loci for Kernel Hardness Appeared as a Response to Heat and Combined Heat-Drought Conditions in Wheat Harboring Aegilops tauschii Diversity. Agronomy 2021, 11. [Google Scholar] [CrossRef]
- Tahir, I.S.A.; Elbashier, E.M.E.; Mustafa, H.M.; Elhashimi, A.M.A.; Abdalla, M.G.A.; Hassan, M.K.; Saad, A.S.I.; Elbashir, A.A.E.; Elsheikh, O.; Meheesi, S. Durum Wheat Field Performance and Stability in the Irrigated, Dry and Heat-Prone Environments of Sudan. Agronomy 2023, 13. [Google Scholar] [CrossRef]
- Reynolds, M.P.; Pask, A.J.D.; Hoppitt, W.J.E.; Sonder, K.; Sukumaran, S.; Molero, G.; Pierre, C. Saint; Payne, T.; Singh, R.P.; Braun, H.J.; et al. Strategic Crossing of Biomass and Harvest Index—Source and Sink—Achieves Genetic Gains in Wheat. Euphytica 2017, 213. [Google Scholar] [CrossRef]
- Miki, Y.; Yoshida, K.; Enoki, H.; Komura, S.; Suzuki, K.; Inamori, M.; Nishijima, R.; Takumi, S. GRAS-Di System Facilitates High-Density Genetic Map Construction and QTL Identification in Recombinant Inbred Lines of the Wheat Progenitor Aegilops tauschii. Sci Rep 2020, 10. [Google Scholar] [CrossRef] [PubMed]
- Cui, F.; Fan, X.; Zhao, C.; Zhang, W.; Chen, M.; Ji, J.; Li, J. A Novel Genetic Map of Wheat: Utility for Mapping QTL for Yield under Different Nitrogen Treatments. BMC Genet 2014, 15. [Google Scholar] [CrossRef] [PubMed]
- Röder, M.S.; Korzun, V.; Wendehake, K.; Plaschke, J.; Ne Tixier, M.-H.; Leroy, P.; Ganal, M.W. A microsatellite map of wheat. The Genetics Society of America 1998. [Google Scholar] [CrossRef] [PubMed]
- Liton, M.M.U.A.; McCartney, C.A.; Hiebert, C.W.; Kumar, S.; Jordan, M.C.; Ayele, B.T. Identification of Loci for Pre-Harvest Sprouting Resistance in the Highly Dormant Spring Wheat RL4137. Theoretical and Applied Genetics 2021, 134, 113–124. [Google Scholar] [CrossRef] [PubMed]
- Abdollahi Sisi, N.; Stein, N.; Himmelbach, A.; Mohammadi, S.A. High-Density Linkage Mapping of Agronomic Trait QTLs in Wheat under Water Deficit Condition Using Genotyping by Sequencing (GBS). Plants 2022, 11. [Google Scholar] [CrossRef] [PubMed]
- Wang, S.; Wong, D.; Forrest, K.; Allen, A.; Chao, S.; Huang, B.E.; Maccaferri, M.; Salvi, S.; Milner, S.G.; Cattivelli, L.; et al. Characterization of Polyploid Wheat Genomic Diversity Using a High-Density 90 000 Single Nucleotide Polymorphism Array. Plant Biotechnol J 2014, 12, 787–796. [Google Scholar] [CrossRef] [PubMed]
- Bhusal, N.; Sarial, A.K.; Sharma, P.; Sareen, S. Mapping QTLs for Grain Yield Components in Wheat under Heat Stress. PLoS One 2017, 12. [Google Scholar] [CrossRef] [PubMed]
- Tadesse, W.; Suleiman, S.; Tahir, I.; Sanchez-Garcia, M.; Jighly, A.; Hagras, A.; Thabet, S.; Baum, M. Heat-Tolerant QTLs Associated with Grain Yield and Its Components in Spring Bread Wheat under Heat-Stressed Environments of Sudan and Egypt. Crop Sci 2019, 59, 199–211. [Google Scholar] [CrossRef]
- Hassan, F.S.C.; Solouki, M.; Fakheri, B.A.; Nezhad, N.M.; Masoudi, B. Mapping QTLs for Physiological and Biochemical Traits Related to Grain Yield under Control and Terminal Heat Stress Conditions in Bread Wheat (Triticum Aestivum L.). Physiology and Molecular Biology of Plants 2018, 24, 1231–1243. [Google Scholar] [CrossRef] [PubMed]
- Telfer, P.; Edwards, J.; Norman, A.; Bennett, D.; Smith, A.; Able, J.A.; Kuchel, H. Genetic Analysis of Wheat (Triticum Aestivum) Adaptation to Heat Stress. Theoretical and Applied Genetics 2021, 134, 1387–1407. [Google Scholar] [CrossRef] [PubMed]
- Guan, P.; Lu, L.; Jia, L.; Kabir, M.R.; Zhang, J.; Lan, T.; Zhao, Y.; Xin, M.; Hu, Z.; Yao, Y.; et al. Global QTL Analysis Identifies Genomic Regions on Chromosomes 4A and 4B Harboring Stable Loci for Yield-Related Traits across Different Environments in Wheat (Triticum Aestivum L.). Front Plant Sci 2018, 9. [Google Scholar] [CrossRef] [PubMed]
- Li, L.; Mao, X.; Wang, J.; Chang, X.; Reynolds, M.; Jing, R. Genetic Dissection of Drought and Heat-Responsive Agronomic Traits in Wheat. Plant Cell Environ 2019, 42, 2540–2553. [Google Scholar] [CrossRef] [PubMed]
- Paliwal, R.; Röder, M.S.; Kumar, U.; Srivastava, J.P.; Joshi, A.K. QTL Mapping of Terminal Heat Tolerance in Hexaploid Wheat (T. Aestivum L.). Theoretical and Applied Genetics 2012, 125, 561–575. [Google Scholar] [CrossRef] [PubMed]
- Bhusal, N.; Sarial, A.K.; Sharma, P.; Sareen, S. Mapping QTLs for Grain Yield Components in Wheat under Heat Stress. PLoS One 2017, 12. [Google Scholar] [CrossRef] [PubMed]
- Sangwan, S.; Munjal, R.; Ram, K.; Kumar, N. QTL Mapping for Morphological and Physiological Traits in RILs of Spring Wheat Population of WH1021 × WH711. J Environ Biol 2019, 40, 674–682. [Google Scholar] [CrossRef]
- Mohammadi, V.; Zali, A.A.; Bihamta, M.R. Mapping QTLs for Heat Tolerance in Wheat. J. Agric. Sci. Technol 2008, 10, 261–267. [Google Scholar]
- Mahjoob, M.M.M.; Kamal, N.M.; Gorafi, Y.S.A.; Tsujimoto, H. Genome-Wide Association Study Reveals Distinct Genetic Associations Related to Leaf Hair Density in Two Lineages of Wheat-Wild Relative Aegilops tauschii. Sci Rep 2022, 12. [Google Scholar] [CrossRef] [PubMed]
- Farhad, M.; Kumar, U.; Tomar, V.; Bhati, P.K.; Krishnan J, N. ; Kishowar-E-Mustarin; Barek, V.; Brestic, M.; Hossain, A. Heat Stress in Wheat: A Global Challenge to Feed Billions in the Current Era of the Changing Climate. Front Sustain Food Syst 2023, 7.
- Hassouni, K. El; Belkadi, B.; Filali-Maltouf, A.; Tidiane-Sall, A.; Al-Abdallat, A.; Nachit, M.; Bassi, F.M. Loci Controlling Adaptation to Heat Stress Occurring at the Reproductive Stage in Durum Wheat. Agronomy 2019, 9, 1–20. [Google Scholar] [CrossRef]
- Wang, X.; Guan, P.; Xin, M.; Wang, Y.; Chen, X.; Zhao, A.; Liu, M.; Li, H.; Zhang, M.; Lu, L.; et al. Genome-Wide Association Study Identifies QTL for Thousand Grain Weight in Winter Wheat under Normal- and Late-Sown Stressed Environments. Theoretical and Applied Genetics 2021, 134, 143–157. [Google Scholar] [CrossRef] [PubMed]
- Wang, X.; Guan, P.; Xin, M.; Wang, Y.; Chen, X.; Zhao, A.; Liu, M.; Li, H.; Zhang, M.; Lu, L.; et al. Genome-Wide Association Study Identifies QTL for Thousand Grain Weight in Winter Wheat under Normal- and Late-Sown Stressed Environments. Theoretical and Applied Genetics 2021, 134, 143–157. [Google Scholar] [CrossRef] [PubMed]
- Fernandez, G.; et al. Fernandez 1992.Pdf. Effective selection criteria for assessing plant stress tolerance. In: “Proceeding of the International Symposium on Adaptation of Vegetables and other Food Crops in Temperature and Water Stress” 1992, 257–270.
- PBTools PBTools 2014.
- IBM Crop IBM SPSS Statistics.
- Saghai-Maroof, M.A.; Soliman, K.M.; Jorgensen, R.A.; Allard, R.W. Ribosomal DNA Spacer-Length Polymorphisms in Barley: Mendelian Inheritance, Chromosomal Location, and Population Dynamics. Proc Natl Acad Sci U S A 1984, 81, 8014–8018. [Google Scholar] [CrossRef] [PubMed]
- Meng, L.; Li, H.; Zhang, L.; Wang, J. QTL IciMapping: Integrated Software for Genetic Linkage Map Construction and Quantitative Trait Locus Mapping in Biparental Populations. Crop Journal 2015, 3, 269–283. [Google Scholar] [CrossRef]
- Akond, Z.; Alam, Md.J.; Hasan, M.N.; Uddin, Md.S.; Alam, M.; Mollah, N.H. A Comparison on Some Interval Mapping Approaches for QTL Detection. Bioinformation 2019, 15, 90–94. [Google Scholar] [CrossRef]
- Kosambi, D.D. The estimation of map distances from recombination values. Ann Eugen 1943, 12, 172–175. [Google Scholar] [CrossRef]
- Arends, D.; Prins, P.; Jansen, R.C.; Broman, K.W. R/Qtl: High-Throughput Multiple QTL Mapping. Bioinformatics 2010, 26, 2990–2992. [Google Scholar] [CrossRef] [PubMed]


| Pop. | DON | WA | WM1 | WM2 | G | E | G×E | h2 | |||||||||
|---|---|---|---|---|---|---|---|---|---|---|---|---|---|---|---|---|---|
| Mean | Range | N61 | Mean | Range | N61 | Mean | Range | N61 | Mean | Range | N61 | Pr | Pr | Pr | |||
| GY (kg ha-1) | BIL1 | 5553 | 1500-9125 | 4062 | 2340 | 212-4176 | 2171 | 2426 | 887-5131 | 2852 | 5211 | 1684 - 9698 | 5984 | < 0.001 | < 0.001 | < 0.001 | 0.56 |
| BIL2 | 5408 | 1597-8847 | 5100 | 2531 | 310-4635 | 2543 | 2451 | 826-5099 | 30306 | 6136 | 1867 - 9543 | 7241 | < 0.001 | < 0.001 | < 0.001 | 0.60 | |
| DH | BIL1 | 68.5 | 58-77 | 67.6 | 60.5 | 56-69 | 61.6 | 61.1 | 35-83 | 56.2 | 68.0 | 54 - 91 | 63.6 | < 0.001 | < 0.001 | < 0.001 | 0.78 |
| BIL2 | 69.1 | 58-79 | 69.6 | 61.1 | 57-72 | 60.8 | 62.1 | 34-80 | 58.0 | 68.1 | 54 - 100 | 64.2 | < 0.001 | < 0.001 | 0.001 | 0.77 | |
| DM | BIL1 | 100.3 | 92-110 | 98.4 | 88.2 | 80-109 | 87.8 | 100.7 | 78-118 | 94.0 | 104.2 | 82 - 125 | 103.0 | < 0.001 | < 0.001 | < 0.001 | 0.84 |
| BIL2 | 99.8 | 90-110 | 100.0 | 90.2 | 78-112 | 89.6 | 102.0 | 80-132 | 102.0 | 103.0 | 81 - 125 | 103.6 | < 0.001 | < 0.001 | < 0.001 | 0.83 | |
| GFD | BIL1 | 31.7 | 26-46 | 30.8 | 27.7 | 19-40 | 26.2 | 39.4 | 15-64 | 37.8 | 36.2 | 24 - 44 | 39.4 | 0.003 | < 0.001 | < 0.001 | 0.45 |
| BIL2 | 30.8 | 22-48 | 30.4 | 29.1 | 20-42 | 28.8 | 39.1 | 27-59 | 44.0 | 34.8 | 25-43 | 39.4 | < 0.001 | < 0.001 | 0.012 | 0.54 | |
| PH (cm) | BIL1 | 92.6 | 77-113 | 85.1 | 77.0 | 53-101 | 60.3 | 75.85 | 46-110 | 69.6 | 83.2 | 52 - 114 | 78.0 | 0.154 | < 0.001 | < 0.001 | 0.15 |
| BIL2 | 89.9 | 72-111 | 85.2 | 75.6 | 57-95 | 70.5 | 73.6 | 45-105 | 74.6 | 78.9 | 52 - 102 | 76.7 | < 0.001 | < 0.001 | 0.354 | 0.88 | |
| TKW (g) | BIL1 | 37.2 | 9-96 | 36.7 | 38.7 | 25-52 | 36.7 | 35.4 | 21-54 | 32.7 | 35.5 | 23 - 52 | 34.7 | 0.002 | 0.164 | < 0.001 | 0.44 |
| BIL2 | 35.1 | 10-63 | 32.0 | 39.9 | 22-53 | 37.6 | 35.1 | 5 - 56 | 32.5 | 32.9 | 11 - 47 | 27.8 | < 0.001 | < 0.001 | 0.003 | 0.61 | |
| BIO (Kgha-1) | BIL1 | 24082.4 | 3750-39750 | 28187.5 | 8192 | 2250-13250 | 4110 | 7014 | 2500-15250 | 7750 | 15609 | 8216 - 23970 | 150580 | 0.071 | < 0.001 | < 0.001 | 0.29 |
| BIL2 | 17903.6 | 7250-39750 | 13950.0 | 7900 | 1750-15250 | 5030 | 6957 | 1250-14750 | 7437 | 16795 | 7873 - 33204 | 18432 | < 0.001 | < 0.001 | < 0.001 | 0.42 | |
| HI | BIL1 | 25.7 | 12-54 | 17.7 | 29.2 | 5 - 49 | 37.9 | 34.9 | 19-57 | 39.7 | 33.5 | 10 - 45 | 41.6 | 0.017 | < 0.001 | < 0.001 | 0.34 |
| BIL2 | 31.6 | 10-56 | 36.4 | 32.6 | 17-49 | 43.5 | 36.0 | 15-93 | 39.1 | 36.8 | 20 - 48 | 40.4 | 0.028 | < 0.001 | < 0.001 | 0.27 | |
Disclaimer/Publisher’s Note: The statements, opinions and data contained in all publications are solely those of the individual author(s) and contributor(s) and not of MDPI and/or the editor(s). MDPI and/or the editor(s) disclaim responsibility for any injury to people or property resulting from any ideas, methods, instructions or products referred to in the content. |
© 2023 by the authors. Licensee MDPI, Basel, Switzerland. This article is an open access article distributed under the terms and conditions of the Creative Commons Attribution (CC BY) license (http://creativecommons.org/licenses/by/4.0/).


