Preprint
Hypothesis

Virtual Journeys, Real Engagement: Analyzing User Experience in a Virtual Traveling Social Platform

Altmetrics

Downloads

167

Views

66

Comments

0

A peer-reviewed article of this preprint also exists.

Submitted:

25 November 2023

Posted:

27 November 2023

You are already at the latest version

Alerts
Abstract
A sustainable smart tourism ecosystem relies on building digital networks that link tourists to destinations. This study explores how web and immersive technologies, such as the VRRO platform, can improve tourism by offering interactive experiences to augment traditional travel. The study underscores the role of VRRO's design in enhancing user interaction and engagement, thereby encouraging the generation of user content and the development of a virtual tour network. An empirical analysis investigates user engagement, revealing that the platform is accessible to users regardless of their technological familiarity. It suggests a high likelihood of sustained use and recommendations. In conclusion, VRRO demonstrates how accessible and innovative technologies in tourism modernize travel experiences and significantly contribute to the evolution of the broader tourism ecosystem.
Keywords: 
Subject: Computer Science and Mathematics  -   Information Systems

1. Introduction

A pivotal paradigm in the modern travel industry, sustainable tourism encompasses environmental, economic, and social dimensions, seeking to strike a balance between the needs of the visitors, the tourism industry, local environments, and host communities [1,2]. This approach encourages cities to exchange best practices, integrating advanced tele-tourism into urban planning to guide travelers towards informed choices, thereby driving sustainable economic development in tourist destinations [3].
Virtual tourism, powered by advancements in immersive technologies, has the potential to be a significant component of sustainable tourism. The COVID-19 pandemic underscored the fragility of the traditional tourism model, with the travel, tourism, and cultural sectors facing unprecedented challenges. Although reluctant to digitalization, fearing the diminishing of the actual experience or the loss of potential visitors, cultural landmarks administrations realized the potential of a tech-driven solution [4,5].
Virtual tours (VTs) can be pivotal in ensuring that tourism activities continue, even during challenging times [1,6]. Such opportunities not only encompass allowing travelers to explore and gain knowledge about various locations during travel constraints but all from the safety of their homes. Moreover, cultural institutions can maintain their connection with audiences. Additionally, they can offer employment avenues, such as virtual tour guides, ensuring job continuity for professionals in the field [4].
Web social platforms are powerful for expanding the traditional tourist experience into the virtual domain. These platforms, evolving through both public and private initiatives, have become integral in shaping how users interact with and document their travel experiences. Despite raising privacy and security concerns, users adapt and navigate these challenges, sharing their experiences as 'postcards, not ticket stubs' [7], thus prioritizing narrative over mere location logging [8].
With the aid of immersive web technologies, distances for tourists are condensed to a mere click, morphing cultural sites into readily accessible digital destinations. This shift is redefining traditional tourism, paving the way for "digital tourists" [9]. This paper assesses the role of web social platforms in shaping a new dimension of tourism that complements the physical experience with a virtual counterpart, accessible through panoramic imagery and interactive features.

2. Background and literature review

Given the intangibility of the tourism product, XR technologies hold the capacity to unlock significant opportunities in the tourism sector, by revealing rich sensorial information to travelers before reaching their destination. The applications of virtual reality in tourism include planning and management, marketing, education, heritage preservation, and accessibility [10]. A bibliometric review with a timeline from 2004 to 2020 [11] charted the progression of e-tourism trends, from the initial focus on web-based technologies to the more recent emphasis on augmented and virtual reality. The period between 2017 and 2020 was marked by advancements such as netnography, big data, and tourism 4.0. The COVID-19 pandemic accentuated the importance of e-tourism, emphasizing a shift towards internet technology over traditional modes of communication [11].
According to a study on tourism flow in Southern Europe [12], digital adoption—the incorporation of digital technologies within the tourism industry—has a less significant effect on drawing tourists than virtual proximity, which is defined as the perceived ease of digital interaction with a destination. This emphasizes the crucial role of a strong online presence and an engaging online experience to increase tourism. It also implies that the perception of accessibility and closeness enabled by digital tools may have a greater impact on traveler behavior than the simple existence of cutting-edge digital infrastructure and services.
Online sources, particularly social media, significantly influence users' motivation to co-create, which in turn impacts the destination image. Notably, social media recommendations, especially from family and friends, emerged as the most influential motivators for co-creation, as well as the promotion of lesser-known destinations [13].
A paper delving into the influence of online information on international travelers' destination choices underlined a glaring gap: the scarcity of regional tourism data, particularly in lesser-known areas like certain regions of South Korea [14]. This deficiency often skews tourism funds towards well-known destinations. Digital platforms, utilizing GPS and mobile technology, provide a dynamic and comprehensive view of travel options, promoting the discovery of lesser-known destinations towards a more balanced and sustainable tourism landscape.
Before embarking on their journey, tourists typically draft a rough itinerary based on extensive online research, using both social media and official channels. Upon reaching their destination, they further refine their plans by consulting online forums and review platforms, especially to discover attractions in proximity to their primary points of interest [15]. This dual-phase reliance on social media underscores its pivotal role as a travel companion and guide. Furthermore, social media platforms serve as a validation tool, helping travelers finalize which sites to visit. This process underscores the traveler's dual role as both a consumer and a contributor in the digital travel ecosystem.
The spread of VTs in the tourism sector has been significantly influenced by user motivations and technological preferences. A primary driver for individuals participating in virtual tours was the pursuit of relaxation, followed by interests in novelty and education. Interestingly, the digital experience itself was not a dominant motivation, suggesting that users might still value physical travel's authenticity [16]. Demographically, a trend emerged where virtual tour attendees, predominantly young and well-educated, accessed these tours mainly through mobile devices. This preference underscores the importance for VT operators to optimize their offerings for handheld device compatibility [17].

3. The VRRO Platform

VRRO (Virtual Romania) [18,19] is a multi-user web platform, serving both as an informational and promotional tool of a Romanian network of virtual heritage tours, as well as a social hub. It acts as a foundation for the creation of the virtual tour network and fosters a community that remains active and engaged within the platform.
The extensive model of the platform includes layered functionalities that become accessible according to the status of the user and the desired business model. The model includes 3 major categories of users (institutions, creators, and visitors), that branch out according to their specific use case (Figure 1), paid subscription plans being made available for institutions and creators. Although not implemented in the prototypal phase of the project, monetization integration would fully convey the self-sustained status of the platform.
Initially, the platform was envisioned to support a comprehensive model incorporating verified institutions and creators, alongside general users. Verified creators, who would confirm their identity through official documents, and institutions opting for paid subscriptions, were granted expedited content upload privileges and promotional advantages. This tiered access not only ensured content quality and authenticity but also allowed for a regulated community where interactions and contributions were systematically curated.
However, to foster inclusivity and stimulate user-generated content, the prototype adopts a more streamlined approach. The revised user categories simplify the model to general users, content creators, and administrators, each with tailored access.

3.1. Functionalities

In the initial launch of VRRO, the primary objectives were to provide users with a rich and interactive experience quickly and to gather user feedback for future enhancements. The platform's core modules, including the interactive map, the social module, the virtual tour gallery, and the blog module, have been comprehensively implemented. These features offer users a complete experience, emphasizing ease of use and immediate access to Romania's cultural and natural beauty.
While the main modules of VRRO are operational and provide a full user experience, specific areas have been identified for future development. The platform currently lacks automated content moderation for user-uploaded content, advanced image compression, and request queuing processes. Additionally, the implementation of a custom-built ID verification system using computer vision technology is planned but not yet realized. Future enhancements also include the development of animated virtual tours, incorporating video uploads, frame capturing, and a corresponding viewer. The foundational tools for this feature are in place, but full implementation awaits.
Therefore, the initial version of VRRO stands as a comprehensive yet evolving foundation, designed to adapt and expand based on user feedback and technological advancements. The aim is to continually refine and enhance the virtual tourism experience, making VRRO a dynamic and responsive platform in the virtual tourism landscape.

3.1.1. Virtual tours gallery

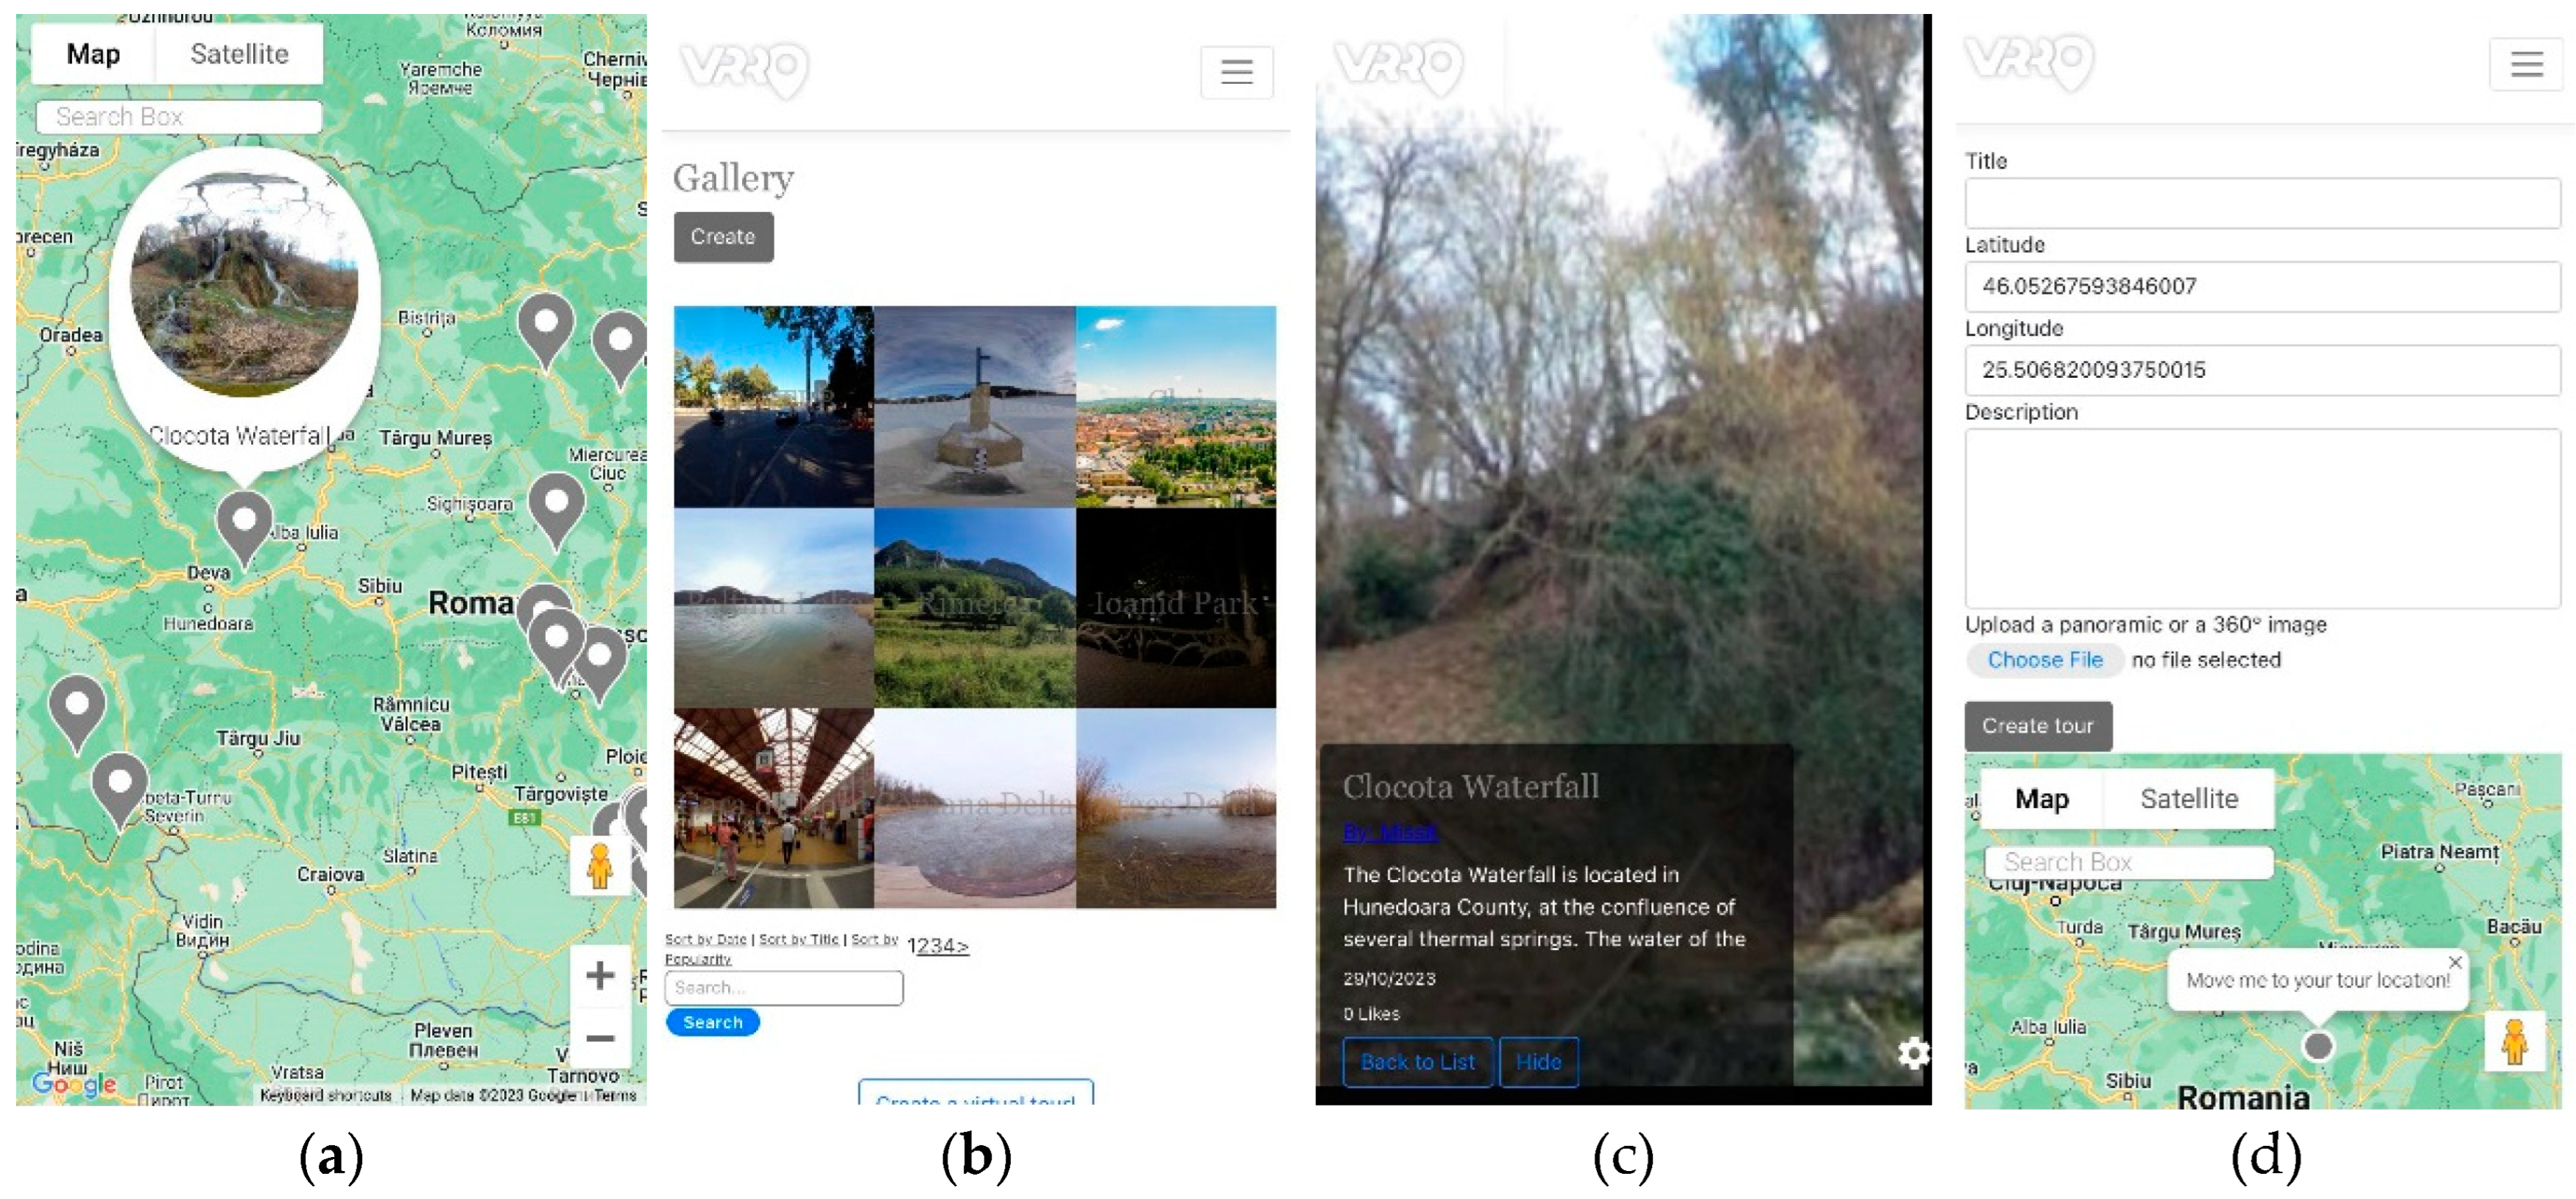
One of the VRRO's primary features is the VT gallery, allowing users to filter and search tours automatically ordered by popularity. Additionally, an alternative viewing mode is provided through an interactive map, granting users a geographical perspective of the showcased locations. These virtual tours are available as non-immersive VR, mobile augmented virtuality (AV), allowing sensor input, and fully immersive mobile VR, with the help of smartphone VR Mounts. The mobile VR functionality offers a highly immersive [20] and low-interactive experience, allowing users to delve into static 360° VT of diverse Romanian tourist attractions.
Figure 2. Four major pages of the VT module: the map (a), the gallery (b), the single tour view (c), and tour creation form (d).
Preprints 91445 g002
Another pivotal feature is the VT creation toolset. Beyond just viewing, registered users are endowed with the capability to upload and design their own virtual tours. In the creation process, the challenge of finding and entering the tour location is solved with the use of a map submodule with a single pin serving as input. The pin's position can be adjusted via direct drag on the map or location search (using a string that represents the name or address).
The VRRO platform is designed for accessibility across various devices, using the Panolens.js [21] library to ensure cross-compatibility and optimal performance. This library, complemented by custom CSS rules, guarantees that the virtual tour views are correctly displayed on desktop interfaces, mobile devices, and mobile VR equipment. The platform's multi-platform approach is integral to providing users with a flexible and immersive virtual tourism experience, catering to diverse preferences, whether it's through traditional desktop interaction, the portability of smartphones and tablets, or the immersive capabilities of mobile VR devices.
The settings menu allows users to change their tour viewing experience by selecting their preferred control and view mode. The control options include sensor-based navigation using a gyroscope for a more immersive experience, particularly on mobile devices, or traditional mouse and touch inputs for desktop and standard mobile use. For the view mode, users can choose between normal, cardboard, or stereoscopic views. The fully immersive mode is accessible on mobile devices by combining sensor data as the control setting with either the cardboard or stereoscopic view modes. These customizable settings ensure that users can enjoy a seamless virtual tour experience on the VRRO platform, regardless of their device or preferred mode of interaction.
Figure 3. The mobile VR view is accessible through the selected settings.
Preprints 91445 g003

3.1.2. Social module

The platform's commitment to fostering community engagement is evident in its social component. Users are empowered to create personal profiles, facilitating interactions such as comments, likes, and direct messaging. Ensuring user trust, all interactions are meticulously stored in compliance with the General Data Protection Regulation [22].
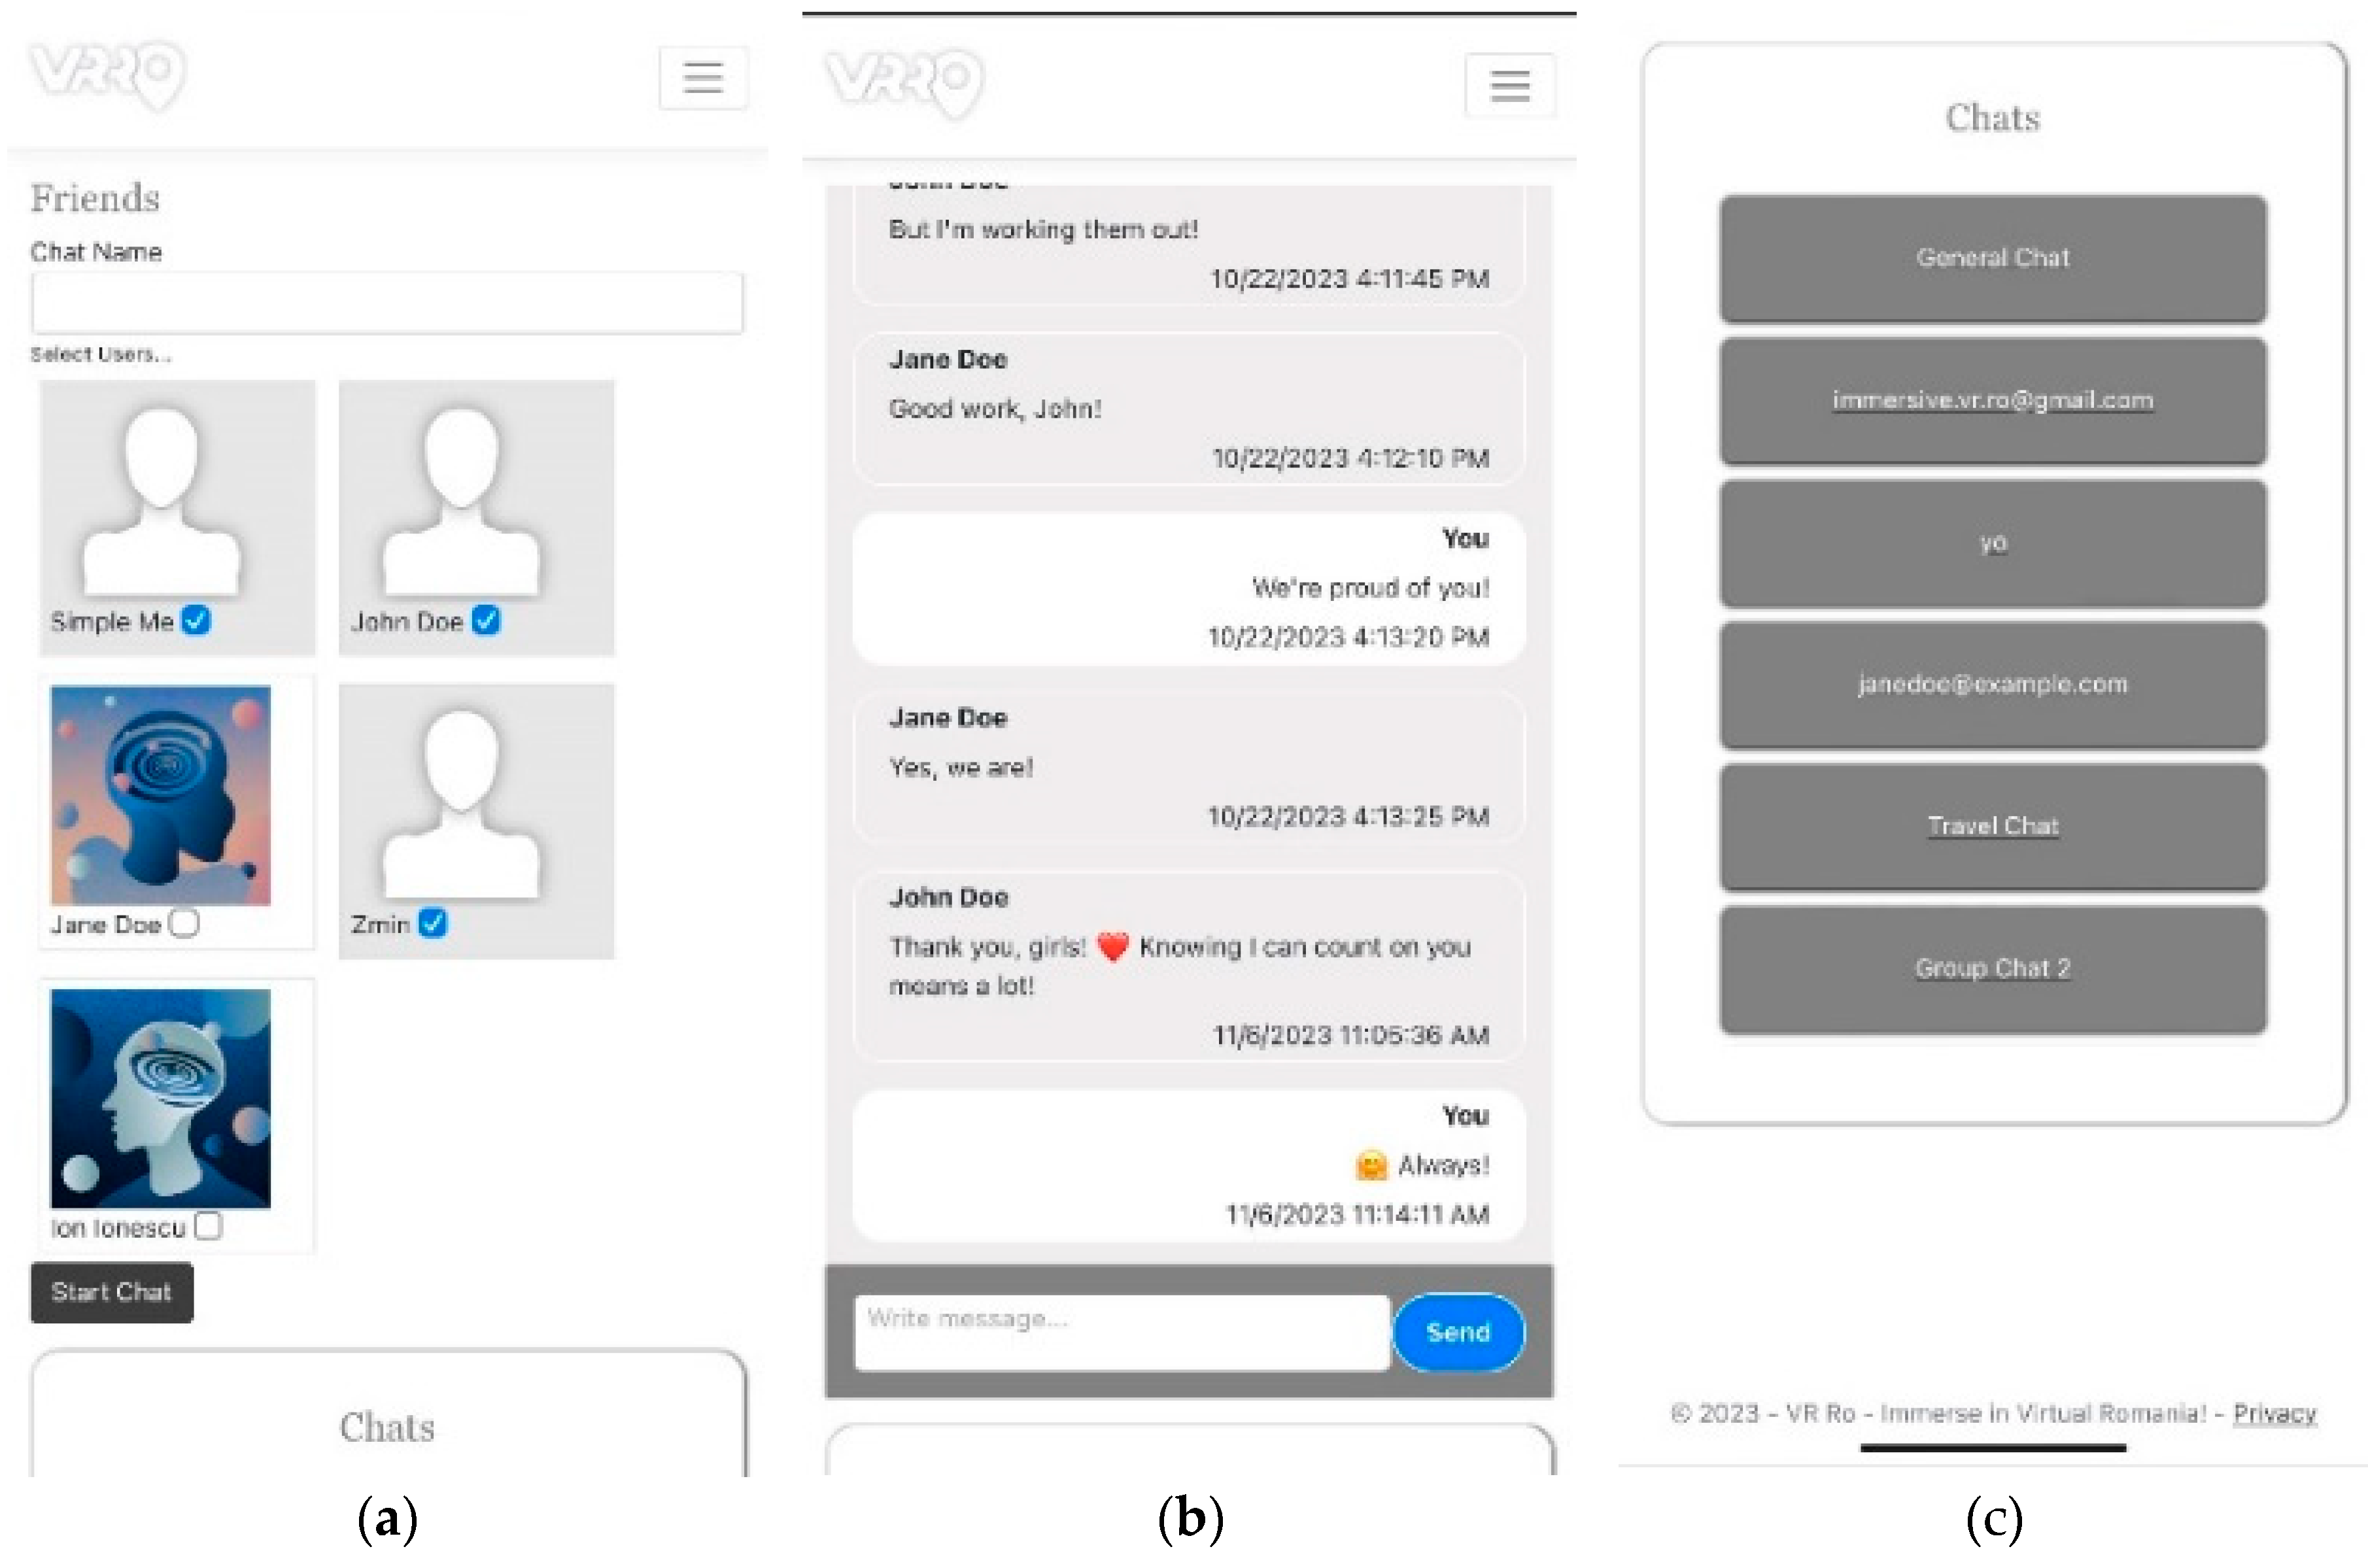
The social module of the VRRO platform encapsulates a real-time chat feature. By integrating SignalR [23], a powerful real-time web functionality library for ASP.NET, the platform delivers instant messaging capabilities through a persistent, bidirectional connection between the server and connected clients.
The social module is accessible to registered users. However, interactions are limited to befriended users. Only those who made a public presence through posts or comments have accessible profiles and can receive friend requests.
Figure 4. The social module's main pages: friend list (a), chat (b), and chat list (c).
Preprints 91445 g004

3.1.3. Blog

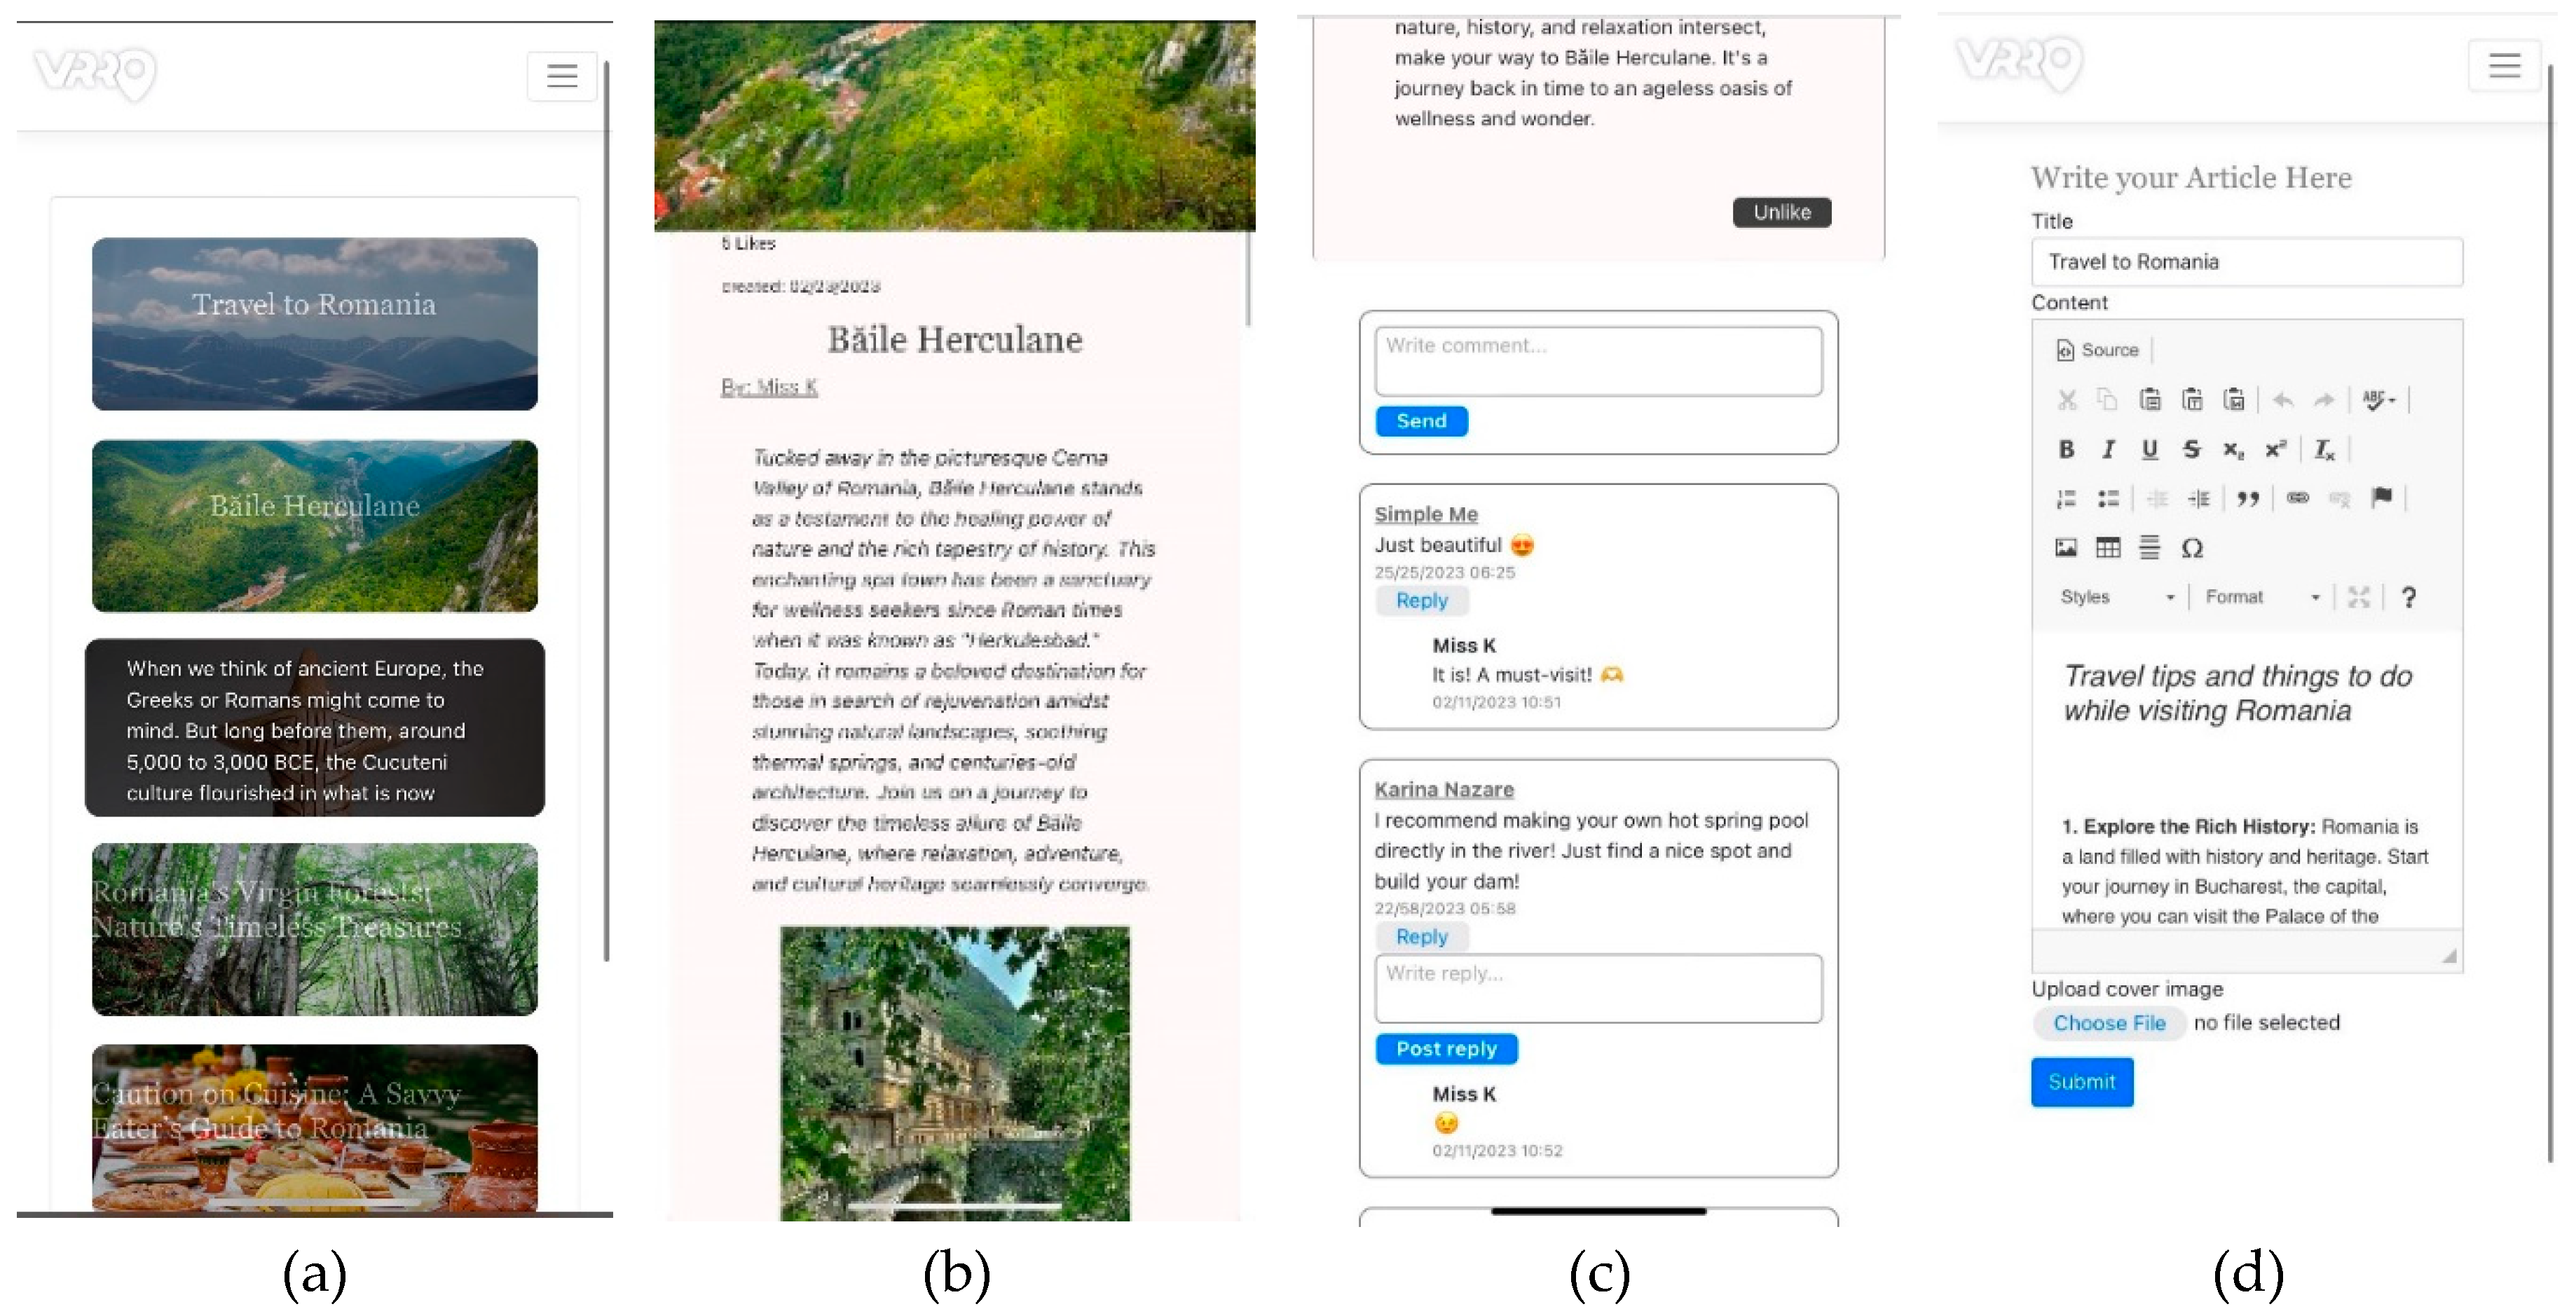
Complementing its virtual tour offerings, the VRRO platform also serves as a hub for tourism-related content through its Blog section. Both individual enthusiasts and institutional partners can contribute articles centered on tourism themes. To encourage reader engagement, functionalities such as commenting and voting through liking articles have been integrated.
The integration of the CKEditor [24] library in the blog's text editor allows for rich content creation. Users can easily style text and incorporate images, facilitating the production of visually appealing and well-formatted articles.
Figure 5. The informational blog also plays a major role in user engagement and interaction. The figure presents the article list (a), single-article view (b) and associated comments (c) and the article creation form (d).
Preprints 91445 g005

3.1.4. User engagement

To encourage user activity and reward engagement, the gamification module introduces elements such as badges for active users. It also promotes popular articles or tours, ensuring that quality content gets the recognition it deserves.
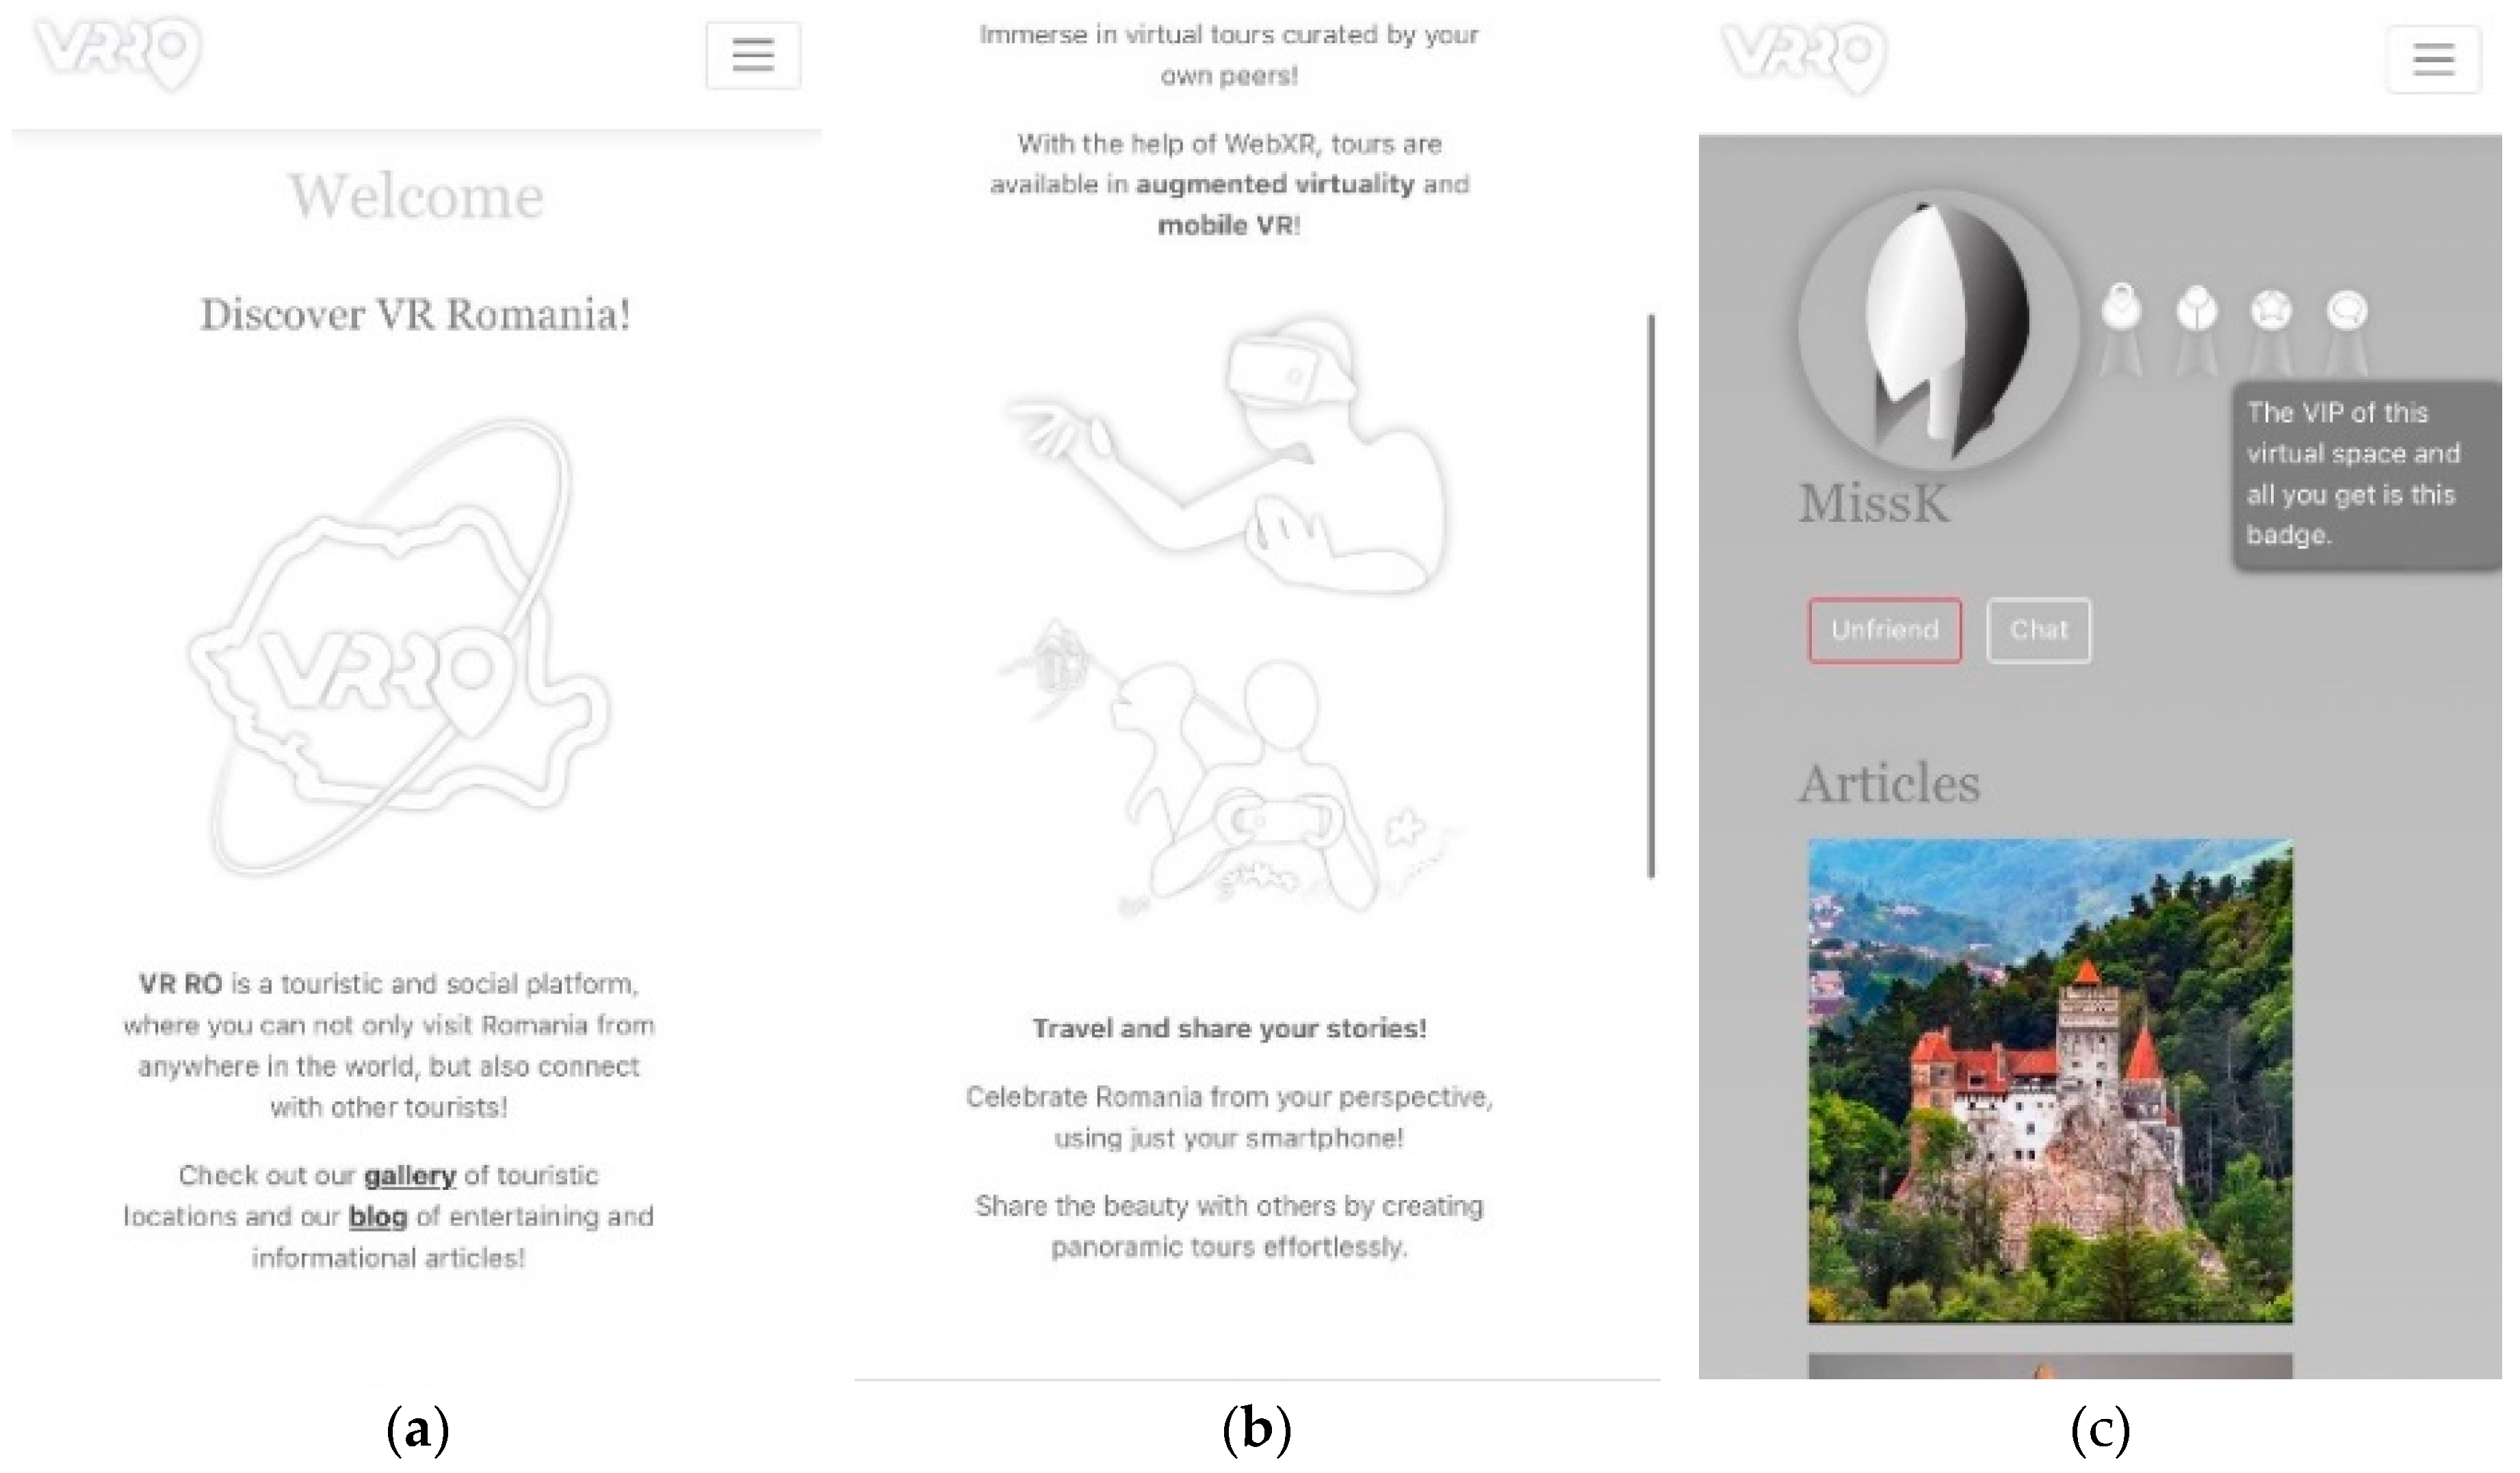
The visitors are encouraged to become a part of the community through the welcoming messages on the site’s landing page and encouraging messages on buttons that lead to account-creating actions or VT-creating actions if logged in.
VRRO employs a gamification strategy that rewards users with badges for various levels of engagement. These badges include the Community Badge, awarded for engaging in multiple posts or chats; the Explorer and the Informer Badges, for users who actively create gallery or blog posts, respectively; and the VIP Badge, for those whose posts exceed in popularity. This system not only incentivizes user interaction but also acknowledges and celebrates the contributions of active members within the VRRO community.
Figure 6. Users are encouraged to take an active part in the community (a, b) and are rewarded (c).
Preprints 91445 g006

3.2. Architecture

VRRO is designed with a combination of distributed, Three-Tier, and Model-View-Controller (MVC) architectures. This integration ensures scalability, maintainability, and efficient data processing, with a focus on distributed functionalities across various services and components.
The Three-Tier architecture provides a structured approach by dividing the application into three distinct layers: the presentation layer, the business logic layer, and the data layer. Within this structure, the platform’s architecture is built on a robust and scalable .NET Core framework [25], integrating a Model-View-Controller (MVC) design pattern that divides the application into logical units to enable efficient development, testing, and maintenance. Each functional module (Social, VT Gallery, Blog, Map) consists of models, views, and controllers, using specific services or libraries that facilitate their functionality. Entity Framework Core [26] is used in the backend for object-relational mapping, ensuring smooth data transactions with our Azure-hosted distributed database [27].

3.2.1. Presentation Layer

The presentation layer primarily consists of Views from the MVC architecture, focusing on user interface and interaction. These Views are dynamically rendered based on the data and logic provided by Models and Controllers located in the business logic layer. This layer is fundamental in defining the user's initial and ongoing interaction with the platform.
The design is minimalist and elegant, providing a user interface that is visually appealing, with a straightforward and intuitive interface. This design choice helps new users quickly learn how to use the platform, improving their overall experience.
Additionally, the presentation layer has a responsive design. This means it works well on a variety of devices, from desktop computers to mobile phones and tablets. The platform is robust and easy to understand, with content that is easy to read and helpful input assistance. While the platform works in many different scenarios, it is especially well-suited for basic input methods. The platform is designed to be inclusive, offering text alternatives for non-text content, enabling its transformation into various accessible forms.
Overall, the presentation layer of VRRO delivers an accessible, user-friendly, and aesthetically pleasing experience, reflecting the platform's commitment to making Romania's cultural and natural heritage globally accessible and adhering to various accessibility standards [28].

3.2.2. Business Logic Layer

The core of VRRO's functionality lies in its Business Logic Layer. This layer is primarily composed of Controllers, the functional components of the MVC architecture that manages the flow of data within the application (MapController, BlogController, GalleryController, ProfileController, etc.). They interact with models to process business logic, handle user requests, and determine the data presented in the views.
Central to this layer are the Entity Models, intricately mapped to the database tables (e.g.: Post entity model). These models are responsible for more than just data handling; they enforce business rules, including access protocols, formatting rules, and error message management. Complementing these are the Domain-Specific Models, which define the data structure, outline relationships, and establish business rules (e.g.: GalleryPost and BlogPost, which extend the Post entity model).
The layer is further enhanced by specialized services, that manage specific processes or business rules, such as authentication, content management, and the logic behind user interactions (e.g.: ChatHub, FileManagement service, etc.). An integral part of this layer is also the client-side scripts, which include integrations with client-side APIs and support for synchronized real-time services, ensuring a smooth and responsive user experience.

3.2.3. Data Layer

In the data layer, the VRRO Platform utilizes Entity Framework Core [26] as its Object-Relational Mapping (ORM) system. This layer consists of database tables that correspond to Entity Models. Although these Entity Models are part of the business logic layer, they are crucial for the data layer as they directly map to the database, facilitating seamless data management and interaction between the application's business logic and its data storage.
The platform utilizes a relational database model, which organizes data into tables corresponding to entities or to relationships between them. This model is particularly advantageous for its ability to efficiently handle large volumes of data while maintaining strong data integrity and consistency. Compared to other database models, relational databases offer superior flexibility in querying and data manipulation, making them ideal for complex applications like VRRO that require robust data management and sophisticated query capabilities.

3.2.4. Cross-Layer Accessibility of Cloud Services
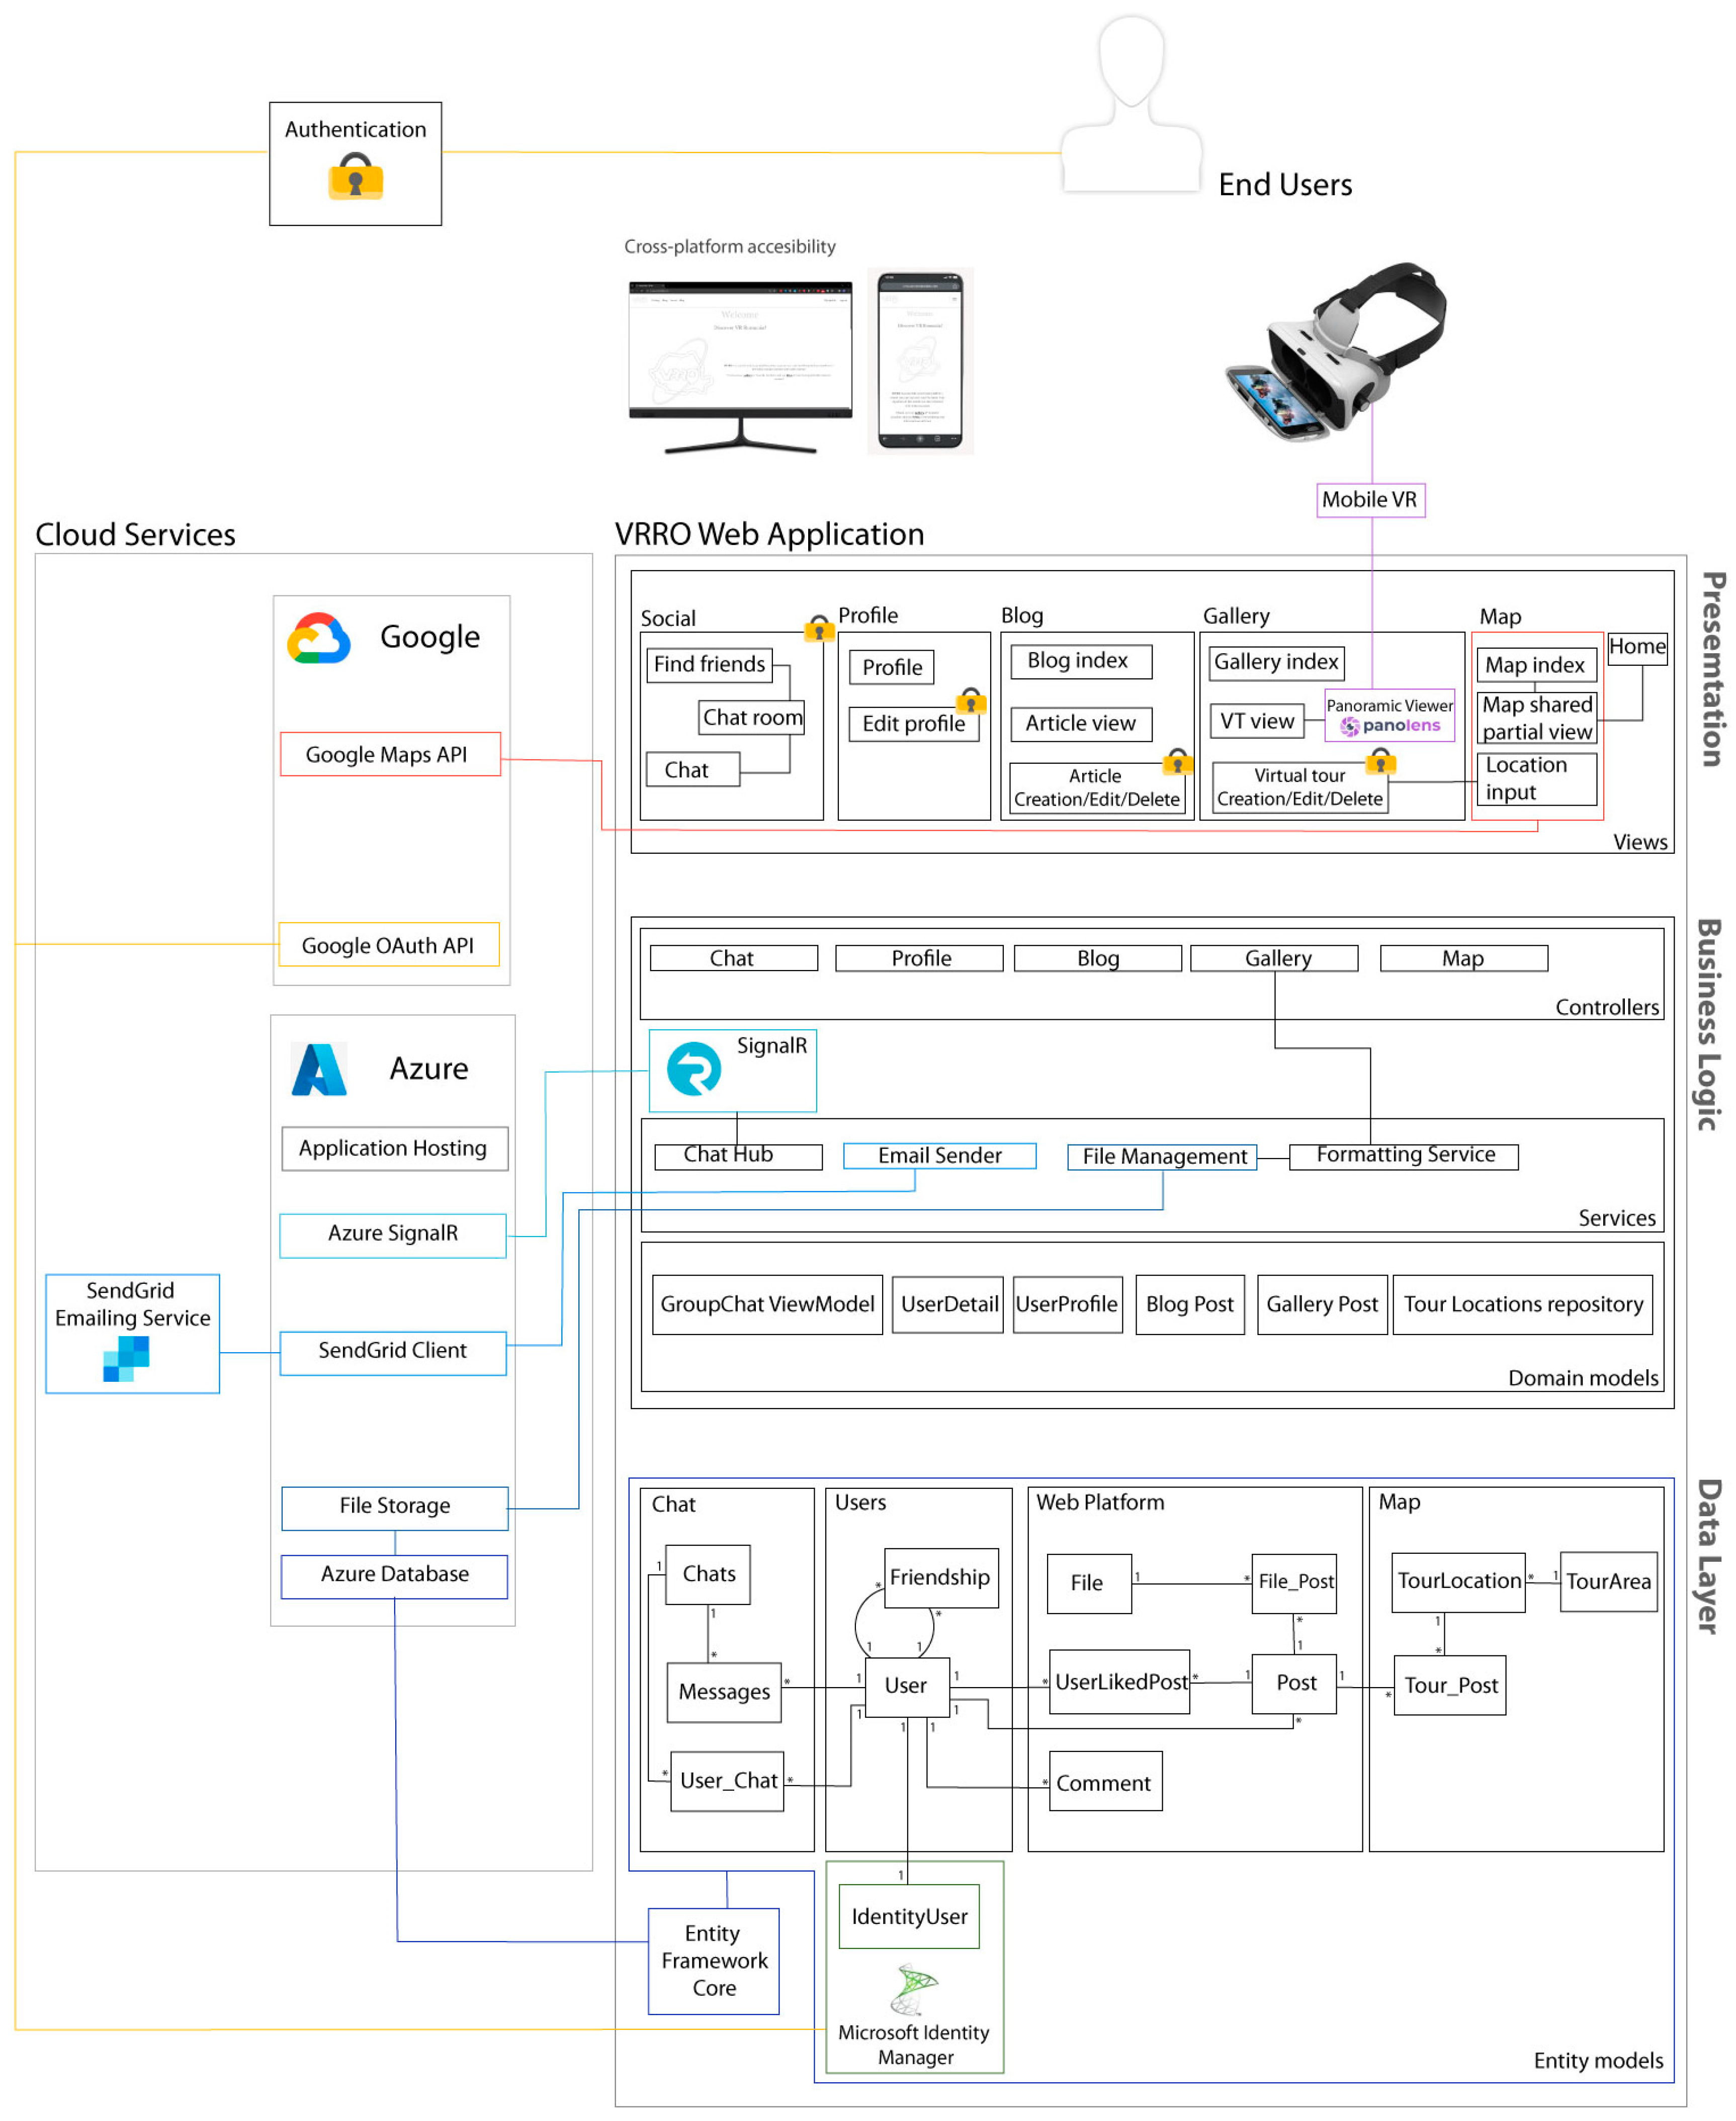
The VRRO platform is characterized by a distributed architecture, a design that spreads its functionalities across multiple computer networks to enhance efficiency and reliability, using Azure cloud hosting [29].
However, VRRO also integrates a range of external cloud services, each contributing unique functionalities to the platform. The following paragraphs present the specific cloud services and functionalities integrated within each of the Three-Tier layers, illustrating how they collectively contribute to the robust and flexible nature of the platform.
In the Presentation and Business Logic Layers, the platform utilizes Google Maps API [30] for dynamic map displays, enriching the user's navigational experience with geographical context. Additionally, the Panolens.js [21] library plays a crucial role in providing immersive virtual tour views, ensuring a seamless and engaging user experience across different devices.
At the Business Layer, the platform's core functionalities are supported by a suite of services. Microsoft's Identity Service ensures secure user authentication and management, while Google OAuth [31] integration offers a streamlined sign-in process. Real-time communication is facilitated by Azure SignalR [23], essential for the platform's chat feature. Furthermore, the SendGrid Emailing Service [32], integrated within the Azure framework, handles email communications.
Within the Data Layer, which includes Hosting and Infrastructure, Azure Files storage [27] is employed for efficient file management. The Azure Database [27] is used for data management, offering scalability and robust performance. The Microsoft Identity Management platform [33], beyond authentication, also contributes to the management of user data tables.
Figure 7. Architecture and components diagram: a structured overview of the VRRO Web Application, detailing its interactions with external Cloud Services and between different modules within the application.
Preprints 91445 g007

4. Empirical Study

An empirical study has been conducted to evaluate the platform's ease of adoption by users. This assessment is crucial to gauge the platform's potential for integration into potential tourists’ practices and to cater to their distinct needs. Through the analysis of received feedback and collected data, the aim is to pinpoint the platform's strengths and areas that might require enhancements to optimize its adoption among the target audience.

4.1. Methodology

To gain a comprehensive understanding of the user experience on the VRRO platform, a mixed-methods approach was chosen. This allows for both quantitative assessments of user experience metrics and qualitative insights into user behaviors, motivations, and feedback.
A convenience sampling method was employed, leveraging peers, friends, and acquaintances primarily through social media outreach and direct contact. This approach was chosen due to its feasibility and the potential to gather diverse feedback quickly. While the study did not set strict demographic controls, the participant pool inherently consisted of tech-accustomed users, ensuring a basic level of technological comfort. This demographic is particularly relevant as the study aims to understand the attitude of users who are already curious or prone to adopt such technologies.
The data collection instruments that have been used are:
  • Quantitative: The short form of the User Engagement Scale (UES) [31] is employed to gather numerical data on user engagement. Additionally, it included participant ratings of platform modules, self-assessed digital familiarity, and evaluations of future engagement intentions, offering a comprehensive view of user interaction and platform impact.
  • Qualitative: Open-ended questions were used to collect qualitative data, providing deeper insights into users' experiences and perceptions. This approach captured feedback on specific platform modules, suggestions for improvements, and challenges encountered during interaction. It also included aspects related to technology usage and participants' self-evaluation of their activity on the platform.
Participants were provided with access to the VRRO platform and asked to interact with it for a comfortable duration. Post-interaction, participants completed the feedback questionnaire [34] consisting of the demographic questions (age, prior engagement with such technologies, interest, platform of use), the short form of the UES (Table 1), module-specific rating of platform functionalities, self-rating of users’ activity, impressions (open-ended questions).
Rating or self-scoring questions’ answers are in the form of 5-point Likert scales, with values corresponding to the context. For example, ‘How often did you upload virtual tours’ would have the answers ‘Never’, ‘Once’, ‘Twice or thrice’, ‘Multiple times’, or ‘Often’. Their feedback is recorded [35] and analyzed to draw insights.

4.2. Results

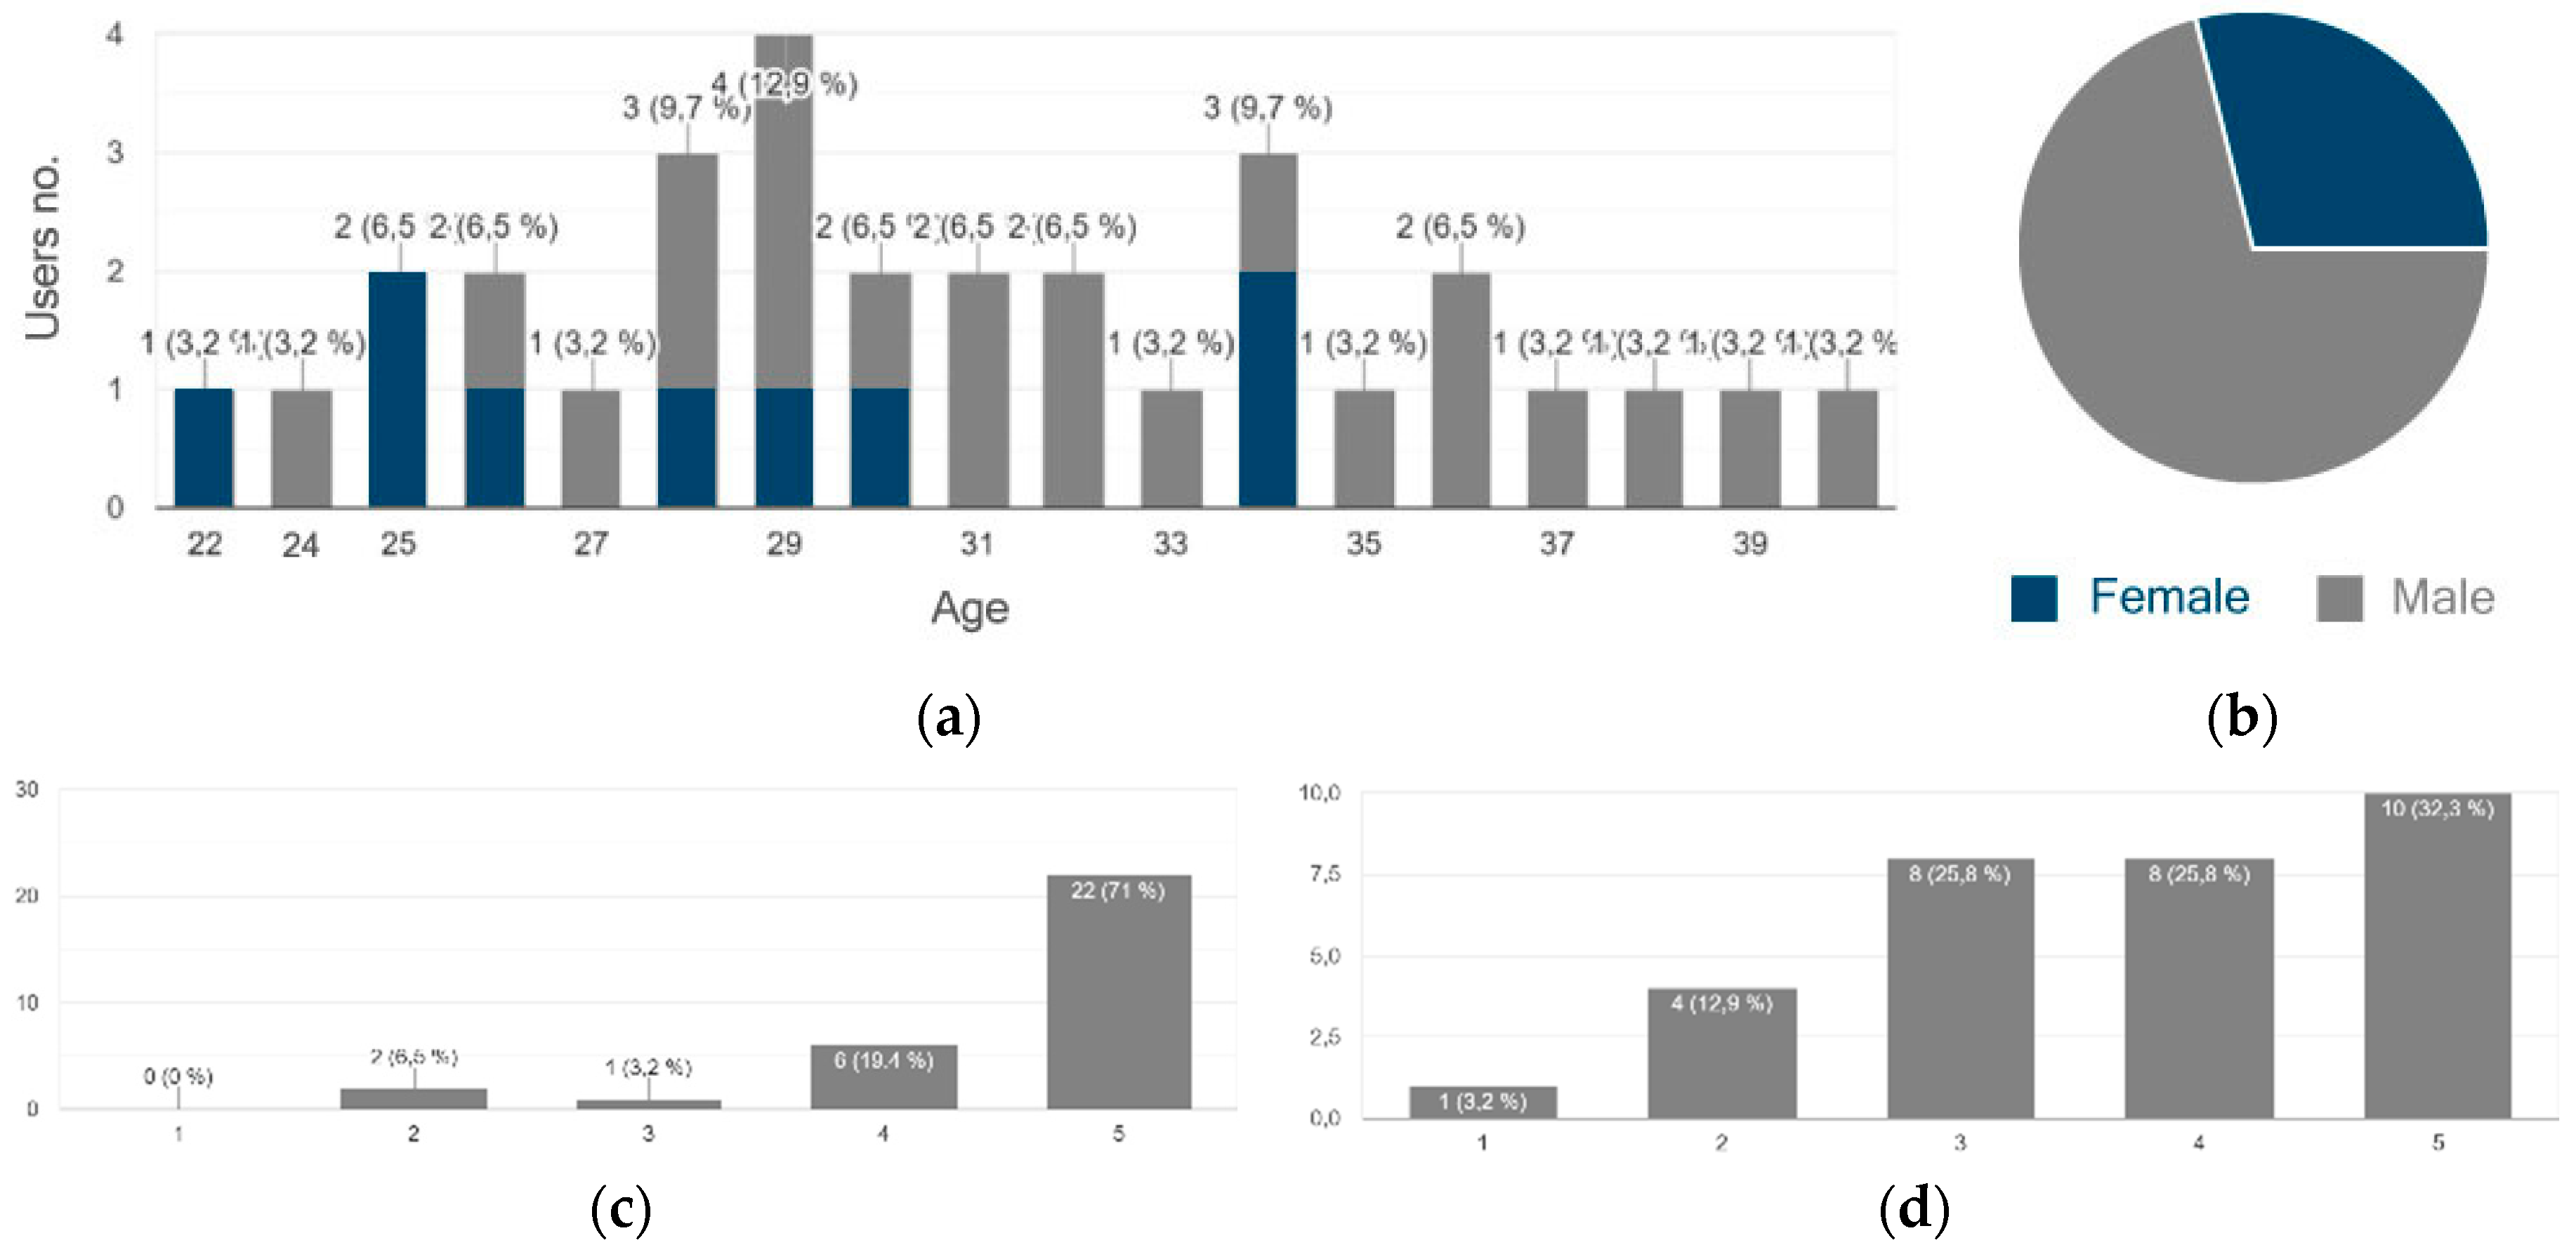
The results included answers from 31 users, 9 female (29%) and 22 male (71%), of ages ranging from 22 to 42 years old, all past or present visitors of Romania, with the intention of traveling within Romania in the future. Users rated their familiarity with web technologies highly, with a mean score of 4.5 out of 5, while immersive technologies familiarity ratings had a mean score of 3.7 out of 5.
Figure 8. User demographics: age (a) and gender (b), and reported familiarity for web (c) and immersive (d) technologies.
Preprints 91445 g008
The devices used for accessing the platform were preponderantly mobile (21), and the most used operating system iOS. Four participants used both mobile and desktop devices in their experience, and 9 only desktop devices.
Figure 9. Preferred platform access. (a) 70% of surveyed users preferred access by mobile devices; (b) the preferred operating system is iOS (41.9 %).
Preprints 91445 g009

4.2.1. Activity

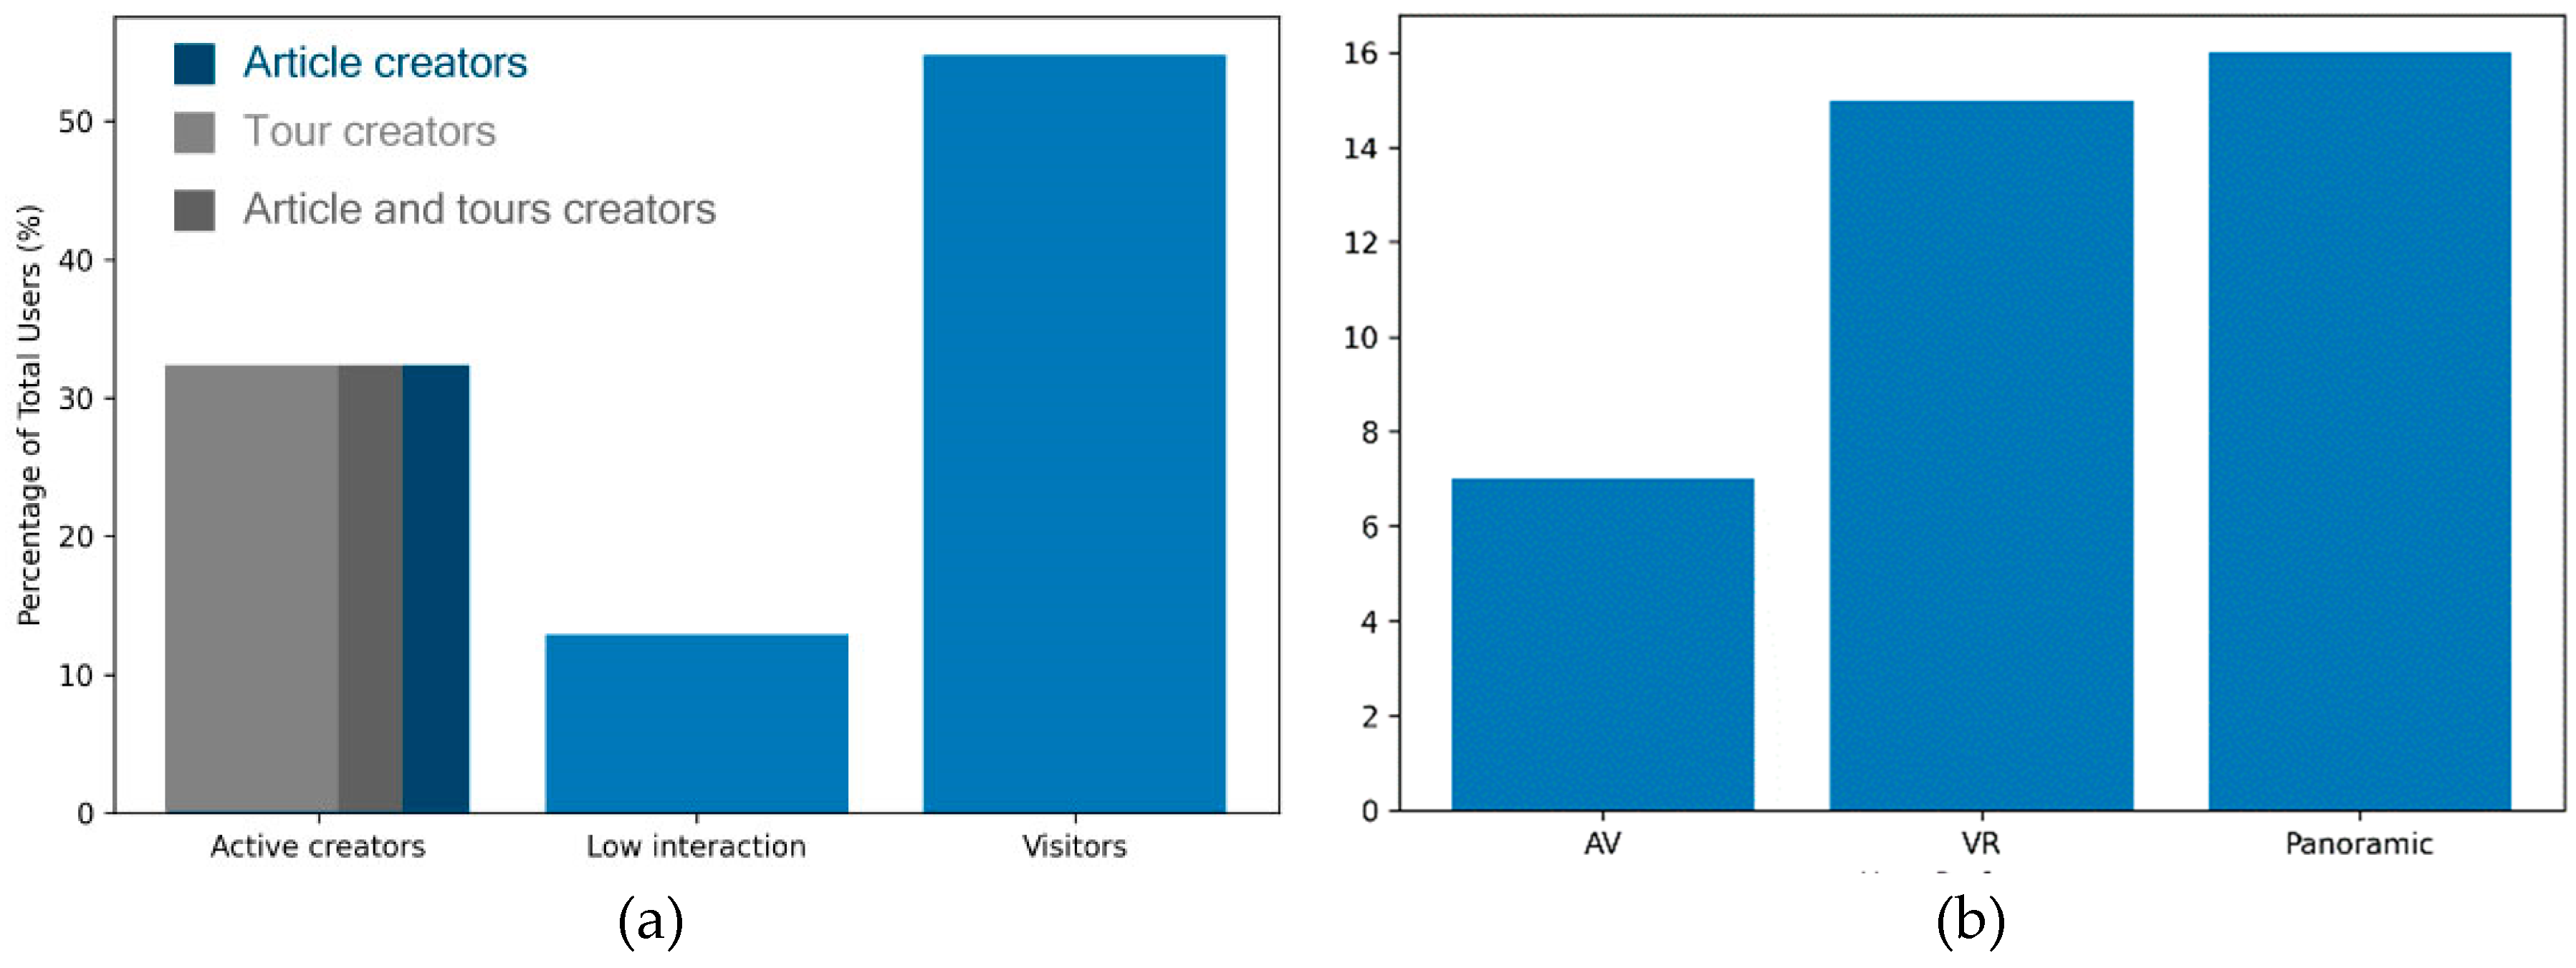
We categorized our users based on their level of interaction with the platform from a pool of 31 participants. A total of 10 users, representing 32.3% of the sample, were identified as 'Active creators.' Within this group, 60% (6 users) created tours, 20% (2 users) wrote articles, and another 20% (2 users) contributed to both the gallery and blog posts. These individuals were not only frequent visitors but also actively engaged with the platform's features.
A smaller segment, consisting of 4 users (12.9%), showed 'Low interaction,' participating minimally and preferring to engage through voting or commenting on posts rather than creating content.
Among the active 14 users, 14.3% (2 users) never voted, 71.4% (10 users) voted multiple times, and 14.3% (2 users) voted once. For commenting, 21.4% (3 users) did so once, 28.6% (4 users) commented more than once, and 50% (7 users) never commented at all. 28.6% (4 users) befriended other users and only 14.3% (2 users) of the active users received badges, a reward for high levels of activity.
The 'Visitors,' who primarily used the platform to view content, constituted the majority, with 17 users making up 54.8% of the total participants. This group's interaction was characterized by significantly less content creation and interaction compared to the other groups.
Figure 9. User classification by activity (a) and user preferences of viewing virtual tours (b).
Preprints 91445 g010
29% of the participants favored a traditional approach of VT viewing, engaging exclusively with basic panoramic views on desktop interfaces, aligning with the 9 users that used exclusively desktop devices.
A significant majority, approximately 68%, utilized mobile devices to access the tours, indicating a preference for more immersive experiences. Within this mobile user segment, a small proportion, roughly 10%, experimented with augmented virtuality, which integrates the physical environment with digital overlays through device sensors. A larger portion, 48%, opted for a virtual reality format, suggesting a preference for a fully immersive digital experience.
Notably, 23% of participants were inclined towards a hybrid approach, engaging with both basic panoramas and VR formats. This indicates a non-exclusive, exploratory interaction with the available technological modalities.

4.2.2. Engagement

The platform's commitment to delivering a seamless and engaging user experience is reflected in the ratings provided by our diverse user base. To capture the essence of this experience, we have analyzed the UES scores alongside the ratings for open-access modules and specialized features accessible to active users. This analysis not only sheds light on the overall satisfaction but also allows us to discern patterns across various user segments.
Table 2. Summary of User Engagement Scale scores.
Factor Focused Attention FA 1 FA 2 FA 3 Perceived Usability Aesthetic
Appeal
Reward Factor UES
(Overall)
Score 2.97 2.29 3.23 3.39 4.56 3.70 3.97 3.81
The lower scores in the FA factor of the UES for the VRRO platform align with the platform’s primary function as an informational and educational tool. The platform's minimalist aesthetic, characterized by a simple color scheme and a straightforward interface, facilitates easy navigation and efficient information consumption. However, this design approach, while effective for its intended purpose, does not inherently promote deep immersion or a sense of escapism, which are typical contributors to higher FA scores.
The content and interaction style on VRRO, including article viewing, virtual tour exploration, and chatting, are primarily structured for information exchange rather than immersive engagement. The VR mode, offering static image views, provides a basic level of virtual experience but lacks interactive or dynamic elements that could lead to higher levels of user absorption. This focus on information delivery over immersive interaction is reflected in the FA scores, particularly in the lower ratings for the first statement, "I lost myself in this experience."
Future enhancements to VRRO could aim to increase user immersion and engagement, by incorporating engaging narratives, interactive tutorials, and enhanced VR experiences. However, any such enhancements should be carefully balanced with VRRO's core informational and educational objectives, ensuring that the platform remains true to its primary purpose while enriching the user experience.
The survey questions also assessed users' intent to use the platform for travel-related activities and their likelihood to recommend it to others. These responses were used to create an endurability index, mirroring the concept from the long-form UES, which reflects users' long-term engagement and potential for recommendation.
Table 3. Engagement endurability scores.
Question Categories Average Score
Commemorate Travels 4.10
Connect with Travelers 3.65
Pre-travel Information 4.06
Inform Other Travelers 4.10
Future Platform Use 3.94
Recommend to Friends 4.23
Drive Index 3.98
Endurability Index 4.05
The Drive Index, with a calculated value of 3.98, serves as a quantitative measure of users' immediate motivation to engage with the VRRO platform. This index is derived by averaging responses to four key questions that assess users' intentions to use the platform for specific activities: commemorating travels, connecting with travelers, gathering pre-travel information, and informing other travelers. This high score suggests that the platform successfully meets user needs and interests.
The Endurability Index, with a value of 4.05, reflects the long-term potential of user involvement and the likelihood of users recommending the platform to others. It is calculated by averaging the Drive Index and responses to the next two questions, regarding future platform use and the propensity to recommend the platform to friends. The score underscores the platform's capability to not only attract users initially but also retain them over time, indicating a strong potential for building a loyal user base and fostering community growth.
Another section of the user feedback questionnaire focused on user satisfaction with specific modules of the platform (the Map, the Blog, and the VT Gallery). Overall ratings for the open-access modules—Map, VT Viewer, and Art Viewer—indicate a consistently positive experience, with scores exceeding 4 out of 5 (Table 4). This suggests a high level of satisfaction with the platform's core functionalities available to all users.
The specialized features, such as Article Creation, VT Creation, and Chat, evaluated only by our 14 active users, also received favorable ratings, with the Article Creation module standing out with the highest scores. This reflects the platform's ability to cater to content creators with tools that are both functional and user-friendly.
When segmenting the data, nuanced variations in ratings based on users' expertise with web and immersive technologies are observed. Notably, participants who reported high technological familiarity tended to rate the modules slightly higher than the others, pointing to a correlation between technological familiarity and user satisfaction.
Table 5. Overall experience ratings.
Module UES Open access modules Advanced features Endurability
Rating 3.81 4.06 3.76 4.05

4.2.3. The influence of digital literacy on experience

In the initial stage of our analysis, we concentrated on the distribution of user engagement scores (UES), technology familiarity assessments, and ratings of the open-access modules (accessible for both visitors and authenticated users) —datasets encompassing information from all 31 participants. The selection of these data sets for normality testing was driven by our aim to understand the underlying patterns of user interaction with the platform.
Before presenting the normality of these distributions, we present an overview of overall ratings by user engagement factors and technology familiarity. This summary (Table 6) provides a baseline understanding of how users with different levels of digital literacy perceive various aspects of the platform, setting the stage for a deeper analysis of distributional characteristics.
Preliminary analysis of the overall ratings suggests a pattern where participants with higher familiarity with web and immersive technologies tend to report slightly higher engagement scores across the individual factors of the User Engagement Scale, as well as overall the UES. Similarly, the ratings for the Virtual Tour (VT) Viewer, Article Viewer, and Map functionalities also appear marginally higher among these users.
By assessing the normality of these distributions, we aim to validate the appropriateness of the statistical methods used for further comparative analysis. The following table encapsulates the results of the Shapiro-Wilk test and key descriptive statistics, providing a snapshot of the data's distribution.
Table 7. Data Normality and Descriptive Statistics for Key Study Variables.
Variable Shapiro-Wilk W p-value Average (x̄) Std. Deviation (S)
UES 0.9749 0.6616 3.8118 0.5137
VT Viewer 0.8253 <0.001 4.0323 1.016
Article Viewer 0.7897 <0.001 4.129 1.0565
Map 0.8174 <0.001 4.0323 1.0796
Web Familiarity 0.5904 <0.001 4.5484 0.85
XR Familiarity 0.875 0.0018 3.7097 1.1603
The comparative analysis of user engagement and module ratings across different levels of technology familiarity revealed no statistically significant differences (Table 8). The UES scores, which reflect user engagement, showed a slight tendency for higher engagement among users familiar with immersive technologies, but this did not reach statistical significance. Similarly, the ratings for the open-access modules did not differ significantly between users with high or low familiarity with web and immersive technologies. The effect sizes were generally small, indicating minimal practical differences in perceptions between the groups. This suggests that familiarity with the technology did not markedly influence the users' engagement or their perception of the platform's modules. This may also imply that these factors may not have a substantial impact on the user experience within the sample studied.

4.2.4. Qualitative insights

To draw qualitative insights into users' experiences, four open-ended questions were posed to assess their candid opinions on the platform's usability and features. Users expressed a strong affinity for the platform's core functionalities, particularly the ease of creating and viewing virtual tours and the informative content provided by the map feature and blog posts. The platform is seen as a valuable tool for travel enthusiasts, especially those interested in virtual reality and photography, with many users indicating they would recommend it to close friends and family who share a passion for travel.
However, users also highlighted areas for improvement, suggesting a need for a more engaging user interface and additional functionalities such as video uploads and social media integration. Technical issues such as slow loading times and navigation difficulties were noted as annoyances that detract from the overall experience. Despite these challenges, the concept of 'pre-visiting' destinations resonated well with users, pointing to the platform's potential as a planning tool for explorers and adventurers. These insights suggest that while the platform's concept is well-received, focusing on design elegance, technical refinement, and community-building features could significantly enhance user satisfaction and engagement.

4.3. Discussion

The empirical study conducted on the VRRO platform offers valuable insights into user engagement and the platform's potential for widespread adoption. The mixed-methods approach, combining the User Engagement Scale with qualitative feedback, has painted a comprehensive picture of the user experience, highlighting the platform's strengths and areas for improvement.
Quantitatively, the platform demonstrates strong engagement, with the Endurability Index suggesting a high likelihood of sustained use and recommendations to others. This is indicative of a successful user interface and experience design that resonates with the target audience. The high ratings for the platform's core functionalities, such as the Map and VT Viewer, underscore the effectiveness of these features in meeting user needs and expectations.
Qualitatively, the feedback points to a user base that values the platform's utility for travel planning and connection with other travelers. The enthusiasm for creating and viewing virtual tours suggests that VRRO has tapped into a niche that is both relevant and exciting for users. However, the call for a more engaging user interface and additional features like video uploads indicates room for enhancement. Addressing technical issues and improving navigation could further refine the user experience.
The study also reveals that while technological familiarity does influence user satisfaction to some extent, it is not a significant barrier to engagement. This suggests that the platform has managed to create an accessible environment that can cater to both tech-oriented users and those less familiar with immersive technologies. It is important to note that the study's small sample size may limit the generalizability of these results.

5. Conclusions

The current landscape of virtual tourism is increasingly dependent on digital platforms that facilitate connections among travelers, hosts, and destinations. The VRRO platform, blending web-based social interaction with low-immersive virtual experiences, is designed to cater to a diverse range of user needs. Its empirical evaluation indicates strong user engagement and satisfaction, attributed to its intuitive design and interactive features. The study also underscores the necessity for ongoing interface and functionality enhancements. Overall, VRRO demonstrates the potential of digital platforms to enrich travel experiences, emphasizing the ongoing need for adaptation and improvement based on user feedback and technological progress.

Supplementary Materials

The VRRO platform can be visited at https://vrro.azurewebsites.net/ and its code is available at https://github.com/KarinaNazare/VRRO_MVC. The VRRO User Experience Survey can be accessed at https://forms.gle/8MnQoBPv3Le4vNuk6.

Author Contributions

Conceptualization, A.M., and A.-K.N.; methodology: A.M. and A.-K.N.; software, A.-K.N.; formal analysis, A.-K.N.; validation, A.M. and F.M.; investigation, A.-K.N.; resources, A.M. and A.-K.N.; data curation, A.-K.N.; writing—original draft preparation, A.-K.N.; writing—review and editing: all authors; visualization, A.-K.N.; supervision, A.M. and F.M.; project administration: A.M.; funding acquisition, A.M. All authors have read and agreed to the published version of the manuscript.

Funding

This research was funded by the National University of Science and Technology POLITEHNICA of Bucharest through the “INVEST UPB Proof of Concept” program, (UPB-PoC 2020) project number – PN-III-P1-1.2-PCCDI-2017.

Data Availability Statement

The raw data supporting the findings of this study are openly available in Mendeley Data, under the dataset titled “VRRO User Engagement Survey Data”, at doi: 10.17632/j39dx362p3.1.

Acknowledgments

Additionally, this article was supported via fellowship to A.-K.N. awarded by the Ministry of Investments and European Projects through the Human Capital Sectoral Operational Program 2014-2020, Contract no. 62461/03.06.2022, SMIS code 153735. We thank the participants of the study and, especially, the volunteer students Maria Coroabă and Andrei Lăpușteanu, who supported this research during their internship.

Conflicts of Interest

The authors declare no conflict of interest.

References

  1. Loureiro, S.M.C., Nascimento, J.: Shaping a view on the influence of technologies on sustainable tourism. Sustainability (Switzerland). 13, (2021). [CrossRef]
  2. Sustainable development | UNWTO, https://www.unwto.org/sustainable-development.
  3. An EU initiative to reward innovative and smart tourism in European Cities!, https://smart-tourism-capital.ec.europa.eu/index_en.
  4. El-Said, O., Aziz, H.: Virtual Tours a Means to an End: An Analysis of Virtual Tours’ Role in Tourism Recovery Post COVID-19. J Travel Res. 61, 528–548 (2022). [CrossRef]
  5. Bachiller, C., Monzo, J.M., Rey, B.: Augmented and Virtual Reality to Enhance the Didactical Experience of Technological Heritage Museums. Applied Sciences 2023, Vol. 13, Page 3539. 13, 3539 (2023). [CrossRef]
  6. tom Dieck, D., tom Dieck, M.C., Jung, T., Moorhouse, N.: Tourists’ virtual reality adoption: an exploratory study from Lake District National Park. Leisure Studies. 37, 371–383 (2018). [CrossRef]
  7. Tasse, D., Hong, J., Antin, J.: How Geotagged Social Media Can Inform Modern Travelers. (2017). [CrossRef]
  8. Chan, H.F., Cho, H.J., Lee, H.E.: Examining the Use of Geotags on Instagram: Motivation, Satisfaction, and Location-based Information Sharing in Hong Kong. International Journal of Internet, Broadcasting and Communication. 14, 64–77 (2022). [CrossRef]
  9. Bosmos, F., Tzallas, A.T., Tsipouras, M.G., Glavas, E., Giannakeas, N.: Virtual and Augmented Experience in Virtual Learning Tours. Information 2023, Vol. 14, Page 294. 14, 294 (2023). [CrossRef]
  10. Guttentag, D.A.: Virtual reality: Applications and implications for tourism. Tour Manag. 31, 637–651 (2010). [CrossRef]
  11. Singh, S., Bashar, A.: A bibliometric review on the development in e-tourism research. International Hospitality Review. 37, 71–93 (2021). [CrossRef]
  12. Guedes, A., Faria, S., Gouveia, S., Rebelo, J.: The effect of virtual proximity and digital adoption on international tourism flows to Southern Europe. Tourism Economics. 29, 1643–1661 (2022). [CrossRef]
  13. Garcia-Haro, M.A., Martinez-Ruiz, M.P., Martinez-Cañas, R., Ruiz-Palomino, P.: Benefits of Online Sources of Information in the Tourism Sector: The Key Role of Motivation to Co-Create. Journal of Theoretical and Applied Electronic Commerce Research 2021, Vol. 16, Pages 2051-2072. 16, 2051–2072 (2021). [CrossRef]
  14. Lee, H., Chung, N., Nam, Y.: Do online information sources really make tourists visit more diverse places?: Based on the social networking analysis. Inf. Process. Manag. 56, 1376–1390 (2018). [CrossRef]
  15. Liu, X., Mehraliyev, F., Liu, C., Schuckert, M.: The roles of social media in tourists’ choices of travel components. Tour Stud. 20, 27–48 (2020). [CrossRef]
  16. Kurniasari, K.K., Ayu, J.P., Octavanny, V.: Understanding Tourists’ Motivation in Virtual Tour. International Journal of Applied Sciences in Tourism and Events. 6, 31–41 (2022). [CrossRef]
  17. Pratisto, E.H., Thompson, N., Potdar, V.: Immersive technologies for tourism: a systematic review. Information Technology & Tourism 2022 24:2. 24, 181–219 (2022). [CrossRef]
  18. Home Page - VR Ro, https://vrro.azurewebsites.net/.
  19. KarinaNazare/VRRO_MVC: VR Ro Platform, https://github.com/KarinaNazare/VRRO_MVC.
  20. Beck, J., Rainoldi, M., Egger, R.: Virtual reality in tourism: a state-of-the-art review. Tourism Review. 74, 586–612 (2019). [CrossRef]
  21. Panolens.js, https://pchen66.github.io/Panolens/.
  22. EUR-Lex - 32016R0679 - EN - EUR-Lex, https://eur-lex.europa.eu/eli/reg/2016/679/oj.
  23. What is Azure SignalR Service? | Microsoft Learn, https://learn.microsoft.com/en-us/azure/azure-signalr/signalr-overview.
  24. WYSIWYG HTML Editor with Collaborative Rich Text Editing, https://ckeditor.com/.
  25. NET (and .NET Core) - introduction and overview - .NET | Microsoft Learn, https://learn.microsoft.com/en-us/dotnet/core/introduction.
  26. Overview of Entity Framework Core - EF Core | Microsoft Learn, https://learn.microsoft.com/en-us/ef/core/.
  27. Azure SQL Database – Managed Cloud Database Service | Microsoft Azure, https://azure.microsoft.com/en-gb/products/azure-sql/database.
  28. Web Content Accessibility Guidelines (WCAG) 2.1, https://www.w3.org/TR/WCAG21/.
  29. Cloud Computing Services | Microsoft Azure, https://azure.microsoft.com/en-us.
  30. Google Maps Platform - Location and Mapping Solutions, https://mapsplatform.google.com/.
  31. Authentication methods at Google | Google Cloud, https://cloud.google.com/docs/authentication.
  32. Cloud Computing Services | Microsoft Azure, https://azure.microsoft.com/en-us/.
  33. Microsoft identity platform documentation | Microsoft Learn, https://learn.microsoft.com/en-us/entra/identity-platform/.
  34. VRRO User Experience Survey, https://docs.google.com/forms/d/e/1FAIpQLSfZDKQgXiUAwtduKjeBGHRuFr3RHTu__87rEjO2K2wnFjqLWg/viewform.
  35. Nazare, K.: VRRO User Engagement Survey Data. 1, (2023). [CrossRef]
Figure 1. Different account types enable users to interact with the platform at their preferred pace and tailored to their specific needs.
Preprints 91445 g001
Table 1. The Short Form of the User Engagement Scale.
Factor Description Affirmations
FA Focused attention feeling absorbed in the interaction and losing track of time. I lost myself in this experience.
The time I spent using VRRO just slipped away.
I was absorbed in this experience.
PU Perceived usability, negative affect experienced in the interaction, and the degree of control and effort expended. I felt frustrated while using VRRO.
I found VRRO confusing to use.
Using VRRO was taxing.
AE Aesthetic appeal, the attractiveness and visual appeal of the interface. VRRO was attractive.
VRRO was aesthetically appealing.
VRRO appealed to my senses.
RF Reward factor, curiosity, interest, felt involvement, and the overall success of the interaction. Using VRRO was worthwhile.
My experience was rewarding.
I felt interested in this experience.
Table 4. Platform modules ratings.
Module Map VT Viewer VT Creator Article viewer Article Creator Chat
Rating 4.03 4.03 4.00 4.13 4.14 3.14
Table 6. Summary of Overall Ratings by User Engagement Factors and Technology Familiarity.
Factor All
participants
High Web
Familiarity
High XR
Familiarity
Low Web
Familiarity
Low XR
Familiarity
UES 3.81 3.81 3.93 3.81 3.71
VT Viewer 4.03 4.00 4.11 4.11 3.92
Article Viewer 4.13 4.05 4.11 4.33 4.15
Map 4.03 3.95 4.11 4.22 3.92
Table 8. Summary of Mann-Whitney U Test and Effect Size Measures.
Variable Technology familiarity Mann-Whitney U p-value Cohen’s d Glass’s
Delta
Hedges’ g
UES Web 91 .7414 0.008 0.007 0.008
Immersive 102.5 .3843 0.380 0.362 0.377
VT Viewer Web 95.5 .89656 0.121 0.096 0.108
Immersive 110 .79486 0.111 0.106 0.110
Article Viewer Web 91.5 .76418 0.297 0.245 0.270
Immersive 107.5 .71884 0.098 0.094 0.097
Map Web 94.5 .86502 0.273 0.220 0.245
Immersive 106 .67448 0.031 0.028 0.030
Disclaimer/Publisher’s Note: The statements, opinions and data contained in all publications are solely those of the individual author(s) and contributor(s) and not of MDPI and/or the editor(s). MDPI and/or the editor(s) disclaim responsibility for any injury to people or property resulting from any ideas, methods, instructions or products referred to in the content.
Copyright: This open access article is published under a Creative Commons CC BY 4.0 license, which permit the free download, distribution, and reuse, provided that the author and preprint are cited in any reuse.
Prerpints.org logo

Preprints.org is a free preprint server supported by MDPI in Basel, Switzerland.

Subscribe

© 2024 MDPI (Basel, Switzerland) unless otherwise stated