1. Introduction
Since the collapse of the Roman Point apartment in the United Kingdom in 1968, the progressive collapse resistance of the building structures had been received a wide attention in the word for the first time. The progressive collapse of a building structure refers to the structure’s local failure caused by the accidental loads, which is transmitted among the components and triggers a chain reaction, ultimately leading to the collapse of the whole structure, or causing a large-scale collapse of the structure that is disproportionate to the initial local failure [
1].
To analyze the progressive collapse resistance performance and mechanism, a lot of research works were carried out on the building structures, among which the reinforced concrete (RC) structures were the most common building structures [
2]. In terms of the standardized design, the UK takes the lead in formulating the regulations that requires the buildings with five or more floors to consider the effects of accidental loads, and dividing the regulations into three levels, which are the Building Regulations [
3], the Approved Document [
4], and the British Standard [
5]. To enhance the progressive collapse resistance of the building structures, the subsequent requirements propose the need to improve the capacity of key components to resist accidental loads and increase the connection strength of structural components. In the design of high-rise buildings in the United States, the current design codes GSA [
6] and DoD [
7] specify the alternate load path (ALP) method that takes the possibility of progressive collapse into account. However, the Chinese code [
8] stipulates the requirements for the demolition component method and the structural design faced to the progressive collapse resistance, and when the structural safety level is of level 1 or 2, the requirements for conceptual design should be satisfied.
In the field of theoretical research, Starossek [
9] gave the types of progressive collapse of the structures, and classified them into the mixed collapse, the unstable collapse, the pancake collapse, the zipper collapse, the domino collapse, and the cross-sectional collapse. Xiong et al. [
10] studied the progressive collapse performance and mechanism of the RC structures, and derived the resistance calculation formulas for the beam mechanism, catenary mechanism, and composite mechanism by using the analytical methods. Alshaikh et al. [
11] summarized the previous research works on the progressive collapse of the RC structures, and concluded that the mechanism of structural progressive collapse resistance included three stages, which were namely called as the bending action stage (or the Vierendeel stage), the compressive arch action stage, and the catenary action stage, respectively. In addition, among the numerous analysis methods, the ALP method is usually utilized in the experiments or tests to analyze the progressive collapse resistance of the RC structures [
12].
In the numerical analysis and experimental studies, Zhou et al. [13-14] adopted the demolition component method in the experiment to evaluate the progressive collapse resistance of the frame structure under the conditions of dismantling the columns in different parts, and compared the experimental results with the numerical simulated ones obtained by using the finite element method (FEM). The results indicated that the progressive collapse risk of the removed middle column is lower than that of the removed corner column. Based on summarizing the previous research works on the progressive collapse resistance of the remaining structure with one column failure, Qian et al. [
15] conducted an experimental and numerical simulation study on the progressive collapse resistance of the RC structure with both the corner column and the adjacent column failure. It was showed that the mechanical response of the RC beam-slab-column structure under this failure condition was like that of the cantilever slab, and the insufficient horizontal constraints between the beam and slab resulted in the inability to form an effective arch compression mechanism, catenary mechanism, or membrane mechanism to resist progressive collapse. Zhou et al. [
16] conducted the static load tests on the half-scale RC and two half-scale PC substructures bearing the bending moment, and simulated the mechanical behaviors of the remaining structure with dismantling the middle column by using the FEM, and evaluated the remaining structure’s properties resisting the progressive collapse, such as the load transfer mechanism, deformation capacity, steel’s strain, crack distribution, and failure mode.
Although there is a considerable understanding on the collapse performance and mechanism of the structures, most of these research works are focused on the field of frame structure. The large-span ATBCF is a new type of spatial floor structure, and the multi-column frame tube is its combining structure to resist lateral loads [
17]. Although this structural system has the advantages of a large-span structure and assembled structure, such a structure needs to pay more attention to the overall resistance performance of the floor to progressive collapse. However, for the progressive collapse performance of the assembled multi-column frame tube structures or the assembled composite floors, there are few theoretical and experimental studies. In this paper, a numerical calculation and analysis for the remaining structures under different column demolition conditions is conducted by using the ALP method, and the mechanical responses and mechanism of the progressive collapse resistance of the remaining structure are investigated.
2. Structure Model and Mechanical Analysis
2.1. Assembled Structural System
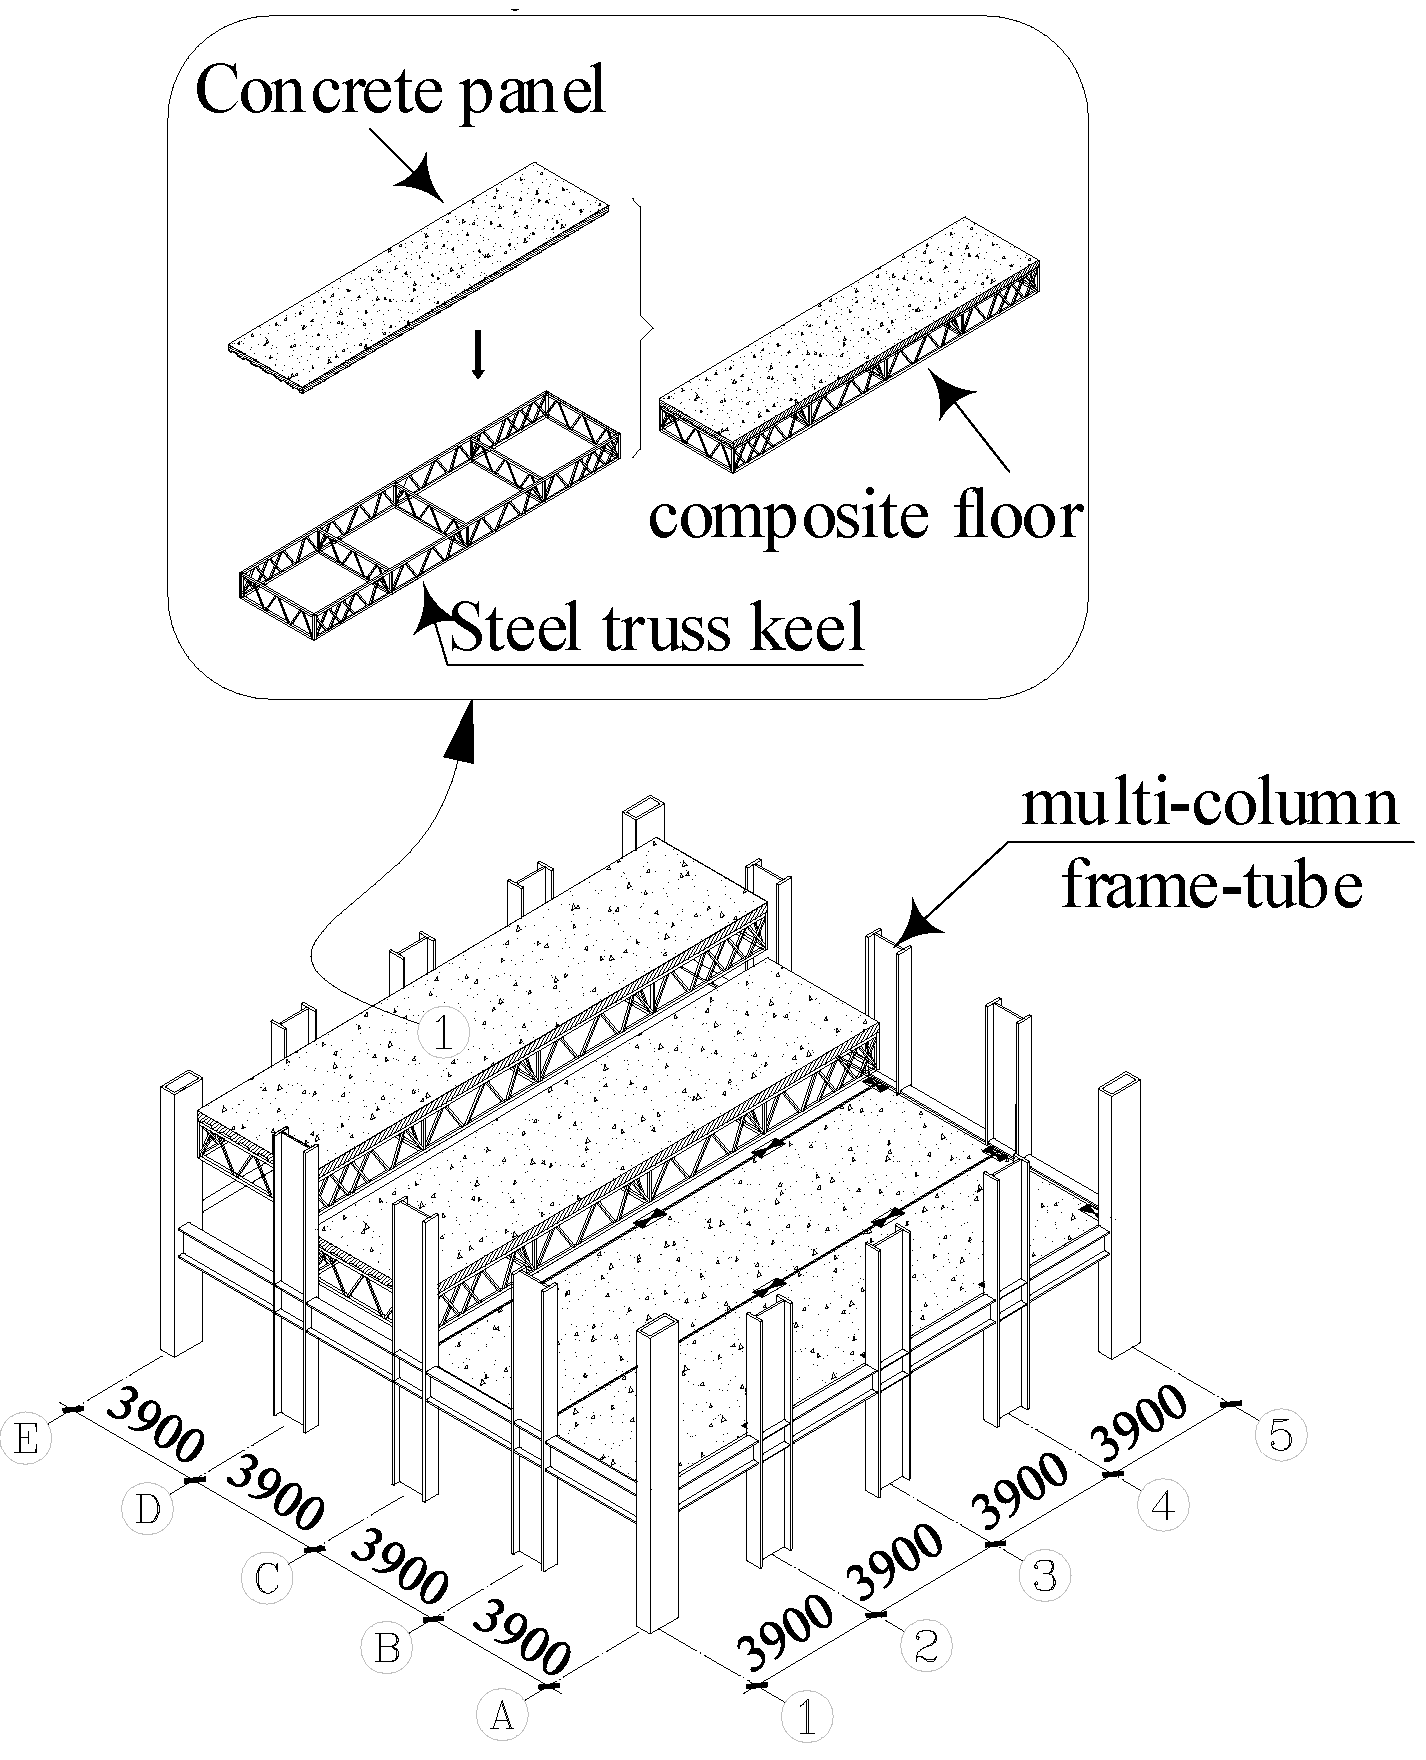
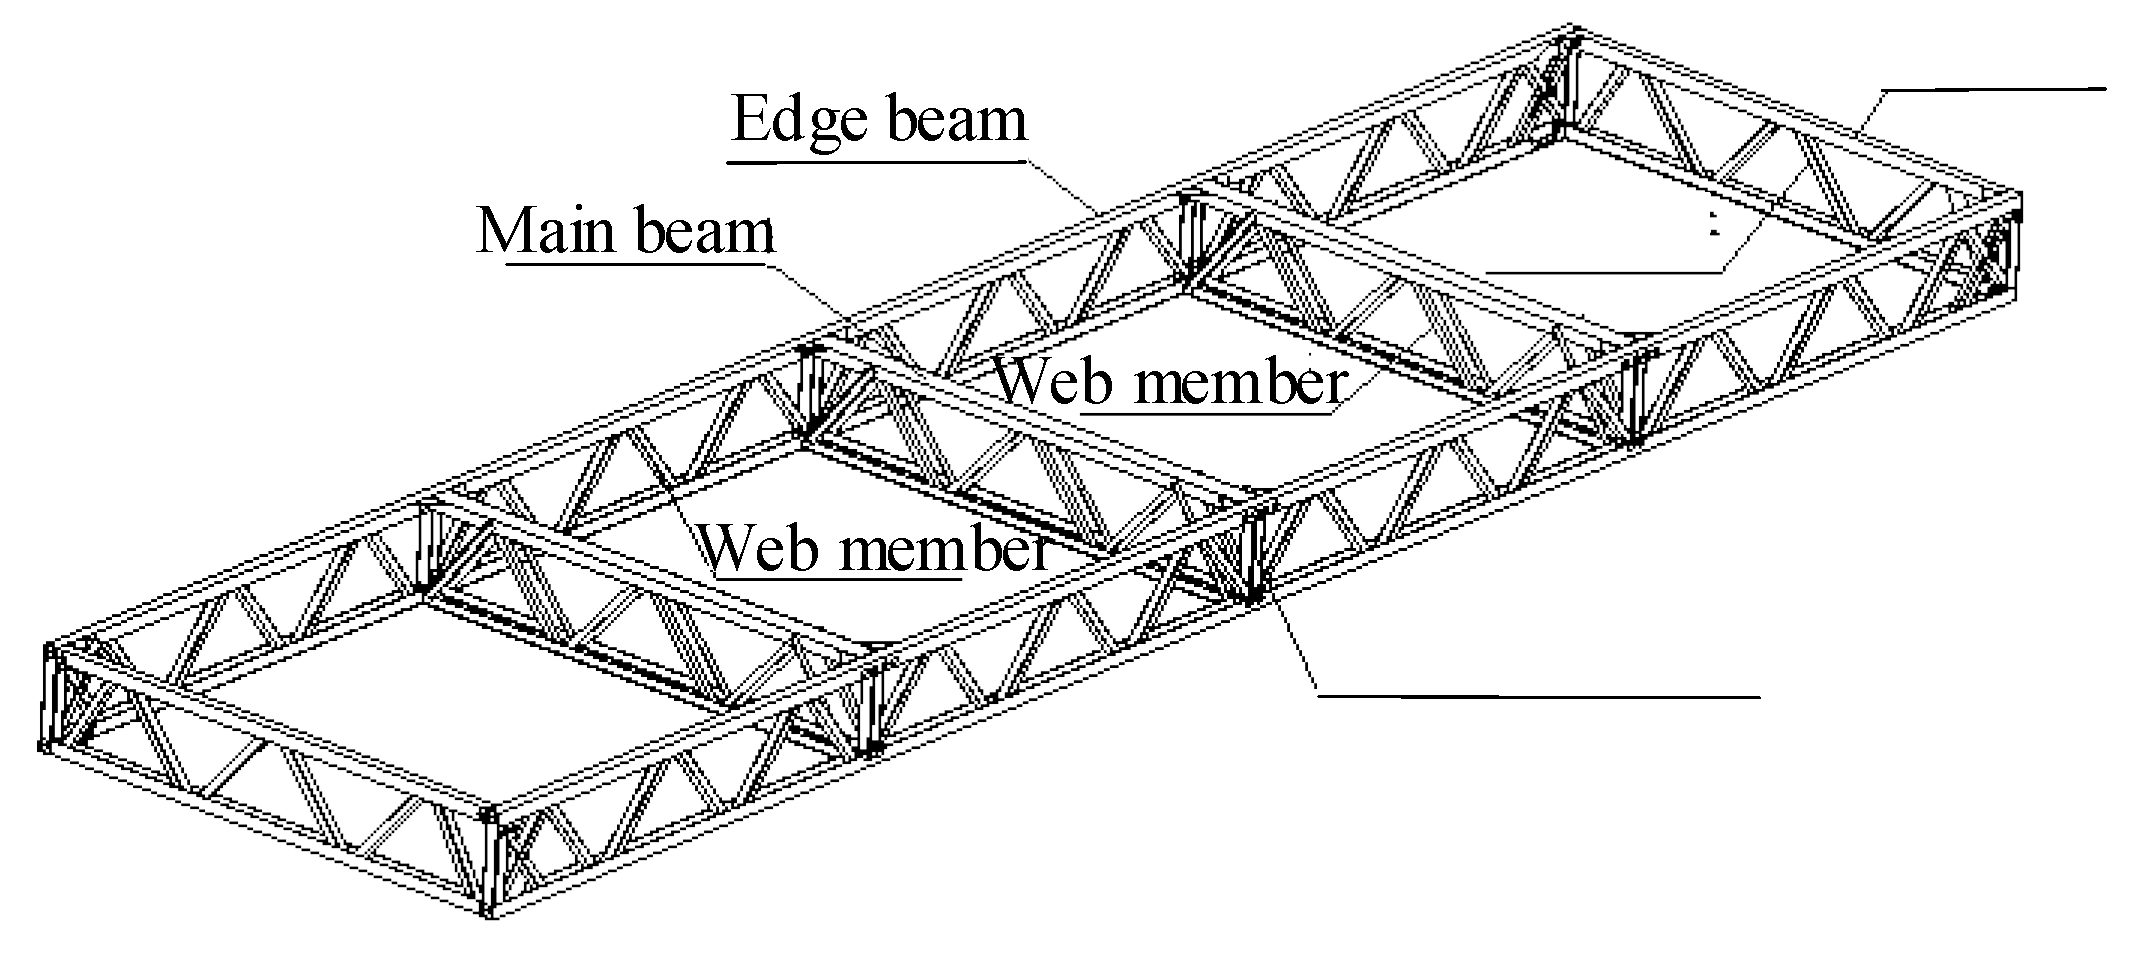
The multi-column frame tube structure with ATBCF is a new type of fully assembled structure. For such a structure, the outer multi-column frame tube is utilized as its basic lateral load resistance system, and the interior of each single tube structure is connected to form a spatial structural system by using a fully assembled open web truss beam composite floor. The floor is assembled from four modular board units, with a plan size of 15.6 m × 15.6 m. The fully dry assembly connection of the floor system is achieved by the specially designed assembly connection components between the plate units, and between the assembled floors and the frame columns [
18]. The composition of a multi-column frame tube structure with ATBCF is shown in
Figure 1.
To investigate the progressive collapse resistance performance of this type of assembled structure, combining with the demolition component method (also known as the ALP method), a progressive collapse resistance analysis on a multi-column frame tube structure with ATBCF under different column failure conditions is conducted by using the pushdown approach and the transient loading technique considering the initial state. Firstly, the residual bearing capacity, internal force redistribution mechanism, and progressive collapse mechanism of the multi-column frame tube structure with ATBCF under different column demolition conditions for this structural system are studied by using the nonlinear static analysis method. Secondly, the dynamic responses of the remaining structure at various column failure times are studied by using the nonlinear dynamic analysis method, and the influence of the column failure time on the dynamic response of the remaining structure is investigated. Finally, the load dynamic amplification factor, which should be considered in the static analysis for the remaining structure, is discussed.
2.2. Model and Loading Conditions
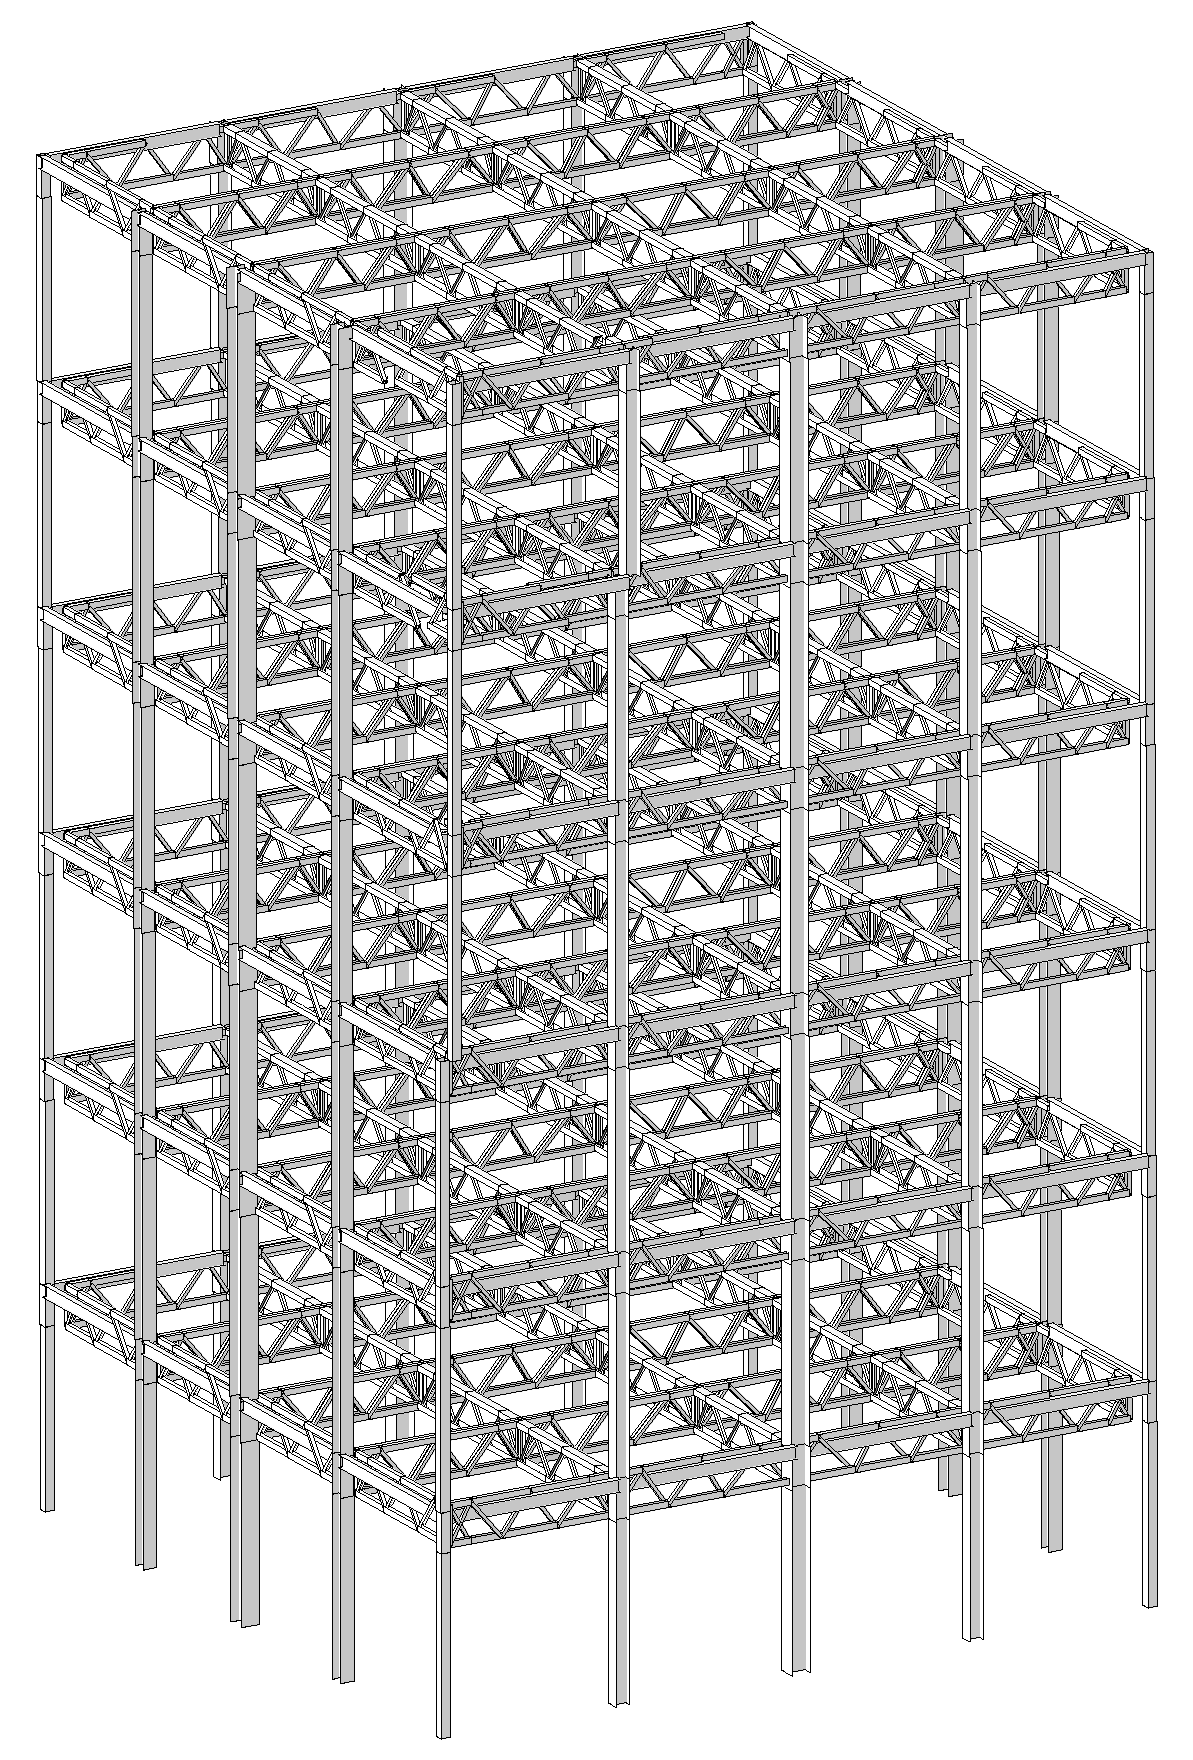
In the multi-column frame tube structure with ATBCF as shown in
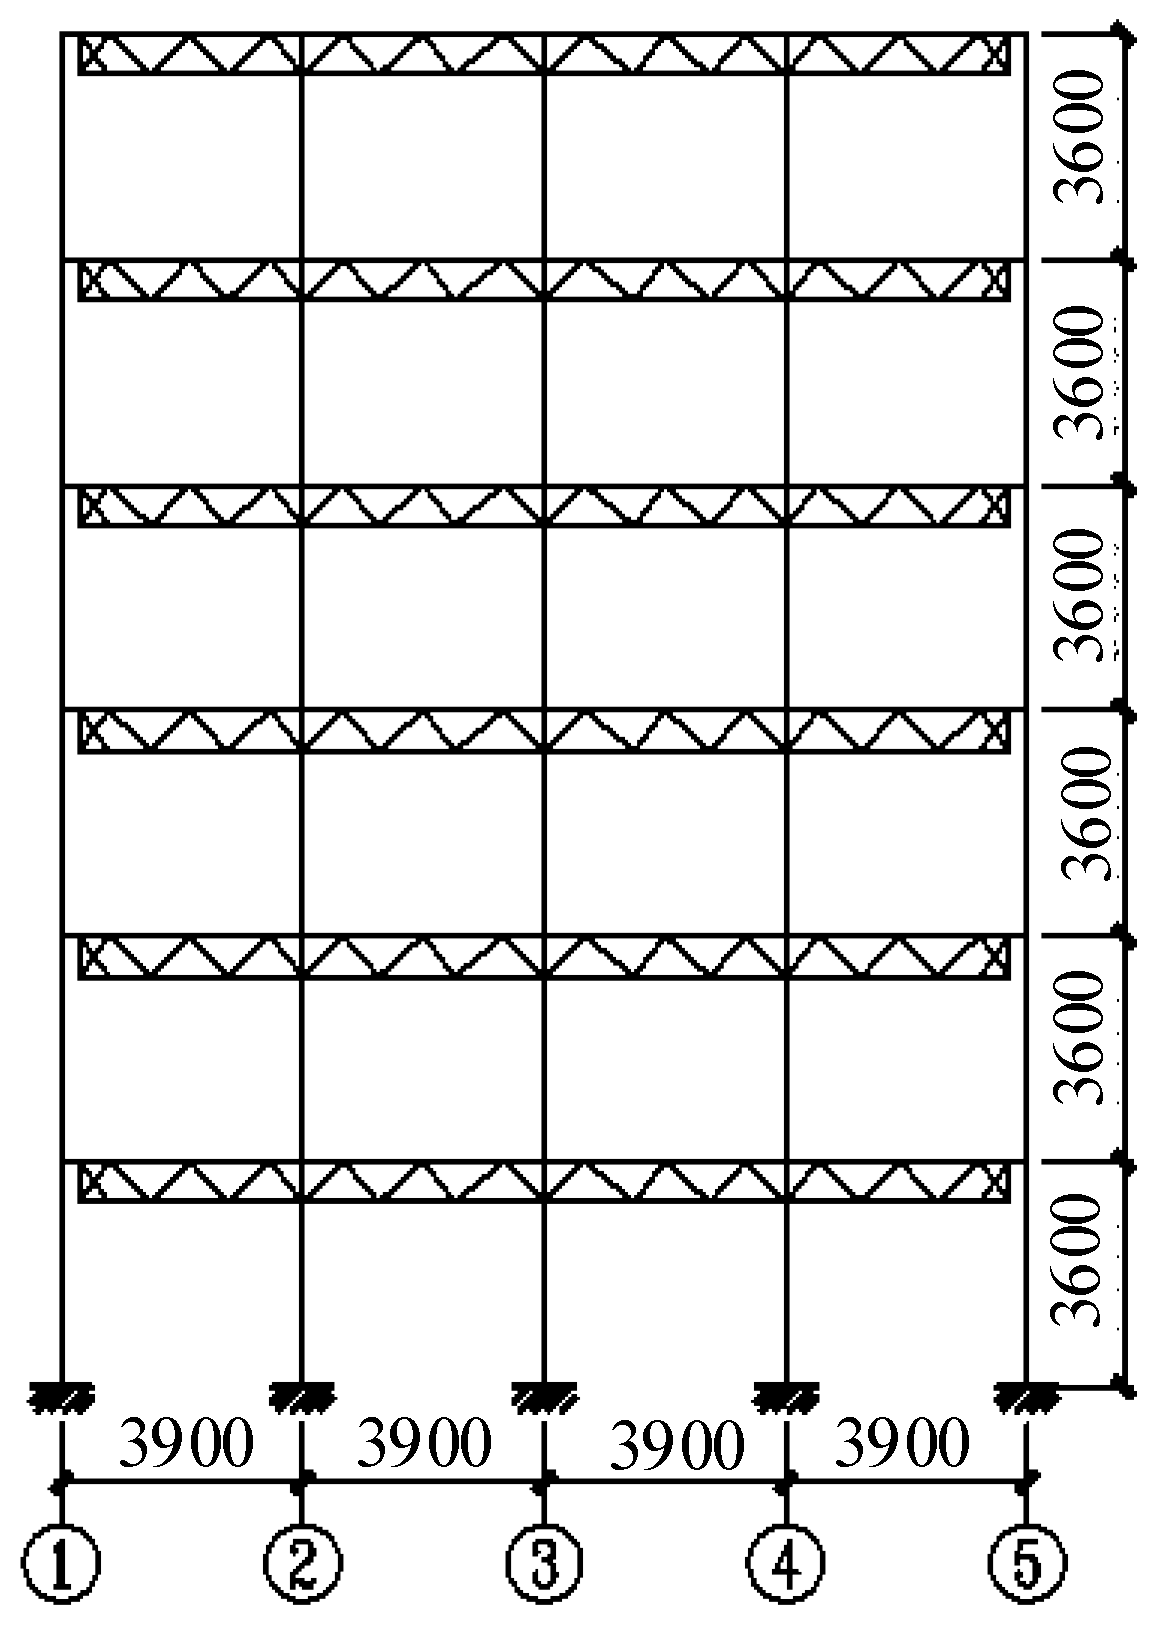
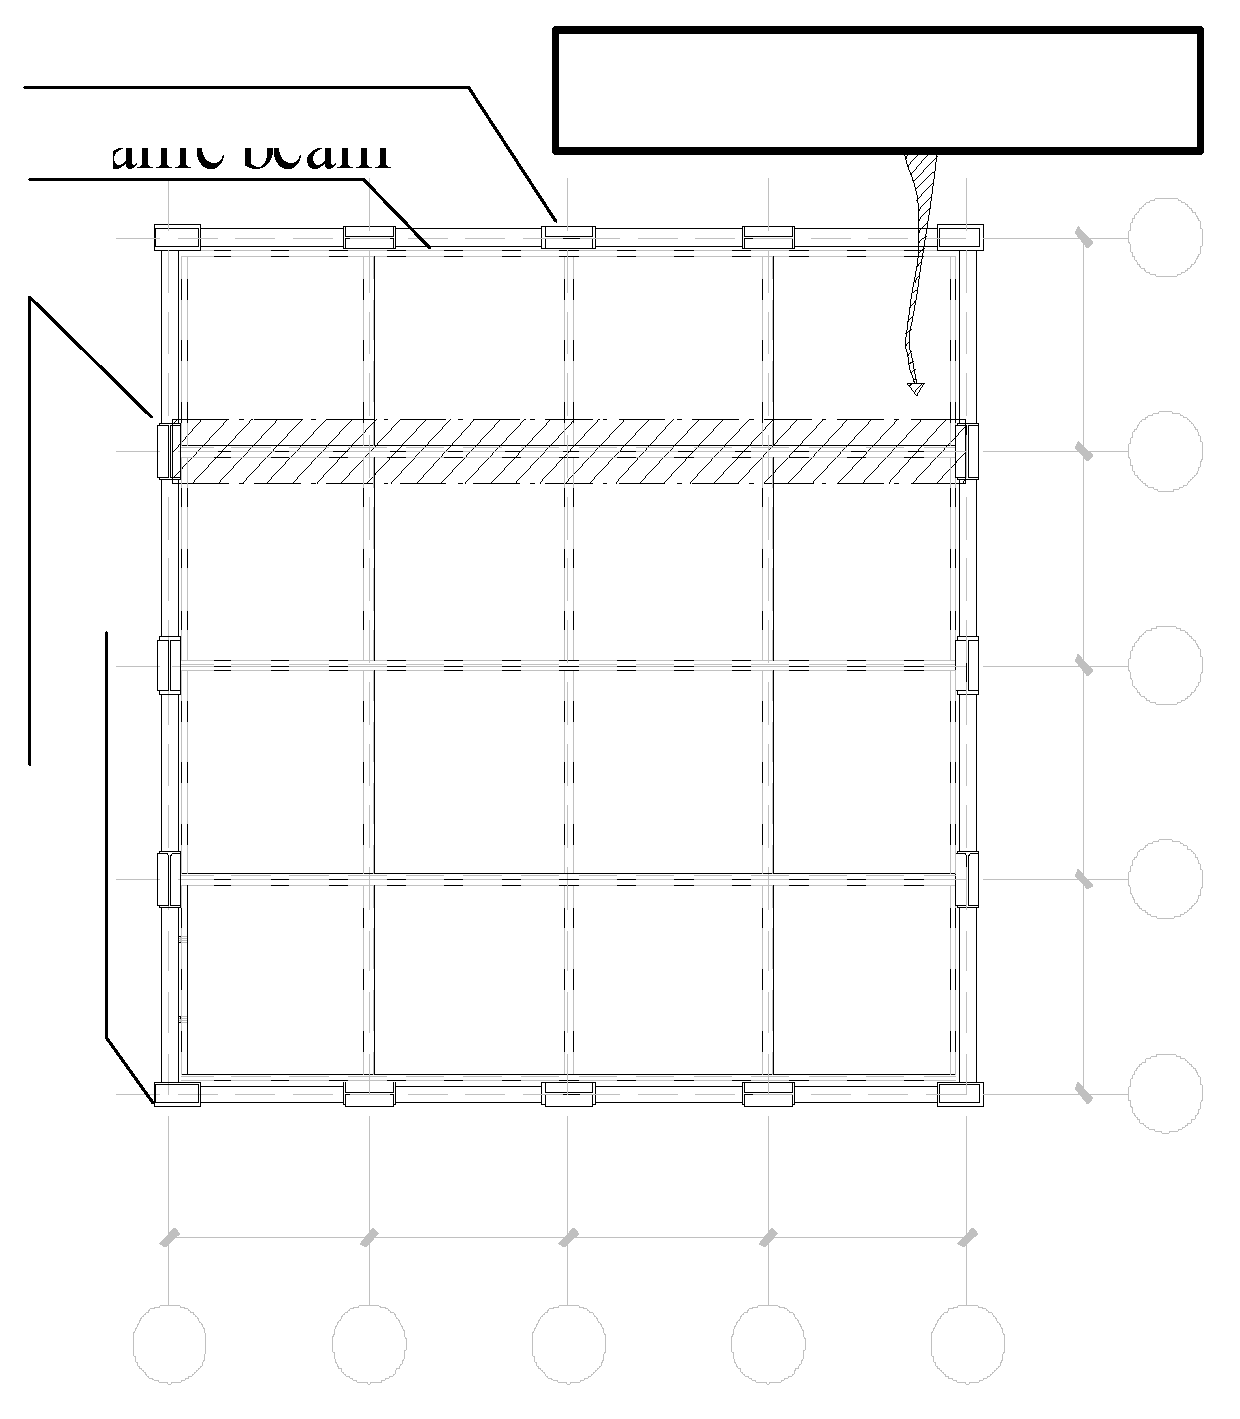
Figure 1, a typical multi-layer frame tube structure is selected as the research object. According to Chinese standards [19-20], the ultimate bearing capacity design for such a structure is designed. The structure is consisted of 6 floors, with a multi-column frame possessing 4 spans in both the transverse and longitudinal directions, a column spacing of 3.9 m, and a floor height of 3.6 m. The structural elevation and layout plan are individually shown in
Figure 2 and
Figure 3, and the isometric layout of the truss beams using for the modular plate components is shown in
Figure 4. The cross-section forms and dimensions of the components of the structure, such as the truss beams, frame beams, and columns, are shown in
Table 1. To investigate the progressive collapse resistance of the structure, the dead loads on the floor and roof are individually taken as 3.2 kN/m
2 and 4.0 kN/m
2, and the live loads are taken as 2.5 kN/m
2 and 0.5 kN/m
2, respectively. The dead load on the exterior wall is taken as 3.0 kN/m, and Q345 steel is applied in this work.
For the multi-column frame tube structure with ATBCF, a finite element model is built by using the MIDAS/Gen software, as shown in
Figure 5. In the mechanical analysis for such a structure, the tensile effect of the floor slab is ignored, and the components of the structure are simulated by using the beam elements. When the pushdown analysis for the structure is conducted, the P-M-M plastic hinges are assigned to both ends of the frame column, the M3 hinges are selected to both ends of the frame beam, and the P hinges are adopted to both ends of the chord or web member of the truss beam. According to the FEMA 356, the parameters of the plastic hinges are determined. When the nonlinear dynamic analysis for the structure is operated, the damping of the remaining structure is presumed as the Rayleigh damping, with a damping ratio of 0.02.
Due to the presence of assembly slab seam in the assembled floors, as shown in
Figure 3, the progressive collapse resistance performance of the structure may vary in the different directions. Therefore, in this study, the side middle column of the bottom frame that is perpendicular to the assembly slab seam, the edge middle column of the bottom frame that is parallel to the assembly slab seam, and the corner column at the bottom frame, as shown in
Figure 3, are individually select as the demolition objects for the progressive collapse resistance analysis of the structure. The three types of column demolition conditions are sequentially named as the work condition 1, the work condition 2, and the work condition 3, respectively.
2.3. Analysis Methodology
2.3.1. Pushdown Analysis for the Remaining Structure
The pushdown analysis, which belongs to a nonlinear static analysis, is one of the commonly adopted methods in the progressive collapse analysis of the structures [
21]. In this method, a gradually increasing vertical load is acted on the remaining structure, until the structure collapse is generated, the relationship curve between the vertical load and the displacement of the structural controlling point is obtained, and the residual bearing capacity of the remaining structure is quantitatively evaluated. During the loading process, the internal force change and plastic development of the remaining structure at different stages can be detected, and the internal force redistribution mechanism and failure modes of the second defense line during the process of structural progressive collapse can be analyzed as well.
Under the three types of work conditions, the pushdown analysis works are individually operated for the finite element model of the remaining structure by using the MIDAS/Gen software. To obtain the ultimate state of the progressive collapse of the remaining structure, the applied vertical load should be large enough. By using the trail calculation method, the target value of the vertical load can be achieved. In the nonlinear analysis, the stiffness of the remaining structure gradually decreases with increasing the vertical load, which will result in the deterioration of the remaining structure. When the stiffness coefficient of the remaining structure decreases to a critical value, the remaining structure will no longer bear the external load, and ultimately following with the collapse of the remaining structure. Furthermore, according to the Chinese Code CSCE 392 [
22], when the nonlinear static analysis method and the nonlinear dynamic one are individually adopted to investigate the static behaviors and the dynamic responses of the building structures, for the case of the plastic rotation angle
p,e of the horizontal components of the remaining structure beyond the allowable one [
p,e], it should be considered that the building structure does not satisfy with the design requirements for the progressive collapse resistance. For the steel beams without adopting any weakening or strengthening measure to the flange, the allowance plastic rotation angle [
p,e] is taken as 0.0213-0.00012
H/
h, here,
H and
h individually denote the cross-sectional height of the steel beam and a unit displacement with a dimension centimeter. Therefore, in this work, the termination conditions of the pushdown analysis for the multi-column frame tube structure with ATBCF under different column demolition conditions are as follows: (1) Under a certain incremental step, the ratio of the structural current stiffness to initial one is of zero; (2) The plastic rotation angle of a certain horizontal component reaches the allowance plastic rotation angle [
p,e].
2.3.2. Nonlinear Dynamic Analysis for the Remaining structure
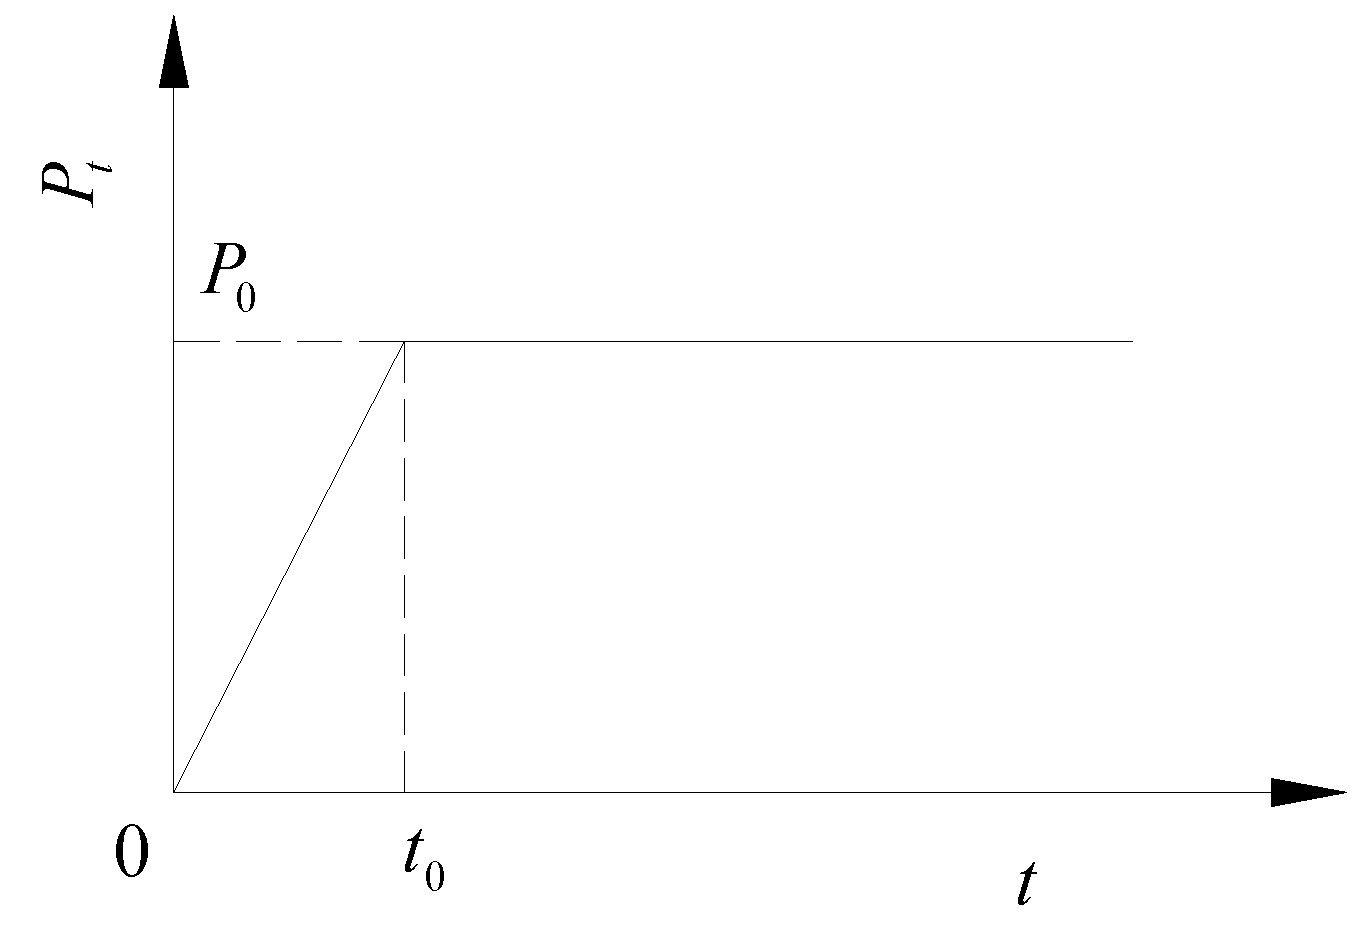
In this paper, the transient loading method with equivalent load considering the initial state is adopted. After obtaining the internal force of the component to be removed under the condition of specific load combination, the component is removed and the internal force at the failed end is converted into the equivalent node load P0, which is applied to the corresponding node, making the remaining structure statically equivalent to the original structure, that is, the initial deformation and internal force of the structure are considered. To obtain the dynamic response of the remaining structure with column failure, based on this situation, a dynamic load Pt is applied to the corresponding nodes to conduct the dynamic time history analysis. The loading curve of the remaining structure is shown in Fig. 6. In the loading curve, when the time is t0, the load P(t0) is of P0, with the direction opposite to the node force, and t0 represents the failure time of the component. In this work, according to the requirements in the Chinese Code CSCE 392, a vertical load combination with 1.0 times dead load and 0.5 times live load acting on the multi-column frame tube structure with ATBCF under the condition of column demolition are adopted for the nonlinear dynamic analysis.
Figure 6.
The loading curve of the remaining structure.
Figure 6.
The loading curve of the remaining structure.
Although the dynamic effects of the remaining structure can be accurately reflected by using the dynamic analysis method, a lot of computational time is required in both theoretical and numerical calculations. Therefore, in the process of the actual structure design, the progressive collapse resistance performance of the remaining structure is preliminarily studied by using the static analysis methods. In the static analysis, to take the dynamic effect caused by the transient failure of the structural component bearing loads into account, a dynamic amplification coefficient ad is introduced according to the Chinese Code CSCE 392. When the progressive collapse resistance of the remaining structure is calculated by using the linear static analysis method, the dynamic amplification coefficient is determined as 2.0, and when that is solved by using the nonlinear static analysis method, the one is taken as 1.35 for the steel structure. The applicable range of load amplification is determined as the span between the columns connected to the removed column, and the layer is located above that of the removed column. In addition, the determination of the value of the dynamic amplification coefficient in the Chinese Code CSCE 392 is more focused on the traditional frame structures, while for the multi-column frame tube structure with ATBCF, a further study is needed.
3. Results
3.1. Pushdown Processing Analysis
3.1.1. Pushdown Processing of the Remaining Structure
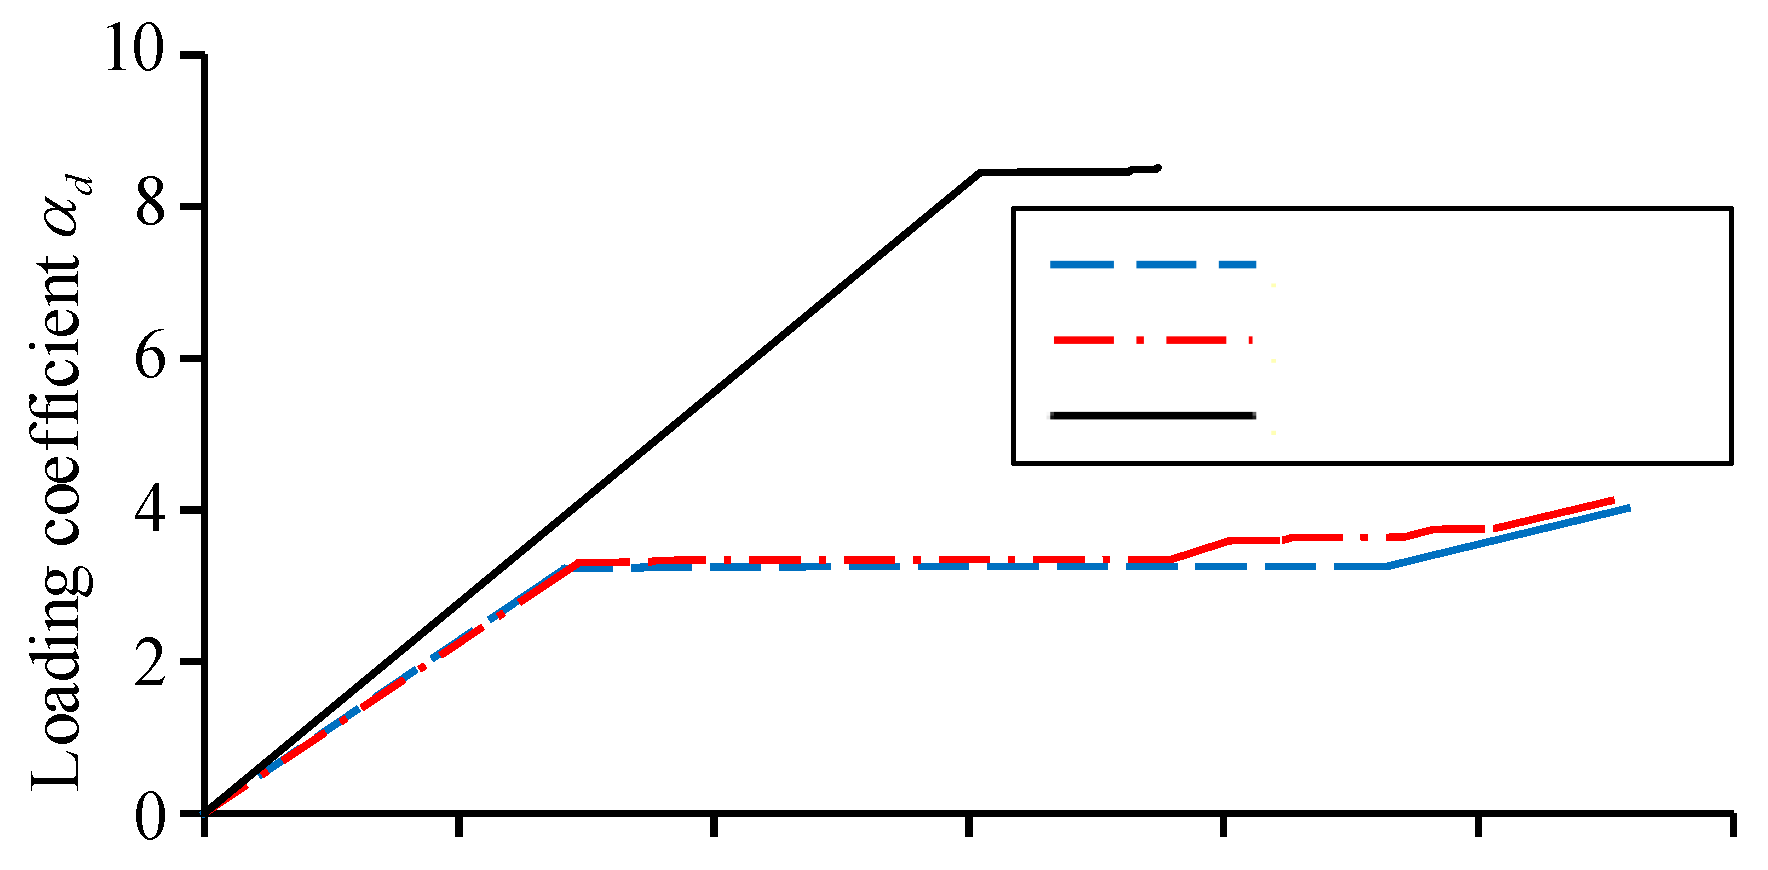
Under the three types of different demolition column work conditions, the curves of the vertical load coefficient
d versus the vertical displacement of the demolition column’s upper node (hereinafter referred to as the “failure point”) are shown in
Figure 7. The endpoints of the curves corresponding to the work condition 1 and the work condition 2 are determined by the collapse criterion. While for the curve corresponding to the work condition 3, at the endpoint of the curve, the ratio of the current structural stiffness to the initial one is equal to zero, which can be seen from
Figure 7. As the load gradually increases, the working state of the structure changes from elastic deformation to elastoplastic one, which reflects in the curve changing from linear to nonlinear. Such a change is marked by the first occurrence of a break point on the curve. The load coefficient at the first break point on the curve of the load coefficient versus the displacement is defined as
d,y. The maximum load coefficient that is called as the ultimate one, is named as
d,max, and the corresponding displacement, which is called as the ultimate displacement, is noted as
max. The results are listed in
Table 2.
Comparing the slopes of the linear segments of the curves shown in
Figure 7, it can be found that the stiffness of the remaining structure under the work condition 3 is larger than that under the work condition 1 and 2. For the work condition 3, when the load curve enters the nonlinear deformation stage, the bearing capacity of the remaining structure quickly reaches its ultimate value, the remaining structure reflects a similar “brittle” property, with the value of
d,maxonly increasing by 0.71% comparing to the value of
d,y. While for the work condition 1 and 2, in the nonlinear deformation stage, the remaining structure undergoes a long period of deformation development, following with a certain degree of recovery in stiffness, and the load coefficient increases with increasing the displacement, the remaining structure exhibits a similar “plastic” property. Comparing to the value of
d,y, the values of
d,max individually increase by 23.81% and 23.85%, and the ultimate displacements are also greater than that under the work condition 3. Simultaneously, by comparing the curves under the work condition 1 and 2, it can be found that the shapes of the two curves are similar, and the ultimate load coefficient of the work condition 2 is slightly larger than that of the work condition 1.
It can be seen from the above analysis that under the condition of the corner column demolition at the bottom floor, the stiffness of the remaining structure in the elastic stage is greater than that of the one under the condition of the middle column demolition at the bottom floor, which indicates that the residual bearing capacity of the remaining structure with the corner column demolition is higher than that of the one with the middle column demolition. However, the plastic deformation capacity of the remaining structure with the middle column demolition is superior to that of the one with the corner column demolition, which can be found from
Figure 7.
3.1.2. Progressive Collapse Mechanism of the Remaining Structure
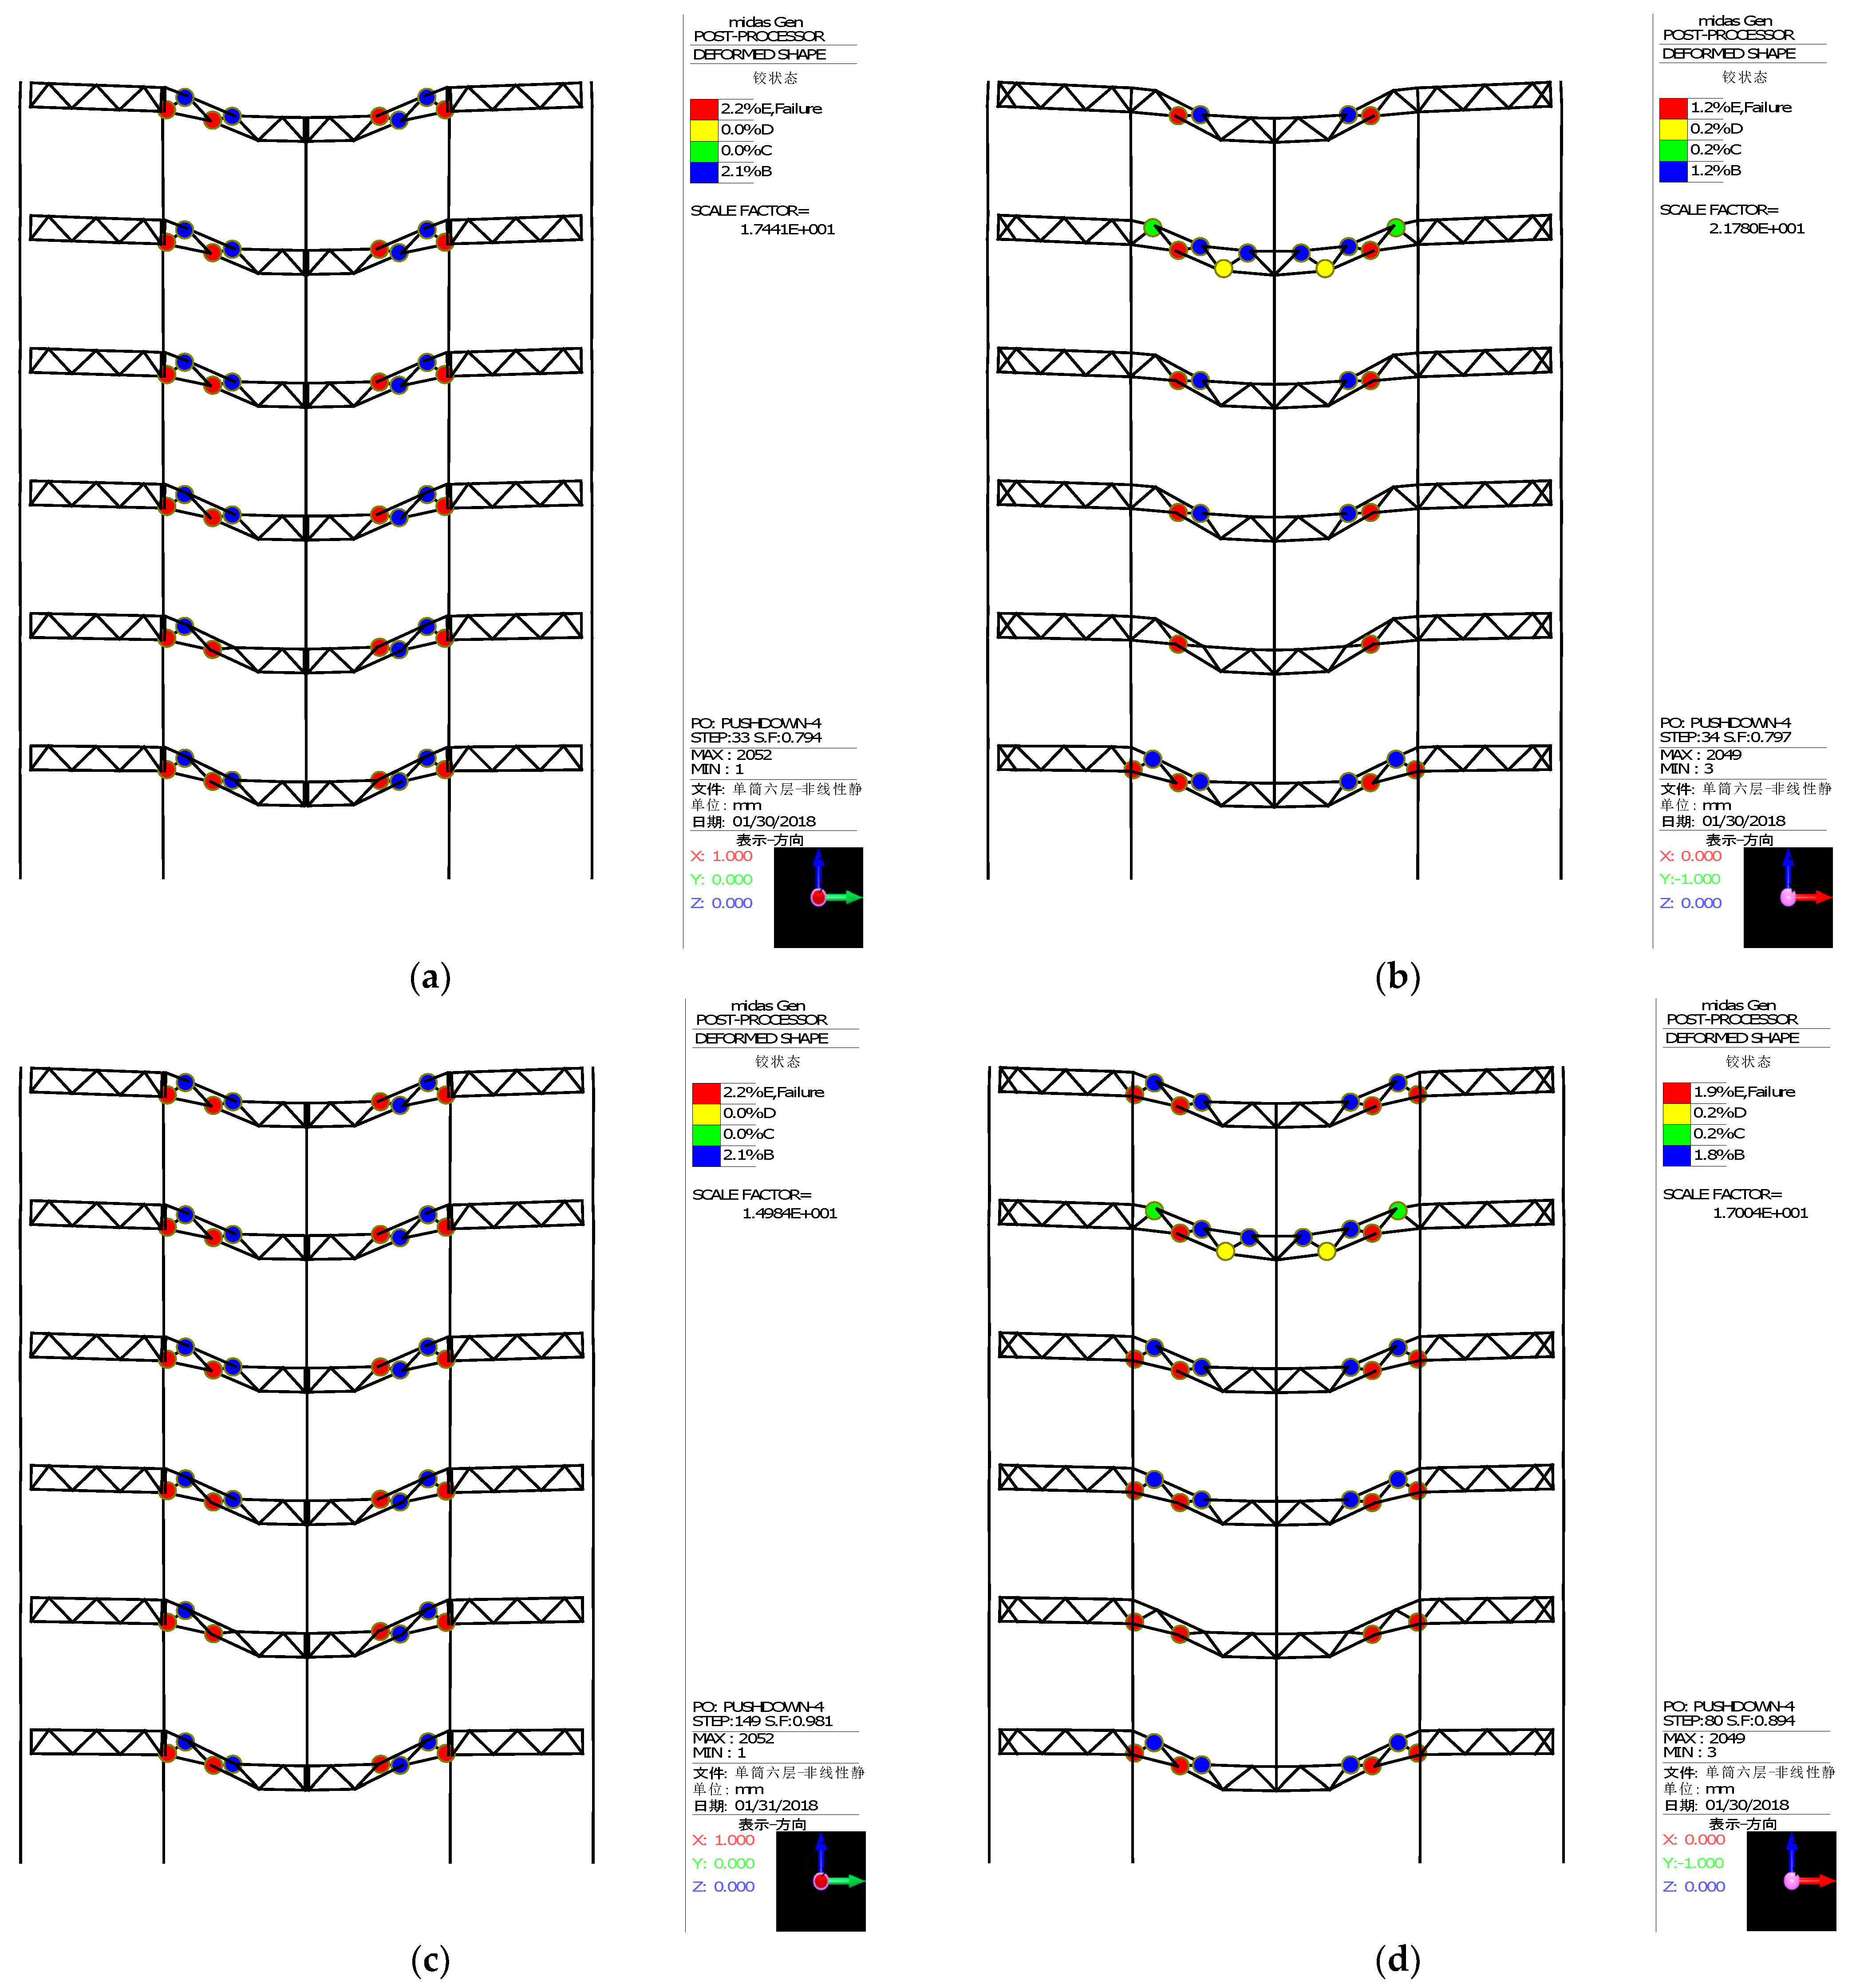
With the demolition of the middle column or the corner one of the multi-column frame tube structure with ATBCF, the vertical load is transmitted to the remaining columns by the frame beams and the truss beams. Due to the higher stiffness of the truss beam, the load transmitted by the truss beam is greater than that of the frame beam. Under the work condition 1 with side middle column demolition and the work condition 2 with edge middle column demolition, the numerical simulations are individually conducted for the finite element models corresponding to the remaining structures by using the MIDAS/Gen software. When the iteration steps are 33 and 34, the deformation diagrams of the remaining structures are shown in
Figure 8a,b.
Combing with the load coefficient and displacement curve under the work conditions 1 or 2 (as shown in
Figure 7), it can be found that during the linear loading stage, the overall remaining structure is in an elastic serving state. When the load closes to the first break point, the remaining structure has almost no plastic hinges or only a small number of plastic hinges. At the first break point, a lot of plastic hinges suddenly appear in the remaining structure, and the plastic hinges firstly appear on the web members of the truss beams near the demolition column end at the bottom floor, and rapidly develop towards the upper floors, as shown in
Figure 8a,b. The web members of the truss beam yield and quickly fail, resulting in a rapid decrease in structural stiffness and an increase in structural deformation. The internal force redistribution occurs in the remaining structure, the bending moment at the end of the frame beam at the failure point rapidly increases, and the frame beam is in an elastoplastic working state. Due to the tie effect of the upper and lower chords of the truss beam and the bending resistance performance of the frame beam, the remaining structure can still bear greater loads. By the internal force redistribution, the structural stiffness has been restored to a certain extent, corresponding to the second break point, and following with the second upward stage in the load coefficient versus displacement curve, as shown in
Figure 7. The plastic rotation angle at the end of the frame beam increases with increasing external load, until it approaches to the ultimate value [
p,e], the remaining structure no longer satisfies with the requirements for resisting the progressive collapse. Currently, the loading processes are terminated, and the corresponding iteration steps for the work condition 1 and 2 are 149 and 80, the ultimate plastic hinge distributions and deformation diagrams of the remaining structures are shown in
Figure 8c,d, respectively.
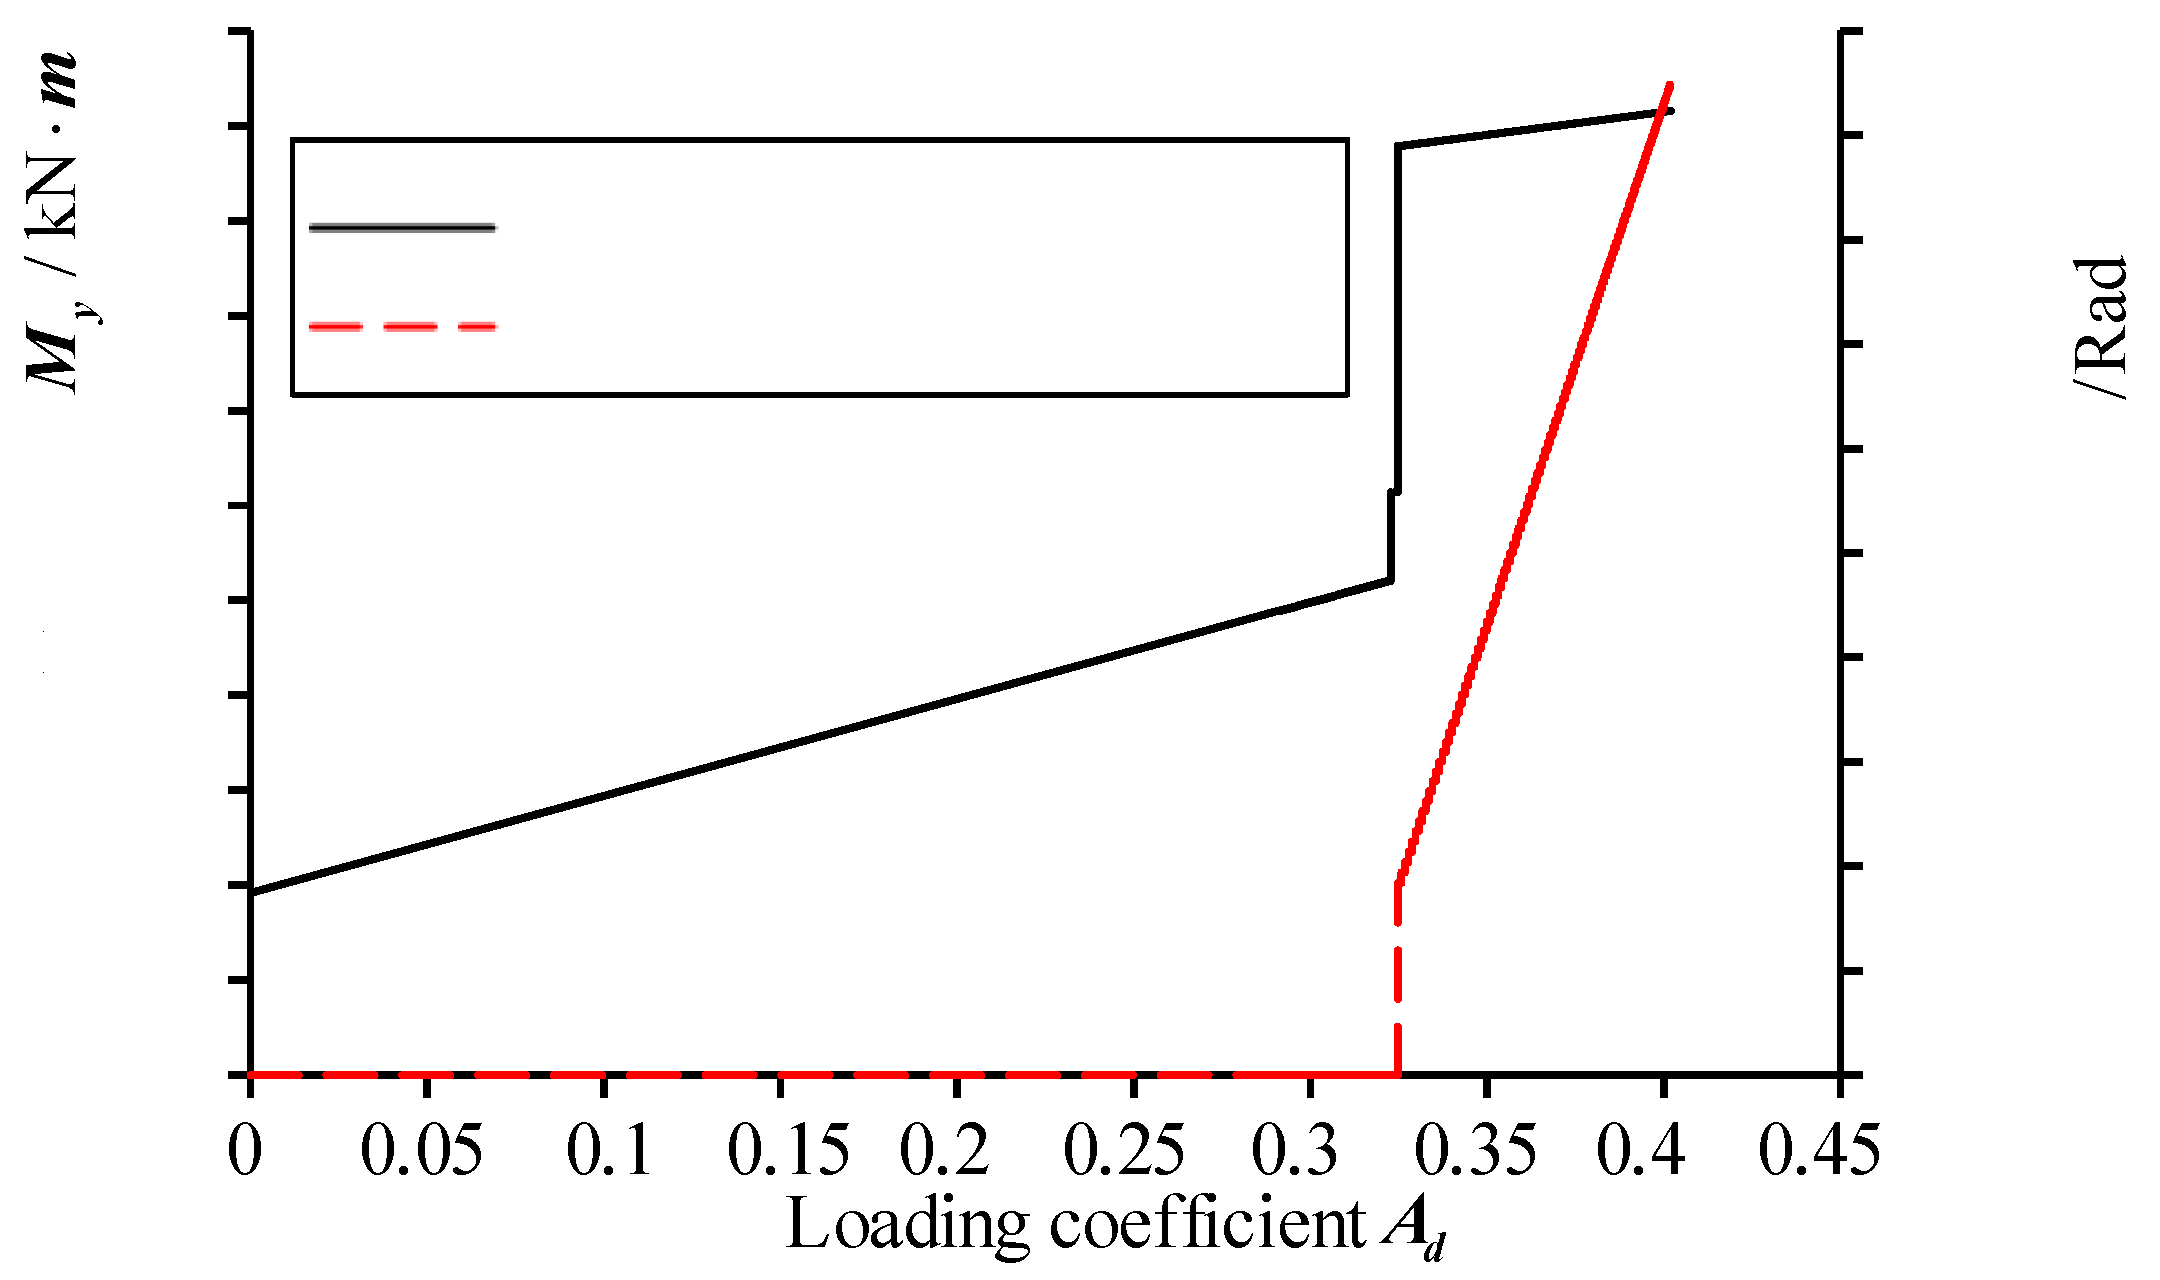
Under the work condition 1 with side middle column demolition, the curves of the bending moment
My and plastic rotation angle
p,e of the frame beam end at the failure point versus the load coefficient
d are shown in
Figure 9. It can be found from
Figure 9 that the changes in the bending moment and plastic rotation angle at the beam end are synchronous. When the bending moment
My reaches its yield value
Mp=90.00 kN·m, the plastic rotation angle at the beam end begins to emerge. When the bending moment
My increases to 101.56 kN·m, the plastic rotation angle
p,e at the beam end is of 0.1897 rad, which is larger than the allowable one [
p,e]=0.0189 rad. It can be seen from the above analysis that under the condition of the side middle column failure, the structure possesses a good second defense line to resist the progressive collapse. Therefore, the frame beam can effectively improve the safety storage of the remaining structure against the progressive collapse.
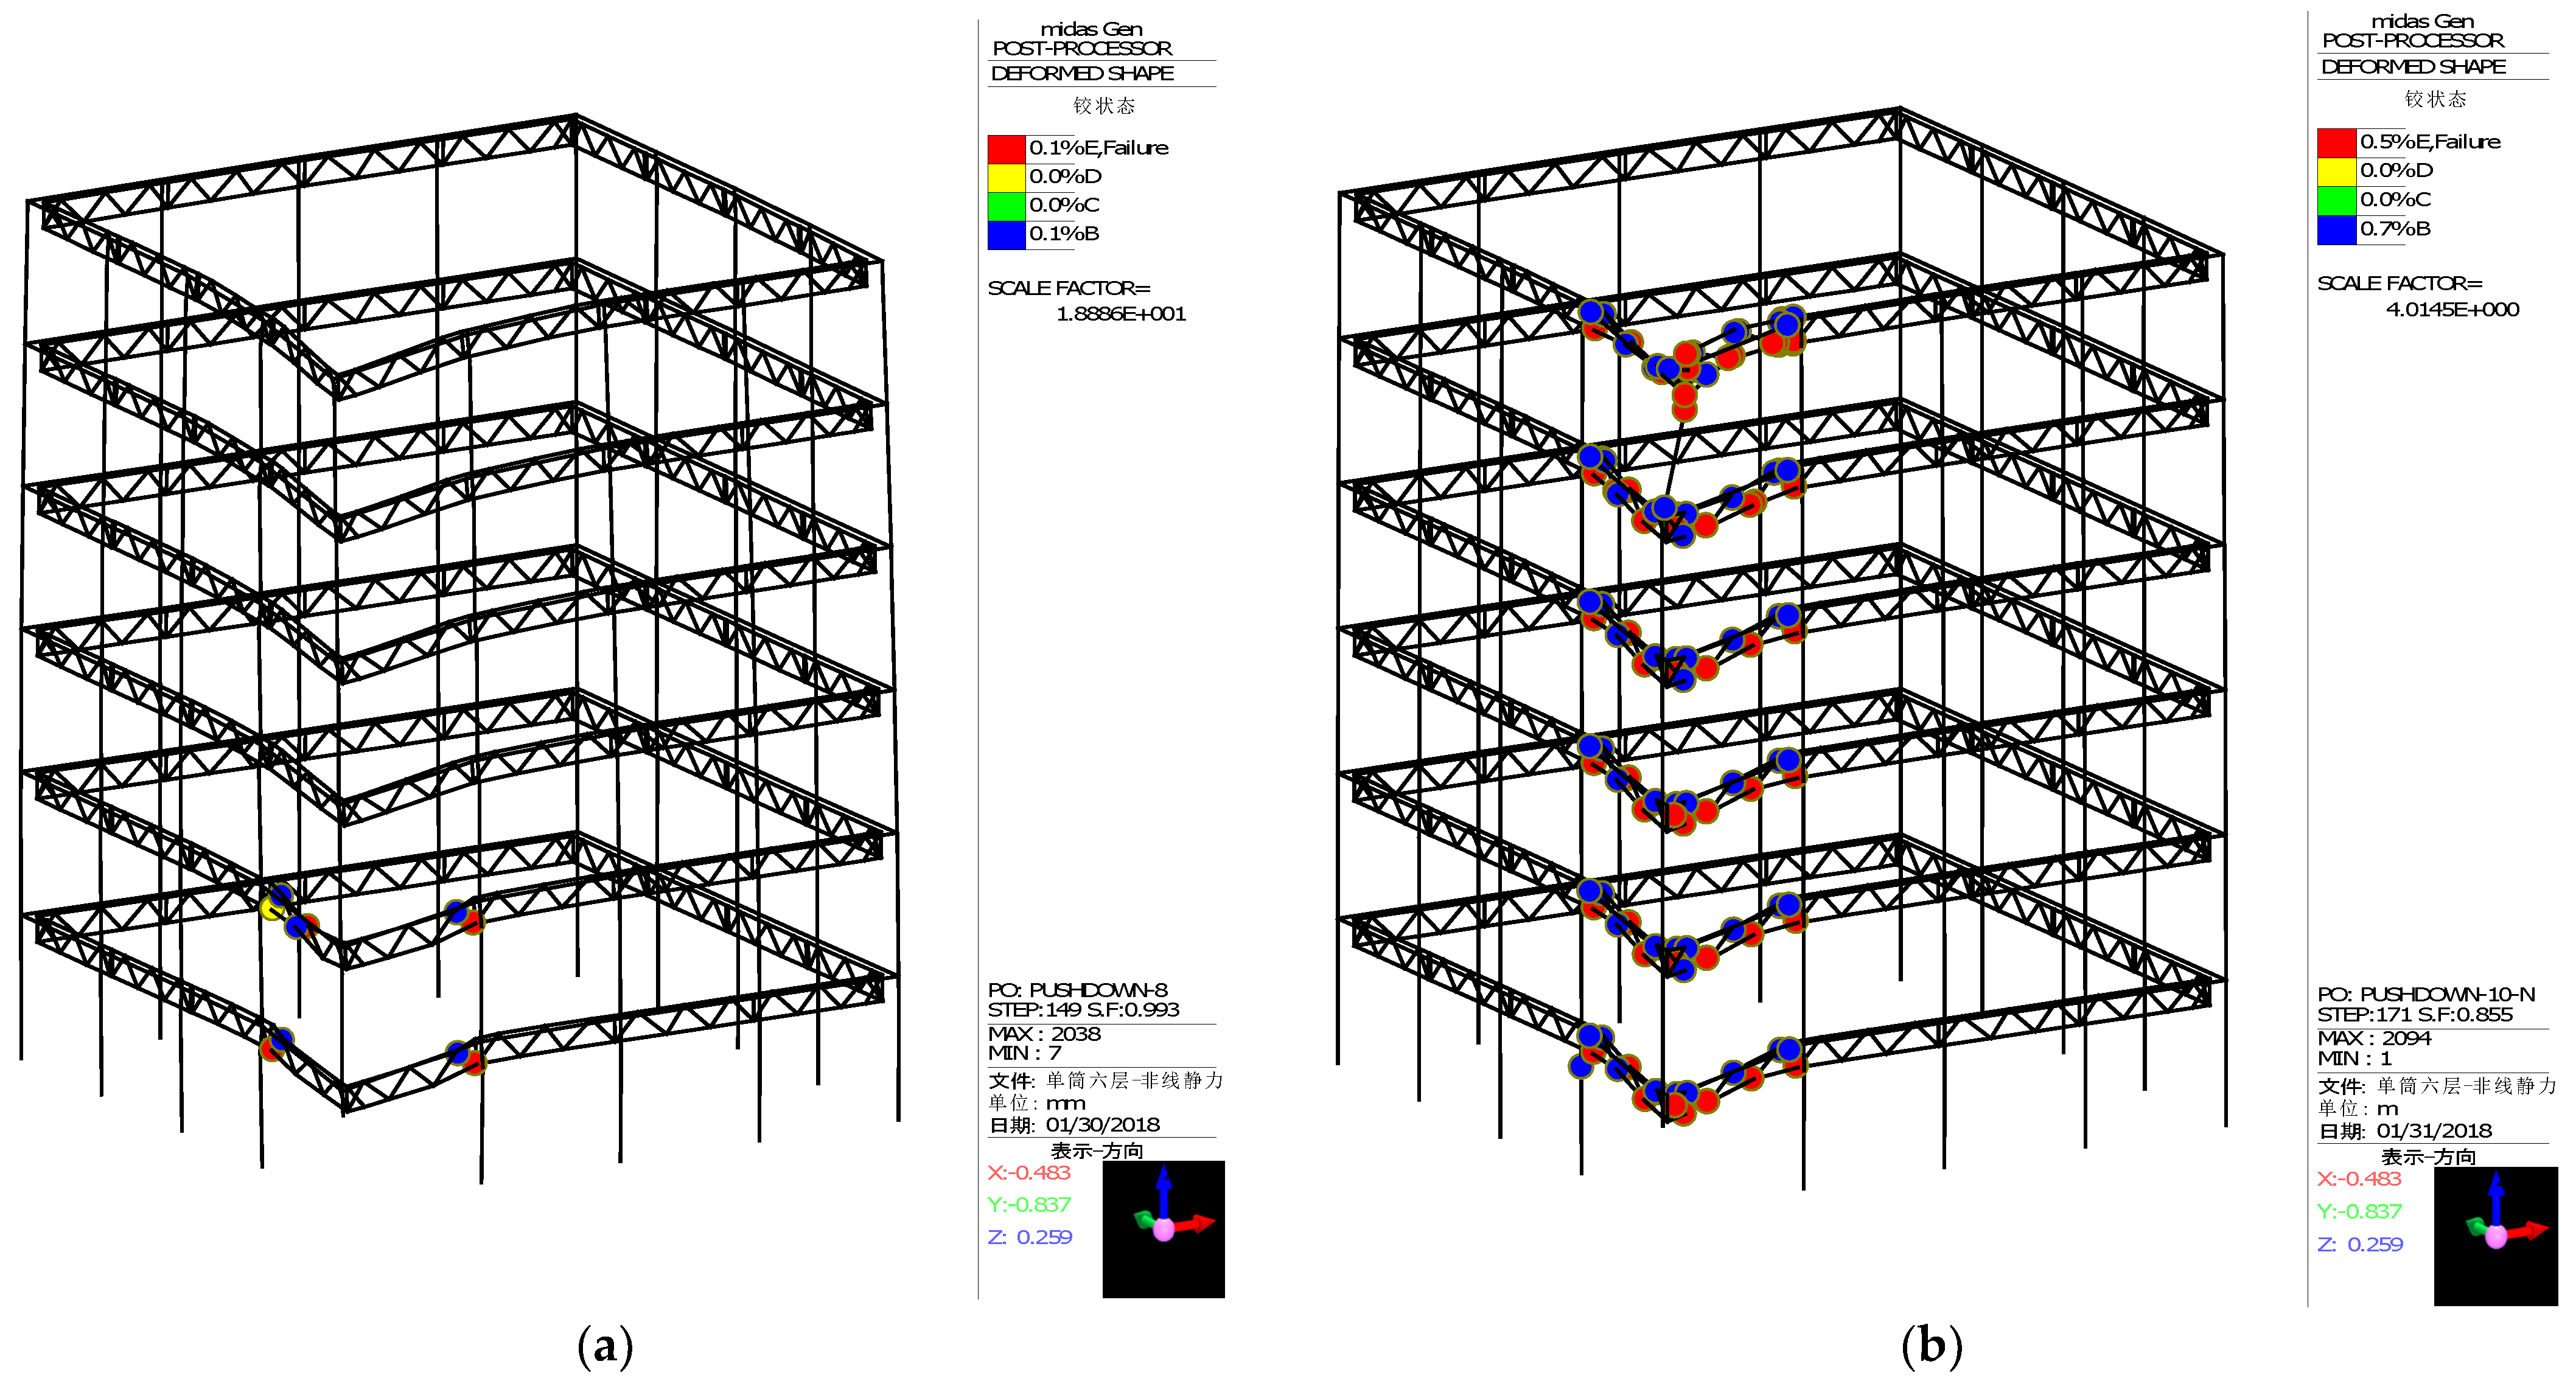
Under the work condition 3 with corner column demolition, the numerical calculation is operated on the finite element model of the remaining structure by using the MIDAS/Gen software. When the iteration step is 149, the deformation diagram of the structure is shown in
Figure 10a. It can be found from
Figure 10a that the progressive collapse process of the multi-column frame tube structure with ATBCF under the work condition 3 is different from that under the work condition 1 or 2. When the corner column of the structure fails, as the vertical load gradually increases, the plastic hinges firstly emerge on the web members of the truss beams near the column end at the bottom floor, as shown in
Figure 10a. Distinguishing the work conditions 1 and 2, the upper and lower chords of the structural truss beam at the corner cannot form effective ties like that at the mid span. With the failure of the web members, the stiffness of the truss beam rapidly decreases, and the proportion of the load enduring by the frame beam greatly increases. The load redistribution between the truss beam and the frame beam causes a rapid yielding and failure of the frame beam, resulting in a severe degradation of the stiffness of the overall remaining structure, which corresponds to the break point of the load coefficient versus displacement curve under the work condition 3 in
Figure 7, and ultimately results in the progressive collapse in the region at the corner columns. At this moment, the corresponding iteration step for the work condition 3 is 171, the ultimate plastic hinge distribution and deformation diagram of the remaining structure is shown in
Figure 10b. Thus, it can be found from the above analysis that in the actual design of the multi-column frame tube structure with ATBCF, the frame beam, as the second defense line against progressive collapse, should possess a sufficient safety storage to ensure that the structure still possesses the capacity of progressive collapse resistance under the condition of the corner column demolition.
3.2. Nonlinear Dynamic Analysis
3.2.1. Failure Time of the Column
When an engineer structure is subjected to an unexpected load, such as an explosion load, or an impact load, resulting in the failure of its components, the failure time of the structural components is generally very short [
23]. It is shown that the failure time of the load-bearing component at the bottom floor has a significant impact on the dynamic response of the remaining structure. The shorter the failure time, the stronger the dynamic response [
24]. For the value of failure time
t0, the DoD 2013 specification [
25] stipulates that the failure time of the column shall not exceed 0.1 times of the first vertical vibration period
Tv1 of the remaining structure, while the Chinese Code CSCE 392 stipulates that the failure time of the removed column shall not be greater than 0.1 times of the primary vibration period
T1 of the remaining structure. To obtain a reasonable value of failure time
t0, in the following study, the multi-column frame tube structure with ATBCF under the work condition 1 is selected as a research object. Based on the eigenvalue analysis (or mode analysis) of the frame structure with the side middle column demolition, the primary vibration period
T1 and the first vertical vibration period
Tv1 of the remaining structure are 1.327 s and 0.2717 s, respectively. Thus, the failure time
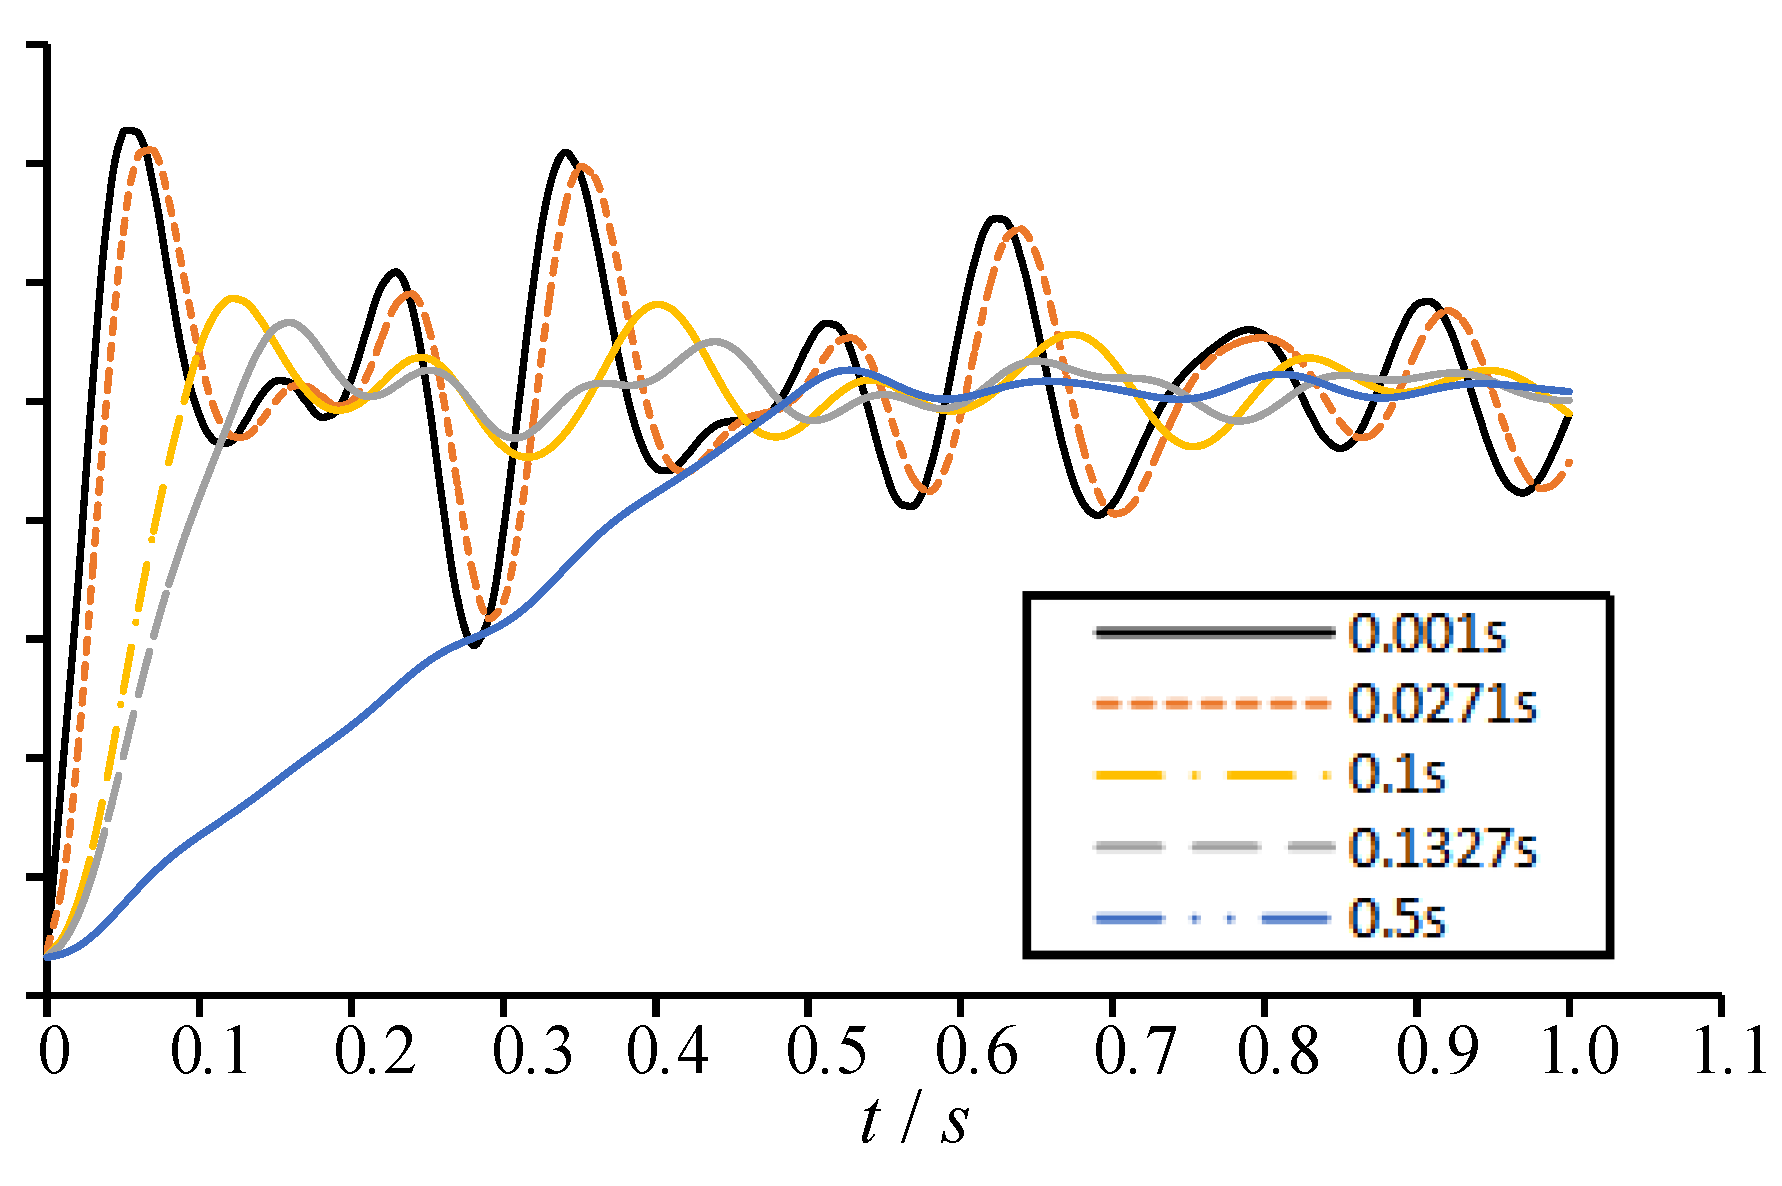
t0 is individually taken as 0.001 s, 0.02717 s (0.1
Tv1), 0.1 s, 0.1327 s (0.1
T1), and 0.5s, and the vertical displacement versus time curves of the remaining structure at various failure times are shown in
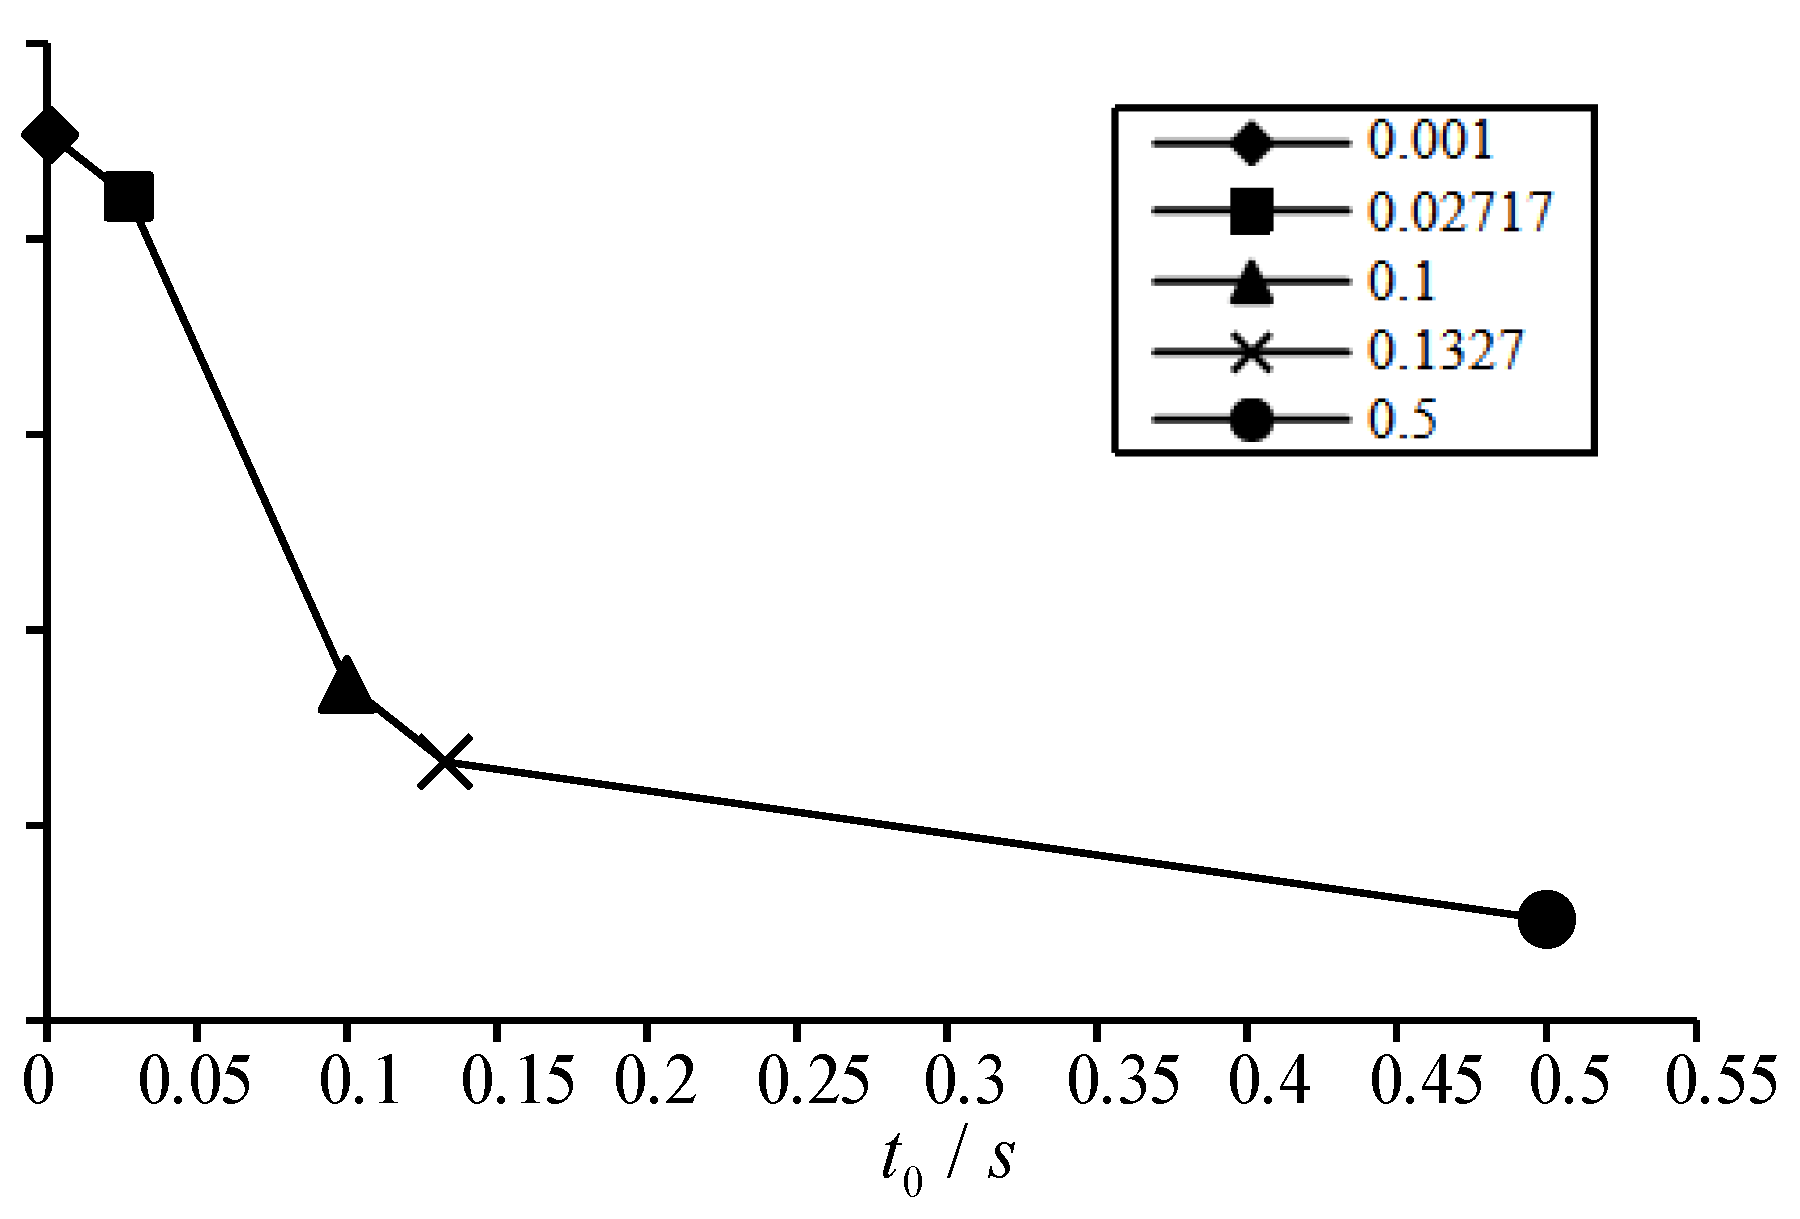
Figure 11. Extracting the maximum displacement on each vertical displacement time history curve, the relationship curve between the maximum displacement and the failure time can be obtained, as shown in
Figure 12.
It can be found from
Figure 11 and
Figure 12 that the shorter the failure time
t0 of the column, the greater the dynamic response of the remaining structure. When the failure time is of 0.001 s and 0.02717 s (0.1
Tv1), the vertical displacement time history curves of the remaining structures are very similar, with the corresponding maximum vertical displacement as 14.53 mm and 14.22 mm, respectively. The difference between the both values is only 0.31mm, with a decrease of only 2.2%. When the failure time is of 0.1s and 0.1327s (0.1
T1), the maximum vertical displacement of the remaining structure is individually 11.72 mm and 11.32 mm, which is 19.3% and 22.1% lower than the result at the failure time 0.001 s. When the failure time is 0.5 s, the maximum vertical displacement of the remaining structure is of 10.52 mm, which is a decrease of 27.6% compared to the value at the failure time 0.001 s. For this case, the dynamic effect of the remaining structure has significantly decreased. Therefore, it is reasonable to take a failure time for the structural components not greater than 0.1 times the first vertical vibration period of the remaining structure. In this situation, the calculation results can fully reflect the maximum dynamic response of the remaining structure.
3.2.2. Dynamical Magnification Factor
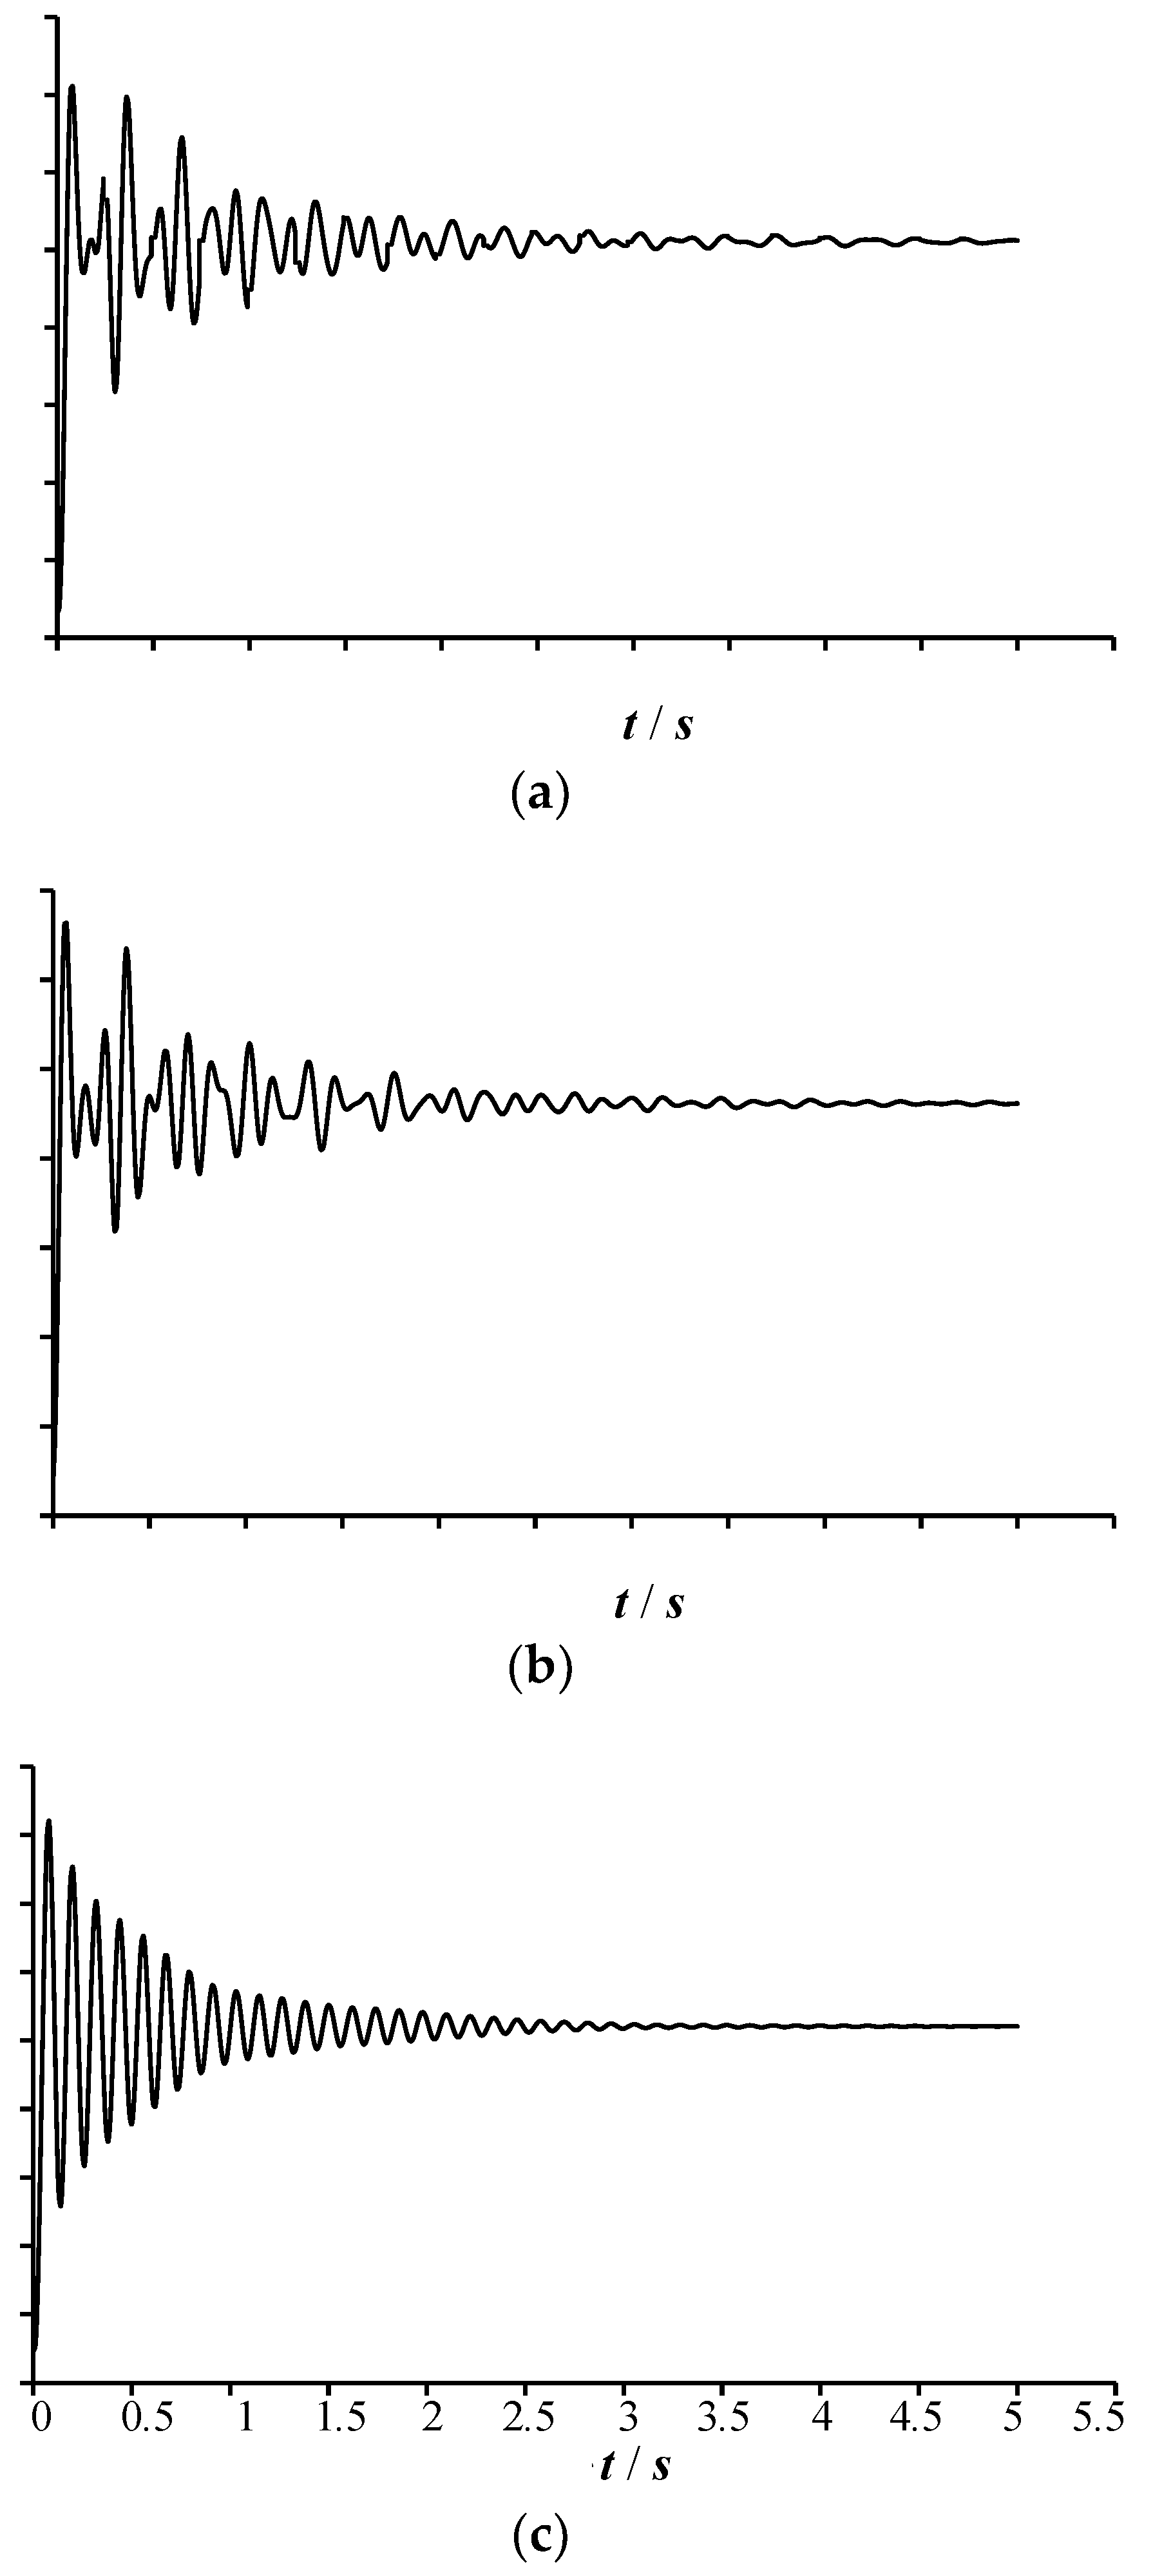
For the work condition 1 with the side middle column failure, the work condition 2 with the edge middle column failure, and the work condition 3 with the corner column failure, the failure times of the columns are taken as 0.1 times of the first vertical vibration periods of the corresponding remaining structures. A nonlinear dynamic analysis is conducted on the remaining structures to obtain the displacement time history curves at the structural components’ failure points under the three work conditions, as shown in
Figure 13. It can be seen from
Figure 13 that under the three types of different working conditions, the maximum displacements at the failure points of the remaining structures are of 14.22 mm, 13.27 mm, and 8.20 mm, respectively. Then, according to the Chinese Code CSCE 392, the displacements at the failure points of the remaining structures are individually solved by using the linear static calculation method (LSCM) and the nonlinear static calculation method (NSCM). The vertical displacements at the failure points of the multi-column frame tube structure with ATBCF under three working conditions obtained by using the linear static calculation method, the nonlinear static calculation method, and the nonlinear dynamic calculation method (NDCM) are listed in
Table 3.
It can be found from
Table 3 that under the three working conditions, the vertical displacements obtained by using the LSCM are greater than that obtained by using the NDCM, and the calculation results obtained by LSCM and NDCM are relatively close. Comparing with the vertical displacement obtained by NDCM, the vertical displacements obtained by LSCM are individually only larger of 2.5%, 2.9%, and 7.2%, which indicates that when adopting the LSCM, if the dynamic amplification coefficient is selected as 2.0, then the calculation results can accurately reflect the dynamic effects caused by the transient failure of the structural load-bearing components. However, under the three working conditions, the vertical displacements obtained by using the NSCM are smaller than that obtained by using the NDCM. Comparing with the vertical displacements obtained by NDCM, the vertical displacements obtained by NSCM are individually smaller of 17.4%, 18.8%, and 21.3%, which indicates that when utilizing the NSCM, if the dynamic amplification coefficient is taken as 1.35, then the calculation results of the vertical displacements at the failure points of the remaining structure may be smaller than the actual ones.
The vertical displacements of the failure points of the remaining structures with the side middle column demolition, the edge middle column demolition, and the corner column demolition are recalculated by using the NSCM. Currently, the dynamic amplification coefficients are determined as of 1.92, 1.92, and 1.84, and the corresponding vertical displacements at the failure points of the remaining structures are calculated as of 14.23 mm, 13.31 mm, and 8.22 mm, respectively. At this point, the calculation results obtained by using the NSCM are very close to those obtained by using the NDCM, with only the differences of 0.01 mm, 0.04 mm, and 0.01 mm between the calculated results.
4. Discussion
The plastic deformation capacity of the remaining structure with the side column demolition or with the edge middle column demolition is significantly higher than that of the remaining structure with the corner column demolition. Its mechanical mechanism can be explained by the fact that the upper and lower chords of the mid span truss beam can generate the effective ties, while the upper and lower chords of the truss beam at the end almost cannot militate the effective ties. However, for the remaining structure dismantling the side column that is perpendicular to the assembly slab seam, its plastic deformation capacity approximately equals to that of the remaining structure dismantling the edge column that is parallel to the assembly slab seam, while its bearing capacity of the second defense line is slightly smaller than the latter's bearing capacity of the second defense line. The mechanical mechanism formed by the difference in load-bearing capacity of the second defense line of the remaining structure under the two working conditions of removing the side beam and removing the edge beam is a problem worthy of in-depth research.
In addition, the calculation and analysis for the progressive collapse resistance of the multi-column frame tube structure with ATBCF under the conditions of different column demolition indicate that when applying the LSCM for calculating the vertical displacements of the remaining structures, it is reasonable to take 2.0 as the recommended dynamic amplification factor according to the Chinese Code CSCE 392, While when adopting the NSCM for calculation, if the dynamic amplification coefficient is taken as 1.35, the calculation results may be smaller than the actual values. So, when the nonlinear static calculation method is adopted to solve the failure point displacement of the remaining structure of the multi-column frame tube structure with ATBCF or other similar assembly frame structures, how to determine the appropriate dynamic amplification factor, is also a question worth further research.
5. Conclusions
To assess the progressive collapse resistance capacity of a multi-column frame tube structure with ATBCF under different column demolition conditions, the progressive collapse resistance performance and mechanism of the remaining structure are studied by using the ALP method, and the effect of column failure time on the dynamic response of the remaining structure is investigated. The conclusions of this study are as follows:
(1) The stiffness and residual bearing capacity of the remaining structure with the corner column demolition are larger than that with the middle column demolition, while the ultimate displacement of the former is smaller than that of the latter, therefore, the remaining structure with the middle column demolition possesses a stronger plastic deformation capacity.
(2) For the remaining structure with the side or edge middle column failure, the frame beam elevates the safety storage, which results in that the remaining structure has an excellent second defense line against the progressive collapse. However, for the remaining structure with the corner column failure, due to the lack of reliable ties of the upper and lower chords of the truss beam at the corner, the safety storge of the frame beam above the failure point needs to be enhanced to ensure the remaining structure’s capacity to resist progressive collapse under the condition of corner column failure.
(3) The dynamic analysis for the structure with ATBCF indicates that the shorter the column failure time, the greater the dynamic response of the remaining structure is. When the ALP method is adopted to operate the progressive collapse analysis of the remaining structure, it is reasonable to take the column failure time as 0.1 times of the first-order vertical vibration period of the remaining structure, and it is suitable to set the dynamic amplification coefficient as 2.0.
Author Contributions
Conceptualization, R.Z. and Z.Z.; methodology, R.Z. and G.C.; software, Z.Z. and G.C.; validation, R.Z., Z.Z. and G.C.; formal analysis, Z.Z.; investigation, R.Z. and Z.Z.; resources, W.L.; data curation, Z.Z. and G.C.; writing—original draft preparation, R.Z.,G.C. and Z.Z.; writing—review and editing, R.Z. and G.C.; visualization, W.L.; supervision, R.Z.; project administration, Z.Z. and G.C.; funding acquisition, R.Z. and G.C.; All authors have read and agreed to the published version of the manuscript.
Funding
This research was funded by the Scientific Research Project of Education Department of Hunan Province (19A095) and the Hunan Natural Science Foundation (2018JJ2020, 2020JJ5018).
Data Availability Statement
All data and models generated or used during the study appear in the submitted article.
Acknowledgments
The research work was supported by Key Laboratory of Dynamics and Reliability of Engineering Structures of College of Hunan Province, and Hunan Engineering Research Center of Development and Application of Ceramsite Concrete Technology.
Conflicts of Interest
The authors have no relevant financial or non-financial interests to disclose. The authors have no competing interests to declare that are relevant to the content of this article.
References
- ASCE 7. American society of civil engineers standard 7 minimum design loads for buildings and other structures. Am. Soc. Civ. Eng. 2010, USA. [Google Scholar]
- Li, Z.; Xu, T.; Yuan, X.; Zhang, Y. , Q, K. Load resisting mechanism of RC spatial beam-column substructures with unequal spans in the loss of a corner column scenario. J. Vib. Shock 2023, 42, 115–125. [Google Scholar] [CrossRef]
- Moore, D. The UK and European regulations for accidental actions. In Workshop on Prevention of Progressive Collapse, National Institute of Building Sciences, Washington, DC, 2002.
- Office of the Deputy Prime Minister. The Building Regulations 2000, Part A, Schedule 1: A3. Disproportionate Collapse, UK, 2004.
- BS, B. Structural use of concrete, part 1: Code of practice for design and construction. British Standards Institution, UK, 1997. [Google Scholar]
- GSA (General Services Administration). Alternate path analysis and design guidelines for progressive collapse resistance. Washington, DC, 2013.
- DoD (Department of Defense). Design of structures to resist progressive collapse. Unified Facilities Criteria. UFC 4-023-03, Washington, DC, 2016.
- JGJ3. Technical specification for concrete structures of tall building. China Architecture and Building Press, Beijing, 2010.
- Starossek, U. Typology of progressive collapse. Eng. Struct. 2007, 29, 2302–2307. [Google Scholar] [CrossRef]
- Xiong, J.; Xiong, H.; Li,Y. Analysis on resistance and ductility of progressive collapse of RC frame structures. J. Nanchang Univ. (Eng. Technol.) 2014, 36, 335–340. [Google Scholar] [CrossRef]
- Alshaikh, I.M.H.; Bakar, B.H.A.; Alwesabi, E.A.H.; Akil, H.M. Experimental investigation of the progressive collapse of reinforced concrete structures: An overview. Structures 2020, 25, 881–900. [Google Scholar] [CrossRef]
- Qian, K.; Li, B. Dynamic and residual behavior of reinforced concrete floors following instantaneous removal of a column. Eng. Struct. 2017, 148, 175–184. [Google Scholar] [CrossRef]
- Zhou, Y.; Chen, T.; Pei, Y.; Hu, X. Failure mode research of fully assembled precast concrete frame structure under progressive collapse test. Earthq. Eng. Eng. Dyn. 2019, 39, 40–51. [Google Scholar] [CrossRef]
- Zhou, Y.; Zhang, Q.; Hu, X.; Chen, T.; Yi, W. Progressive collapse analysis of fully assembled precast concrete frame structures based on column removal method. J. Hunan Univ. (Nat. Sci.) 2020, 47, 1–13. [Google Scholar] [CrossRef]
- Zhou, Y.; Chen, T.; Pei, Y.; Hwang, H.-J.; Hu, X.; Yi, W.; Deng, L. Static load test on progressive collapse resistance of fully assembled precast concrete frame structure. Eng. Struct. 2019, 200, 109719. [Google Scholar] [CrossRef]
- Qian, K.; Luo, D.; He, S.; Yu, X. Progressive collapse performance of reinforced concrete frame structures subjected to ground two-column removal scenario. J. Build. Struct. 2018, 39, 61–68. [Google Scholar] [CrossRef]
- Zhang, Z.; He, R.; Mao, G.; Shu, X. Experimental and numerical study on the in-plane behaviour of a new long-span assembly composite floor system under lateral load. J. Asian Archit. Build. Eng. 2021, 21, 954–972. [Google Scholar] [CrossRef]
- Shu, X.; Zhang, Z.; He, R.; Xiao, S.; Liu, Z. Experimental study on in-plane stiffness performance of assembly truss beam composite floor. J. Build. Struct. 2017, 38, 93–104. [Google Scholar] [CrossRef]
- 19. GB50017. Code for design of steel structures. China Planning Press, Beijing, 2003.
- 20. GB50009. Load code for the design of building structures.China Architecture and Building Press, Beijing, 2012.
- Khandelwal, K.; El-Tawil, S. Assessment of progressive collapse residual capacity using pushdown analysis. In Structures Congress 2008: Crossing Borders, 2008; pp. 1–8. [CrossRef]
- 22. CECS 392: 2014. Code for anti-collapse design of building structure. China Planning Press, Beijing, 2015.
- Ji, N; Wu, X. ; Zhao, R.; Zhai, C.; Zhang, Y.; Nie, X. Experimental study on anti-explosion performance of the different types of structures in rock under the condition of plane charge explosion loading. Appl. Sci. 2023, 13, 5097. [Google Scholar] [CrossRef]
- Wang, T.; Liu, C. Dynamic progressive collapse analysis of steel frame structure. Build. Struct. 2010, 40, 5–8. [Google Scholar] [CrossRef]
- DoD. Design of buildings to resist progressive collapse. Unified facilities criteria (UFC). 4-023-03, US Department of Defense, USA, 2013.
|
Disclaimer/Publisher’s Note: The statements, opinions and data contained in all publications are solely those of the individual author(s) and contributor(s) and not of MDPI and/or the editor(s). MDPI and/or the editor(s) disclaim responsibility for any injury to people or property resulting from any ideas, methods, instructions or products referred to in the content. |
© 2023 by the authors. Licensee MDPI, Basel, Switzerland. This article is an open access article distributed under the terms and conditions of the Creative Commons Attribution (CC BY) license (http://creativecommons.org/licenses/by/4.0/).
