1. Introduction
In a world faced with growing environmental challenges such as climate change, natural resource degradation and demographic pressure, sustainable and efficient agricultural production has become a priority. Water-intensive agriculture is the main sector that feeds humanity, consuming around 70% of the total water consumed (FAO, 2017; SWITCH Asia, 2022b; Tian, 2016), and the demand for water and energy will continue to grow to meet the world's growing need for food (Alexandratos, 2012; Dalstein & Naqvi, 2022). 20.2% or 700 million Africans, according to a 2022 survey by the Food and Agriculture Organization of the United Nations (FAO), are suffering from hunger. Projections made by ref. (Walsh, 2018; Zhang, 2016) show an increase in demand for food of 50%, water of 30% and energy of 40% by 2030. Despite modernization and technological progress in the agricultural sector, the number of people suffering from hunger remains alarmingly high, and according to the FAO (2022) is expected to reach 600 million by 2030. To this end, many countries are importing more and more agricultural products to satisfy the growing demand for food (D'Odorico, Carr, Ridolfi, & Vandoni, 2014). Both the food and livestock sectors produce large quantities of organic waste, with animals producing around 8,000 billion kilograms of manure over the course of their lives (ASAE, 2005). Worldwide, a significant proportion of the 330 km3 of municipal wastewater is of food and organic origin (Mateo-Sagasta, 2015). In this respect, it is necessary to consider an inclusive approach between the different elements of the energy, water, food, waste and land nexus, rather than looking exclusively at the effects of each (Purwanto, 2017).
To understand and plan regional development, including the agricultural production sector, public authorities need a basic economic approach to better appreciate the impact of each sector of activity on the economy (Purwanto, 2017). Moreover, national agricultural production is underpinned by local agriculture, which is inextricably linked to water, energy and fertilizer resources (Songhua Huan, 2023). The importance of fostering a healthier, cleaner and more innovative environment is underlined in SDGs 2, SDGs 6, SDGs 7. Given the effects of climate change and the scarcity of water resources, it is more appropriate to make use of water-efficient techniques and technologies that can guarantee better yields (Songhua Huan, 2023). Some research works have examined the elements of the coupled link, such as (Ahmad, Jia, Chen, Li, & Xu, 2020) water-energy link, (Ali & Akbar, 2021) water-feed link and (Ladha Sabur, Bakalis, & Fryer, 2019) energy-feed nexus.
A number of recent studies have focused on an approach aimed at understanding the connections between water, energy, food and associated elements (Songhua Huan, 2023). The understanding of interconnections in the energy-water-food nexus mainly uses the analysis method via the input-output model (Tabatabaie, 2021; Pemi, et al., 2023), the spatio-temporal evaluation method with emphasis on a logical coupling arrangement (Sun L. N., 2022) or other similar methods. The culmination of these approaches ensures the security and sustainability of WEF and related elements (Meng, 2019; Li, 2020).
The work of (Wang, 2008) develops the hypothesis of economic base theory, enabling it to be classified into essential (basic) and non-essential (non-basic) sectors. The distinction between core and non-core sectors is important for understanding a region's economy. A basic sector are often considered the primary engines of economic growth, as they create jobs, generate income and stimulate other economic activities, while non-basic sectors provide services and intermediate products needed by the economy as a whole that are mainly used locally (Juleff, 1993). This approach is developed in this work aiming to classify basic and non-basic sector for each production area. Assessing the basic/non-basic sector in a local area will enable the government to better understand, target and spend its budget (Purwanto, 2017).
There are four analysis approaches in the literature: The Location Quotient, the Assumptions Method, the Location Quotient and the Minimum Requirements Method (Wang, 2008). The work of (Karsinah KARSİNAH, 2016), the LQ as a tool that can be applied to position sectors as basic and non-basic through a comparison of the sector's potential at the local level with its potential at the regional level. Several sectors have been the subject of QL approach usage in occurrence agriculture (Hendayana, 2003), trade sector (Chiang, 2009), industrial concentration (Billings, 2012), carbon emissions (Trappey, 2013), economic development and interaction (Alhowaish, 2015; Karsinah KARSİNAH, 2016), road project development (Berawi, 2017), maritime sector (Morrissey, 2016.), determining strategies for the water, energy and food sectors in local economic development (Purwanto, 2017) , and among others.
Research on the energy-water-food nexus and associated elements is fraught with many questions and criticisms, including the lack of precision of the QL method, which despite its simplicity and analytical strengths is frequently used (Miller MM, 1991; Purwanto, 2017).
DLQ also has positive aspects such as its speed, low cost (Isserman, 1977) and absence of primary data in inter-regional trade (Richardson, 1985). In addition, to analyze gross domestic product (GDPR) (Suyatno, 2000; Iswandi, 2016) have made use of the dynamic location quotient (DLQ) in combination with the static location quotient (SLQ). Very few works adopt the Energy-water-waste-land nexus approach for the sustainability of agricultural production.
The main objective of this study is to quantitatively and qualitatively assess the contribution of the energy, water, waste and land sectors to agricultural products through the Energy- agricultural products, Water- agricultural products, Waste- agricultural products and Land- agricultural products nexus in each of Cameroon's ten regions. The input-output method combined with LQ and competitive cluster graph techniques analyzing regional production data from the year 2009 to 2018 are used. The proportional contributions of each nexus element to the agricultural sector are determined. The various methods were used to estimate harvested areas by region, agricultural production by region and the competitive positions of agricultural products (commodities and non-commodities). This study provides an overview of how energy, water, waste and land resources are linked to agricultural products within a sustainable approach to agriculture. The main contributions of this study are as follows
The proportions of the contributions of each network element in the EWWaL chain to agricultural production are determined
Geolocation and scale of variation of harvested areas and total regional production
Determining the zones suitable for each crop in each given region
Competitive position of main products on average by region.
Following the introduction section, section two describes the methodology applied in this research, while section three concerns the presentation of the data. Section four presents the nexus indicators (E-W-Wa-L) for agriculture and competitive positioning. Section five presents the results and discussion, and conclusion in section six.
2. Method
This research is organized according to a mixed method combining aspects based on quantitative and qualitative approaches. The following sections 2.1 and 2.2 summarize the steps and methods employed in this study.
2.1. Quantitative Approach Using the Input-Output Model
The methodology used in this section is an input-output model method for quantitatively assessing the interactions of the energy, water, waste and land (EWWaL) nexus in agricultural production. Adopting this approach, the quantitative equilibrium equation is the modified model equation of Ref. (Pemi, et al., 2023) :
represents quantities of intersectoral use, quantity of final demand and the quantity of resources produced. The vector of total product quantities () are nexus by a matrix of intersectoral intensity coefficients (K).
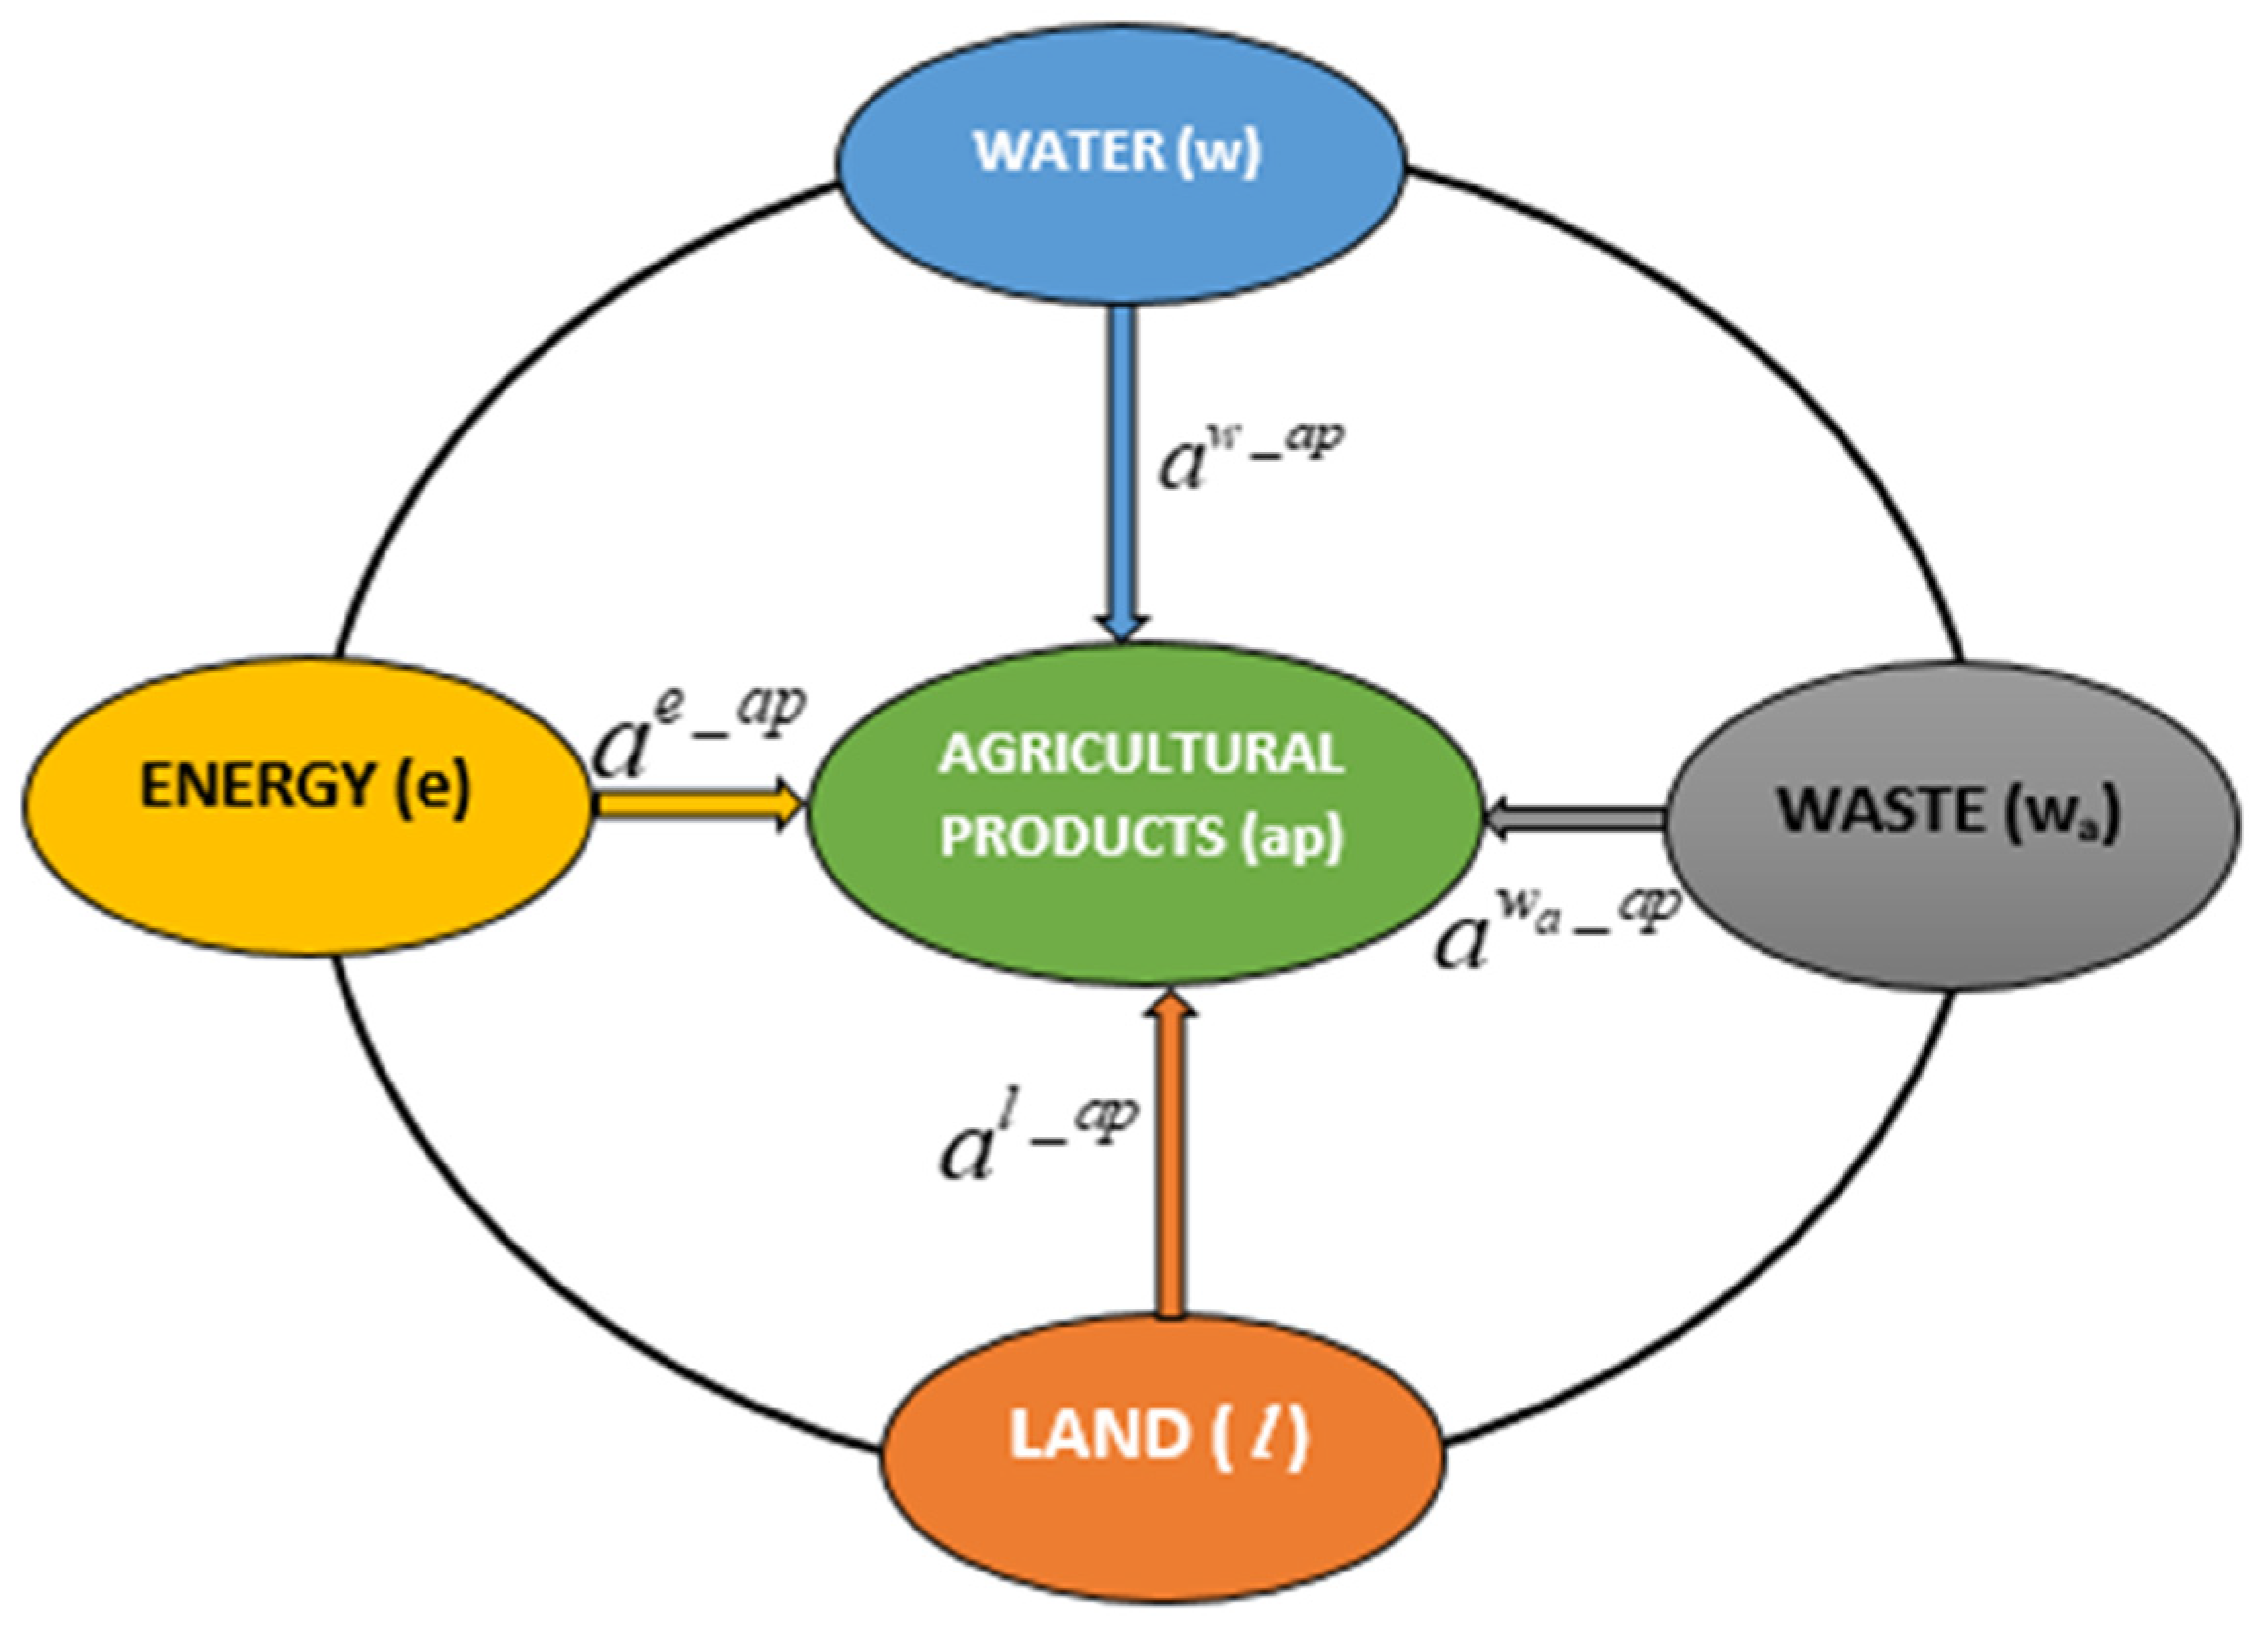
To complete the quantitative resource balance, the interleaved nexus of the E- W-W-L for agricultural products are shown in
Figure 1.
where Consumption of the ith energy resource in the jth agricultural products.
Consumption of the ith water resource in the jth agricultural products.
The consumption of the ith waste resource in the jth agricultural products.
The use of the ith agricultural area in the jth agricultural products. We have
where r, s, u, v and t are respectively the number of resources in Energy, Water, Waste, Land and agricultural products. The link intensity coefficients in the (E-W-Wa-L) nexus are governed by the intersectoral link elements
so:
Equations (2)–(5) then become:
With
, the Equations (10)–(13) become:
Equations (14)–(17) take the form
to obtain Equation (18) where K denotes the technology matrix of the E-W-Wa-L nexus.
2.2. Qualitative Approach Using Location Quotient and Competitive Position
Ref (Miller MM, 1991) defined LQ as a basic analytical tool for obtaining a coefficient or simple expression of the degree of representation of a particular industry in a given study region. This method is applied in this work to analyze the position of agricultural products in different regions with the same variable at the upper regional level to understand local potential on basic sectors. It is determined from Equation (21).
Where LQ is the value of the location quotient, represents production of product i in the region j and
is total production in the region j,
is the production of product i at national level, while
indicates total production at national level. If the value of
for a given production sector is greater than or equal to 1
, it can be classified as a commodity, whereas if the value of LQ is below 1
, it can be classified as a non-basic product. In addition, the value of the production growth rate (P) is obtained by subtracting the value of the production level of product i in the selected year j.
the value of the production level of product i in the initial year
, divided by value of
, then multiplied by 100 Equation (22).
If the value of P is positive and greater than 10% or 0.1, it reflects that product i is growing and the cluster's level of advantage in the region is increasing. On the other hand, if the value of P is negative and less than -10% or - 0.1. This means that growth is declining and the cluster's advantage is decreasing. Furthermore, if the shift is between +/ 10% or +/ 0.1 this can be considered a very small change.
3. Data Presentation
The data analyzed in this manuscript come from a variety of sources. In the energy demand and production sector, data are taken from the International Energy Agency (AIE, 2021) database and Cameroon-Electricity Consumption (electricity, 2021), representing total energy production in Cameroon. Data on agricultural products (production, production demand, irrigated area, water, agricultural waste, energy use in the agricultural sector, manure applied to soils) are taken from the FAO-AQUASTAT database (FAO, 2023), AQUASTAT (FAO, 2016; KNOEMA, s.d.). (KNOEMA, s.d.)The wastes considered are those from agriculture (potatoes, wheat, dried beans, soya beans, rice, corn, millet, sorghum) and livestock (breeding animals, chickens, layers, sheep, horses, goats, cattle, dairy cows, donkeys). The waters considered are those taken from underground sources. The energies used in agriculture in this paper are (diesel fuel), (Automotive gasoline), (liquefied natural gas), (fuel oil), (charbon) (electricity). Agricultural products include rice, corn, millet, potatoes, sweet potatoes, cassava, macabo/taro, yams, beans, soy, groundnuts, sesame, onions, okra, peppers, plantains, sweet bananas, cowpeas, pineapples, tomatoes, Bambara, cucumbers, palm oil and watermelons.
4. Link Indicators (EWWaL) for Agriculture and Competitive Positioning
Proportion of energy, water, waste and land consumption linked to agricultural products in relation to total energy, water, waste and land consumption in (%).
Location quotient and competitive position of main products by region
5. Results and Discussion
5.1. Energy Nexus Indicator for Agricultural Production
Energy plays an essential role in agricultural production.
Table 1 shows the quantification of the different forms of energy used in the agricultural production sector over the period 2009 to 2020. During this period, fuel oil emerged as the most widely used form of energy, followed by diesel, liquefied natural gas, electricity, a constant value use of coal and a very low value use. There are several reasons why the agricultural sector in Cameroon uses more fossil energy sources, not least the availability of fossil energy sources. Fossil fuels such as oil and natural gas have long been available and widely used in the country. They are easily accessible and more affordable in terms of costs for farmers. Furthermore, the infrastructure needed to use clean energies such as solar or wind power can be costly to set up. In Cameroon, there is still a lack of suitable infrastructure to enable a transition to clean energies in the agricultural sector, which hampers their use. The lack of subsidies and incentives to encourage the use of clean energy in the agricultural sector may also be a factor. However, it is important to note that the transition to clean energy sources in the agricultural sector is increasingly being encouraged in many countries, including Cameroon as Ref. (Iweh., et al., 2023) has highlighted. Initiatives and programs to promote the use of renewable energies and sensitize farmers to their benefits would be necessary as Ref. (World-Bank, 2022) highlights their ongoing development. This is to promote agricultural sustainability.
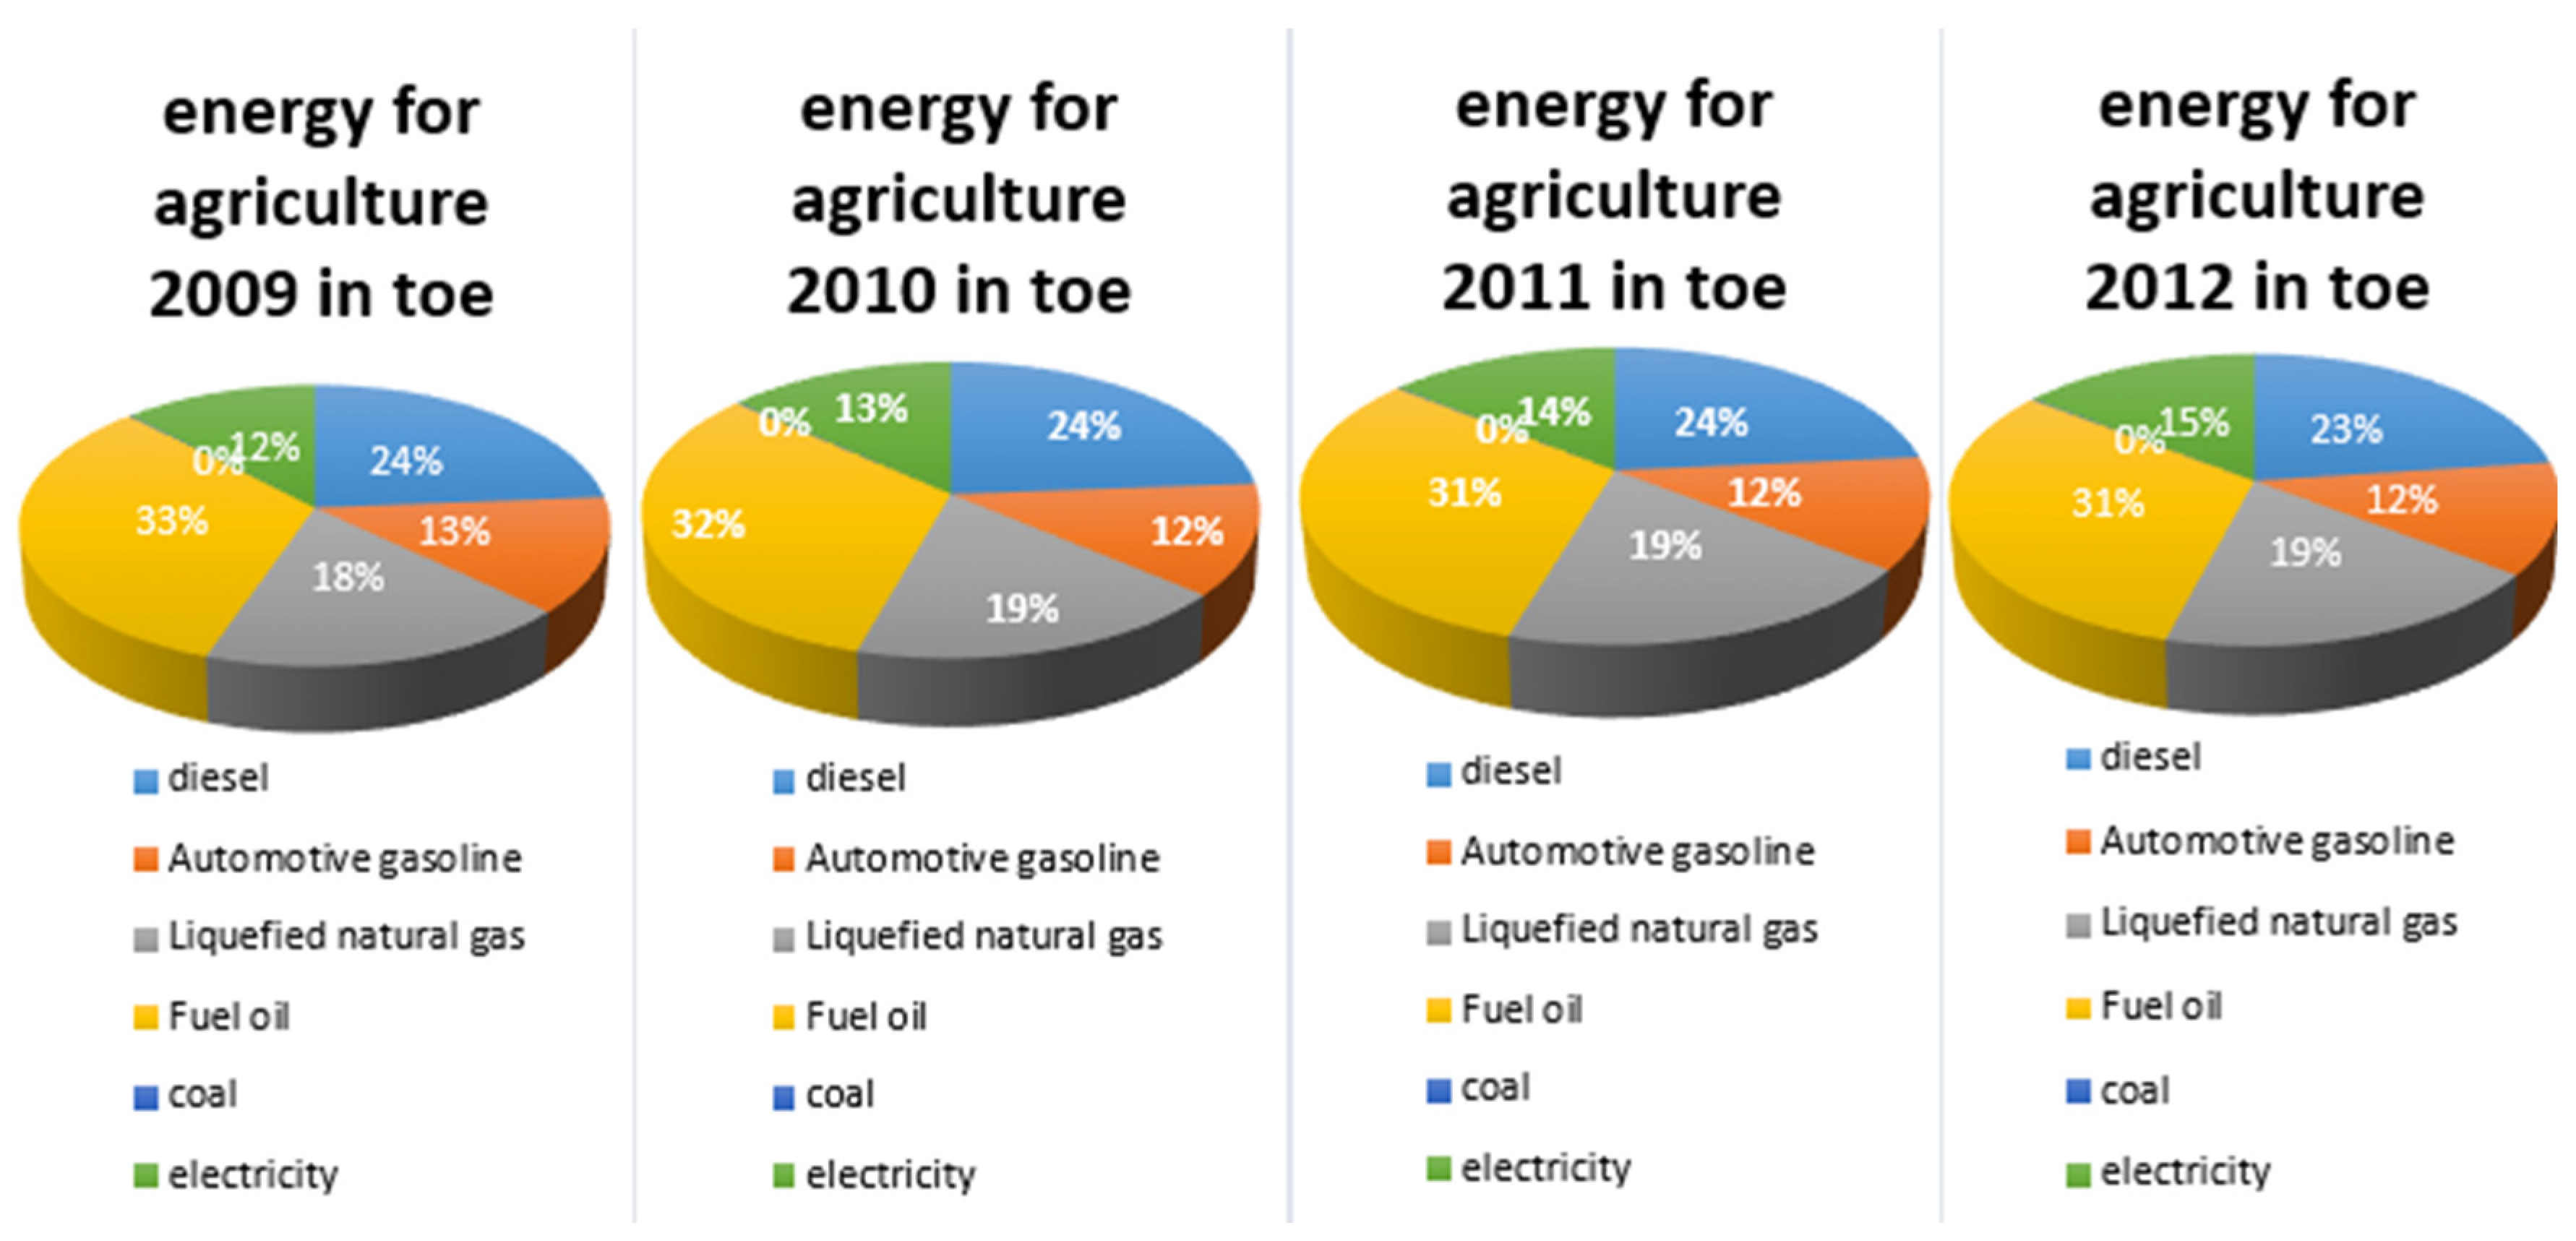
Figure 2 shows the share of different forms of energy used in the agricultural production sector over four consecutive years. It can be seen that for the different forms of energy as a whole, there is very little variation in usage, fluctuating around 1%.
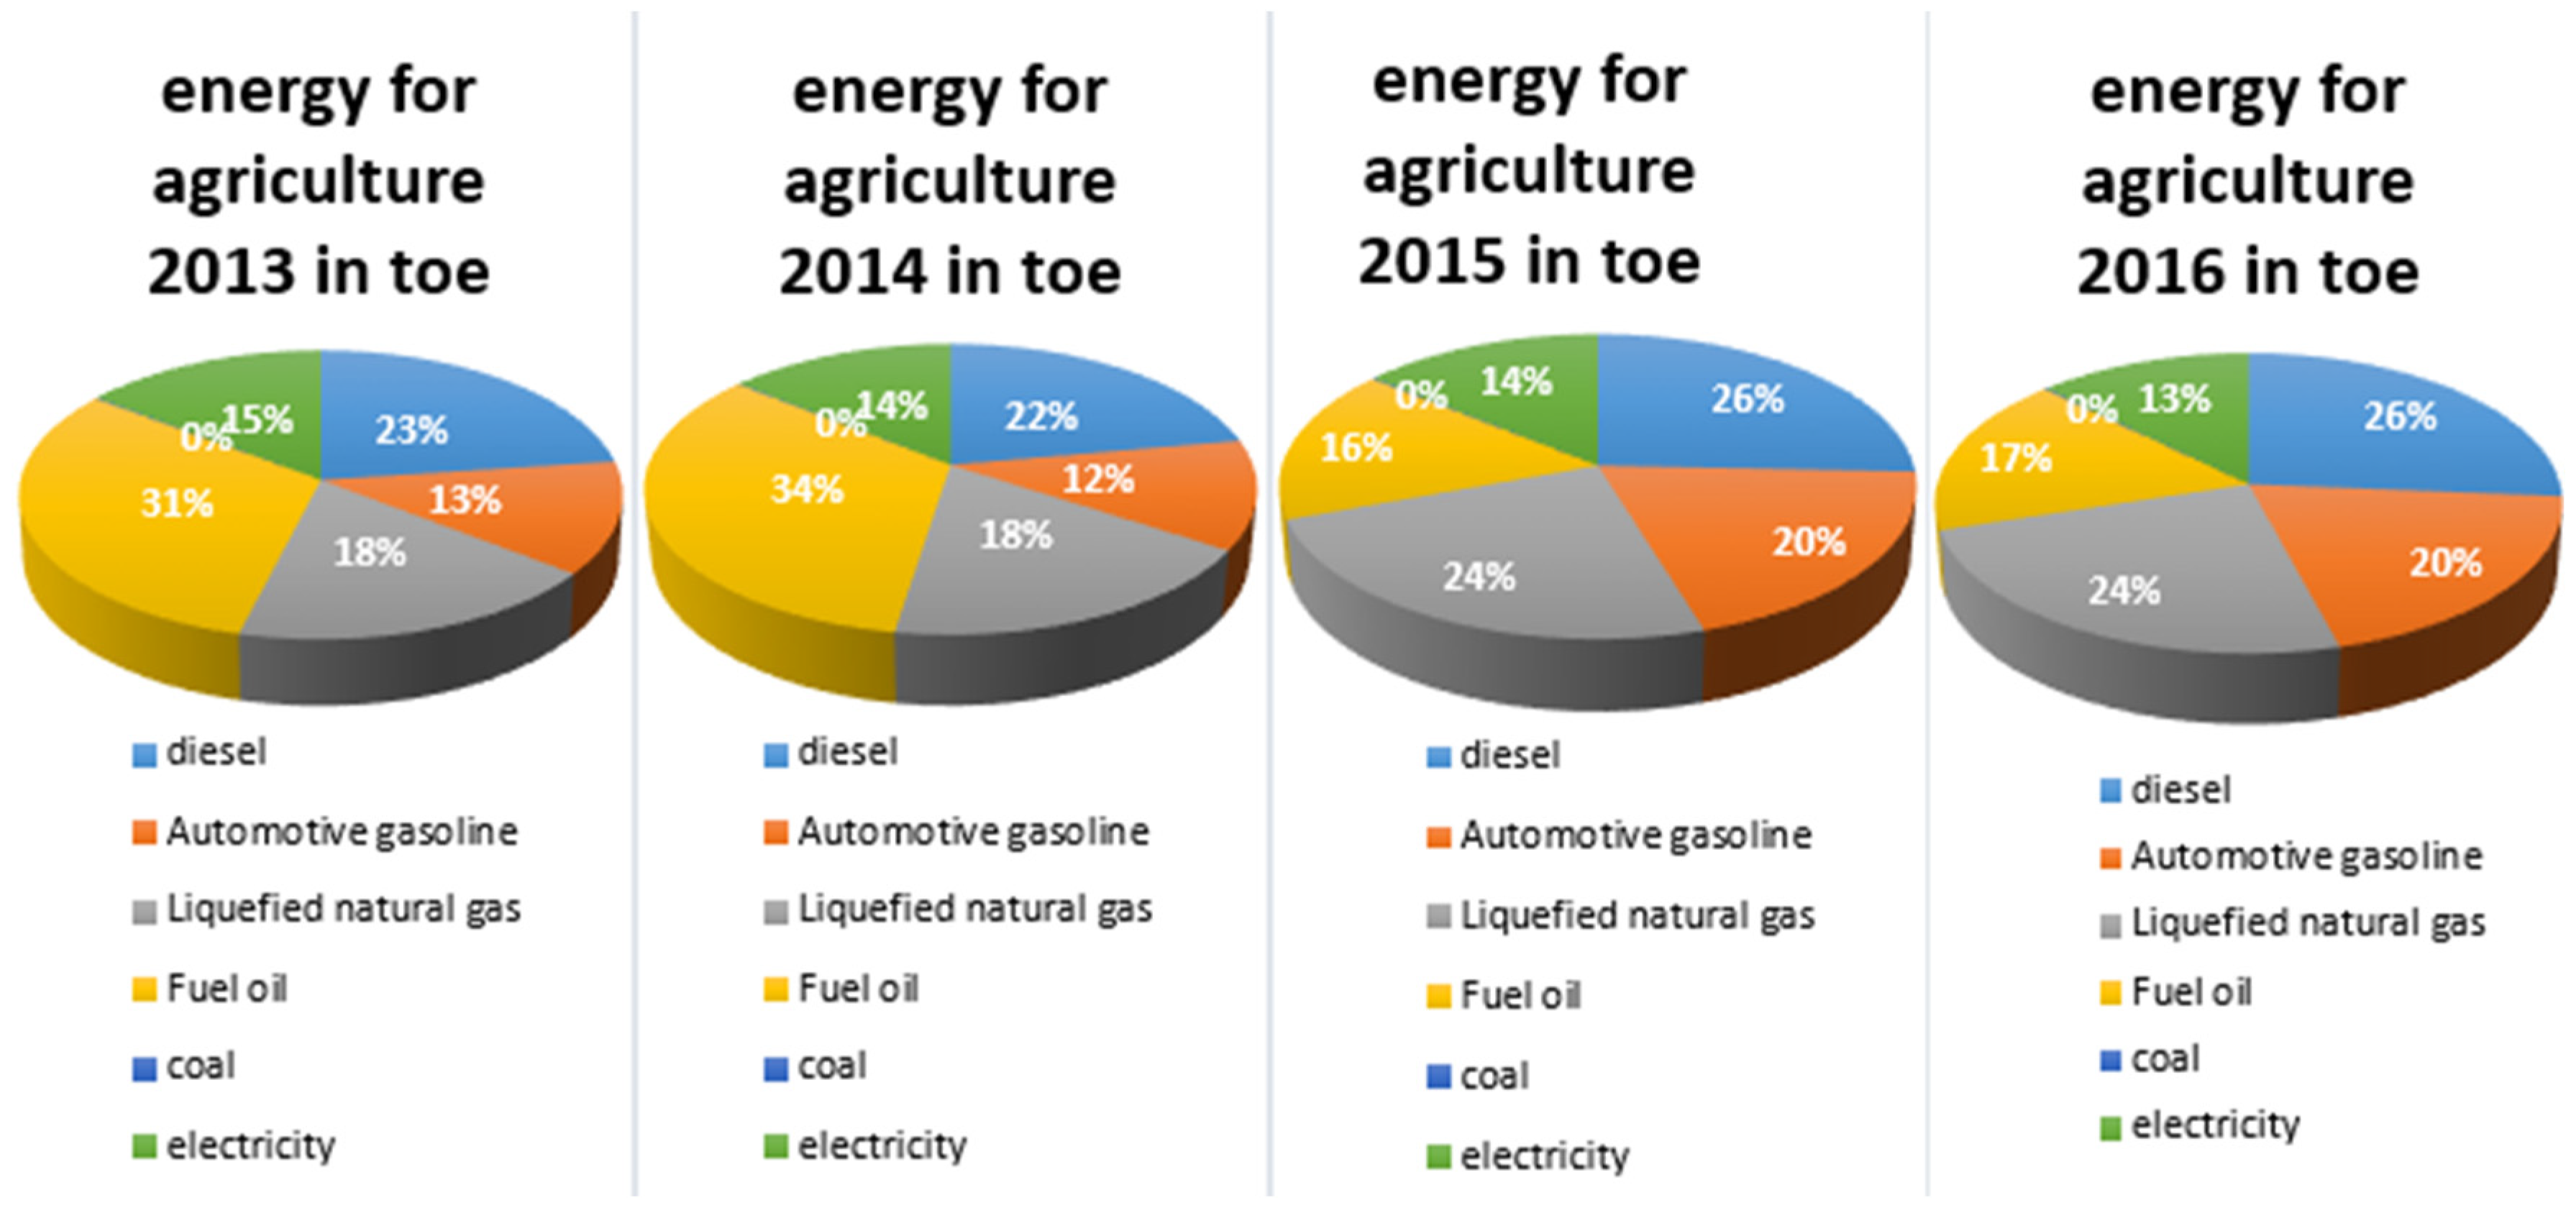
Figure 3 shows an increase of 4% in the use of motor gasoline between 2014 and 2015, which most probably signifies an expansion of developed agricultural land, the modernization of the sector in terms of agricultural equipment (new farm machinery, mechanized harvesting) and an increase in working hours. There has also been a drop in the use of fuel oil, which fell by more than 50% between 2014 and 2015, and an increase in the share of liquefied natural gas of around 6%. This can be explained by the variety of machine types used and their marginal productivity.
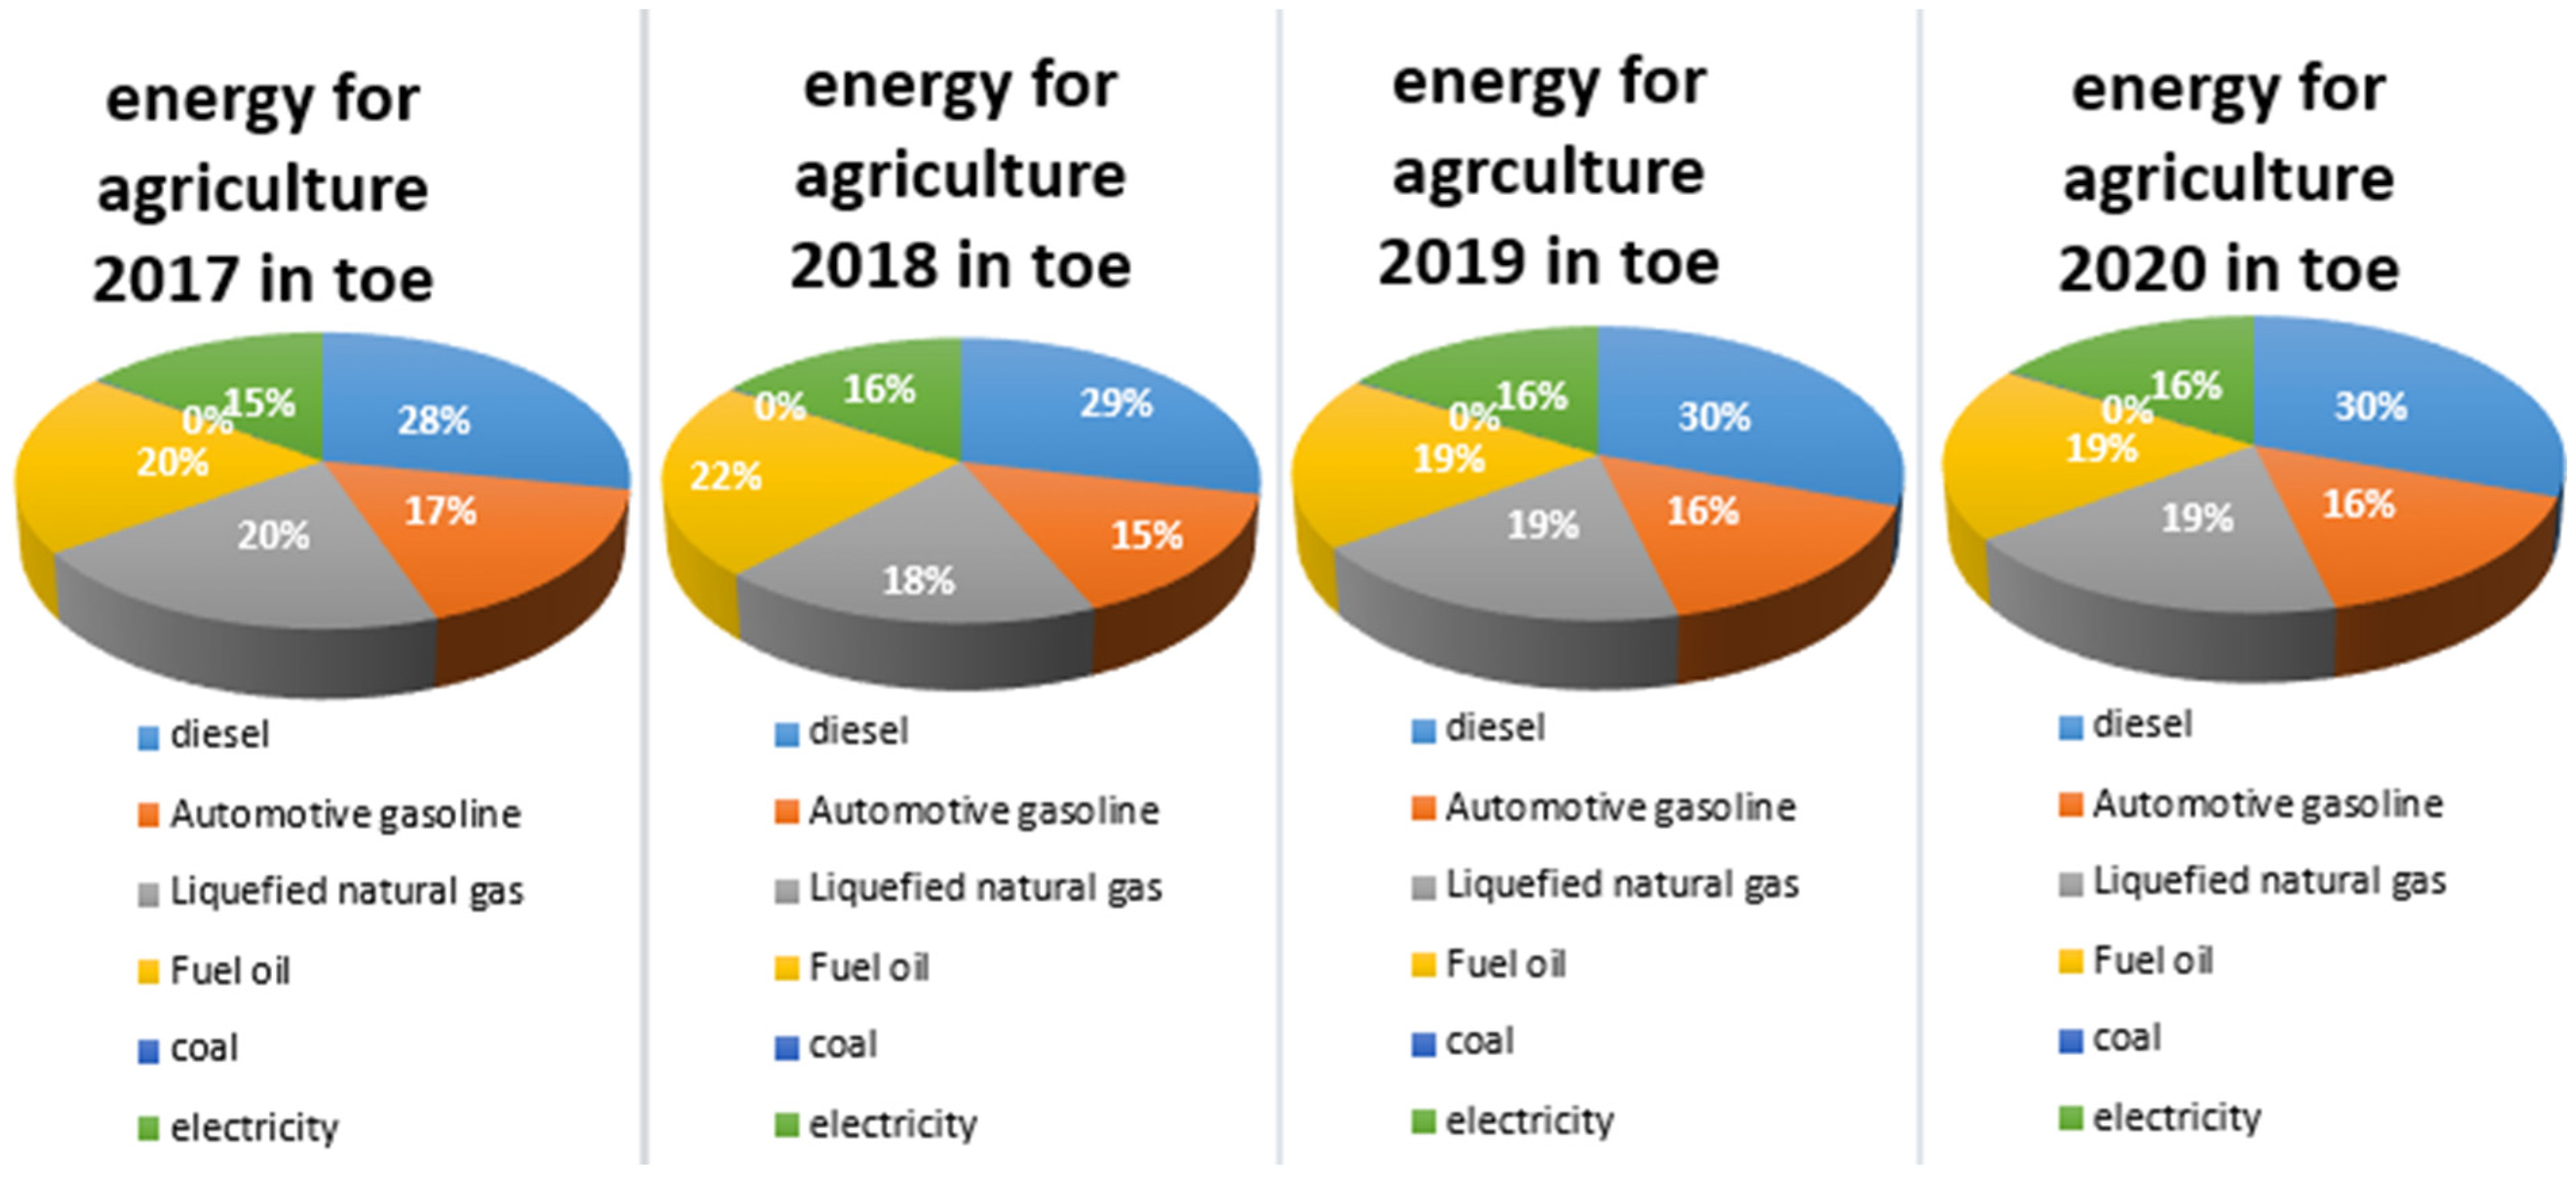
Table 2 shows the overall increase in production and total agricultural area from 2009 to 2018. An overall increase in production can be observed over this period. As for the agricultural area, a decrease of 6% is observed between 2016 and 2017. In this period (2016-2017),
Figure 4 shows a 3% drop in motor gasoline and a 4% drop in liquefied gas. However, we cannot literally conclude that these declines are the cause of the decrease in agricultural land, as the 2017-2018 period saw a further decline in motor gasoline (2%) and liquefied gas (2%), while harvested agricultural land increased by 4.7%.
In conclusion, cultivated farmland is not very dependent on energy availability, but is mostly ploughed using human and animal labor. This conclusion is in line with the Ref. (CIRAD., 2020), which states that draught animals provide 10% of agricultural energy, with 89% of the remainder provided by human power (farmers' arms). Mechanization of agriculture is likely to increase production, attract young people to farming, and reduce unemployment and the high rural exodus of young people in Africa and Cameroon in particular.
The results in
Table 3 show a gradual increase in energy consumption by the agricultural sector between 2009 and 2014, which also reflects the drop in consumption between 2014 and 2018. However, it is important to put these figures into perspective with the corresponding agricultural production over the same period. Agricultural production rose significantly, from 15,266,818 tonnes in 2009 to 22,342,775.3 tons in 2018, an increase of 46.36% in this decade. It appears that between 2009 and 2018 the average value of the energy share (in toe) per tonne of production is 0.0020 toe/t.
This suggests that, despite a fall in energy consumption, the agricultural sector has managed to increase its production significantly. This is the result of a more efficient and sustainable use of energy, as well as other factors such as the adoption of advanced agricultural technologies.
In conclusion, although energy consumption by the agricultural sector has fallen over a period of time, this has had no significant impact on growth in agricultural production.
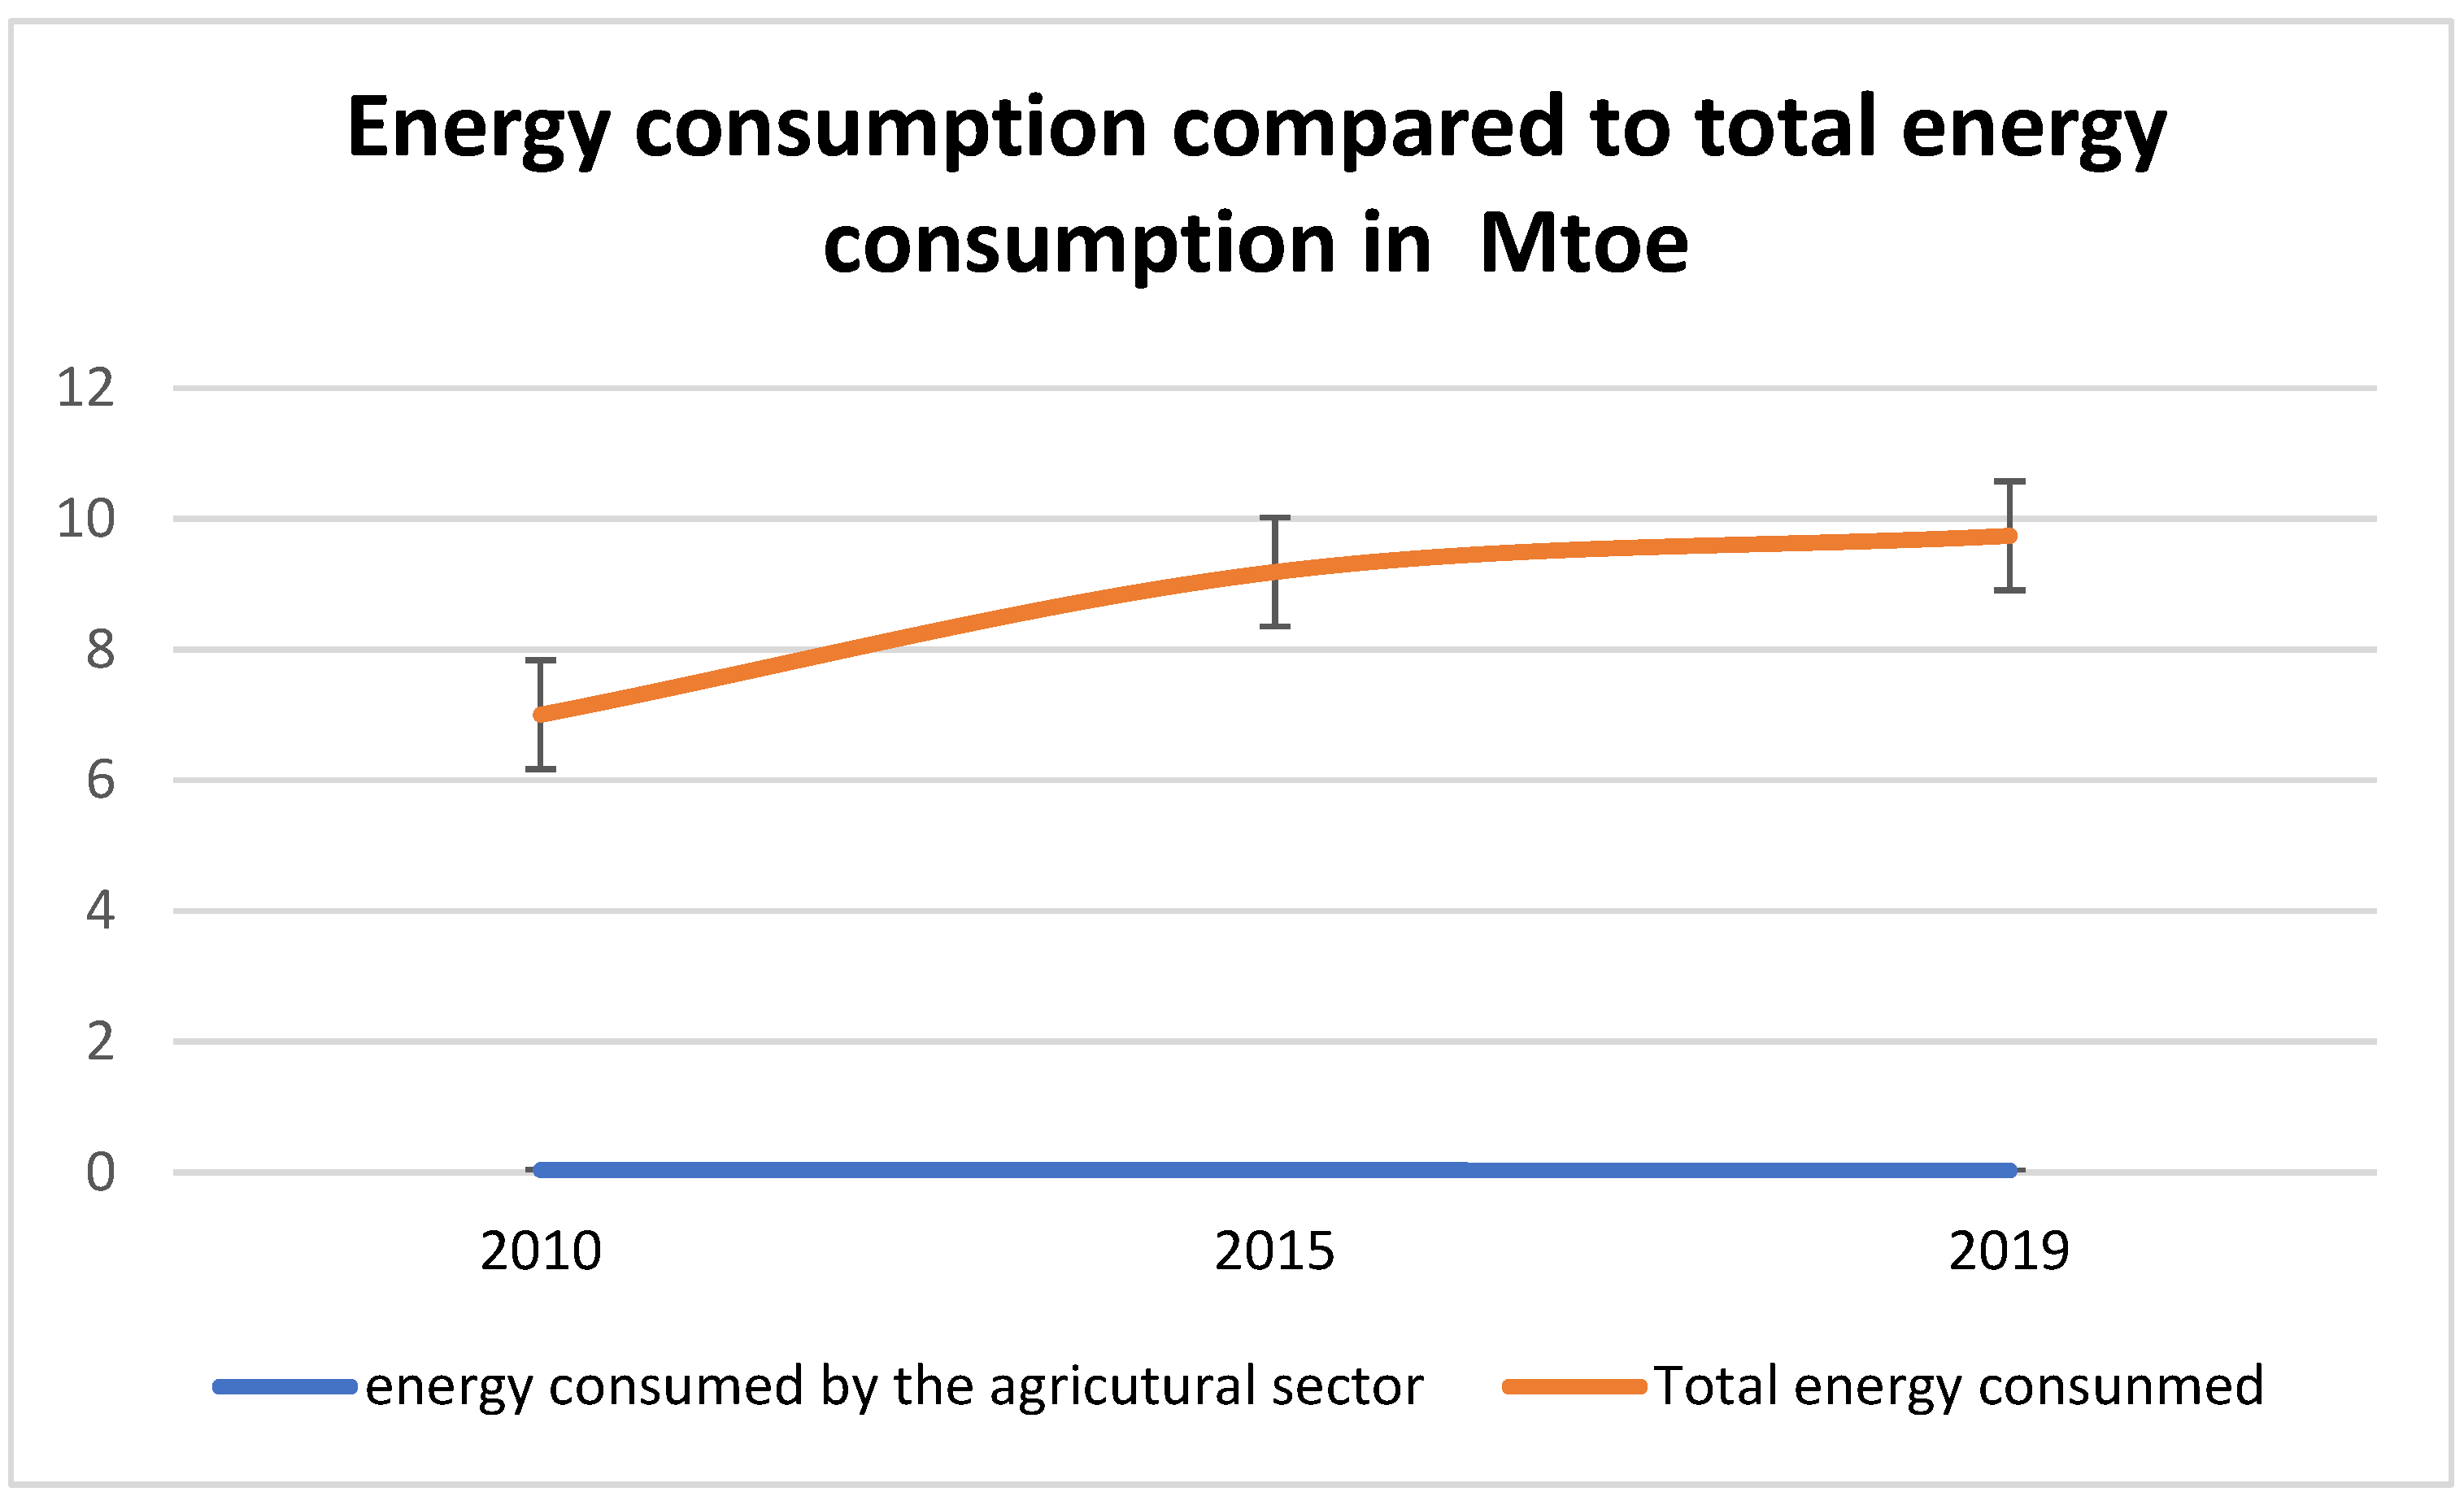
Figure 5 shows the intensity of energy use in the agricultural sector as a proportion of total consumption.
It is interesting to note from
Figure 5 that energy consumption by the agricultural sector as a proportion of total energy consumption is relatively low and has a downward trend throughout the period studied. Between 2010 and 2015 this consumption falls from 0.55% to 0.38%, then from 0.38% to 0.33% between 2015 and 2019.
These results suggest that the agricultural sector has made progress in energy efficiency over time. The decrease in energy consumption in 2010 and 2019 can be attributed to more sustainable farming practices and the adoption of energy-saving technologies. In addition, the security situation and the various crises recorded in the country during this period could have a significant impact on the country's hydrocarbon supply policy. It is important to stress that, in order to draw more accurate conclusions, it would be useful to compare these figures with those of other regions or sectors. This would make it possible to determine whether the energy consumption of agriculture is relatively low compared to other sectors, or whether it is specific to this particular region. In addition, it could be interesting to dig deeper to understand the specific factors that have contributed to the decrease in energy consumption between 2015 and 2020, in order to apply them to other regions or industries. However, further analysis of comparative figures and specific factors is required to draw more robust conclusions and consider structural measures. From an environmental point of view, the low energy consumption in the agricultural production sector has a positive impact on the environment, as it is heavily dominated by fossil fuel sources (around 85%).
5.2. Water to Agricultural Products Nexus Indicator
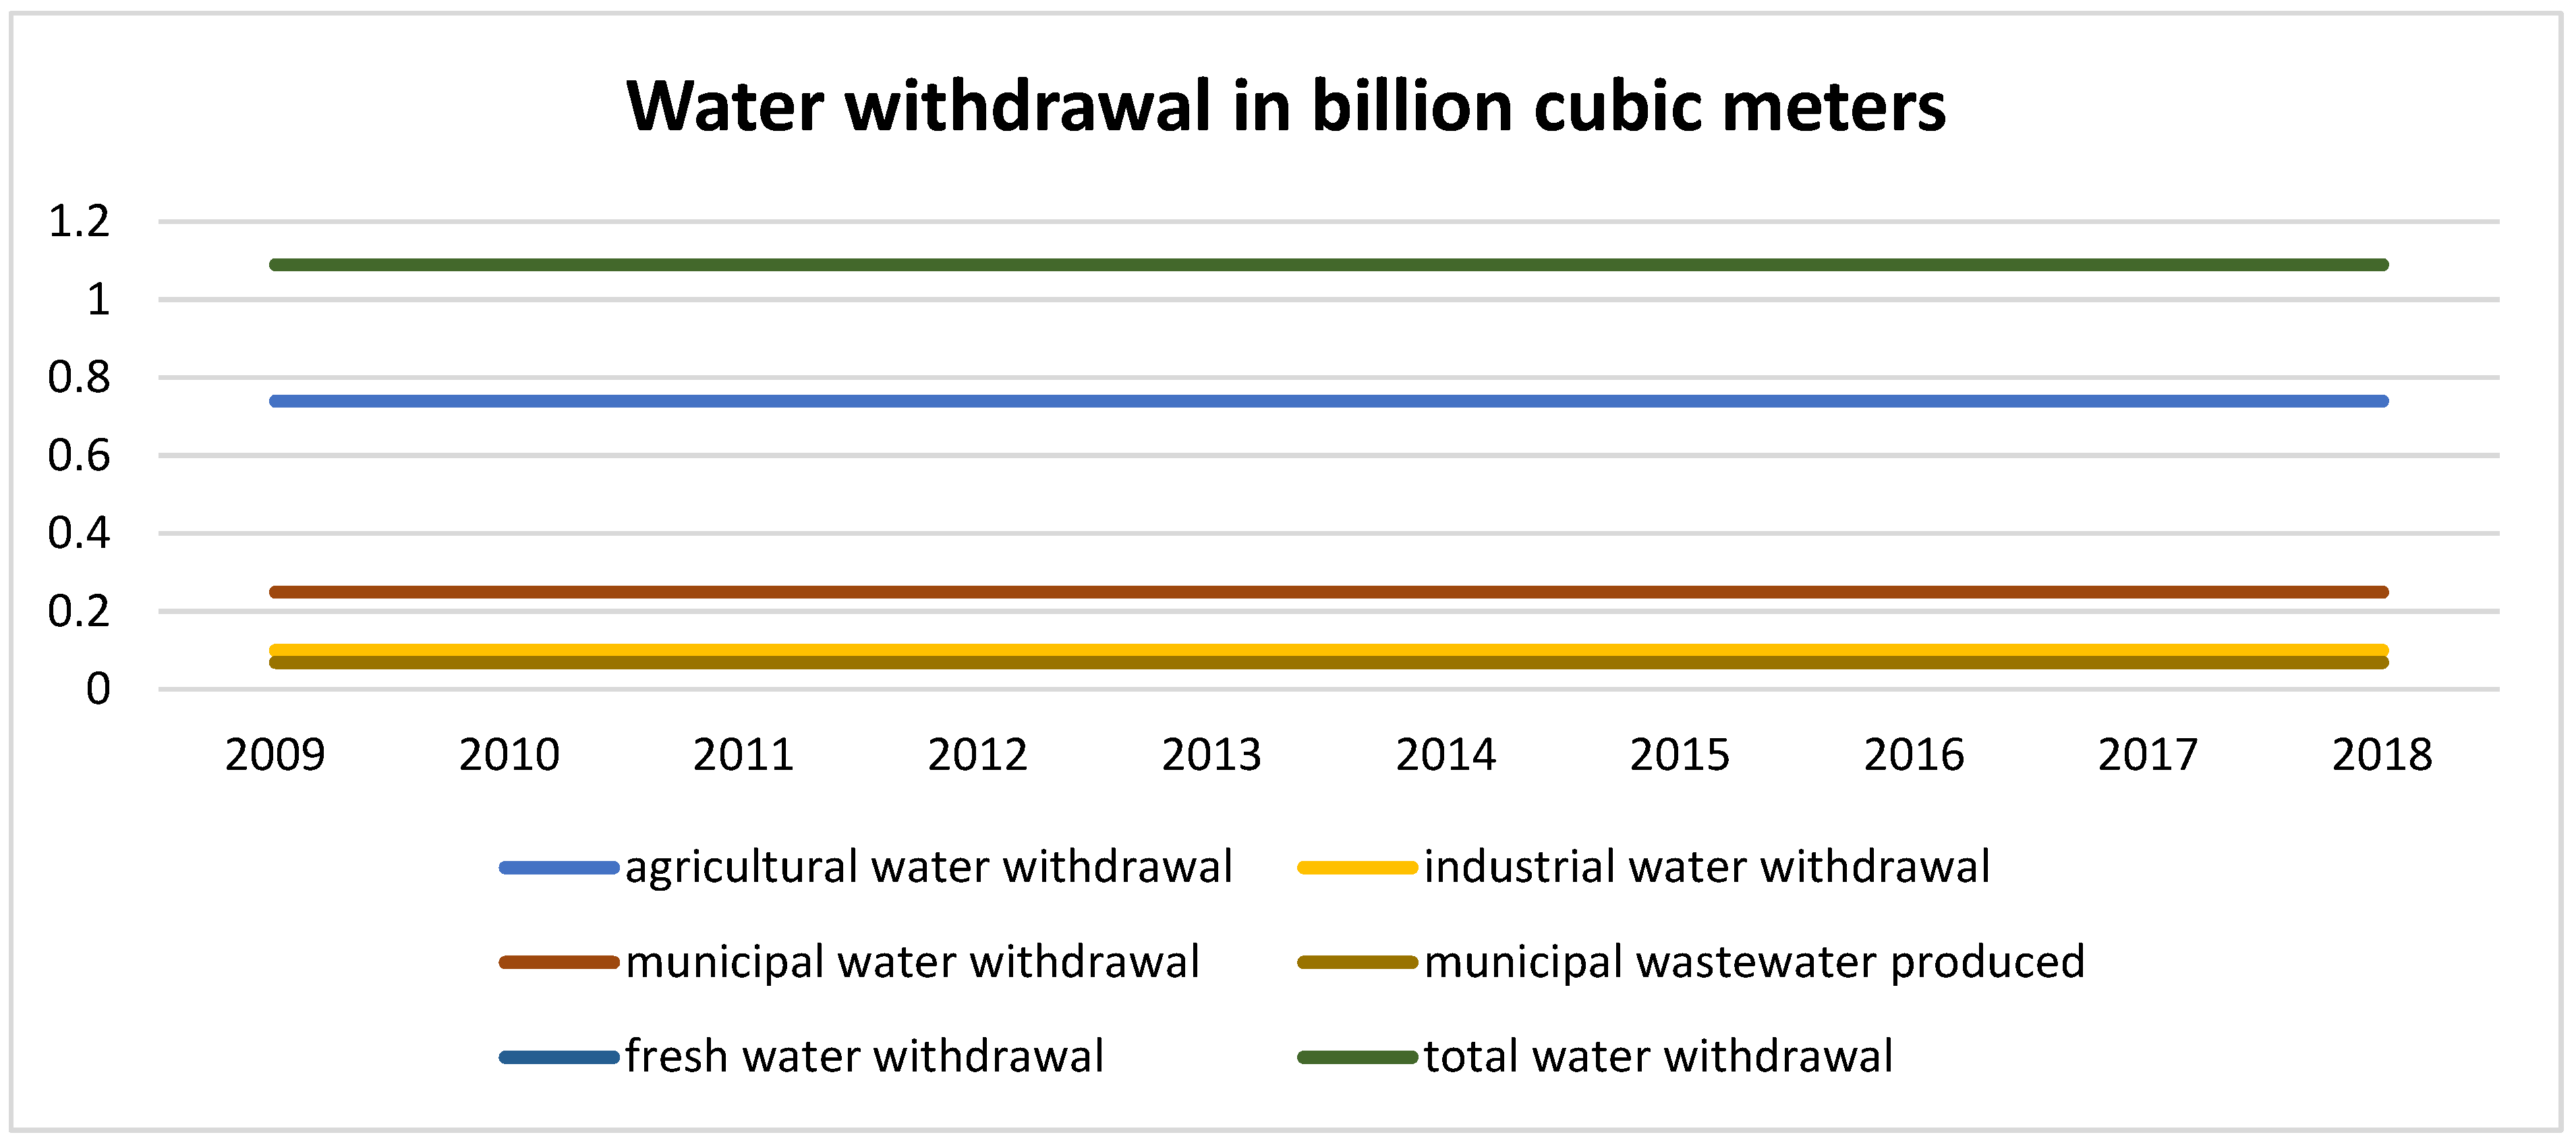
Figure 6 shows water withdrawal in billions of cubic meters for various sectors, including agriculture. The various sectors have managed to optimize their water consumption despite constant water use from 2009 to 2018, their growth is probably linked to investment in more efficient technologies and developing more sustainable practices to reduce their water footprint. This optimization of water use is important to ensure a balanced and sustainable use of water resources, given their scarcity. However, it would also be important to closely monitor the impact of sector growth on the environment, particularly with regard to water quality and the availability of water resources for local communities and ecosystems. The assumption of rain-fed agriculture is also possible to understand the constant use of water abstraction and increasing agricultural production.
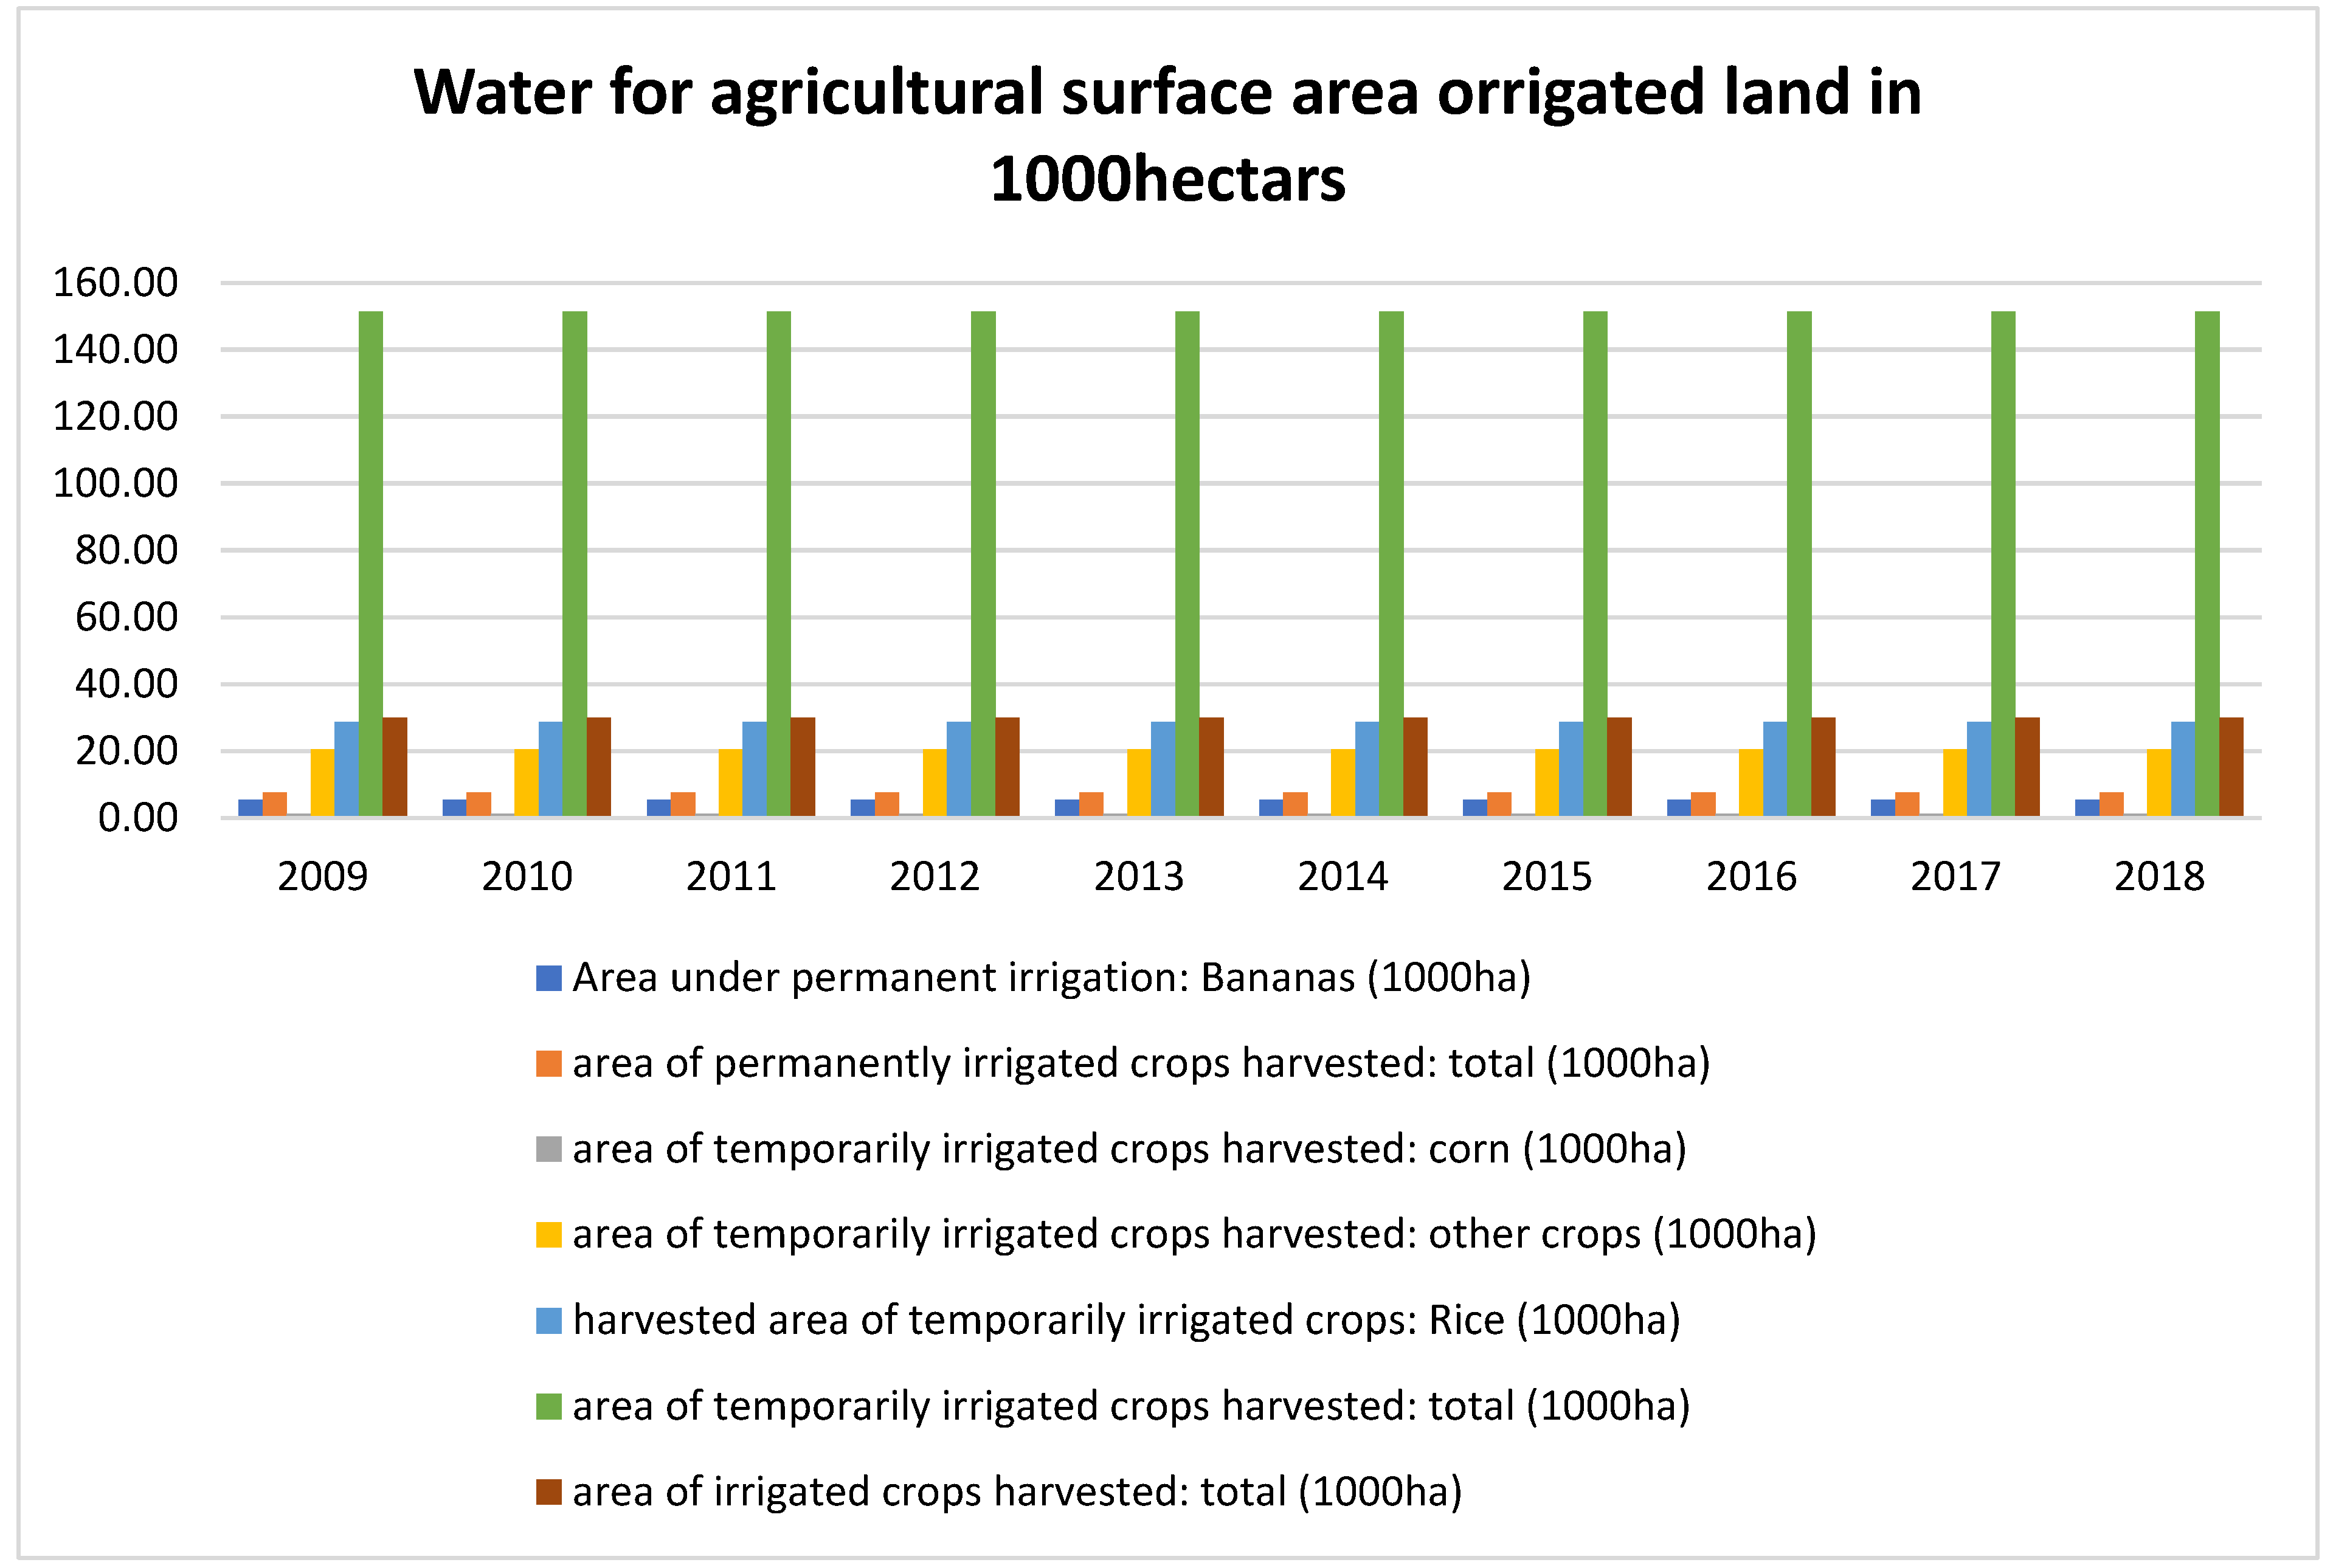
Permanently and temporarily irrigated areas, as shown in
Figure 7, have remained constant on average from 2009 to 2018. Specifically, temporarily irrigated areas are more dominant than permanently irrigated areas.
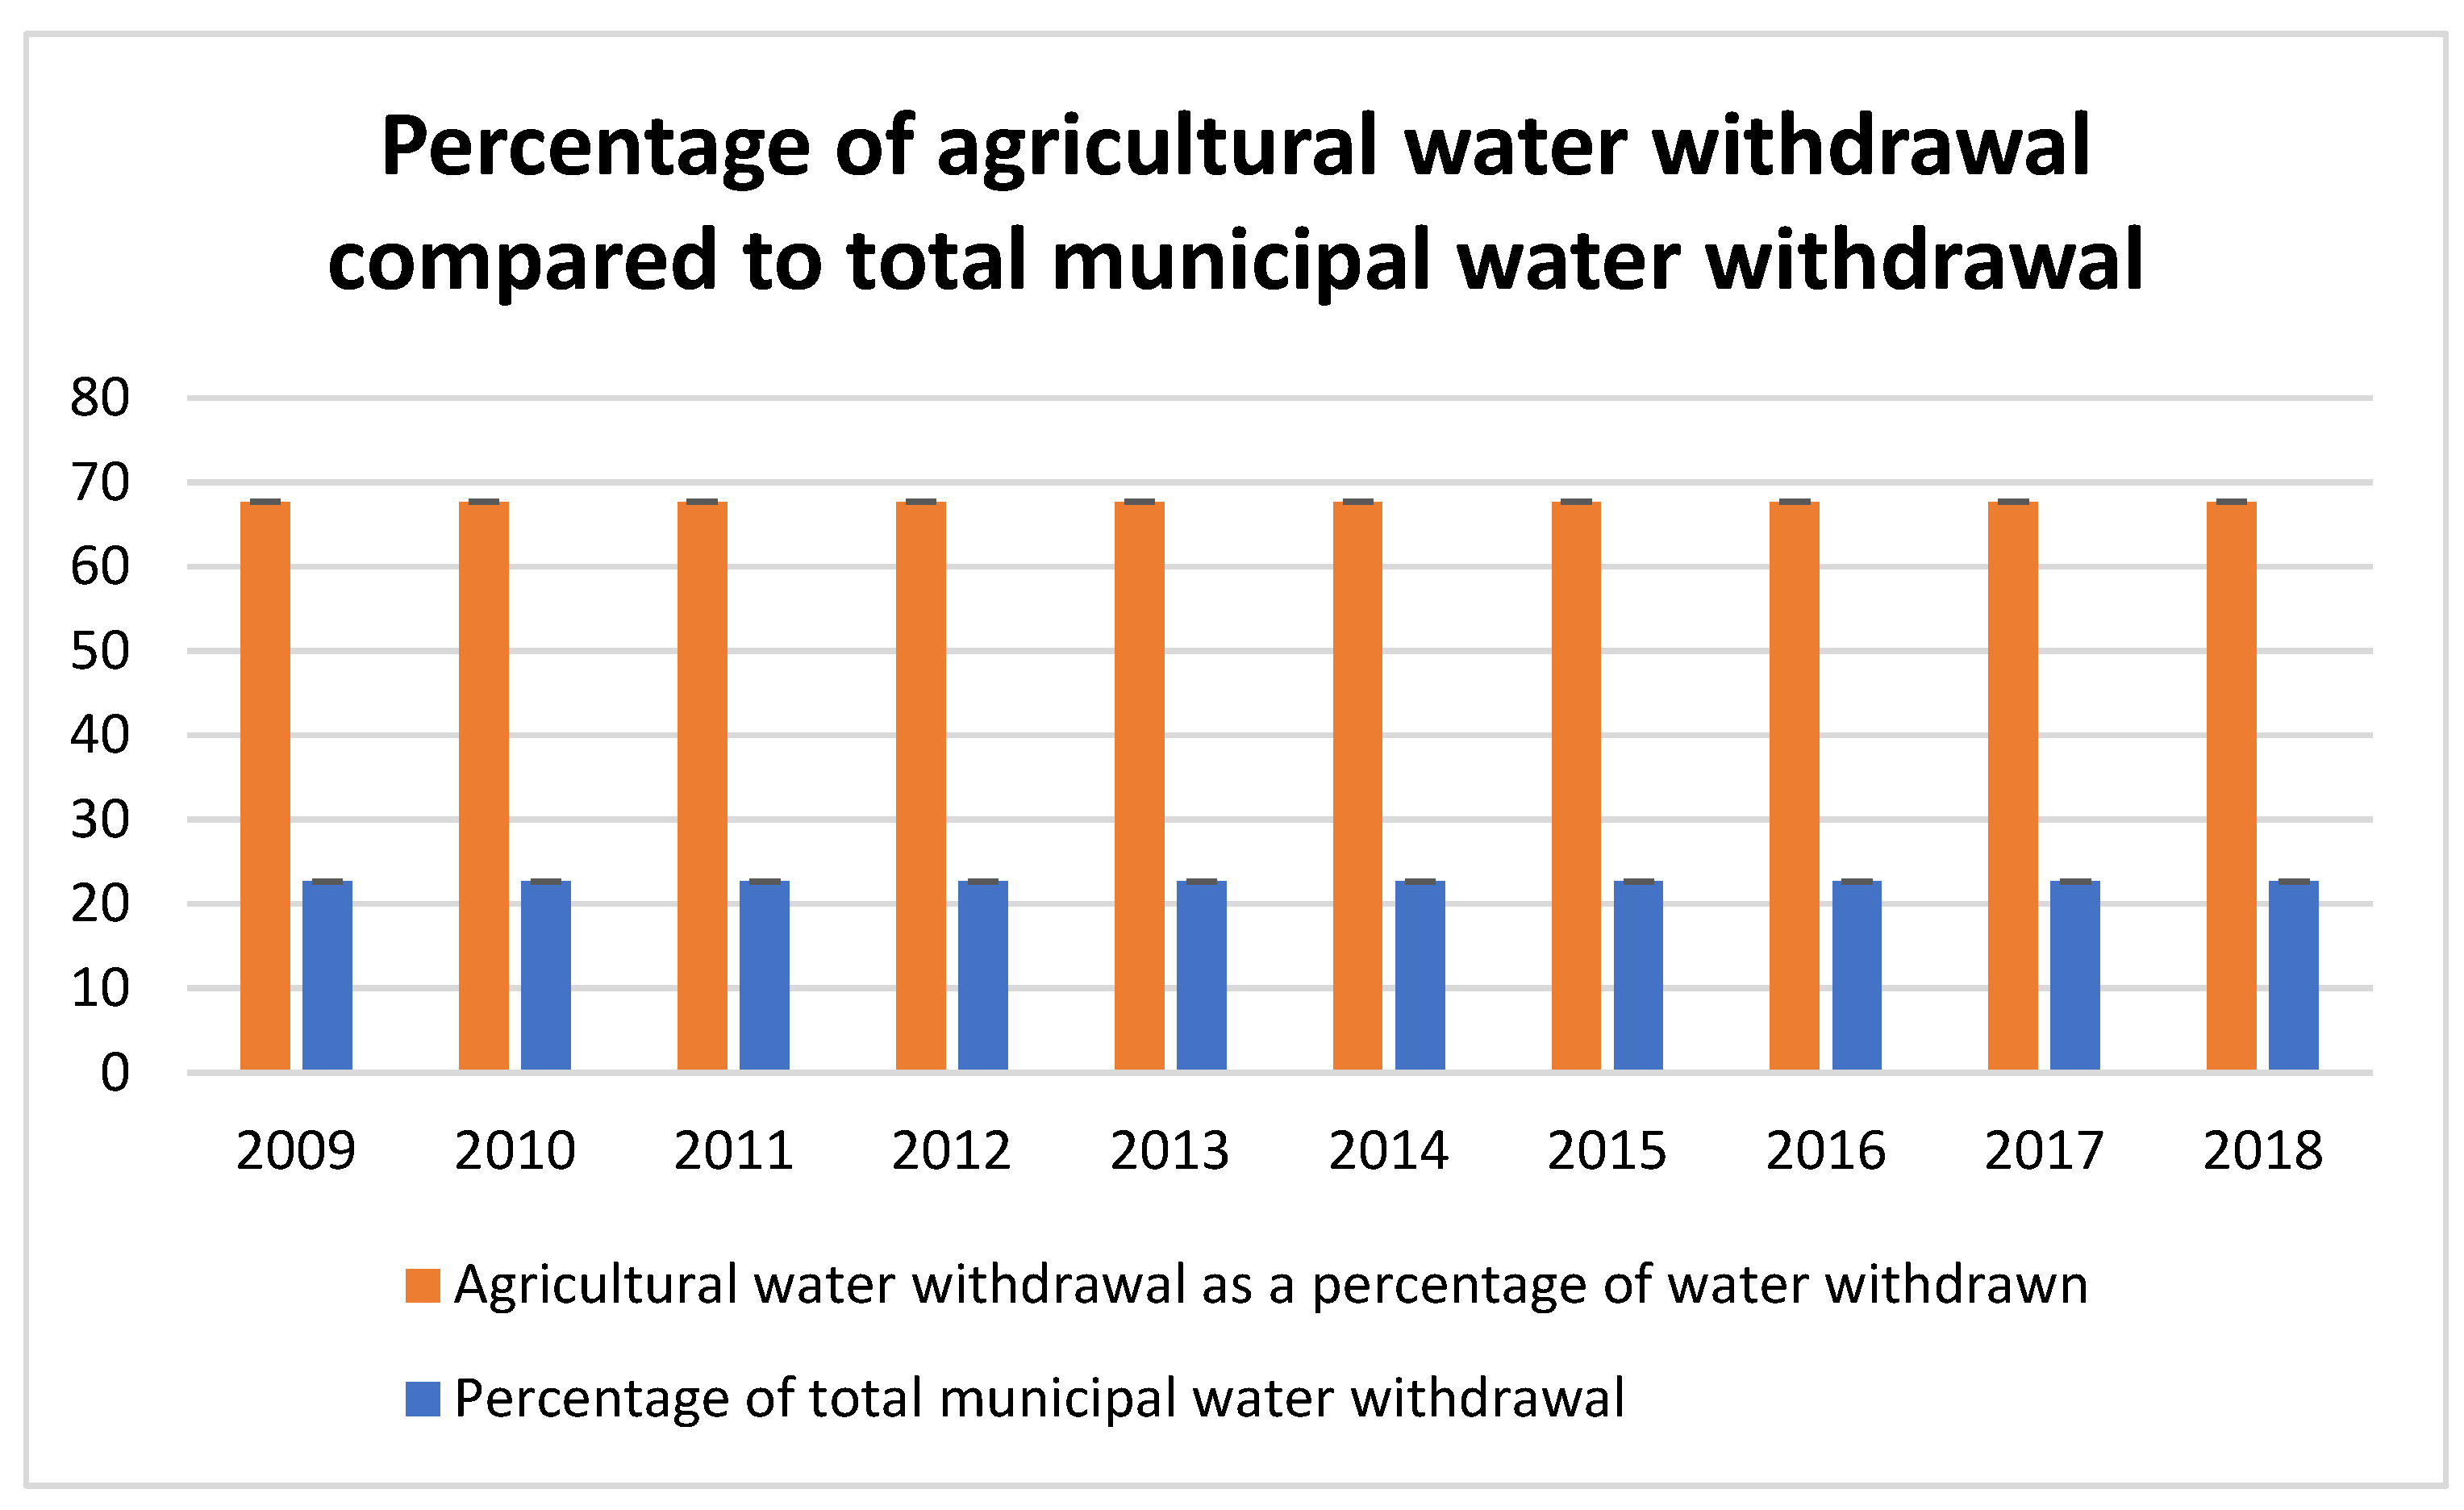
Figure 8 shows that the agricultural sector consumes three times more abstracted water than the total municipal water abstracted. However, water abstraction requires energy, and the use of renewable energy sources for agricultural water abstraction offers numerous advantages, both environmentally and economically. This contributes to the sustainability and resilience of the agricultural sector.
5.3. Waste Index in the Agriculture Sector
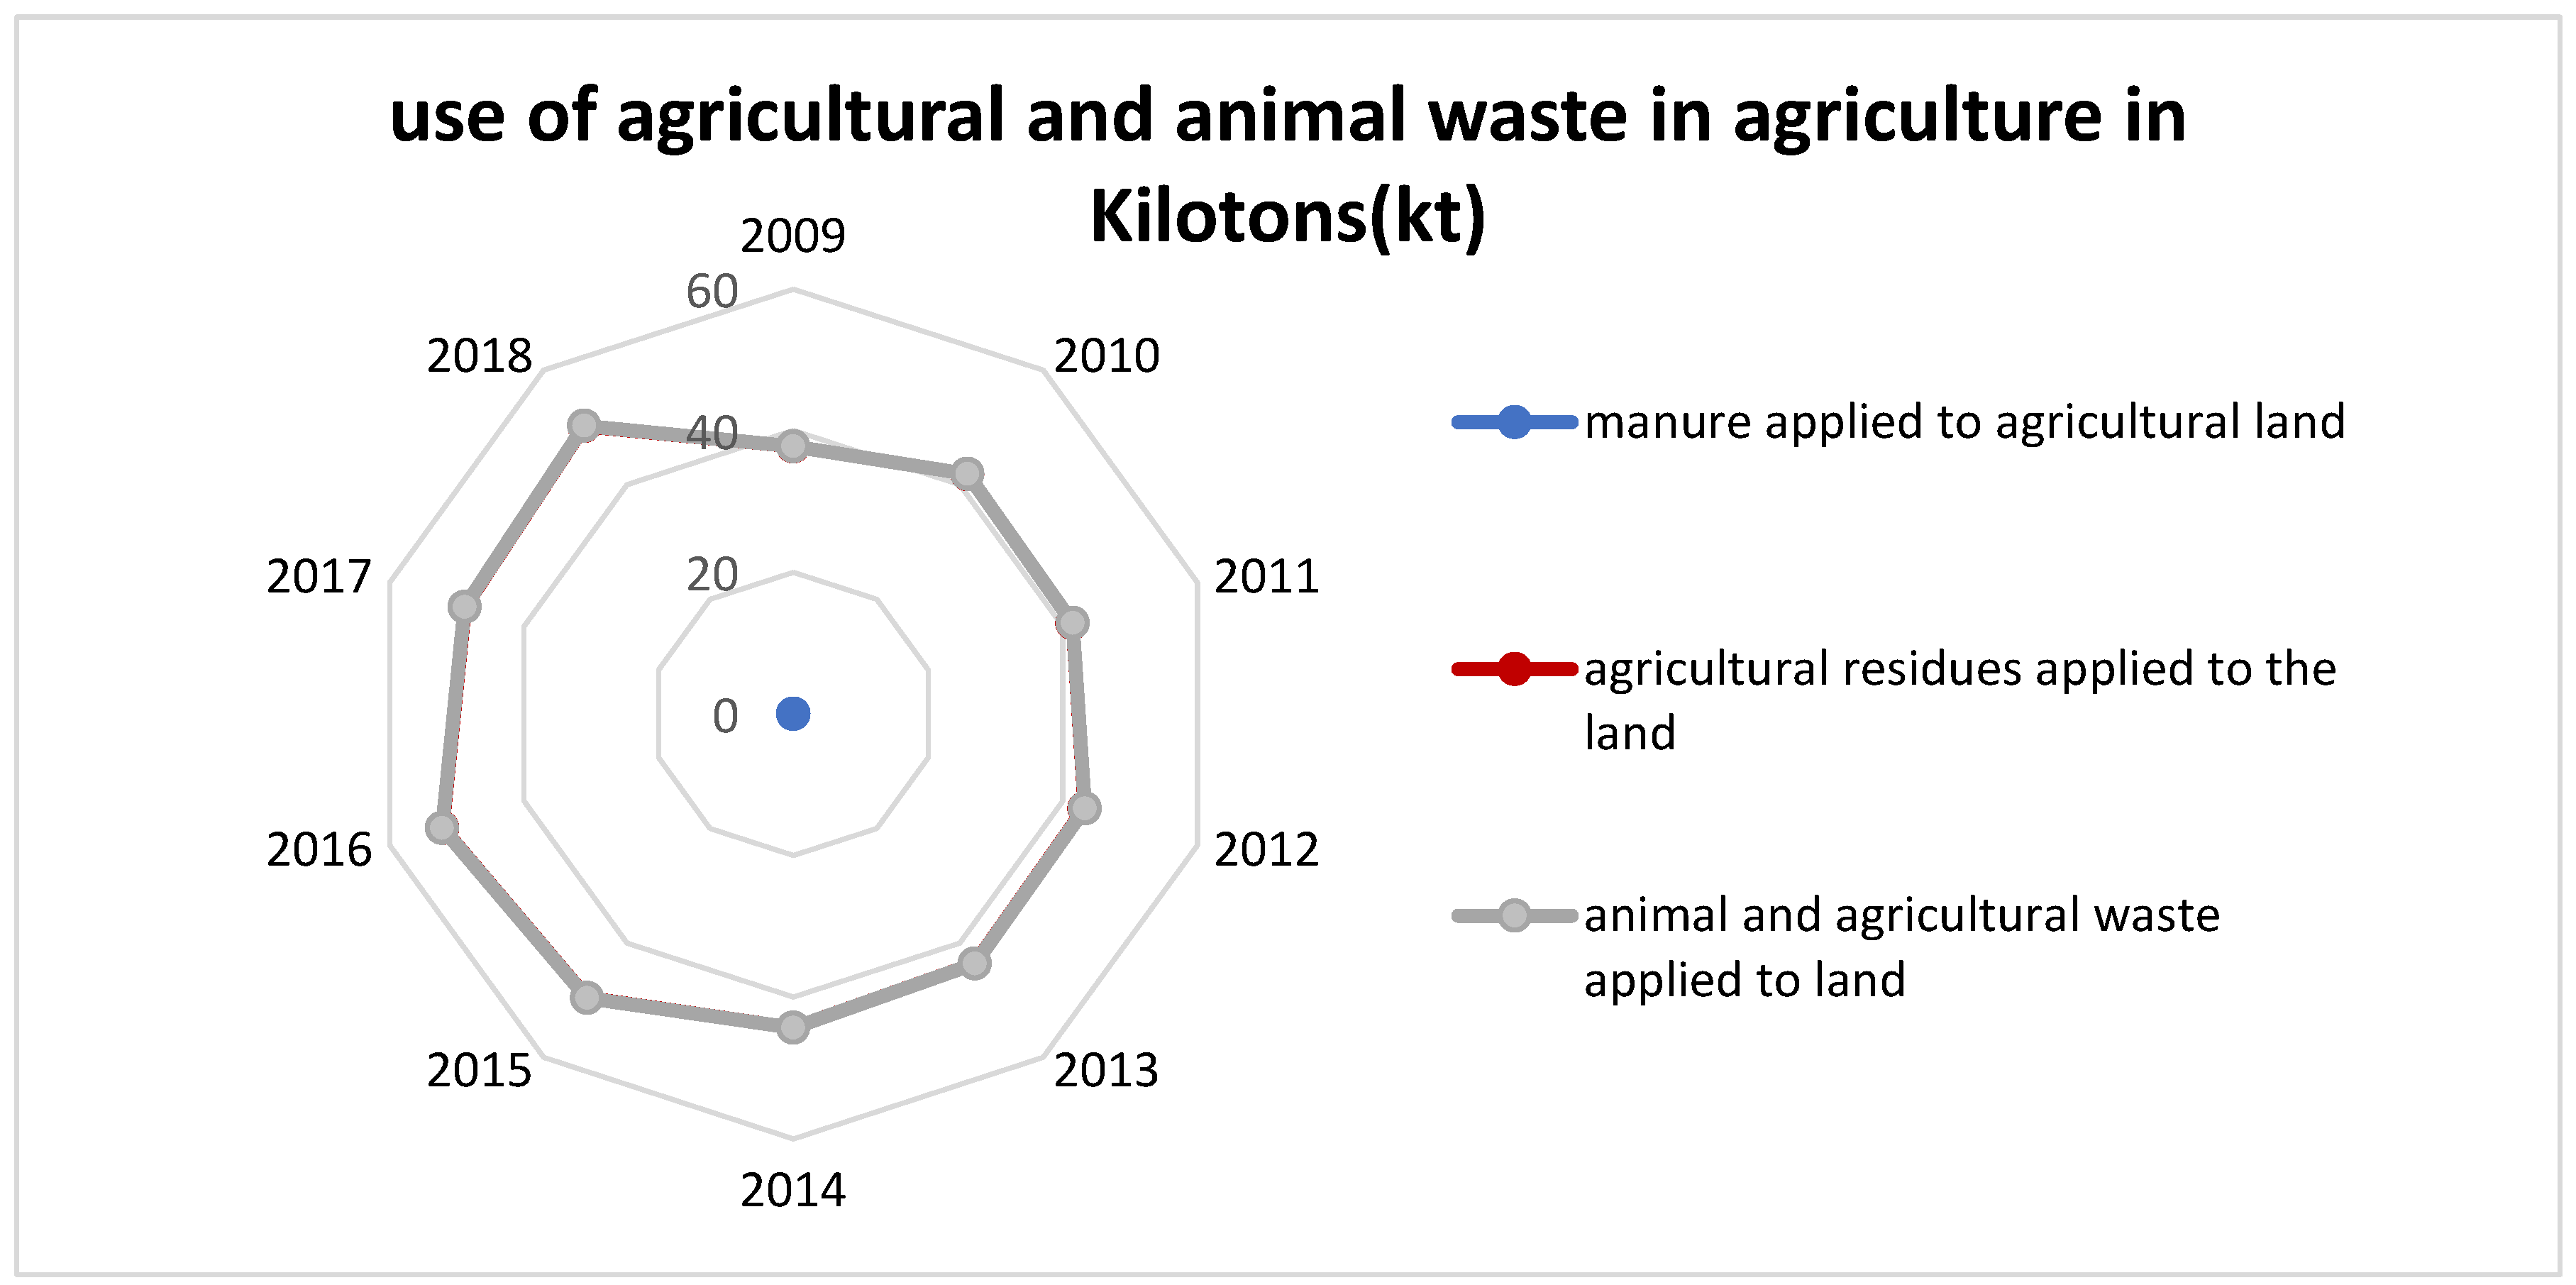
Figure 9 above shows the quantitative application of agricultural and livestock wastes to agricultural land. It is important to note that agricultural residues and wastes can have a significant impact on agricultural production through their various uses to improve soil quality, increase nutrient availability, reduce fertilizer costs, produce energy and contribute to more sustainable and efficient agriculture.
5.4. Indicator of the Link between Land and Agricultural Products
Table 4 shows the areas used for crops by region and by year of agricultural production from 2009 to 2018. The overall trend is upward, with a slight drop between 2016 and 2017.
Table 5 shows total agricultural production values by region from 2009 to 2018. Overall, the country's total agricultural production increased throughout the study period. This is due to the policy implemented in this sector.
5.5. Average Production Yield per Hectare from 2009 to 2018 by Product and Region
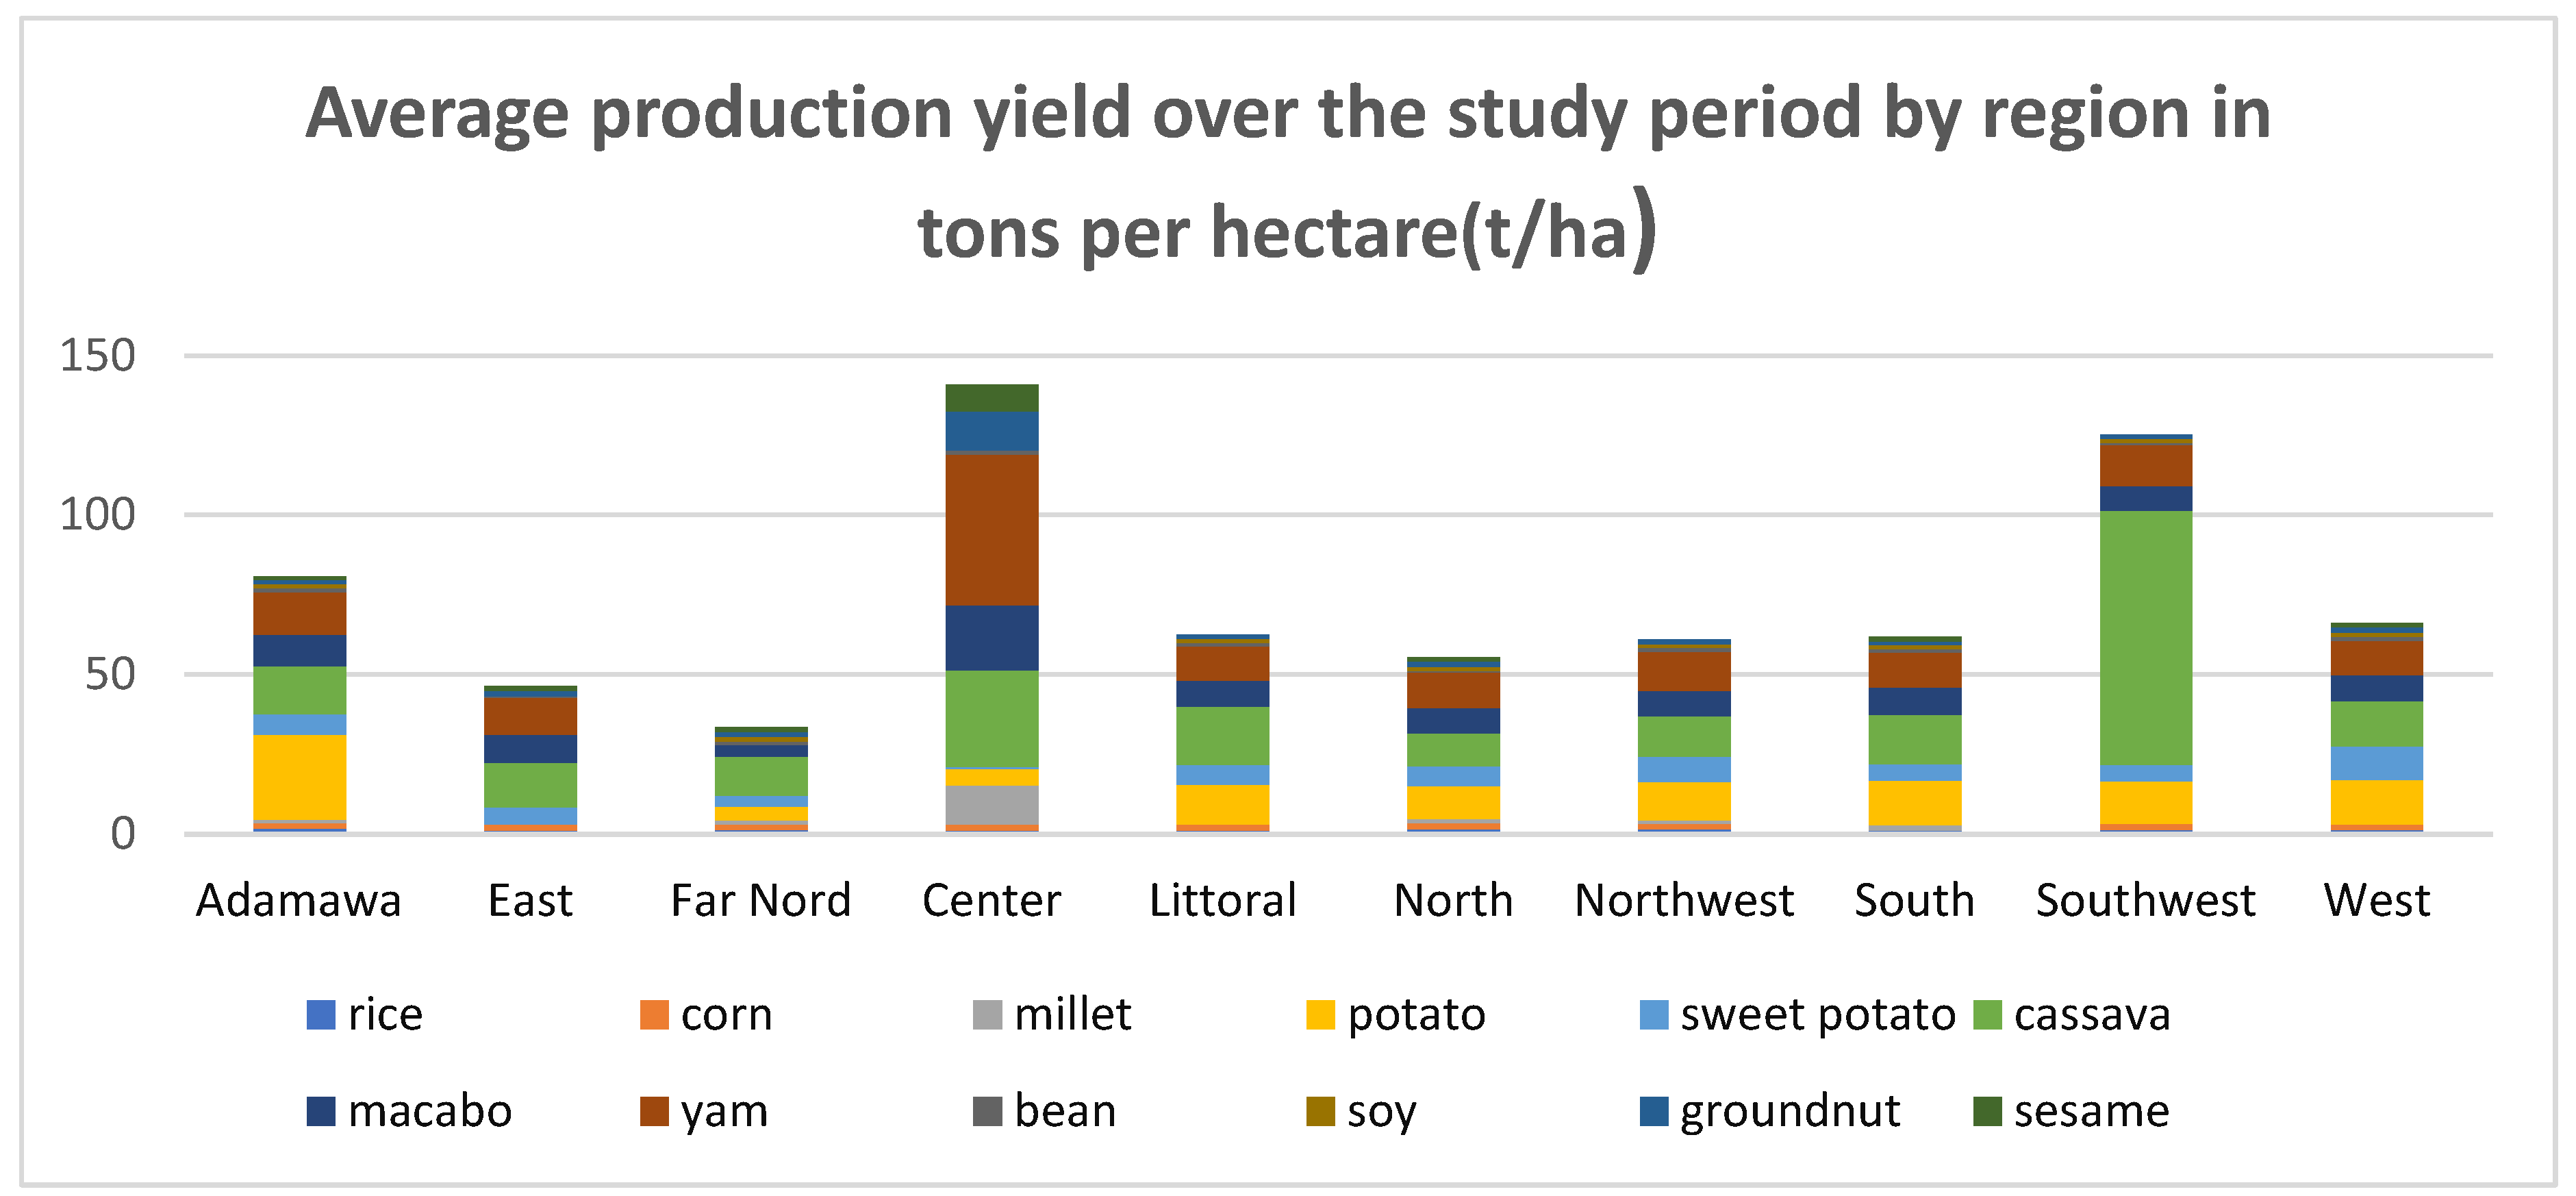
In
Figure 10, cassava yields are highest in the South-West (79.61t/ha), Centre (30.24t/ha) and Littoral (18.26t/ha) regions, while low-yielding products (10.39t/ha) have the lowest yields of any region in the country. Potatoes are also favored in the Adamawa (26.26t/ha), West (14.13t/ha), South (13.96t/ha), Southwest (13.24t/ha), Northwest (12.15t/ha) and Coast (12.37t/ha) regions. Yam is grown in almost every region of the country. Yam is also one of the crops grown in almost every region of the country, with the central region showing the highest average yield per hectare (47.21t/ha), followed by Adamawa (13.42t/ha) and 12.18t/ha in the north-west.
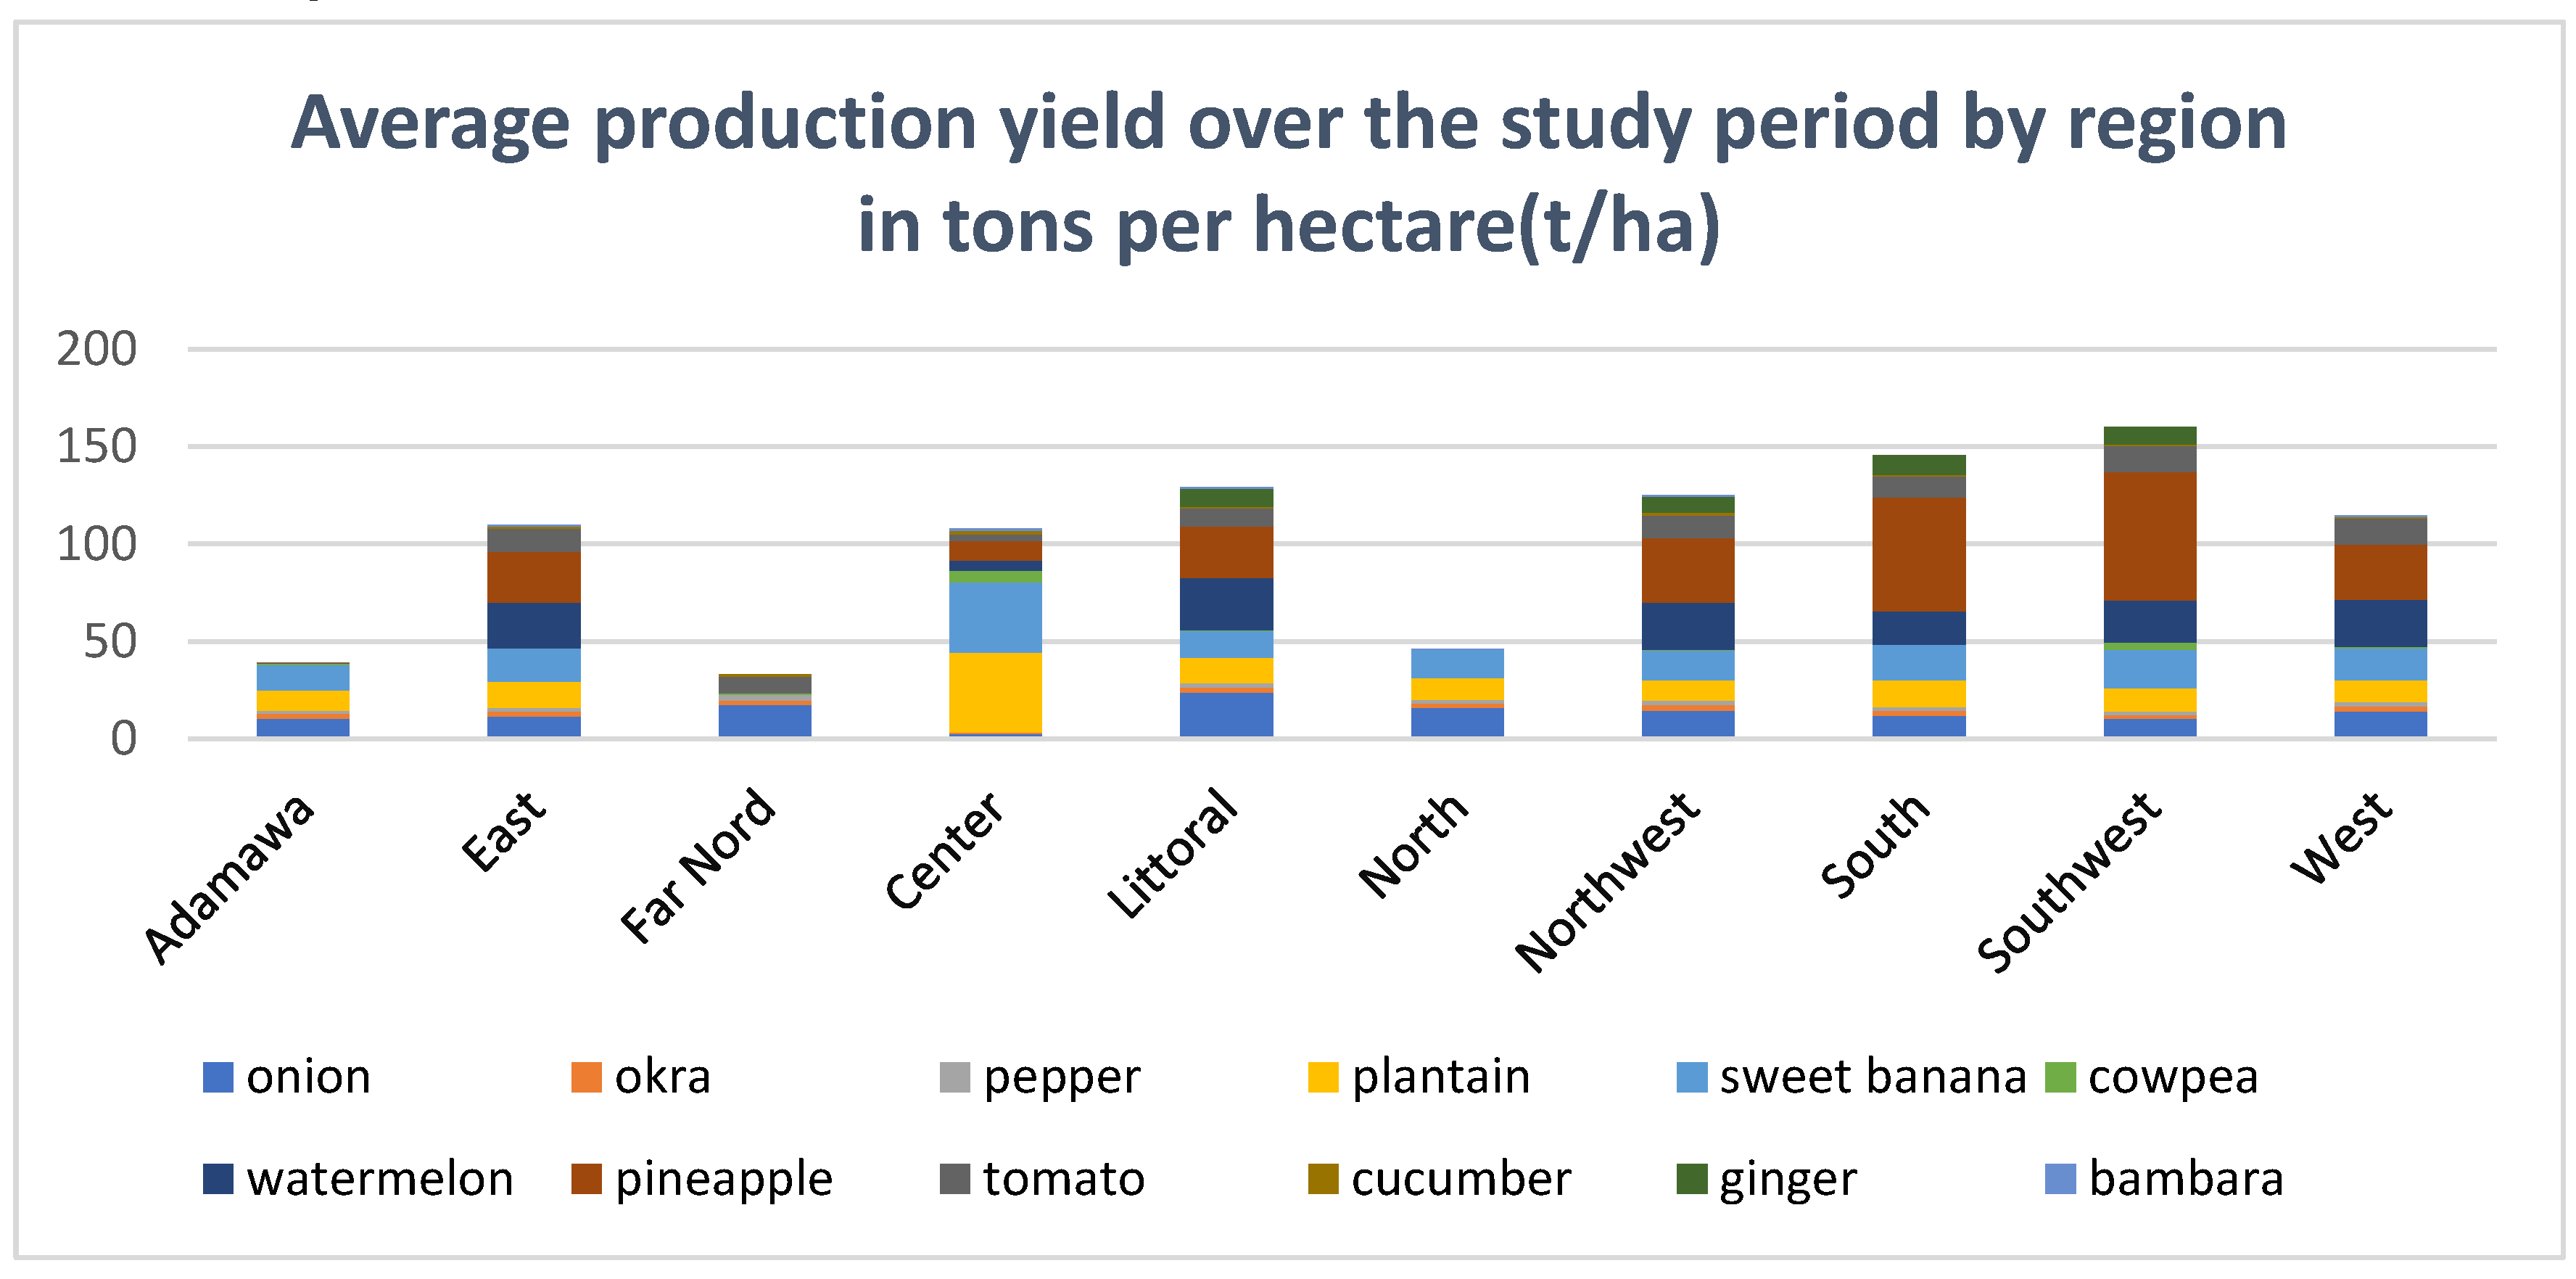
Figure 11 shows average pineapple yields per hectare in the South-West at 66.01t/ha, South at 58.3t/ha, West at 28.09t/ha, North-West at 33.28t/ha, Coast at 26.54t/ha and East at 26.25t/ha. Watermelons also showed average yields of 24.09t/ha in the South-West, South, West, East, Coast and North-West regions. Plantain and sweet bananas show good yields in the Central region, with 40.77t/ha and 36.32t/ha respectively, in the South 13.67t/ha and 18.52t/ha, in the South-West 11.68t/ha and 19.8t/ha and in the Littoral 13t/ha and 14t/ha. An analysis of agricultural yields per hectare by region in a given locality enables investors and farmers to better plan their production and harvests, produce sufficient quantities of quality food, stimulate the local economy and contribute to sustainable agriculture.
5.6. Agricultural Production and Harvested Areas by Region and Year
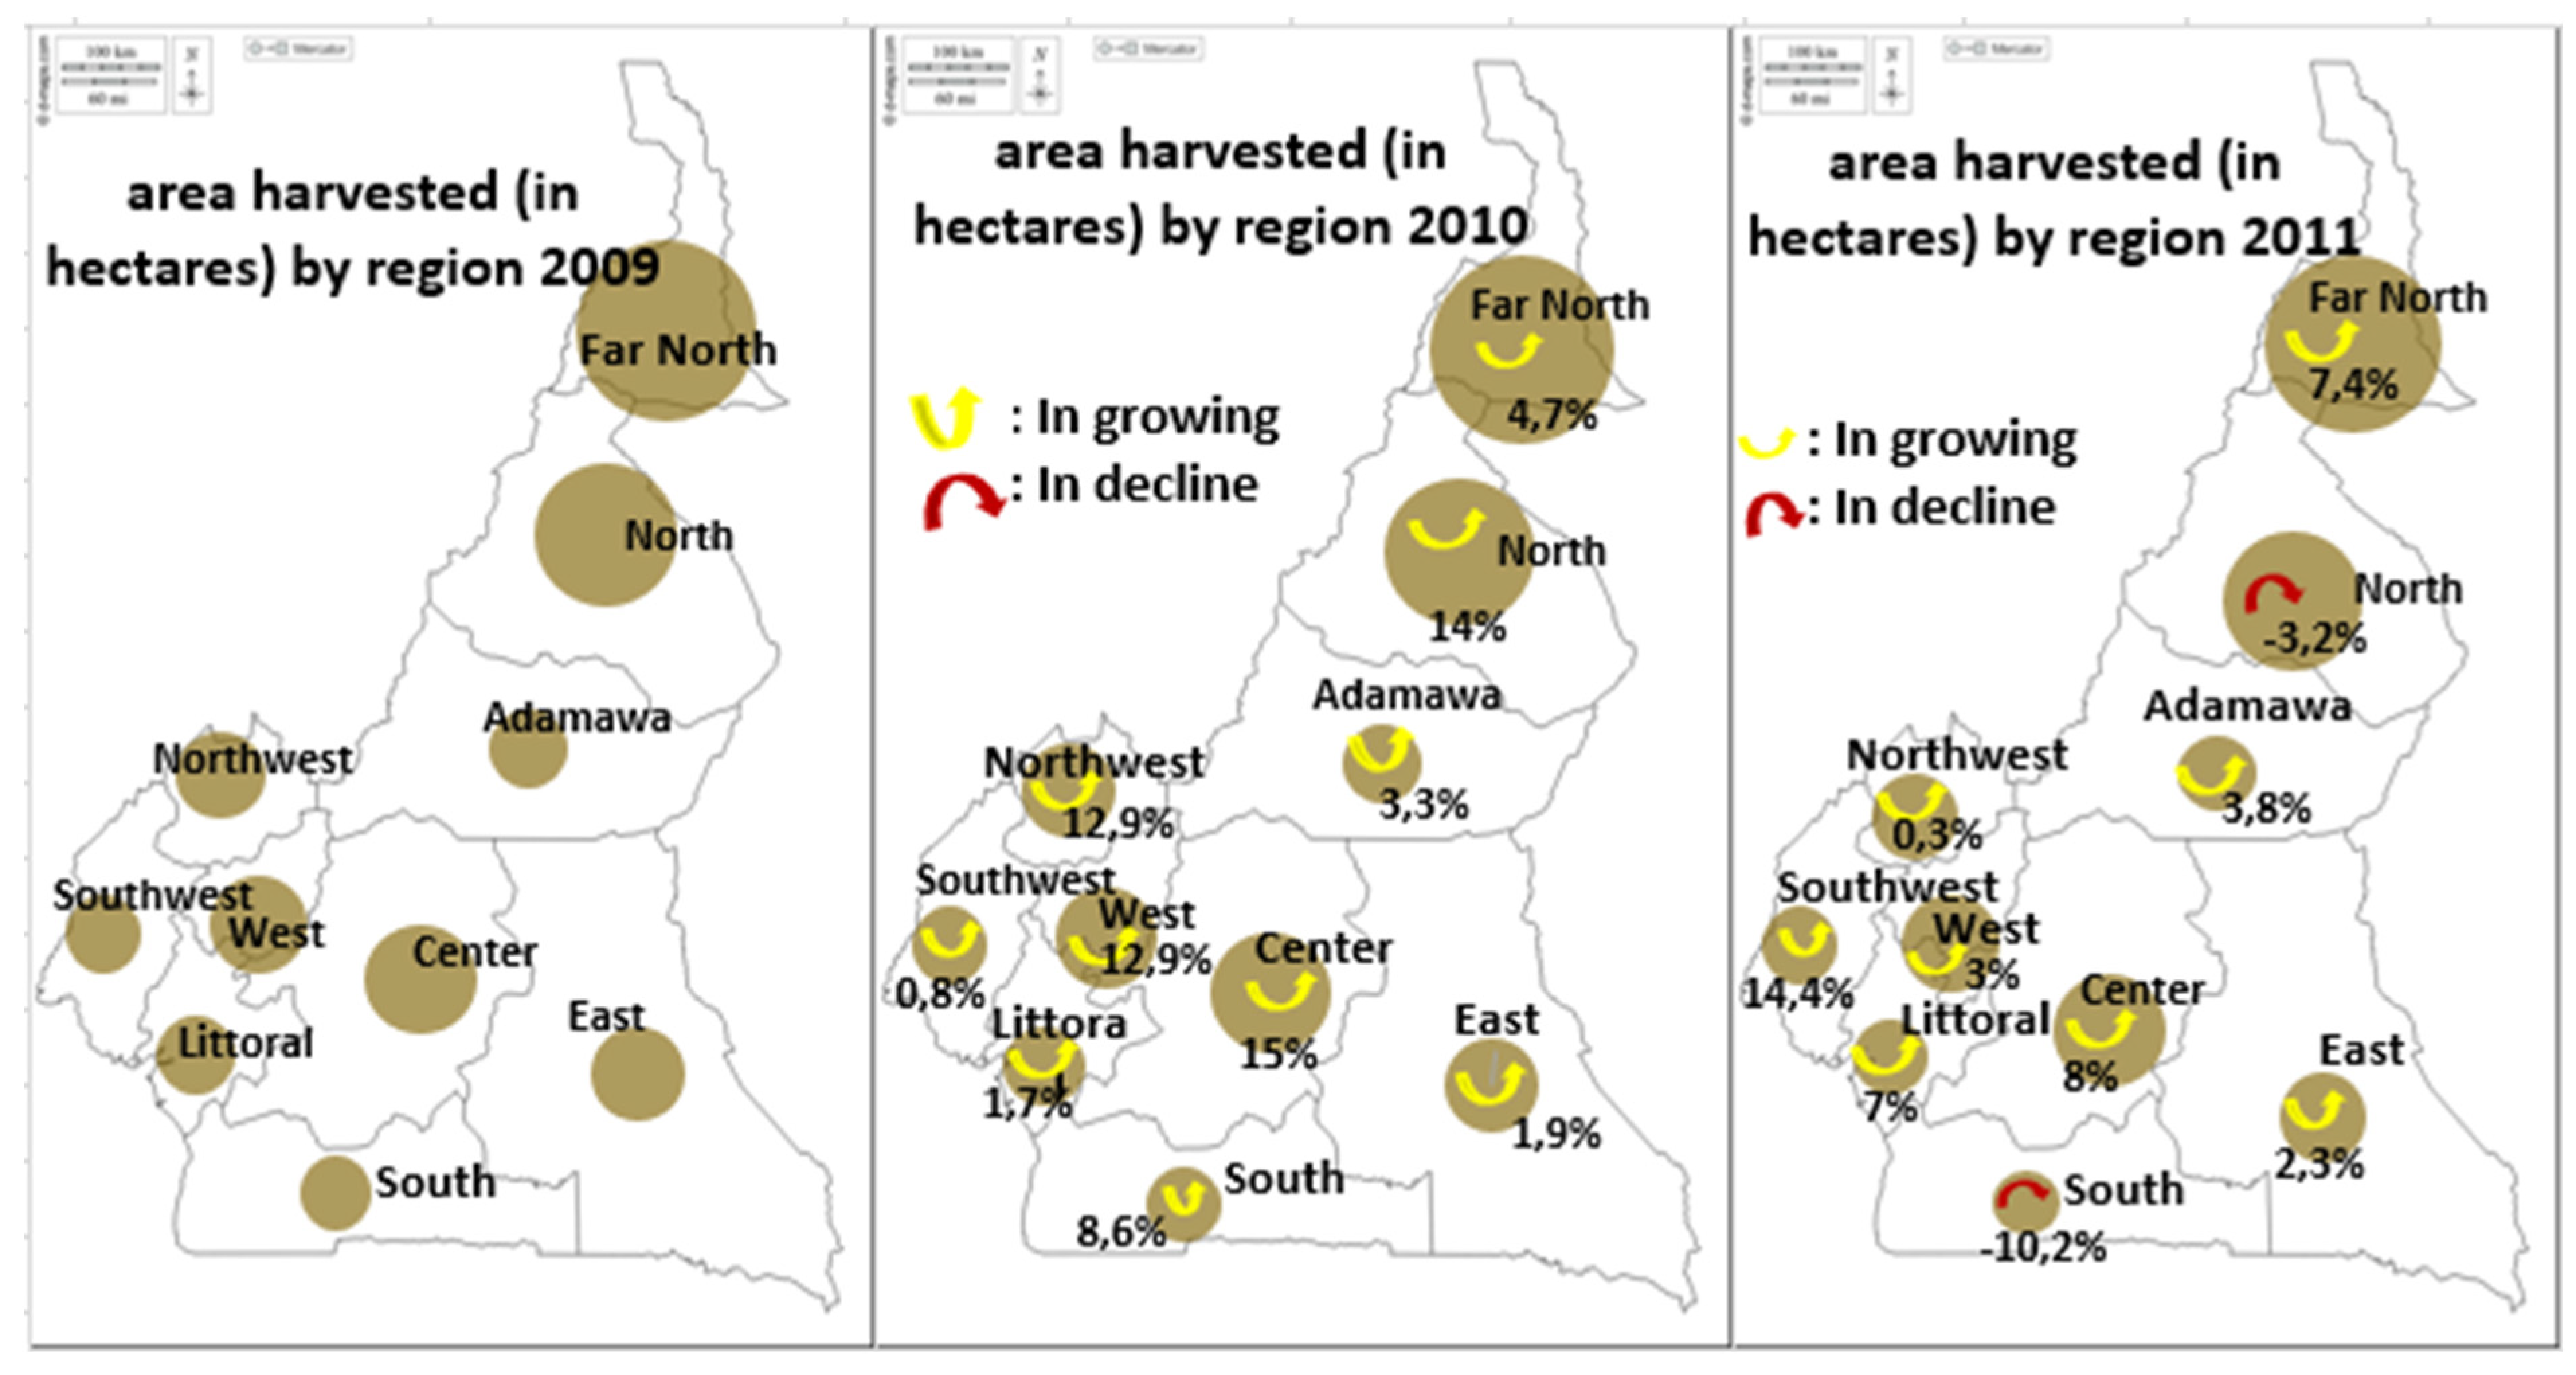
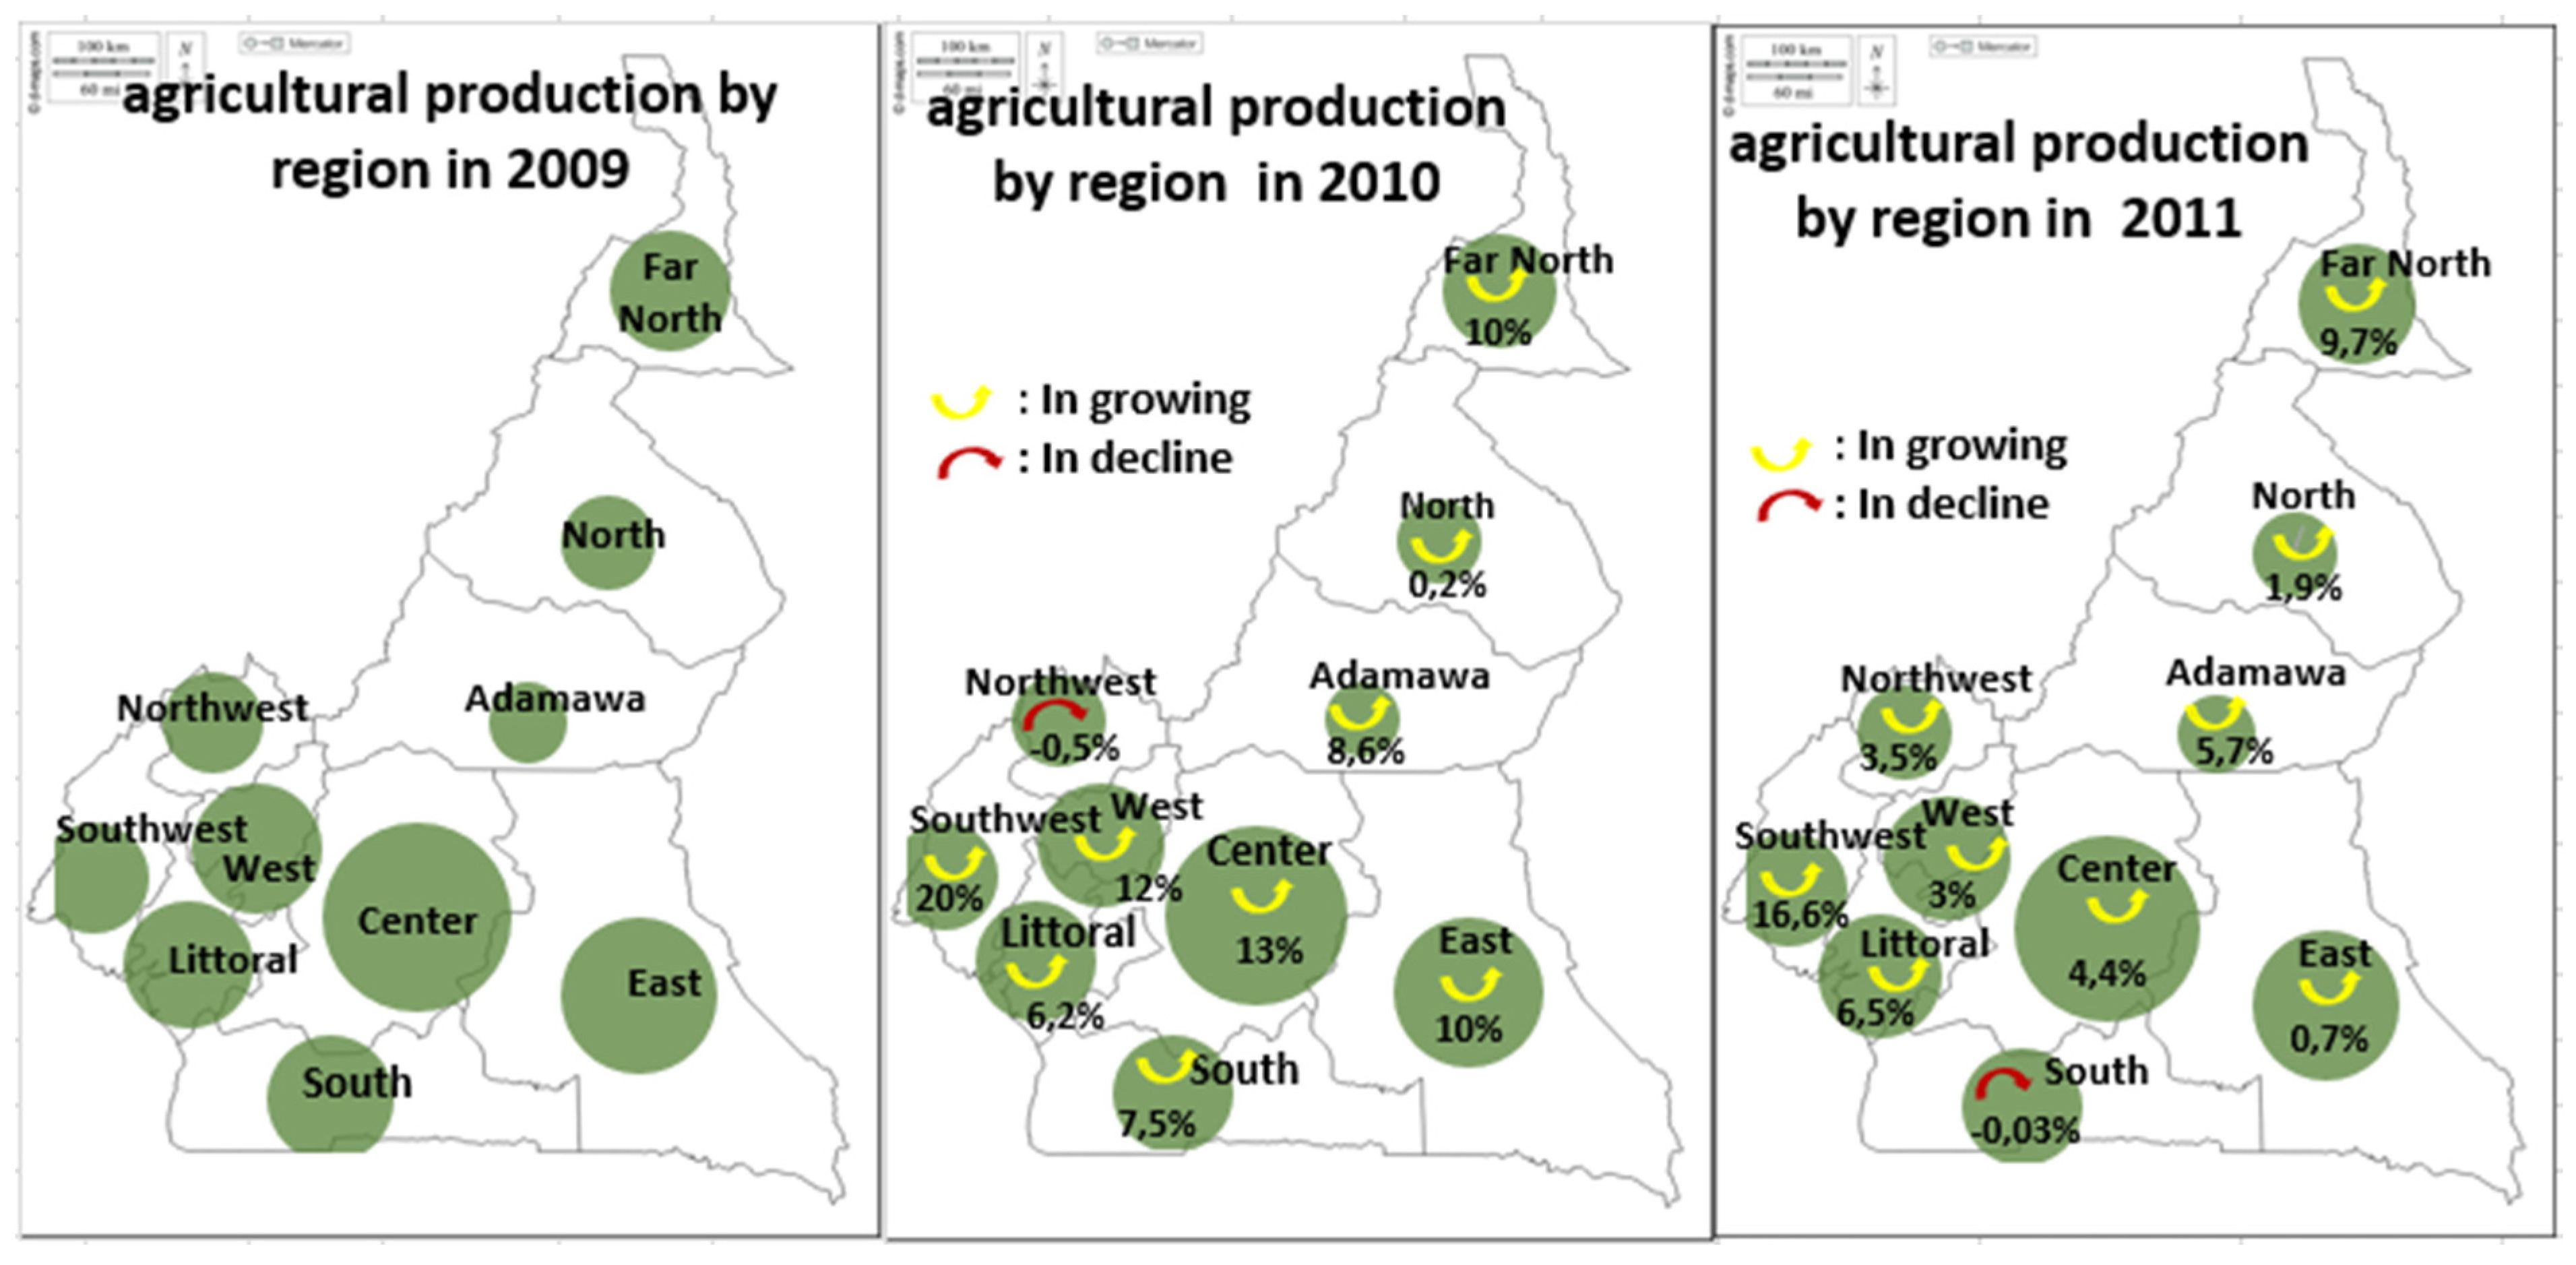
The bubble sizes for the various harvested areas and agricultural products by region and year in this sub-section correspond to the values in
Table 4 and
Table 5 respectively
Figure 12 and
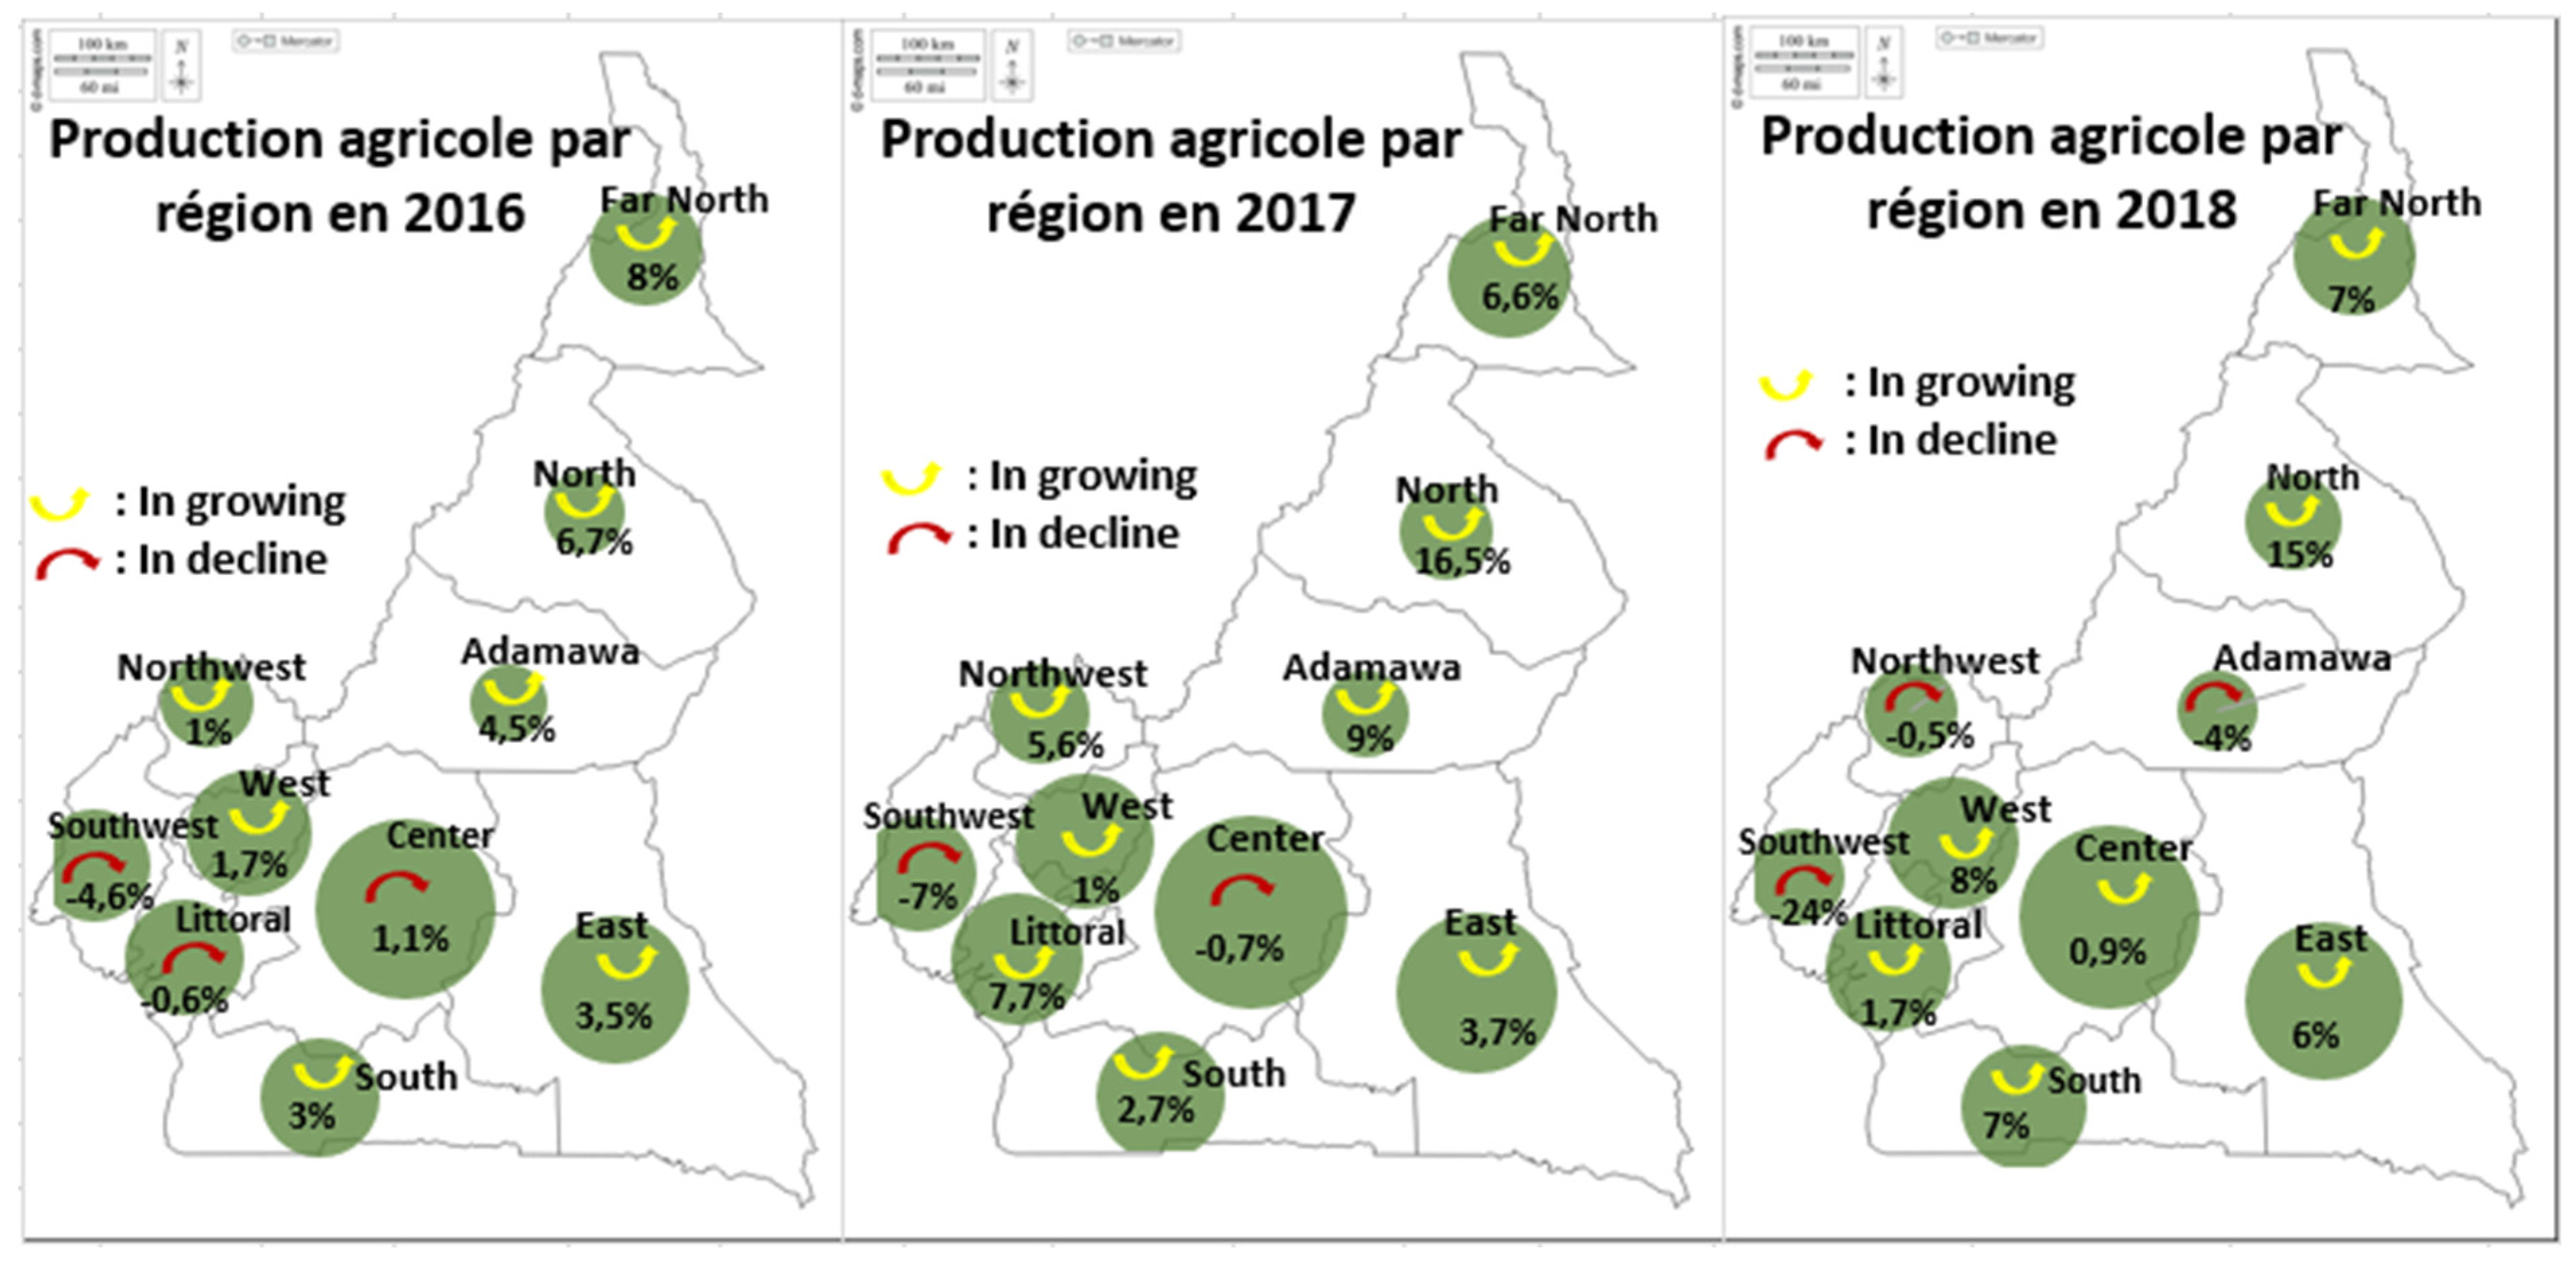
Figure 13 show the respective variations in farmland area and production for three consecutive years (2009 to 2011). Between 2009 and 2011, overall harvested area increased in almost all regions, with a slight drop of -3.2% in the North and -10% in the South in 2011. Over the same period, production also showed an upward trend, which was significant in some regions and insignificant in others. This is in line with the observations made in
Table 4 and
Table 5. However, there is a mismatch between harvested area and production. In the south-west, production increased by 20% and in the north by 0.2%, while harvested area increased by 0.8% and 14% respectively over the same period.
Figure 14 and
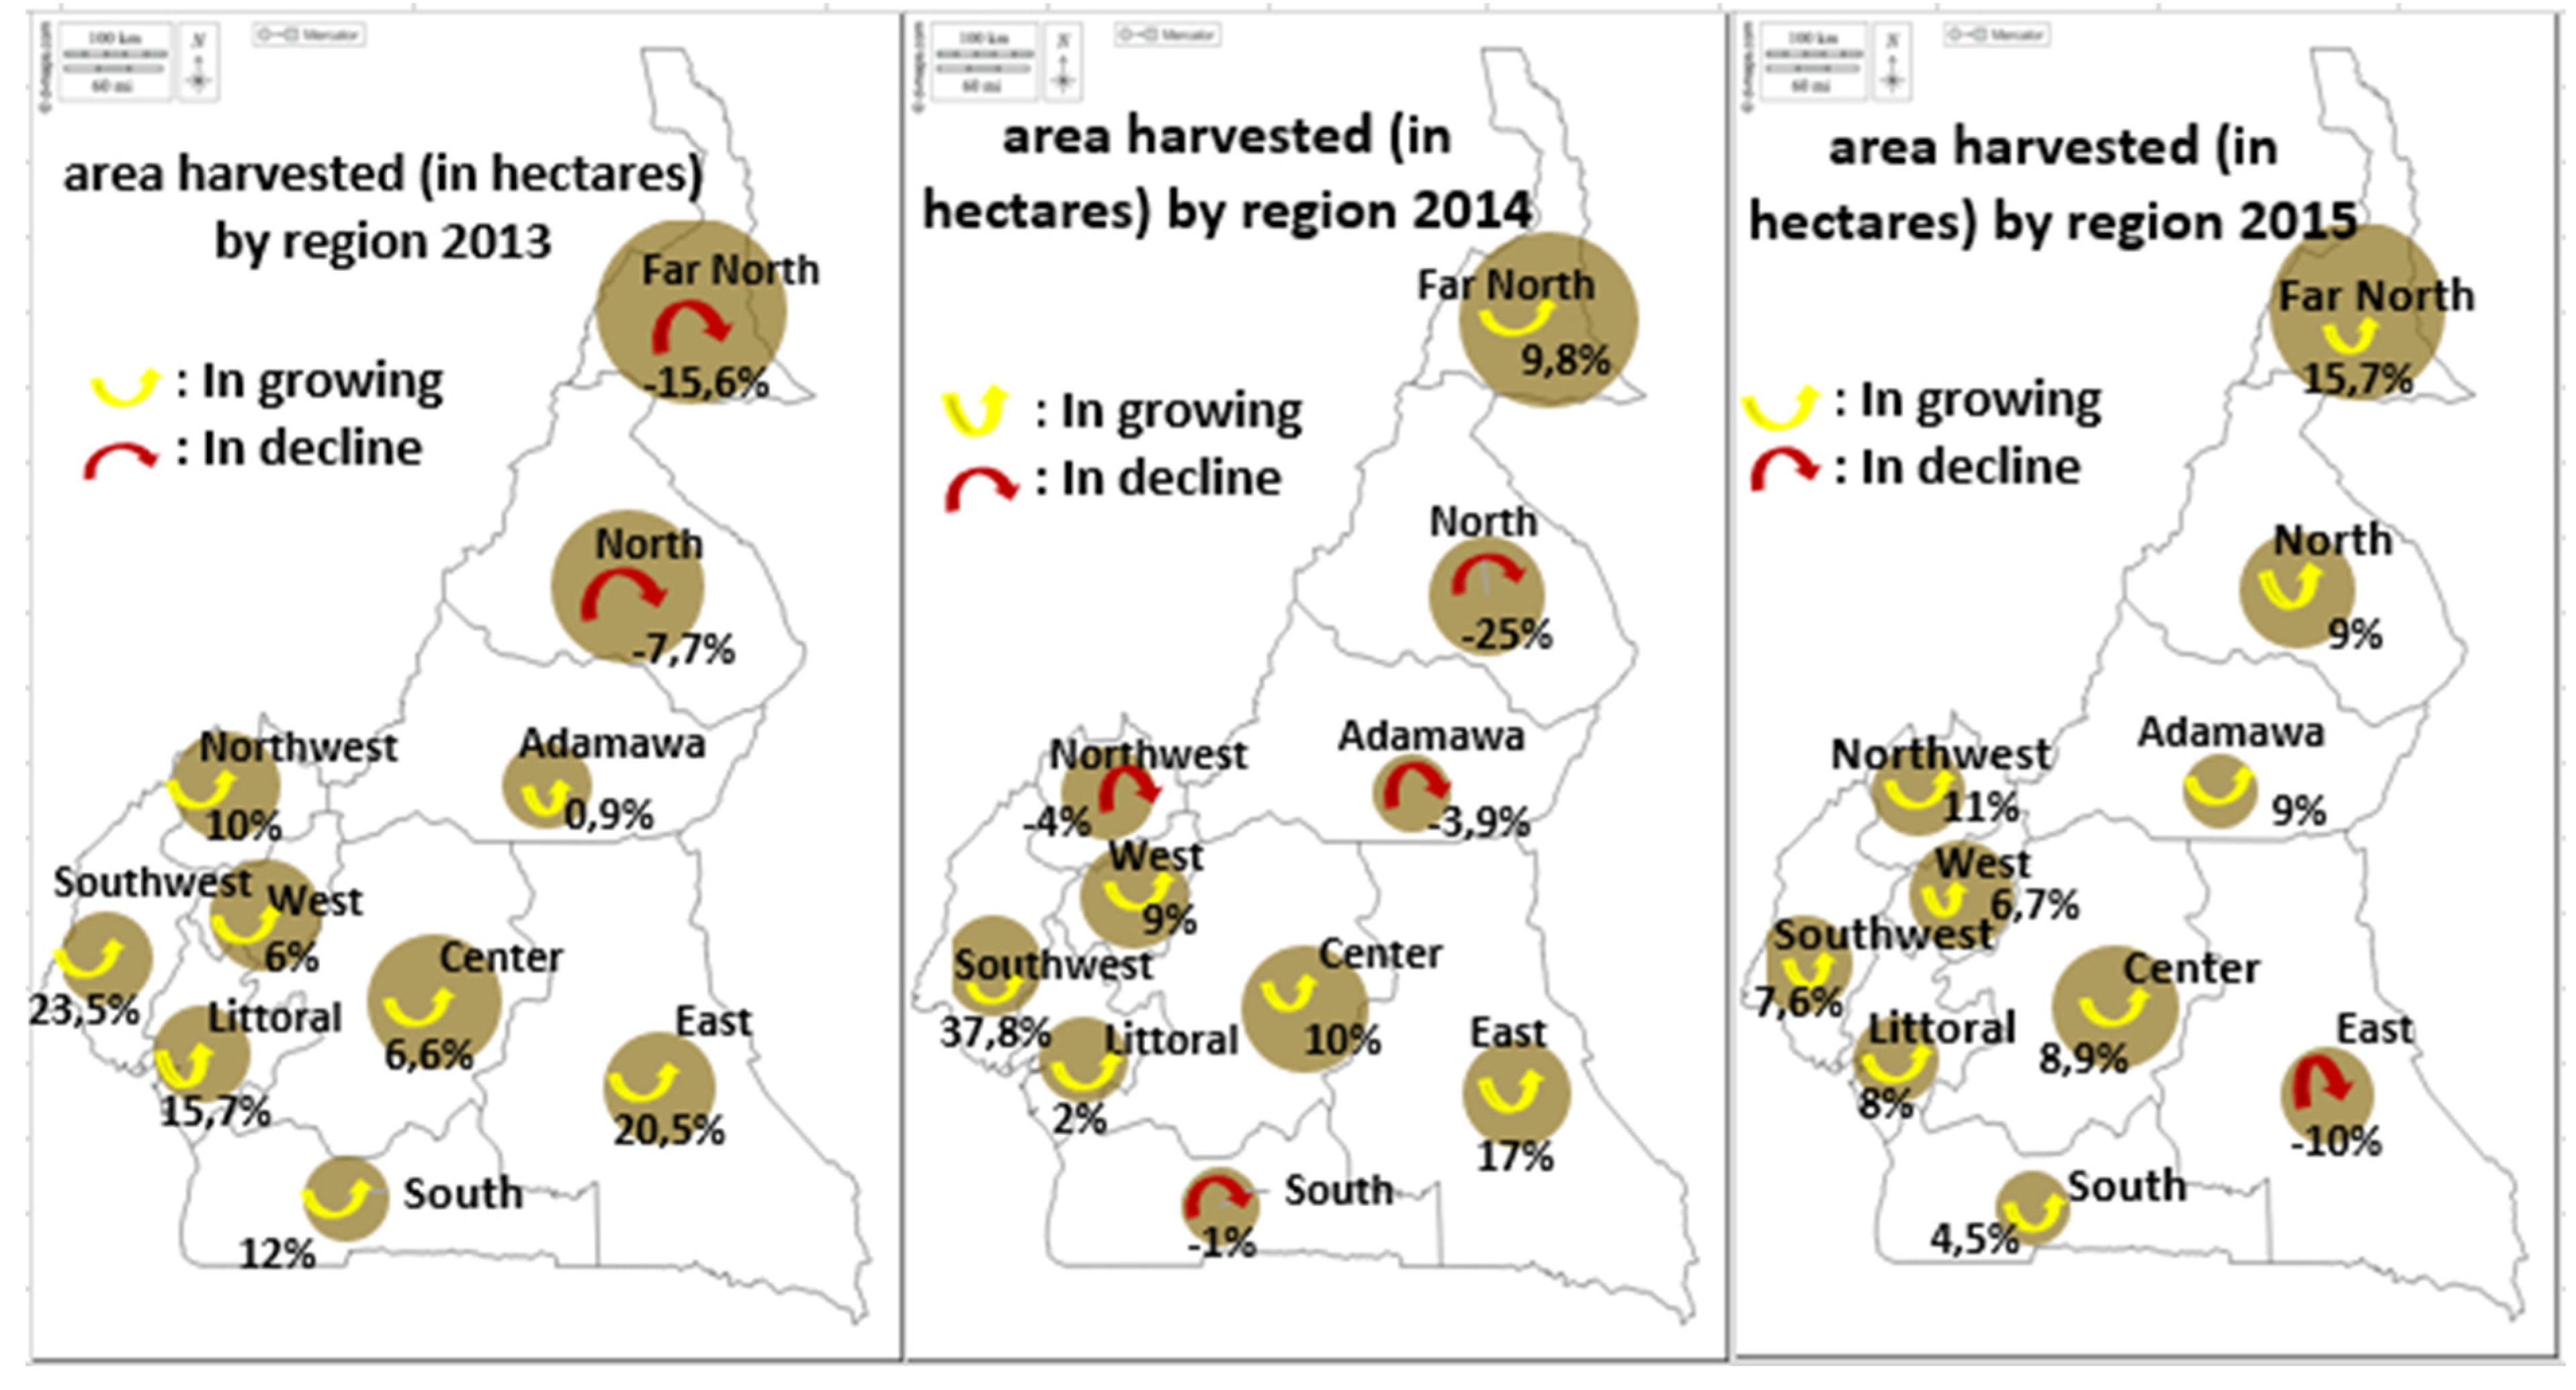
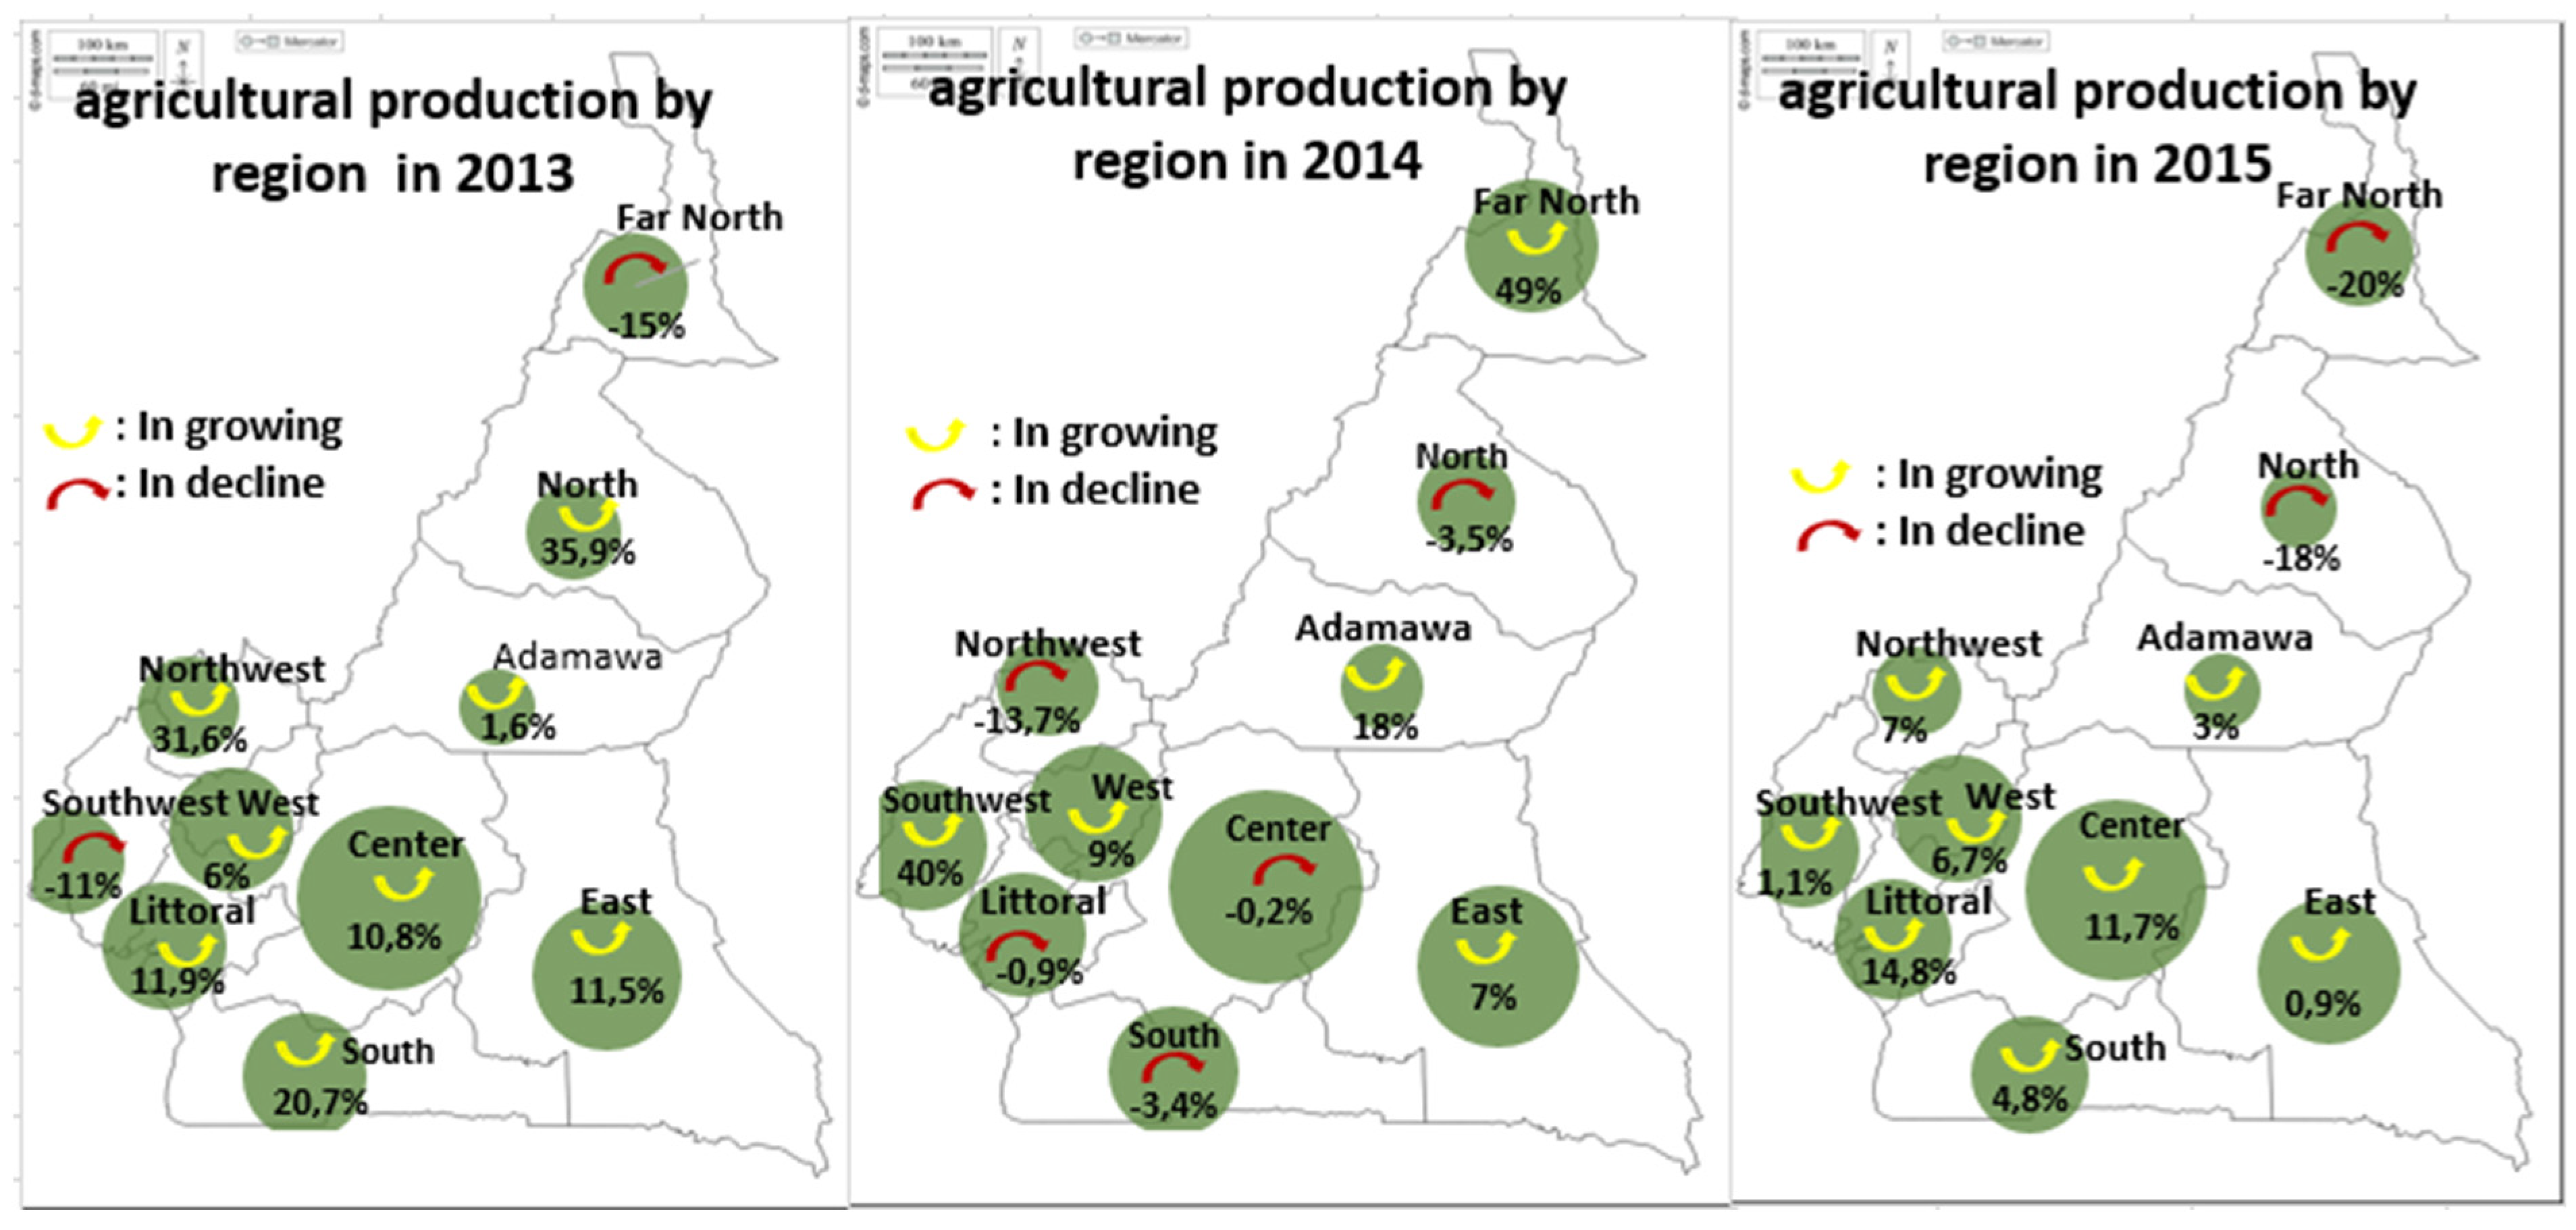
Figure 15 illustrate the variability of harvested areas and production over 2013, 2014 and 2015. The proportion of variation in production is similar in the Far North region (a 15% drop in harvested area and a drop in production of the same absolute value in 2013) and the Southwest region (a 40% increase in production for a 38% increase in harvested area in 2014). This is not the case for the North (a -7.7% drop in harvested area versus a 36% increase in production in 2013), South-West (a 23.5% increase in harvested area versus an 11% drop in production in 2013) and Far-North (a 10% and 15% increase in harvested area respectively in 2014 and 2015 versus a 49% increase in production in 2014 and a 20% drop in production in 2015) regions. These observations allow us to conclude that production is not solely dependent on harvested area. An increase in harvested area does not necessarily guarantee an increase in agricultural production.
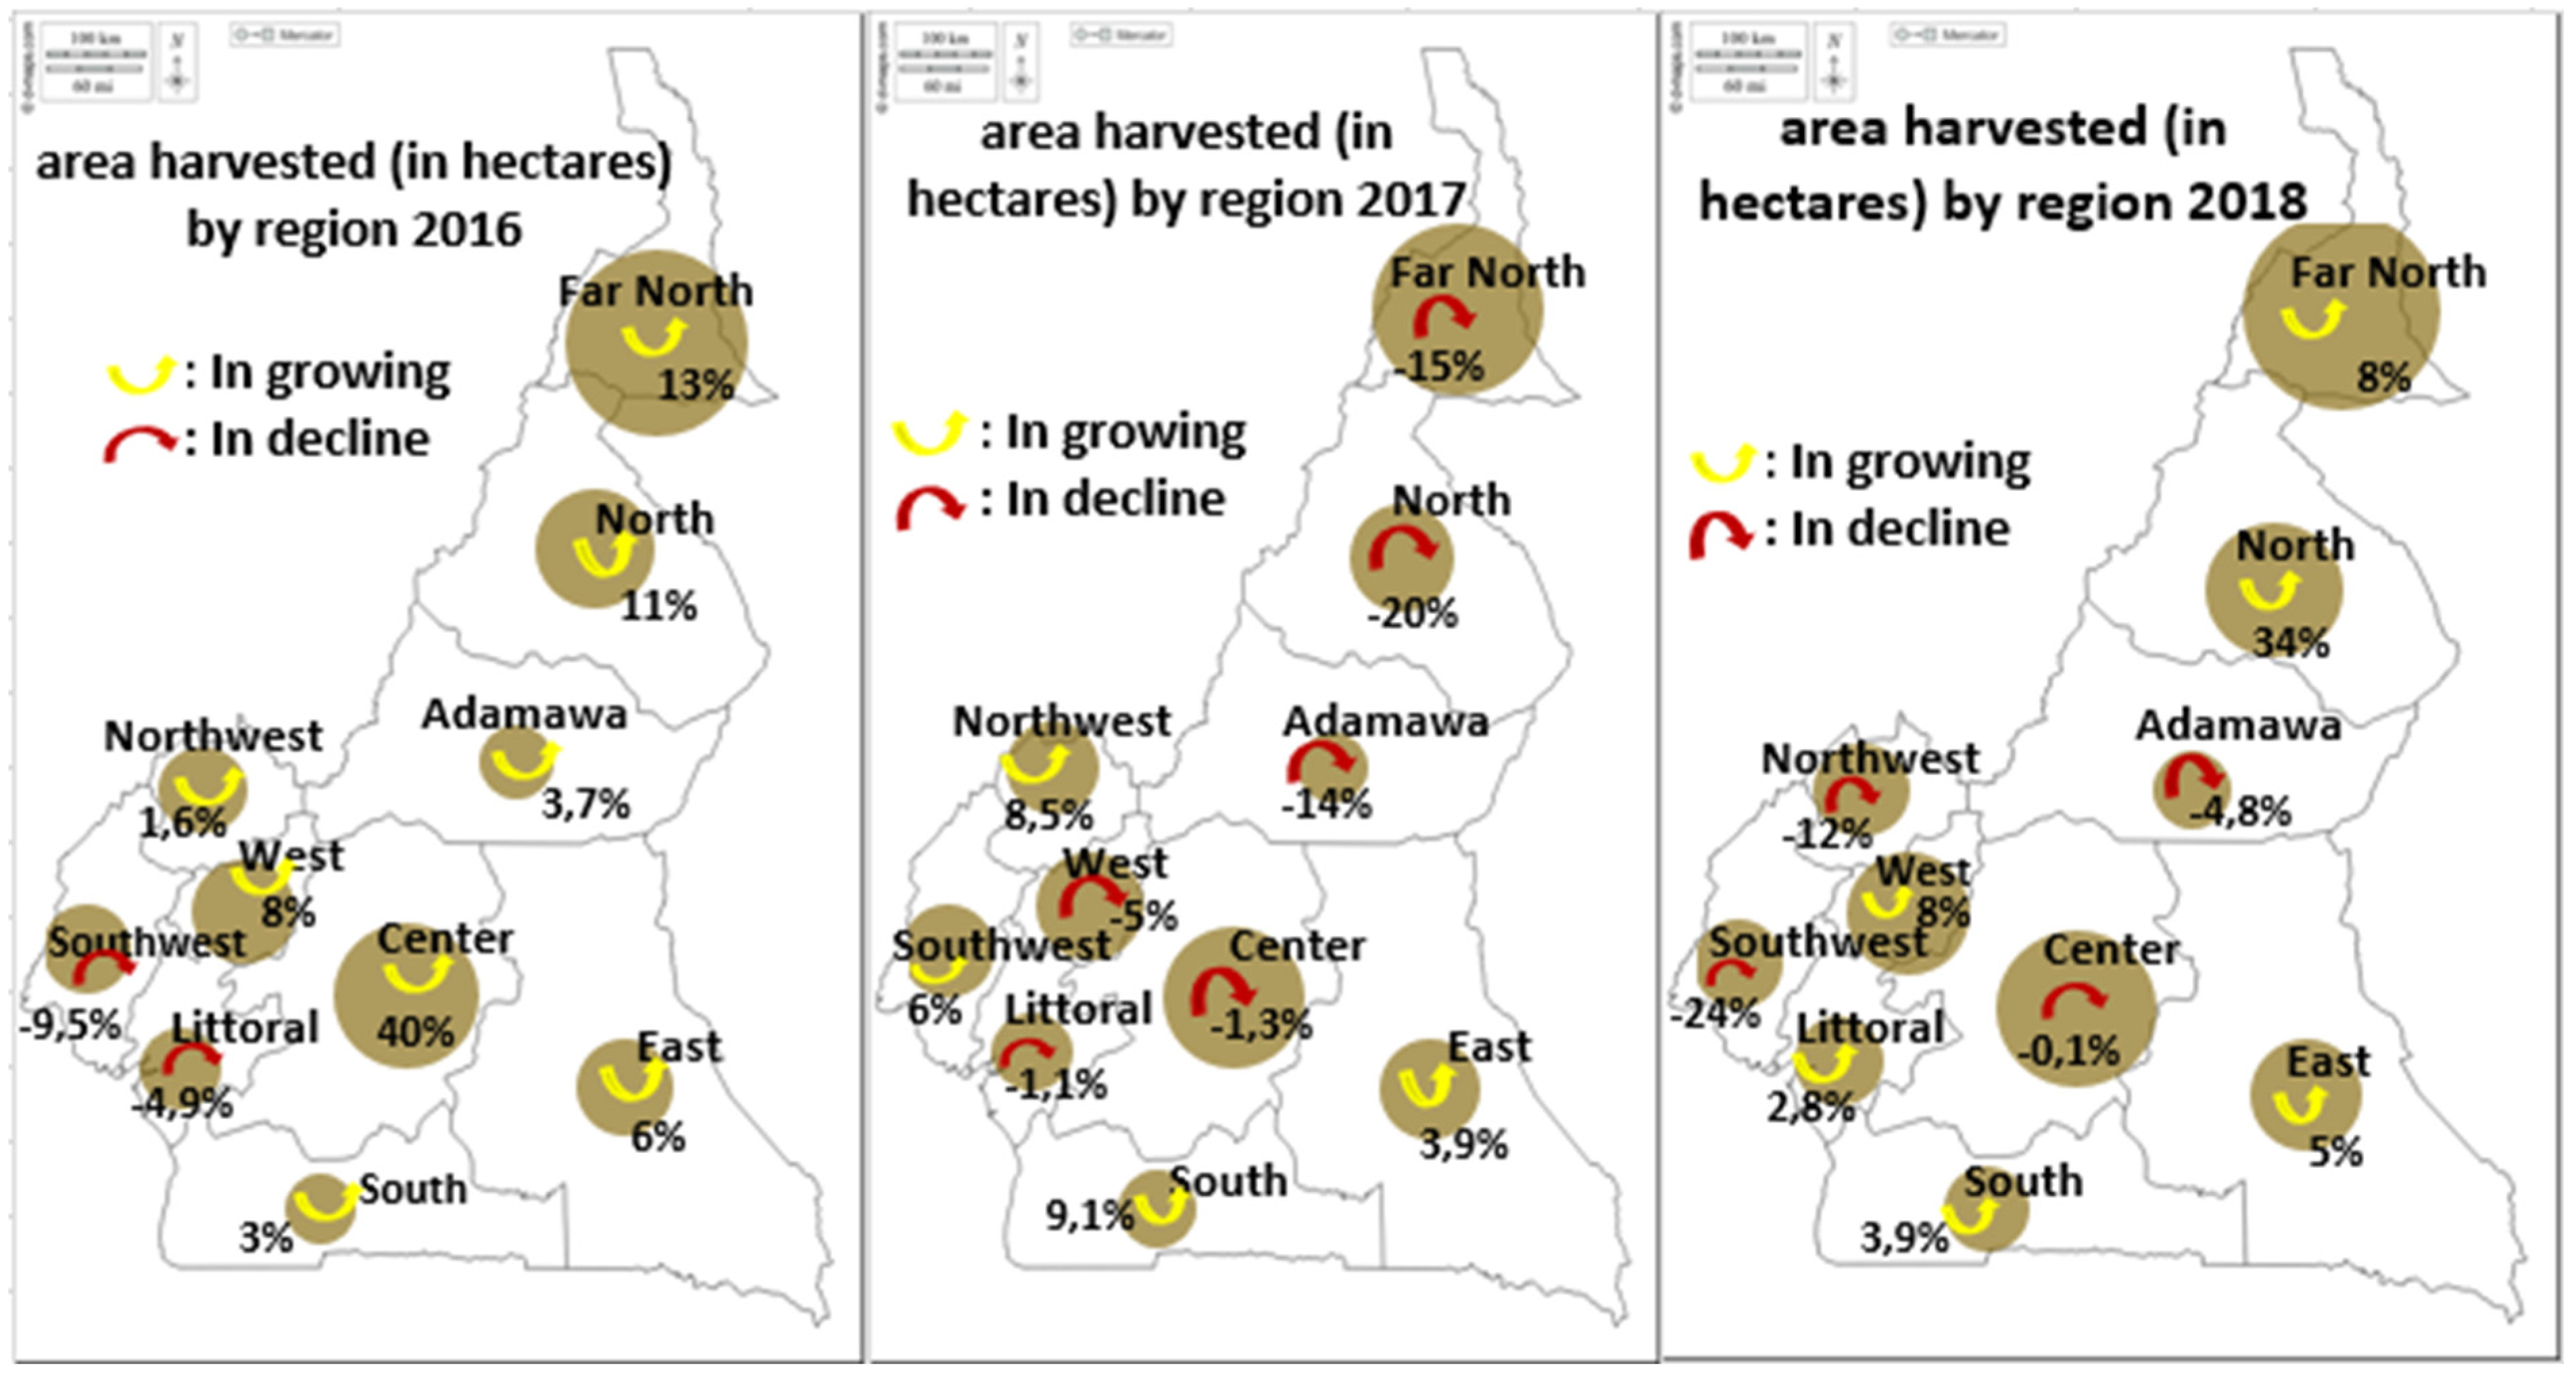
Figure 16 and
Figure 17 show variations in harvested area and production for the consecutive years 2016, 2017 and 2018. As in
Figure 10,
Figure 11,
Figure 12 and
Figure 13, there are both consistencies and inconsistencies between variations in harvested area and variations in production. There are many factors that can influence the yield of agricultural production. Some of the main factors are weather conditions (Climatic conditions, such as rainfall, temperature and sunshine) can have a major impact on crop growth. Then there's the soil (Soil quality and fertility are essential for good crop growth), farm inputs (The use of fertilizers, pesticides, high-quality seeds and other farm inputs can play a major role in crop yield), crop management (Effective crop management, including crop rotation, weed management, disease and pest control, and crop planning, can contribute significantly to agricultural production yields), agricultural technologies (The use of modern agricultural technologies such as drones, sensors, remote sensing systems and precision farming can help optimize farming practices and increase yields). These factors often interact in complex ways, and their differentiated impacts on agricultural production yields can vary according to specific regions, crops and farming systems.
5.7. Average Competitive Position of Main Products by Region
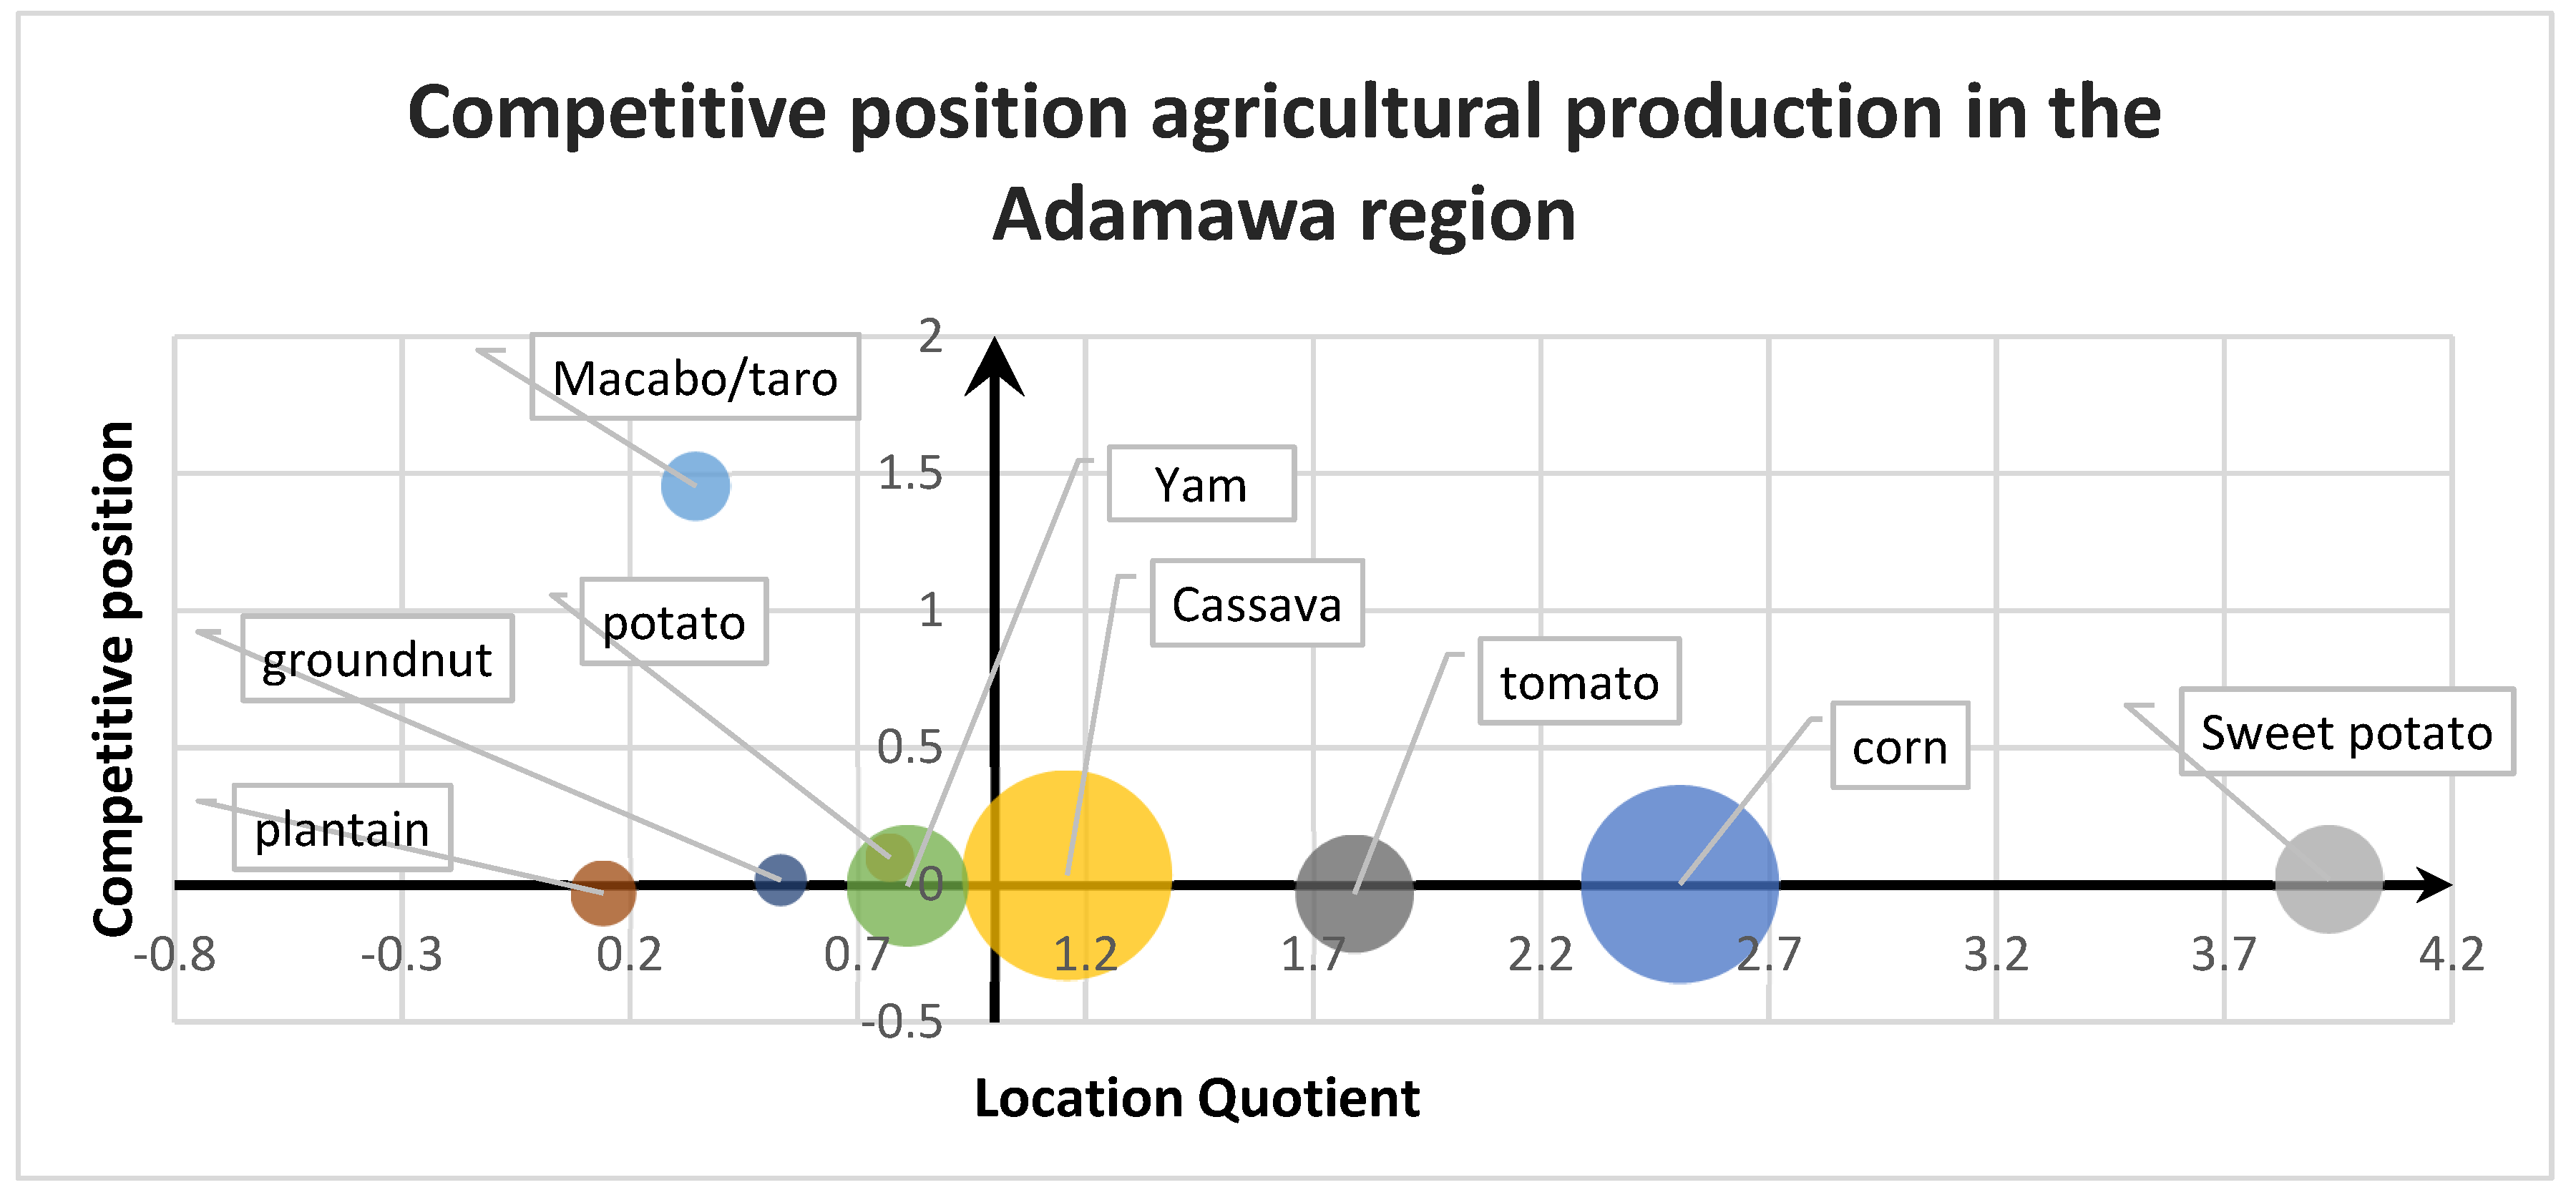
Figure 18 shows the main products on average in the Adamawa region. It can be seen that tomatoes, corn and yams are considered local staples. However, macabo and taro are non-basic products that are growing rapidly.
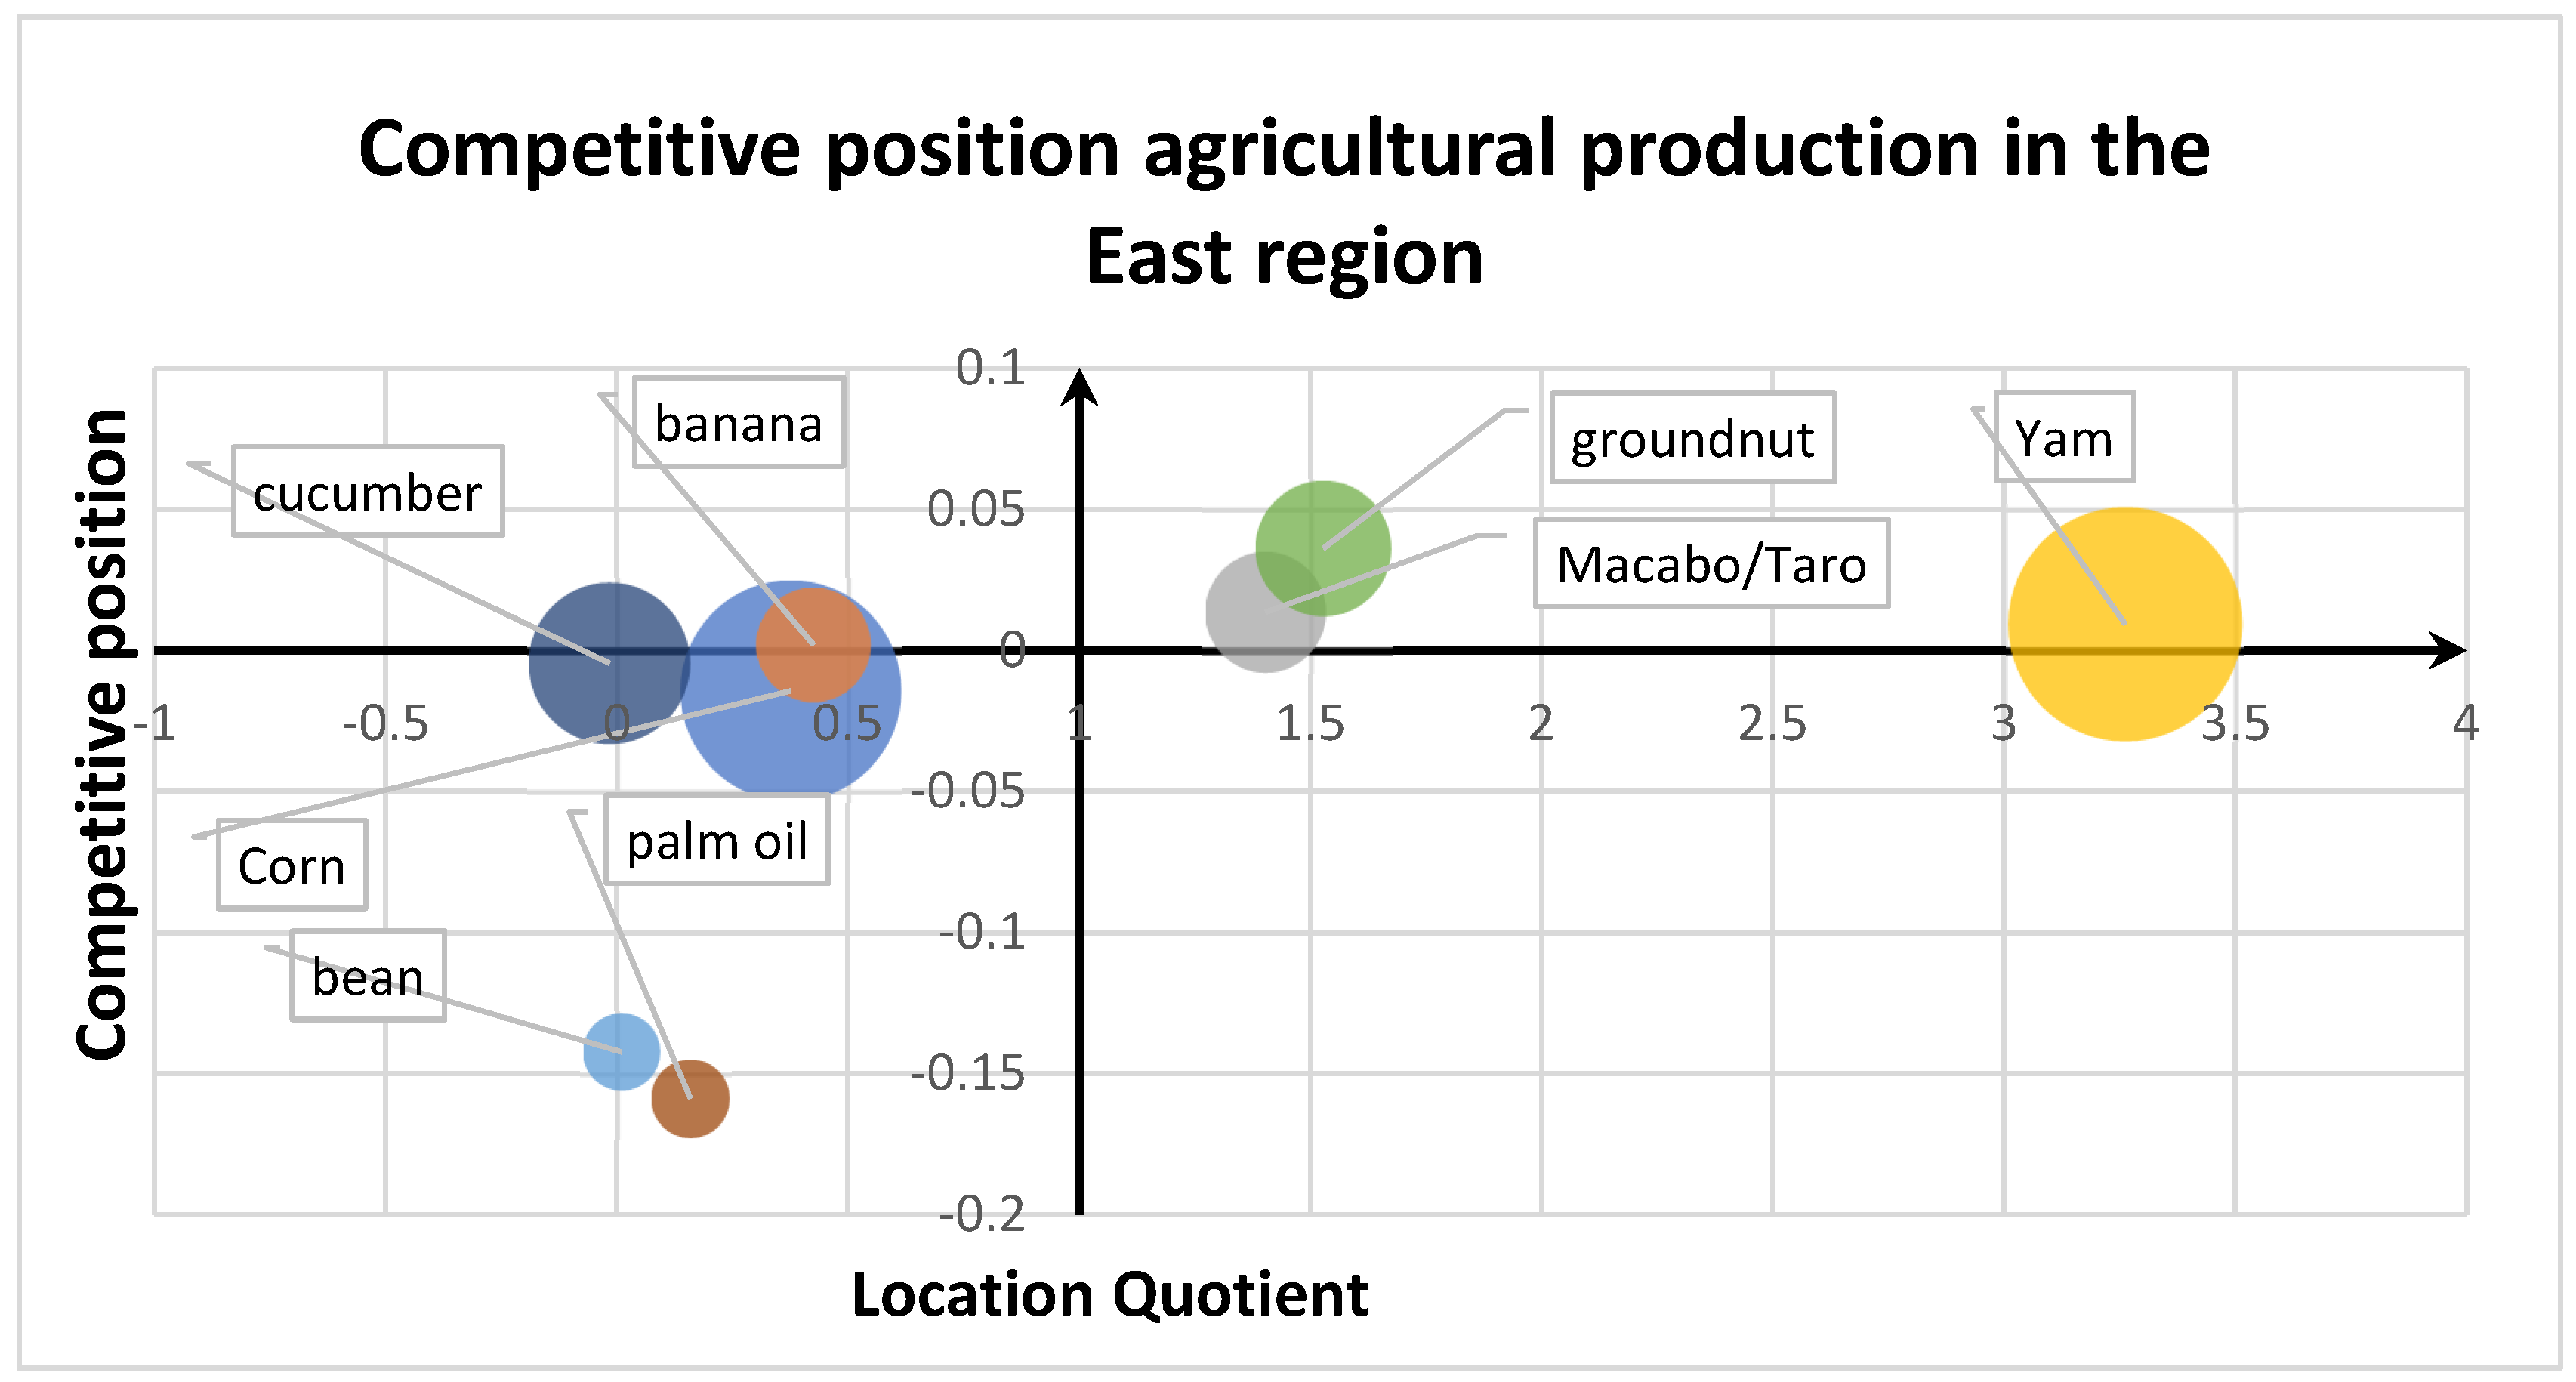
Figure 19 shows the different positions occupied by products in the East region. It shows that groundnuts, taro macabo and yams are the staples in the locality, while sweet potatoes, cucumbers and maize are nonstaples. Bean and palm oil production declined throughout the study period.
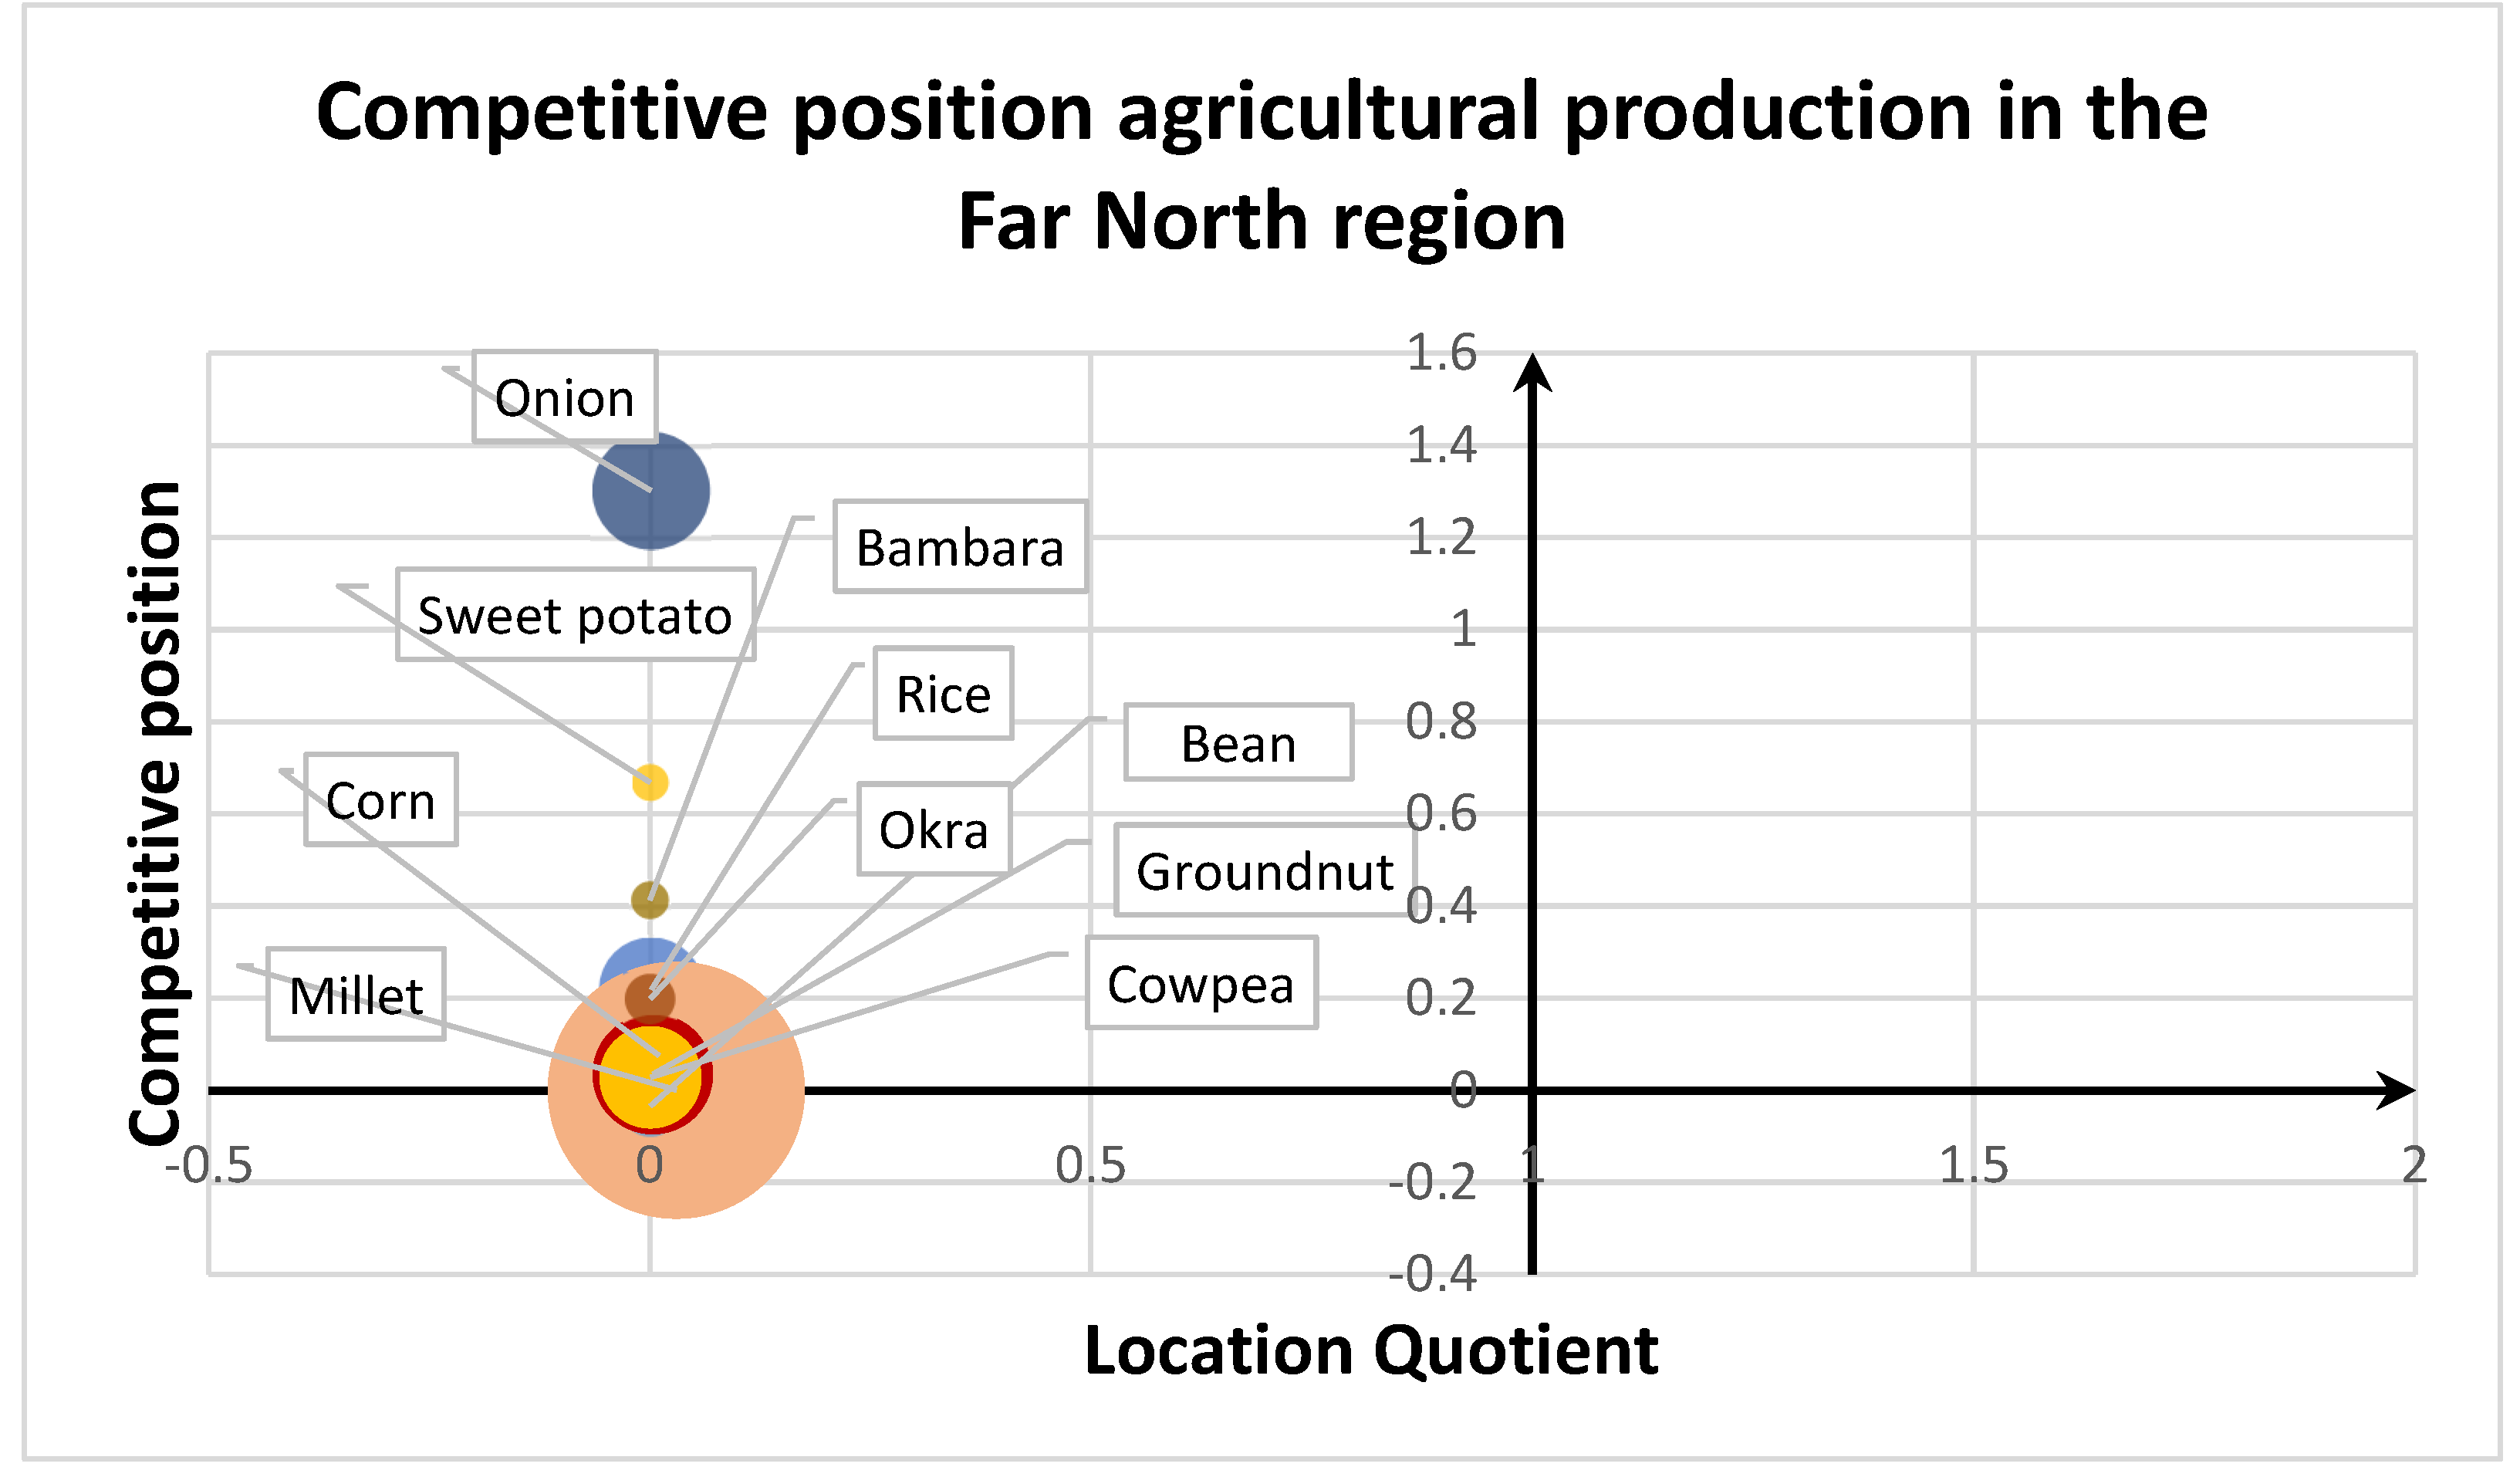
In the far north region, as shown in
Figure 20, no single product is the staple, but the main products in this locality are growing, with the exception of beans and millet, which are not showing any significant decline. The far north of the country is complex due to a number of factors. The region faces challenges such as food insecurity, resource-related conflicts, climate change and land degradation. The region's agricultural support policies and programs need to be further strengthened, and other initiatives to promote the sustainability of farming systems and strengthen the resilience of local populations are strongly recommended.
As shown in
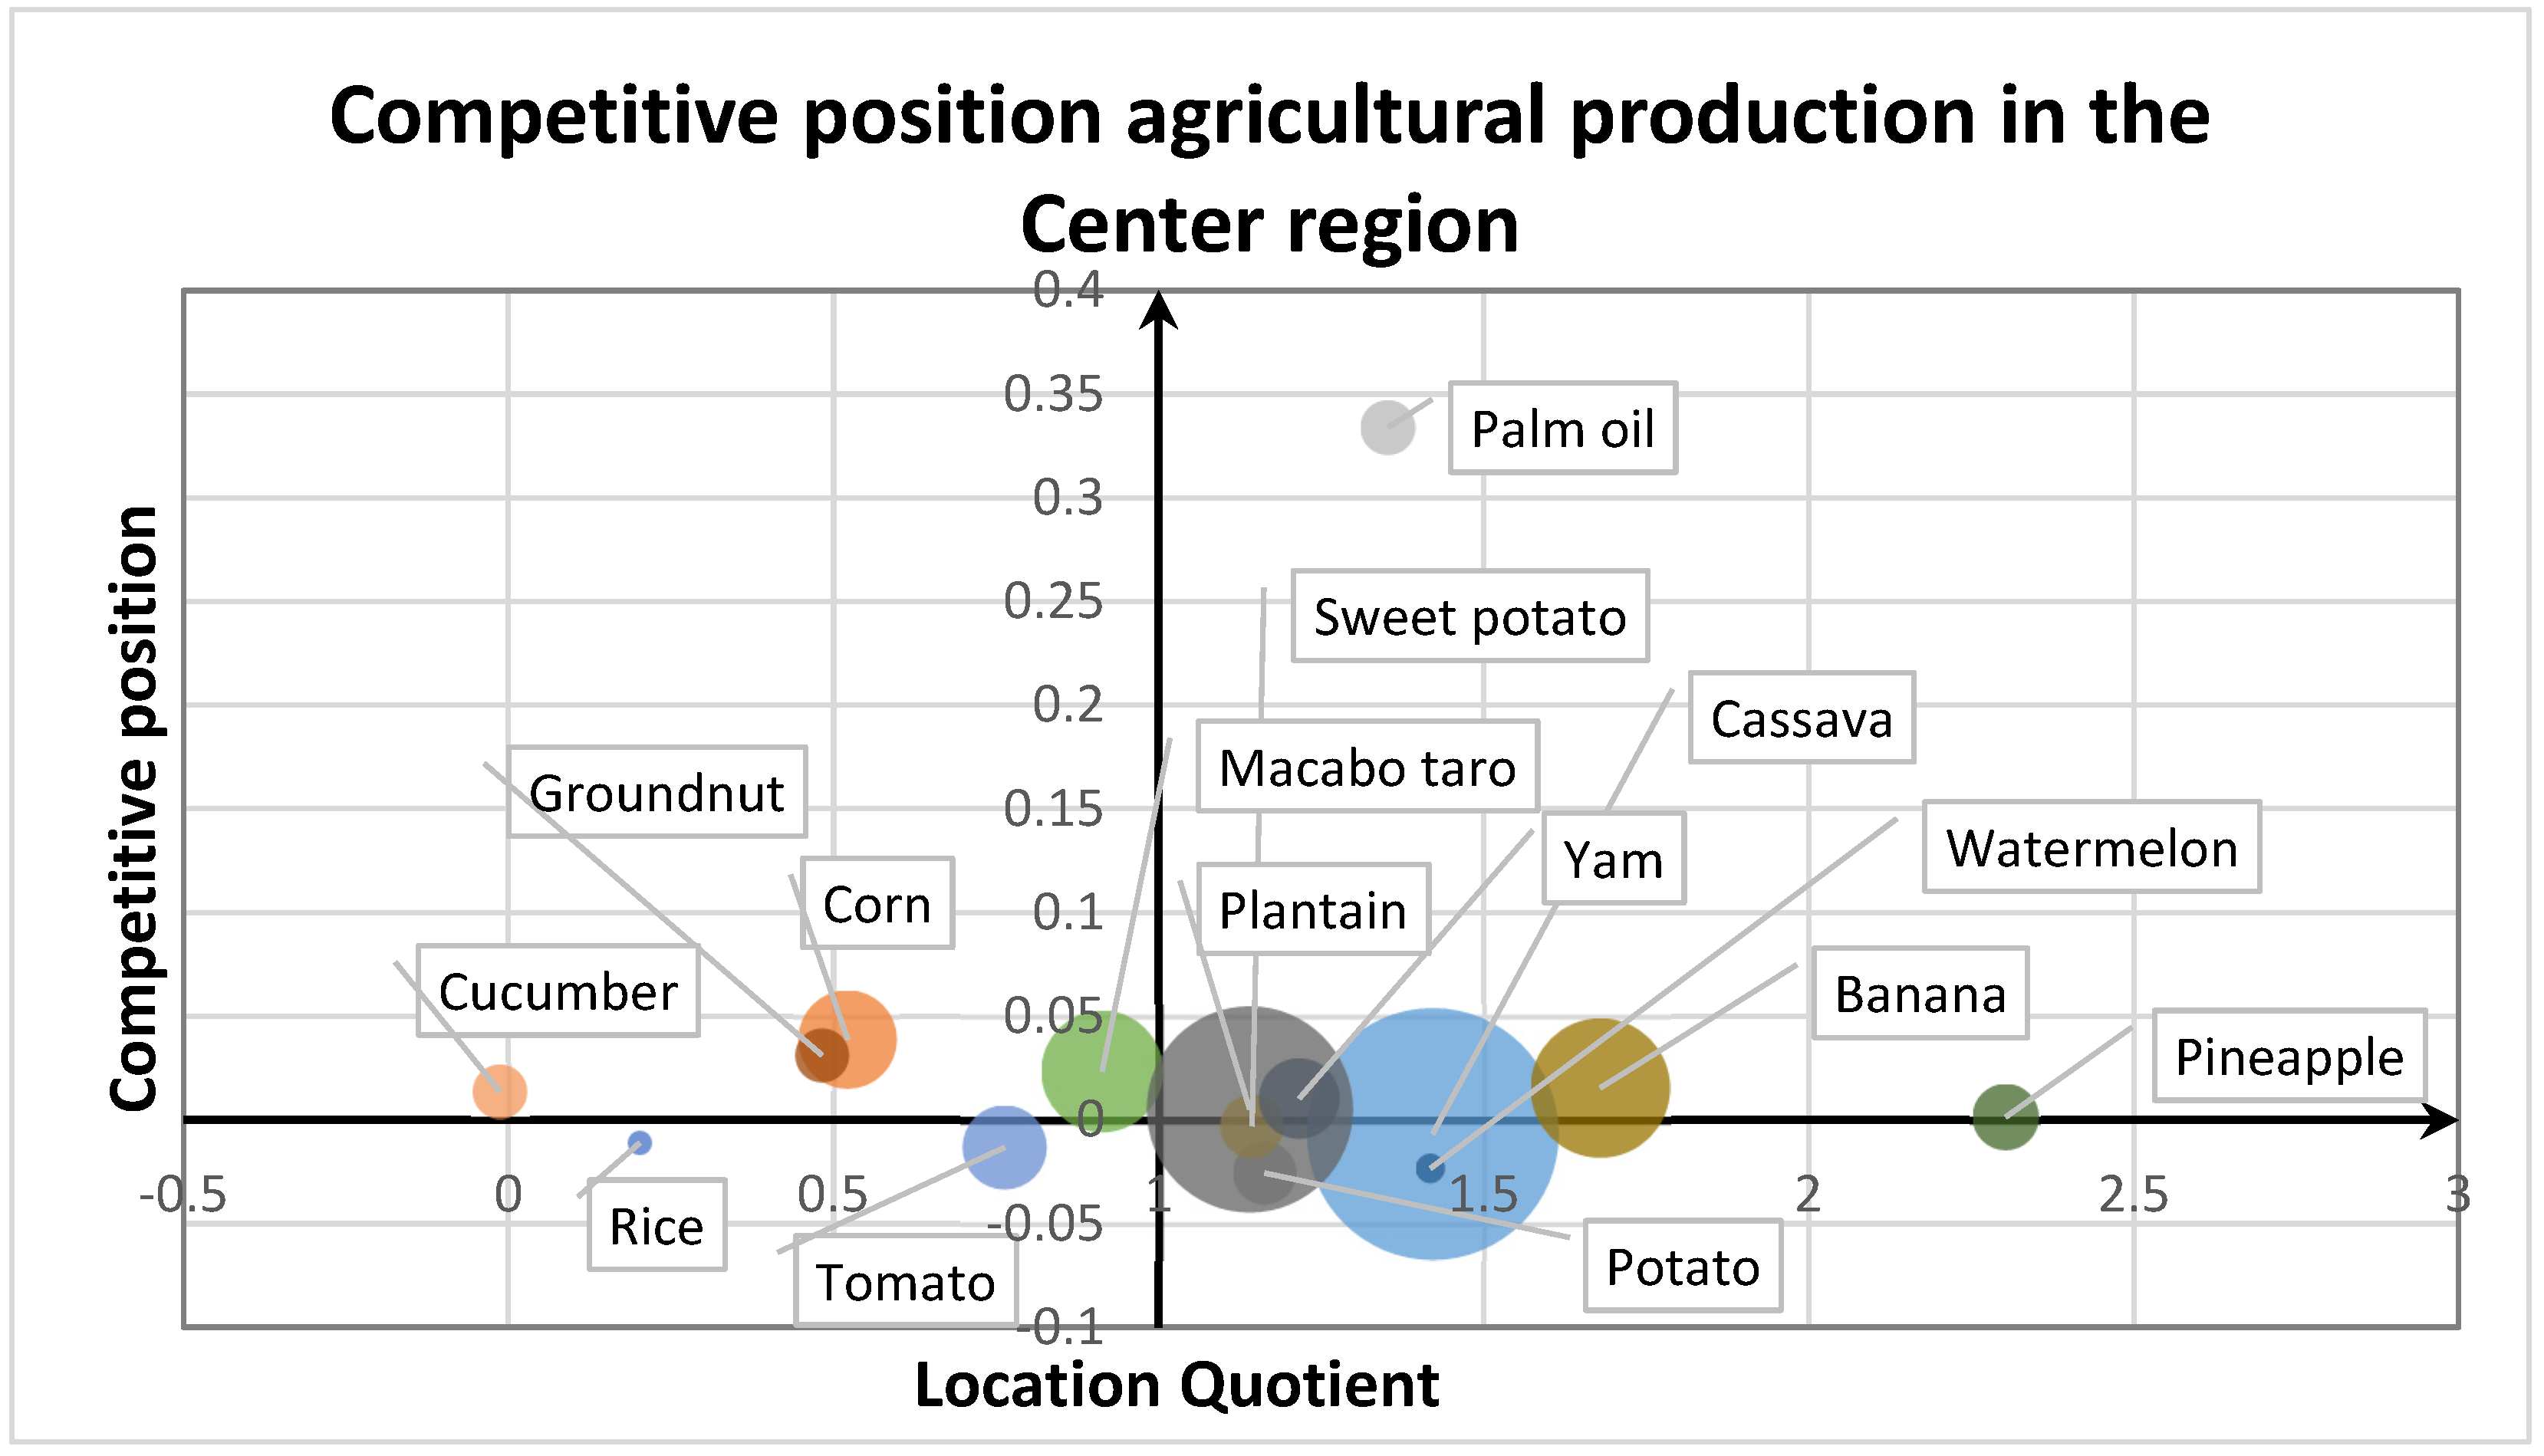
Figure 21, in the Central region, pineapple, sweet potato, sweet banana, plantain, yam, watermelons, manioc and potatoes are staple products. It is important to note that some commodities are declining but not significantly, while other commodities are also experiencing insignificant growth. Non-commodities such as groundnuts, cucumbers, corn and macabo taro are experiencing slight growth. Rice and tomatoes, on the other hand, are not showing any significant decline. Farmers in the Central region face challenges such as land management, access to water resources, the use of modern farming techniques and access to markets. Initiatives can be put in place to support farmers and improve agricultural productivity, for example, by providing technical training and facilitating access to agricultural inputs. Farmers' organizations also play an important role in the region's agricultural production. They help to promote good farming practices, disseminate new techniques and defend farmers' interests.
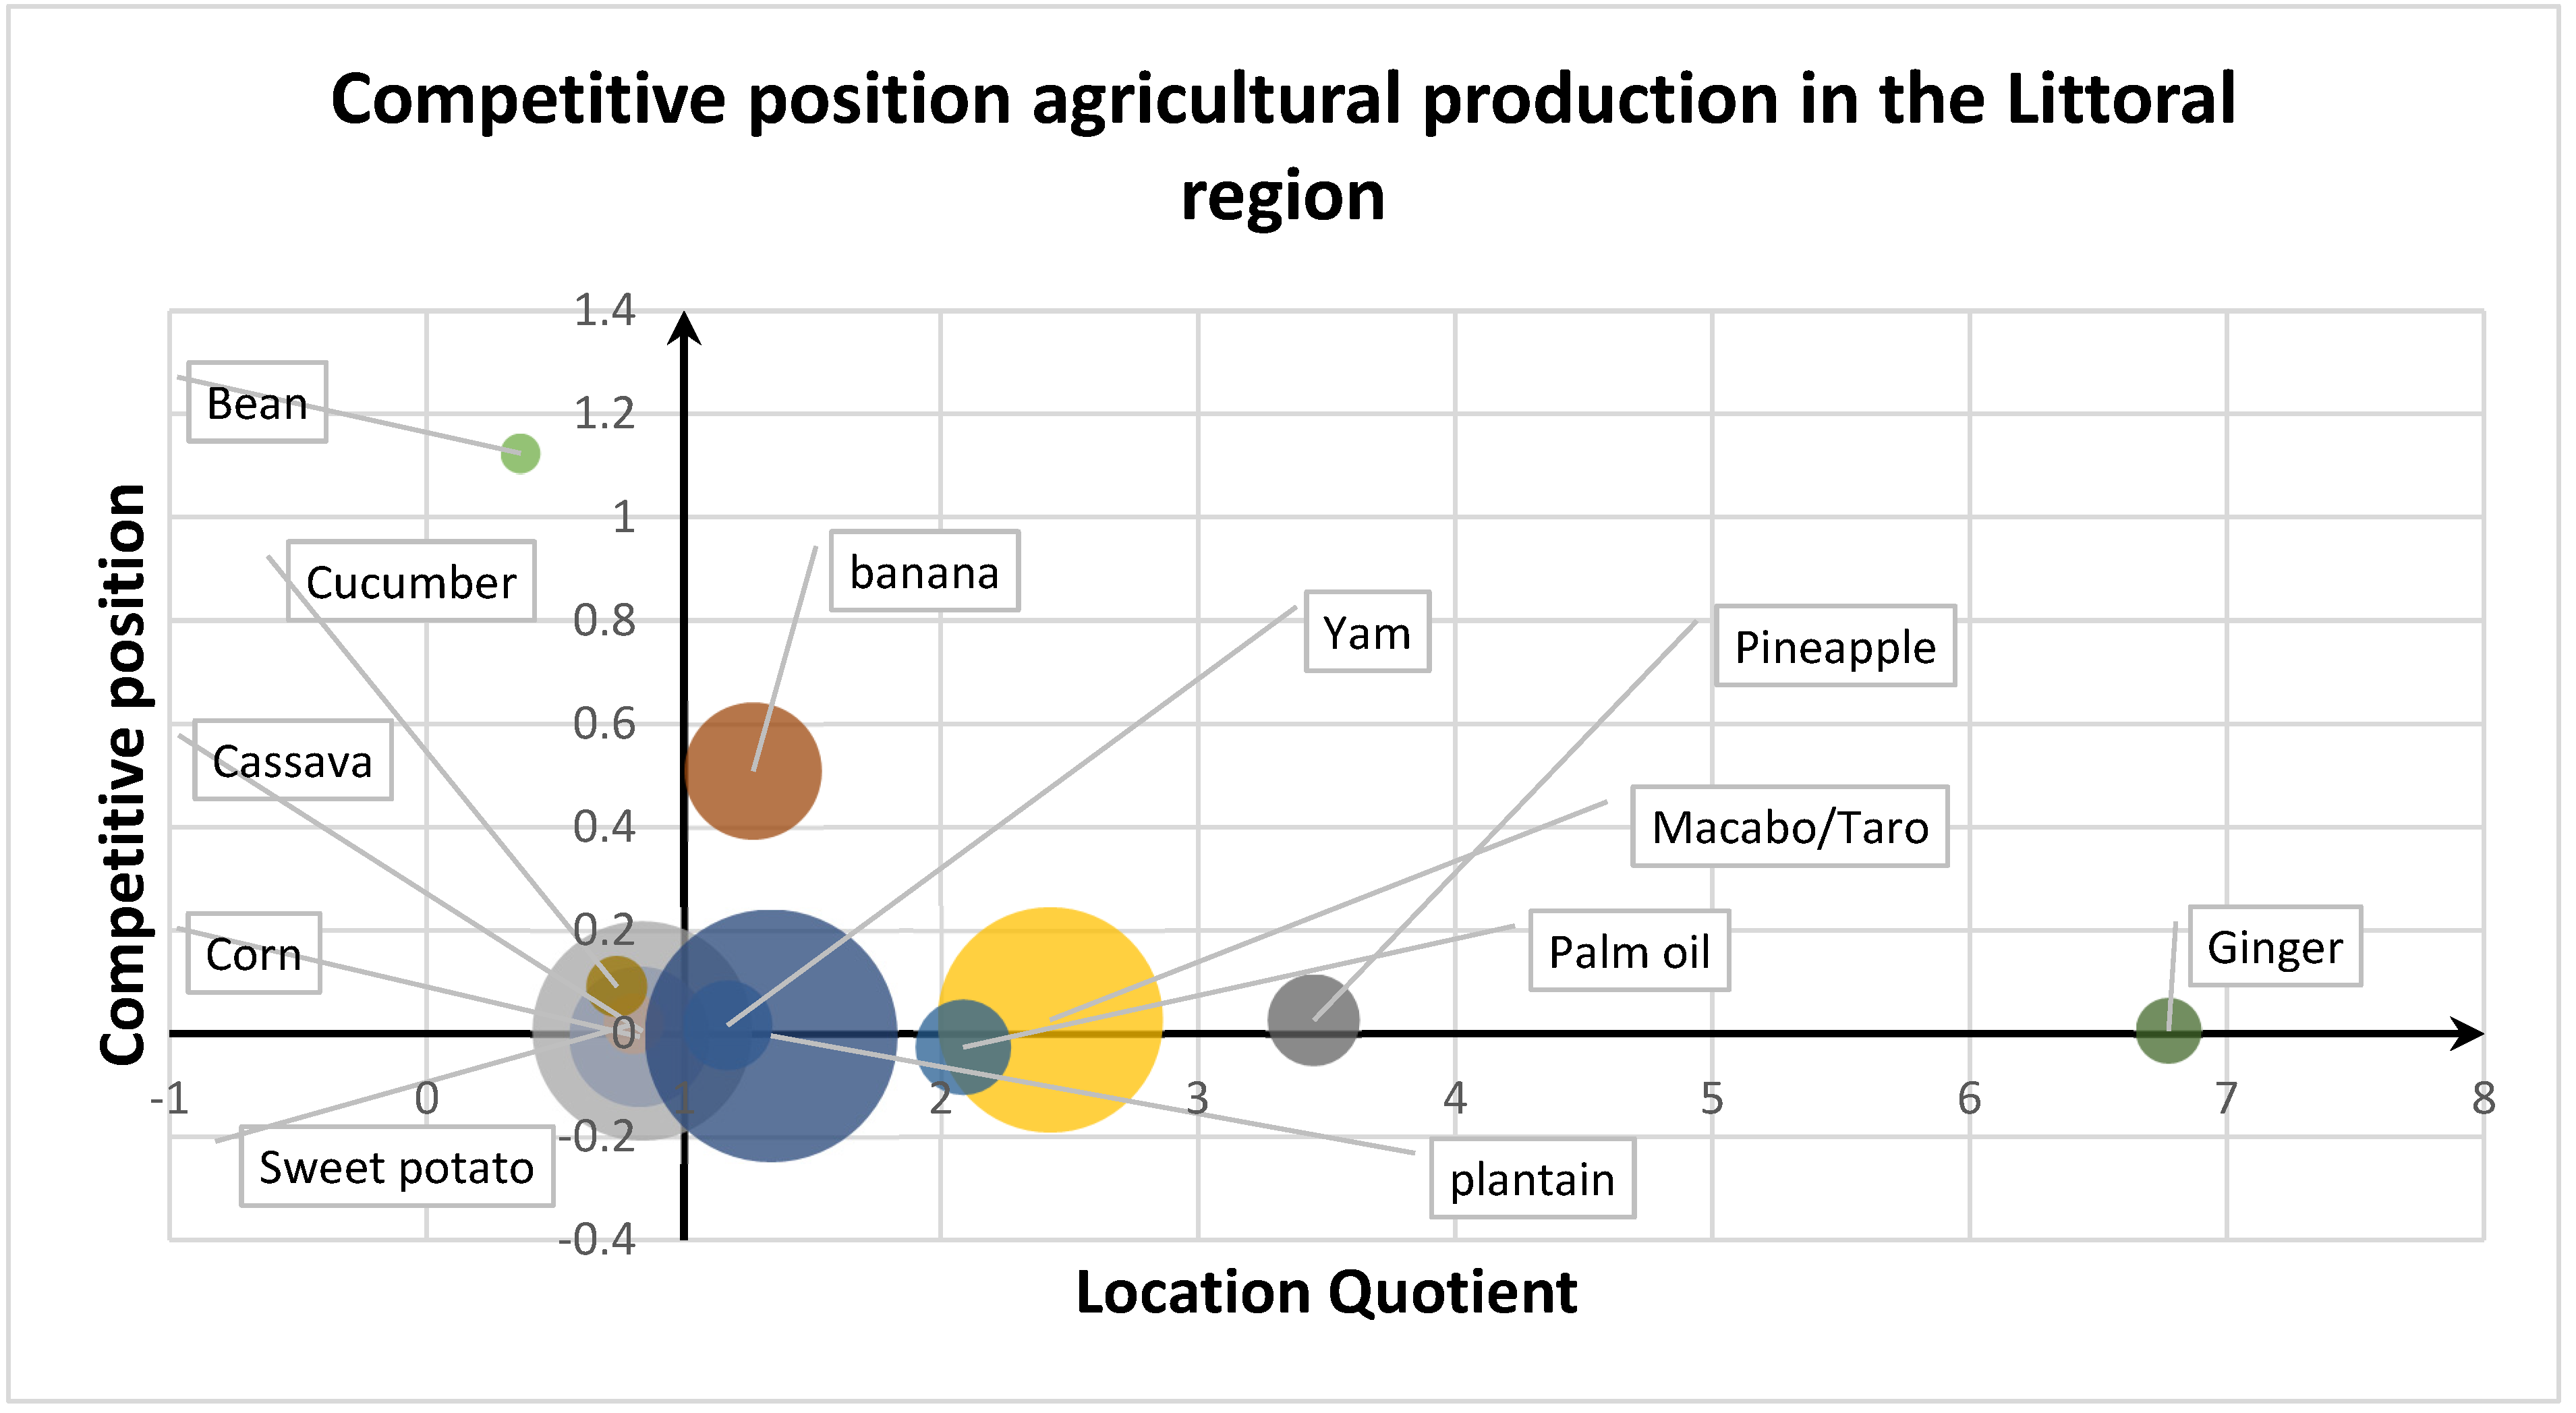
Figure 22 shows ginger, plantain, macabao, palm oil, yam, sweet banana and pineapple as staples in the littoral region. It is important to note that the sweet banana, in addition to being a staple, is also growing significantly. Beans, although not a staple, are growing significantly. Corn, cassava and sweet potatoes are non-basic products. The littoral region enjoys a climate favorable to agriculture, with regular rainfall and moderate temperatures. This favors crop growth and enables relatively high agricultural yields. However, it should be noted that this region can also face agricultural challenges, such as deforestation, soil erosion and crop diseases. These challenges can affect agricultural productivity and require ongoing efforts to overcome. Framework policies would be necessary for sustainable production growth.
In
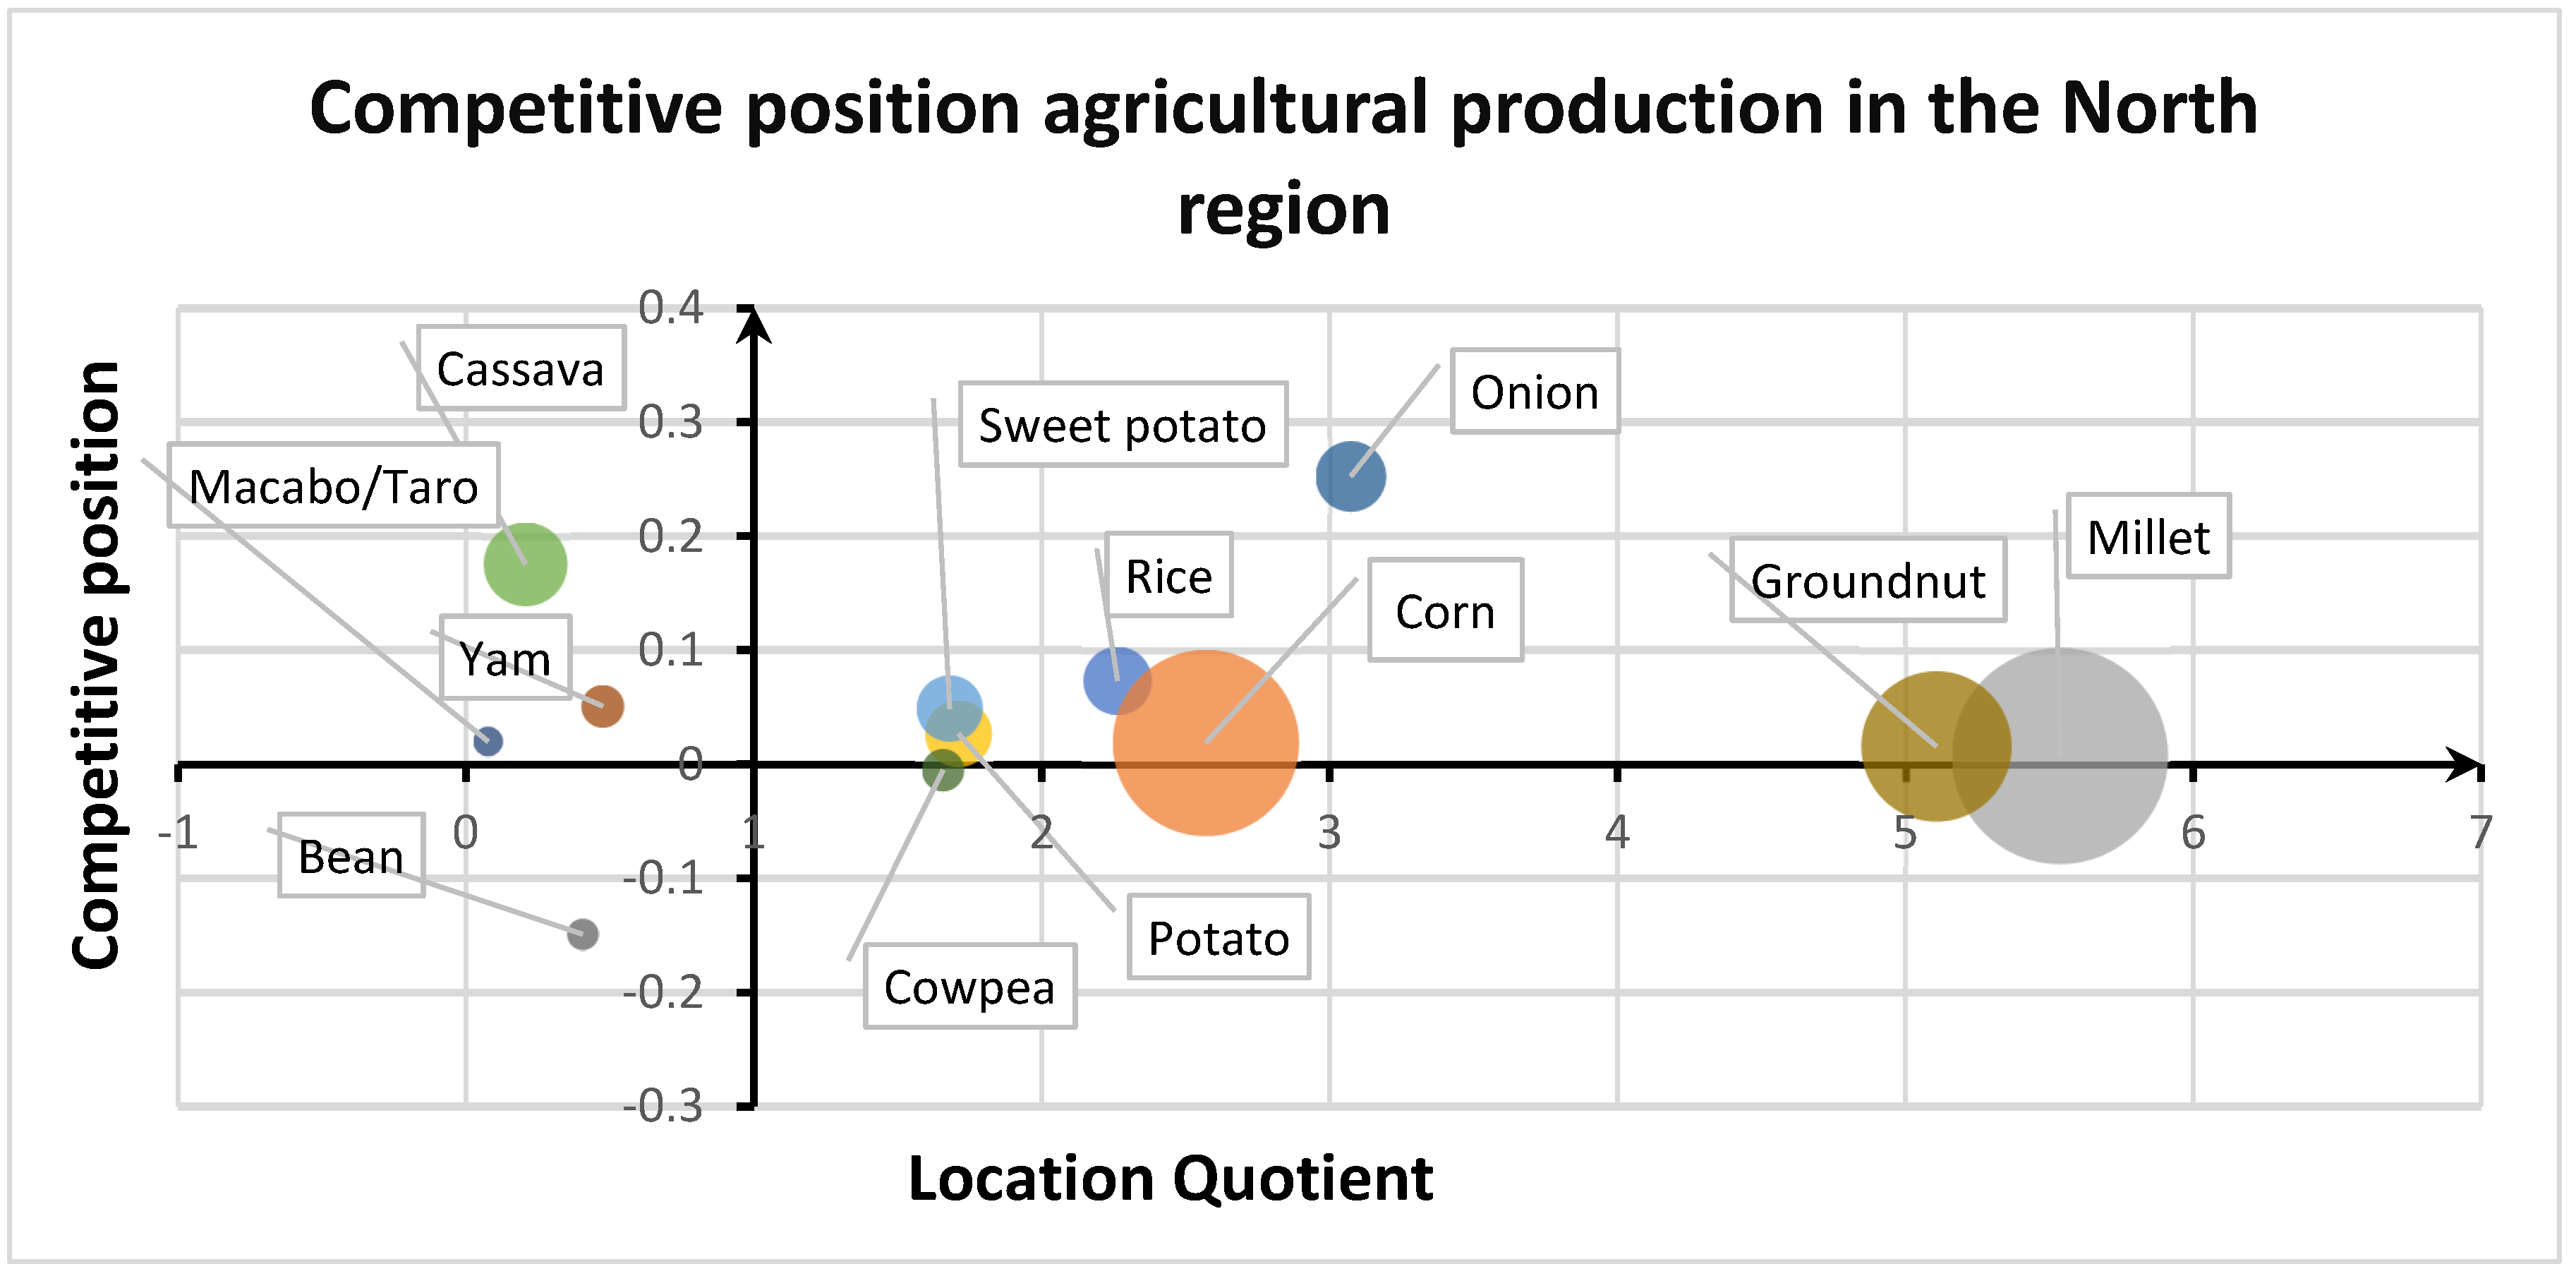
Figure 23, the staple products in the northern region are millet, groundnuts, onions, maize, rice, sweet potatoes, cowpeas and potatoes. It should be noted, however, that the staple onion is enjoying significant growth. As for non-basic products, bean production is declining significantly. Macabao, taro and yam are showing slight growth, while cassava has grown significantly over the year under review. The region faces challenges such as poverty reduction, resource-related conflicts, food insecurity and the need to improve agricultural productivity. Mechanisms to alleviate these challenges could structurally improve production.
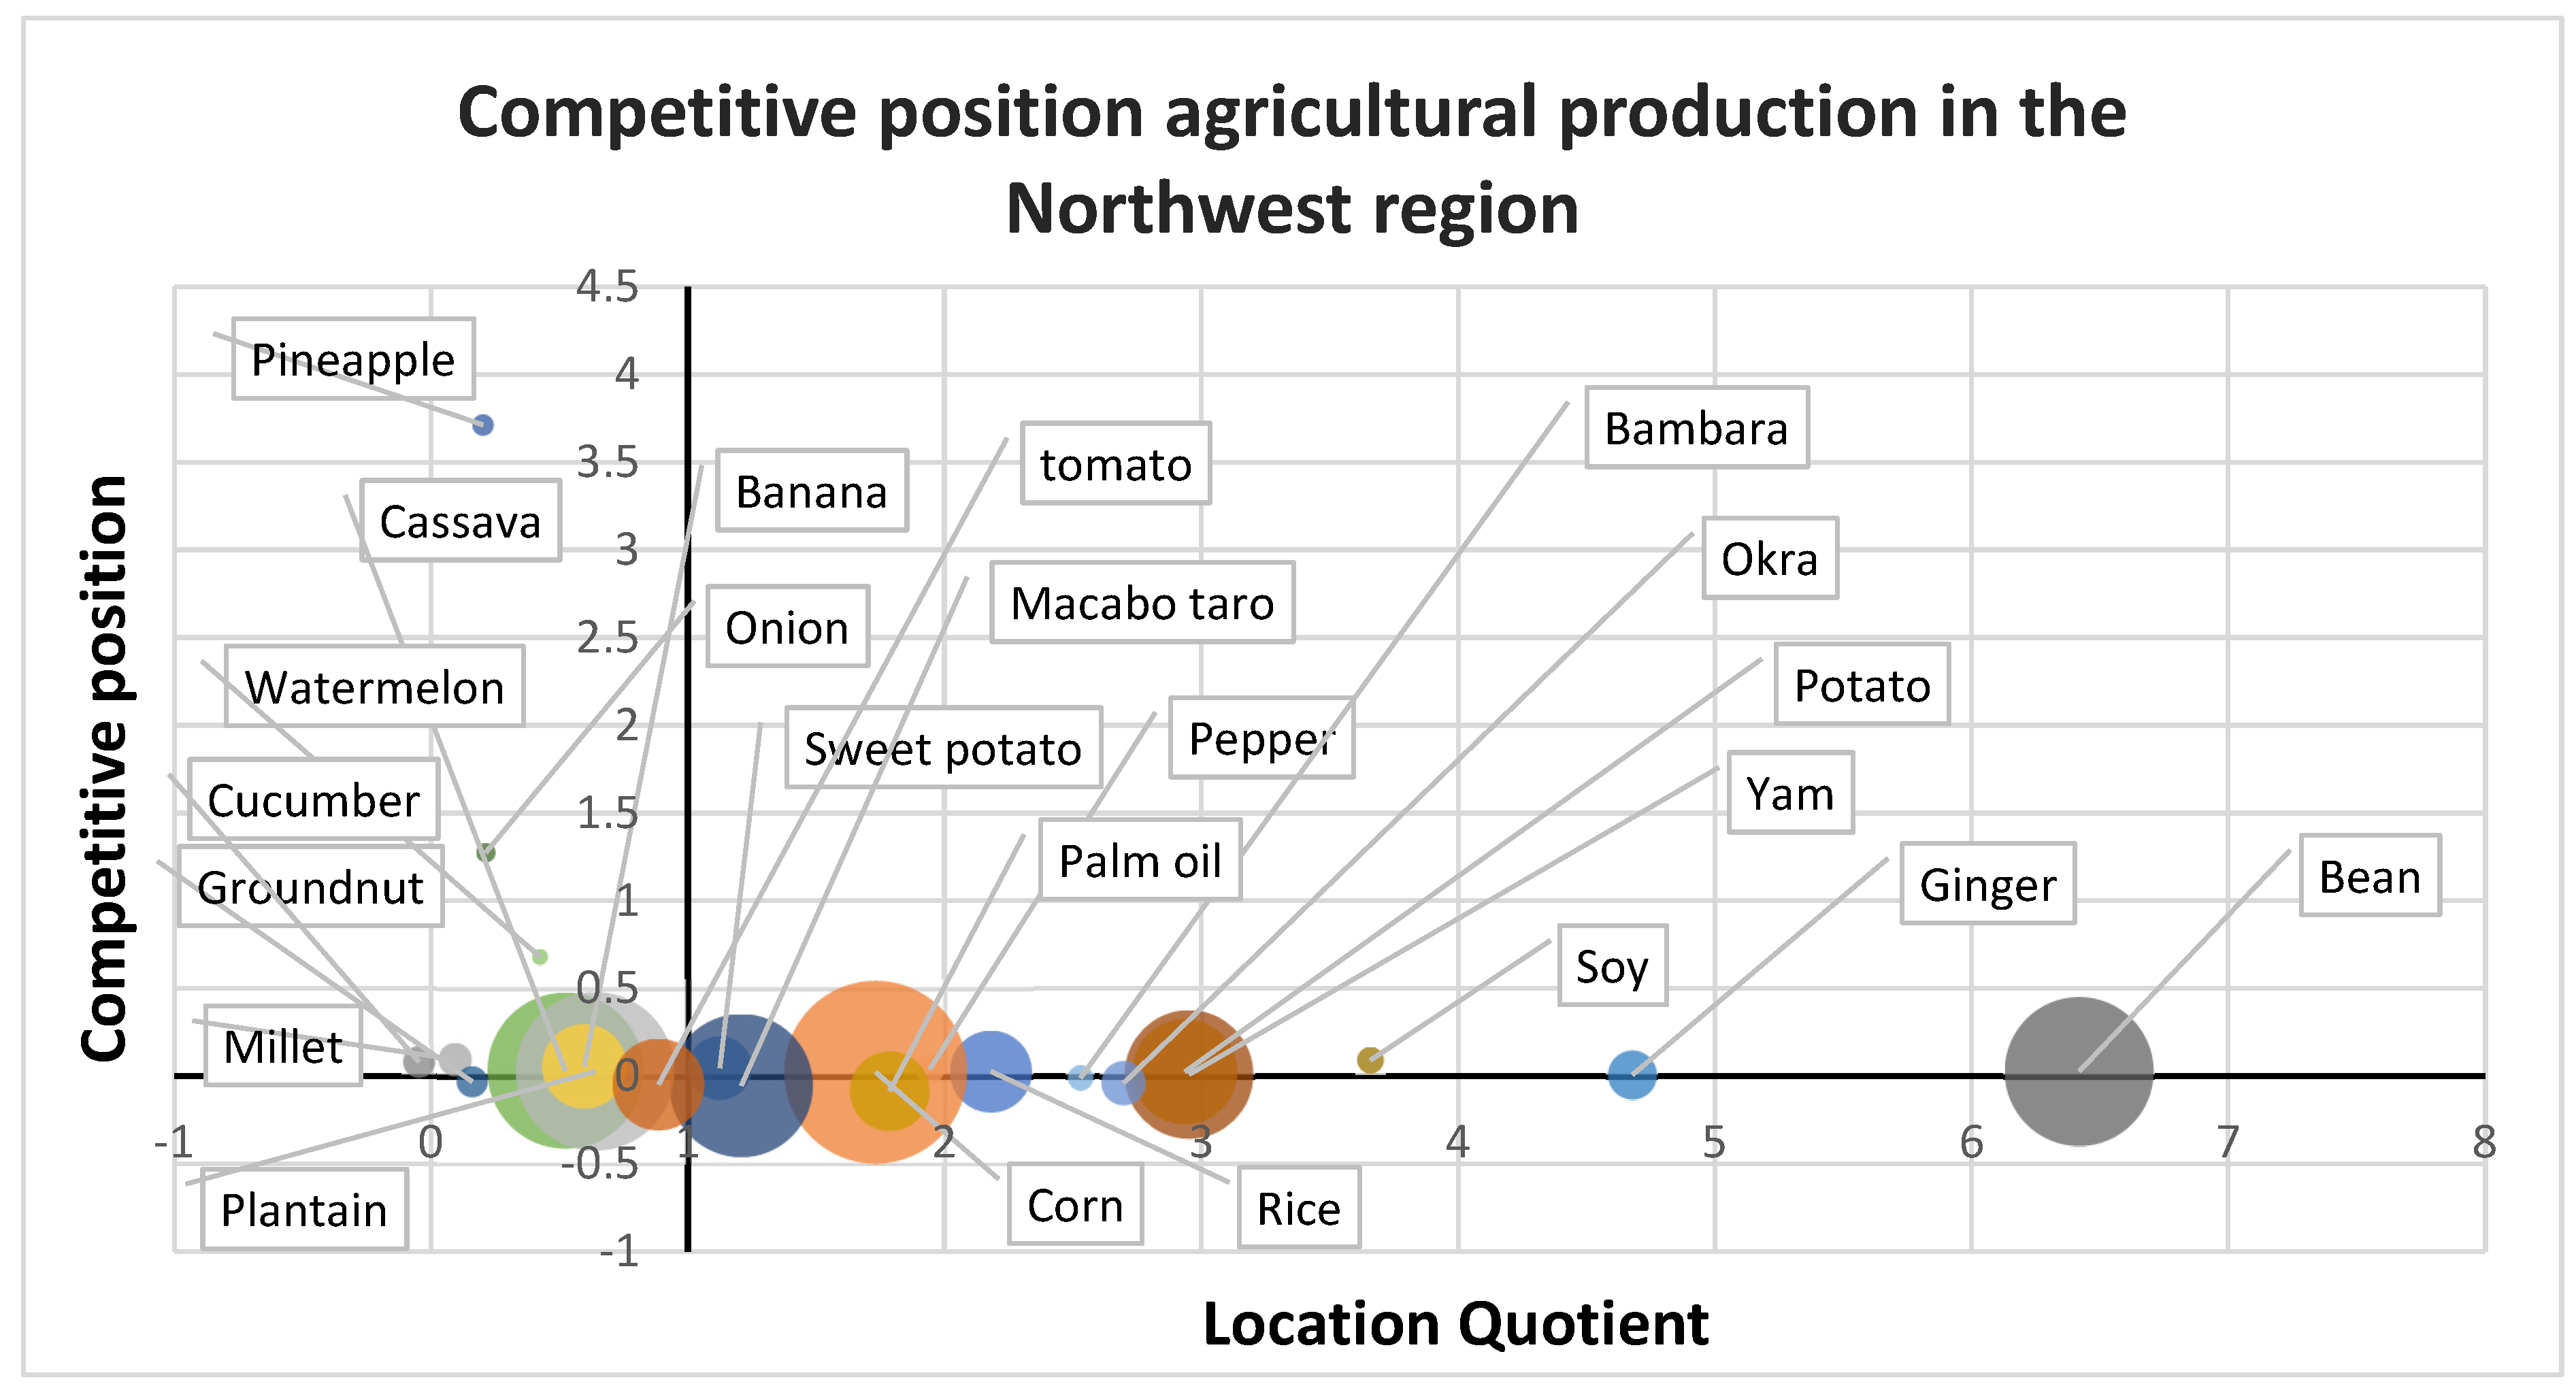
Figure 24 shows beans, ginger, soy, rice, sweet potatoes, palm oil peppers, macabo taro, corn, potatoes, okra and bambara as commodities. It is important to note that no staple product is growing significantly in this region. On the other hand, non-basic products such as onions and pineapples are growing, while other products have shown slight growth. The security situation in parts of the North-West region in recent years has had a significant impact on agricultural production. Conflicts, the non-operation of processing industries and population displacements can disrupt specific agricultural activities and limit access to arable land, having a negative impact on production.
Rice, palm oil, pineapple and groundnuts, as shown in
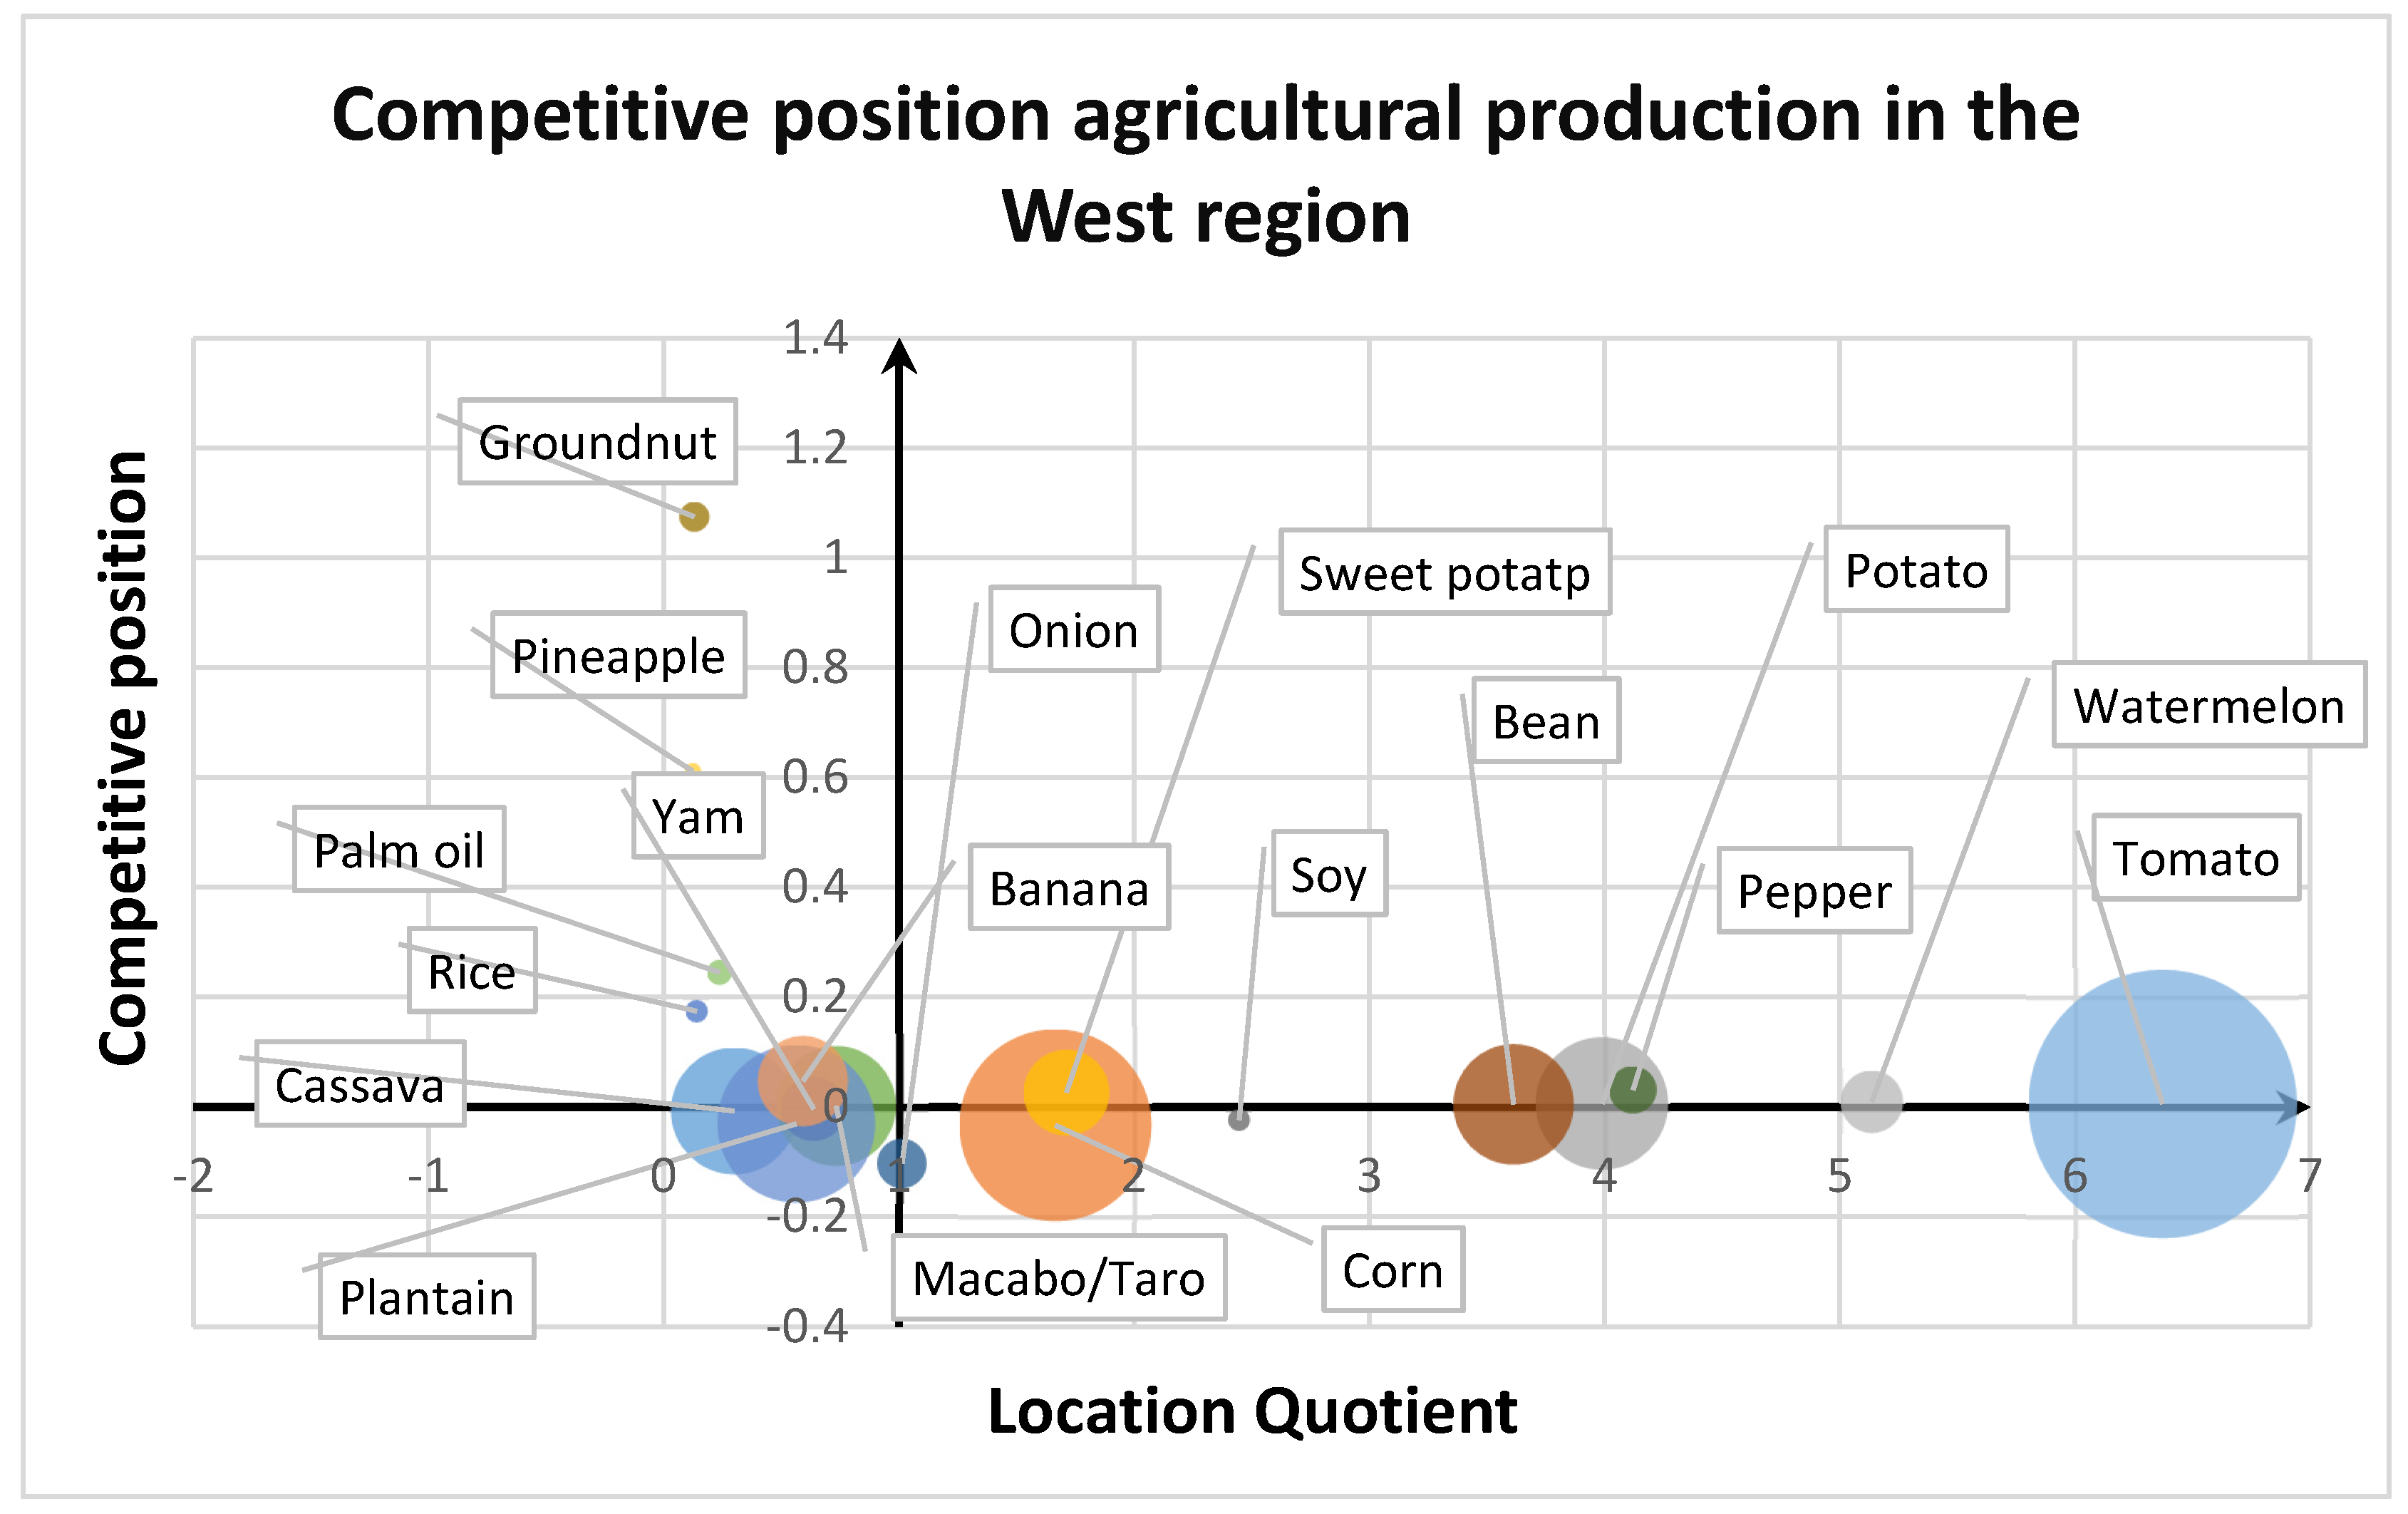
Figure 25, are non-basic products that are growing rapidly in the West region. By contrast, tomatoes, watermelons, chillies, potatoes, beans, sweet potatoes, soy, sweet bananas and corn are the main staples. Tomato production is the region's leading staple. It can also be observed that no single commodity showed significant growth throughout the study period. Cropping systems in West Cameroon may vary, but many farms still practice traditional methods. The West Cameroon region has high altitudes, creating a cool climate and favorable conditions for certain crops. It is important to note that the agricultural production situation can vary depending on a number of factors, including climatic conditions, local farming practices, access to resources and markets, and the agricultural support policies and programs in place in the region.
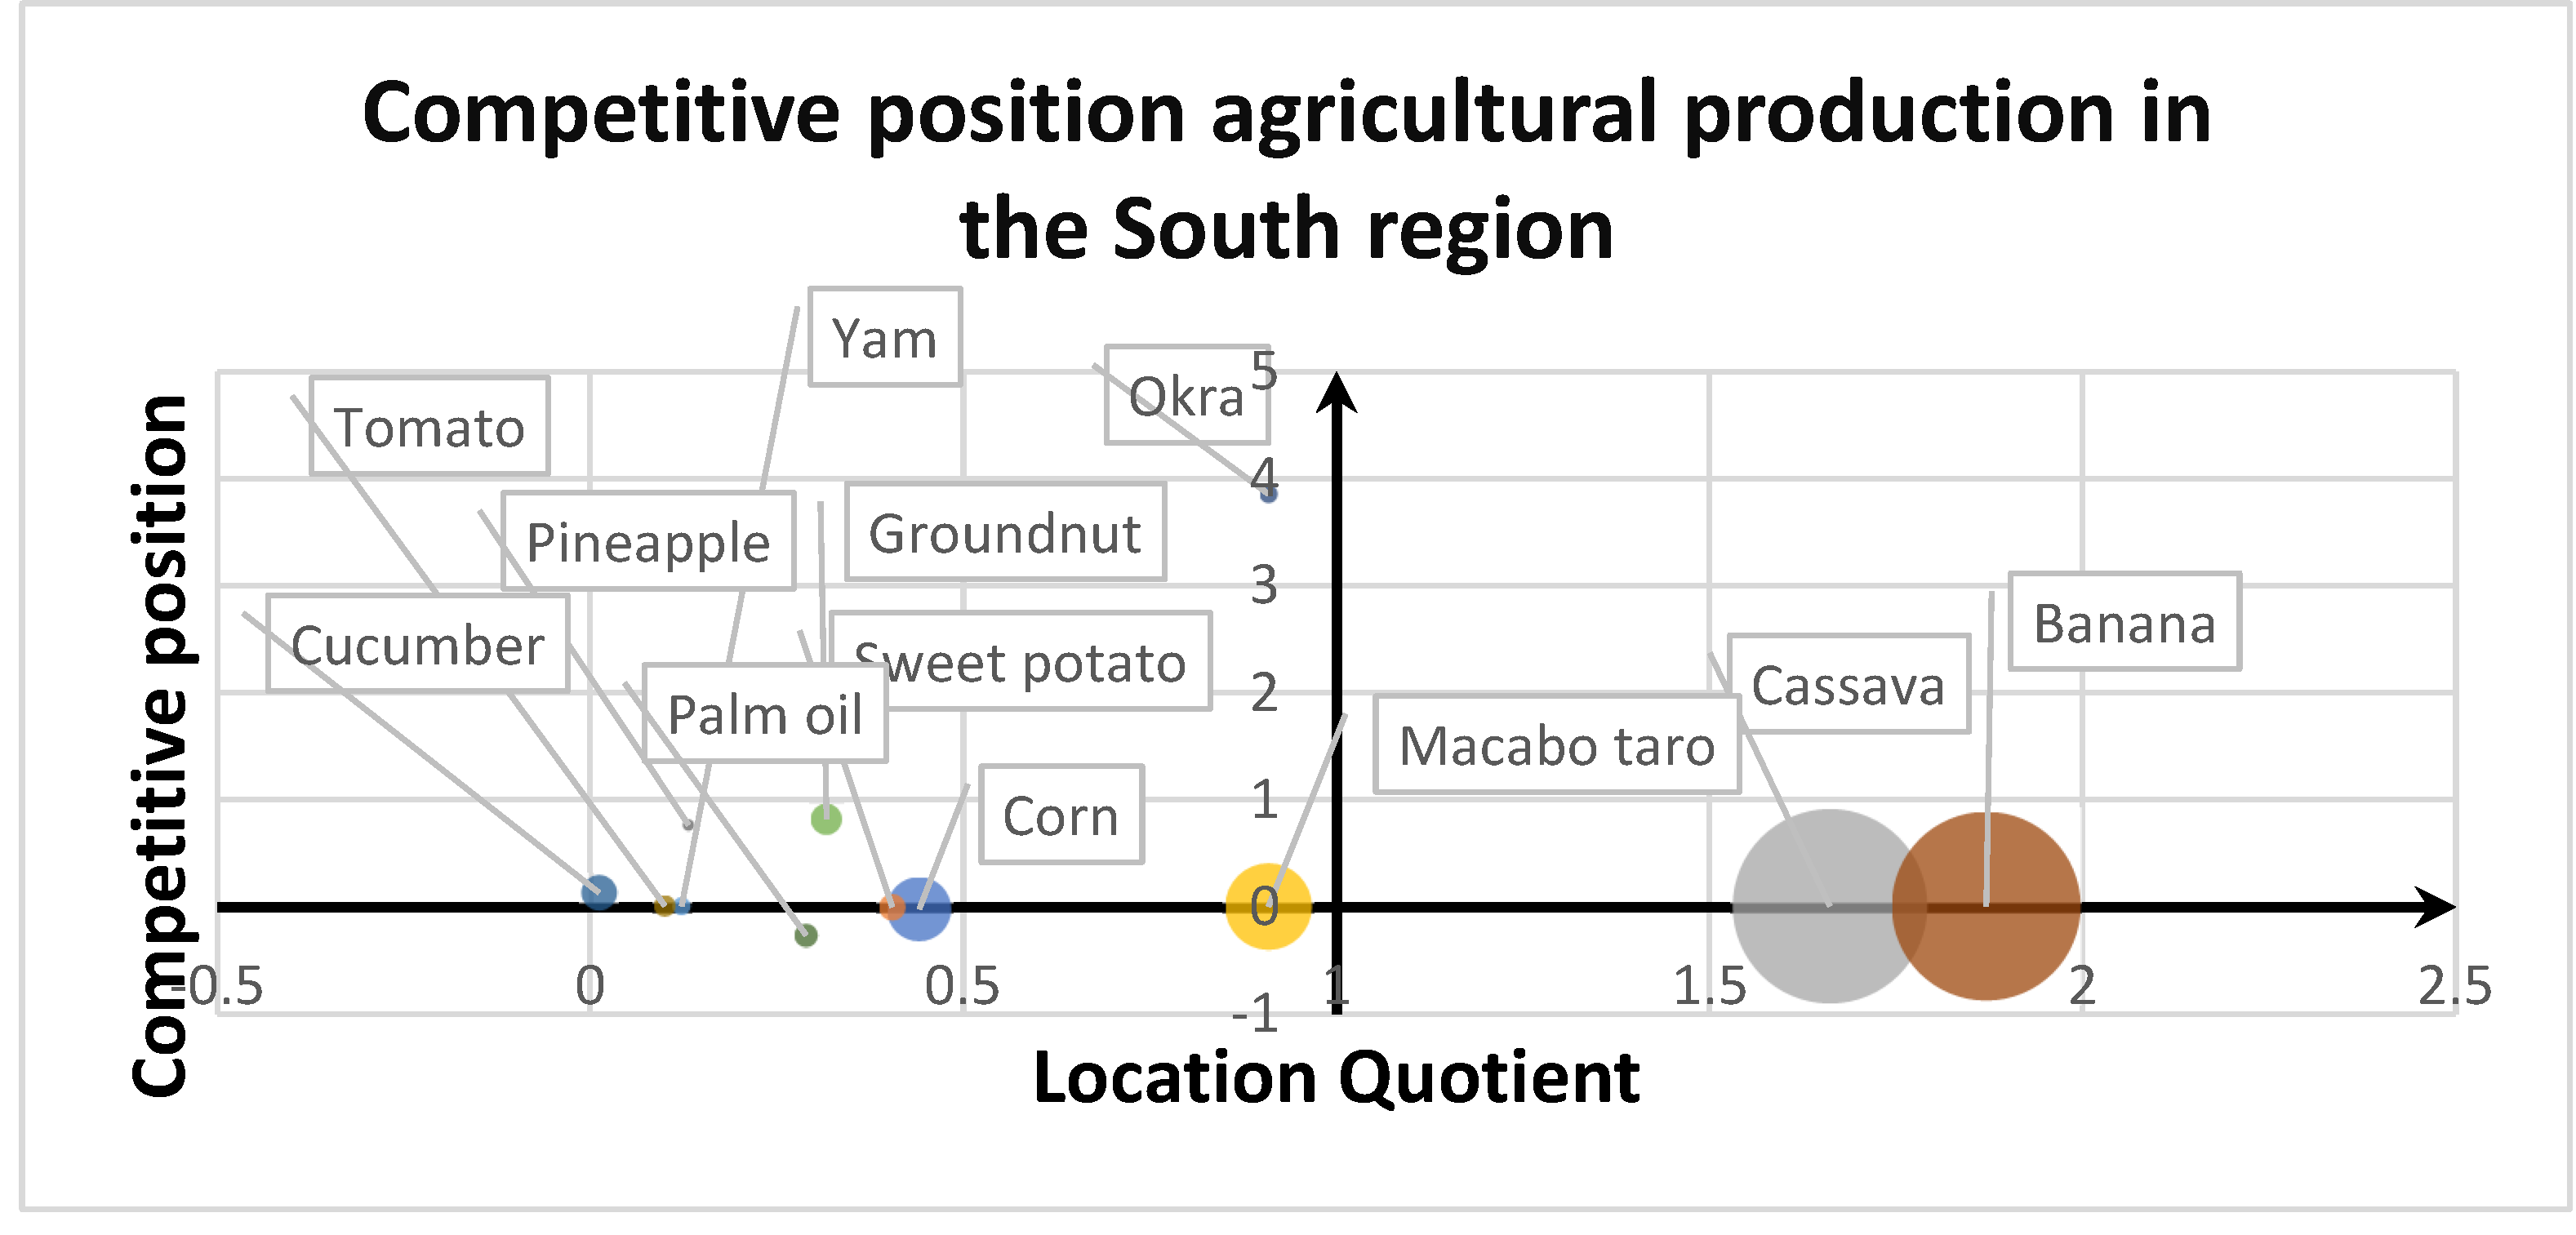
Figure 26 shows that the southern region still has a long way to go in terms of agricultural production, with cassava, plantain and okra as staples, which are growing significantly, and the rest of the non-basic products relatively variable and insignificant. The South Cameroon region is characterized by a humid tropical climate with high rainfall. While this can be beneficial for some crops, it can also lead to problems of excessive humidity and plant diseases. In addition, the region's soils can be acidic and of low fertility, which can limit agricultural productivity, a lack of infrastructure and access to markets, a lack of financing and technical support, and traditional farming practices. It should be noted that these factors may vary according to local specificities and the economic and social conditions of the region. Efforts to improve agricultural infrastructure, increase access to markets, provide financial and technical support to farmers, and promote the adoption of sustainable farming practices can help to increase agricultural production in the region.
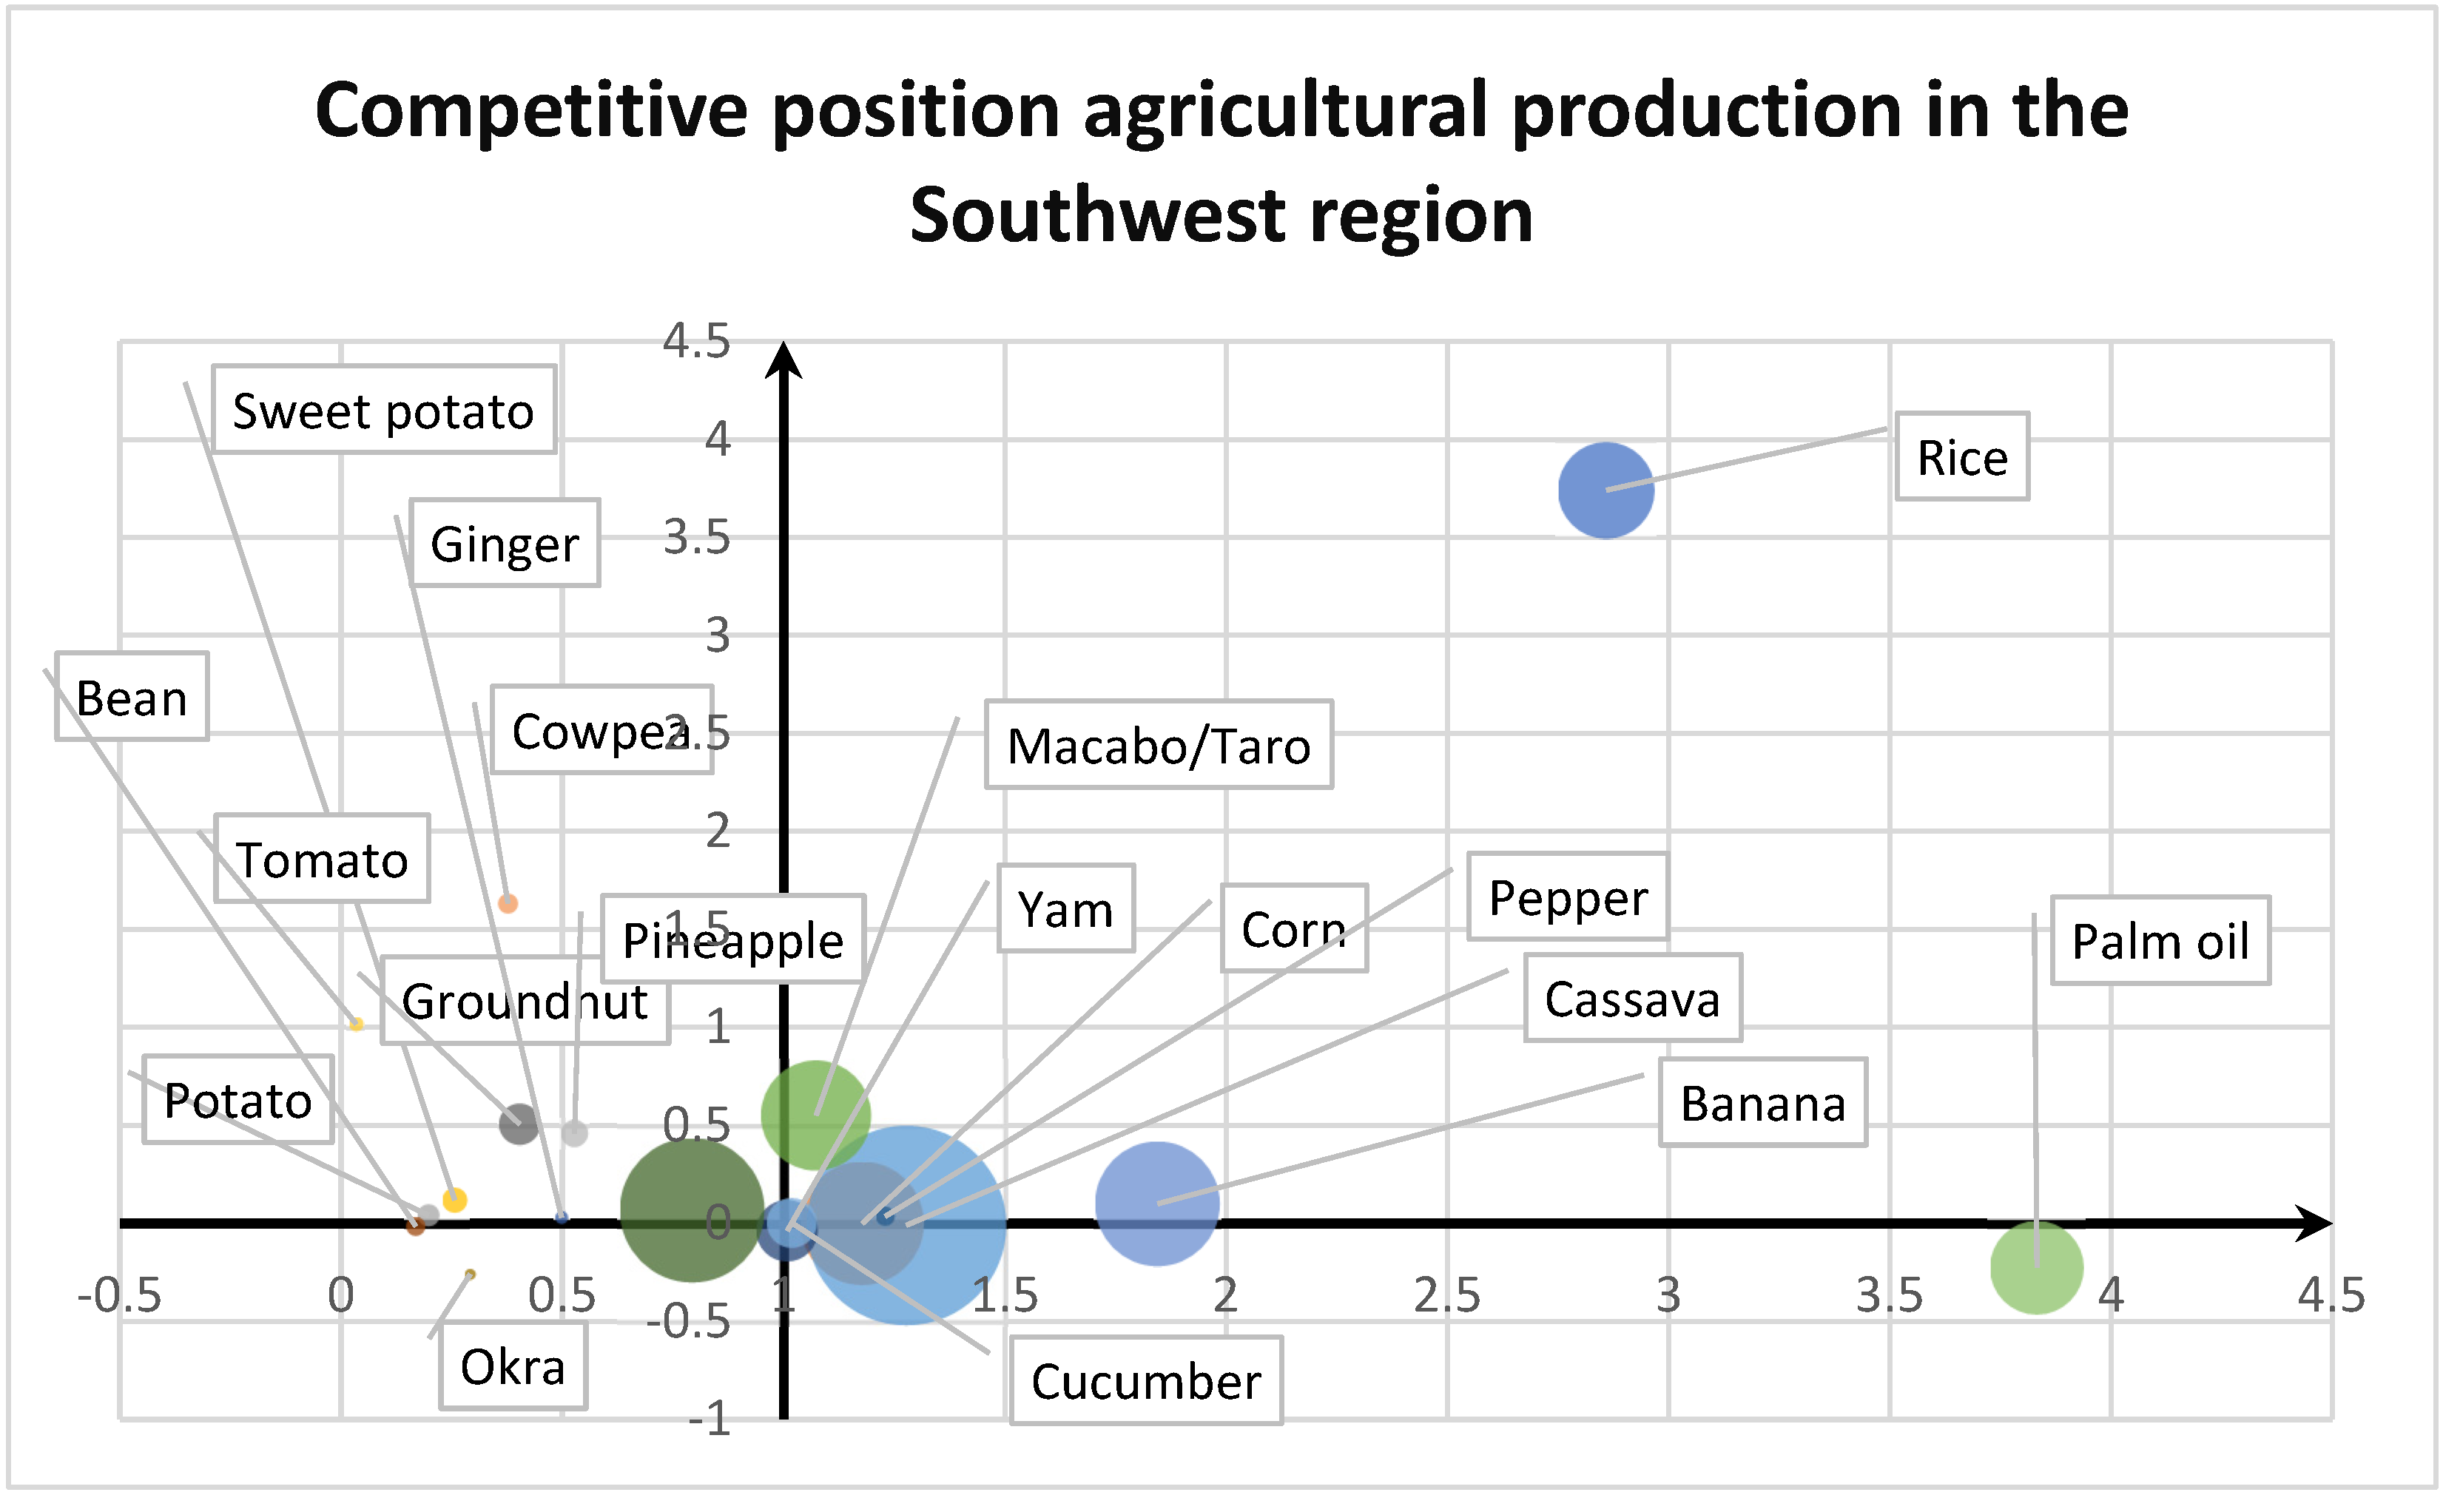
Figure 27 shows palm oil, sweet bananas, manioc, corn, macabo, pepper and rice as staple products in the Southwest region. These products should be given special attention in order to boost the sector and improve food availability in the region. Tomatoes and cowpeas are growing. Other non-basic products showed little significant variance.
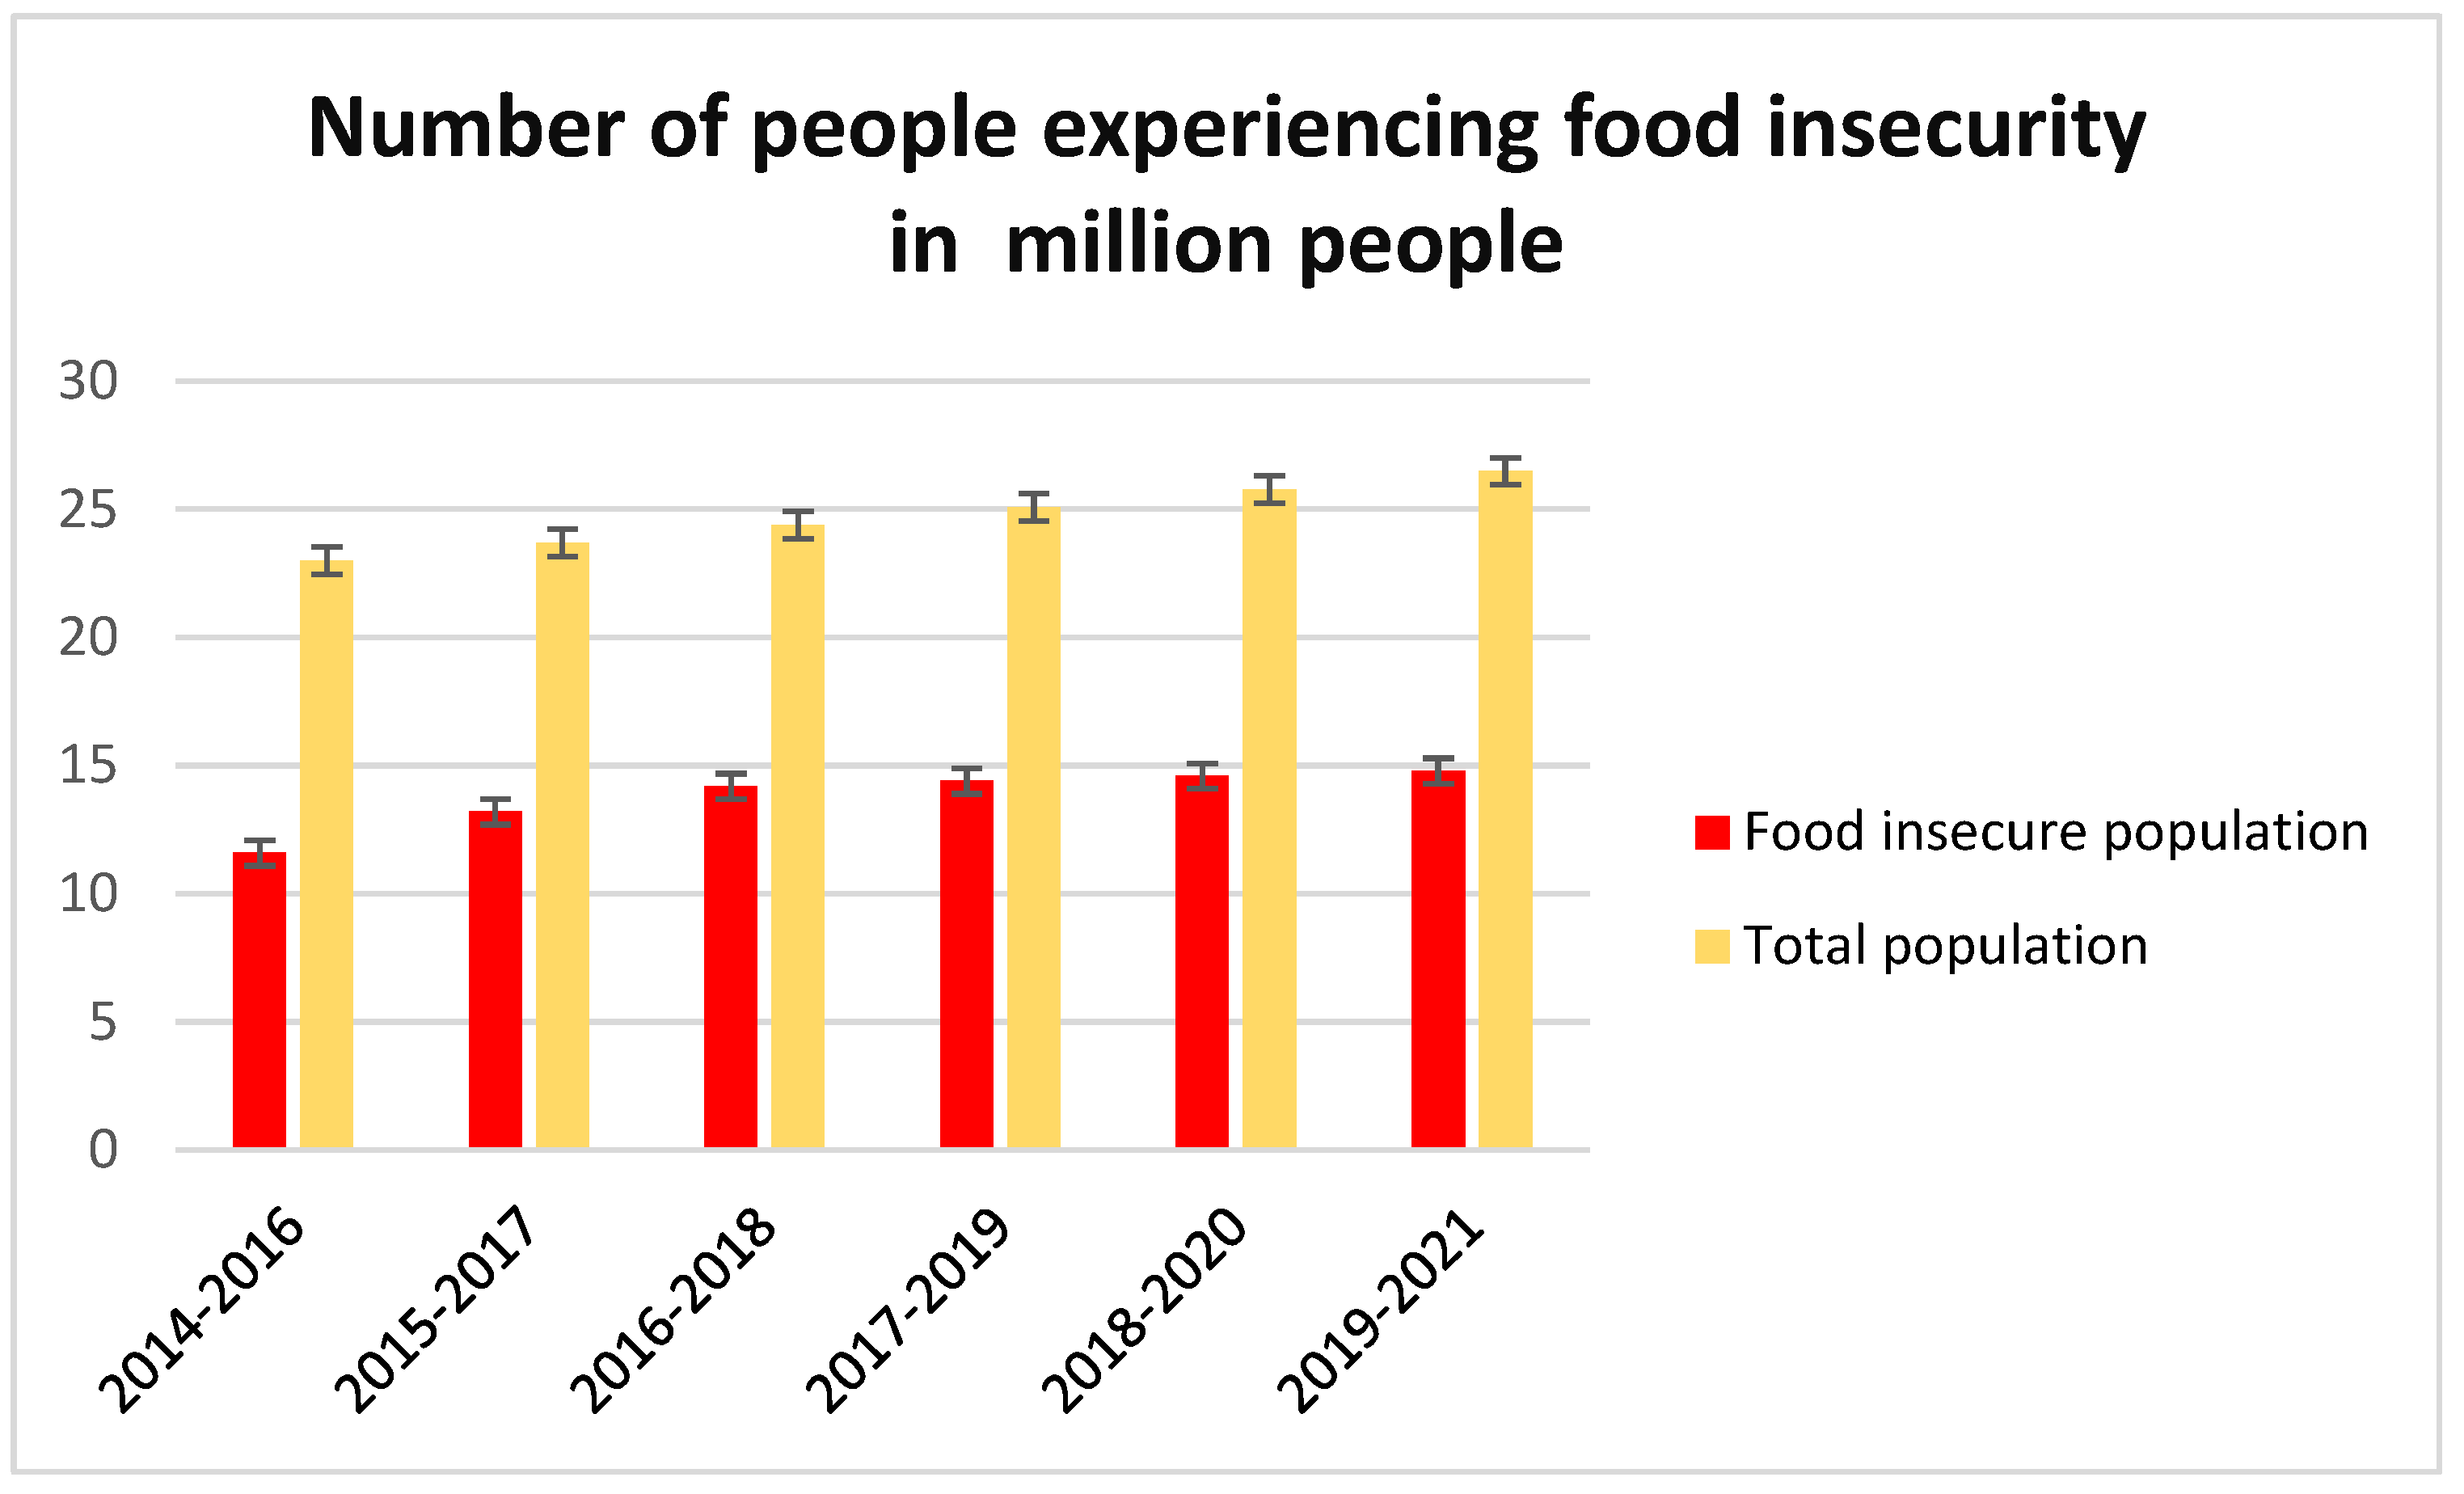
Figure 28 shows the number of food-insecure people in Cameroon from 2014 to 2021 in two-year increments. Although overall agricultural production remains on the rise throughout our study, the number of food-insecure people also increases. More than half the population is food insecure between 2014 and 2021. This increase can be explained by population growth that does not keep pace with agricultural growth, non-diversification of staple food products, a lack of product exchange between regions, a high proportion of products devoted to export, rising food prices linked to energy prices and the covid19 pandemic. Accompanying mechanisms must be devised to improve these statistics.
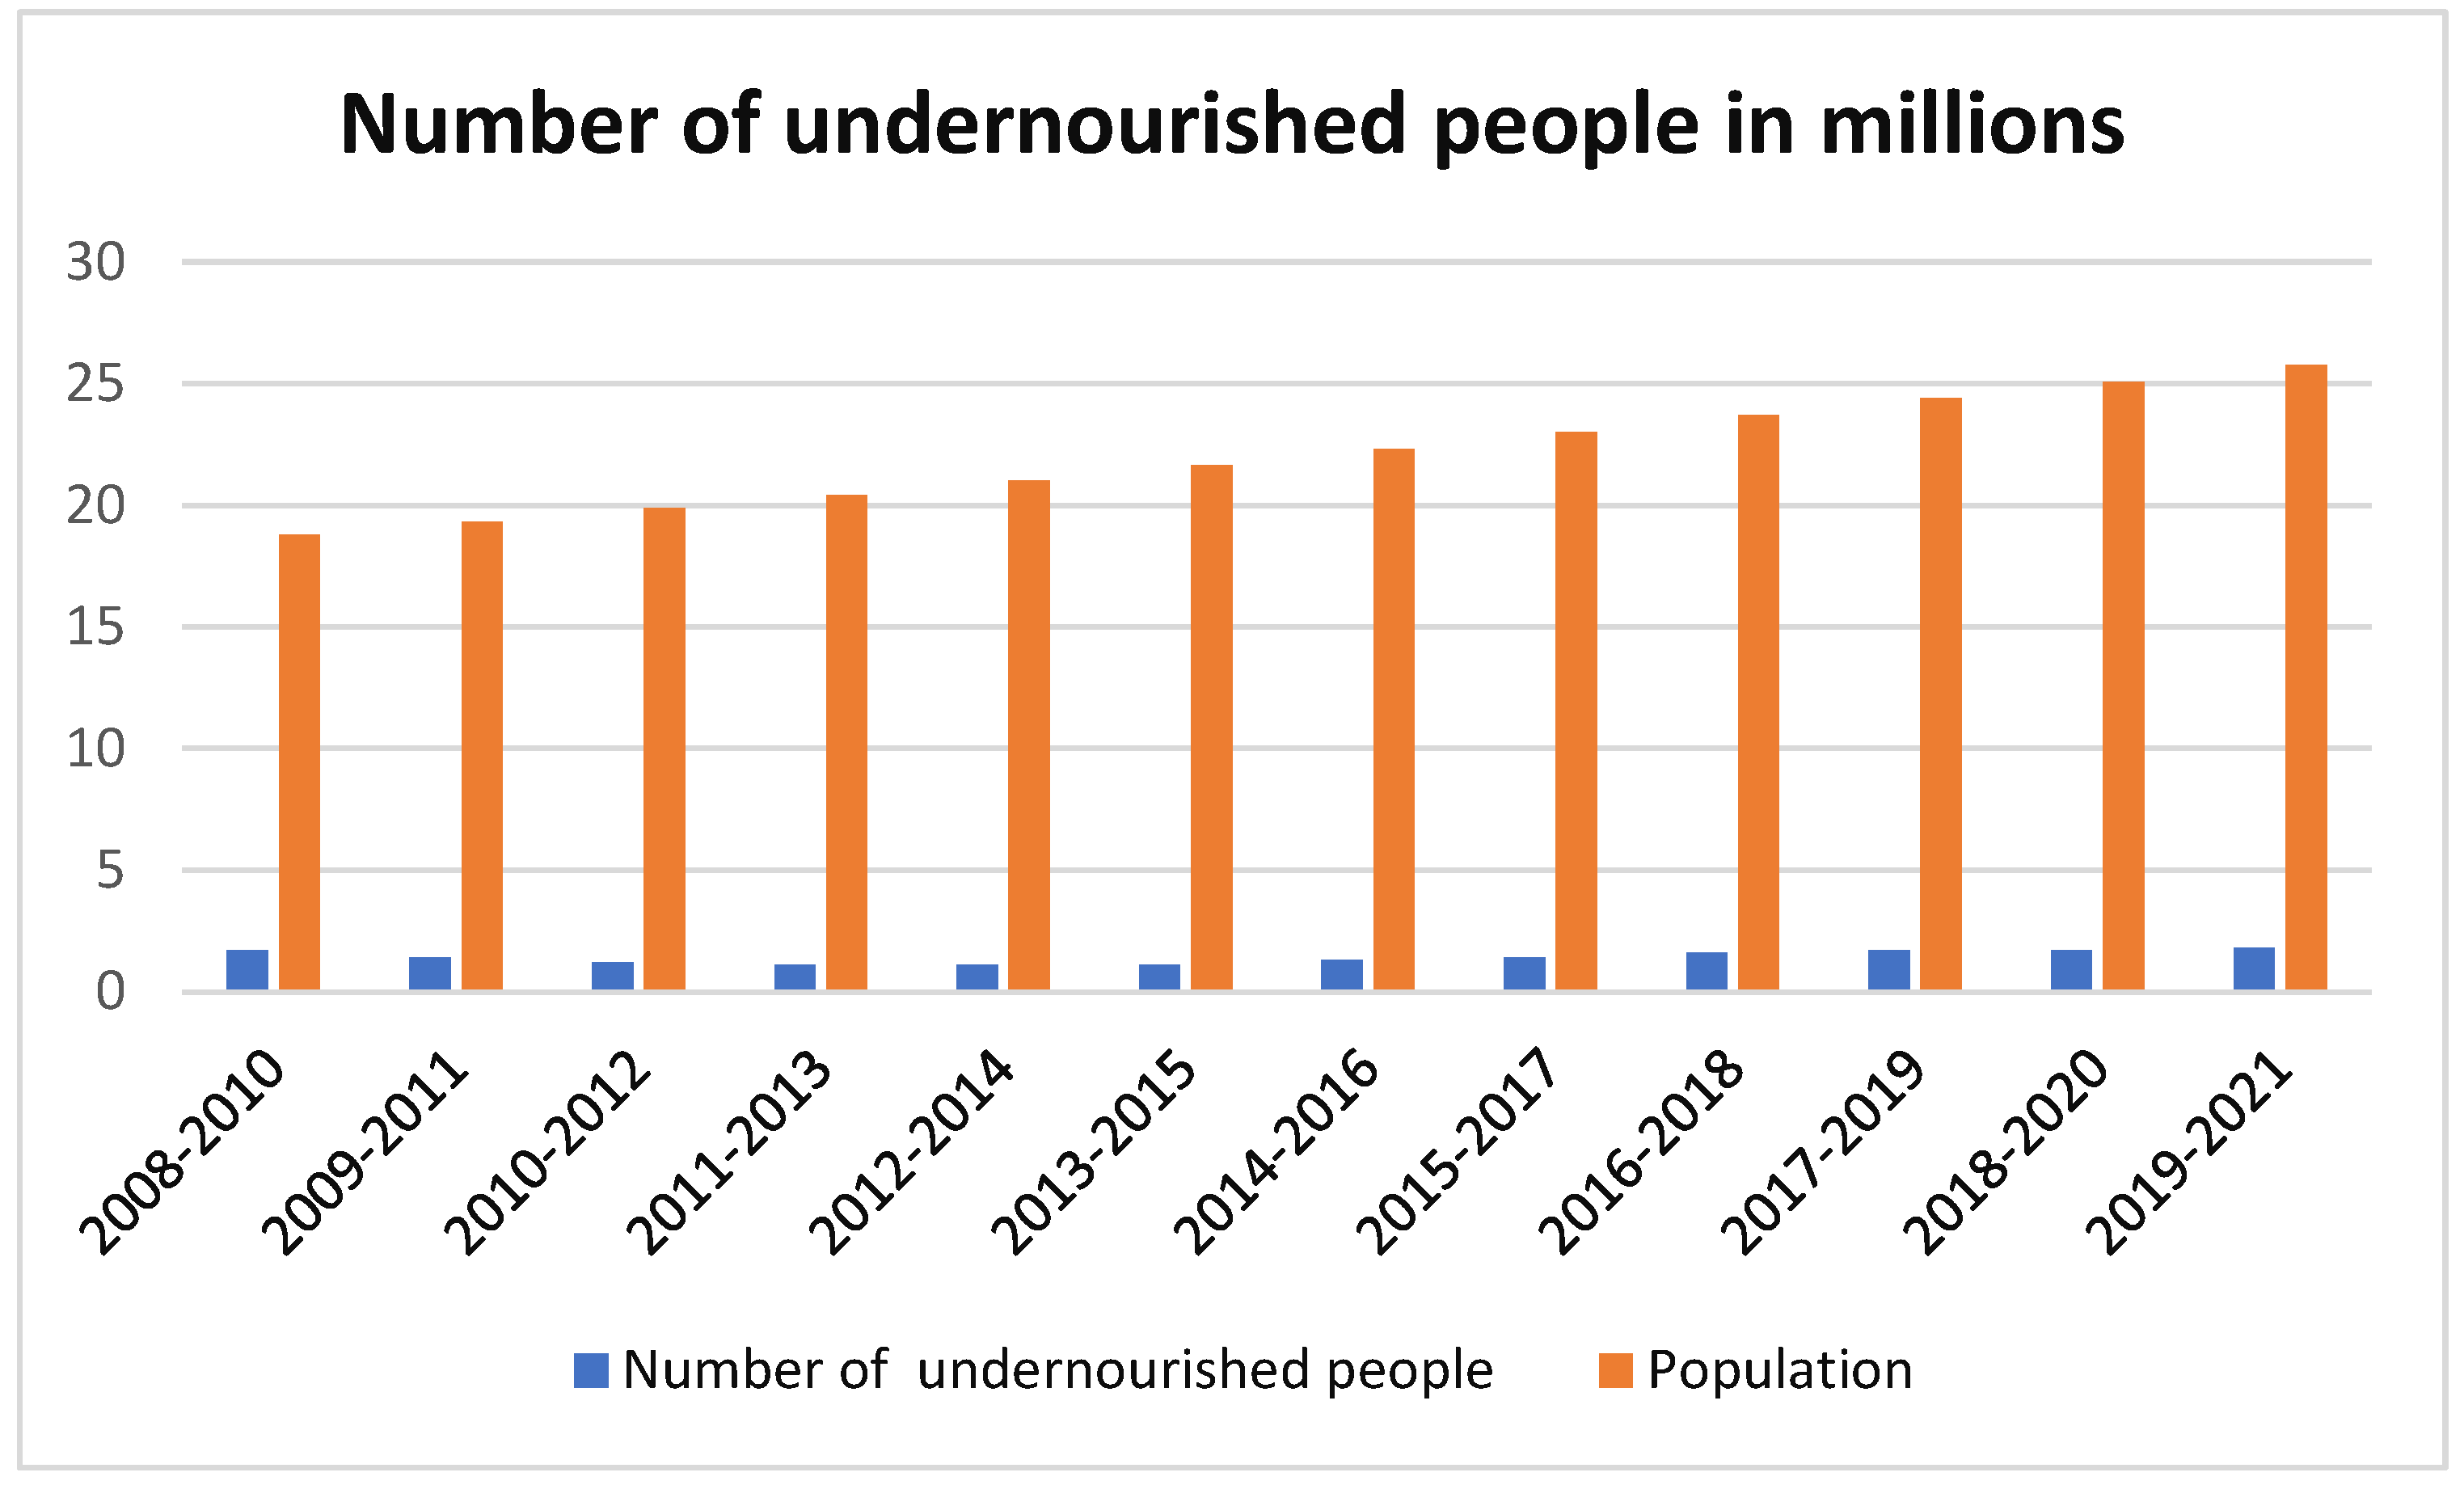
Figure 29 shows that between 2008 and 2014, the number of undernourished people declined from 1.7 million to 1.1 million, whereas between 2013 and 2021, the number of undernourished people rose from 1.1 million to 1.8 million. There are several reasons for this increase, either unemployment, or population growth not keeping pace with food availability.
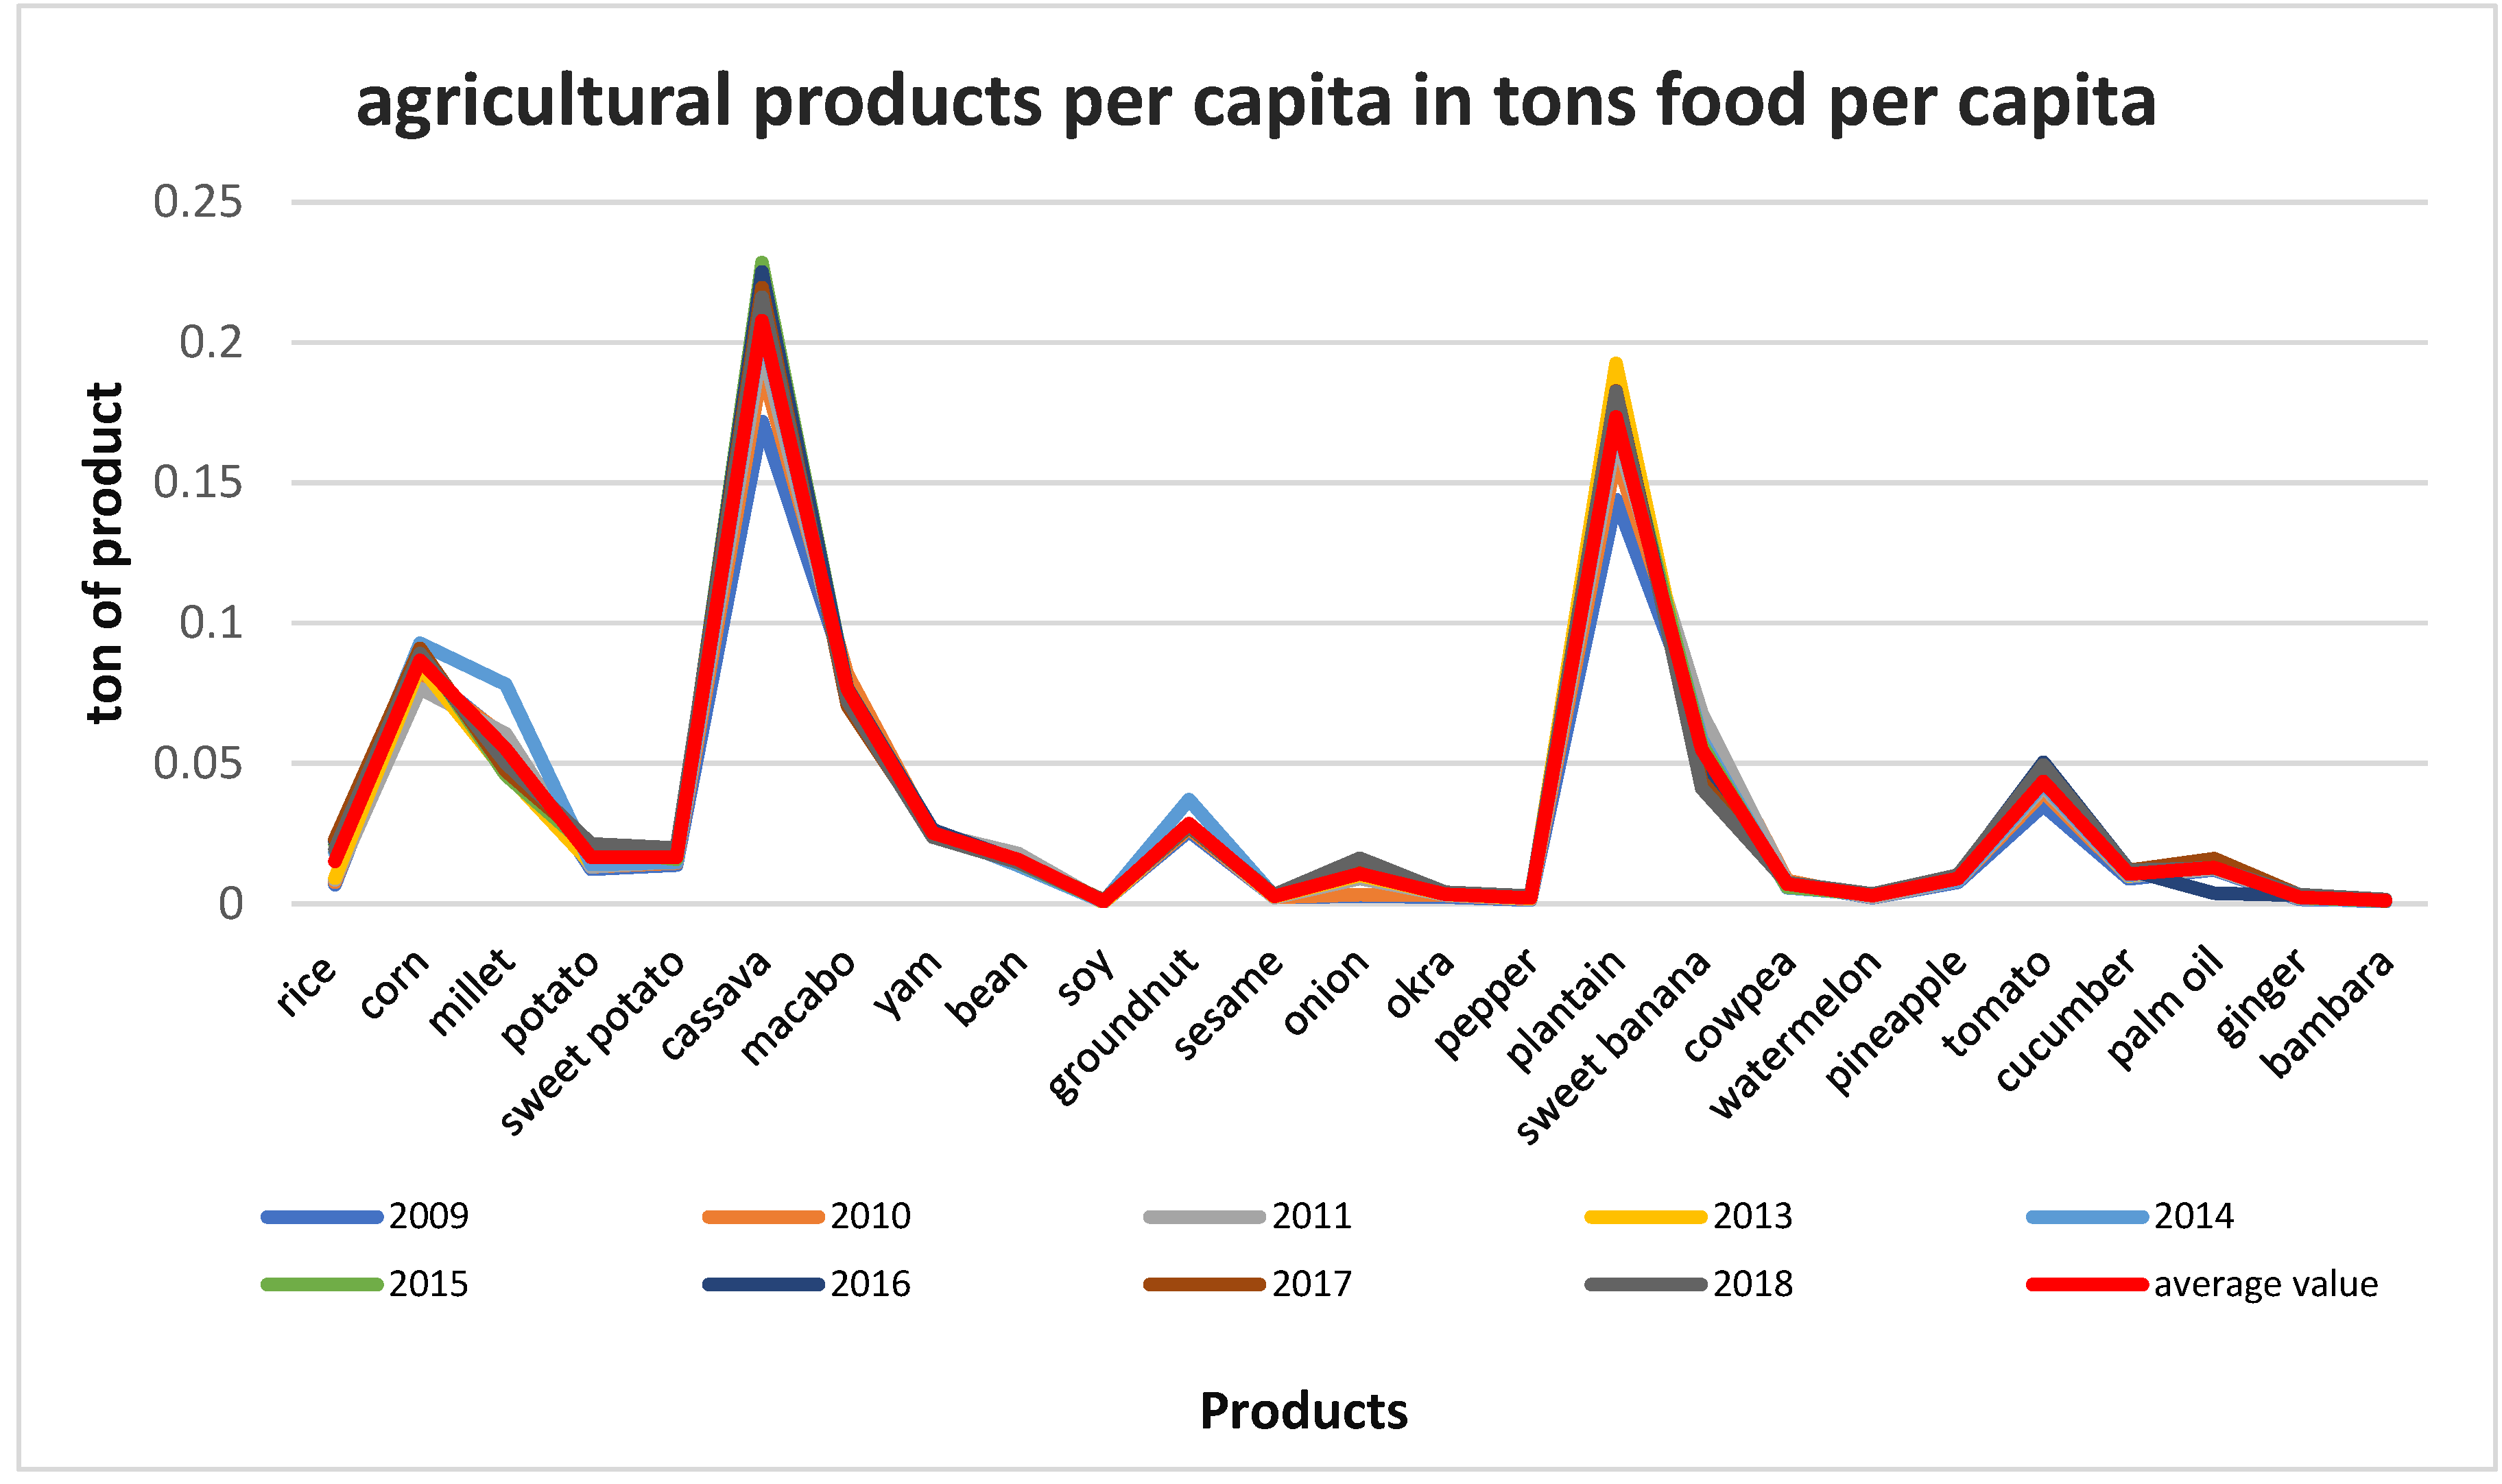
Figure 30 aims to highlight the availability of local production by food product in Cameroon in tons of product per capita. It highlights food crops that are mainly produced locally and identifies those that are more dependent on imports. Cassava (0.21 tons per capita), on average, is heavily produced locally with high per capita availability, reflecting its importance as a staple food crop in the country. Locally produced rice averages 0.02 tons per capita, with very low local availability, which may indicate increased dependence on imports of this food crop. Corn (0.09 tons per capita) and millet (0.06 tons per capita), on the other hand, seem to be produced more locally, with moderate availability per capita compared with other crops. It should be noted that other factors such as real demand (domestic and foreign) and consumption can also influence the availability of agricultural products in the country.
An analysis of
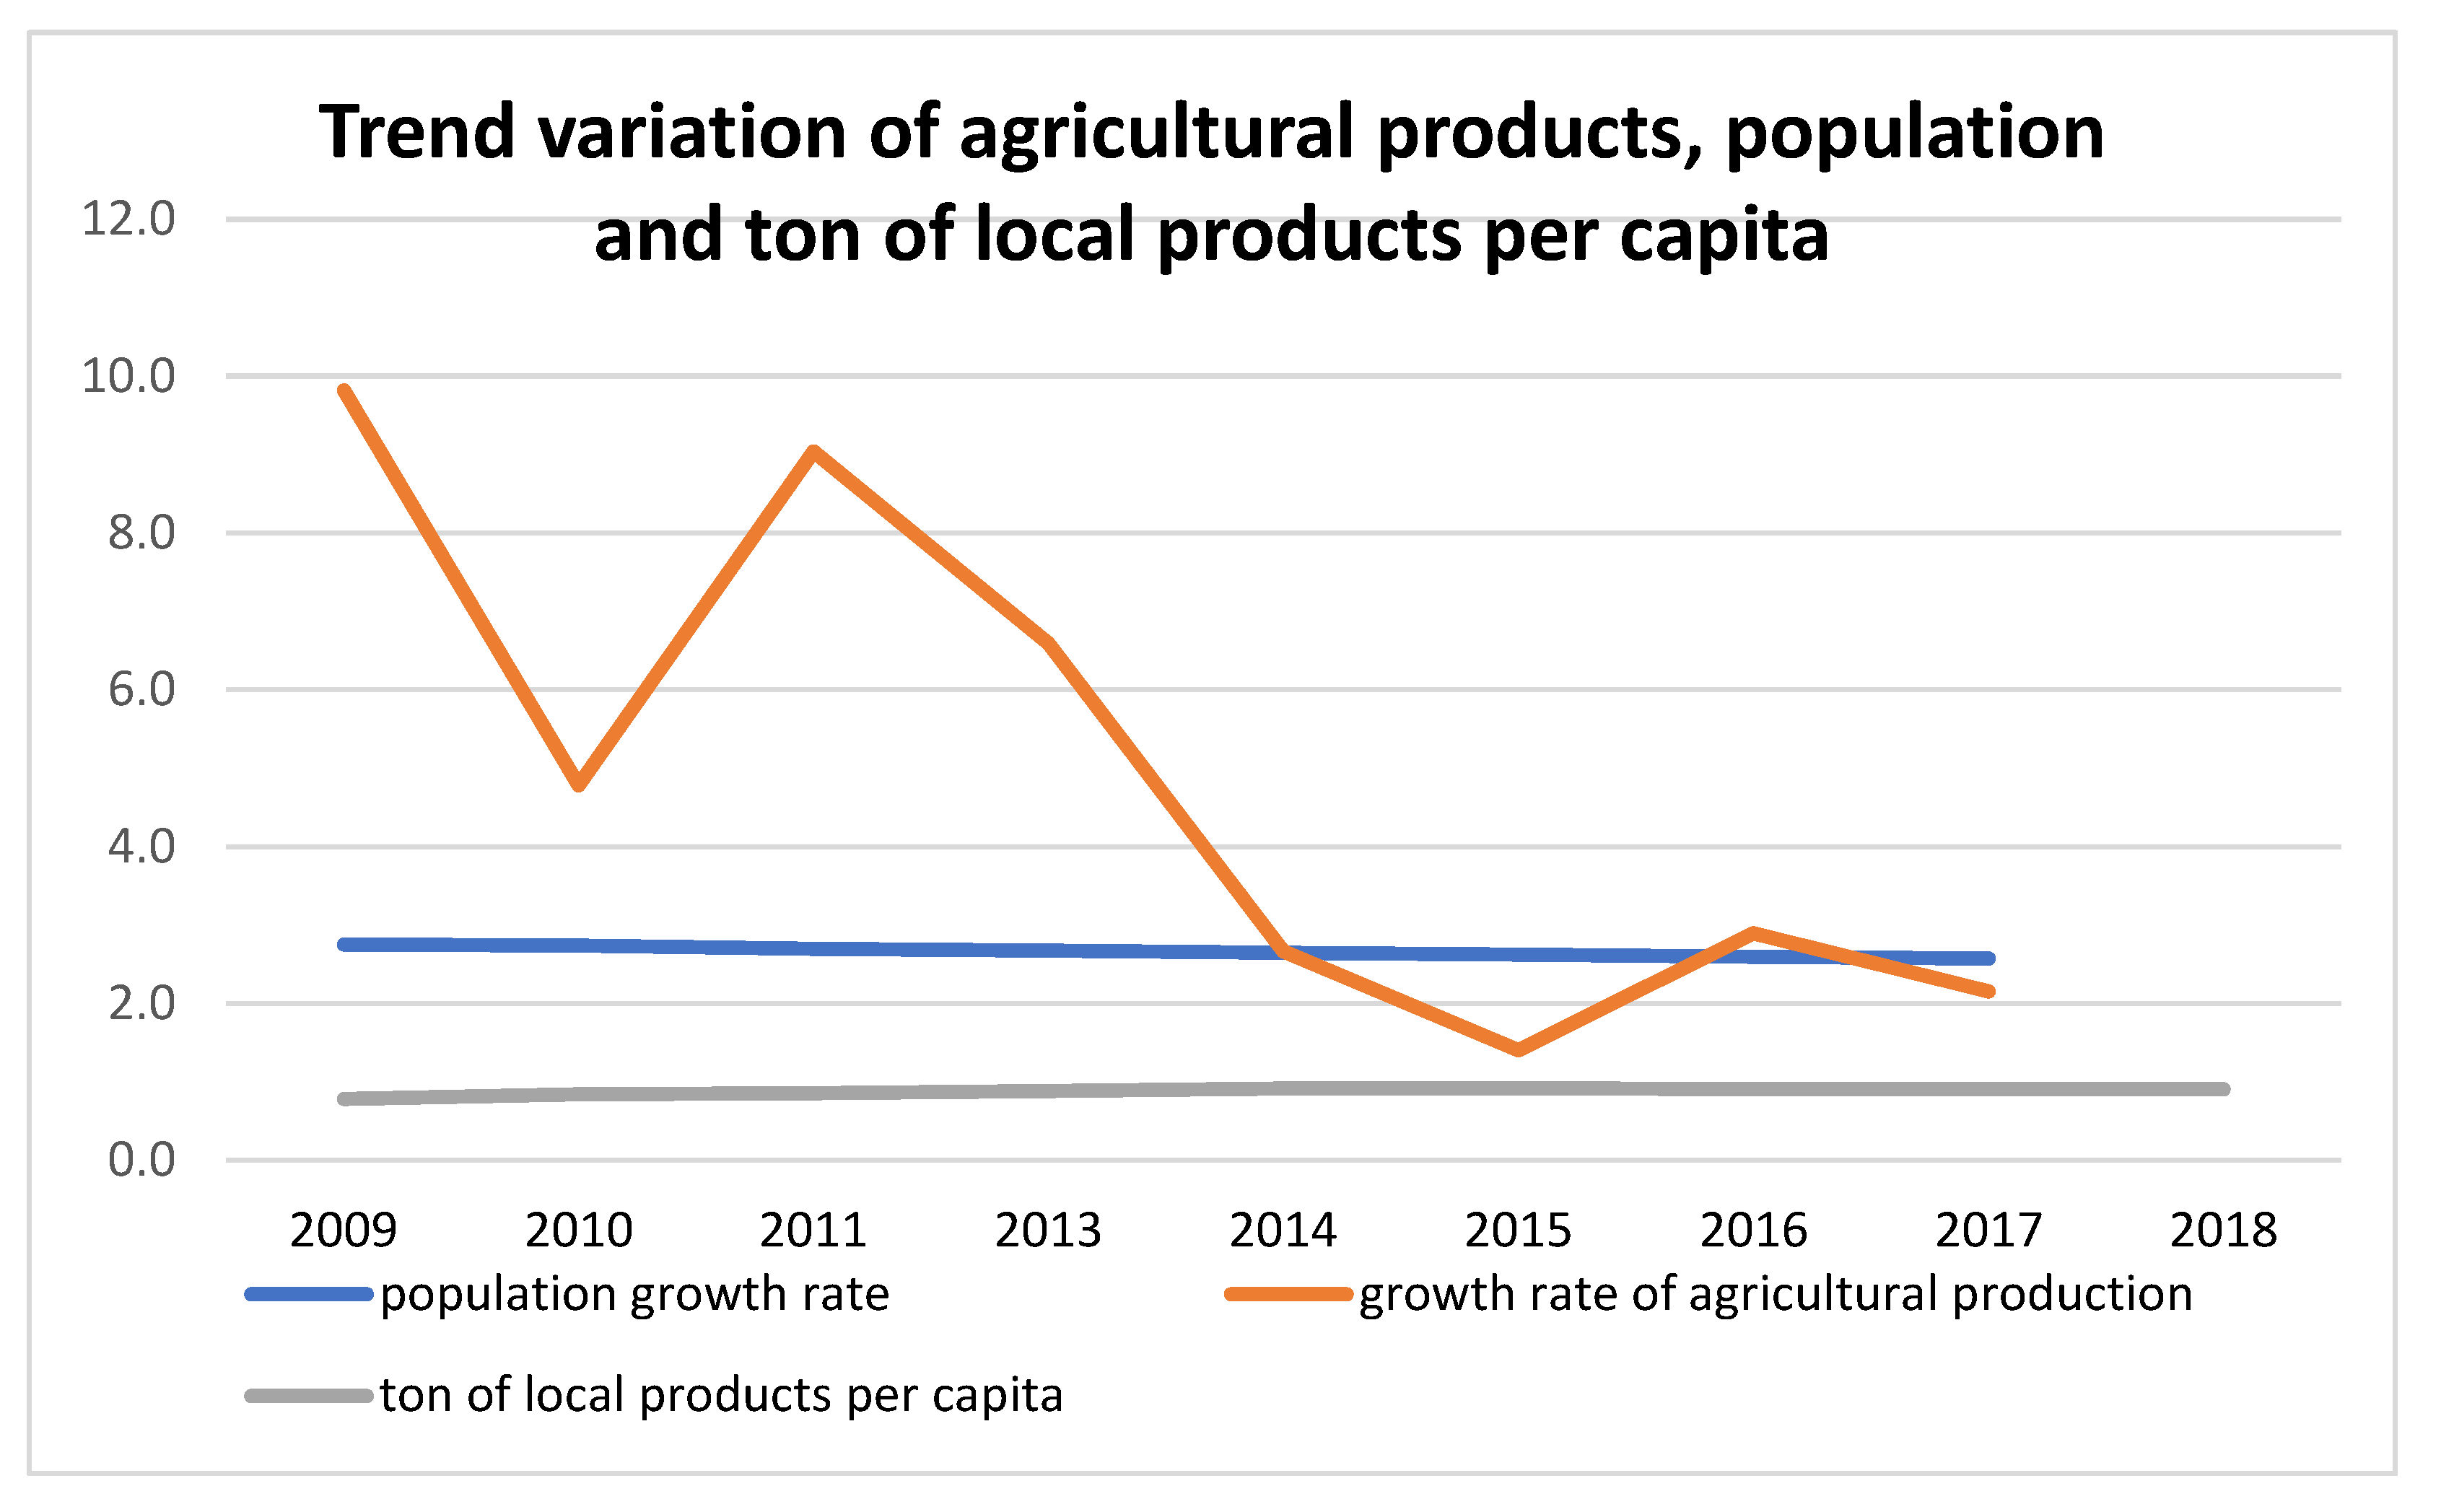
Figure 31 shows several interesting trends in population, production and capital income. The population growth rate has been declining over the years, from 2.8 in 2010 to 2.6 in 2018. The decline in agricultural production, lower investment, deteriorating infrastructure, increased security spending and loss of investor confidence are all significant factors in the observed demographic downturn. Agricultural production, for its part, is rather volatile, but there is a general downward trend from 9.8% in 2010 to 2.2% in 2018. The agricultural sector is impacted by many factors, such as environmental changes and economic difficulties. In addition, the displacement of farming populations due to conflict has forced many people to flee their farmland. This has led to a reduction in the available agricultural labor force and a drop in agricultural production. The destruction of agricultural infrastructure such as irrigation systems, storage warehouses and equipment damaged or destroyed during the conflicts, have hampered farmers' ability to cultivate and harvest their crops. The disruption of supply chains, such as roads and transport routes affected by conflict, make it difficult to transport agricultural produce to market. These consequences have led to a decline in agricultural production in conflict-affected regions of Cameroon. Agriculture, an essential pillar of the Cameroonian economy, has been severely affected. Per capita food availability remained relatively stable throughout the period, with a constant value of 0.9 tons of food per capita. This suggests that despite fluctuating production, per capita product availability remains constant. As a result, population growth has slowed over the period under review, while agricultural production has shown a downward trend. However, per capita product availability remains relatively stable. These trends may indicate a potential need to invest in sustainable and efficient agricultural practices to meet the needs of a growing population.
5.8. Recommendation
To stimulate the local economy and contribute to sustainable agriculture, it is strongly recommended to:
Invest in local agriculture: It is important to promote investment in local agriculture by providing financial, technical and logistical support to farmers. This will encourage increased local production and reduce dependence on imports.
Improving access to agricultural resources and infrastructure: It is essential to provide farmers with adequate access to land, water, quality seeds and modern agricultural technologies. Improving agricultural infrastructure, including rural roads and irrigation systems, will also facilitate the transport and marketing of produce.
Building farmers' capacities: By offering training and coaching programs to farmers, we help them improve their skills in farm management, cultivation techniques, pest management and sustainable practices. This will help increase crop productivity and quality.
Encourage crop diversification: Promoting crop diversification can help reduce over-reliance on certain crops and broaden the availability of local food products. This will contribute to food security by offering a wider variety of foods.
Encourage partnerships between players in the agricultural sector: Collaboration between farmers, research institutions, government agencies and non-governmental organizations is essential to share knowledge, technologies and best practices.
Invest in storage and processing infrastructure: Providing adequate storage and processing facilities will help to reduce post-harvest losses and add value to agricultural products while generating local added value.
Promote local consumption: Raising consumer awareness of the importance of supporting local food products and encouraging programs to promote local consumption can stimulate domestic demand and strengthen local agricultural markets.
The use of irrigation systems powered by renewable energies can save water and maximize irrigation efficiency, as well as being used to treat agricultural waste and produce biogas, drying crops and reducing greenhouse gas emissions. Renewable energies offer sustainable, economical and environmentally-friendly solutions for agricultural production in Cameroon. They improve productivity, reduce costs and help preserve natural resources. By implementing these recommendations and suggestions, it will be possible to boost local agricultural production, reduce dependence on imports and strengthen food security in Cameroon. However, it is important to note that these measures must be supported by appropriate policies, targeted investments and the active participation of all players in the agricultural value chain.
6. Conclusions
A research approach aimed at quantifying, on the one hand, the contribution of each element of the energy-water-waste-land nexus to agricultural production and, on the other hand, a qualitative analysis of commodities and non-commodities by region was carried out, based on approaches and models applied in the literature. These analyses have produced a number of results, the main ones being as follows:
The proportion of energy used in agriculture that comes from fossil fuels is 85%. Its average contribution is 0.42% in the agricultural production sector, which is beneficial to the ecobalance of the agricultural sector.
67.88% of total water abstraction is used for agricultural purposes. This has remained constant throughout the study period. The sector is managed in a sustainable manner and guarantees long-term preservation of the resource.
The far north region has the largest harvested area (1,373,829 ha) and Adamawa (224,038 ha) the smallest. However, the Centre region (4,334,095 tons) is the leading region in terms of agricultural production, while Adamawa (915,841 tons) produces the least; the Centre, littoral and West regions are more representative of diversified agricultural production than the other regions; remarkable yields such as manioc (79. 60t/ha, larger) in the southwest are better than in the north (10.4t/ha, smaller), yam (47.7t/ha, larger) in the center is better than (10.8t/ha, smaller) in the west, pineapple (66t/ha, larger) in the southwest are better than (0.11t/ha, smaller) in Adamawa.
The agriculture sector is growing at a slower pace, with more than half the population (11.6 million out of 23 million in 2009 to 14.8 million out of 26.5 million 2018) food insecure and 1.7 million malnourished over the study period. Further analysis of comparative figures and specific factors would be required to draw more robust conclusions and consider structural measures to be taken.
Funding
This study did not receive funding from any person or institution.
Data Availability Statement
The data used are included in article trough the supplementary material referenced in article.
Conflicts of Interest
The authors declare that there are no conflicts of interest with each other or with any person or institution.
References
- Endo, I.T. (2017.). A review of the current state of research on the water, energy, and food nexus. Journal of Hydrology: Regional Studies,, vol. 11,, 20-30.
- Purwanto, J.S. (2021). Water-energy-food nexus: Critical review, practical applications, and prospects for future research. Sustainability, 13, 1919.
- Ahmad, S., Jia, H., Chen, Z., Li, Q., & Xu, C. (2020). Water-energy link and energy efficiency: a systematic analysis of urban water systems. Renew. Sust. Energy, 134. [CrossRef]
- AIE. (2021). Energy Statistics Data Browser - Cameroon Balances 2019, International Energy Agency, October 2021. Available online: https://fr.wikipedia.org/wiki/%C3%89nergie_au_Cameroun.
- Alexandratos, N.B. (2012). World agriculture towards 2030/2050: the 2012 revision. (Food and Agriculture Organization of the United Nations). [CrossRef]
- Alhowaish, A. (2015). Location Quotient Technique and Economy Analysis of Regions: Tabuk Province of Saudi bArabia as a Case Study. 4, 1756–1761.
- Ali, S., & Akbar, M. (2021). Solar Irrigation in Pakistan: A Situation Analysis Report. international water management institute, 35.
- ASAE. (2005). Annual Meeting. American Society of Agricultural and Biological Engineers, St. Joseph, Michigan, 056128. doi:(doi: 10.13031/2013.19579) @2005. [CrossRef]
- BAD. (2022). Cameroon-programme d'appui au renforcement de la production agricole-project evaluation report. Available online: www.afdb.org/fr/documents/cameroun.
- Berawi, M. e. (2017). Producing Alternative Concept for the Transsumatera Toll Road Project Development using Location Quotient Method. Procedia Engineering 171, 265–273.
- Billings, S. &. (2012). The location quotient as an estimator of industrial concentration. Regional Science and Urban Economics, 42, 642–647. http://dx.doi.org/10.1016/j.regsciurbeco.2012.03.003. [CrossRef]
- Brantingham, P. &. (1998). Mapping crime for analytic purposes: location quotients, counts and rates. Crime mapping and crime prevention, 8, 263–288.
- Brodsky, H. &. (1977). Measuring the Urban Economic Base in a Developing Country. 53, 445-454. Available online: http://www.jstor.org/stable/3145988.
- Chiang, S. (2009). Location quotient and trade. Annals of Regional Science 43, 399–414.
- CIRAD. (2020). La traction animale au Nord-Cameroun: historique, état de la pratique,enjeux pour le développement. Available online: https:agritrop.cirad.fr/512219/1/ID512219.
- Claudia Ringler, .. A. (2013). The nexus across water, energy, land and food (WELF): potential for improved resource use efficiency? Current Opinion in Environmental Sustainability 5, 617-624. [CrossRef]
- D. J. Garcia et F. You. (2016). The water-energy-food nexus and process systems engineering: A new focus. Computers & Chemical Engineering, , 27, 49-67.
- Dalstein, F., & Naqvi, A. (2022). Decoupling water withdrawals in the 21st century: a path to a more water-efficient world? Water resources. Écon. 38. [CrossRef]
- Daniel J, .. G. (2019). Considering agricultural wastes and ecosystem services in Food-Energy-Water-Waste Nexus system design. Journal of Cleaner Production, 228, 941-95. [CrossRef]
- D'Odorico, P., Carr, J.L., Ridolfi, L., & Vandoni, S. (2014). feeging humanity through global food trade. lands of the future, 2(458 469.). [CrossRef]
- electricity, C.-C. (2021). countryeconomy.com. Available online: https://en.countryeconomy.com/energy-and-environment/electricity-consumption/cameroon.
- FAO. (2014.). The water-energy-food nexus: A new approach in support of food security and sustainable agriculture. he Food and Agricultural Organisation of the United Nations.
- FAO. (2016). the United Nations FAOSTAT (2016) Food and Agriculture Organization of the United Nations. Available online: http://faostat.fao.org/site/291/default.aspx.
- FAO. (2017). Water for sustainable food and agriculture, a report produced for the German presidency of the G20a. Available online: https://www.fao.org/3/i7959e/i7959e.pdf.
- FAO. (2022, october 11). A story of empty plates. Available online: https://www.fao.org/interactive/state of food security nutrition/fr.
- FAO. (2023, september). FAO-AQUASTAT (2016) Food and Agriculture Organization of the United Nations. Available online: Available: http://www.fao.org/nr/water/aquastat/data/query/index.html?lang=en.
- Faranak Karamian, A. (2021). The water-energy-food nexus in farming: Managerial insights for a more efficient consumption of agricultural inputs. Sustainable Production and Consumption 27, 1357-1371. [CrossRef]
- Fracasso, A.V. (2018). Estimating dynamic localization economies: the inadvertent success of the specialization index and the location quotient. Regional studies, 52, 119-132.
- H. Turral, J.B. (2011). Climate change, water and food security. Food and agriculture. Food and agriculture organization of the United nations (FAO),(No. 36).
- Hendayana, R. (2003). Aplikasi metode location quotient (LQ) dalam penentuan komoditas unggulan nasional. Informatika Pertanian 12, 1-21. http://www.litbang.pertanian.go.id/wartaip/pdf-file/rahmadi-12.pdf.
- Hoff, H. (2011). Understanding the Nexus. Available online: Available online: https://policycommons.net/artifacts/1359033/understanding-thenexus/.
- El Gafy, N.G. (2017). Irrigation and Drainage. Dynamic behaviour of the water–food–energy Nexus: focus on crop production and consumption. 66, 19-33.
- Isserman, A. (1977). The Location Quotient Approach to Estimating Regional Economic Impacts. Journal of the American Planning Association 43, 33–41. [CrossRef]
- Iswandi, R.Y. (2016). Study of Local-Based Excellent Potency in Bombana District. IJABER, 14, 10299–10309.
- Iweh., C.D., Ayuketah., Y.J., Gyamfi., S., Tanyi., E., Effah-Donyina., E., & Diawuo., F.A. (2023). Driving the clean energy transition in Cameroun: A sustainable pathway to meet the Paris climate accord and the power supply/demand gap. Frontiers. [CrossRef]
- Juleff, L. (1993). The Implication of Export Base Theory for The Study of Advanced Producer Services(1): Location Quotient Analysis,. Napier University, Department of Industrial and Social Studies.
- Karnie. (2017). A Quantitative Assessment Framework for Water, Energy and Food Nexus. Computational Water, Energy, and Environmental Engineering 6, 11-23. http://www.scirp.org/journal/PaperInformation.aspx?PaperID=72359&#abstract.
- Karsinah KARSİNAH, P. (2016). The Profile of Pekalongan as a Center of Economic Growth at Tangkallangka Strategic Areas. International Journal of Economics and Financial Issues 6, 105 - 109.
- Karsinah, K. e. (2016). The Profile of Pekalongan as a Center of Economic Growth at Tangkallangka Strategic Areas. 6(table1), 105-109.
- KNOEMA. (n.d.). Cameroun-knoema.com. Available online: https://knoema.fr/CAMAP2018/production-agricole-du-cameroun.
- L. Bizikova, D.R. (2013). The water-energy-food security nexus: Towards a practical planning and decision-support framework for landscape investment and risk management,» . International Institute for Sustainable Development 16-20.
- Ladha Sabur, A., Bakalis, S., & Fryer, P.L. Q. (2019). Mapping energy consumption in food manufacturing. The trends. Food science and technology 86(270 280).
- Leigh, R. (1970). The Use of Location Quotients in Urban Economic Base Studies. Land Economics 46, 202–205.
- Li, H.Z. (2020). A review of the energy-water nexus: concepts, lines of research, mechanisms and methodologies. Son. Energy Environ. 9, 358.
- Mateo-Sagasta, J.R.-S. (2015). Global wastewater and sludge production, treatment and use .Wastewater. Economic asset in an urbanizing world, 15-38.
- Meng, F.L. (2019). A critical examination of the energy-carbon nexus in cities. Energy 171, 1017–1032.
- Miller MM, G.L. (1991). Location quotient: a basic tool for economicevelopment analysis. Economic development review 2, 9. Available online: http://search.proquest.com/openview/d6011b83d027b7ad1dba29bb96b74a53/1.pdf?pq-origsite=gscholar&cbl=38209.
- Morrissey, K. (2016.). A location quotient approach to producing regional production multipliers for the Irish economy. Papers in Regional Science 95, 491-506. [CrossRef]
- Pemi, B., Njomo, D., Tchinda, R., Seutche, J., Kamta Legue, D., Babikir, M., & Chara-Dackou, V. (2023). Modeling and Quantitative Analysis in the Energy–Food–Water–Waste Nexus (EF2W): Case Study in Cameroon. Sustainability 15. [CrossRef]
- Purwanto. (2017). A. ECONOMIC BASE ANALYSIS OF WATER, ENERGY, AND FOOD RELATED SECTORS: A CASE OF WEST JAVA PROVINCE ANALISIS BASIS EKONOMI SEKTOR TERKAIT AIR, ENERGI, DAN PANGAN: STUDI KASUS PROVINSI JAWA BARAT. CR Journal, 03, 73-90.
- R. N. D. Ferroukhi, A.L.-P. (2015). Renewable Energy in the Water, Energy and Food Nexus. International Renewable Energy Agency: Abu Dhabi, United Arab Emirates.,.
- Richardson, H. (1985). Input-Output and Economic Base Multipliers: Looking Backward and Forward. Journal of Regional Science, 25, 607-661.
- S. J. Kenway, P.A. (2011). Water Science and Technology, 63, 1983-1990.
- S. J. Kenway, P.A. (2011). The connection between water and energy in cities: a review. Water Science and Technology, vol. 63,(9), 1983-1990.
- Songhua Huan, X.L. (2023, juillet). Network modeling and stability improvement of the water-energy-fertilizer-food nexus flows based on global agricultural trade. Sustainable Production and Consumption, 39, 480-494. [CrossRef]
- Sun, C.Y. (2021). efficiency and spatial correlation characteristics of the water-energy-food nexus in China. Resources Conserve Recycle, 105151.
- Sun, L.N. (2022). Integrated assessment of the sustainable water-energy-food nexus in China: case studies on multiple regional sustainability and multi-sector synergyJ. Nettoyer. Prod, 334, 130235. Available online: https://doi.org/10.1016/j.jclepro.2021.130235.
- Suyatno. (2000). Analisa Economic Base Terhadap Pertumbuhan Ekonomi Daerah Tingkat II Wonogiri. Menghadapi Implementasi UU No 22/1999 dan UU No. 5/1999.
- SWITCH Asia. (2022b). Indicateur régional et base de données sur l’efficacité des ressources en Asie. Récupéré de :. Dans : Gheewala, SH, Ghani, HU, Nilsalab, P. Farooq, A., Akbar, H., Gazal, AA.
- Tabatabaie, S.M. (2021). Development of an input-output model for the link between food, energy and water in the Pacific Northwest, USA. Resource Conserve Recycle, 168, 105267. [CrossRef]
- Tian, T.S. (2016). Multi-sensor information fusion estimators for stochastic uncertain systems with correlated noises. Information Fusion, 27, 126-137.
- Trappey, A. &. (2013). Location Quotient EIO LCA Method for Carbon Emission Analysis. 1081–1092. http://link.springer.com/10.1007/978-1-4471-4426-7.
- Walsh, G. (2018). Biopharmaceutical benchmarks 2018. Nature biotechnology 36, 1136-1145.
- Wang, X. &. (2008). Research Methods in Urban and Regional Planning, Tsinghua University Press. Springer Science & Business Media.
- World-Bank. (2022). Towards a green and resilient future for Cameroonians. Available online: www.banquemondiale.org.
- Zhang, X. &. (2016). makers., nergy-water nexus: Balancing the tradeoffs between two-level decision. E Applied energy, 183, 77-87.
Figure 1.
Elements of the energy-water-waste-land nexus for agricultural production.
Figure 1.
Elements of the energy-water-waste-land nexus for agricultural production.
Figure 2.
Proportion of energy consumption in the agricultural production sector from 2009 to 2012.
Figure 2.
Proportion of energy consumption in the agricultural production sector from 2009 to 2012.
Figure 3.
Proportion of energy use in the agricultural production sector from 2013 to 2016.
Figure 3.
Proportion of energy use in the agricultural production sector from 2013 to 2016.
Figure 4.
Proportion of energy use in the agricultural production sector from 2017 to 2020.
Figure 4.
Proportion of energy use in the agricultural production sector from 2017 to 2020.
Figure 5.
proportion of energy consumed by agriculture to total energy consumed in toe.
Figure 5.
proportion of energy consumed by agriculture to total energy consumed in toe.
Figure 6.
Water withdrawal in giga cubic meters.
Figure 6.
Water withdrawal in giga cubic meters.
Figure 7.
Irrigated land area in 1000 hectares.
Figure 7.
Irrigated land area in 1000 hectares.
Figure 8.
Percentage of water withdrawal.
Figure 8.
Percentage of water withdrawal.
Figure 9.
Agricultural and Animal Waste Products, Applied to Farmland as Fertilizer.
Figure 9.
Agricultural and Animal Waste Products, Applied to Farmland as Fertilizer.
Figure 10.
Average production yield by region and product in t/ha.
Figure 10.
Average production yield by region and product in t/ha.
Figure 11.
Average yield by region and product in t/ha.
Figure 11.
Average yield by region and product in t/ha.
Figure 12.
Rate of change in agricultural land area 2009, 2010, 2011 in hectares in (ha).
Figure 12.
Rate of change in agricultural land area 2009, 2010, 2011 in hectares in (ha).
Figure 13.
Agricultural production and rate of change agricultural production years 2009, 2010, 2011 in hectare in (ha).
Figure 13.
Agricultural production and rate of change agricultural production years 2009, 2010, 2011 in hectare in (ha).
Figure 14.
Agricultural area and rate of change agricultural land area years 2013, 2014, 2015 in hectare in (ha).
Figure 14.
Agricultural area and rate of change agricultural land area years 2013, 2014, 2015 in hectare in (ha).
Figure 15.
Agricultural production and rate of change agricultural production years 2013, 2014, 2015 in hectare in (ha).
Figure 15.
Agricultural production and rate of change agricultural production years 2013, 2014, 2015 in hectare in (ha).
Figure 16.
Agricultural area and rate of change agricultural land area years 2016, 2017, 2085 in hectare in (ha).
Figure 16.
Agricultural area and rate of change agricultural land area years 2016, 2017, 2085 in hectare in (ha).
Figure 17.
Agricultural production and rate of change agricultural production years 2016, 2017, 2018 in hectare in (ha).
Figure 17.
Agricultural production and rate of change agricultural production years 2016, 2017, 2018 in hectare in (ha).
Figure 18.
Competitive position of main products on average from 2009 to 2018 in the Adamawa region.
Figure 18.
Competitive position of main products on average from 2009 to 2018 in the Adamawa region.
Figure 19.
Competitive position of main products on average from 2009 to 2018 in the East region.
Figure 19.
Competitive position of main products on average from 2009 to 2018 in the East region.
Figure 20.
Competitive position of main products on average from 2009 to 2018 in the Far North region.
Figure 20.
Competitive position of main products on average from 2009 to 2018 in the Far North region.
Figure 21.
Competitive position of main products on average from 2009 to 2018 in the Centre region.
Figure 21.
Competitive position of main products on average from 2009 to 2018 in the Centre region.
Figure 22.
Competitive position of the main products on average from 2009 to 2018 in the coastal region.
Figure 22.
Competitive position of the main products on average from 2009 to 2018 in the coastal region.
Figure 23.
Competitive position of main products on average from 2009 to 2018 in the North region.
Figure 23.
Competitive position of main products on average from 2009 to 2018 in the North region.
Figure 24.
Competitive position of the main medium-sized products from 2009 to 2018 in the Northwest region.
Figure 24.
Competitive position of the main medium-sized products from 2009 to 2018 in the Northwest region.
Figure 25.
Competitive position of main medium-sized products from 2009 to 2018 in the West region.
Figure 25.
Competitive position of main medium-sized products from 2009 to 2018 in the West region.
Figure 26.
Competitive position of main medium-sized products from 2009 to 2018 in the South region.
Figure 26.
Competitive position of main medium-sized products from 2009 to 2018 in the South region.
Figure 27.
Competitive position of the main medium-sized products from 2009 to 2018 in the Southwest region.
Figure 27.
Competitive position of the main medium-sized products from 2009 to 2018 in the Southwest region.
Figure 28.
Number of food-insecure people in millions.
Figure 28.
Number of food-insecure people in millions.
Figure 29.
Number of undernourished people in millions.
Figure 29.
Number of undernourished people in millions.
Figure 30.
agricultural products per capita in tons food per capita.
Figure 30.
agricultural products per capita in tons food per capita.
Figure 31.
Growth rate of population, agricultural production and product per capita (in tons per capita).
Figure 31.
Growth rate of population, agricultural production and product per capita (in tons per capita).
Table 1.
Energy consumption by agricultural production in tonnes of oil equivalent.
Table 1.
Energy consumption by agricultural production in tonnes of oil equivalent.
| year |
2009 |
2010 |
2011 |
2012 |
2013 |
2014 |
2015 |
2016 |
2017 |
2018 |
2019 |
2020 |
|
8645.3 |
9230.12 |
9627.97 |
9517.5 |
9852.24 |
10549 |
9081.52 |
9350.09 |
9678.84 |
9969.61 |
9853.6 |
9853.64 |
|
4843.67 |
4746.52 |
4940.82 |
5162.88 |
5440.45 |
5759.7 |
6953.24 |
6967.11 |
5731.91 |
5190.64 |
5076.8 |
5076.83 |
|
6642.13 |
7096.025 |
7797.55 |
7796.86 |
7919.88 |
8657.6 |
8548.26 |
8637.46 |
7038.96 |
6435.84 |
5991.5 |
5991.49 |
|
11849.49 |
12451.79 |
12786.8 |
12999.3 |
13497.9 |
15864 |
5816.58 |
6112.2 |
6940.44 |
7774.19 |
6156.3 |
6156.273 |
|
54.04 |
54.04 |
54.048 |
54.04 |
54.043 |
54.04 |
54.04 |
54.04 |
54.04 |
54.04 |
54.04 |
54.04 |
|
4371.51 |
5142.96 |
5742.97 |
6000.12 |
6257.26 |
6685.8 |
4971.52 |
4457.23 |
5057.24 |
5400.1 |
5143 |
5142.96 |
|
36406.1 |
38721. 5 |
40950.2 |
41530.7 |
43021.7 |
47570.1 |
35578.1 |
34501.4 |
34501.4 |
34824.4 |
32275.2 |
32275.2 |
Table 2.
Agricultural production in tonnes and area in ha.
Table 2.
Agricultural production in tonnes and area in ha.
| Year |
2009 |
2010 |
2011 |
2013 |
2014 |
2015 |
2016 |
2017 |
2018 |
| Total agriculturale production() ] |
15266818 |
16765766 |
17567744 |
19155918 |
20417861 |
20961495 |
21255814 |
21871448.3 |
22342775 |
| Total area harvested (ha) |
5492937 |
5999641 |
6208182 |
6305190 |
6629460 |
7161306 |
7901028 |
7423803 |
7793055 |
Table 3.
energy intensity for agriculture in (toe/t).
Table 3.
energy intensity for agriculture in (toe/t).
| Year |
2009 |
2010 |
2011 |
2013 |
2014 |
2015 |
2016 |
2017 |
2018 |
|
36406.1 |
38721.4 |
40950.1 |
43021.7 |
47570.1 |
35425.1 |
35578.1 |
34501.4 |
34824.4 |
|
0.002384 |
0.002309 |
0.002330 |
0.002245 |
0.002329 |
0.001690 |
0.001673 |
0.001577 |
0.001558 |
Table 4.
Total harvested area by region and by year in hectares from 2009 to 2018.
Table 4.
Total harvested area by region and by year in hectares from 2009 to 2018.
| Year刘刘Region |
2009 |
2010 |
2011 |
2013 |
2014 |
2015 |
2016 |
2017 |
2018 |
| Adamawa |
232750 |
240656 |
249878 |
252120 |
242204 |
264824 |
274716 |
235376 |
224038 |
| East |
322905 |
328920 |
336516 |
405651.8 |
475310 |
426657 |
453573 |
471390 |
495511 |
| Extreme north |
1220298 |
1276581 |
1371507 |
1157857 |
1271018 |
1470350 |
1664934 |
1408657 |
1523260 |
| Center |
449188 |
518163 |
560139 |
596910.1 |
657933 |
716184 |
1008448 |
995837 |
995106 |
| Coast |
238595 |
242448 |
259672 |
300544.2 |
306602 |
332491 |
316105 |
312497 |
321274 |
| North |
731562 |
834192 |
807114 |
745242 |
557910 |
610054 |
679874 |
541357 |
727347 |
| North-west |
286843 |
323702 |
324586 |
357767.9 |
342239 |
380964 |
387061 |
420130 |
369569 |
| West |
349006 |
393337 |
408397 |
426520.1 |
466926 |
508805 |
534484 |
547221 |
590772 |
| South |
198329 |
215441 |
193458 |
239108.2 |
236628 |
247209 |
254725 |
277902 |
288668 |
| South-east |
221939 |
223614 |
255888 |
287234.9 |
395678 |
425820 |
385443 |
410245 |
310412 |
| total harvested area |
4251415 |
4597054 |
4767155 |
4768956 |
4952448 |
5383358 |
5959363 |
5620612 |
5845957 |
Table 5.
Agricultural production by region and production year in tonnes from 2009 to 2018.
Table 5.
Agricultural production by region and production year in tonnes from 2009 to 2018.
| Year刘Region |
2009 |
2010 |
2011 |
2013 |
2014 |
2015 |
2016 |
2017 |
2018 |
| Adamawa |
601239 |
653456 |
690485 |
701610.4 |
812018.3 |
837511.3 |
875211.41 |
957323.57 |
915841.6 |
| east |
2314422 |
2545175 |
2562955 |
2859342 |
3059880 |
3087826 |
3195323.2 |
3312104.3 |
3523418 |
| extreme north |
1391105 |
1532055 |
1680572 |
1420537 |
2119417 |
1695005 |
1829544.6 |
1949470.4 |
2088645 |
| Center |
3332719 |
3770770 |
3935911 |
4361647 |
4352880 |
4862870 |
4807993 |
4770443 |
4811630 |
| coast |
1571230 |
1669606 |
1778089 |
1990227 |
1802874 |
2069895 |
2056517 |
2215026 |
2252271 |
| North |
831766 |
833744 |
849444 |
1154181 |
1113217 |
911454.4 |
972090.38 |
1132636.1 |
1307307 |
| North-west |
976659 |
971479 |
1004983 |
1322290 |
1141398 |
1223768 |
1236945 |
1306051 |
1299363 |
| West |
1590528 |
1795924 |
1849424 |
1962754 |
2143938 |
2286753 |
2326221 |
2350412 |
2537870 |
| South |
1538096 |
1652719 |
1652080 |
1993770 |
1925872 |
2018704 |
2078278 |
2134095 |
2287873 |
| South-east |
1119054 |
1340838 |
1563801 |
1389560 |
1946366 |
1967709 |
1877691 |
1743887 |
1318556 |
| total Production |
15266818 |
16765766 |
17567744 |
19155918 |
20417861 |
20961496 |
21255815 |
21871448 |
22342775 |
|
Disclaimer/Publisher’s Note: The statements, opinions and data contained in all publications are solely those of the individual author(s) and contributor(s) and not of MDPI and/or the editor(s). MDPI and/or the editor(s) disclaim responsibility for any injury to people or property resulting from any ideas, methods, instructions or products referred to in the content. |
© 2023 by the authors. Licensee MDPI, Basel, Switzerland. This article is an open access article distributed under the terms and conditions of the Creative Commons Attribution (CC BY) license (http://creativecommons.org/licenses/by/4.0/).
