1. Introduction
With the gradual decrease of oil and gas from land and shallow sea, the main increment will come from deep sea in the future. Thus, floating platforms have been constructed and used. However, the deep-sea environment is harsh, and taking the South China Sea as an example, it is characterized by typhoons, internal waves, high salt corrosion, and submarine landslides, and global warming has increased the frequency of extreme environments. Extreme environmental conditions can cause the platform to exceed the design limits and lead to the destruction and shutdown of offshore oil and gas production systems. The data show that between 2001 and 2011, there were more than 20 accidents involving the safety of mooring systems around the world [
1]. It can be seen that the existing design methods of marine structures are not yet able to ensure the safety of platforms under extreme conditions, and the design methods and performance evaluation of structural systems need to be further improved. Therefore, a comprehensive dynamic performance analysis of the floating platform under mooring line failure is required.
The impact of mooring system failure on the dynamic response of various floating platforms has been studied by various researchers. Hong et al. carried out FPSO model test of mooring line failure to investigate the characteristics of motions and mooring line tension under the extreme condition [
2]. Qiao et al. analyzed the transient and steady-state responses of the FPSO under the failure of a single mooring line or two mooring lines on the ipsilateral, opposite, and adjacent sides under the 100-year hurricane [
3]. Li et al. investigated the transient response of a Spar-type floating offshore wind turbine (FOWT) with fractured mooring lines under the rated condition [
4]. Yang et al. found that the breakage of an upwind mooring line significantly affected the sway and yaw motion of FOWT, but had less effect on the aerodynamic performance and aero-elastic responses under rated and extreme conditions [
5]. Yu et al. investigated the effects of simultaneous and continuous failure of multiple tendons on TLP under the 1000-year sea state[
6]. Cheng et al. qualitatively analyzed the changes of tendons failure on motion properties and quantitatively analyzed the effects of changes in stiffness and frequency on TLP motion under different failure combinations of tendons [
7]. Zhang et al. simulated the semi-submersible Mobile Offshore Drilling Unit (MODU) response and progressive mooring line failure, in which the wind, wave, and currents were non-collinear [
8]. Stendal examined the mooring line failure for catenary and taut mooring system of the semi-submersible platform under extreme environmental conditions [
9]. Chuang et al. investigated the transient/unsteady response of a semi-submersible platform under different sea states, tension variation of the remaining lines, and evaluated the risk of risers clashing after mooring lines or risers failure [
10]. Tabeshpour and Abbasian considered four different mooring configurations of the semi-submersible platform and compared the motion response after failure of single mooring line under a severe condition for each configuration to finally determine the optimal mooring configuration [
11].
In summary, scholars have investigated the motion responses of different types of floating platforms after mooring system failure(s) in extreme marine environments. However, there are still research deficiencies for the semi-submersible platform. Firstly, the existing literatures mainly focus on the intuitive motion changes after mooring line(s) failure, and lack in-depth mechanistic studies. Secondly, the failure mode is mainly the top of the mooring line failure, and lacks the simulation of the bottom failure. Finally, there is a lack of analysis of the top and touchdown tension changes of the risers after mooring line failure and calculation of the failure probability at different zones of the riser. Therefore, to address the shortcomings of the above studies, this paper investigates the change mechanism of motion response under mooring line failure by qualitative and quantitative methods, and analyzes the effect of the residual tension of the bottom disconnecting mooring line on the motion of the platform. This paper also analyzes the tension changes in different areas of the riser before and after the mooring line failure under the 1000-year marine environment, and uses the Dezert-Smarandache theory (DSmT) to calculate the failure probability of different combinations of different areas of the riser.
This paper is structured as follows:
Section 2 introduces the theory of hydrodynamic calculations for each part of the platform system.
Section 3 presents the theory of calculating the failure probability of risers.
Section 4 analyzes the motion mechanism and tension changes of the riser before and after the mooring line failure. The primary findings and conclusions of this study are presented in
Section 5.
2. Numerical model
2.1. Hull model
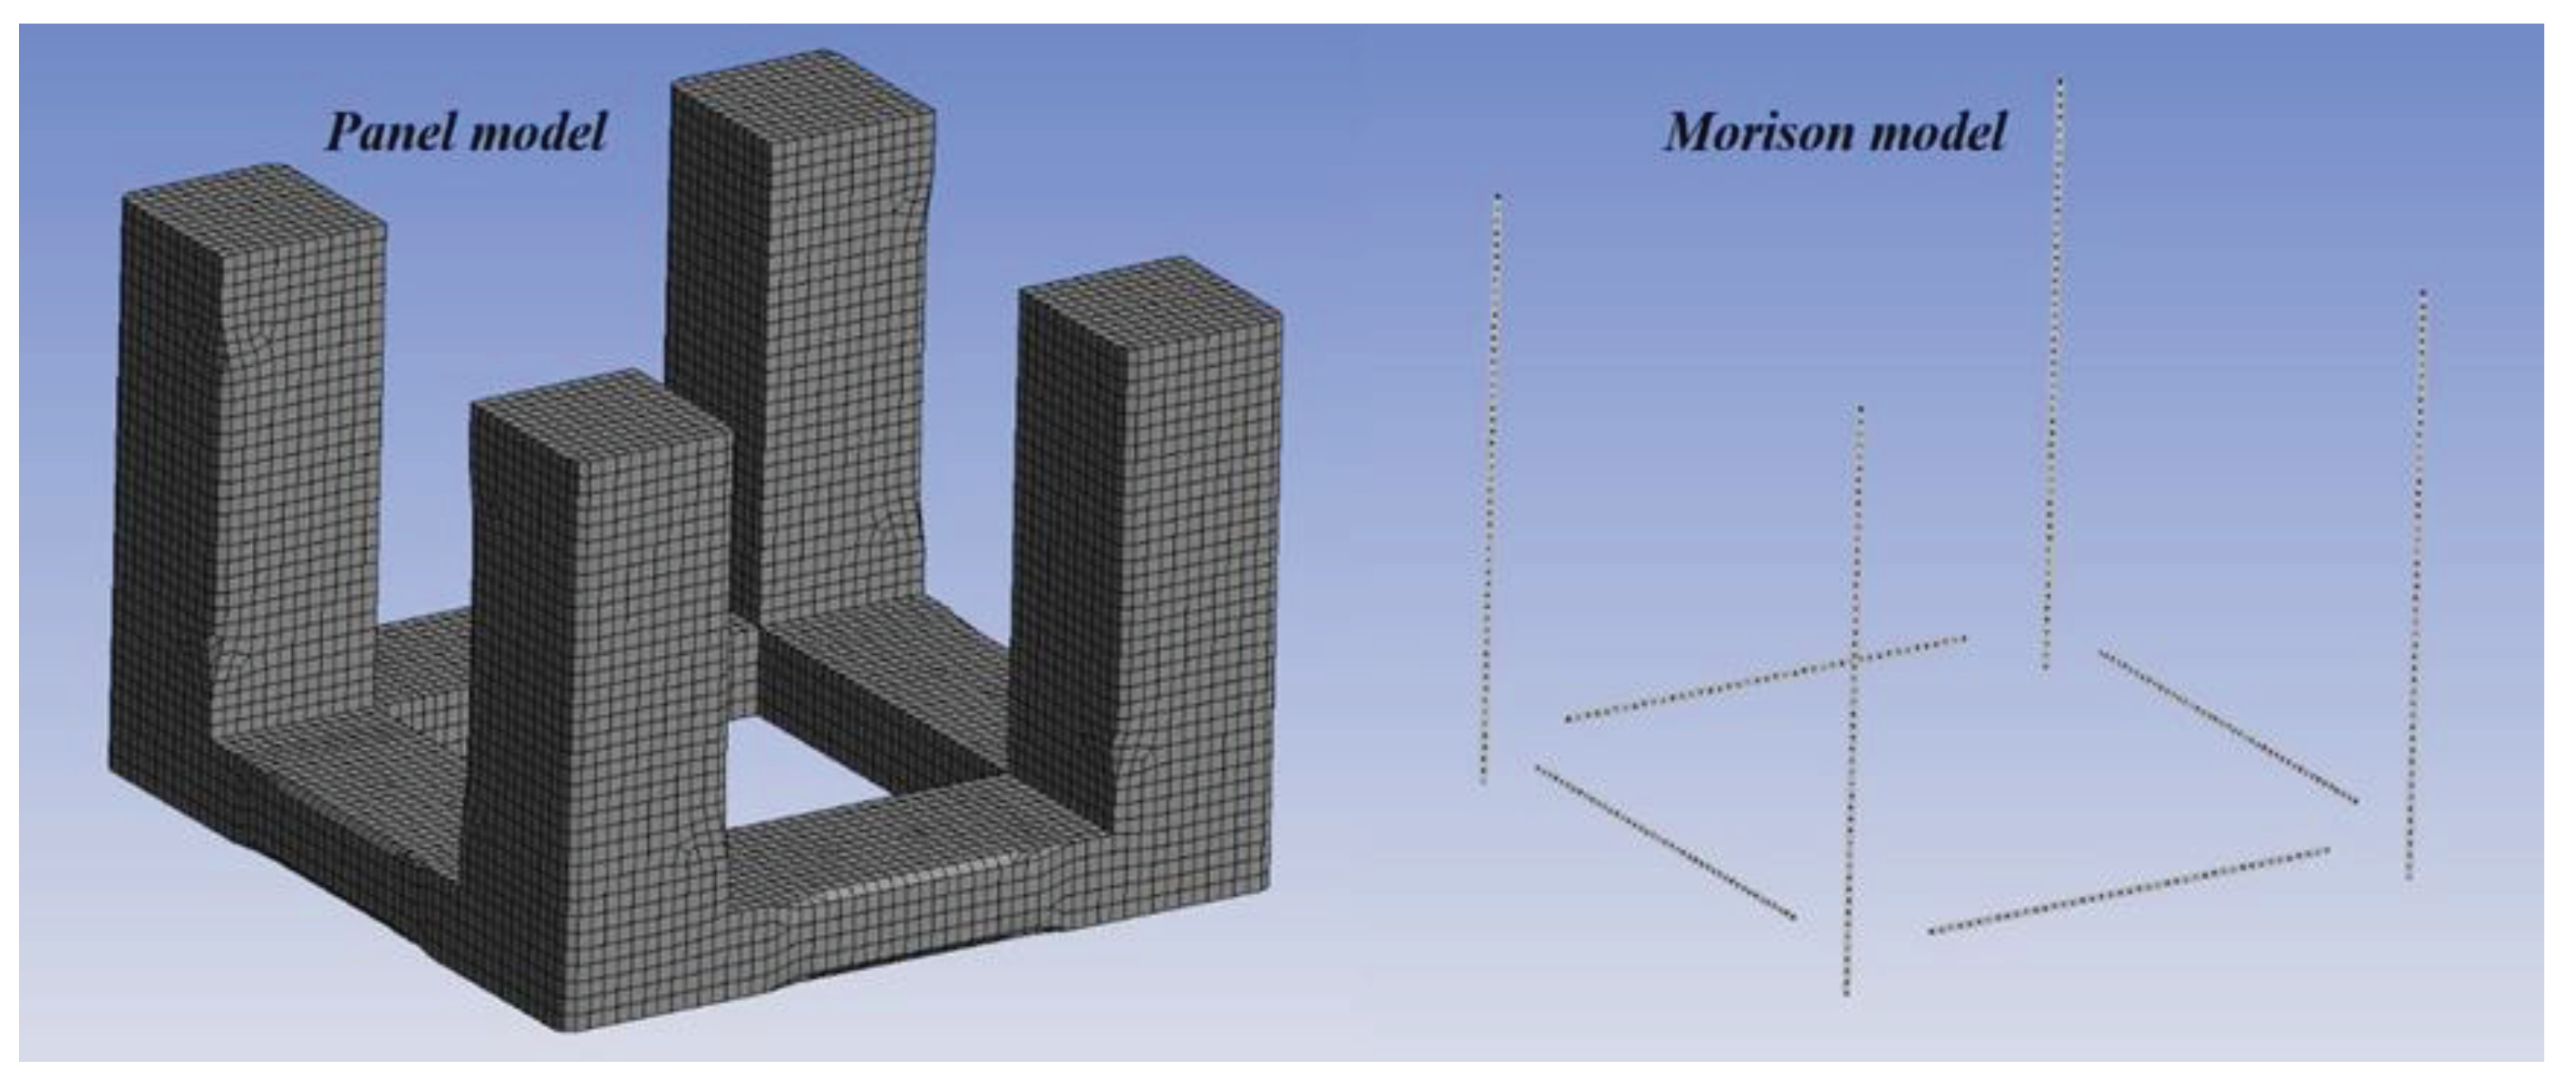
Hydrodynamic loading on marine structures primarily arises from the motion of water particles in waves, the movements of the structure, and the interactions between waves and the structure. Three-dimensional panel methods are the predominant numerical tools for analyzing the hydrodynamic behavior of large-volume structures in waves. The Morison equation approach is commonly applied to slender body components. In this study, the semi-submersible platform utilizes a hybrid method [
12], employing diffracting panels to model the large-volume components and Morison elements for the small cross-sectional components, as shown in
Figure 1. Details of the floating body's parameters are provided in
Table 1.
Table 1.
Parameters of the floating body [
7].
Table 1.
Parameters of the floating body [
7].
| Parameter |
Unit |
Value |
| Total hull width |
m |
91.5 |
| Pontoon length |
m |
49.5 |
| Pontoon width |
m |
21 |
| Pontoon height |
m |
9 |
| Column length |
m |
21 |
| Column width |
m |
21 |
| Column height |
m |
59 |
| Draft |
m |
37 |
| Displacement |
t |
105000 |
Figure 1.
Panel model and Morison model used in hydrodynamic analysis.
Figure 1.
Panel model and Morison model used in hydrodynamic analysis.
2.1.1. Potential flow theory
The velocity potential in the fluid domain can be formulated using the linear superposition theorem, as the analysis here relies on the first-order potential theory of diffraction and radiation waves. The potential resulting from incident, diffraction, and radiation waves can be expressed as follows:
Where,
is the first-order incident wave potential with unit wave amplitude,
is the corresponding diffraction wave potential,
is the radiation wave potential resulting form the
j-th motion with unit motion amplitude,
is the wave frequency.
Once the wave velocity potentials are determined, the first-order hydrodynamic pressure distribution can be computed using the linearized Bernoulli’s equation:
The different fluid forces can be computed by integrating the pressure across the wetted surface of the body based on the pressure distribution. The overall first-order hydrodynamic force can be expressed as:
of which the
j-th Froude-Krylov force due to incident wave is
the
j-th diffracting force due to diffraction wave is
the
j-th radiation force due to radiation wave induced by the
k-th unit amplitude body rigid motion is
Where,
is the water density,
is the unit normal vector of hull surface,
is the mean wetted surface of body.
Assesssing second-order hydrodynamic effects is a critical aspect of design and analysis for performance and safety in marine structures. The calculation of mean wave drift forces on a floating body in the horizontal plane involves considering the rate of change of linear and angular momentum within a specified fluid domain. This approach is referred to as the far-field solution [
13]:
Where,
is the point at which the control surface
intersects with the mean free surface,
is the coordinates of a point within the fluid domain,
is the center of gravity of the floating body,
is the normal vector on the boundary surface pointing positively outwards from the fluid volume.
The second order wave exciting force can be written as [
14]:
Where,
is the elevation of the wave relative to the mean undisturbed water line,
is the mean wetted surface,
is the floating body rotation matrix,
is the floating body mass,
is the acceleration vector of the center of gravity of the floating body,
is the second order fluid potential.
In the case of unidirectional waves, Newman’s approximation [
15] is commonly used in practical applications. This involves considering the off-diagonal difference in the quadratic transfer function(QTF) value as an average of the corresponding diagonal values:
The slowly varying drift force of the structure at deep water depths with irregular waves can be written as:
2.1.2. Morison theory
The Morison equation approach [
16] is commonly applied to slender body components when the characteristic diameter of a structural component is less than 1/5
th of the shortest wavelength. In this equation, the drag load component is caused by viscosity and is proportional to the relative velocity between fluid particles and the structure surface. Morison element forces pertain to all non-panel elements capable of attracting wave and current loading. The Morison equation for the fluid forces acting on the cross section of a slender structural member is:
Where,
is the drag coefficient,
is the characteristic drag diameter,
is the transverse directional fluid particle velocity,
is the transverse directional structure velocity,
is the added mass coefficient, and
is the cross-sectional area.
2.2. Mooring system model
Mooring system is an important system used for positioning of marine floating structures. At present, there are two main types of methods for mooring force and configuration analysis: quasi-static method and dynamic method. The quasi-static method is represented by the catenary method. On the basis of determining the parameters such as gravity and buoyancy of mooring line, the catenary equation derived mathematically is used to solve the configuration and tension. In the dynamic method, the mooring line is abstracted into a discrete or continuous dynamic model by using beam or slender rod theory, and the motion and dynamic performance of the mooring line are simulated in the time domain according to the dynamic equilibrium conditions.
2.2.1. Quasi-static method
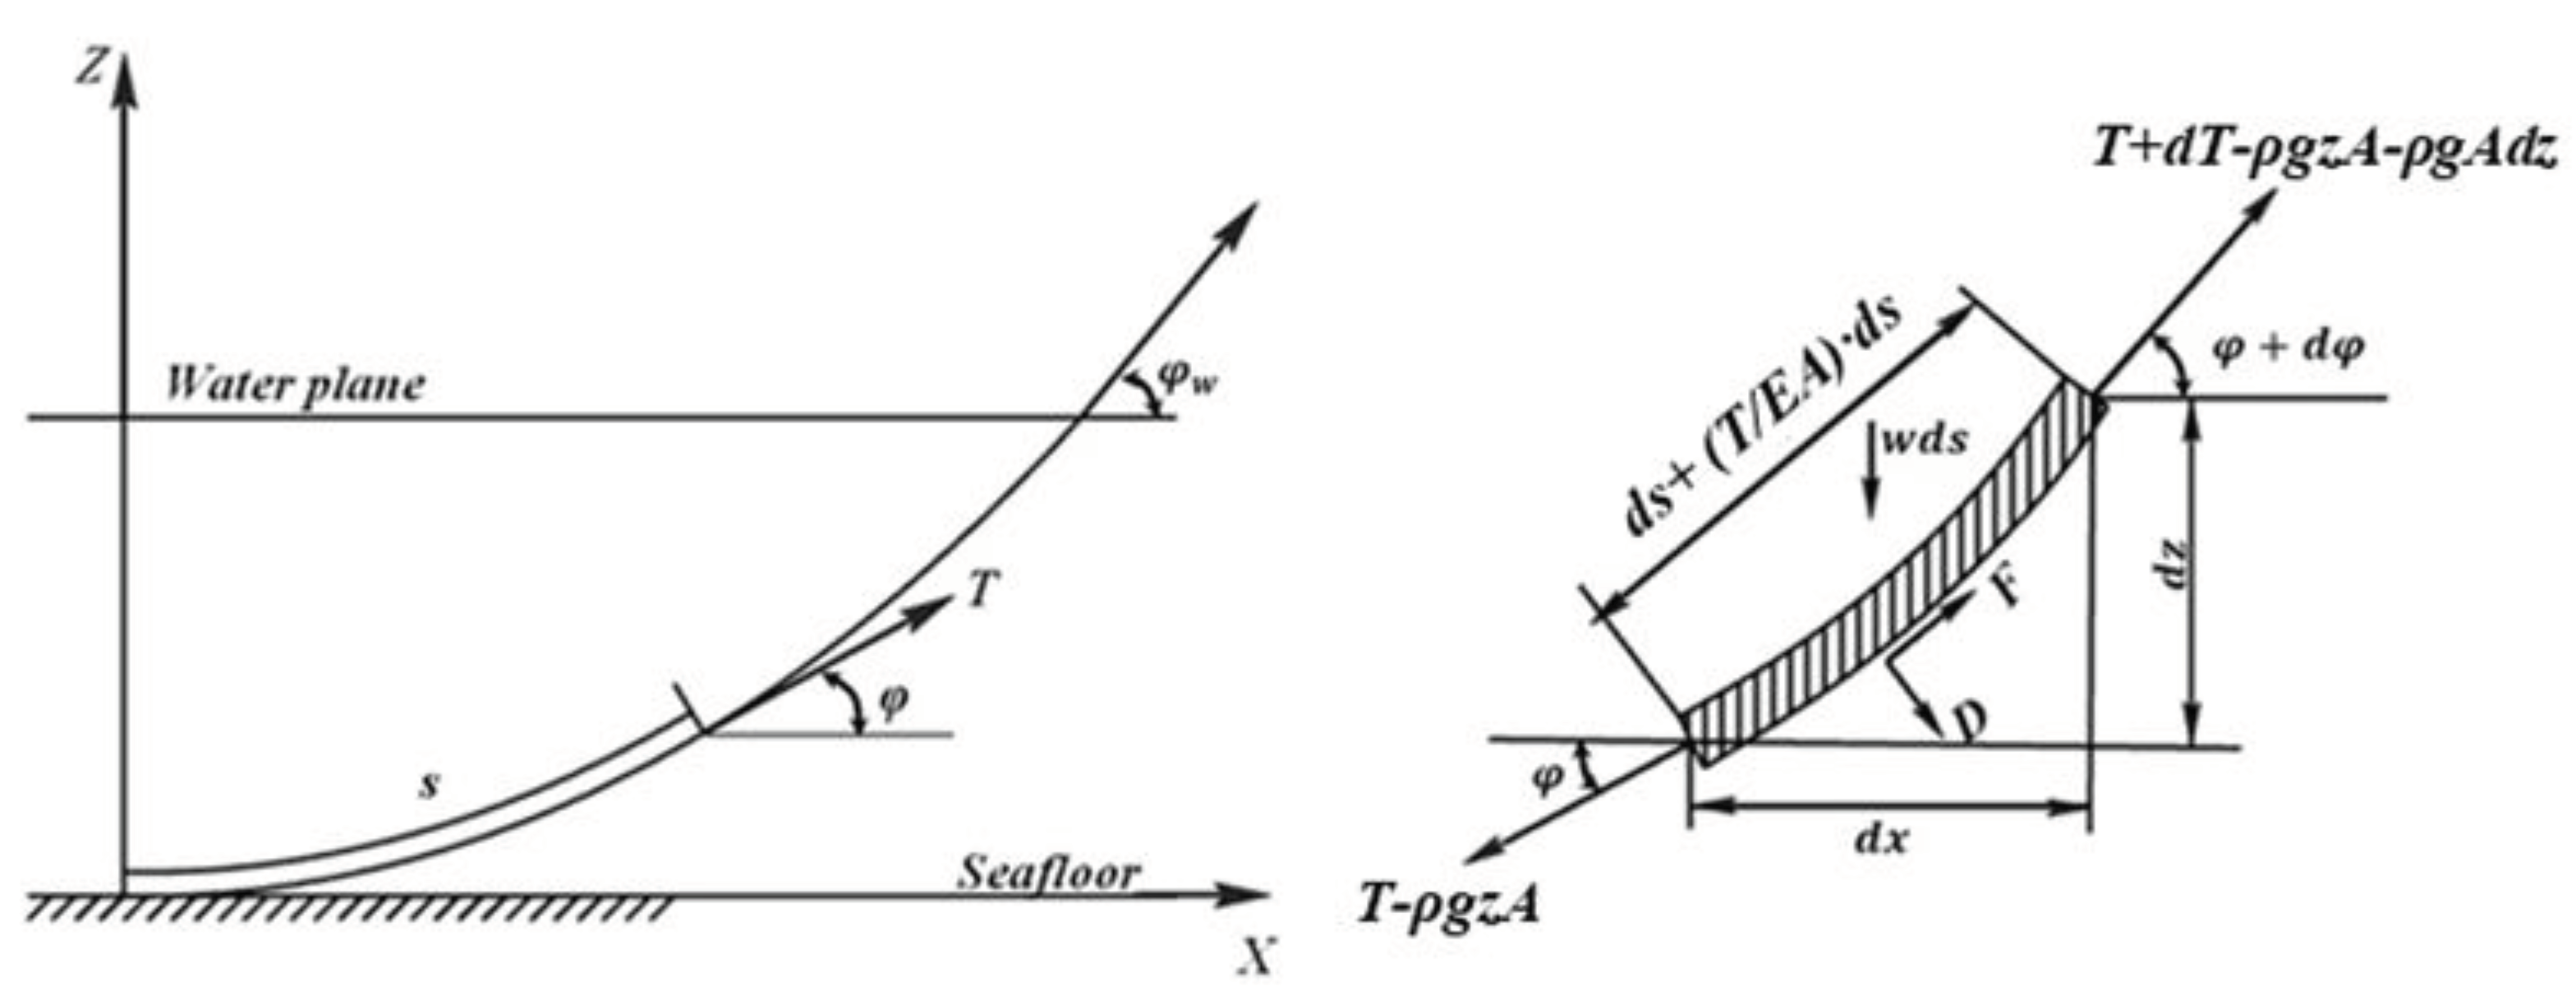
A segment of the single catenary is intercepted for force analysis, as shown in
Figure 2. The equations can be formulated in a mooring local axis system, with the local x-axis projected onto the seabed along the vector connecting the two attachment points, and the z-axis oriented vertically upwards. The equations for the equilibrium of forces along the tangent and vertical directions of the segment are given as:
Where,
is wet weight per unit length,
is the cross-sectional area,
is the modulus of elasticity,
is the tangential tension,
are vertical and tangential hydrodynamic forces respectively,
is the density of water,
is the acceleration of gravity,
is the angle between the bottom of the segment and the horizontal direction.
The hydrodynamic forces
are ignored. By integrating
and
, the general equation of catenary can be obtained:
Figure 2.
Stress analysis of single catenary and segment.
Figure 2.
Stress analysis of single catenary and segment.
2.2.2. Dynamic method
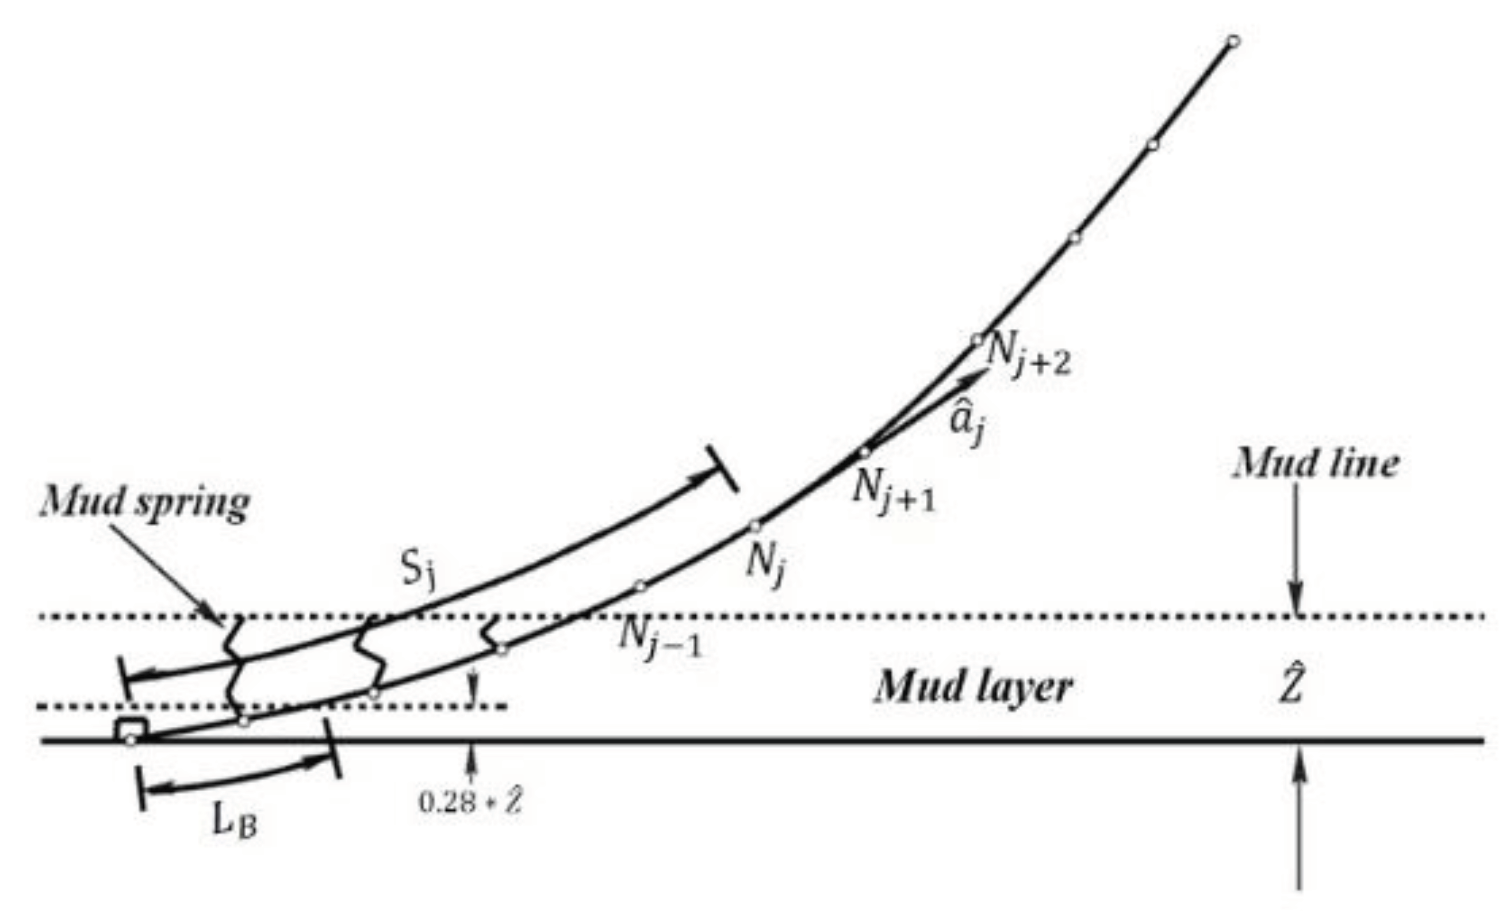
Each dynamic mooring line is represented as a chain of Morison-type cable elements subjected to various external forces. The simulation of mooring line dynamic uses a discretization along the mooring line length. As shown in
Figure 4, the mooring line is divided into several finite elements, where the mass of each element is concentrated into a corresponding node (Lump-Mass model). The parameters of the mooring line are shown in
Table 2. Inclusive of the dynamics of the mooring line in the analysis accounts for the effects of mass, drag forces, inline elastic tension, and bending moment.
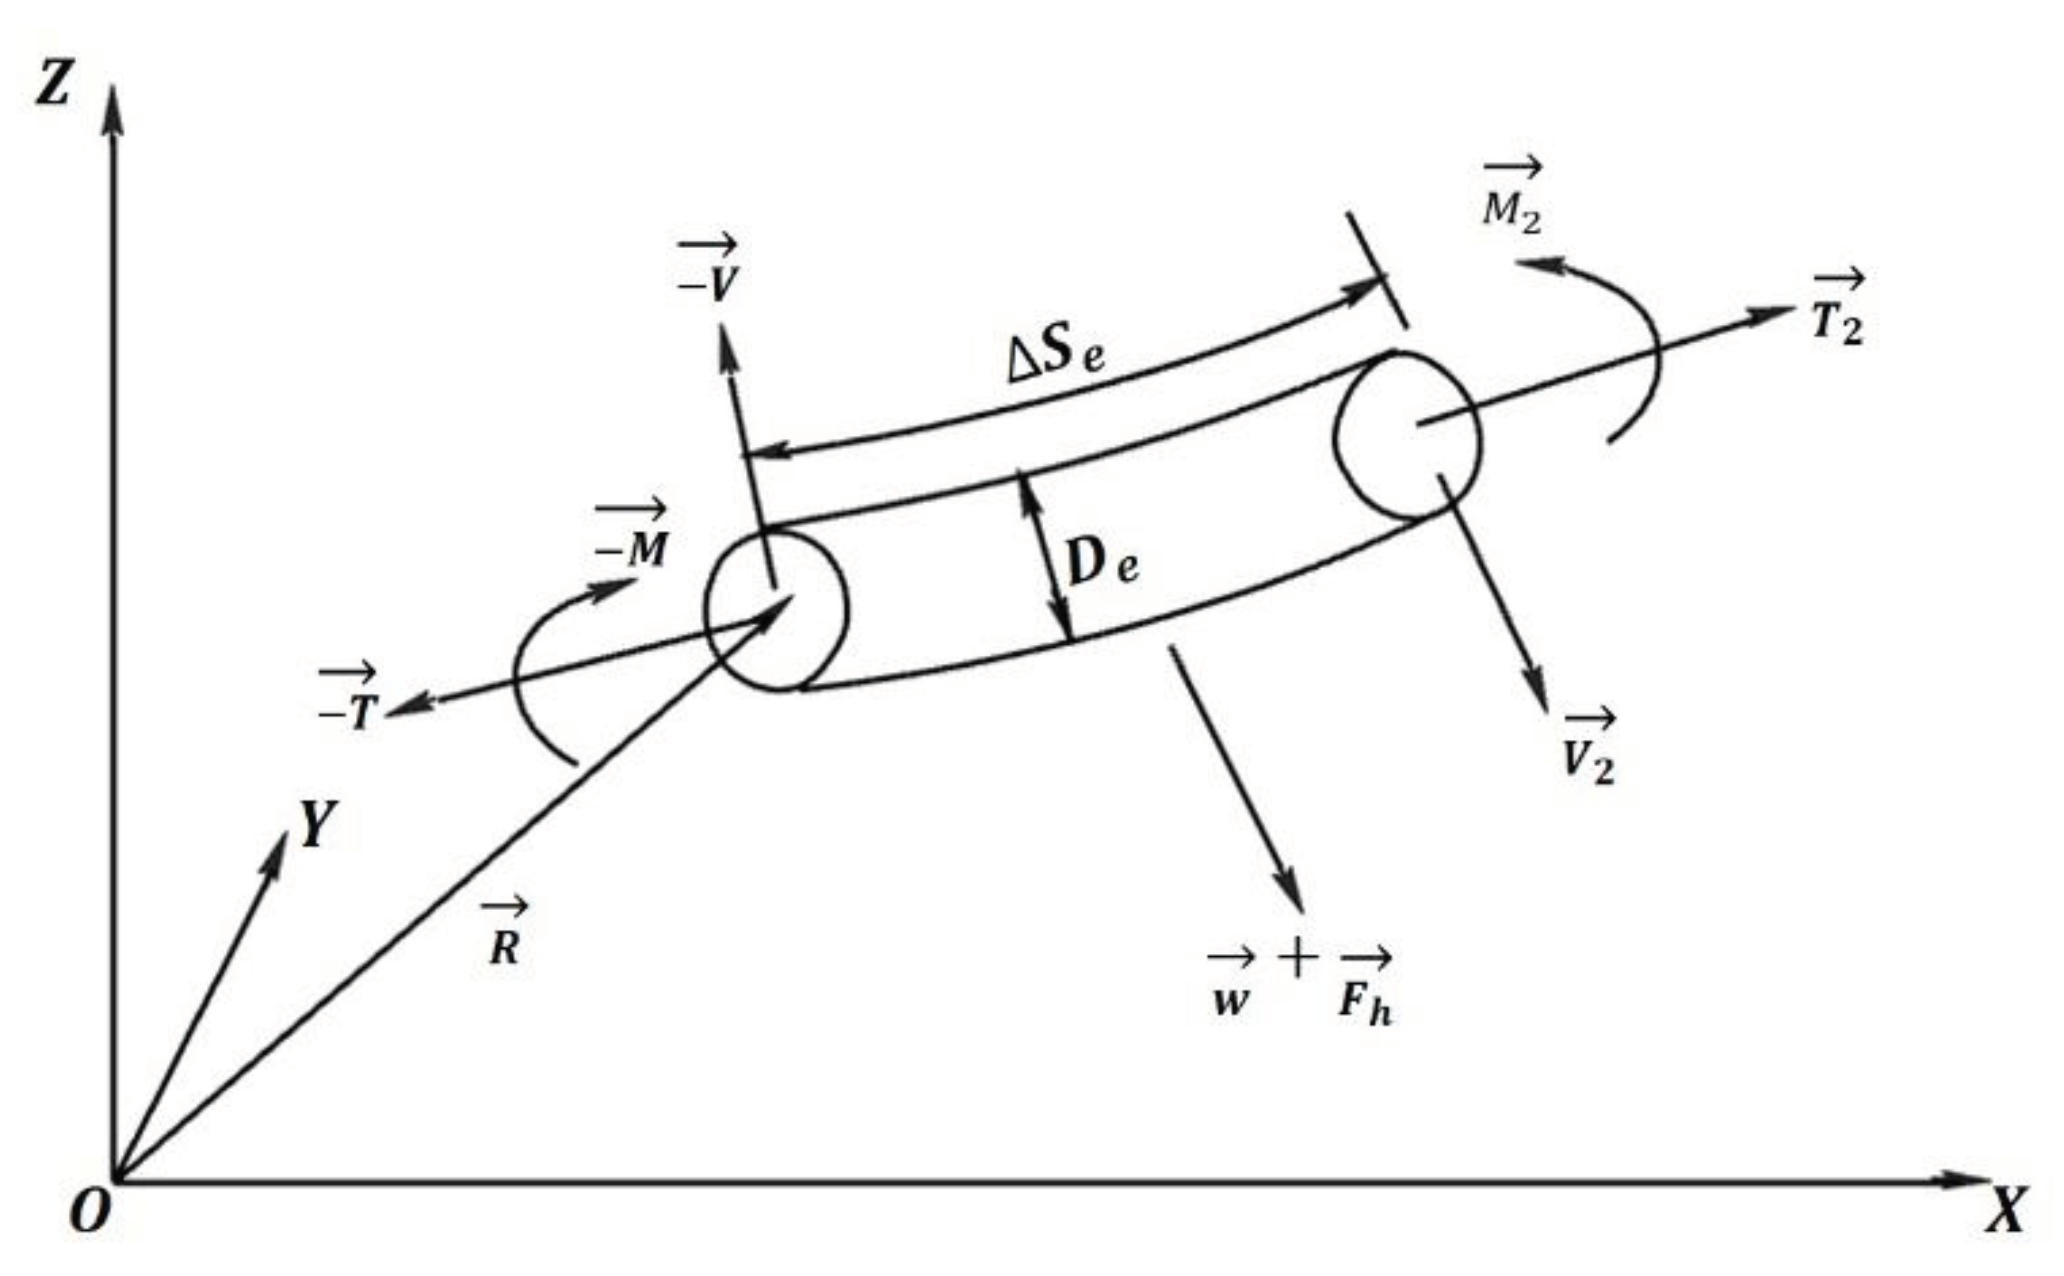
Figure 3 illustrates a single element of a circular slender cable, and it's important to note that torsional deformation is not considered in dynamic cable analysis. The motion equation of this cable element is :
Where,
is the structural mass per unit length,
is the distributed moment loading per unit length,
is the distributed moment loading per unit length,
and
are the length and diameter of the element respectively,
and
are the element weight and external hydrodynamic loading vectors per unit length respectively,
is the tension force vector at the first node of the element,
is the bending moment vector at the first node of the element, and
is the shear force at the first node of the element.
The bending moment and tension are correlated to the bending stiffness
and the axial stiffness
of the cable material through the following relationships:
Where,
are the locations of the mooring line attachment points and
is the total unstretched length of the mooring line.
To ensure a unique solution to equation (15), pinned connection boundary conditions are imposed at the top and bottom ends:
Where,
are the locations of the mooring line attachment points and
is the total unstretched length of the mooring line.
Table 2.
Parameters of the mooring line.
Table 2.
Parameters of the mooring line.
| Parameter |
Fairlead chain |
Polyester |
Ground chain |
| Diameter (mm) |
157.0 |
256.0 |
157.0 |
| Breaking strength (KN) |
23559 |
21437 |
23559 |
| Corroded breaking strength (KN) |
20709 |
- |
20709 |
| EA (MN) |
1960 |
171.5 |
1960 |
| Wet weight (kg/m) |
428.6 |
11.3 |
428.6 |
| Length |
259 |
1950 |
1321 |
Figure 3.
Force on a circular slender cable element.
Figure 3.
Force on a circular slender cable element.
Figure 4.
Modeling of a dynamic mooring line.
Figure 4.
Modeling of a dynamic mooring line.
2.3. Mooring line suspension model
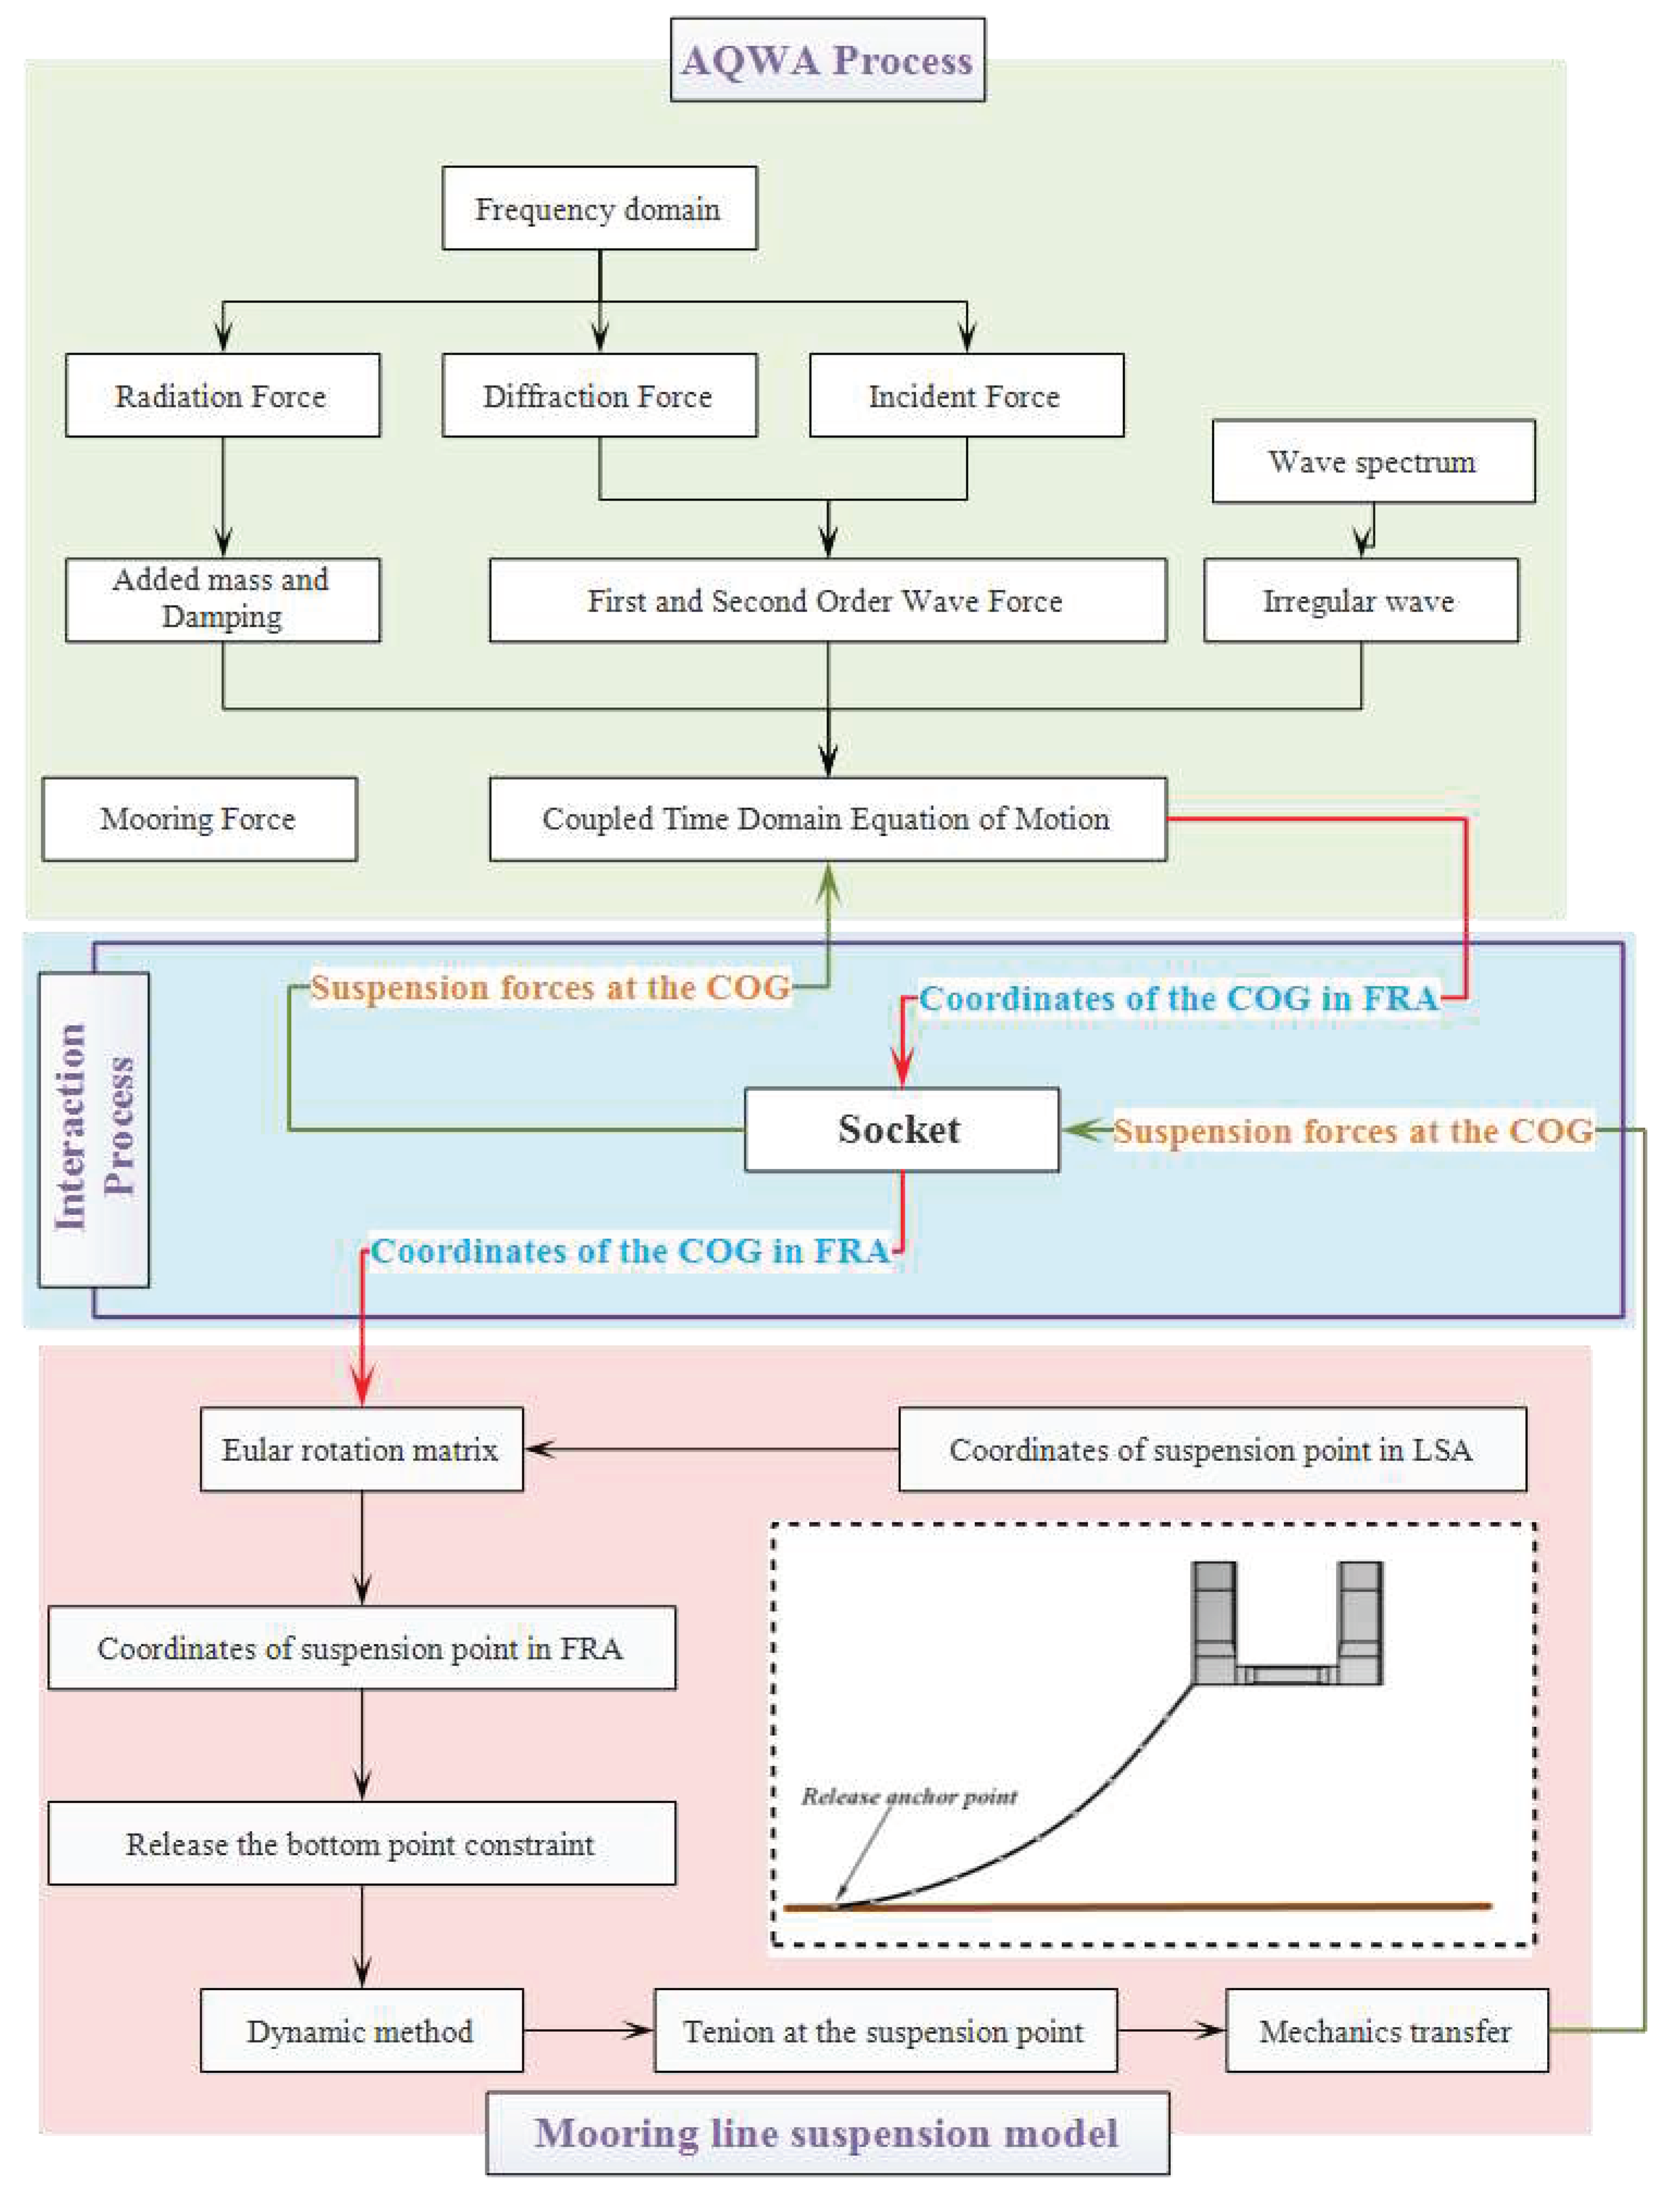
There are two typical failure conditions for mooring system. The first involves disconnection between its fairlead and hull, while the second occurs between its anchor and seabed, causing it to be suspended by the hull. The former can be accomplished directly by removing the cable model from the mooring system, while the latter requires an additional method. A mooting line mathematical model is programmed according to the dynamic theory in section 2.2.2, which needs to be involved in the hull motion coupling calculation. The mooring line suspension is achieved by changing the boundary conditions at the bottom of the mooing line in equation(17).
An external process describing the force of a suspended mooring line is programmed by Python and the external server feature is activated by linking the AQWA executable. At each time step, the AQWA executable sends data to the external process via the socket. At the same time, the AQWA executable listens to the socket for the information generated by the external process.
The coordinate of the suspension point in the fixed reference axes (FRA) needs to be obtained by means of the Euler rotation matrix
, the coordinate in FRA of any point fixed on rigid body can be expressed as:
Where,
is the coordinate of COG in the FRA as exported from the AQWA, and
is that of object point in local structure axes (LSA)
2.4. Time domain dynamic simulation
The motion equation of the floating structure in the time domain is shown below [
17]:
Where, is the structural mass matrix, is the fluid added mass matrix at infinite frequency, is the damping matrix except the linear radiation damping effects due to diffraction panels, is the total stiffness matrix, is the acceleration impulse function matrix, is the first order wave force, is the second order wave force, is the current hull drag force, is the wind drag force, is the mooring force and riser force, and represents additional external forces i.e. the residual tension of the bottom disconnecting mooring line.
Figure 5 shows the computational flow of the numerical model, with the combination process and data transfer between the external program and AQWA represented in the purple line.
3. Method of calculating the failure probability of SCR
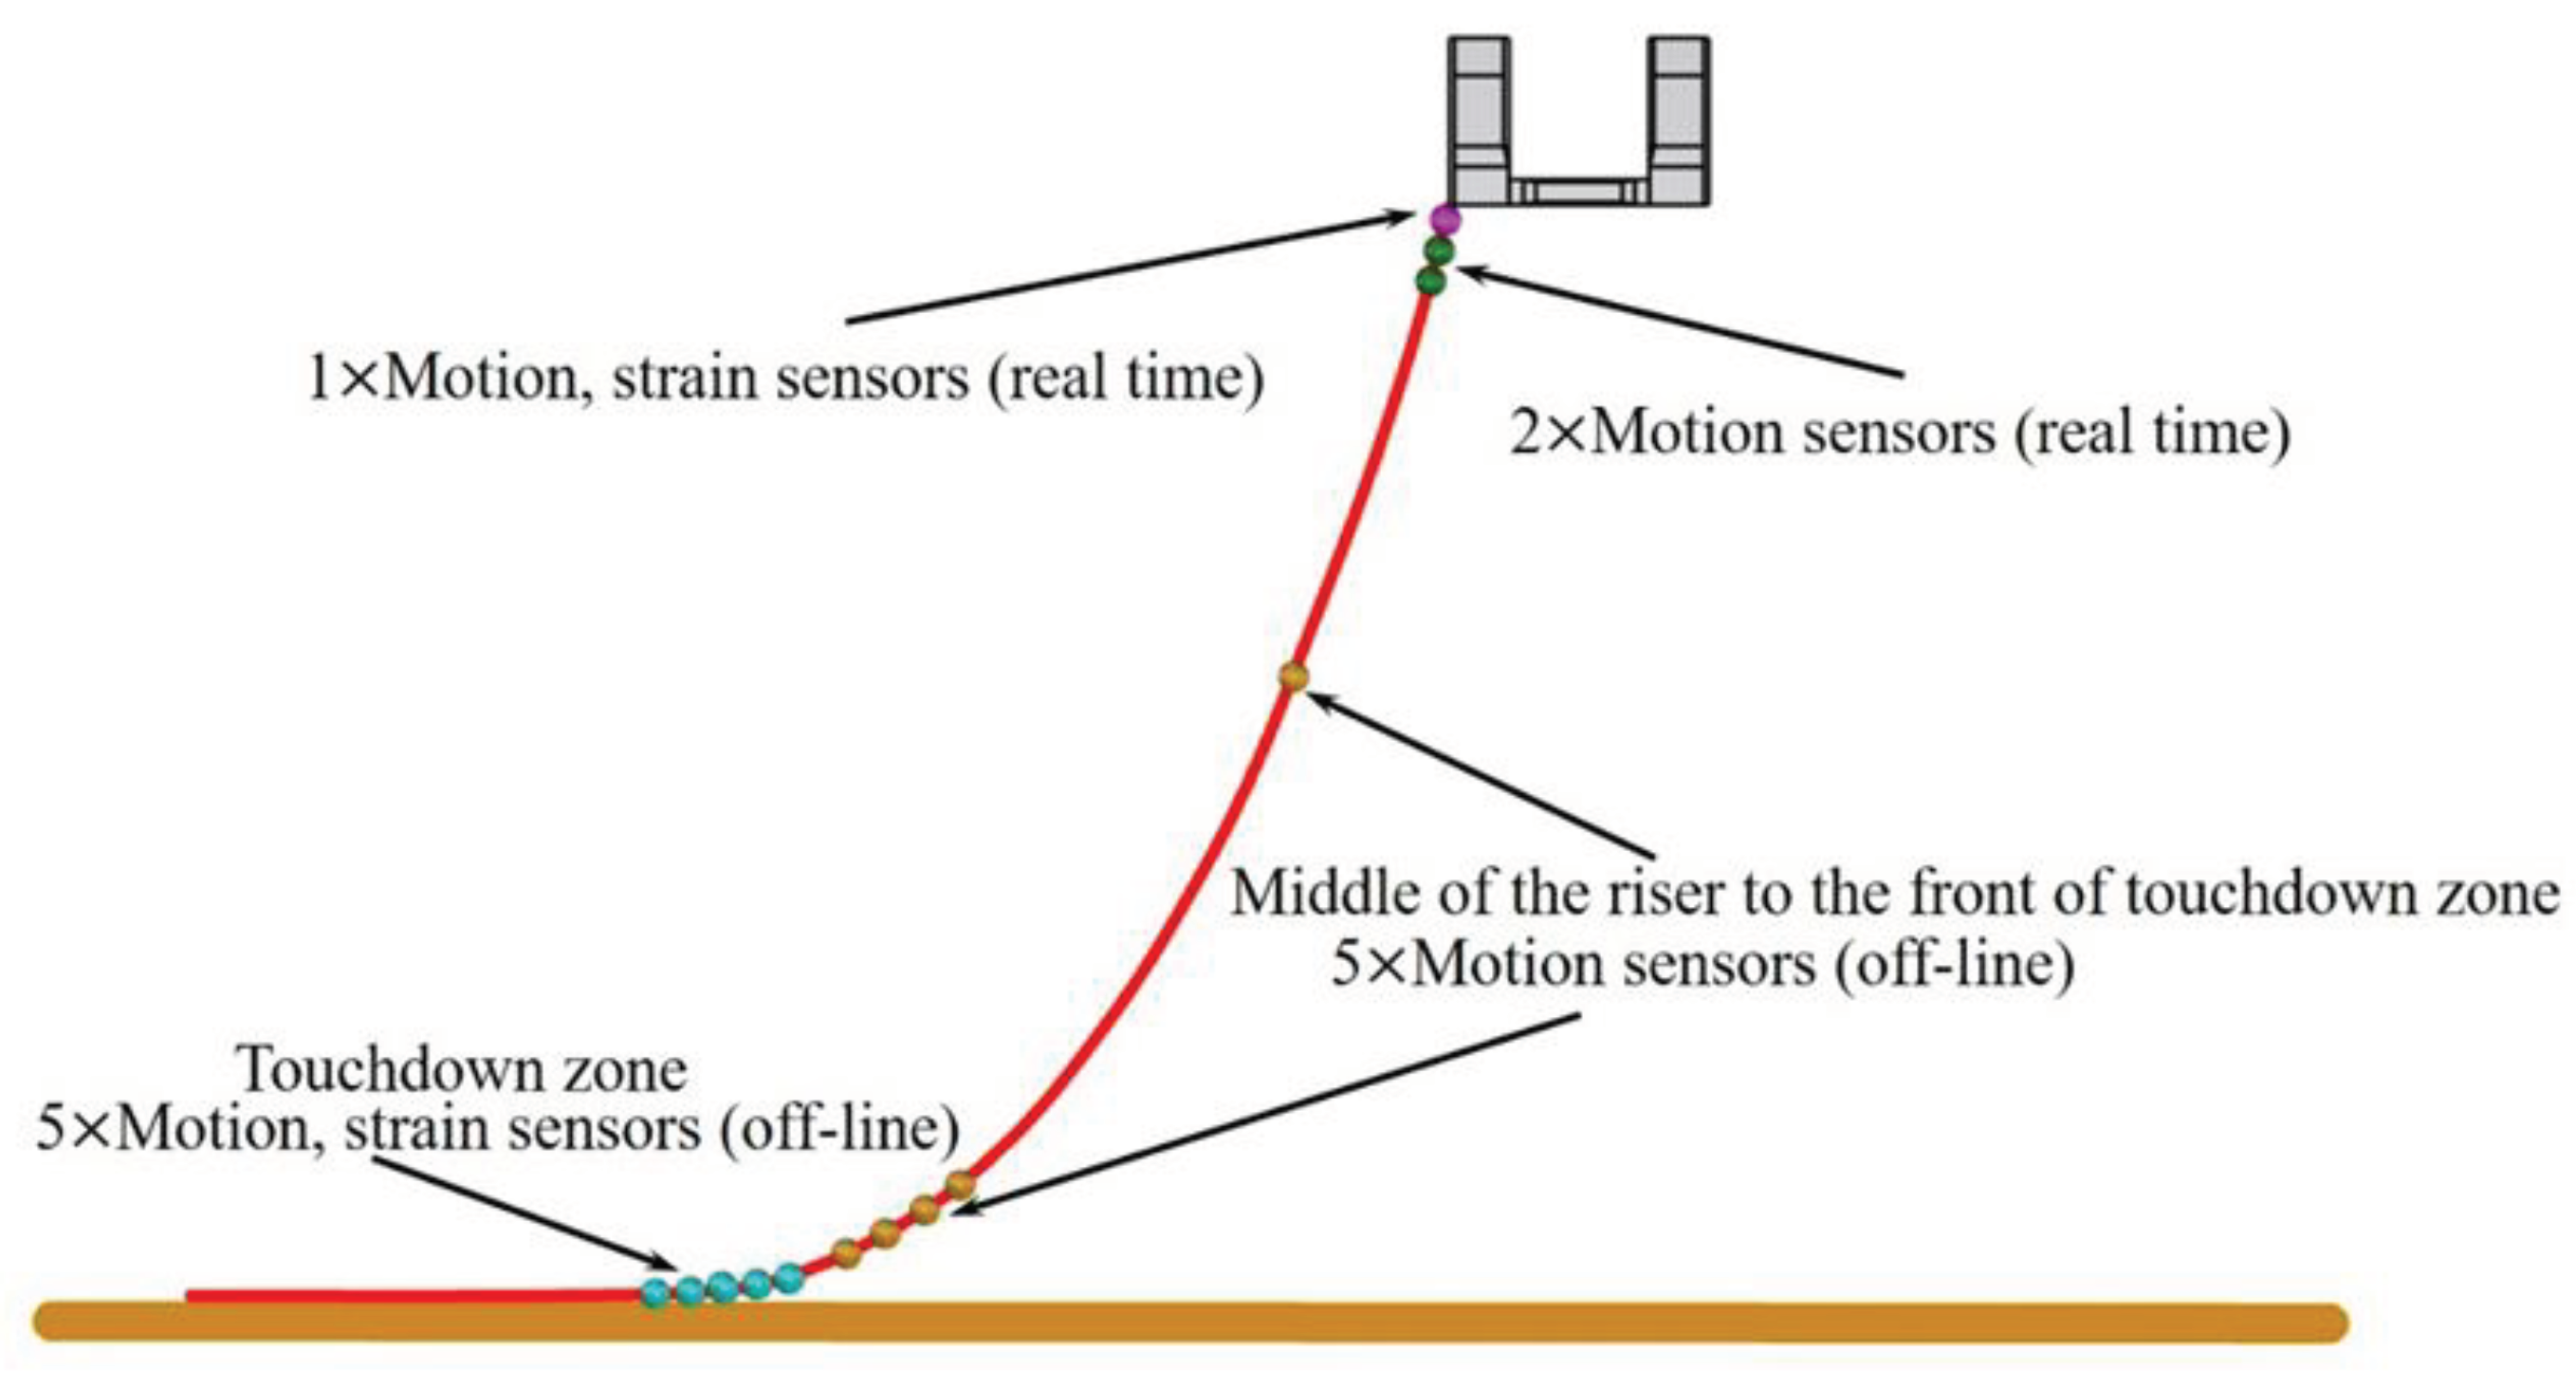
As the main system for deep-sea oil and gas development, the complex and changing ocean environment brings risks to the working safety of SCR. Therefore, a monitoring system is needed to monitor the riser movement and strain. The monitoring system mainly consists of sensors to forecast and warn sudden disasters through monitoring data, as shown in
Figure 6. However, the factors of riser failure are random and ambiguous, and the site and probability of failure cannot be accurately determined by a single sensor. Therefore, monitoring information from multiple sensors needs to be fused. Evidence theory (DST) [
18] has received much attention for its advantages in the representation, measurement, and combination of uncertainty. DSmT (Dezert-Smarandache theory) [
19] is a generalization of traditional DST and largely solves the problem of inability to represent concurrent failures in the DST framework. In this paper, DSmT is used to evaluate the failure probability of SCR after mooring line failure.
3.1. Dezert-Smarandache theory
Based on the location of the riser sensor, the generalized identification framework is defined as
. It is a finite nonempty set composed of 3 complete assumptions. The failure of the flexible joint at the top of the riser is recorded as
, the failure of the middle zone to the touchdown zone is recorded as
, and the failure of the touchdown zone is recorded as
. The Hyper-power set
is the set generated by crossing (∩) and merging (∪) the elements in the identification framework. The maximum effective tension (m1), maximum bending stress (m2), and max von mises stress (m3) are used as evidences to determine failure. The basic definition of DSmT theory can be found in Smarandache and Dezert [
21]. This section focuses on the specific application of the theory to riser failure.
Based on the three types of evidences defined above, the fusion of their information needs to be used to calculate the probability of different combinations of riser failures. The combination rules of DSmT are derive from DST (Shafer’s model), but are somewhat different. Two DSmT models have been proposed by Smarandache and Dezert [
21] as shown in
Figure 7.
The first kind model we called is free DSm model. In this model, it is supposed that within the identification framework , A and B represent two independent evidences, with their respective generalized basic probability assignment (GBPA) denoted as and . When these act simultaneously, for a given , the synthesis formula is as follows:
Another model is hybrid DSm model. In this model, it is supposed that k pieces of evidences within the identification framework are independent of each other, and their respective GBPAs are denoted as . When these act simultaneously, for a given , the synthesis formula is as follows:
All sets included in the expression are canonical forms, where is the characteristic non empty function of set . If , , otherwise . Here is , is the set of elements forced to be empty in the hyper-power set , and is an empty set in the classical or ordinary meaning.
(free DSm model),
,
defined as follows [
22]:
Where , is the union of all the that make up , and represents complete unknown. represents the combination of k independent information sources under the free DSm model. represents the relative or complete unknown that transforms BPA of all relative and absolute empty sets. represents the union of non-empty sets converted by GBPA of relatively empty sets
Figure 7.
Two combination rules in DSmT theory.
Figure 7.
Two combination rules in DSmT theory.
3.2. Decorrelation method for dependent sources of evidence
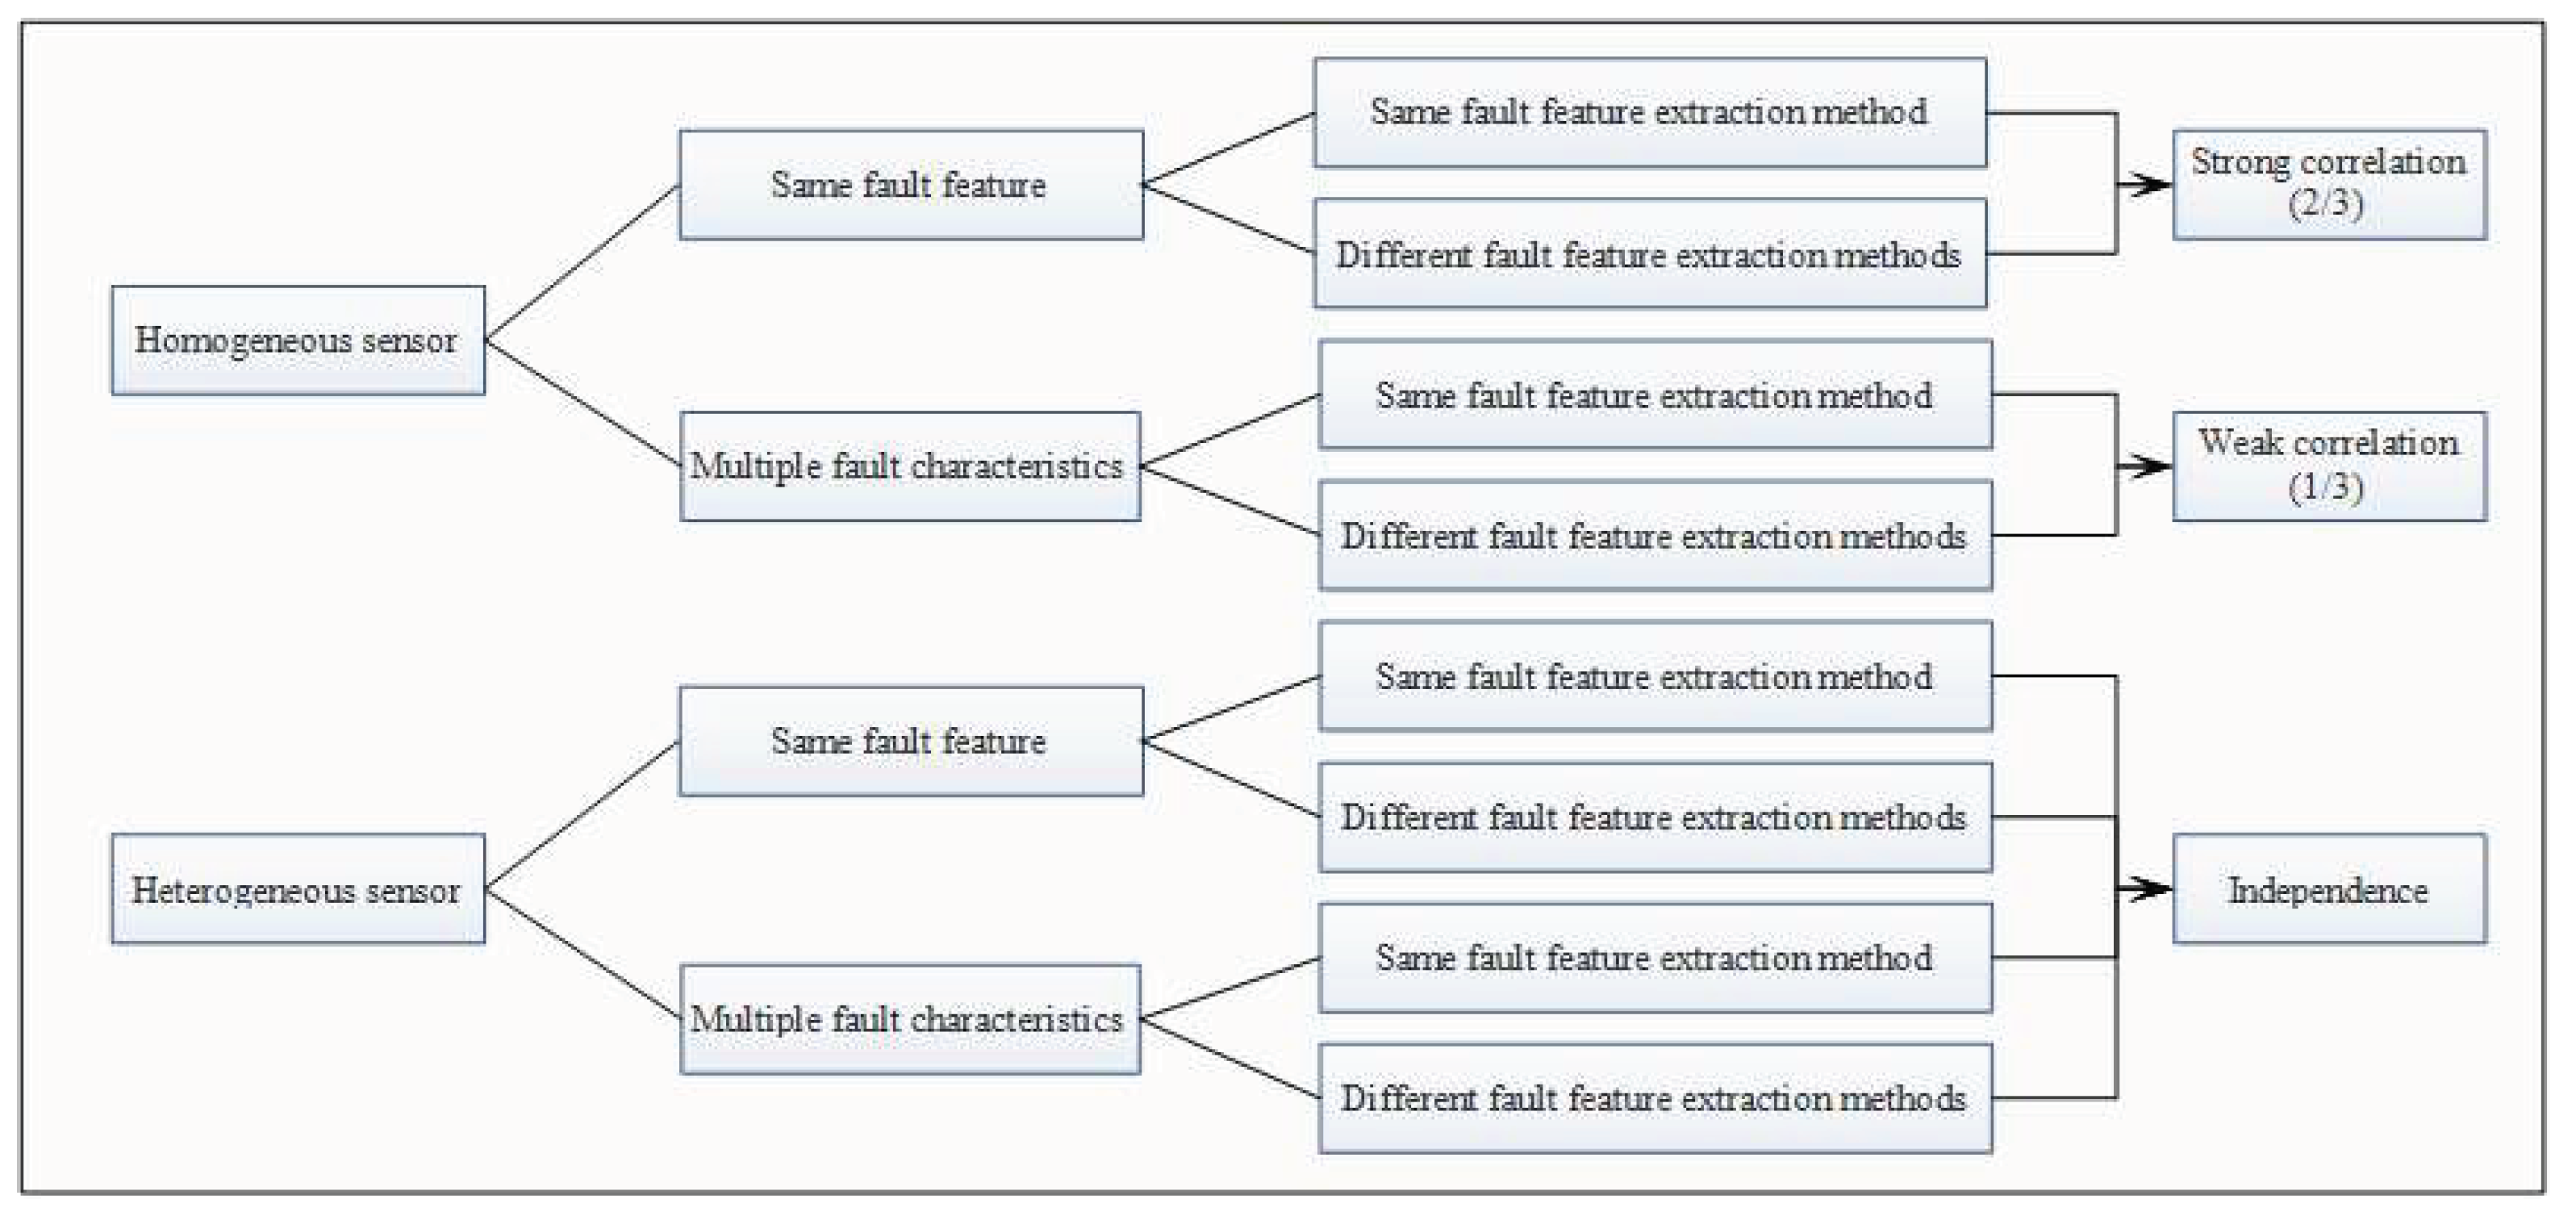
According to the previous section, it can be seen that the three evidences are obtained based on the sensors at three different locations of the riser. In a multi-sensor information fusion system, there is necessarily a correlation between various information. The processing of relevant evidence will further improve the performance of the whole fusion system. We introduce the degree of dependence of evidence (
) [
23] to treat the relevant evidence in this paper. As shown in
Figure 8, the evidence is divided into eight categories based on three factors (method, sensor, and feature). For example, the SCR use stress measured by the same sensor (strain sensor correspond to the homogeneous in Fig. 8) to determine different failure modes (three different failure locations correspond to the multiple fault characteristics in
Figure 8), which are weakly correlated with
. If heterogenous sensors are used, there is no need to consider the correlation between the evidences, as in
Figure 8. After obtaining the different correlations, according to following formulas, each group of evidence can be divided into overlapping evidence sources and independent evidence sources:
Where,
represents original evidence obtained through sensors,
and
denote respectively the belief based on overlapping evidence and the belief based on independent evidence for the
i th evidence in a certain group.
After splitting the evidence in each group, two evidence sets are obtained: one is composed of
beliefs
based on independent evidence, the other is composed of
k beliefs
based on identical evidence. Then, the average belief of
is:
Where,
is the average belief assigned to
by all
relevant evidence. Therefore,
pieces of independent evidence are attained.
Figure 8.
The separation of dependence for evidence [
22].
Figure 8.
The separation of dependence for evidence [
22].
3.3. The weight for measuring credibility of evidence
The riser, as a long-service oil exploration equipment, encounters a large randomness of the marine environment and more uncertainties, resulting in a certain degree of uncertainty in the sensor measurements. Jousselme et al. introduces an ambiguity measure (AM) to perfectly quantify the uncertainty of evidence [
24]. The AM is based on the classical pignistic transformation (CPT). The generalized pignistic transformation (GPT) in the DSmT framework is as follow:
Where,
is the cardinality of proposition
for the DSmT model
Then, a generalized ambiguity measure (GAM) based on GPT can be defined as follow:
Where,
is a GBPA in the generalized identification framework.
Suppose there are
pieces of independent evidence, then the credibility if these evidence can be measure by weights
:
For the
pieces of evidence, the modified
are
Therefore, the process of calculating the failure probability of the riser in this paper is as follows: (1) transforming into GBPA corresponding to three evidences based on the sensor measurements; (2) decorrelating the three evidences based on the formula in section 3.2; (3) correcting the GBPA calculated in the second step based on the formula in section 3.3 by taking into account the uncertainties of the evidences; and (4) the probability of different failure combinations of the riser based on the combination law of evidences in section 3.1.
4. Result and discussion
4.1. Integrity analysis of mooring system
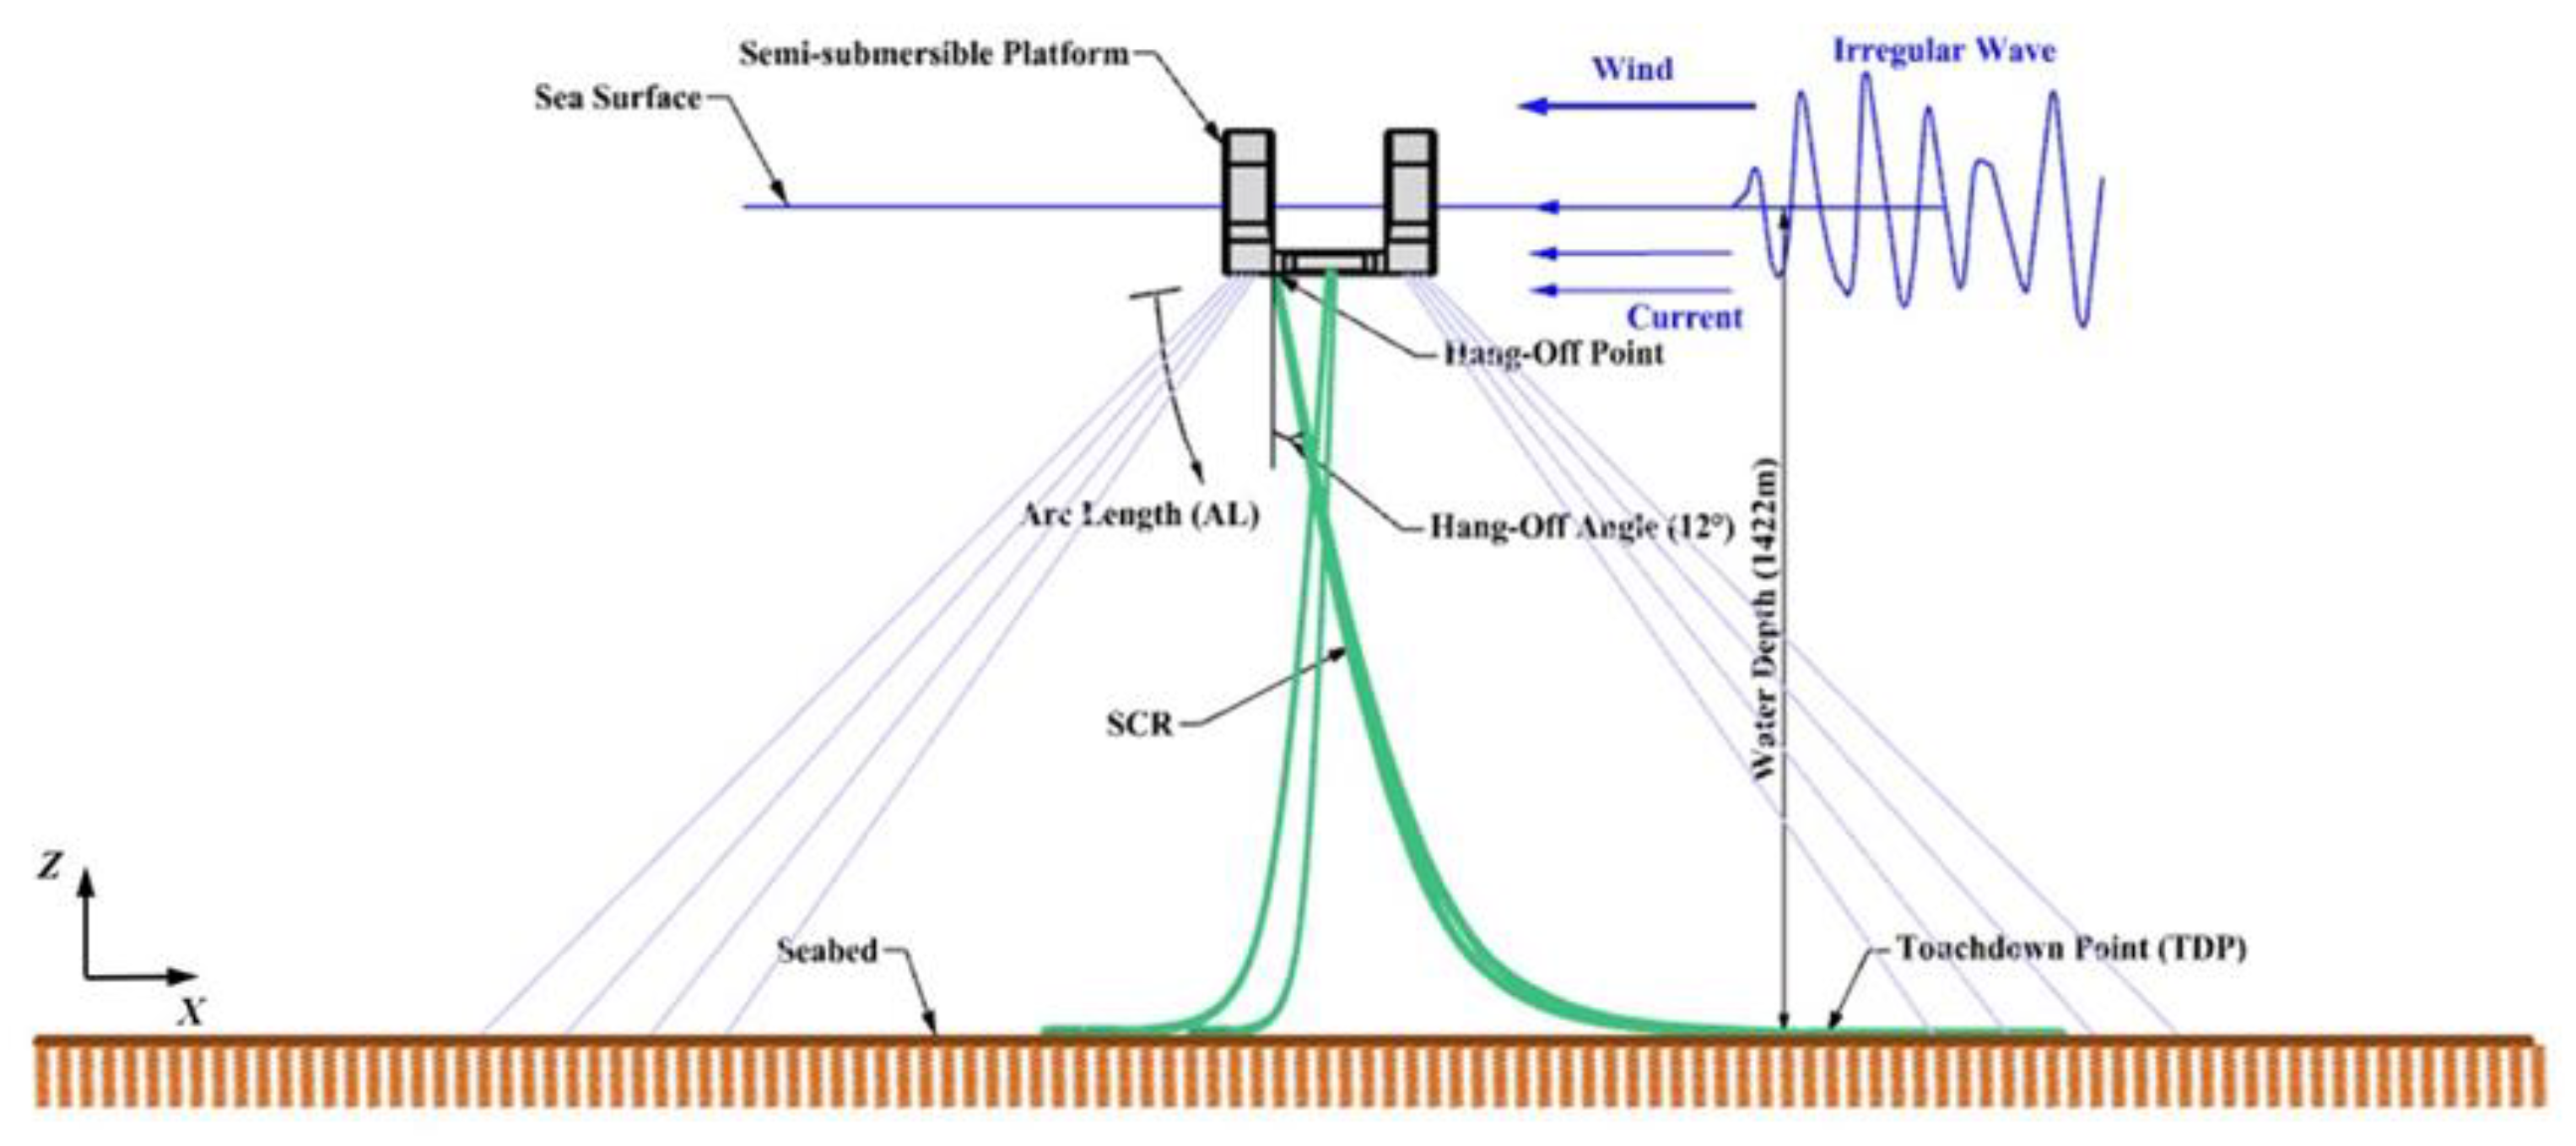
Firstly, the coupled hull-mooring-riser system is established as the research object, as shown in
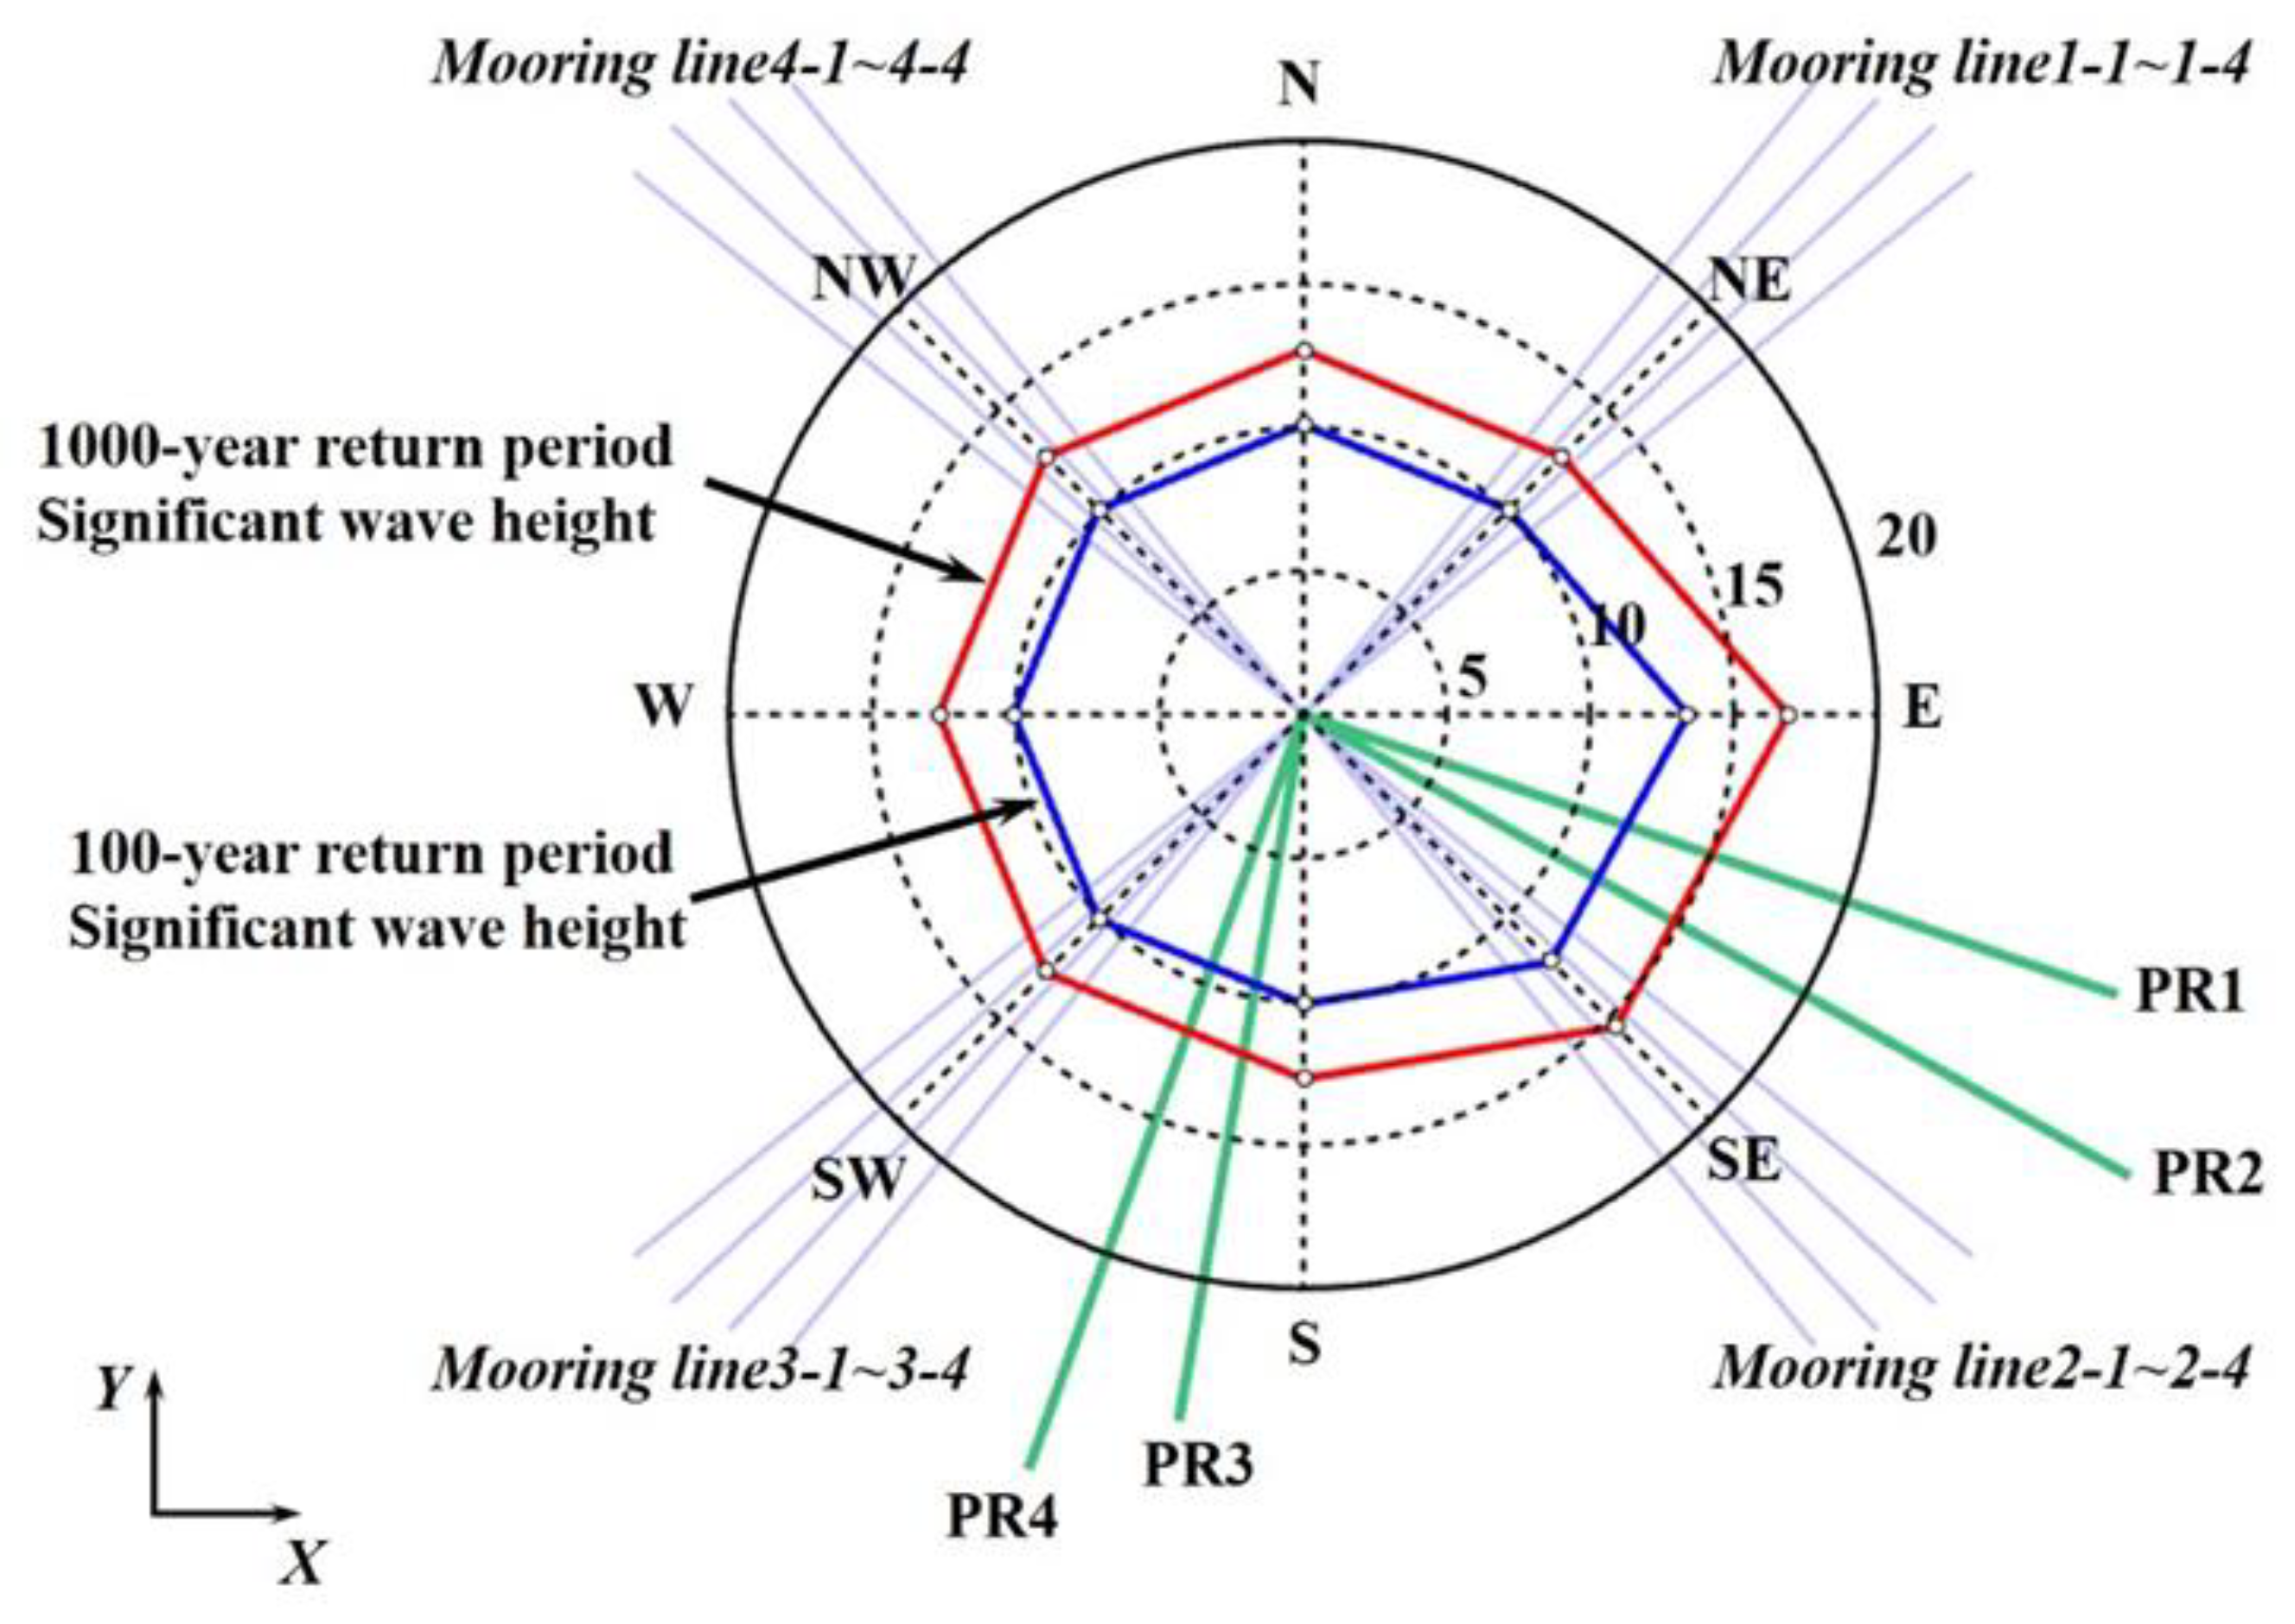
Figure 9. Secondly, according to the common practices and specifications of the international offshore engineering community, mooring system and risers of the floating platform are usually adopt directional extreme of the ocean environment. According to the statistical results of waves in Lingshui area of South China Sea [
25], the direction and significant wave height under extreme sea conditions are determined, as shown in
Figure 10. Finally, wave loads in both E and SE directions are selected for hydrodynamic calculations, and the corresponding conditional extremes are used for wind and current, respectively. The specific ocean environment parameters are shown in
Table 3, and the wind and current coefficients are shown in
Table 4 and
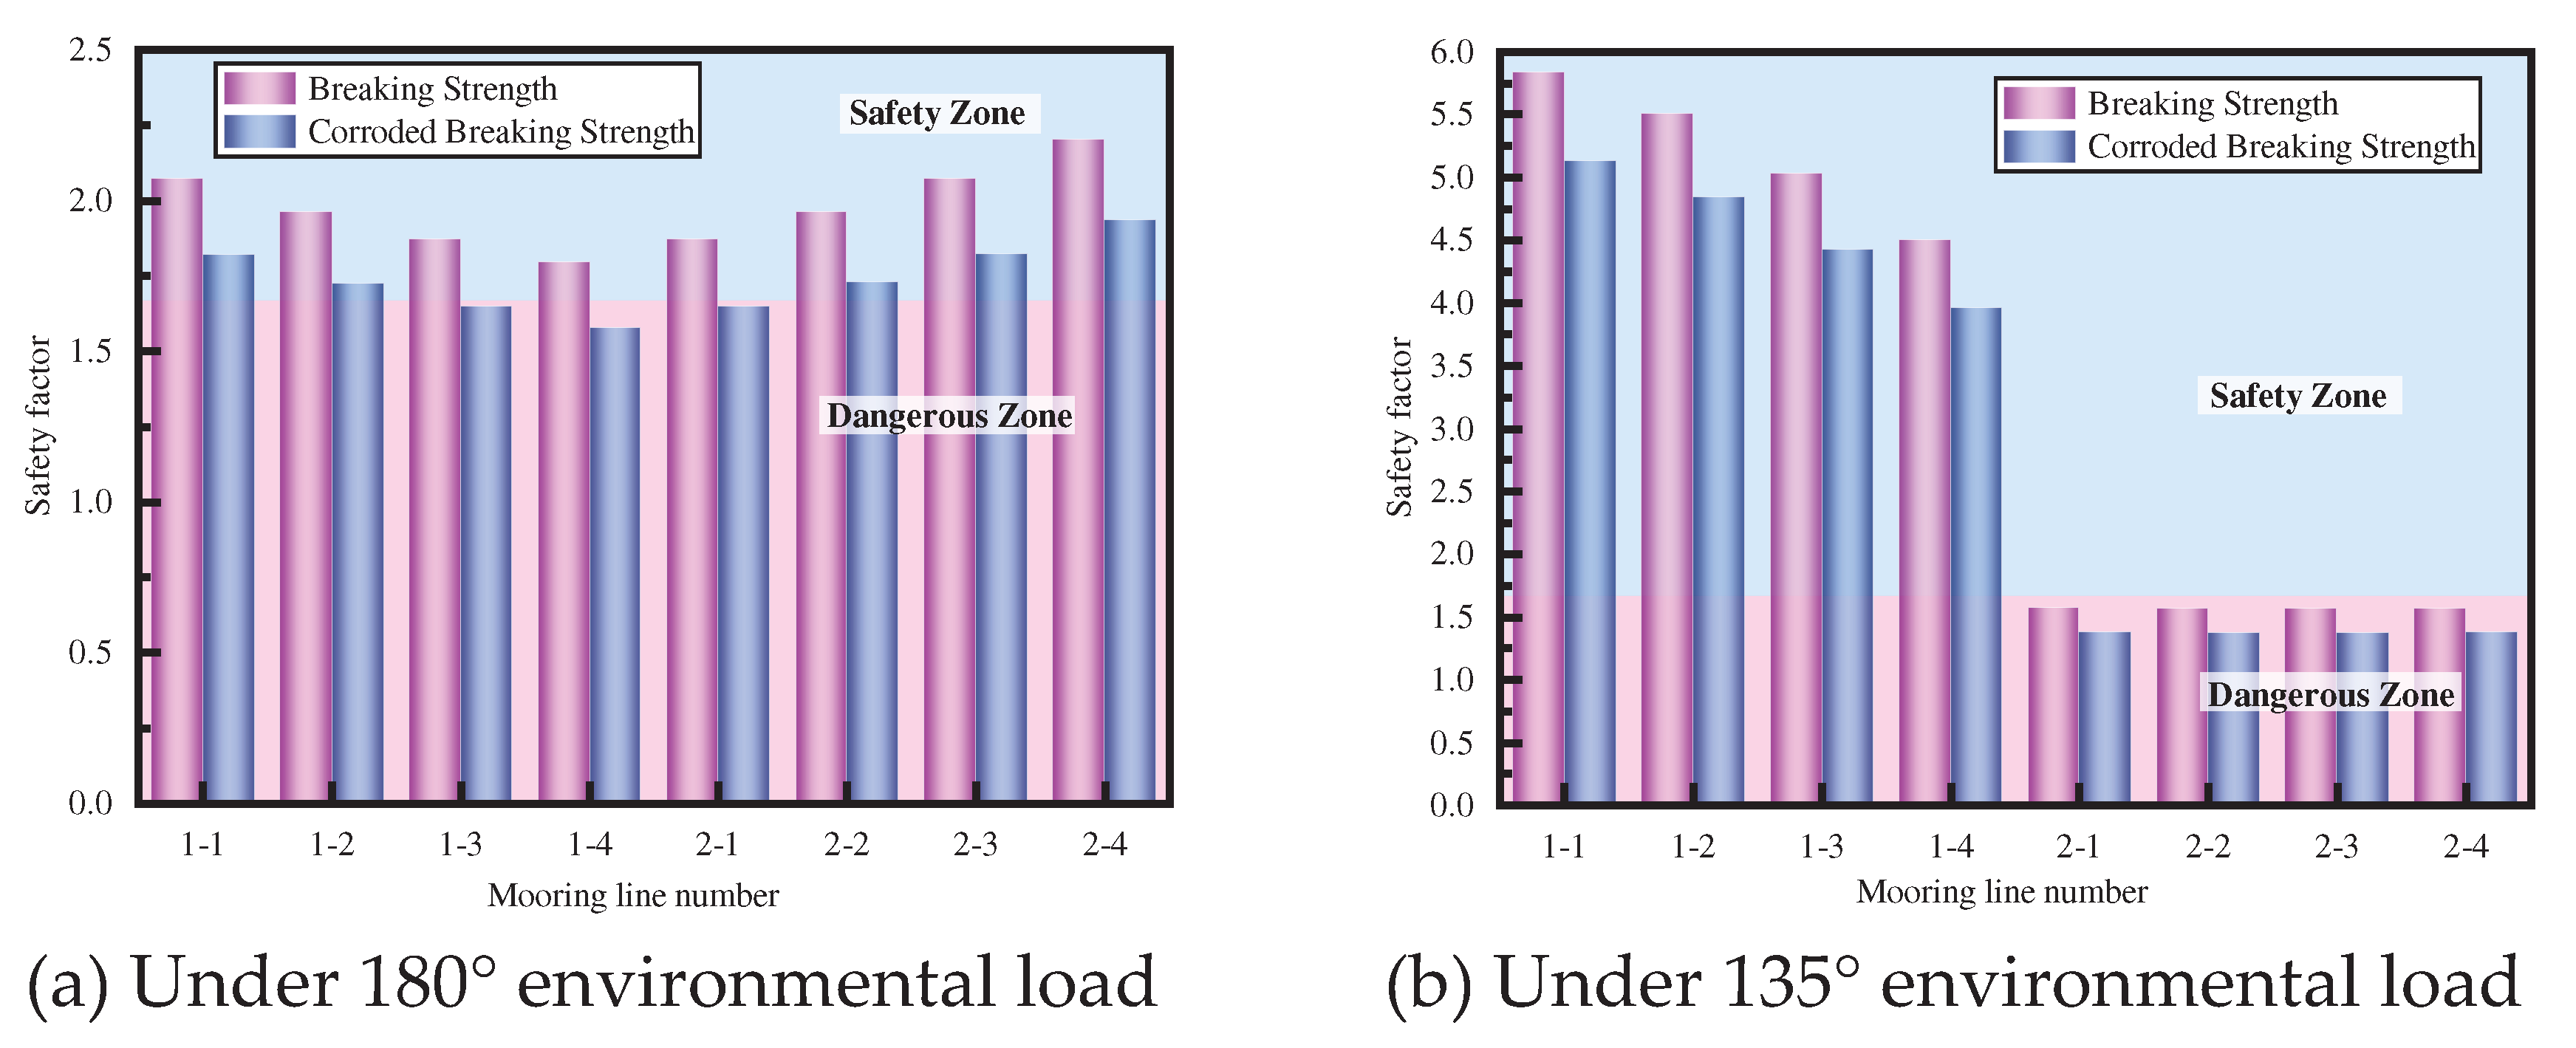
Table 5, respectively. From the directions of the ocean loads, it is known that the most vulnerable mooring lines are 1-1~1-4 and 2-1~2-4. Therefore, the maximum tension of the mooring lines 1-1~1-4 and mooring lines 2-1~2-4 in the time history is extracted, and the safety factors are calculated and compared with the engineering specifications [
26] in
Table 6.
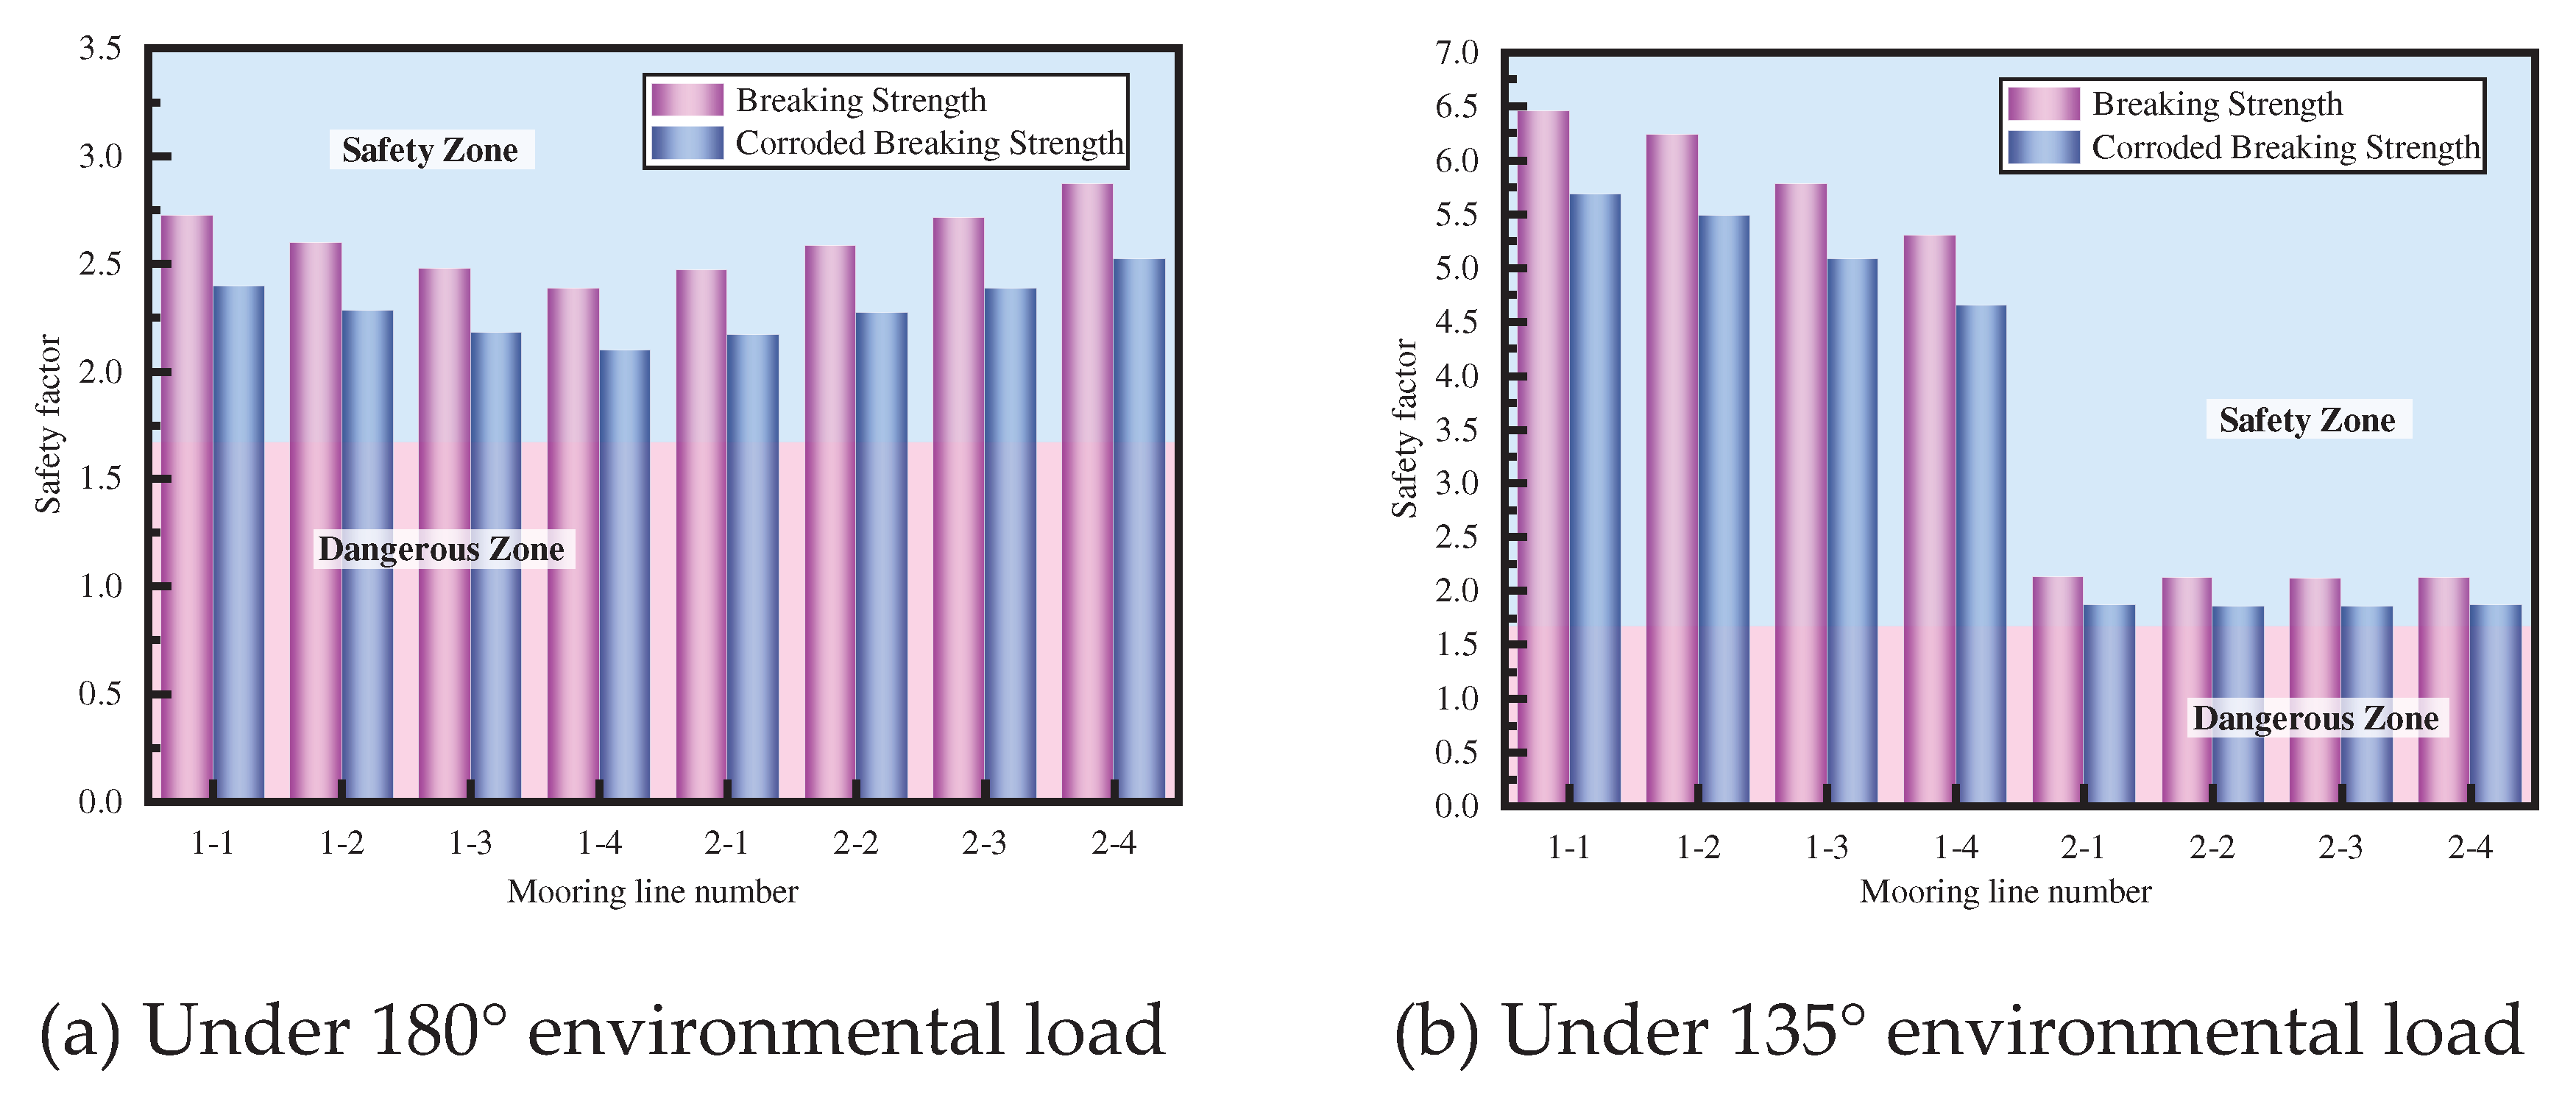
It can be seen from
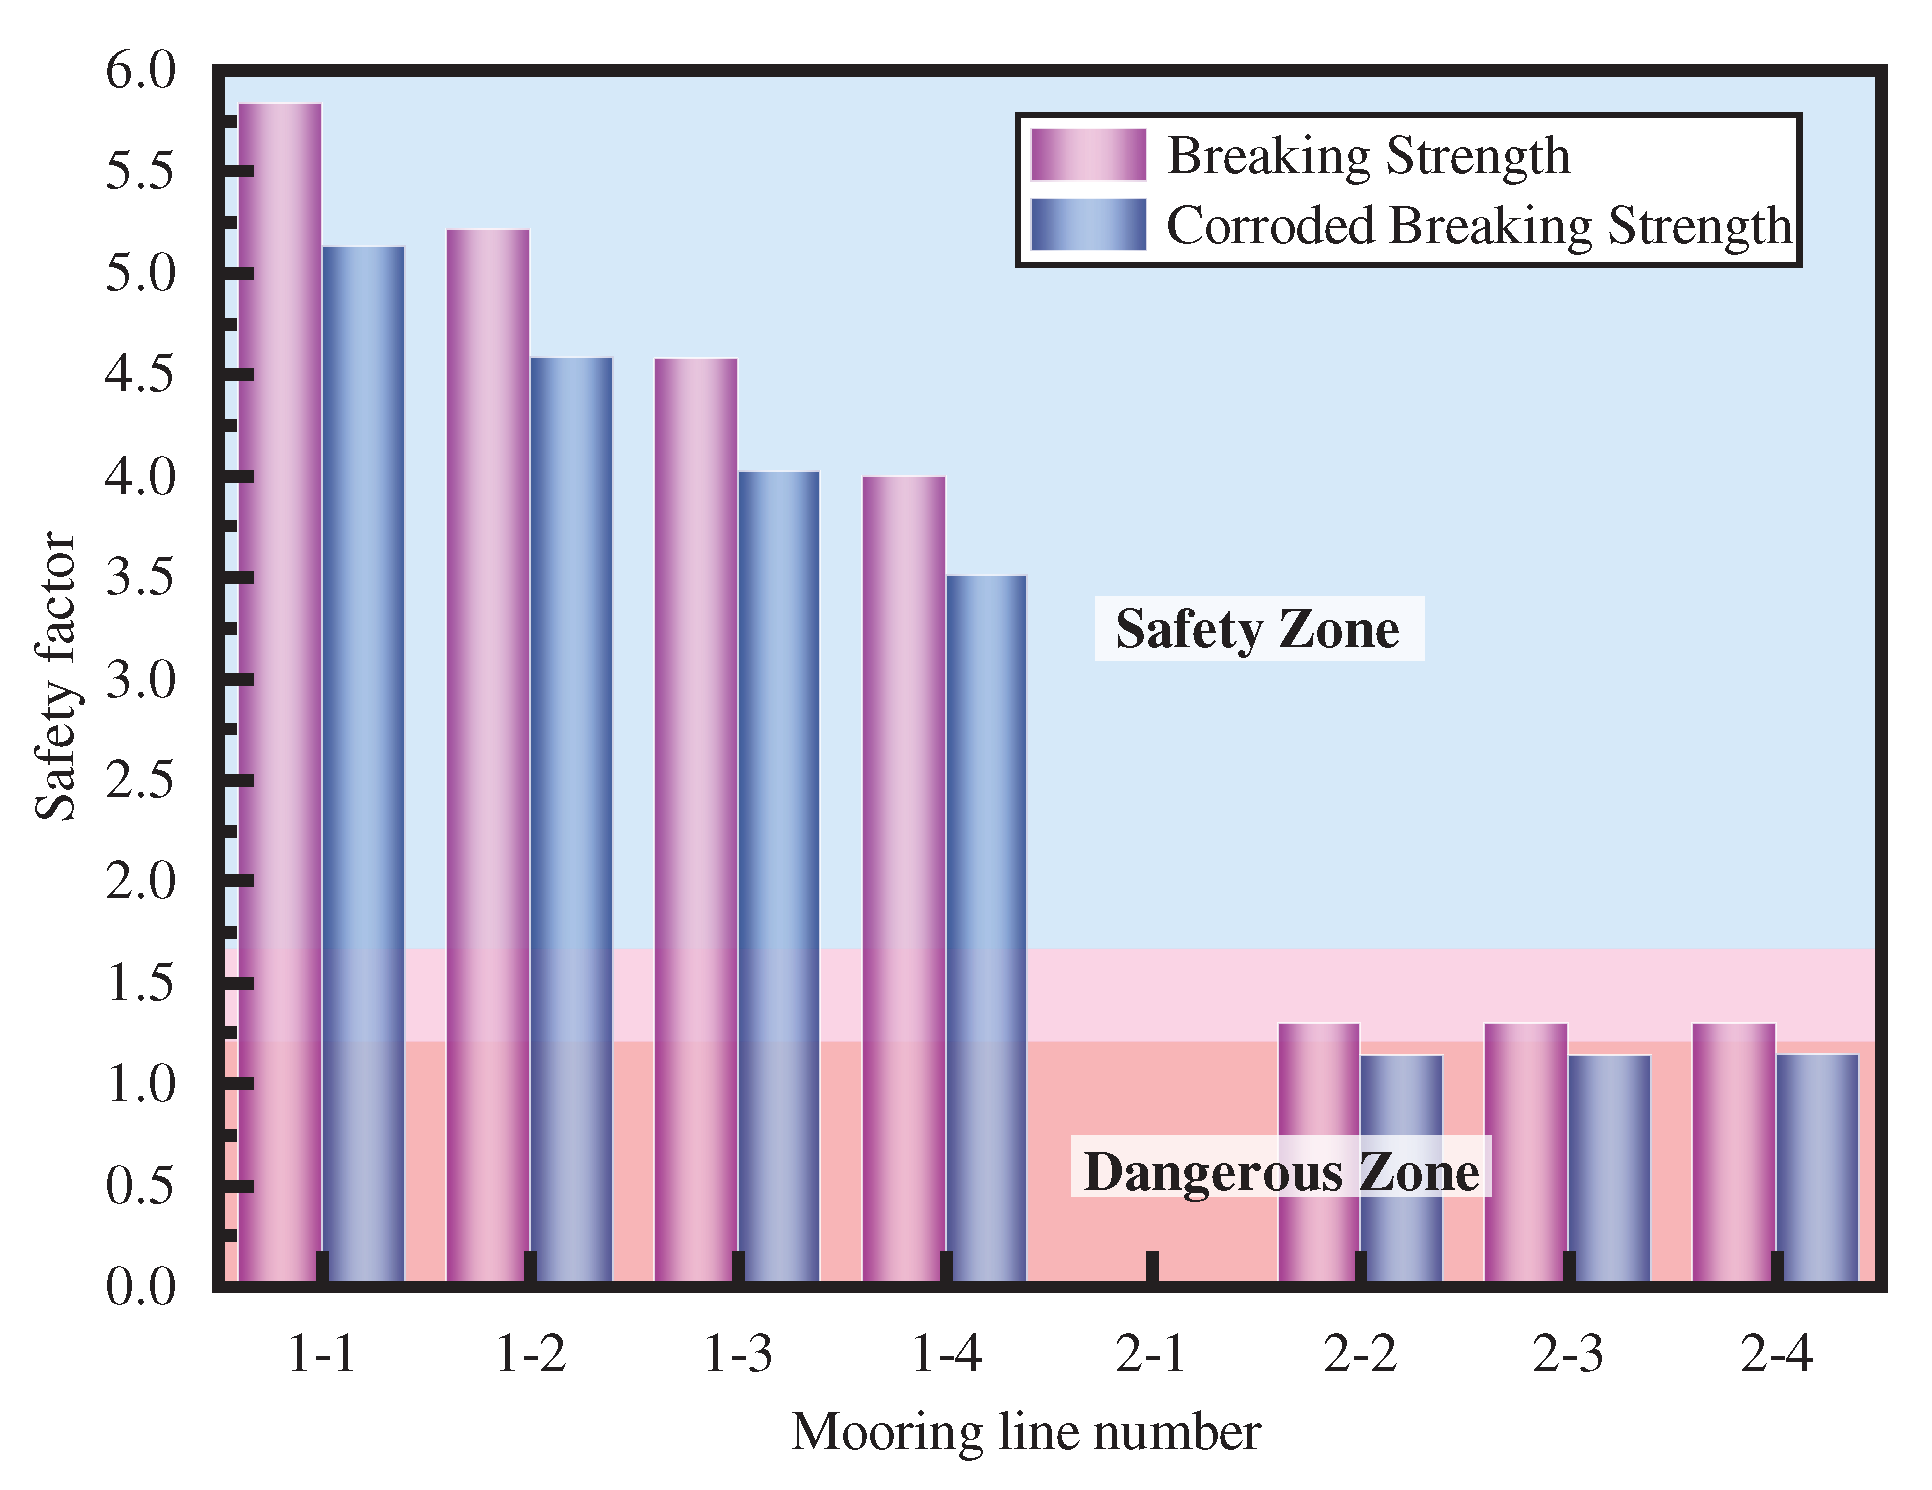
Figure 11 that when the platform encounters a 100-year return period ocean condition under 180°, the safety factors of the mooring lines are all higher than the engineering specification requirements (1.67) considering the effect of corrosion (corrosion breaking strength is provided by the actual engineering). And when the platform encounters a 100-year return period ocean condition under 135°, the safety factors of the mooring line 2-1~2-4 considering the effect of corrosion is already very close to the minimum safety factor in the engineering specification. Similarly, when the platform encounters a 1000-year return period ocean condition, the safety factors of the mooring lines are greatly reduced, as shown in
Figure 12. Especially at the 135°, without considering the effect of corrosion, the safety factors of the mooring line 2-1~2-4 is lower than the engineering specification, so there is a risk of failure. Since the mooring line has failure risk, this section also calculates the safety factors of the remaining mooring lines after the failure of a single mooring line, as shown in
Figure 13. When mooring line 2-1 fails, the safety factor of mooring lines 2-2~2-4 are higher than the specification requirement, but considering the effect of corrosion, the safety factor will be lower than the specification requirement (1.2), and there is still a risk of continuous failure of the remaining mooring lines. Therefore, the changing law of motion responses after mooring line(s) failure and the influence of mooring line failure on the SCR(s) will be analyzed in the following sections.
Figure 9.
Semi-submersible platform coupling system.
Figure 9.
Semi-submersible platform coupling system.
Figure 10.
Directional extremes of irregular wave.
Figure 10.
Directional extremes of irregular wave.
Table 3.
Ocean environment parameters.
Table 3.
Ocean environment parameters.
| Parameter |
Hs (m) |
Tp (s) |
|
Wind speed (m/s) |
Surface current (m/s) |
| 100-year (E) |
13.4 |
14.9 |
2.4 |
40.4 |
1.73 |
| 100-year (SE) |
12.2 |
14.5 |
2.4 |
40.4 |
1.73 |
| 1000-year (E) |
16.9 |
15.8 |
2.4 |
47.7 |
2.02 |
| 1000-year (SE) |
15.4 |
15.4 |
2.4 |
47.7 |
2.02 |
Table 4.
Wind force coefficients.
Table 4.
Wind force coefficients.
| Dir |
X |
Y |
Z |
RX |
RY |
RZ |
| ° |
KN/(m/s)2 |
KNm/(m/s)2 |
|
|
|
|
| -180 |
-2.30 |
-0.01 |
2.30 |
1.46 |
-95.97 |
0 |
| -135 |
-2.49 |
-2.58 |
3.59 |
74.39 |
-97.86 |
0 |
| -90 |
0.17 |
-3.09 |
3.09 |
83.50 |
2.75 |
0 |
| -45 |
2.57 |
-2.83 |
3.82 |
69.99 |
83.72 |
0 |
| 0 |
2.11 |
-0.07 |
2.11 |
1.27 |
65.44 |
0 |
| 45 |
2.34 |
2.73 |
3.59 |
-69.50 |
79.26 |
0 |
| 90 |
-0.02 |
3.12 |
3.12 |
-83.62 |
1.77 |
0 |
| 135 |
-2.74 |
2.72 |
3.87 |
-75.08 |
-100.05 |
0 |
| 180 |
-2.30 |
-0.01 |
2.30 |
1.46 |
-95.97 |
0 |
Table 5.
Current force coefficients.
Table 5.
Current force coefficients.
| Member |
Cd |
| Columns |
Above water |
1.2 |
| Under water |
1.1 |
| Pontoons |
Horizontal |
1.0 |
| Mooring lines |
Chain |
2.2 |
| |
Polyester |
1.2 |
| Risers |
- |
1.6 |
Table 6.
Requirements of the minimum safety factor of mooring line tension.
Table 6.
Requirements of the minimum safety factor of mooring line tension.
| |
Analysis method |
Limitation of maximum mooring line tension |
Safety factor |
| Intact |
Dynamic |
60 |
1.67 |
| Mooring line broken |
Dynamic |
80 |
1.25 |
Figure 11.
Safety factor of mooring lines under 100-year return period.
Figure 11.
Safety factor of mooring lines under 100-year return period.
Figure 12.
Safety factor of mooring lines under 1000-year return period.
Figure 12.
Safety factor of mooring lines under 1000-year return period.
Figure 13.
Safety factor of mooring lines after single mooring line failure under 1000-year return period.
Figure 13.
Safety factor of mooring lines after single mooring line failure under 1000-year return period.
4.2. Mechanism analysis of motion response
4.2.1. Steady-state response analysis
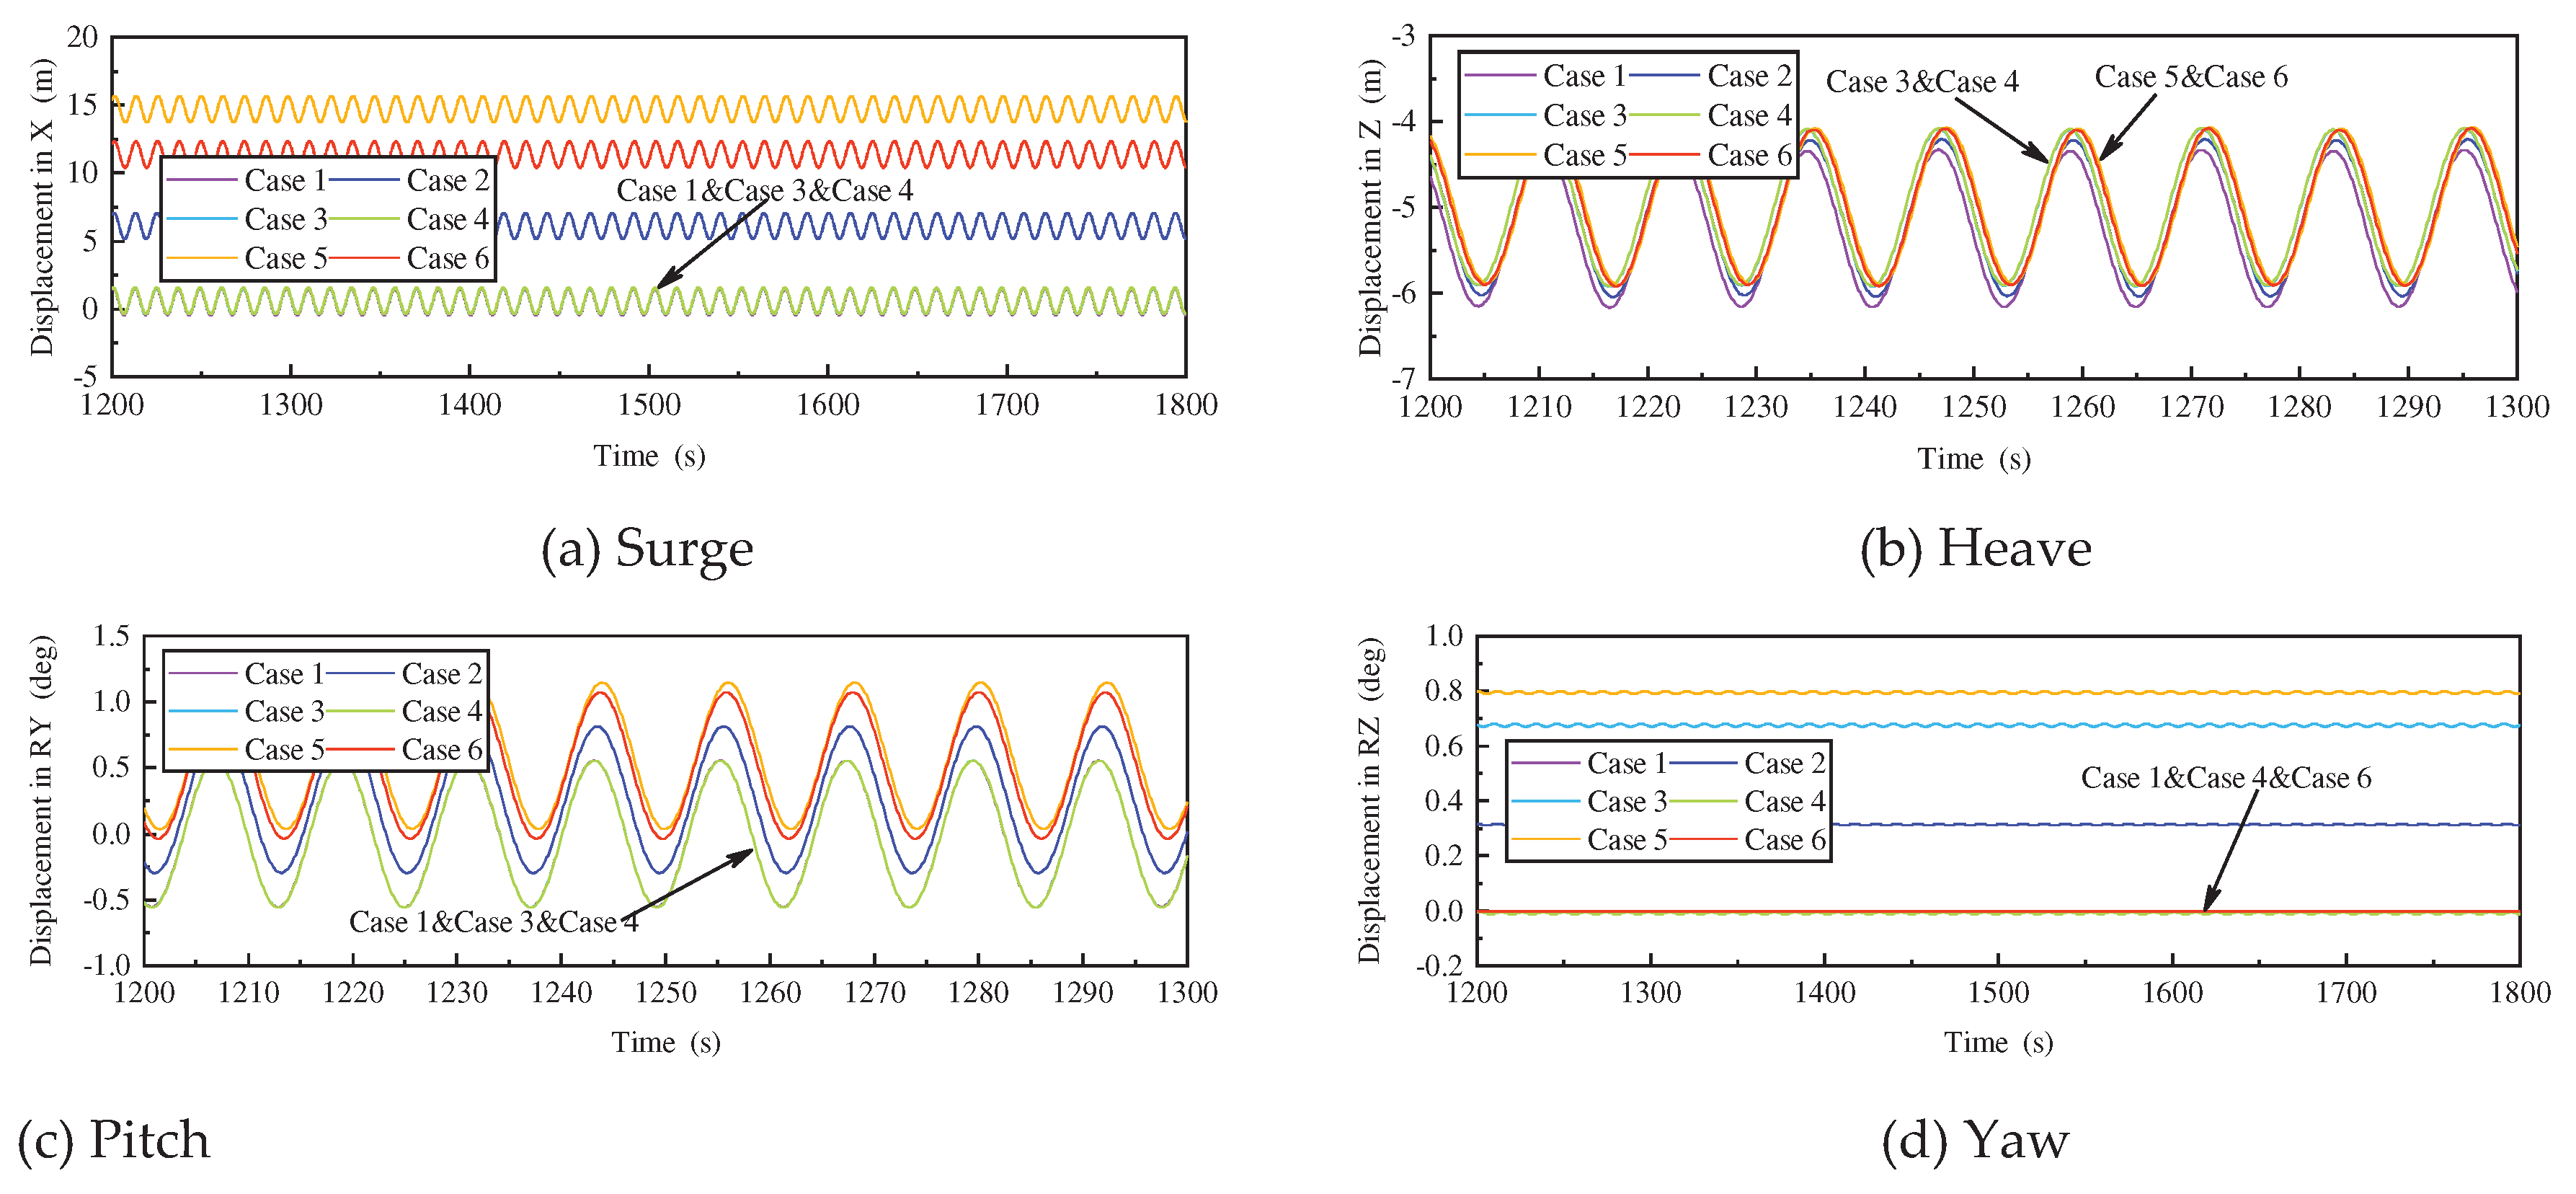
The analysis is first carried out for the changing law of motion responses, and this part is performed under regular wave. The wave direction is defined as 0°, which is the same as the forward direction of the X-axis. One and two mooring line failure models are established respectively (as shown in
Table 7), and time domain calculations and analysis are carried out under the regular wave with a wave height of 6.3m, a period of 12.1s and a wave direction of 0°. The calculation results are shown in
Figure 14.
Table 7.
Mooring line failure modes.
Table 7.
Mooring line failure modes.
| |
Line 1-1 |
Line 2-4 |
Line 3-1 |
Line 3-2 |
Line 4-4 |
| Case 1 |
× |
× |
× |
× |
× |
| Case 2 |
× |
× |
√ |
× |
× |
| Case 3 |
√ |
× |
√ |
× |
× |
| Case 4 |
× |
√ |
√ |
× |
× |
| Case 5 |
× |
× |
√ |
√ |
× |
| Case 6 |
× |
× |
√ |
× |
√ |
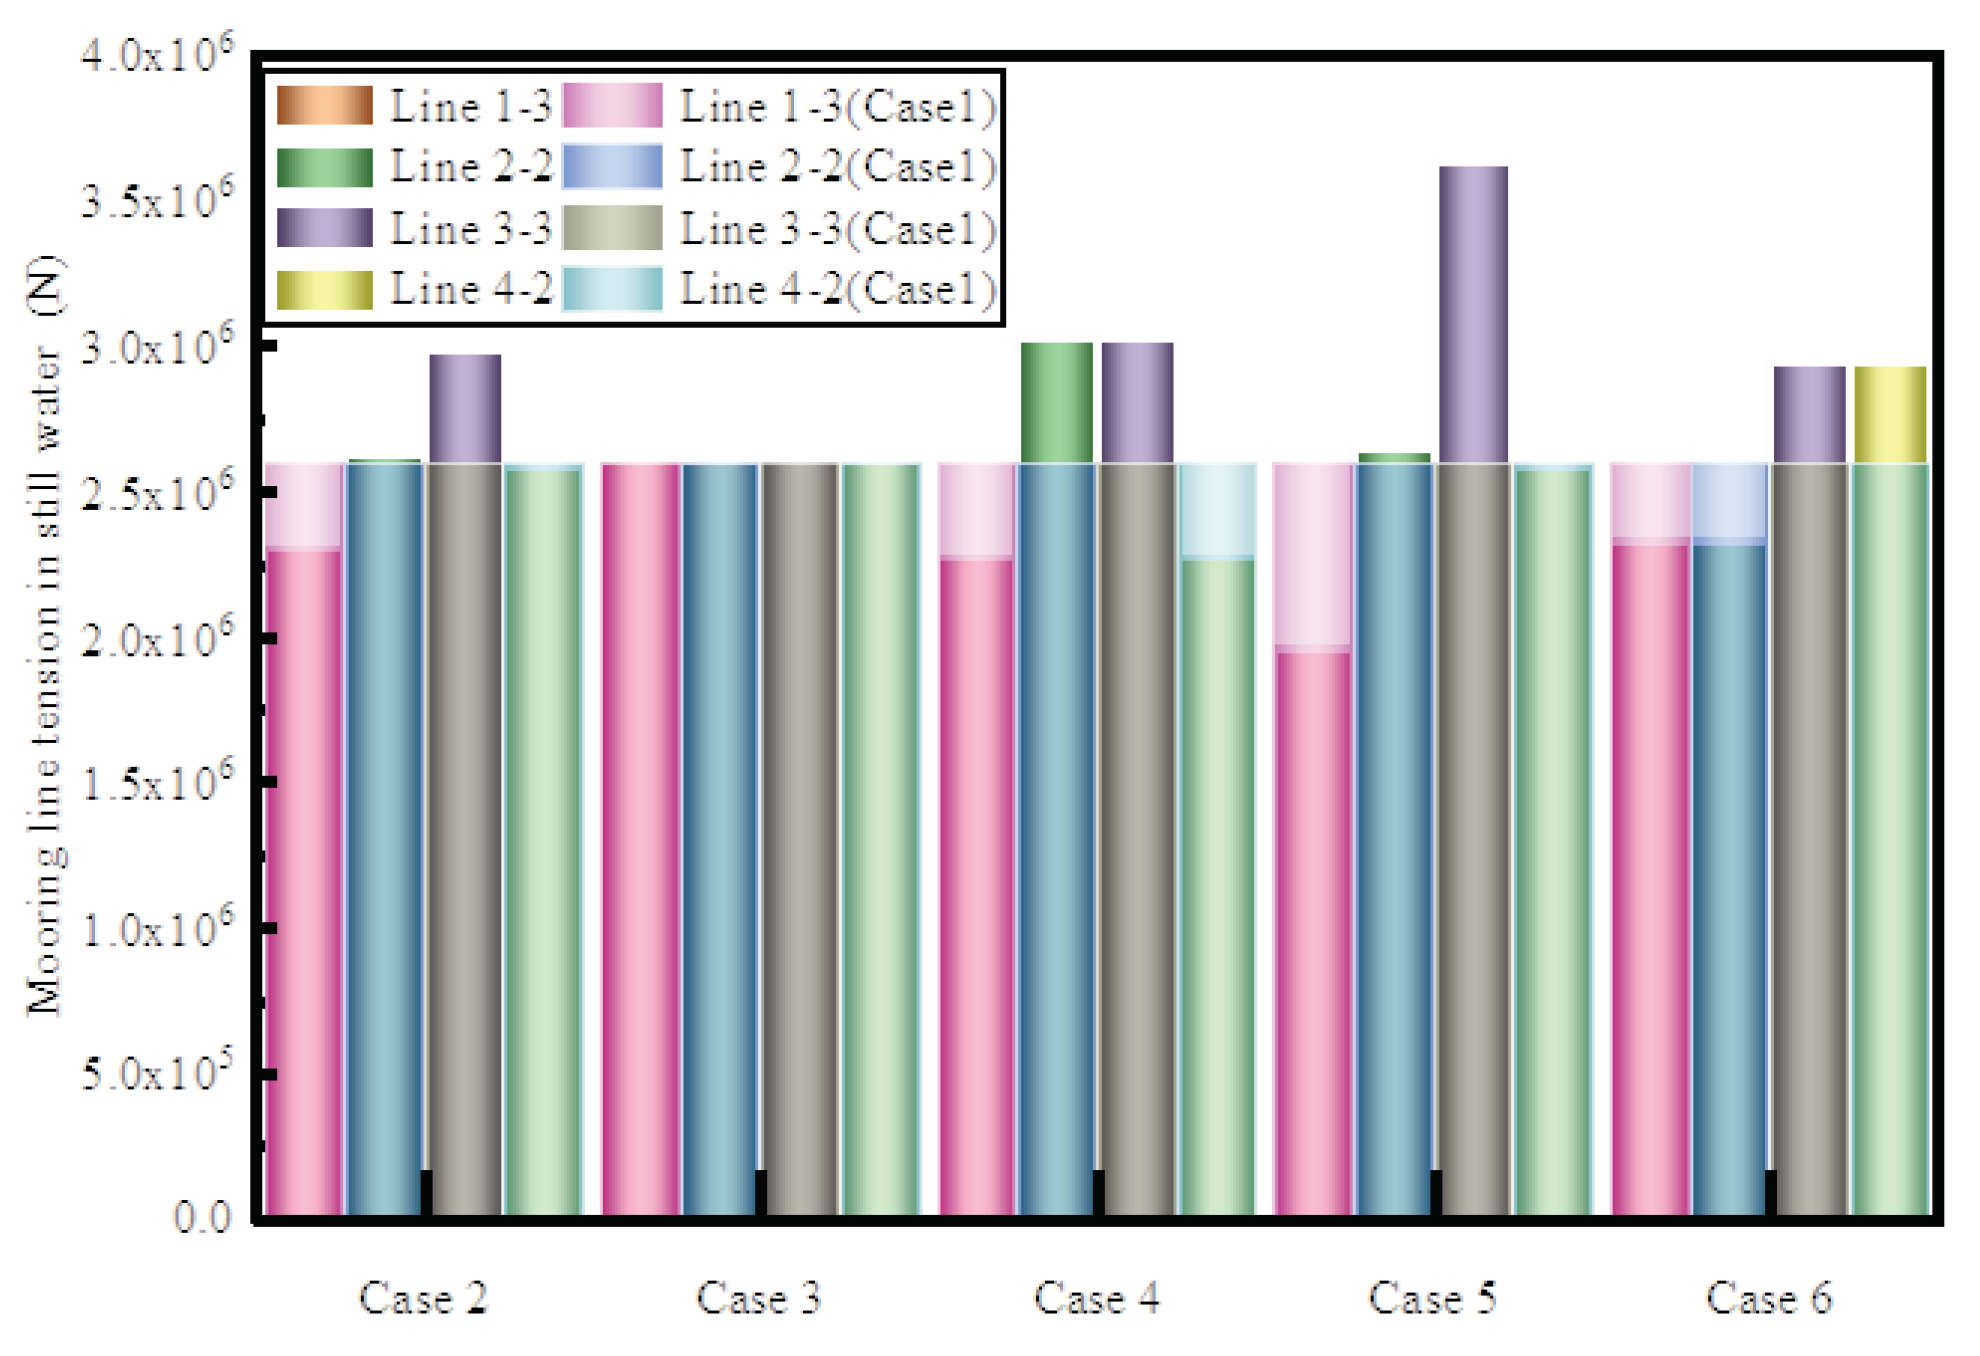
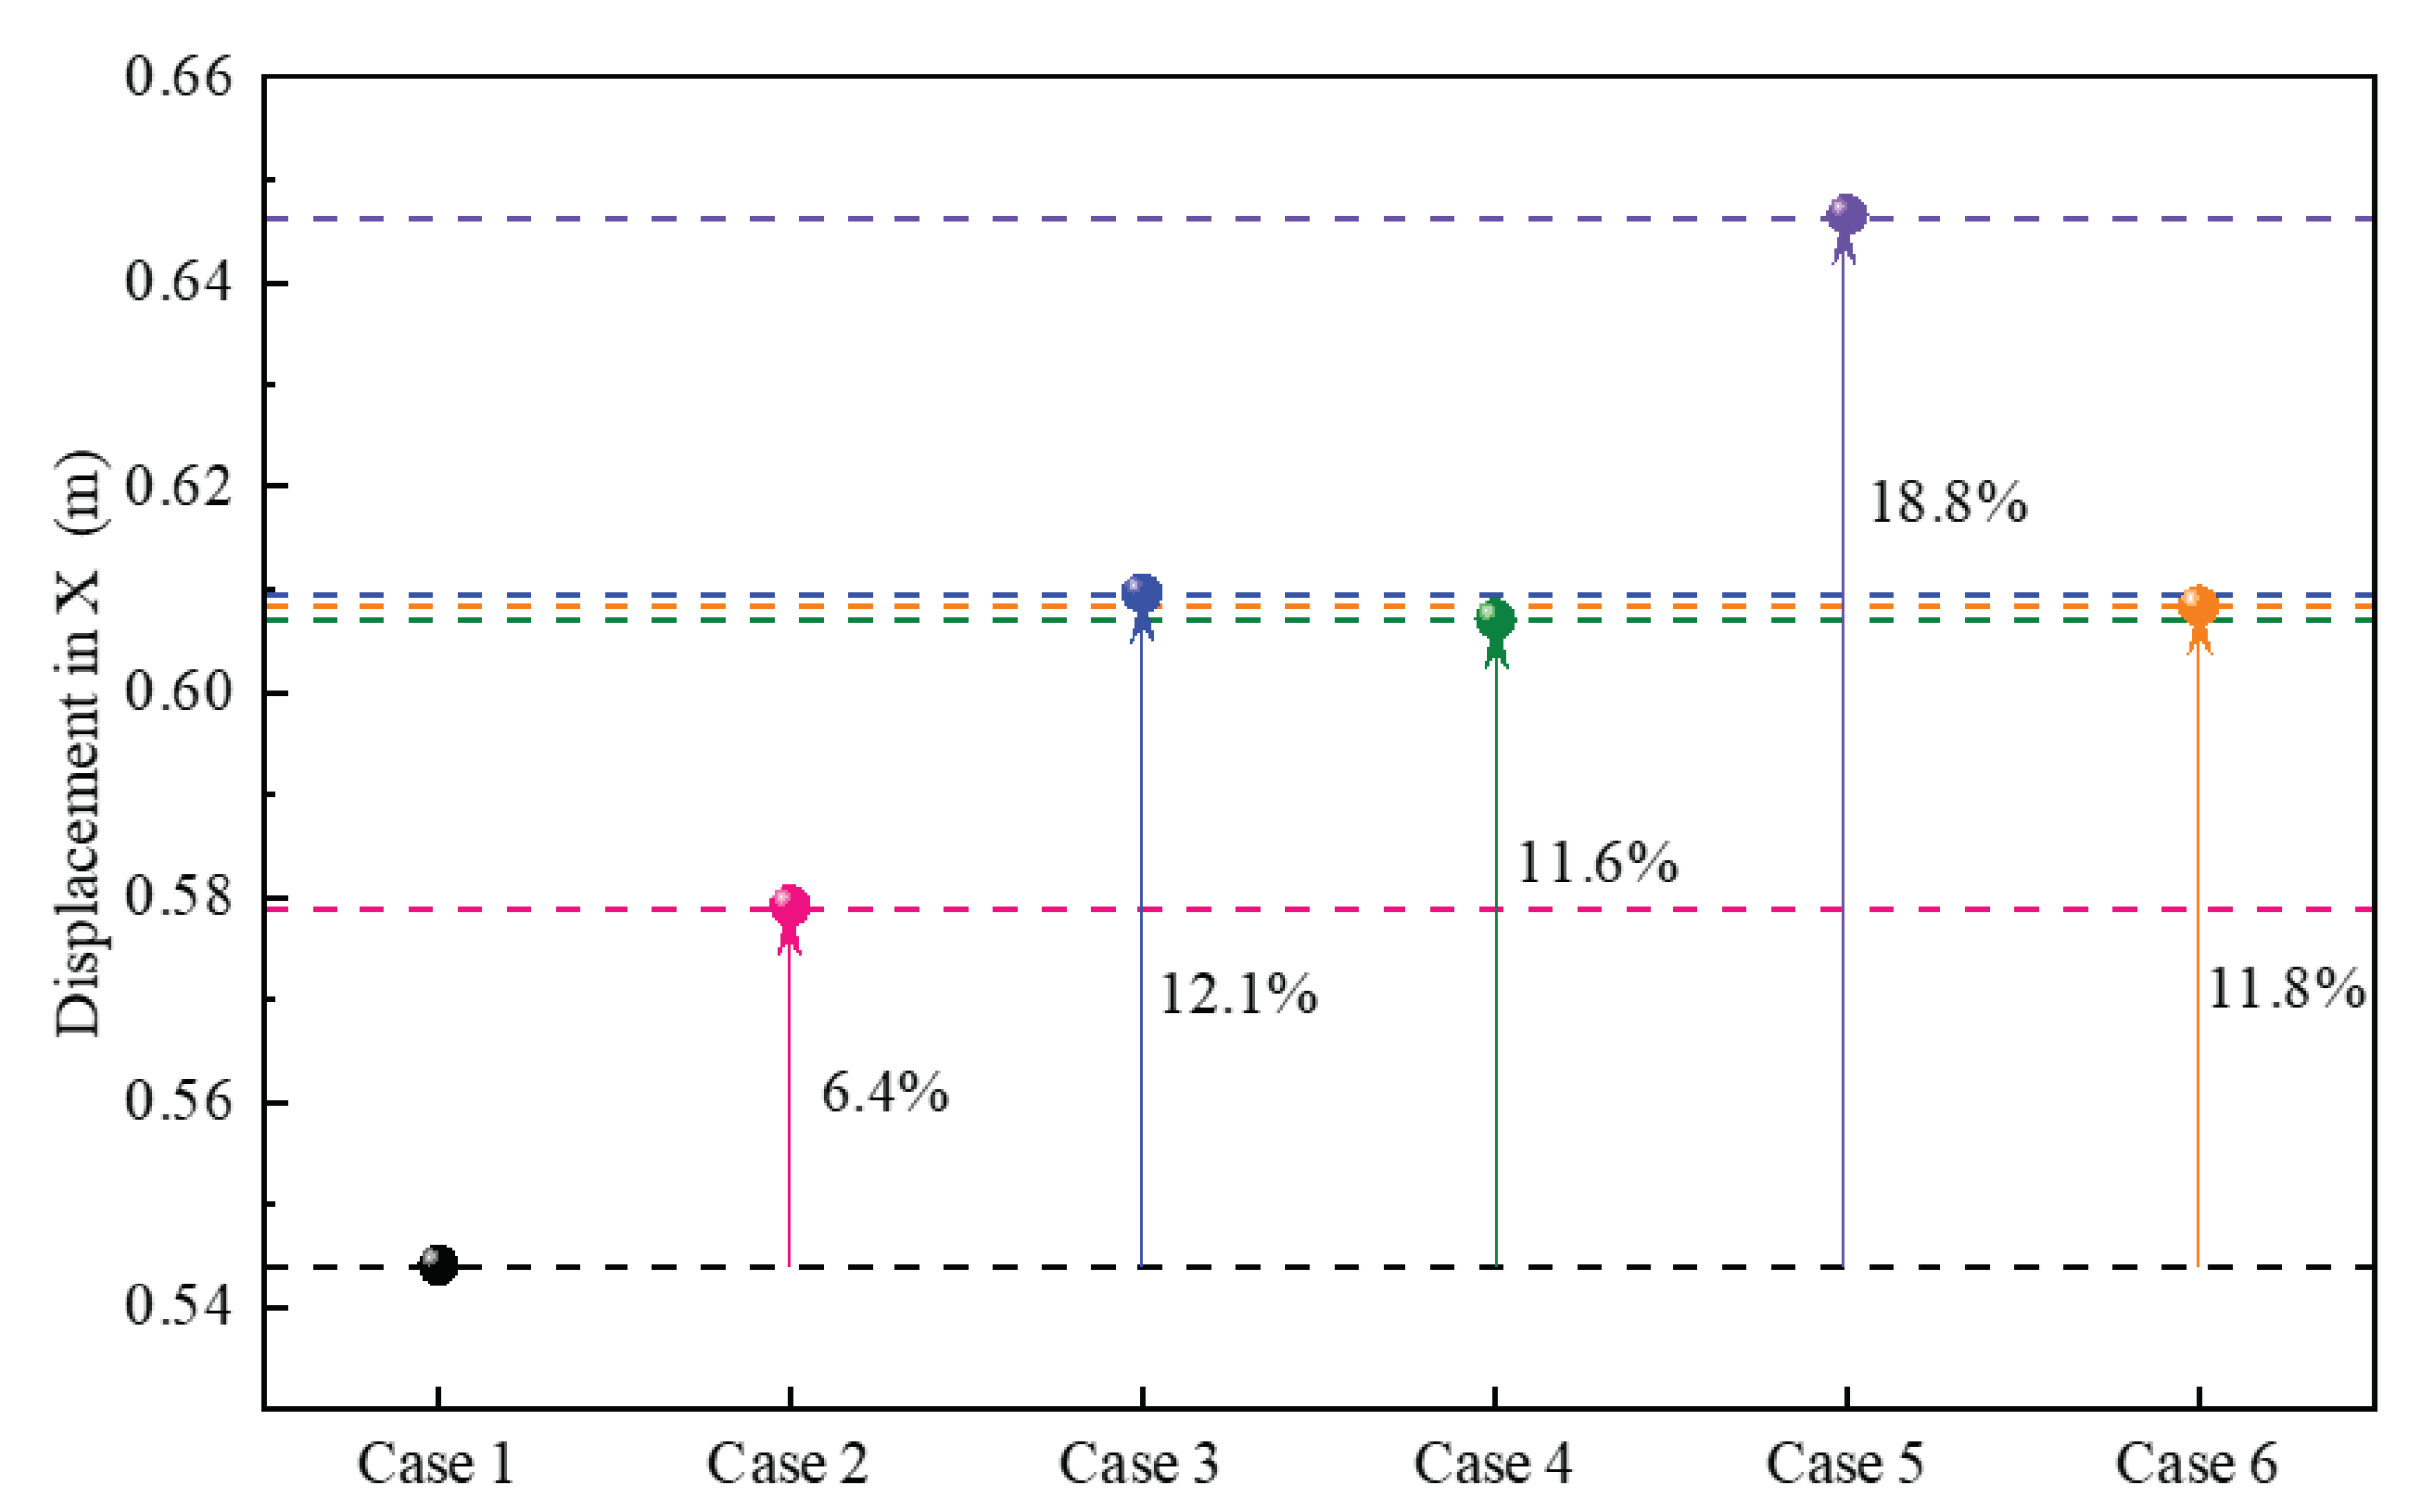
According to the motion response curves, except for the yaw response, the vibration of pitch, heave and pitch responses can be regarded as simple harmonic motion. Taking the surge motion as an example, the motion responses of case 1/3/4 almost coincide. Case 2/5/6 differ significantly from the dynamic equilibrium position of case 1 and the motion response amplitudes are not very different. The reason is that in case 3, mooring line 1-1 and 3-1 are centrosymmetric about coordinate origin. When they fail, the remaining mooring lines are still symmetrical about the origin, and the mooring force is in hydrostatic equilibrium in the X direction, which will not affect the hydrostatic position of the platform. Similarly, when mooring line 2-4 and 3-1 fail, the combined mooring force in the X-axis direction is approximately zero and the platform will not be deflected in the X-direction. For case 5, since the two failed mooring lines are on the same column, the platform needs to redistribute the mooring forces to the remaining mooring lines in order to reach the new hydrostatic equilibrium position. As shown in
Figure 15, the tension of mooring line 3-3 increases significantly, causing the elongation of mooring line 3-3 and eventually causing the maximum offset of the platform.
Figure 14.
Motion responses under the regular wave.
Figure 14.
Motion responses under the regular wave.
Figure 15.
Mooring line tension comparison in still water.
Figure 15.
Mooring line tension comparison in still water.
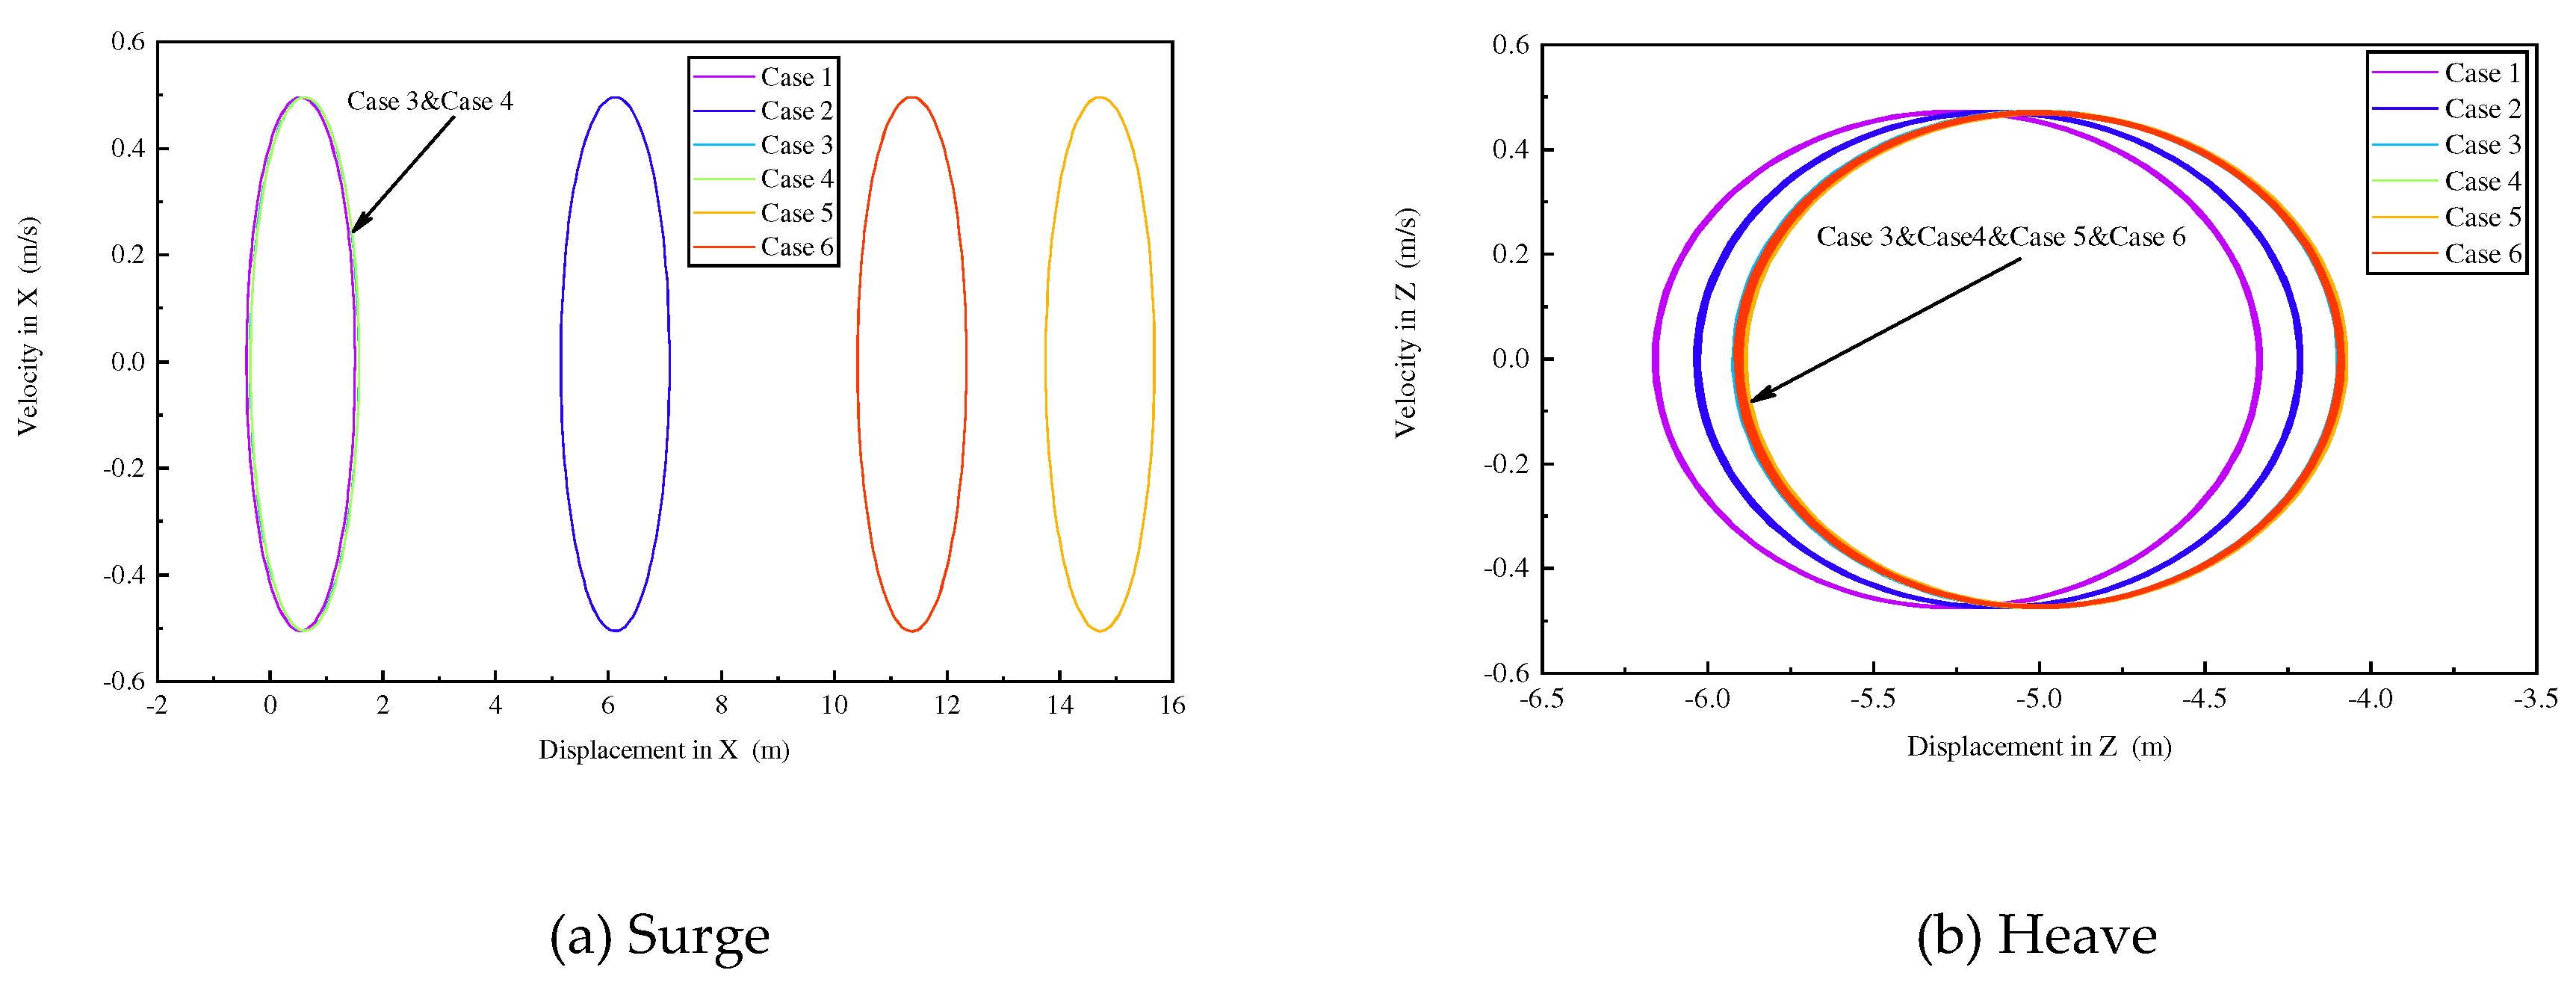
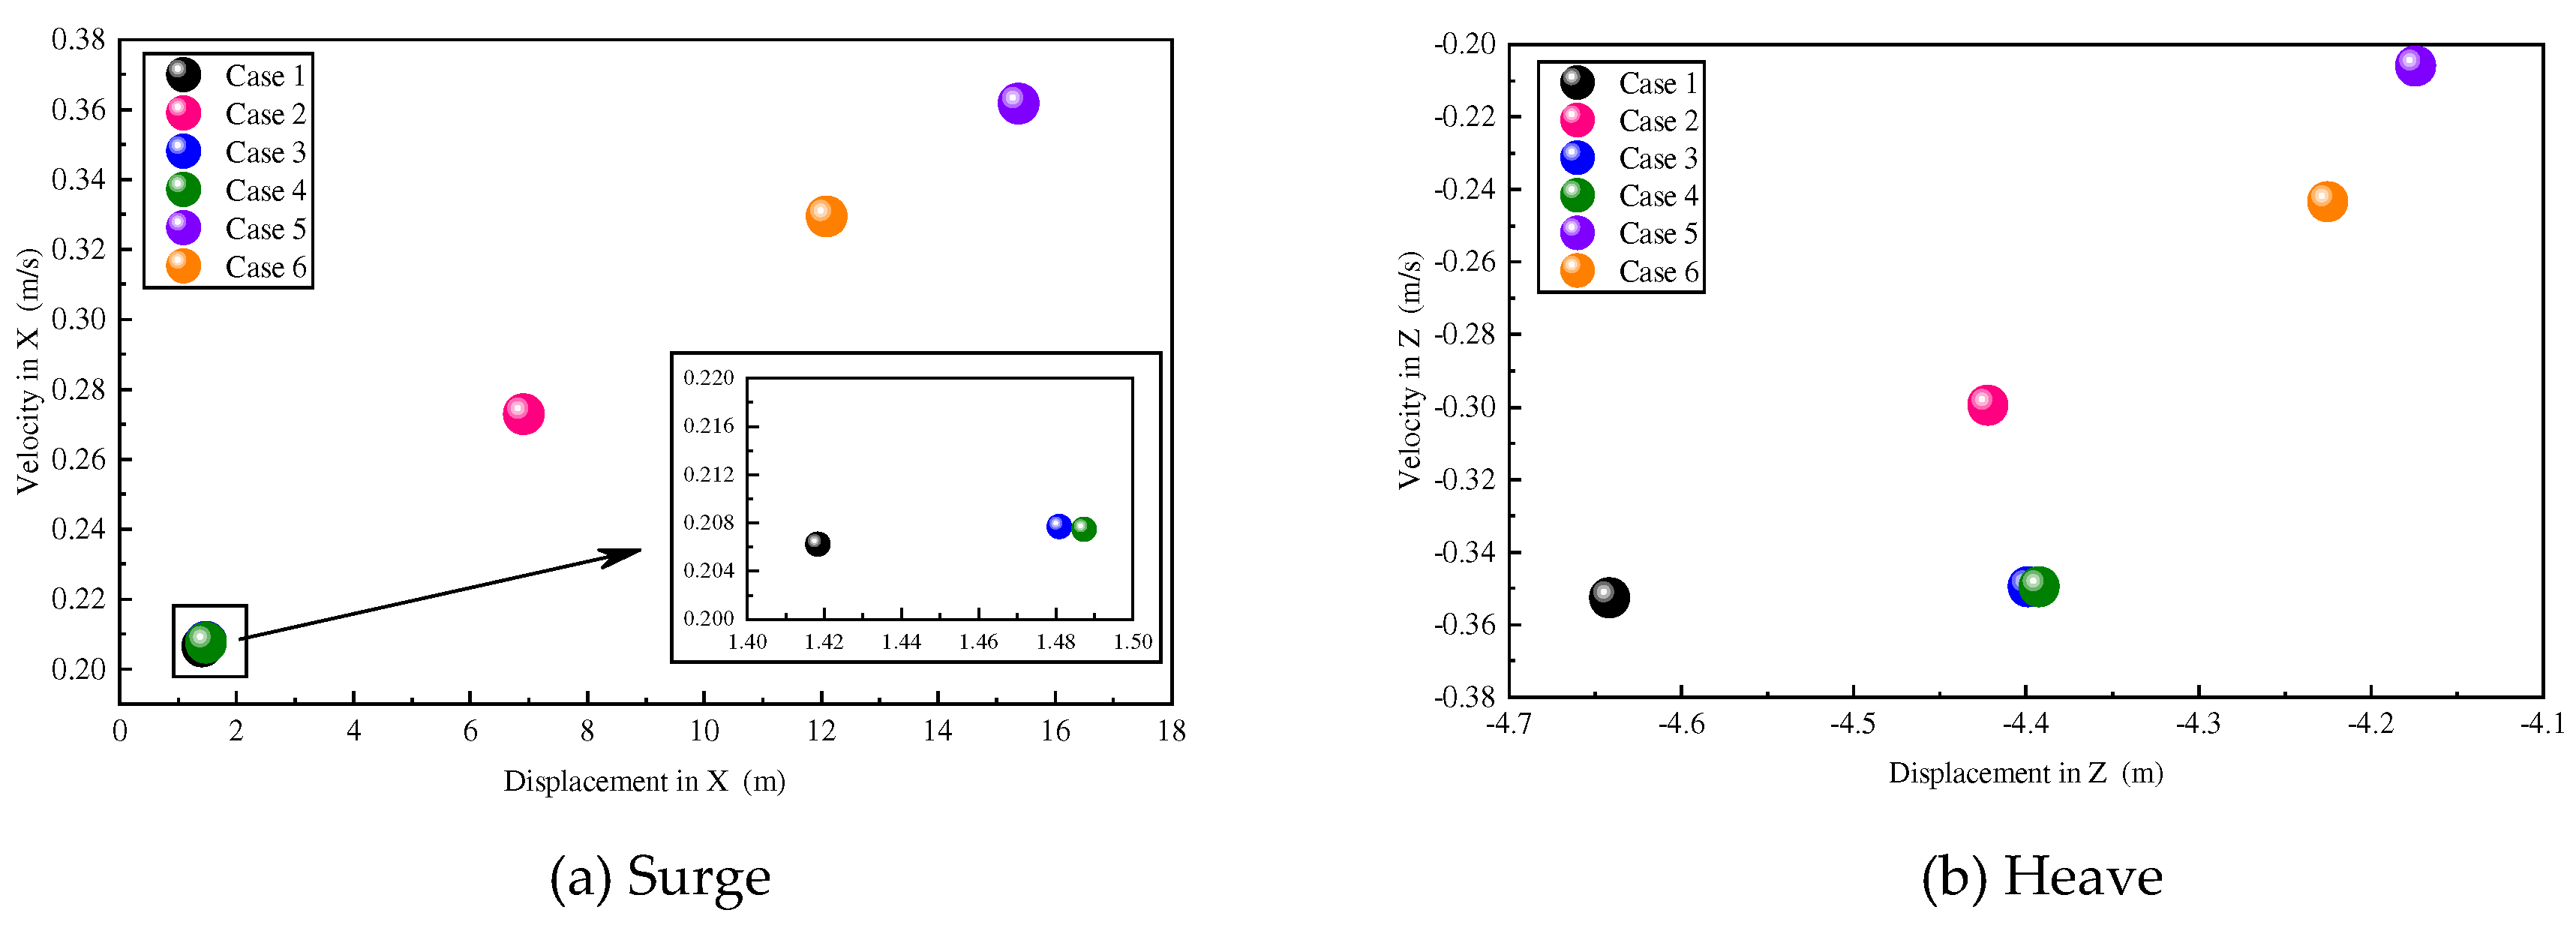
The above content is mainly from the surface to analyze the effect of different failure combinations of mooring lines on the motion response. In order to better analyze the effect of mooring line failure(s) on the motion response, this section is analyzed from two perspectives, qualitative and quantitative, respectively. Firstly, the motion characteristics are analyzed in
Figure 16 and
Figure 17. As in case 1, the motion phase traces in the remaining cases are all a closed curve, i.e., the limit loop, indicating that there exists a stable periodic solution for the platform, which will not cause the platform motion instability due to the failure of the mooring line(s). From the Poincare mapping, it can be seen that there is only one point on the phase diagram in all six cases, indicating that the platform system under the regular wave is a 1-cycle motion regardless of the mooring line failure.
The above analysis shows that the platform system can be considered as a linear system regardless of the mooring line failure. For the linear system, quantitative analysis is carried out in terms of equilibrium position and amplitude respectively. Firstly, the change of the equilibrium position is analyzed. As shown in
Figure 18 and
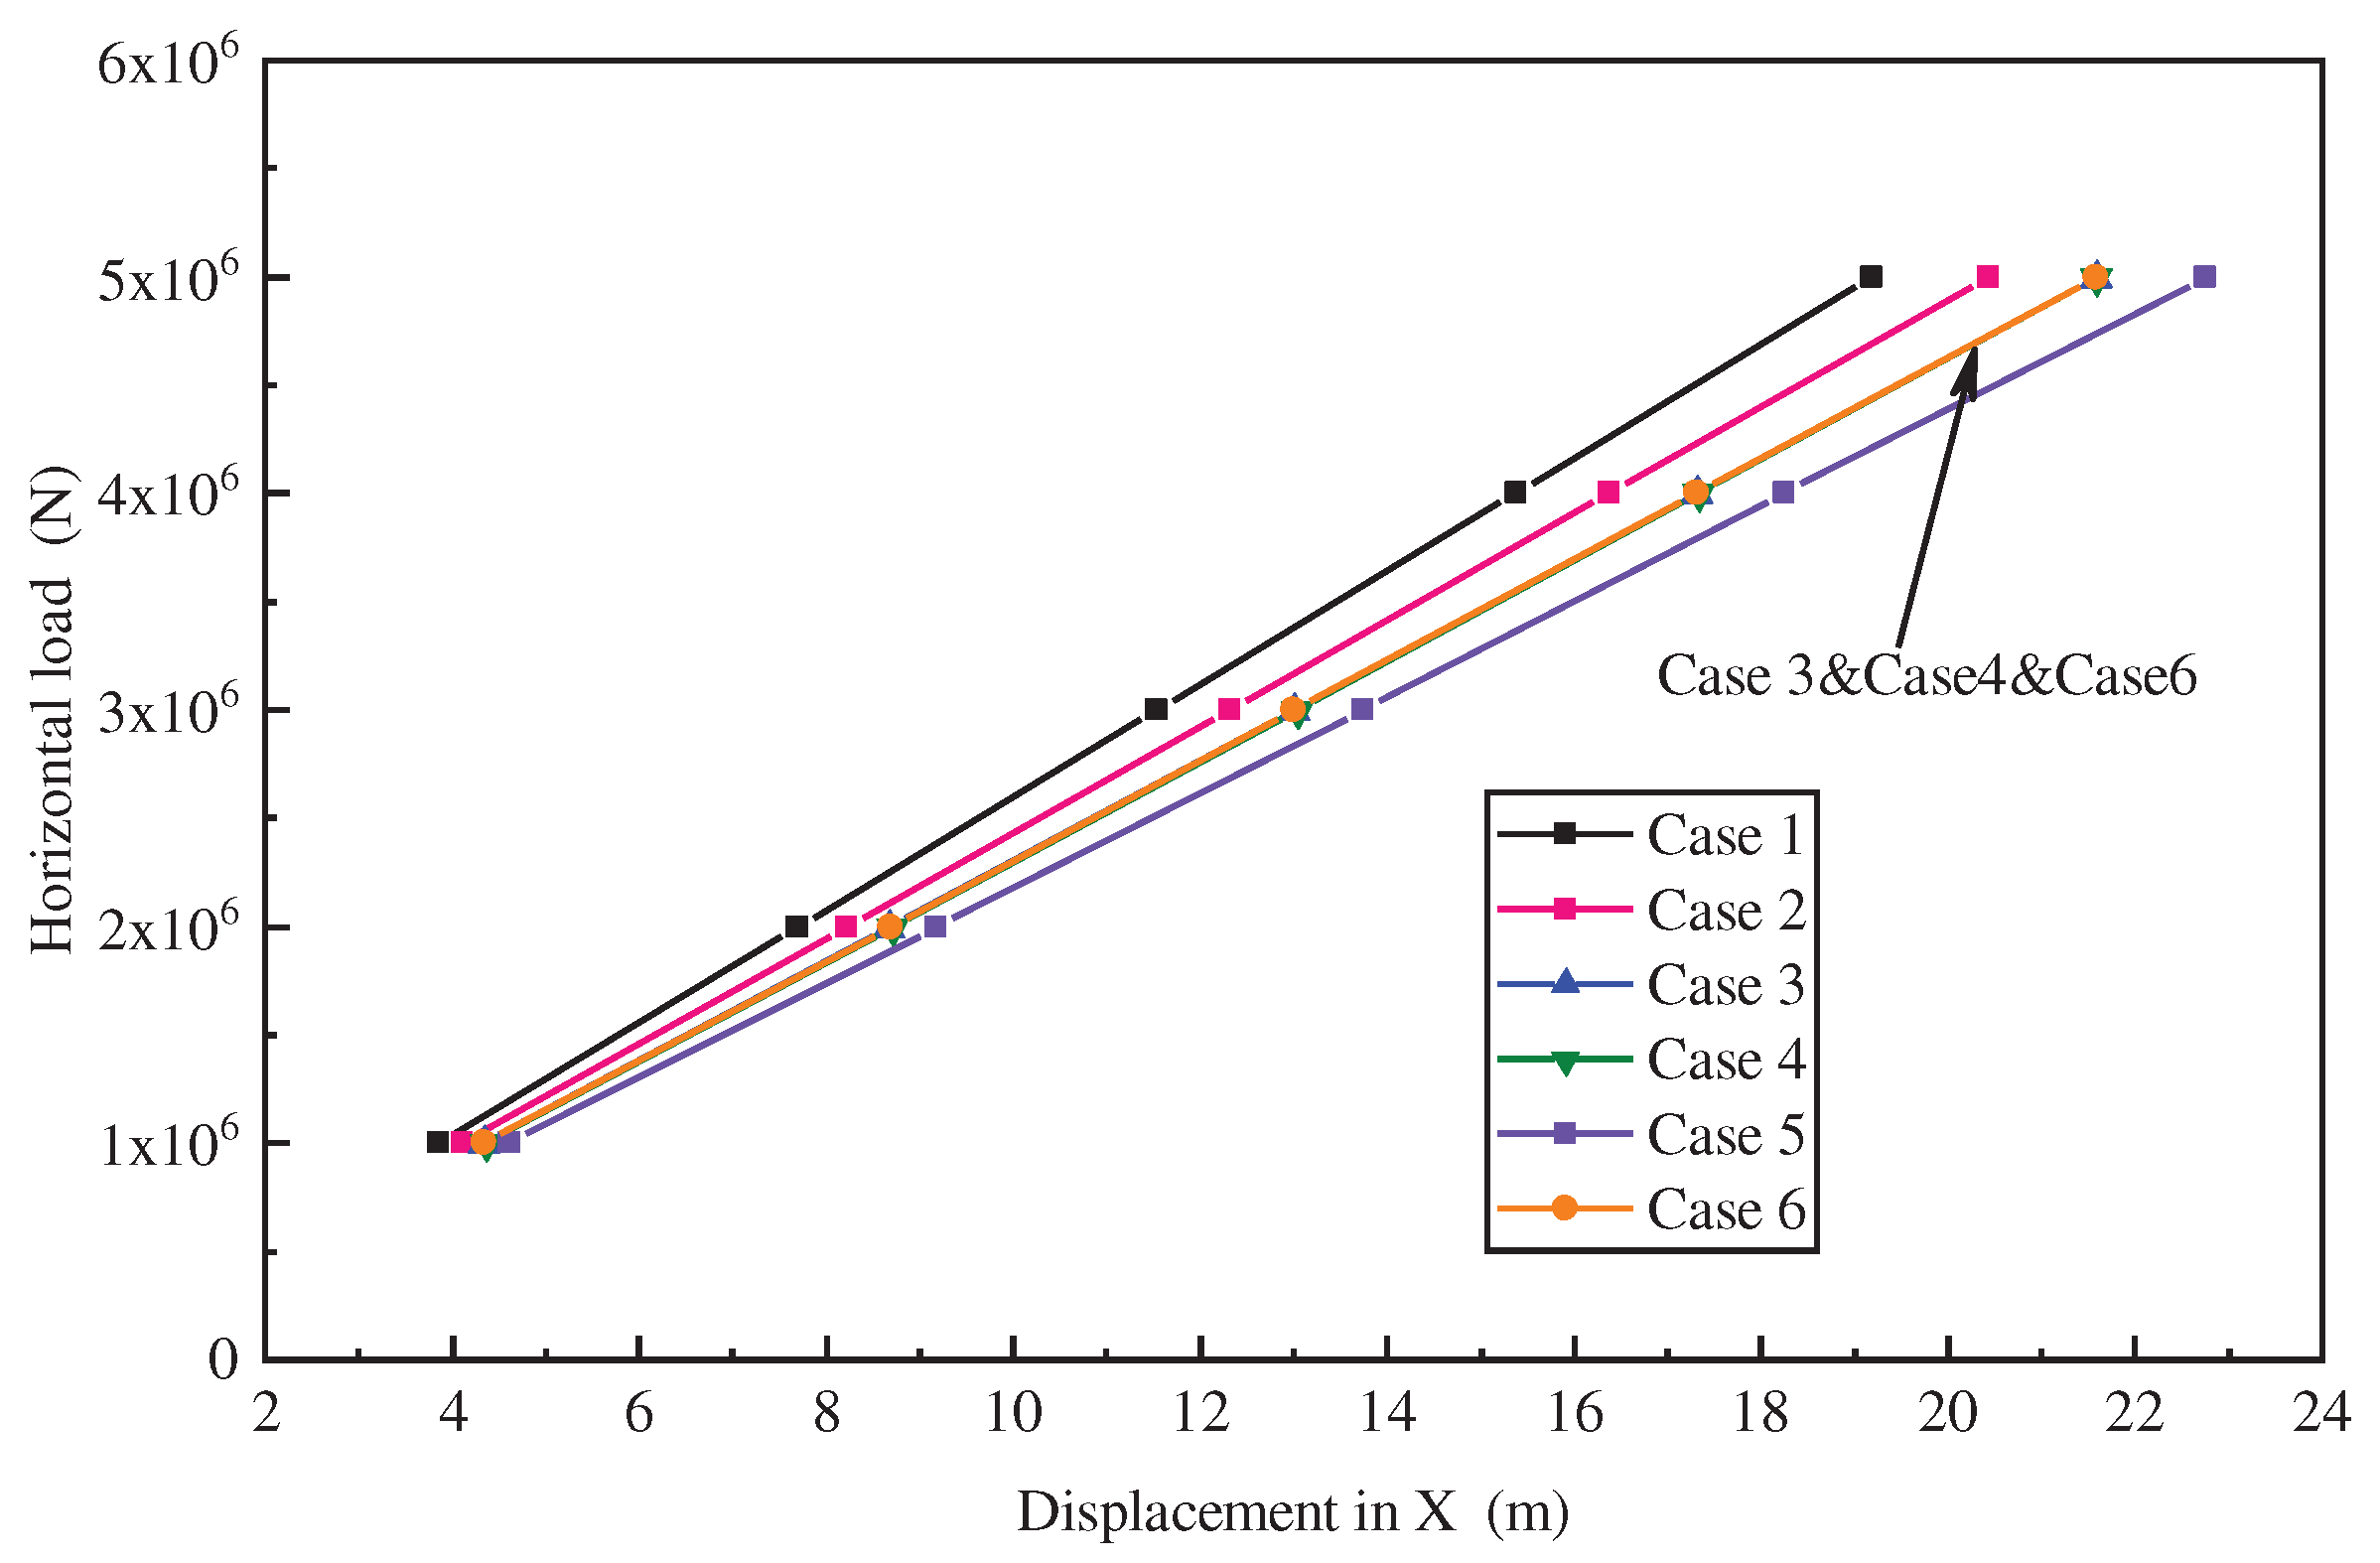
Figure 19 , the change of stiffness and equilibrium position of the platform system under different cases are shown respectively. Compared to case 1, the platform stiffness of case 2/3/4/5/6 decreases by 6.2%, 11.2%, 11.0%, 15.6% and 11.4%, respectively. By bringing the change rate of stiffness into the following equation, the change rate of equilibrium position can be calculated, and the results are 6.5%, 12.6%, 12.3%, 18.4% and 12.8%, which are similar to the numerical calculation results in
Figure 19. From the calculation results, it can be seen that the drift value from the hydrostatic equilibrium position to the dynamic equilibrium position depends on the magnitude of the stiffness change.
where
is the change rate of the equilibrium position,
is the change rate of the stiffness,
and
are external forces.
Secondly, the amplitude of the motion response is also quantitatively analyzed. As can be seen in
Figure 18, the platform stiffness after the single or two mooring line failures remains linear. For a linear system, the motion amplitude can be calculated by the equation (34) and (35) of the steady-state response due to forced vibration of the mass-spring-damper system. The calculated results are compared with the numerical simulation results and are shown in
Table 8. As can be seen from the table, the theoretical and numerical simulation values are very close to each other. As can be seen from the equation, the main factors affecting the response amplitude are the external force amplitude, the stiffness and the damping ratio. Although there is a significant difference in stiffness between the six cases, the change in platform draft caused by the failure of the mooring line(s), which in turn affects the change in external force, the change in stiffness and external force will ultimately result in a small difference in the platform response amplitude.
where
is the motion amplitude,
is the static displacement caused by the amplitude of the dynamic load,
is the dynamic amplification factor,
is the damping ratio,
is the frequency ratio,
is the external excitation frequency, and
is the natural frequency of the system.
4.2.2. Transient response analysis
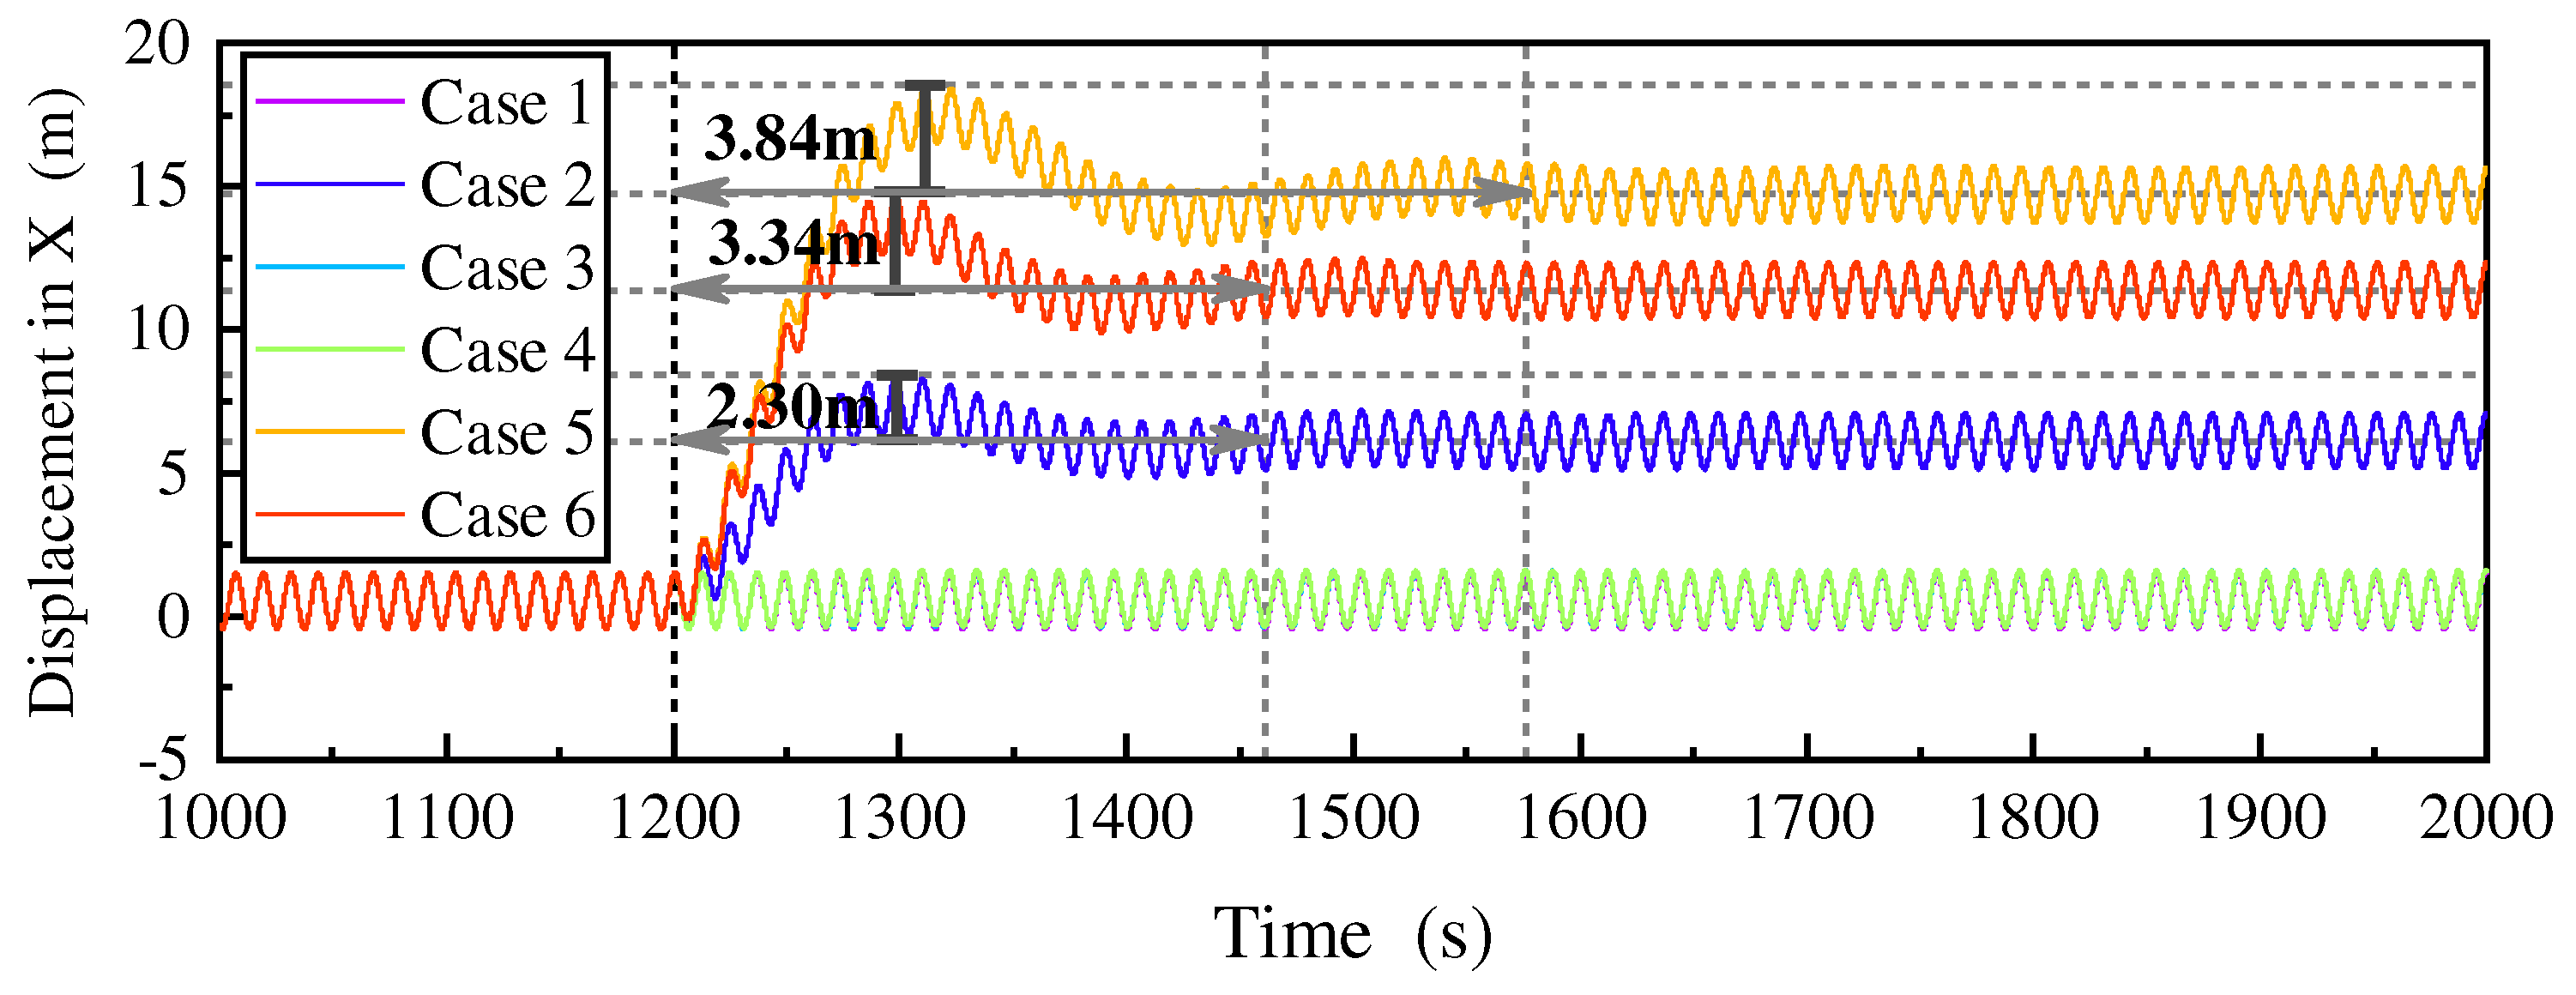
In addition to the analysis of steady-state motion, transient processes in different failure modes also need to be analyzed. As shown in
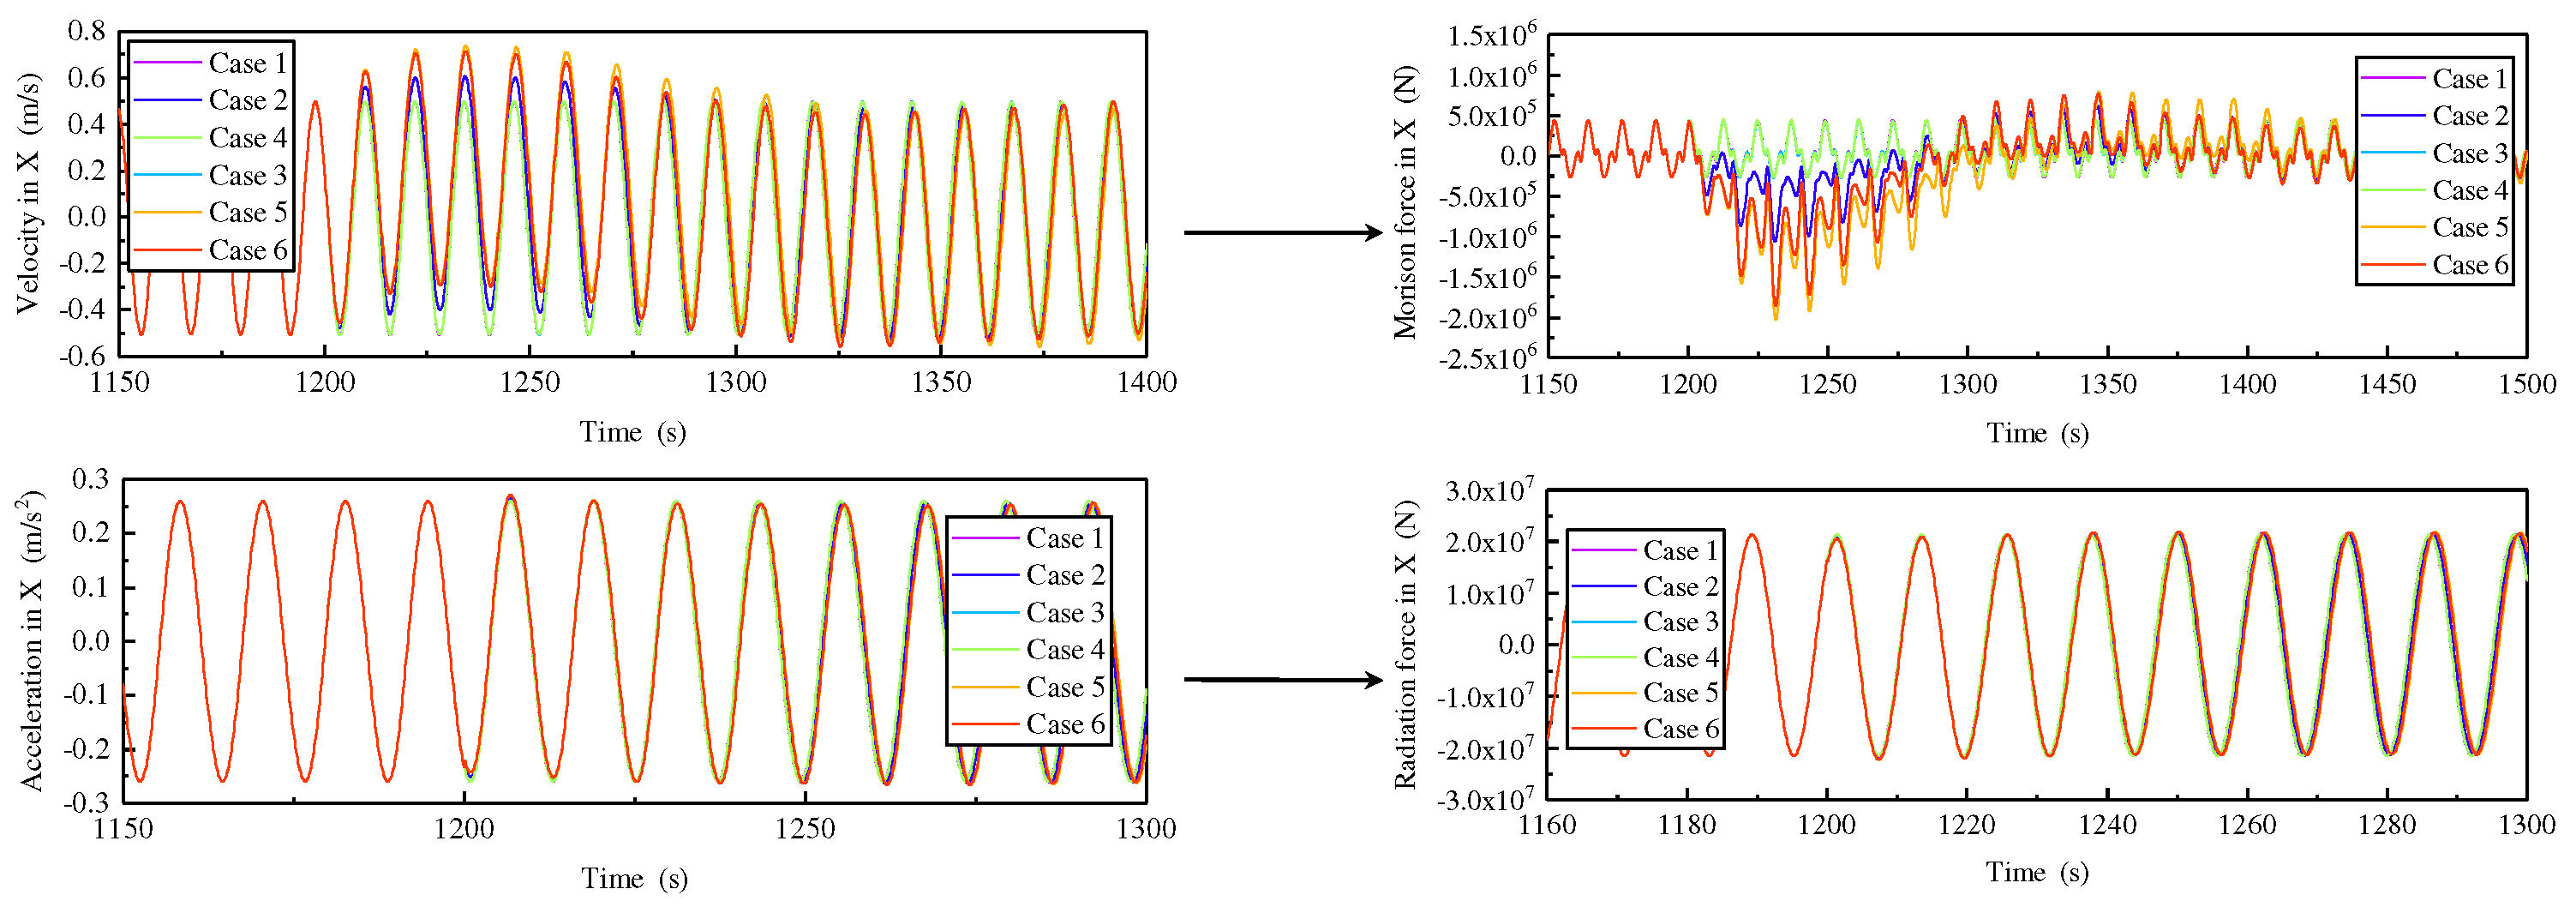
Figure 20, at the moment of mooring line(s) failure, case 3 and case 4 show little change in their motion response compared to case 1. The remaining three cases are not only significantly different in terms of maximum motion response, but the transient times are also different, specifically in terms of the time between the moment of failure and the response maximum and the time between the response maximum and the steady response. The reason for the different transient times is mainly due to the different damping of the platform system during the transient process of mooring line(s) failure. As can be seen from the equation of motion, the damping of the platform system consists of two main components, namely potential flow damping and viscous damping. The potential flow damping is mainly generated by the radiation force and the viscous damping is mainly generated by the Morison force. These two forces are related to acceleration and velocity respectively, as shown in
Figure 21. As can be seen from the figure, the acceleration and radiation force have not changed noticeably due to the failure of the mooring line(s), while the velocity and Morison force change more significantly, indicating that the Morison force is the main factor affecting the decay speed of the platform with little change in the total external force of the platform.
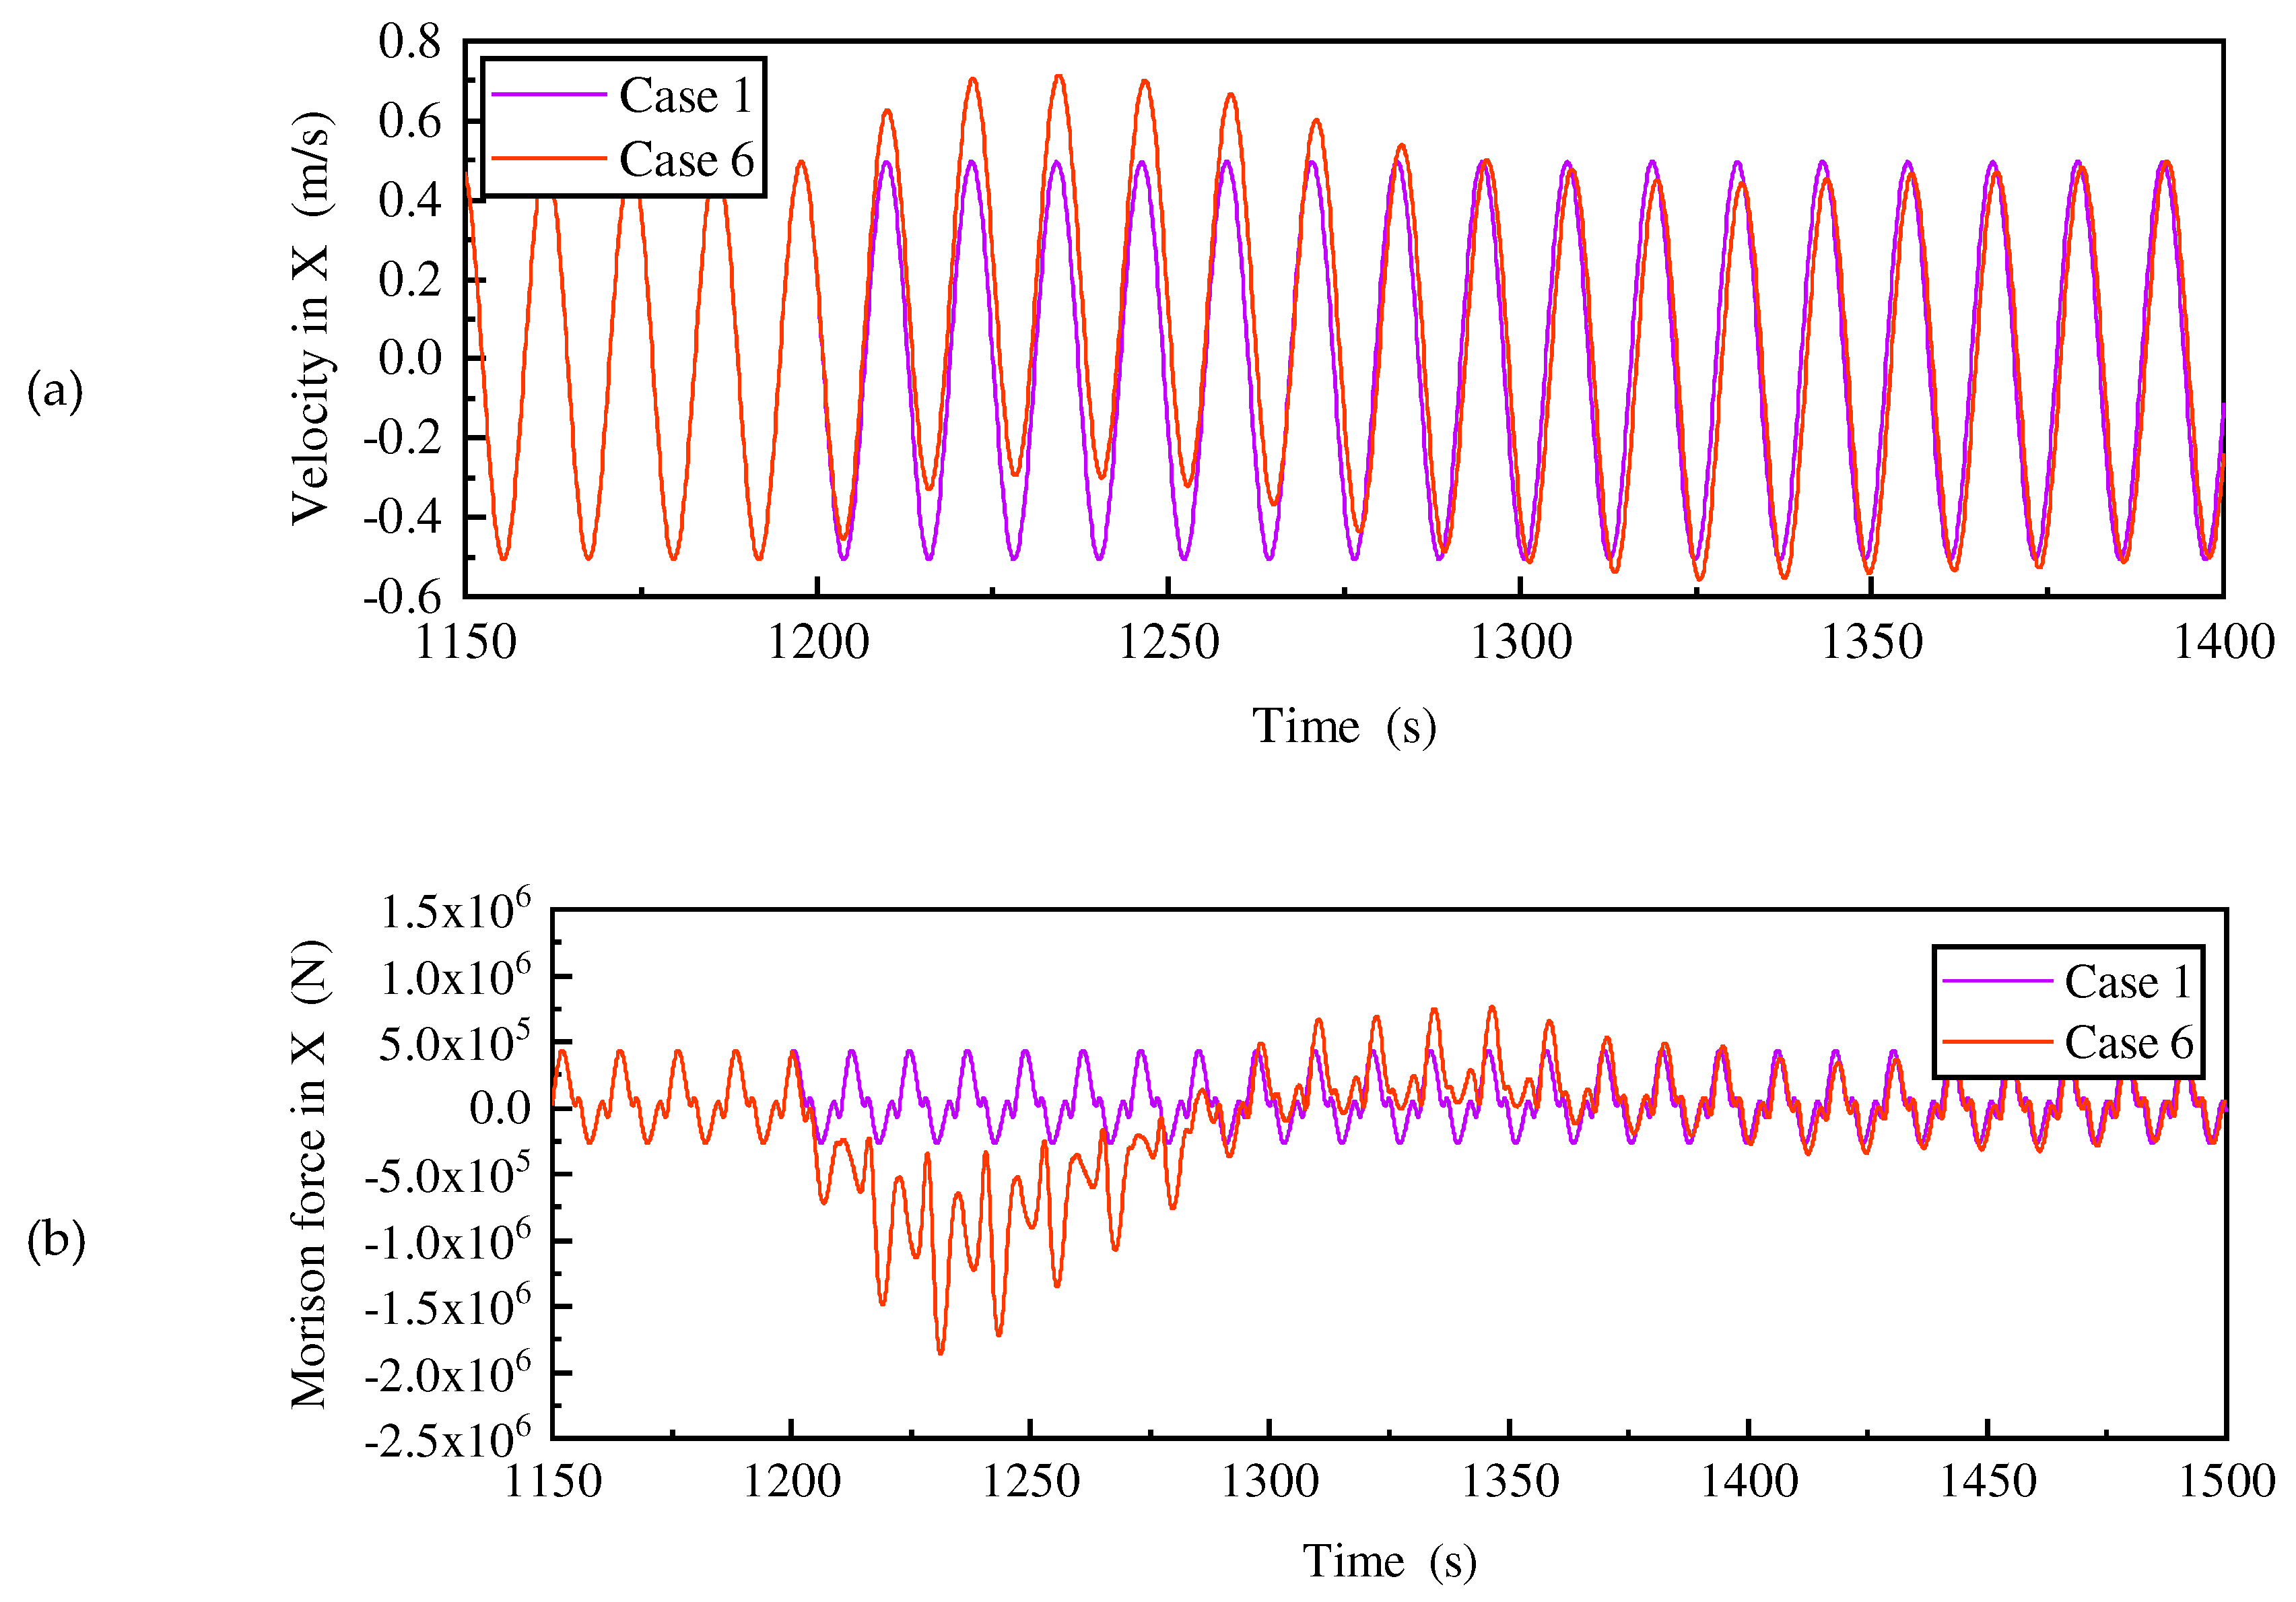
A detailed analysis comparing case 1 and case 6 is shown in
Figure 22. The velocity after mooring lines failure can be view as two components, one is the velocity caused by wave-frequency motion and the other is the drift velocity caused by mooring lines failure. The former velocity does not change, whereas the drift velocity undergoes a process of increasing positively and then decreasing to zero, followed by a negative increase and the decreasing to zero. As the drift velocity changes in the positive direction, the Morison force remains in the opposite direction to the direction of motion, delaying the time for the platform to reach its maximum motion response, which is reached when the drift velocity decreases to zero in the positive direction. Similarly, when the drift velocity changes negatively to zero, the platform completes the transition from maximum response to steady state motion and Morison force also tends to be stable. Case 2 and case 5 can take the same analysis, but the magnitude of the drift velocity and the magnitude of the Morison force are different and therefore the time required to change direction is different, resulting in different transient times.
It is worth mentioning that the Morison force is always non-linear, regardless of the failure of the mooring line(s), but its value is small relative to the wave forces and has less effect on the linear motion of the platform, so the platform still exhibits linear properties.
Figure 20.
Transient motion response of Surge under the regular wave.
Figure 20.
Transient motion response of Surge under the regular wave.
Figure 21.
The change process in Morison force and radiation force.
Figure 21.
The change process in Morison force and radiation force.
Figure 22.
Comparison of velocity and Morison force for case 1 and case 6.
Figure 22.
Comparison of velocity and Morison force for case 1 and case 6.
4.2.3. Mooring line suspension analysis
The mooring lines in the previous section all fail at the top, and as a complement to the mooring line failures, the bottom end breakdown is evaluated. The environmental loads are the same as in the previous section. Firstly, the change in suspension shape is studied by programming the bottom end breakdown of the mooring line 3-1, as shown in
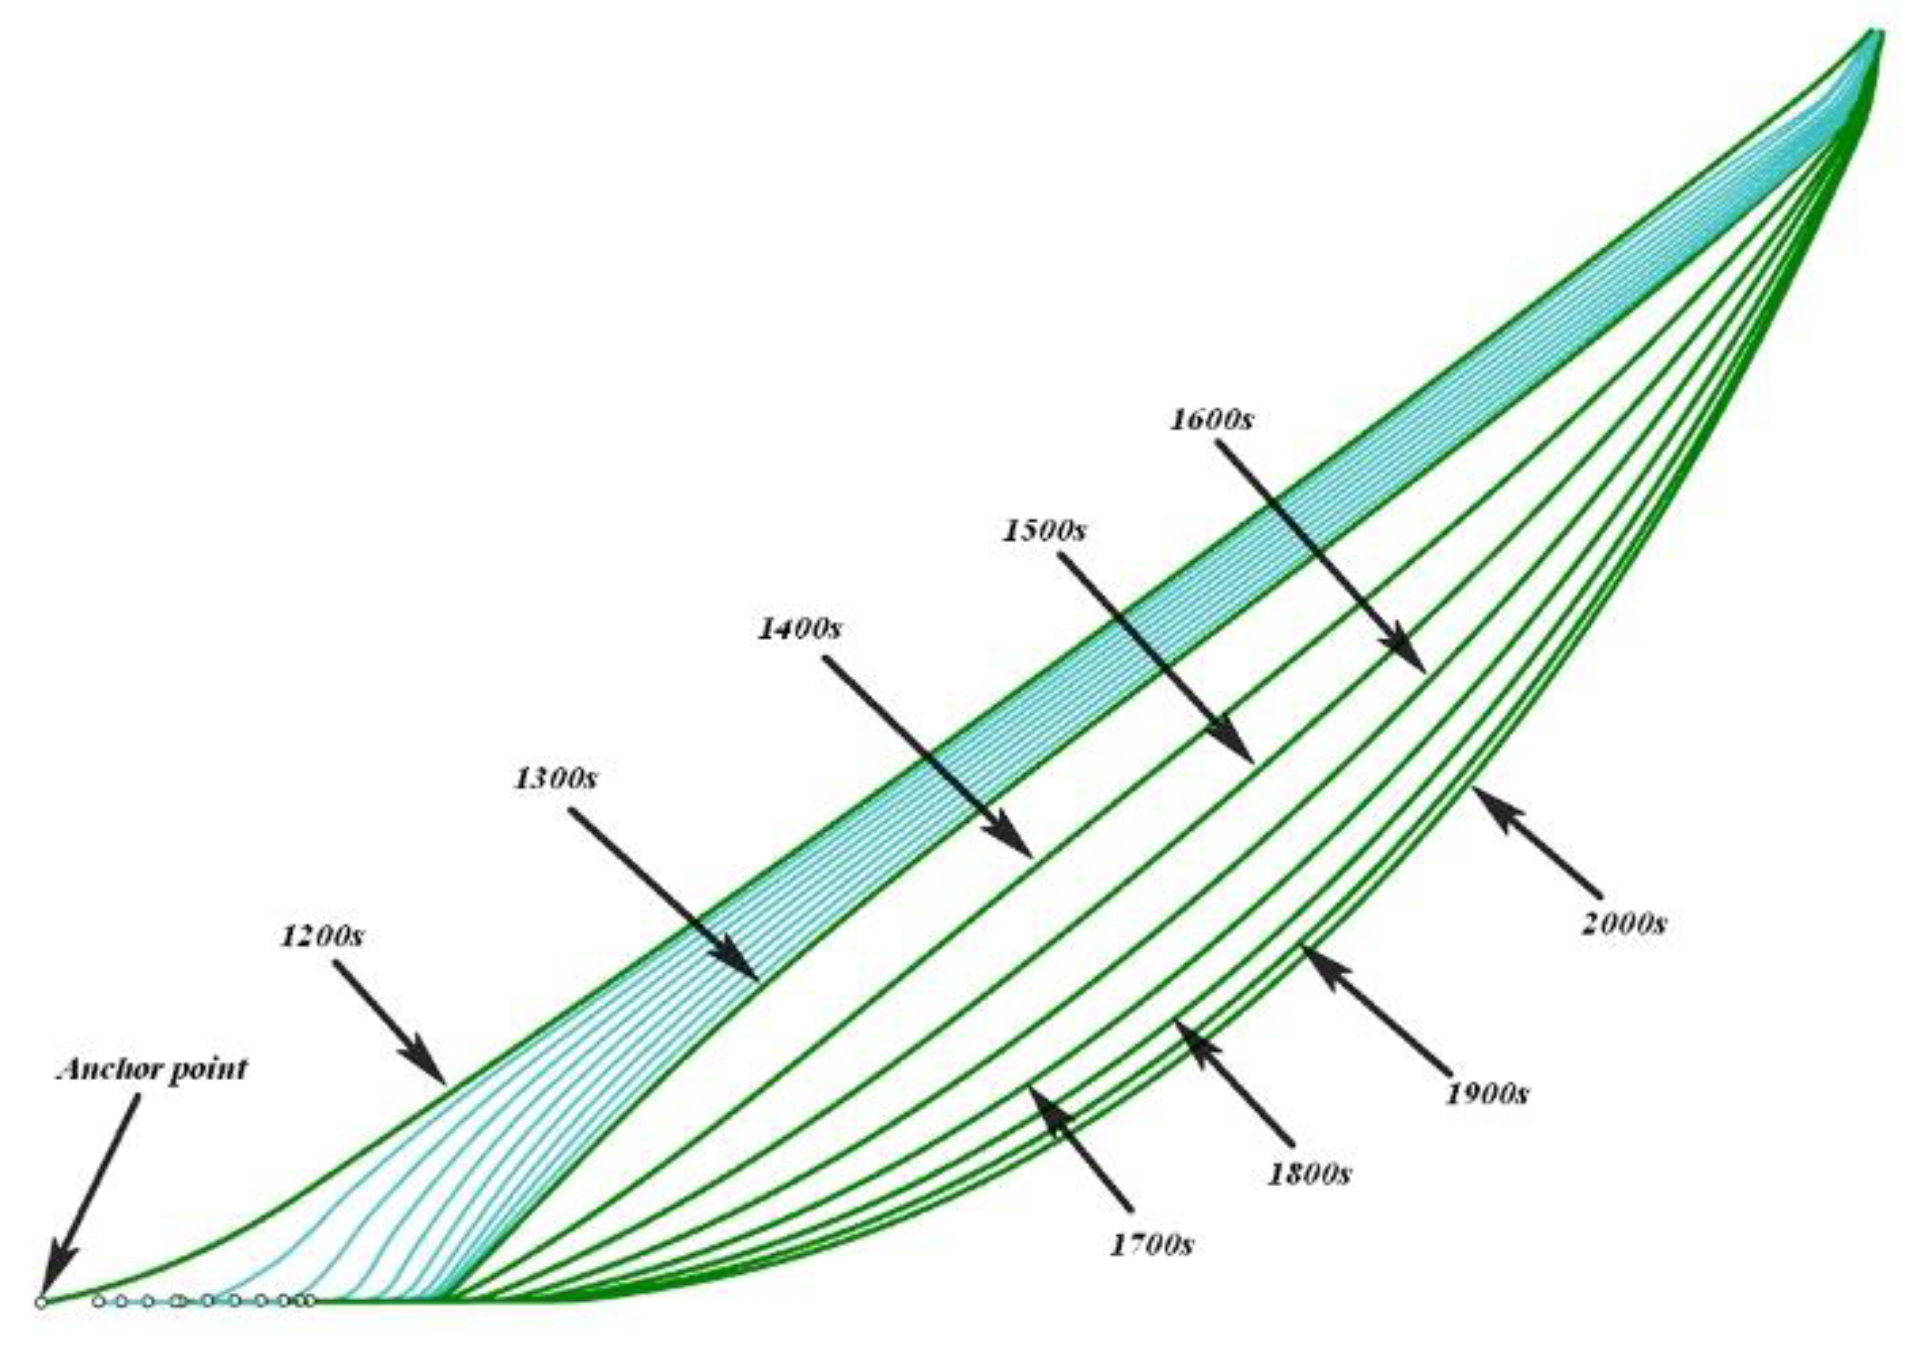
Figure 23. As can be seen from the figure, the mooring line changes from its original tensioned shape to a catenary shape over time due to seabed friction and gravity, and the length of touchdown zone gradually increases. When the bottom of the mooring line fails 600s later, the shape of the mooring line tends to be stable, and the change of the end point is small. The change curve (
Figure 24) of the tension of the failed mooring line reflects the situation in more detail at the moment of failure. From the tension figure, it can be seen that within 2-3s after the failure of the mooring line, the mooring line will slacken due to the sudden disappearance of the bottom restraint. Then, with the combination of bottom friction and gravity, the mooring line is in tension again and makes regular changes with the movement of the top hull. The average tension of mooring line after failure is reduced by 76% compared to that before the failure of the mooring line.
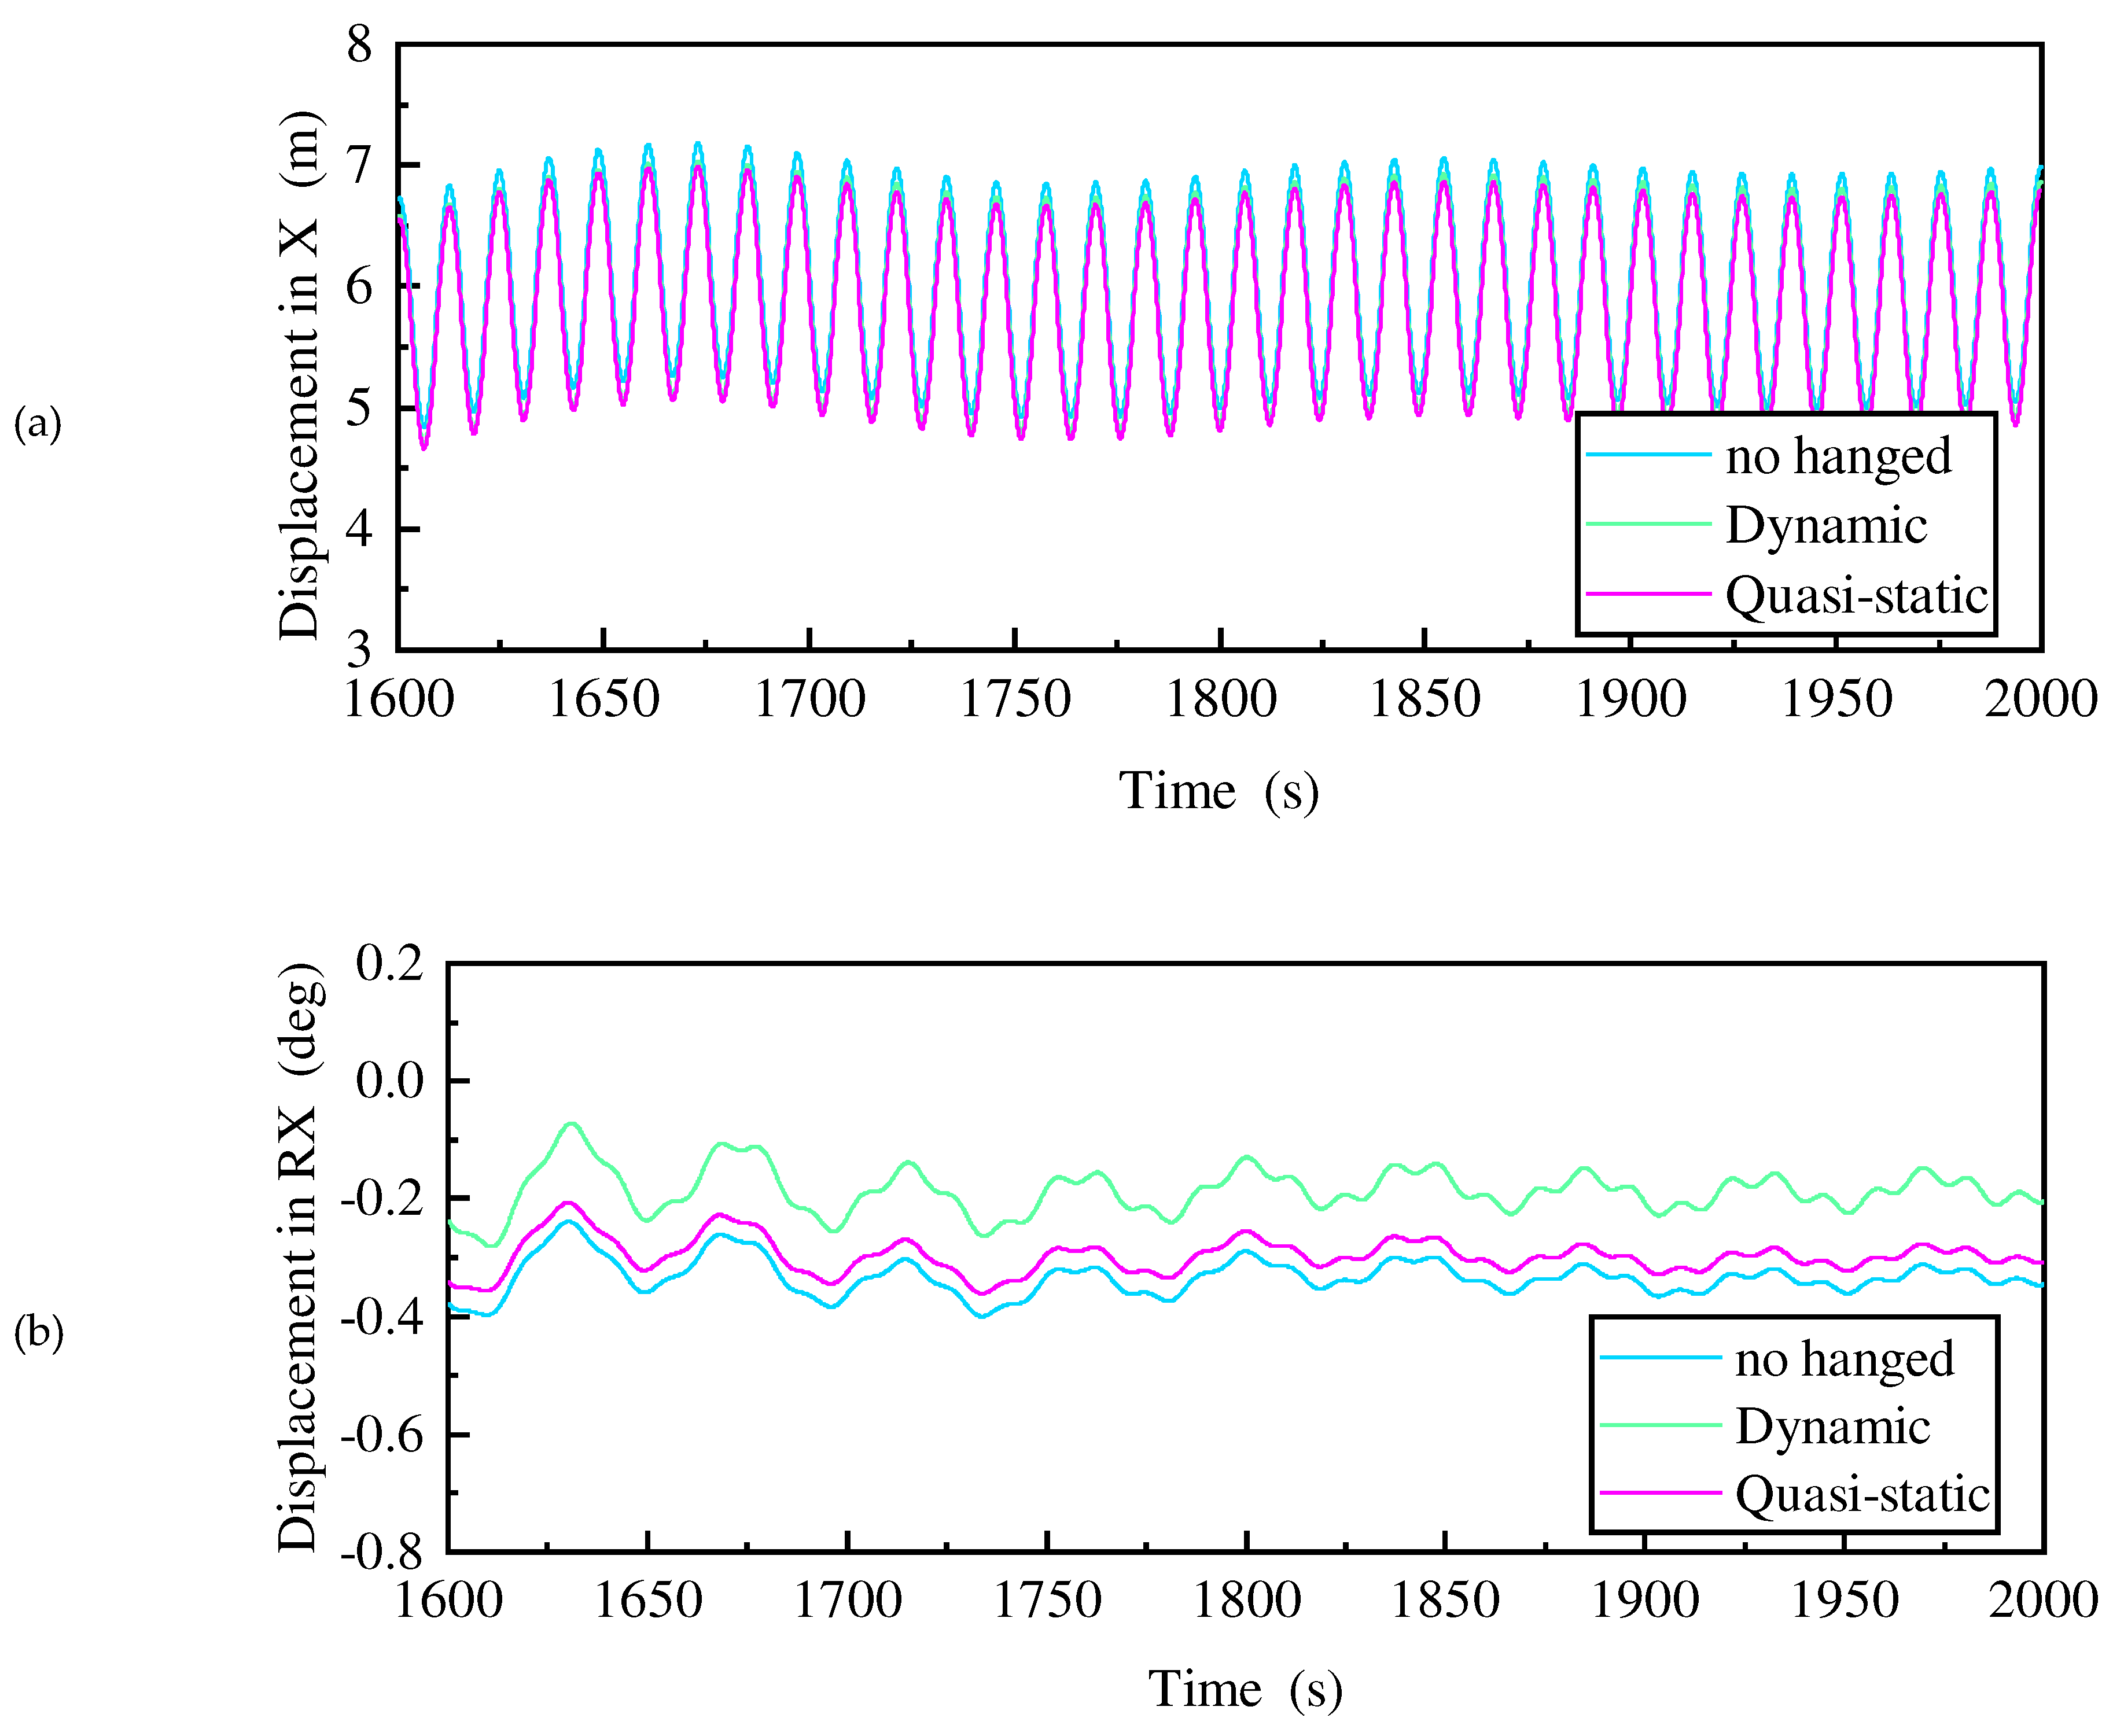
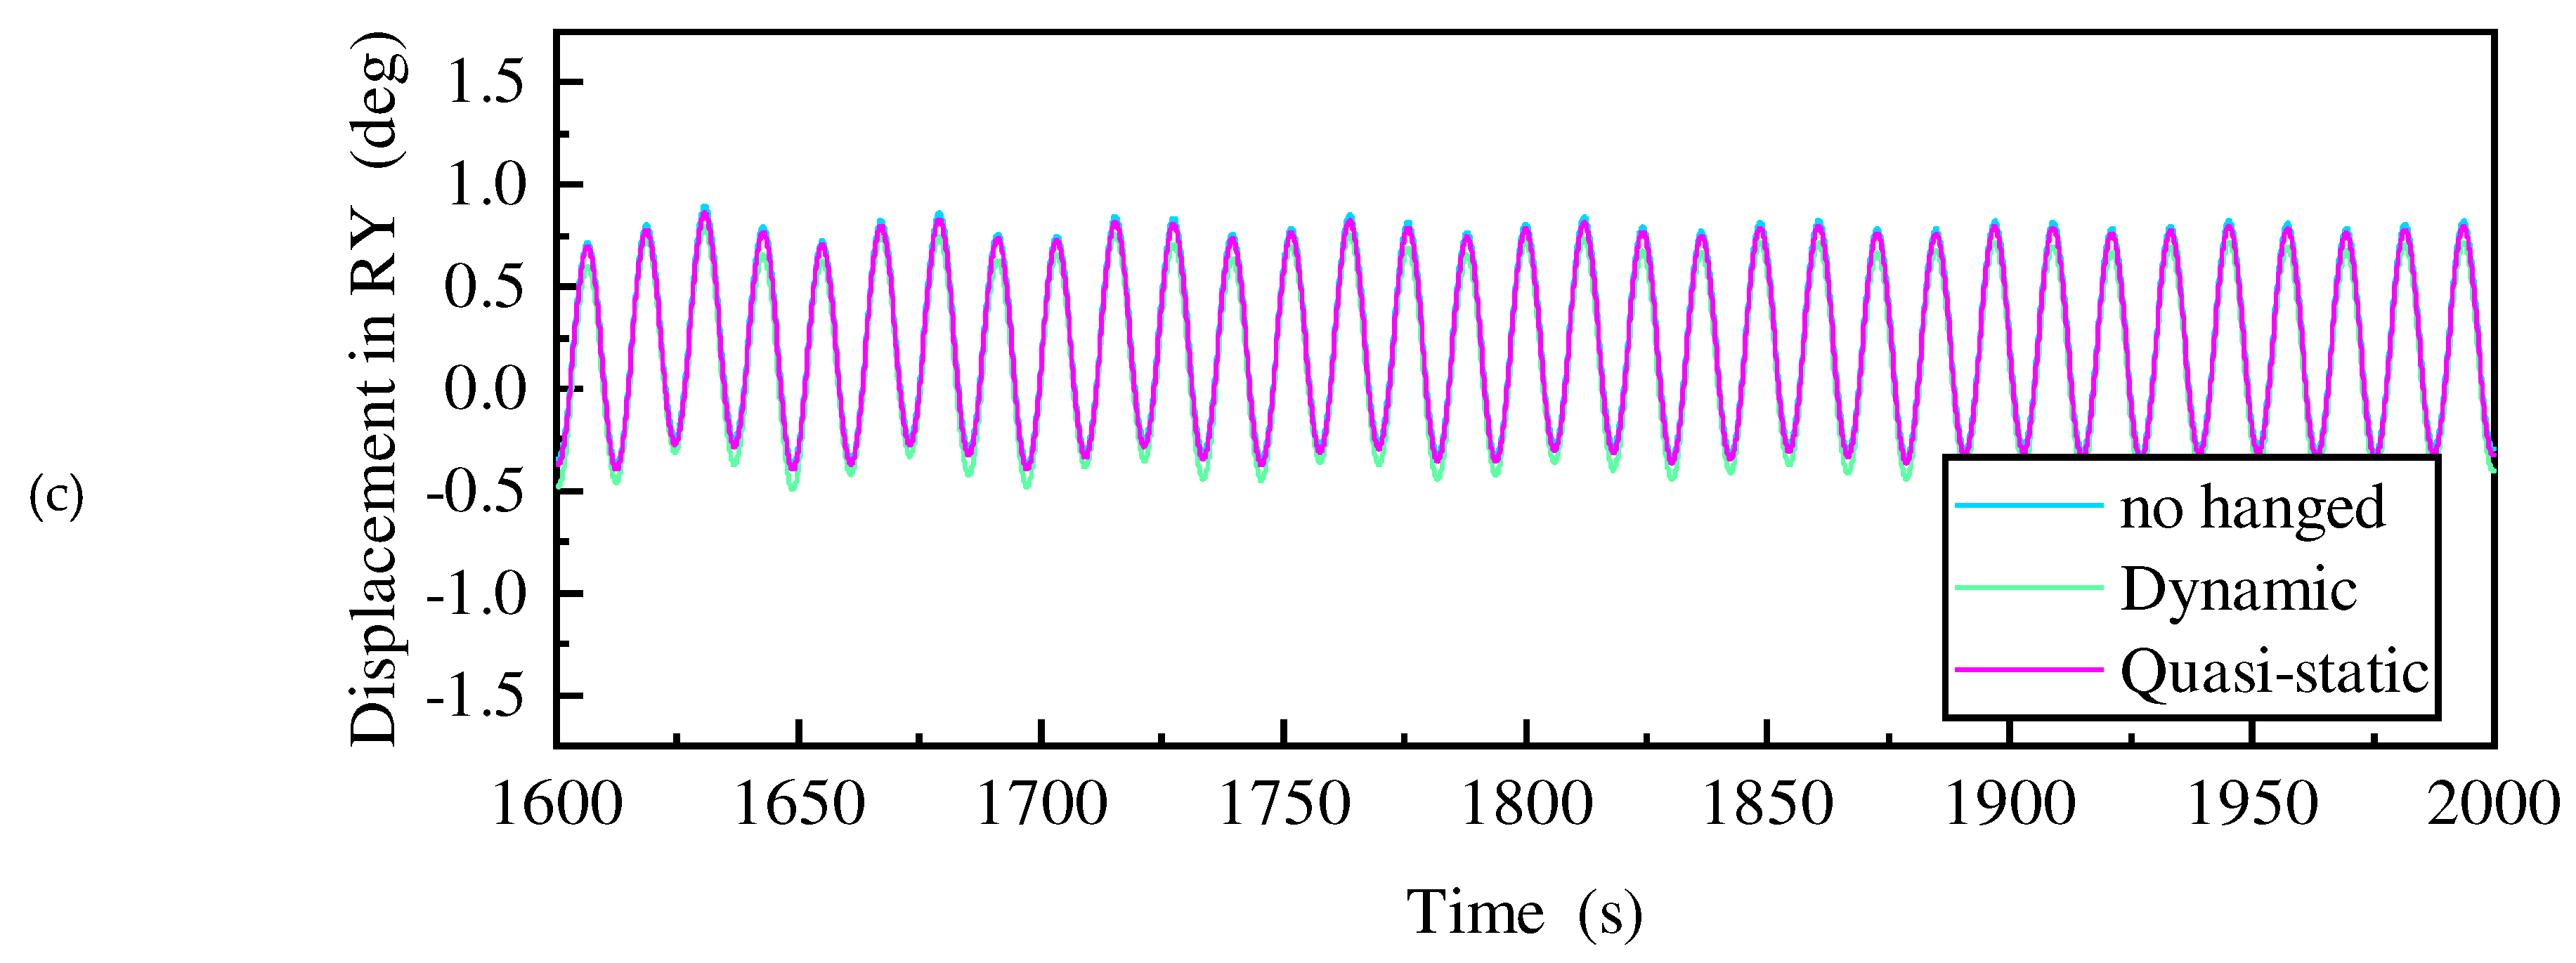
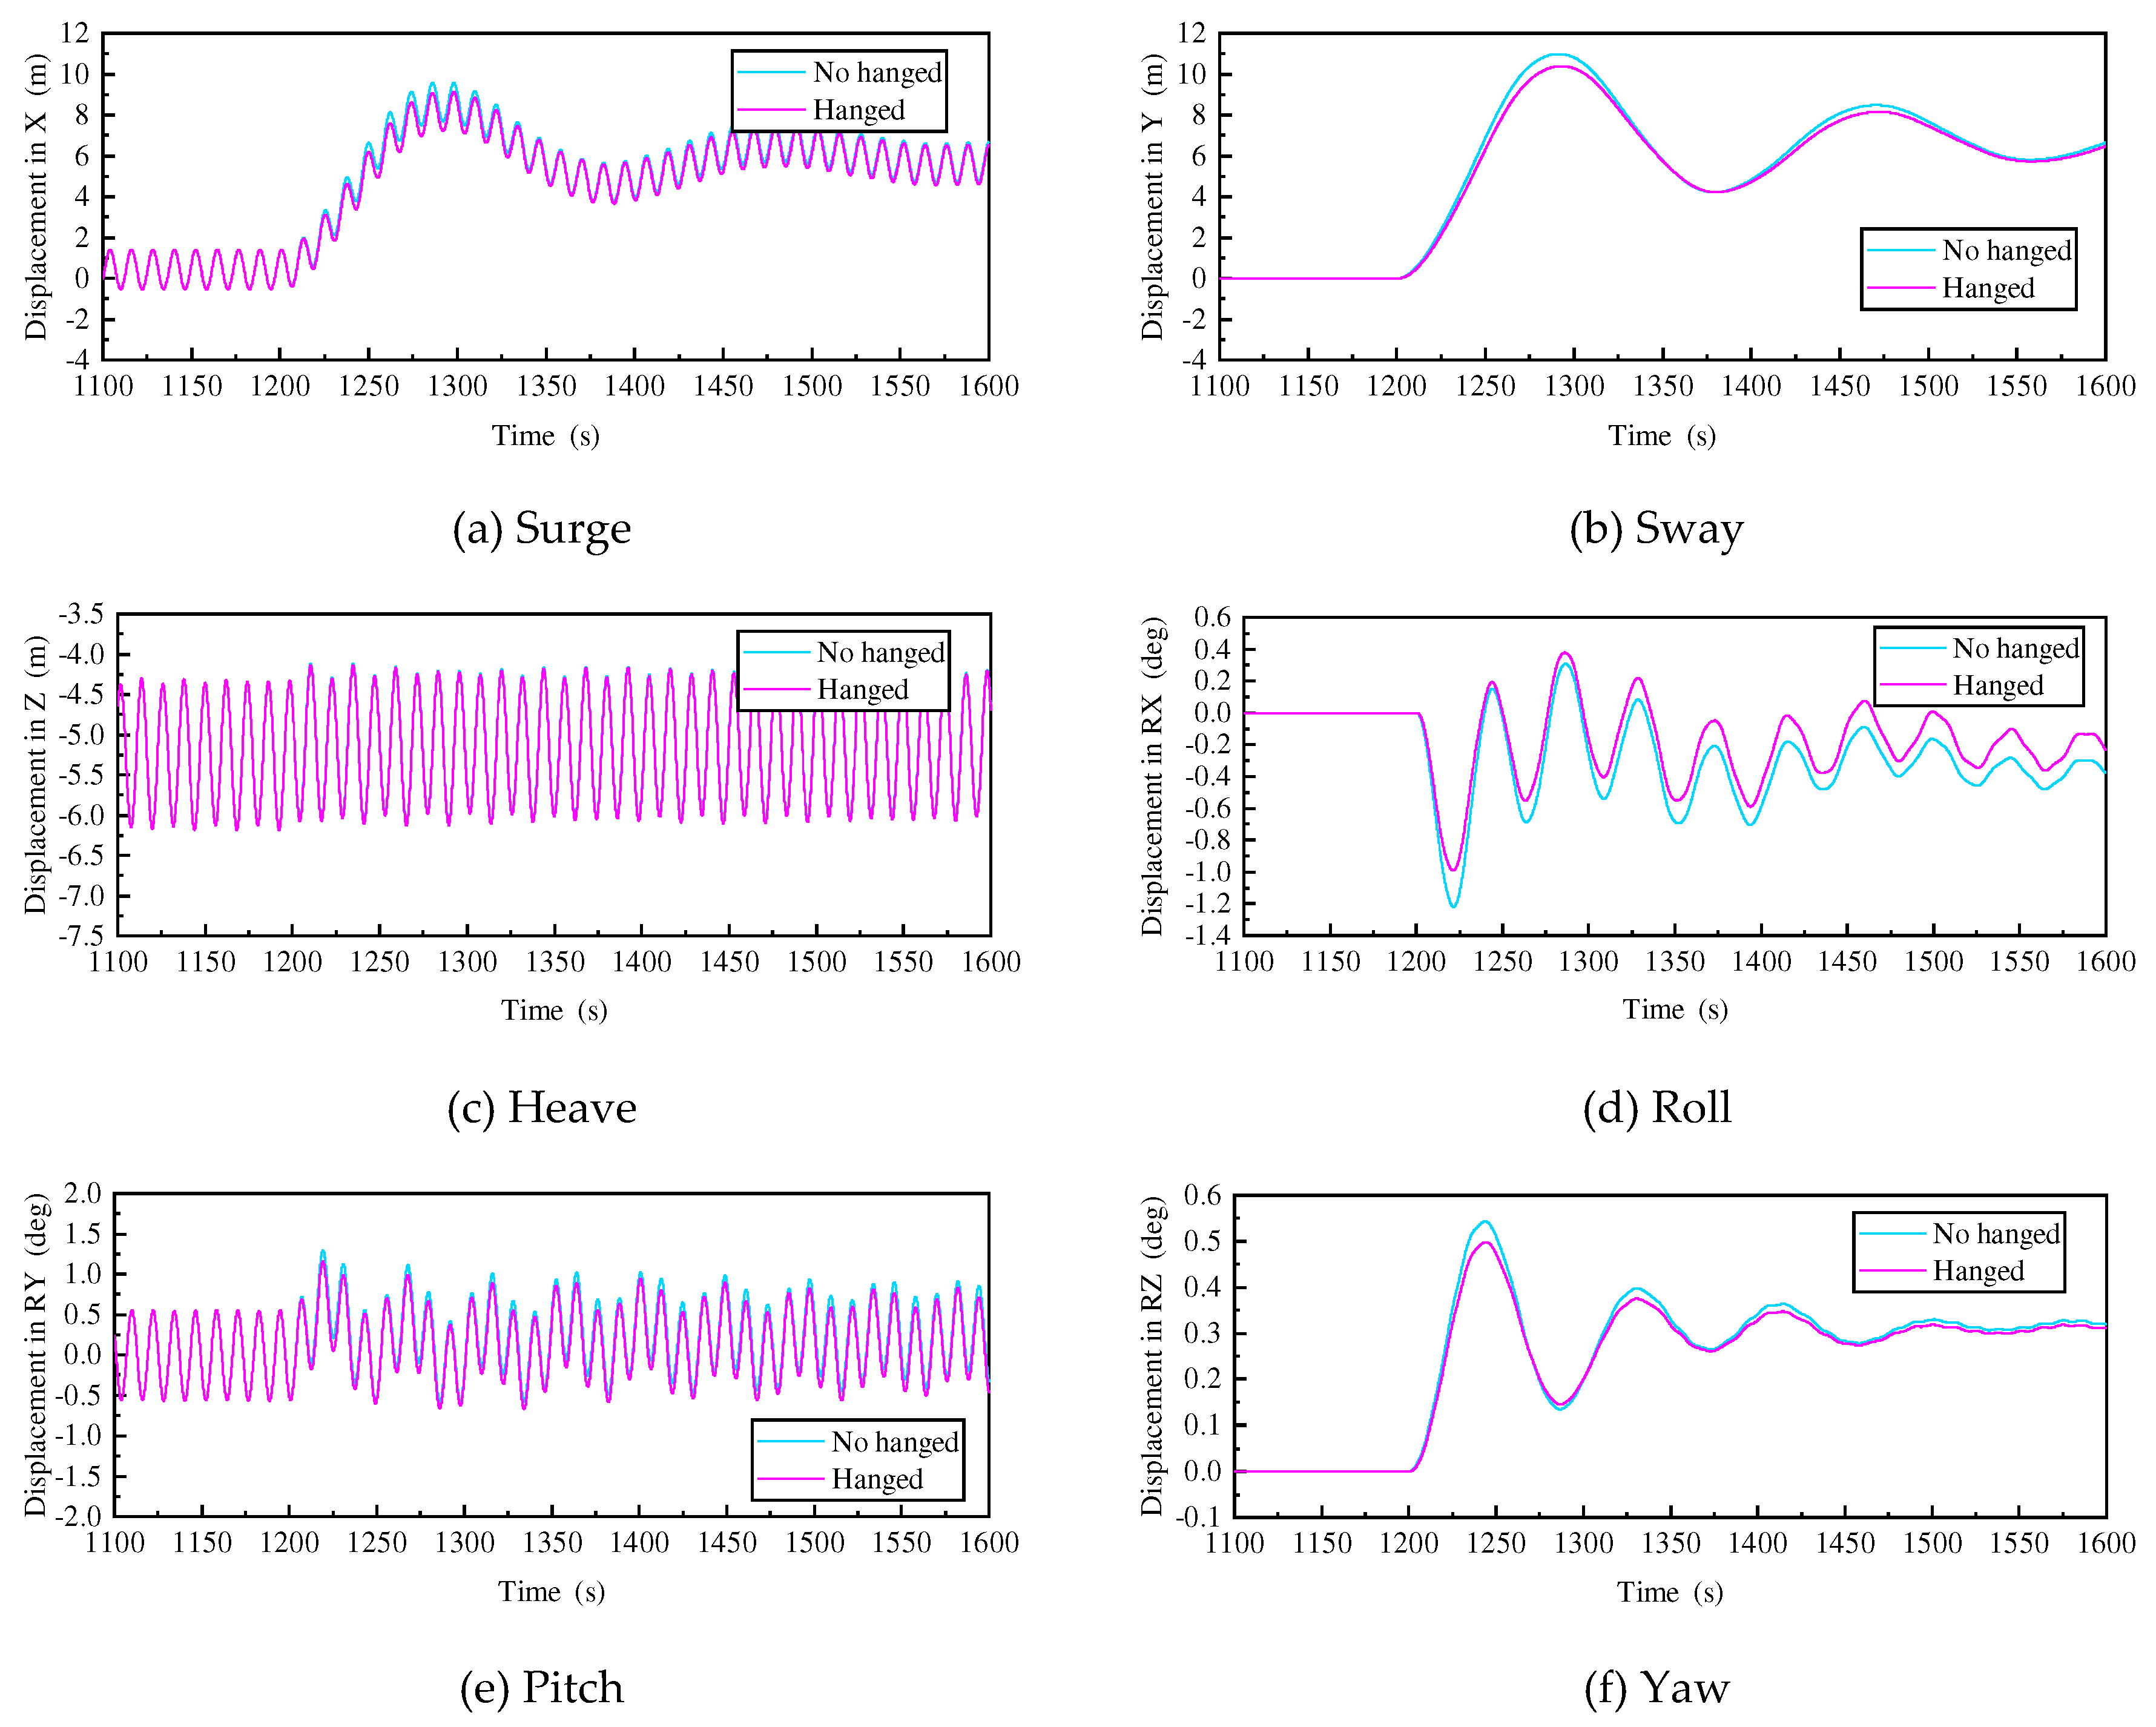
Secondly, this section also compares the effect of failure at the top and bottom of the mooring line on the platform motion responses, as shown in
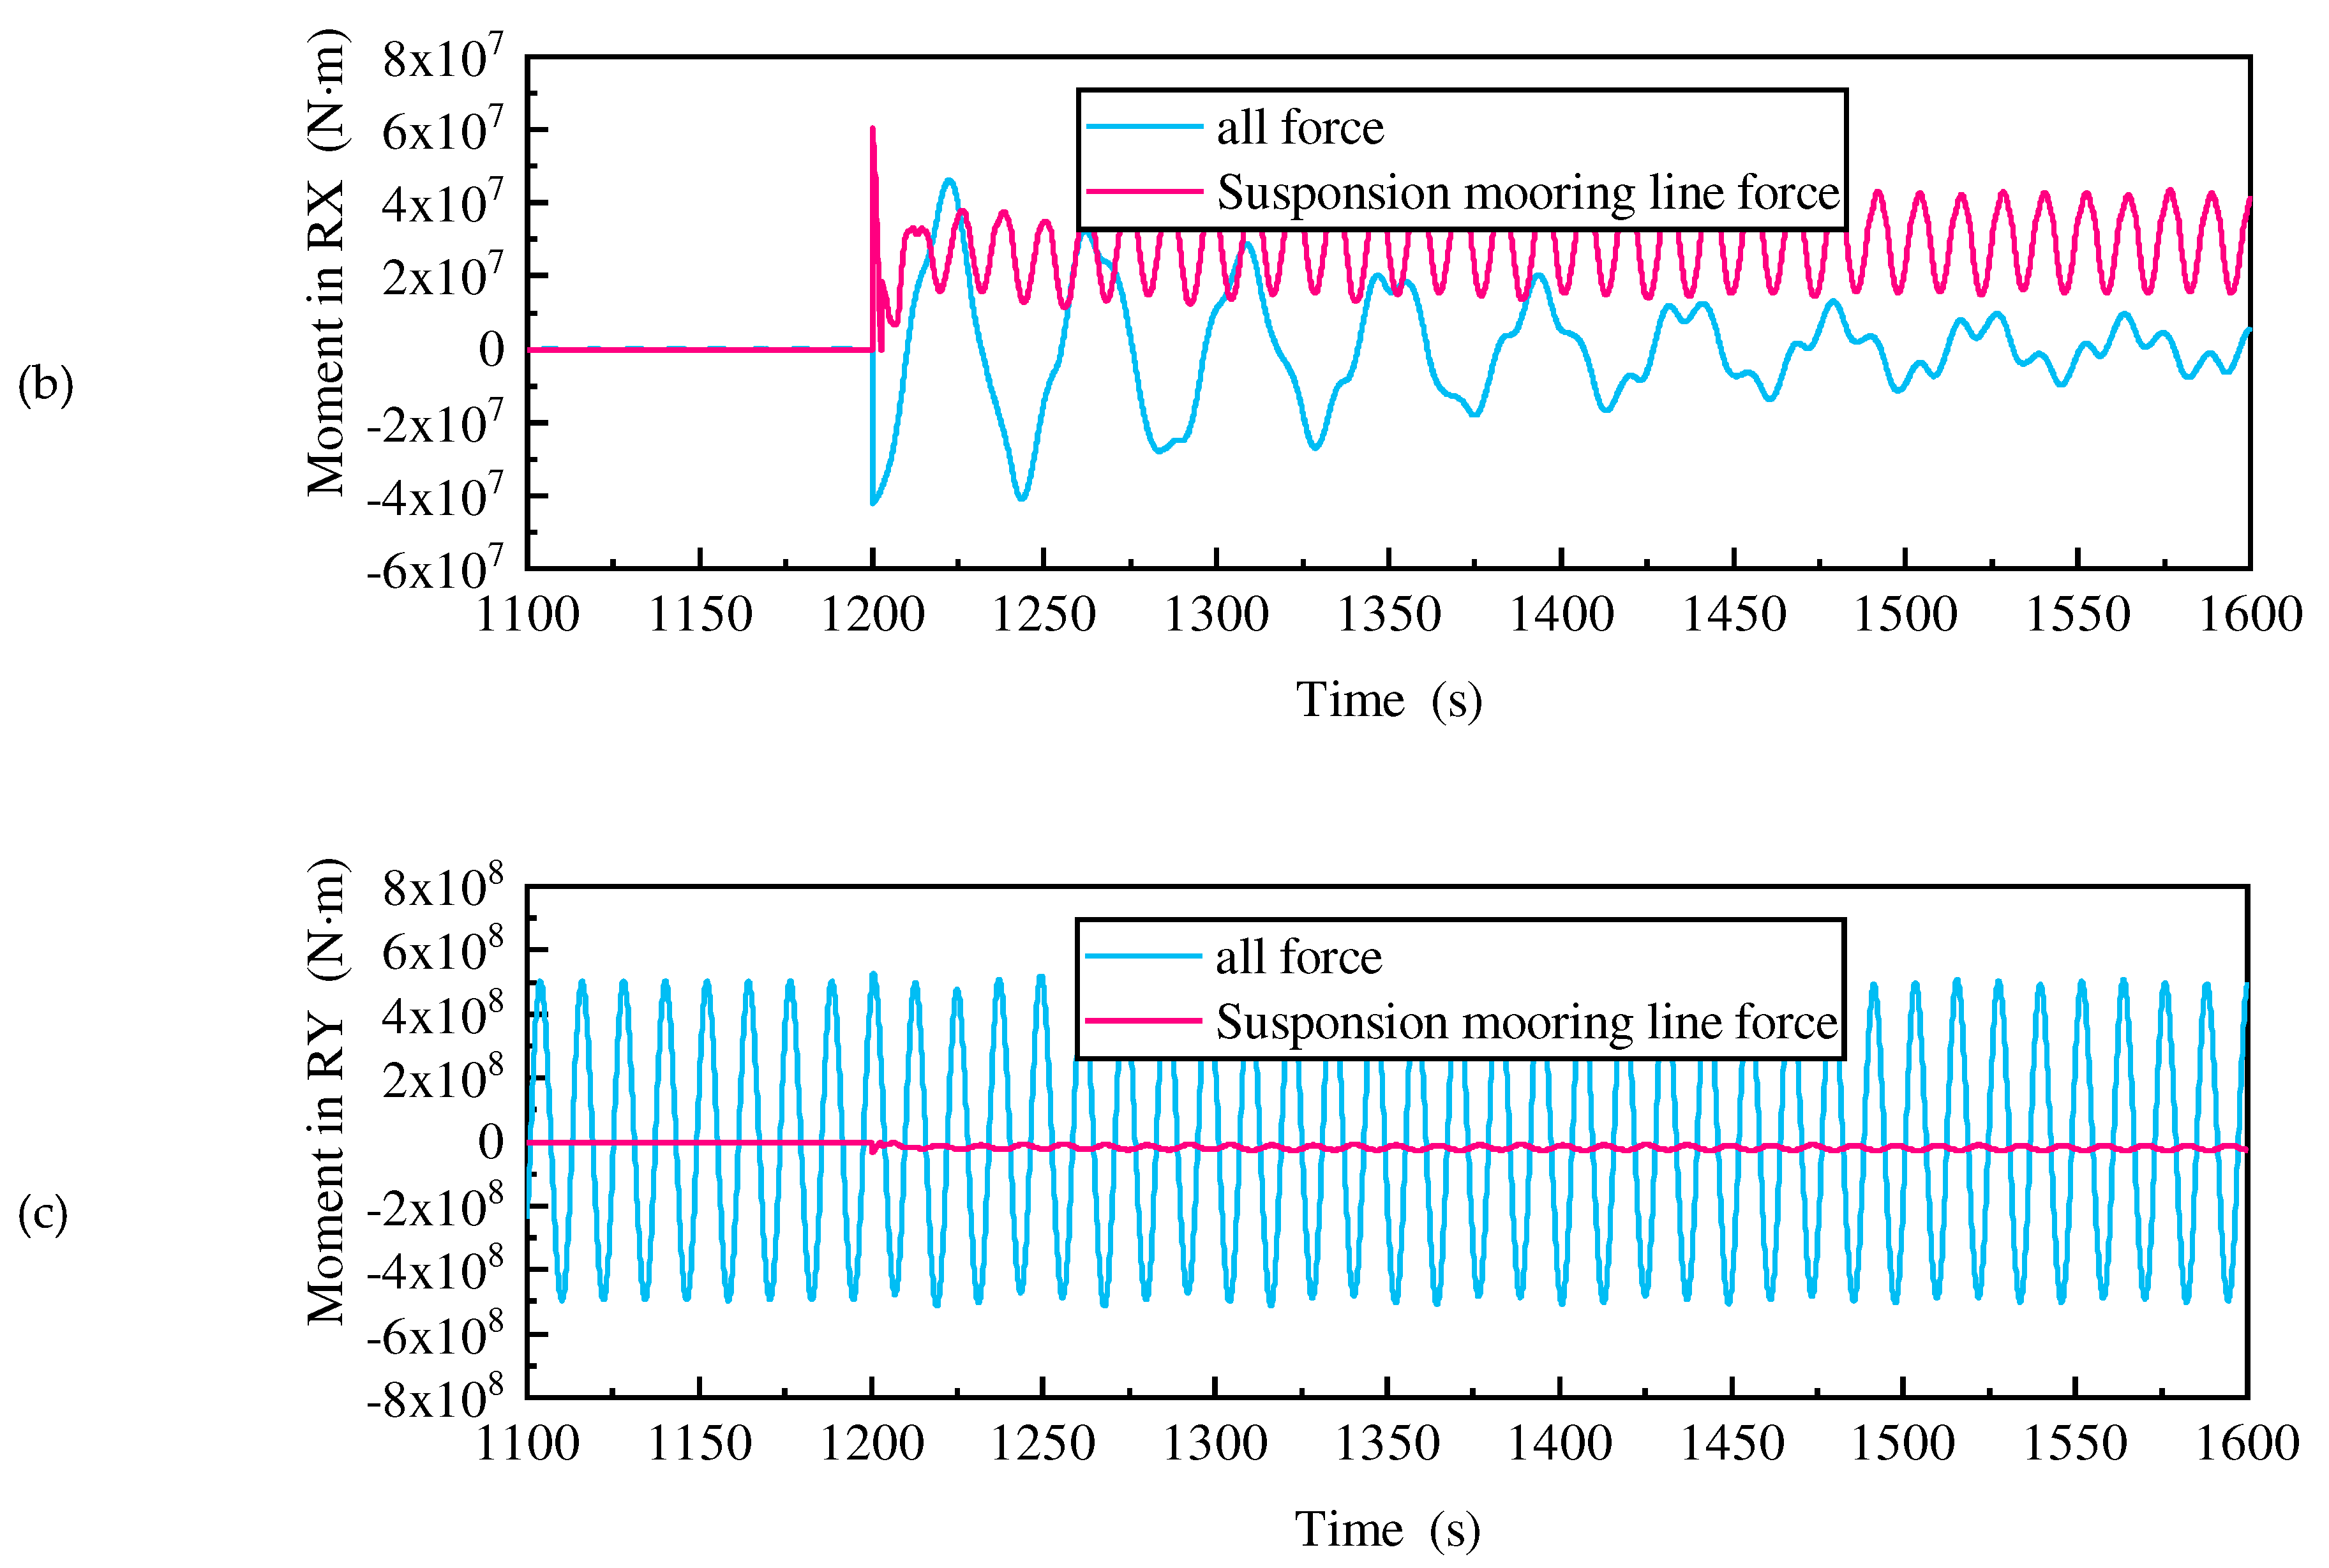
Figure 25. From the figure, it can be seen that the steady-state responses of the remaining degrees of freedom do not differ much, except for the roll and pitch. For the transient response, the motion response of the failure at the bottom of the mooring line is smaller than the motion response of the failure at the top of the mooring line, except for the heave. In order to investigate the causes of the above phenomenon, taking surge/roll/pitch as an example, all forces in the three directions and forces of the failed mooring line on these three directions are compared, as shown in
Figure 26. All force contains wave force, radiation force, Morison force, mooring line of intact mooring lines. All force in the surge reaches 10E7 magnitude, while the force of the failed mooring line in the surge only 10E5 magnitude, with a large difference. Therefore, there is little difference in response to the surge with or without this mooring force. Pitch is similar to surge. Unlike surge/pitch, the moment generated by the failed mooring line on the roll is the same order of magnitude as the all force and in the opposite direction. Therefore, the failed mooring line can significantly reduce the roll angle of the platform.
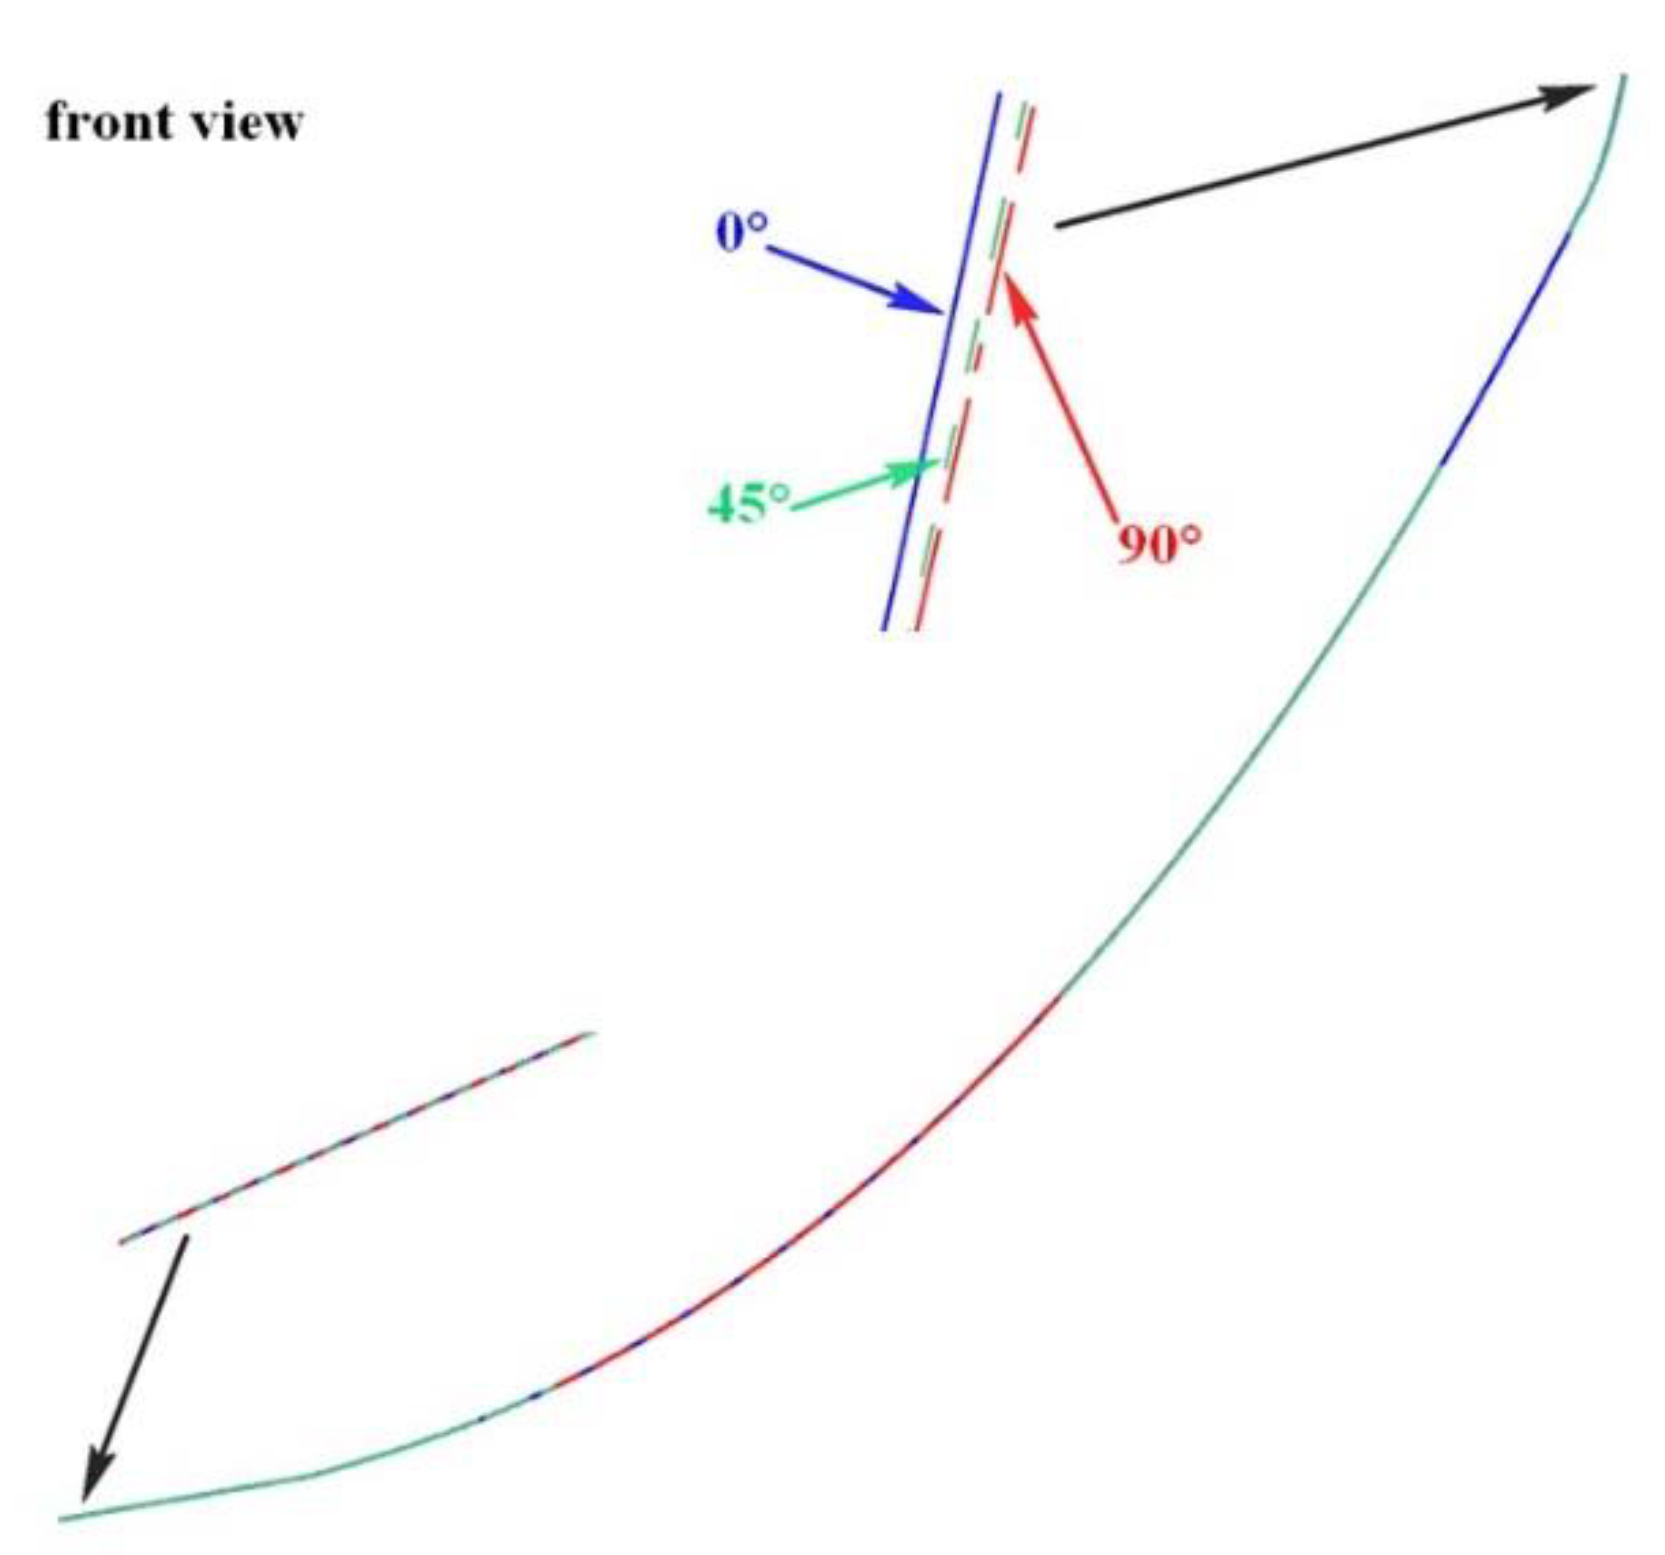
Finally, this section adjusts the directions of the wave load to investigate the difference of the line shape after the failure of the mooring line bottom. The wave directions are 0°, 45°, 90°. The simulation results are shown in
Figure 27. It can be seen from the figure that the failure of the bottom of the mooring line has little effect on the line shape under different wave directions. The position of the top of the failed mooring line is slightly different, but the inclination angle is the same, while the touchdown zone of the failed mooring line overlaps. In the other words, the position of the end point after the failure of the bottom is unchanged. In view of the above characteristics, this paper speculates whether it is possible to fix the end point and adopt the quasi-static method to solve the effect of the failed mooring line on the platform, because the quasi-static method can greatly reduce the computational cost and shorten the simulation time. The calculation results are shown in
Figure 28. The results show that the calculated motion responses using the quasi-static method are slightly larger than those of the dynamic method. Although the difference in the roll response appears to be seemingly large, the difference between the roll response calculated with the dynamic and quasi-static methods is only 0.2°. Therefore, a quasi-static method can be used instead of the dynamic method to calculate the motion response of the mooring line suspension state.
Overall, the suspended mooring line still has some mooring capacity and can reduce the transient responses and the steady-state responses after the mooring line failure. Therefore, failure at the top of the mooring line is the main focus in the following analysis.
Figure 27.
The suspension shape of the mooring line under different wave directions.
Figure 27.
The suspension shape of the mooring line under different wave directions.
Figure 28.
Comparison of quasi-static and dynamic calculation results.
Figure 28.
Comparison of quasi-static and dynamic calculation results.
4.3. Riser failure probability analysis
As one of the important components of the floating platform oil and gas development system, failure of the mooring line may increase the risk of riser damage. Therefore, it is necessary to study the force change of riser after the failure of mooring line and get its failure probability. The main parameters of the SCR are shown in
Table 9, and its layout is shown in
Figure 9. Firstly, the change law of the effective tension of the riser before and after mooring line failure under the regular wave is analyzed, as shown in
Figure 29 and
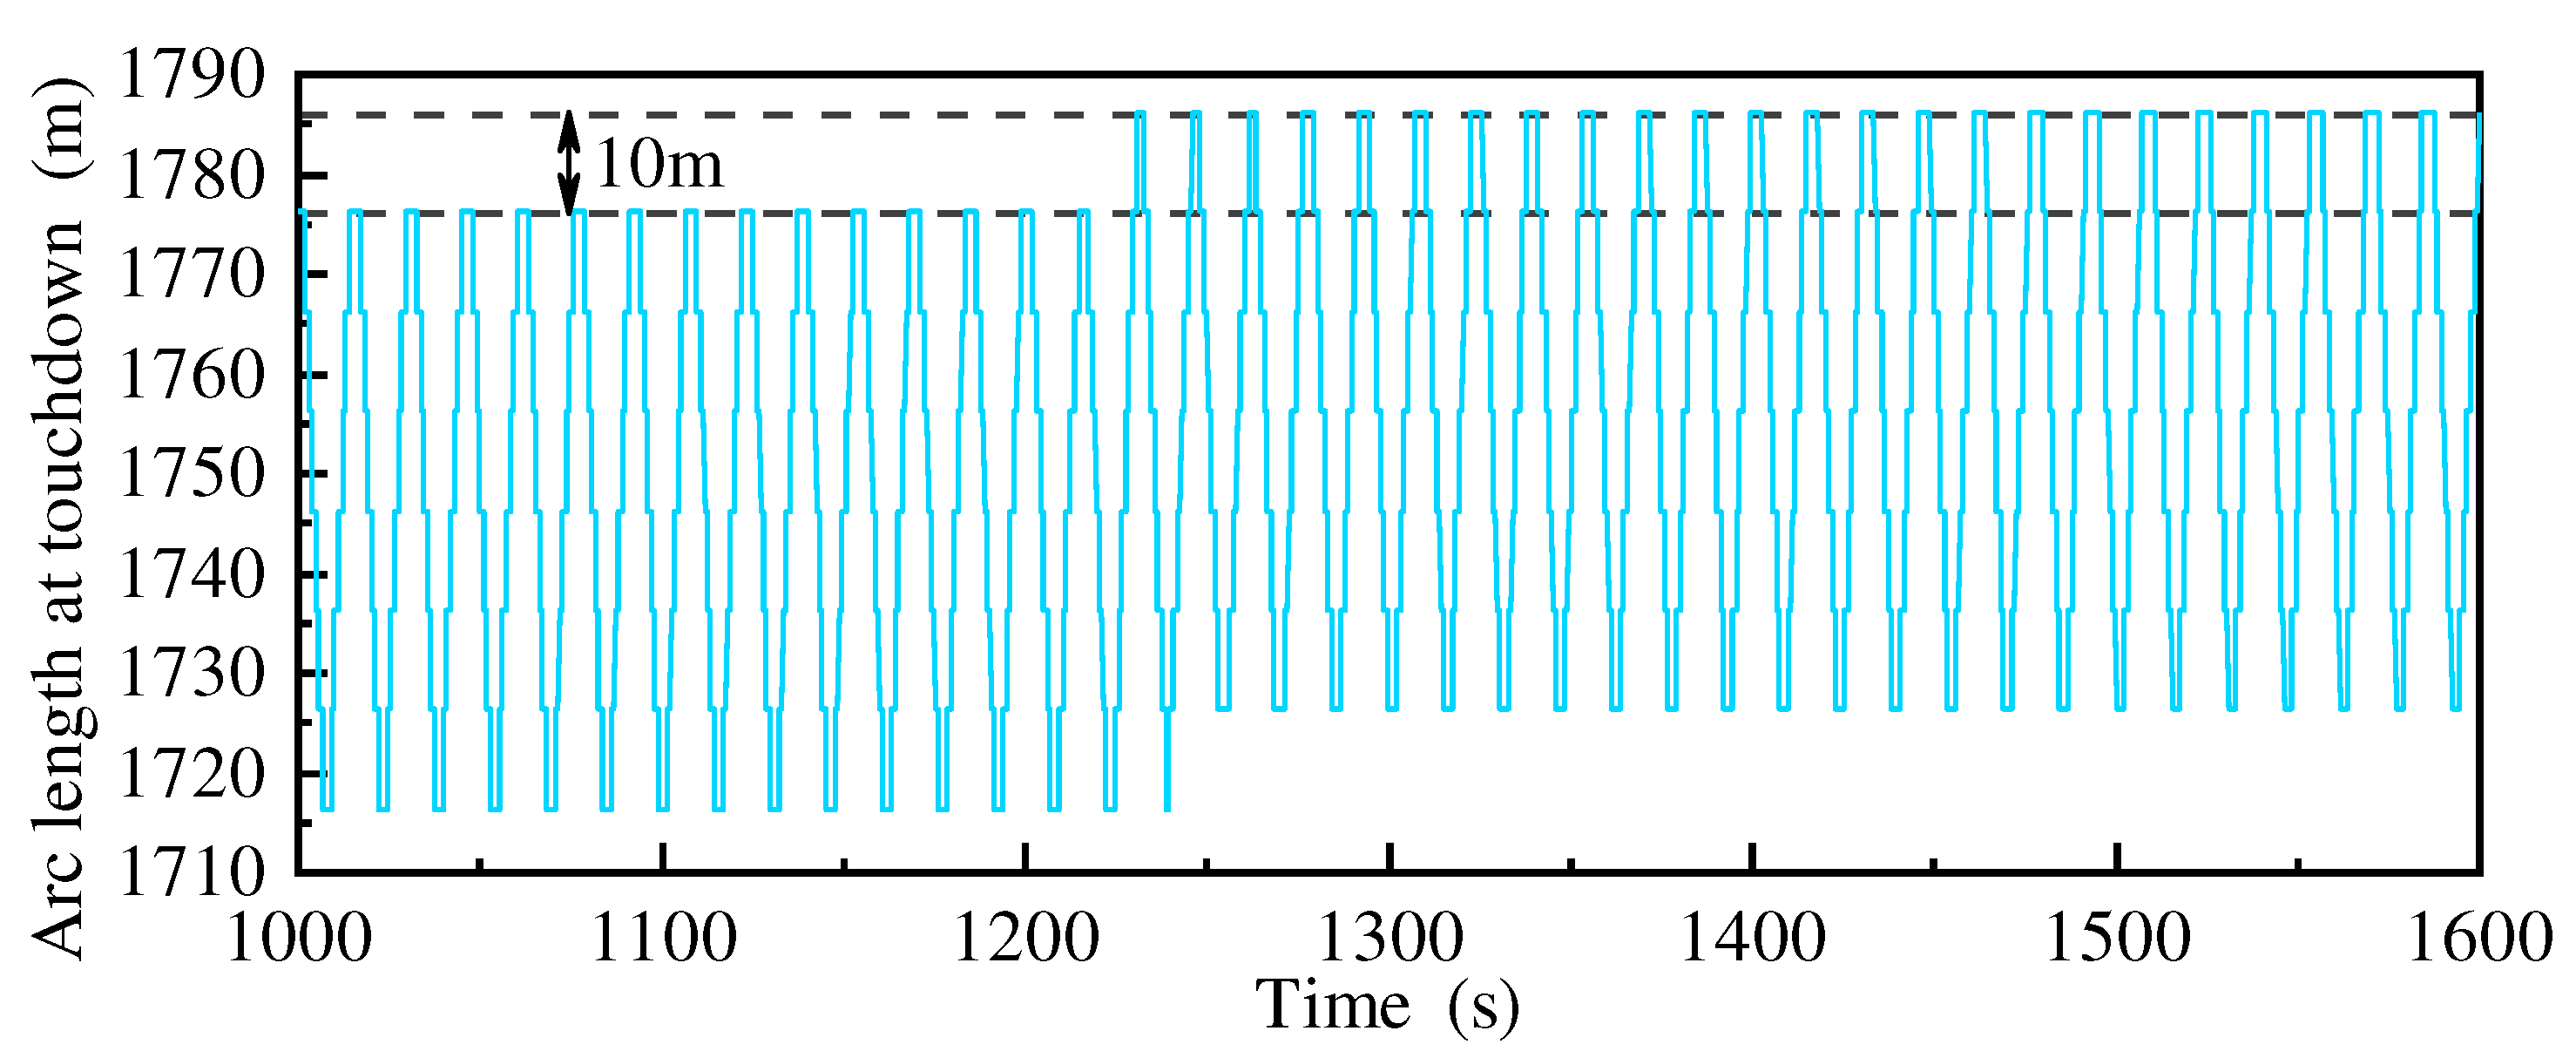
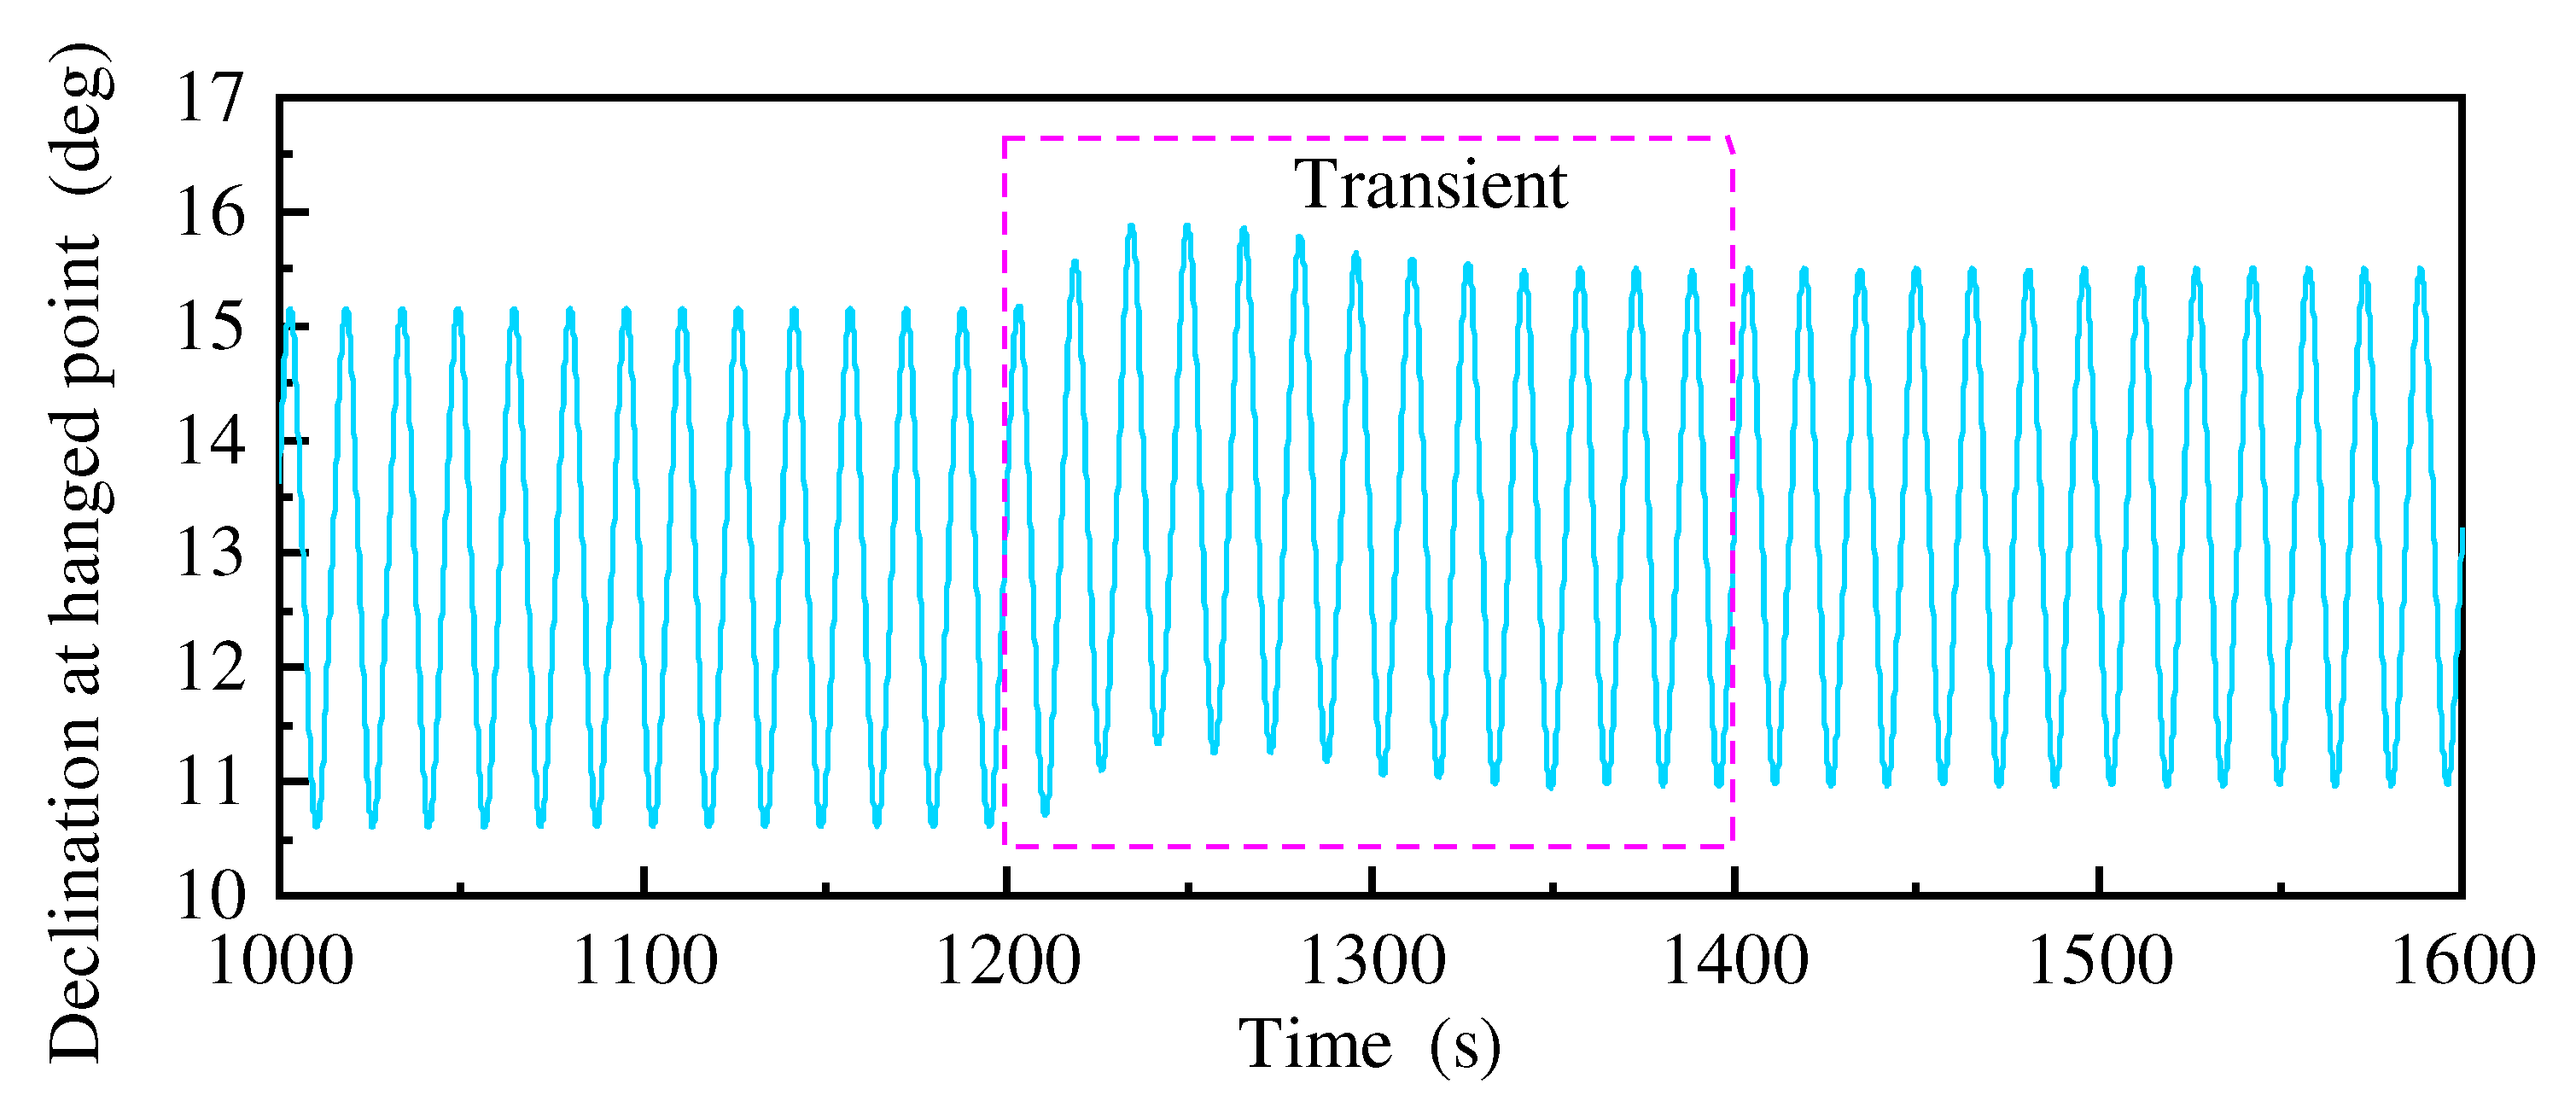
Table 10. The amplitude and period of the regular wave are 7.7m, 15.4s respectively. From the time history curve, it can be seen that the amplitude and change law of the effective tension at the riser hanged point and touchdown point before and after mooring line failure are basically the same. The overall effective tension curve after mooring line failure is slightly higher than that before mooring line failure. According to the data analysis, it can be known that the standard deviation of the effective tension before and after mooring line failure is not very different, and the difference of the mean value is about 13kN. The change in the mean value is due to the change in the riser suspension length caused by the offset motion of the platform. According to
Figure 30, it is estimated that the wet weight of the riser suspension zone after mooring line failure is about 11.3kN heavier, which is approximate to the change in the mean value of the effective force. The difference between the maximum effective tension in the transient and steady-state processes after mooring line failure is about 23kN. This paper suggests that the reason for this phenomenon is that the declination of the riser in the transient process is greater than that in the steady-state process, as shown in
Figure 31. In the case of the same riser wet weight, the larger the declination is, the grater the corresponding tension will be.
Table 9.
Main parameters of the SCR.
Table 9.
Main parameters of the SCR.
| Parameter |
riser |
riser |
| Outside diameter (m) |
0.324 |
0.273 |
| Wall thickness (m) |
0.027 |
0.0254 |
| Axial stiffness (kN) |
5280000 |
4100000 |
| Bending stiffness (kNm2) |
58650 |
31690 |
| Dry weight (kg/m) |
197.75 |
155.13 |
Figure 29.
Effective tension of PR1 riser under the regular wave.
Figure 29.
Effective tension of PR1 riser under the regular wave.
| Parameter |
riser |
riser |
| Outside diameter (m) |
0.324 |
0.273 |
| Wall thickness (m) |
0.027 |
0.0254 |
| Axial stiffness (kN) |
5280000 |
4100000 |
| Bending stiffness (kNm2) |
58650 |
31690 |
| Dry weight (kg/m) |
197.75 |
155.13 |
Table 10.
Statistics of PR1 effective tension (kN).
Table 10.
Statistics of PR1 effective tension (kN).
| Status |
Max. |
Mean |
St. Dev. |
| Hanged point |
Before failure |
2283.82 |
1978.93 |
226.18 |
| Transient state |
2325.86 |
1991.12 |
230.59 |
| Steady state |
2302.76 |
1992.46 |
229.40 |
| Touchdown point |
Before failure |
681.96 |
435.02 |
166.15 |
| Transient state |
725.04 |
447.00 |
170.66 |
| Steady state |
700.89 |
448.73 |
169.99 |
Figure 30.
Comparison of the suspension length before and after mooring line failure.
Figure 30.
Comparison of the suspension length before and after mooring line failure.
Figure 31.
Comparison of riser declination at hanged point before and after mooring line failure.
Figure 31.
Comparison of riser declination at hanged point before and after mooring line failure.
Secondly, the tension changes of the risers before and after the mooring line failure under the 1000-year return period ocean load are calculated and the statistics are analyzed, as shown in
Figure 32 and
Table 11. From the results, it can be seen that the tension of the PR1 riser changes more significantly compared to the PR3 riser, with a 16.7% increase in its maximum value and a 12.8% increase in its standard deviation, while the mean value does not change much compared to the first two items, only 2.2%. Although the riser tension after mooring line failure does not exceed the design specification, the maximum value and standard deviation of the tension are greatly increased, leading to a significant reduction in riser stability and increasing its damage probability, which should be paid more attention to.
Considering that the most likely multiple coupling failures of SCR are predominantly joint failure at the suspension point and failure at touchdown point, and thus
, other coupling failures are set as
. The BPAs calculated from the sensor measurements (
Table 12) are shown in
Table 13; the modified BPAs considering the uncertainties of the evidences are shown in
Table 14; the final calculated failure probabilities for different zones of the riser are shown in
Table 15. From the results, it can be seen that there is little change in the failure probability of different zones of the riser after the mooring line failure. The failure probability of the flexible joint at the top of the riser is the largest, much larger than the other two zones, and the failure probabilities of the combinations of different zones are also at a low level. Therefore, the monitoring of the top flexible joint should be strengthened during the service of the platform.
Figure 32.
Comparison of effective tension of risers after mooring line failure.
Figure 32.
Comparison of effective tension of risers after mooring line failure.
Table 11.
Statistical results of effective tension (kN).
Table 11.
Statistical results of effective tension (kN).
| Riser |
Status |
Max. |
Mean |
St. Dev. |
| PR1 |
Before failure |
5170.25 |
3024.31 |
250.91 |
| After failure |
6032.17 |
3091.80 |
282.99 |
| PR3 |
Before failure |
2983.69 |
2291.25 |
93.19 |
| After failure |
3123.96 |
2336.00 |
105.30 |
Table 12.
Measure data of PR1 under 1000-year marine environment.
Table 12.
Measure data of PR1 under 1000-year marine environment.
| Sensor |
Hanged point |
Middle point |
Touchdown point |
| m1 |
6032.17 kN |
3920.36 kN |
3912.45 kN |
| m2 |
185.6 Mpa |
151.5 Mpa |
10.9 Mpa |
| m3 |
413.4 Mpa |
196.2 Mpa |
181.6 Mpa |
Table 13.
BPA of three failure modes.
Table 13.
BPA of three failure modes.
| |
|
|
|
|
| m1 |
0.2900 |
0.1885 |
0.1881 |
0.3333 |
| m2 |
0.3682 |
0.2784 |
0.0201 |
0.3333 |
| m3 |
0.3483 |
0.1653 |
0.1530 |
0.3333 |
| m4 |
0.1678 |
0.1054 |
0.0602 |
0.6667 |
Table 14.
Modified BPA of three failure modes.
Table 14.
Modified BPA of three failure modes.
| |
|
|
|
|
| m1 |
0.2119 |
0.1377 |
0.1374 |
0.5130 |
| m2 |
0.2918 |
0.2206 |
0.0159 |
0.4717 |
| m3 |
0.2577 |
0.1223 |
0.1132 |
0.5068 |
| m4 |
0.1237 |
0.0777 |
0.0444 |
0.7543 |
Table 15.
Failure probability of PR1 under 1000-year marine environment.
Table 15.
Failure probability of PR1 under 1000-year marine environment.
| Failure mode |
|
|
| Before failure |
After failure |
|
0.3068 |
0.3150 |
|
0.1831 |
0.1704 |
|
0.0672 |
0.0693 |
|
0.1315 |
0.1395 |
|
0.1537 |
0.1490 |
|
0.0511 |
0.0505 |
|
0.0140 |
0.0138 |
|
0.0925 |
0.0925 |
5. Conclusions
In this paper, the “Deep Sea No.1” semi-submersible platform is used as the research object. The environmental direction and number for the most likely failure of the mooring line are determined by considering the directional extremes of the environment and the effect of mooring line corrosion. The change law of motion under different combinations of mooring line(s) failure and the effect of the mooring line suspension are analyzed under the regular wave. The change law of the riser tension and the failure probability of different positions are also analyzed. The primary conclusions of this study are as follows:
- (1)
By studying the steady-state motion under different combinations of mooring line(a) failure, it is found that although the failure cases are different, the shape of the motion phase diagram and the number of mapping points are constant, and the only change is the position on the phase diagram and mapping diagram. This indicates that the platform system has strong robustness in terms of linear motion. Through quantitative calculation, it is found that the change of platform equilibrium position after mooring line(s) failure is closely related to the change of stiffness, and there is a functional relationship.
- (2)
The transient response of the mooring line after failure is studied and it is found that the velocity change at the moment of failure is more pronounced, causing a significant change in the Morison drag force. This results in different regulation times from the failure transient process to the steady-state process. The longer the Morison drag force stays in the negative direction, the longer the regulation time will be, and the relative value of the transient process will also be large.
- (3)
The mooring line after bottom failure still shows a catenary line shape and has certain mooring capacity. Except for the roll motion, the steady-state motion response under the bottom failure of the mooring line is not much different from that under the top failure, but it can reduce the transient motion response. The final line shape after the bottom failure is independent of the direction of the environmental load, and the end point position is almost constant. It is also found that there is little difference in the effect of simulating the suspension mooring line on the platform motion response using dynamic and quasi-static methods, but the quasi-static method can effectively reduce the computational cost.
- (4)
The change in the mean value of the effective tension at the top of the riser after mooring line failure is approximately equal to the wet weight of the change in the suspension length of the riser. The maximum effective tension during the transient process is greater than the steady-state process because of the greater declination angle of the riser in the transient process. The flexible joint at the top of the riser is most likely to fail, and mooring line failure has little effect on the failure probability of different zones of the riser.
Author Contributions
Conceptualization, S.C. and Y.Y.; methodology, S.C., S.W. and M.Z.; software, S.C.; validation, S.C.; formal analysis, S.C. and Y.C.; investigation, S.C. and Y.Y.; resources, Y.Y.; data curation, S.C.; writing—original draft preparation, S.C.; writing—review and editing, S.C.; visualization, Y.Y. and Y.C.; supervision, Y.Y.; project administration, Y.Y. and Z.Y.; funding acquisition, Y.Y. All authors have read and agreed to the published version of the manuscript.
Funding
This research was funded by The National Natural Science Foundation of China for Innovative Research Groups (Grant No. 51321065), National Natural Science Foundation of China (Grant No. 52071234) and High-tech Ship Research Projects Sponsored by MIIT (Grant No.SSBQ-2020-HN-01-03).
Institutional Review Board Statement
Not applicable.
Informed Consent Statement
Not applicable.
Data Availability Statement
The data presented in this study are available upon request from the corresponding author.
Conflicts of Interest
The authors declare no conflicts of interest.
References
- Ma, K.-t. , Shu, H., Smedley, P., apos, Hostis, D., Duggal, A., 2013. A Historical Review on Integrity Issues of Permanent Mooring Systems, Offshore Technology Conference. [CrossRef]
- Hong, J. , Cho, S.-k., Seo, J., Sung, H.G., Lee, D.Y., Park, I.B., Won, Y.U., Choi, S.K., Kim, D.-W.J.J.o.O.E., Technology, 2015. Experimental Study of Effect of Mooring Line Failure on Behavior of Turret-moored FPSO Ship. 29, 231-240.
- Qiao, D.S. , Li, B.B., Yan, J., Qin, Y., Liang, H.Z., Ning, D.Z., 2021. Transient Responses Evaluation of FPSO with Different Failure Scenarios of Mooring Lines. Journal of Marine Science and Engineering 9 (2). [CrossRef]
- Li, Y. , Zhu, Q., Liu, L., Tang, Y., 2018. Transient response of a SPAR-type floating offshore wind turbine with fractured mooring lines. Renewable Energy 122, 576-588. [CrossRef]
- Yang, Y. , Bashir, M., Li, C., Wang, J., 2021. Investigation on mooring breakage effects of a 5 MW barge-type floating offshore wind turbine using F2A. Ocean Engineering 233. [CrossRef]
- Yu, J. , Hao, S., Yu, Y., Chen, B., Cheng, S., Wu, J., 2019. Mooring analysis for a whole TLP with TTRs under tendon one-time failure and progressive failure. Ocean Engineering 182, 360-385. [CrossRef]
- Cheng, S. , Yu, Y., Yu, J., Wu, J., Li, Z., Huang, Z., 2021. Mechanistic research on the complex motion response of a TLP under tendon breakage. Ocean Engineering 240, 109984. [CrossRef]
- Zhang, Z. , Kim, M.H., Ward, E.G., 2010. Progressive Mooring-Line Failure of a Deepwater MODU in Hurricane Conditions, ASME 2009 28th International Conference on Ocean, Offshore and Arctic Engineering, pp. 711-716. [CrossRef]
- Stendal, L.C. , 2015. Analysis Methods for Mooring Systems with focus on Accidental Limit State.
- Chuang, Z.J. , Chang, X., Li, C.Z., Lu, Y., Liu, S.W., 2020. Performance change of a semi-submersible production platform system with broken mooring line or riser. Engineering Failure Analysis 118. [CrossRef]
- Tabeshpour, M.R. , Abbasian, S., 2021. The optimum mooring configuration with minimum sensitivity to remove a mooring line for a semi-submersible platform. Applied Ocean Research 114. [CrossRef]
- Faltinsen, O. , 1990. Sea loads on ships and offshore structures. New York, NY (United States); Cambridge University Press, United States.
- Newman, J.N. , 1967. The drift force and moment on ships in waves. Journal of Ship Research 11, 51-60. [CrossRef]
- Pinkster, J.A. , 1980. Low frequency second order wave exciting forces on floating structures.
- Newman, J.N.J.m. , 1974. Second-order, slowly-varying forces on vessels in irregular waves.
- Morison, J.R.J.P.T.A. , 1950. The force exerted by surtace waves on piles. 189. [CrossRef]
- E. Cummins, W., 1962. The Impulse Response Function and Ship Motions. Schiffstechnik 9, 101-109.
- Shafer, G. , 1976. A Mathematical Theory of Evidence.
- Dezert, J. , Smarandache, F., 2016. Advances and Applications of DSmT for Information Fusion.
- Jia, X. , Jia, L., Huang, J., Liu, Y., Li, D., Li, G., Yi, C., 2021. Research on overall design of steel catenary riser for"Deep Sea No.1"energy station. China Offshore Oil and Gas 33 (5), 165-174.
- Smarandache, F. , Dezert, J., 2006. Advances and Applications of DSmT for Information Fusion.
- Jiang, H.N. , Xu, X.B., Wen, C.L., Ieee, 2009. THE COMBINATION METHOD FOR DEPENDENT EVIDENCE AND ITS APPLICATION FOR SIMULTANEOUS FAULTS DIAGNOSIS, 7th International Conference on Wavelet Analysis and Pattern Recognition, Baoding, PEOPLES R CHINA, pp. 496-501. [CrossRef]
- Guralnik, V. , Mylaraswamy, D., Voges, H., 2006. On handling dependent evidence and multiple faults in knowledge fusion for engine health management, 2006 IEEE Aerospace Conference, p. 9 pp.
- Jousselme, A.L. , Chunsheng, L., Grenier, D., Bosse, E., 2006. Measuring ambiguity in the evidence theory. IEEE Transactions on Systems, Man, and Cybernetics - Part A: Systems and Humans 36 (5), 890-903. [CrossRef]
- Zhu, H. , Li, D., 2021. Research on overall design and key technologies of"Deep Sea No.1" energy station in LS17-2gas field. China Offshore Oil and Gas 33 (3), 160-169. [CrossRef]
- Berteaux, H.O. , 1976. Buoy engineering. Buoy engineering.
|
Disclaimer/Publisher’s Note: The statements, opinions and data contained in all publications are solely those of the individual author(s) and contributor(s) and not of MDPI and/or the editor(s). MDPI and/or the editor(s) disclaim responsibility for any injury to people or property resulting from any ideas, methods, instructions or products referred to in the content. |
© 2023 by the authors. Licensee MDPI, Basel, Switzerland. This article is an open access article distributed under the terms and conditions of the Creative Commons Attribution (CC BY) license (http://creativecommons.org/licenses/by/4.0/).
