1. Introduction
Interleukin-6 receptor (IL-6R), stimulated by IL-6, triggers intricate cell functions including immune cell activation, hematopoietic stem cell differentiation, cancers and inflammatory bowel diseases [
1,
2,
3]. Not only our earlier research but also recent studies pointed out IL-6 levels in serum or tissues were associated with disease status, tumor proliferative activity, angiogenesis, metastasis, and patient prognosis in colorectal cancer (CRC) [
4,
5,
6,
7,
8,
9,
10,
11]. In addition to the above research implications, IL-6 signaling transduction could serve as a potential target to treat CRC [
12]. Evidence revealed anti-IL-6 antibodies were responsible for promising strategies to treat various cancers [
13]. Notably, our previous CRC cell model demonstrated anti-IL-6 receptor antibody suppressed the colony formation in soft agar and invasiveness of SW480, which was stimulated by IL-6 [
14]. We subsequently discovered that JAK/STAT3, PI3K/AKT and MEK/ERK-1/-2 pathways were involved in IL-6 induced clonogenicity and invasiveness of SW480, and neutralization of IL-6R could reverse the IL-6 effect on signaling transduction, suggesting the potential therapeutic role of the anti- human IL-6R antibody in CRC cell progression [
15]. More recently, we further demonstrated the injection therapy of anti-IL-6R antibody suppressed the tumor growth of SW480 xenograft and attenuated the proliferation marker Ki-67, along with down-regulating JAK/STAT3, PI3K/AKT and MEK/ERK-1/-2 signaling pathways [
16]. Whether IL-6R expression level in CRC tumor is capable of affecting the efficacy of anti-IL-6R antibody treatment remains unclear. Based on the different IL-6R mRNA levels in SW480 and HT-29 cells [
17], the tumor responses to anti-IL-6R antibody treatment were compared between xenografts of SW480 and HT-29 cells in NU/NU mice, including tumor growth, invasiveness in vivo and the underlying mechanism. We hypothesized IL-6R expression of CRC could be the key factor to influence the tumor response to anti-IL-6R antibody therapy.
2. Materials and Methods
2.1. Materials
Cell culture medium and other supplements were purchased from Gibco Ltd. (Paisley, UK). Primary antibodies including anti-ERK-1/-2, anti-phospho-ERK-1/-2 (The202/Tyr204), anti-STAT3, anti-phosphor-STAT3 (S727), anti-AKT, anti-phospho-AKT, anti-Ki-67 and secondary antibody conjugated with poly-peroxidase and DAB chromogen for immunohistochemical (IHC) staining were purchased from Abcam (Cambridge, MA, USA) and GeneTex (Hsinchu, Taiwan). CRC cell line SW480 and HT-29 were purchased from the Bioresource Collection and Research Center, Taiwan, and cultured in 90% medium supplemented with 10% heat-inactivated FBS, 25 U/mL penicillin and 25 μg/mL streptomycin at 37℃ and a water-saturated atmosphere. All experiments were carried out on cell lines passaged 5–20 times.
2.2. Animal Study
Animal experiments were performed according to the Guide for the Care and Use of Laboratory Animals (8th Edition), and the detail protocol used here was reviewed and approved by the Institutional Animal Care and Use Committee (IACUC No. 2017-234) of China Medical University (Taichung, Taiwan). Briefly, male nude mice (6-8-week-old) (strain NU/NU; BioLASCO Taiwan Co., Ltd., Taiwan) cultivated under the pathogen-free condition were inoculated with 100μL cell suspension of 5 × 10⁷cells/mL SW480 or HT-29 cells using a 1-mL syringe and a 27-gauge needle. The mice with approximately 100 mm3 tumor in size were divided into four groups. Each group contained 5 animals. The treated groups underwent peritoneal injection with 1.0 mg/kg anti-IL-6R antibody (Tocilizumab, Rhoch Inc., USA) in 0.1 mL PBS three times a week. The untreated groups were injected with an equal volume of PBS as a replacement for the anti-IL-6R antibody. The body weight and tumor length, width and height of the nude mice were measured once a week, and the volume was calculated (V = length × width × height / 2). After 11 days, the mice were sacrificed, and the tumors and other organs such as the liver, lungs, spleen, heart, and kidneys were removed surgically and fixed in 3% formalin/PBS.
2.3. Tissue Processing and H&E Staining
The detail procedures were essentially according to the previous study [
16]. Briefly, the formalin-fixed tissues in plastic tissue support racks were dehydrated by sequential immersing in 50%, 70%, 85%, 95% and 100% ethanol, and then xylene under an automatic dehydrator machine, and finally embedded in the molten paraffin wax. After slicing the paraffin-embedded tissues with a microtome (Leica RM2125 RTS; Leica Microsystems Inc., USA), the 2-3-μm-thick tissue sections were fixed on glass slides by heating at 60℃ overnight. For hematoxylin and eosin (H&E) staining, the 65℃ heat de-waxed paraffin-embedded tumor slices were washed in xylene and rehydration with series alcohol gradients (absolute alcohol, 95% alcohol and 80% alcohol). The rehydrated tissue sections were stained with Mayer’s H&E protocol and then underwent the dehydration process as described in our previous report [
16]. The mounted slices were scanned by a digital pathology scanner (MoticEasyScan, Motic Inc., China) to obtain the digital microscopy images on a computer using the image program (DSAssistant, Motic Inc., China).
2.4. Immunohistochemical (IHC) Staining
The detail procedures were essentially according to our previous study [
16]. Briefly, the tumor slices were rehydration with series alcohol gradients (absolute alcohol, 95% alcohol and 80% alcohol) and finally, immersed in TBS (Tris-buffered saline). After antigen retrieval in 95℃ heated citrate buffer and de-activated endogenous peroxidases with 3% H2O2, tissue sections in the slices were incubation with anti-Ki-67, ERK-1/-2, phosphorylated ERK-1/-2, STAT3, phosphorylated STAT3, matrix metalloproteinase (MMP)-9 and MMP-2 antibodies at the indicated dilution ratios. The location and intensity of each antigen on the tissue sections were visualized using the LSAB staining system and hematoxylin as the counter stain. The stained slices were dehydrated and scanned as high-resolution digital images using a digital pathology scanner. The overall staining intensity was typically classified into four categories: negative (0), weak (1 plus), moderate (2 plusses), and strong (3 plusses). Immunological activities of each antigen with the intensity scores were calculated by semi-quantitative analysis as described in prior studies [
16,
18].
2.5. Statistical Analysis
Data were analyzed by the Kruskal-Walli’s test, which is a nonparametric test, to evaluate significant differences between the control group and treatment groups. If significant differences existed, the multiple comparison test was then used to identification. Differences among group means were considered significant at P <0.05.
3. Results
3.1. Human CRC SW480 Tumor Xenografts Expressed Higher Levels of IL-6 Receptor than HT-29 Xenografts
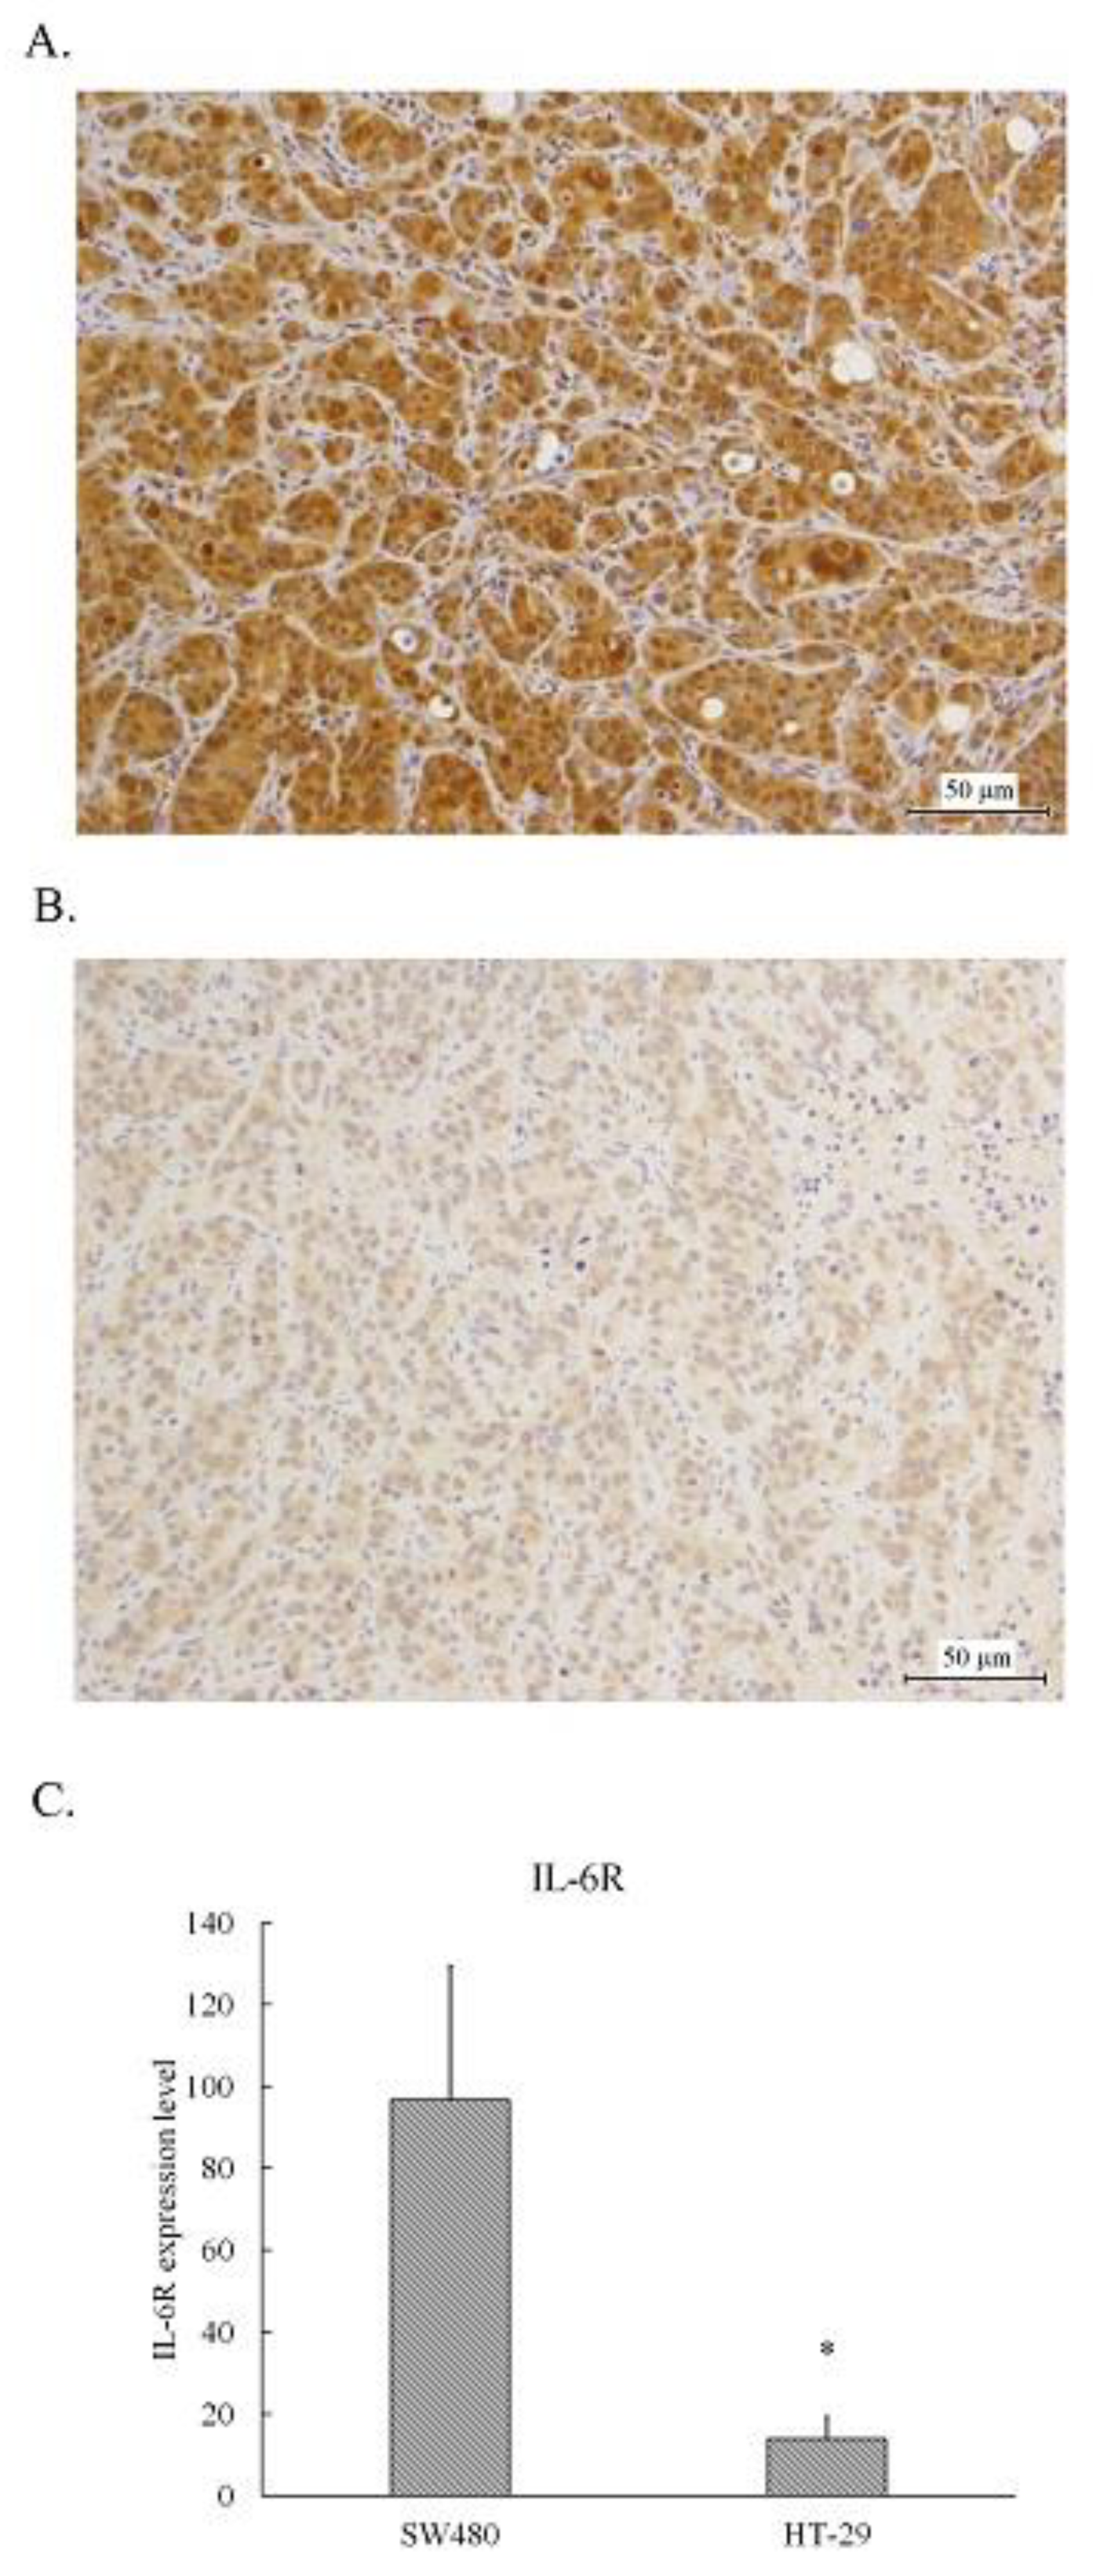
The tumors resected from the xenografts inoculated with SW480 or HT-29 cells were fixed and embedded in paraffin followed by sliced and stained with IL-6 receptor antibody using immunohistochemical staining. As shown in
Figure 1, the medium brown staining cells scattered some dark brown staining spots were found in SW480 tumors (
Figure 1A), whereas the light brown staining cells were in HT-29 tumors (
Figure 1B). The IHC overall score of IL-6 receptor in SW480 tumor slices was approximate 100, whereas that in HT-29 tumor slice was less than 20 (
Figure 1C). Obviously, the expression level of IL-6 receptor in SW480 tumors was higher than that in HT-29 tumors.
3.2. Inhibition Effect of anti-IL-6R antibody (Tocilizumab; ACTEMRA®) on the Tumor Growth of Human CRC SW480 Xenografts Was Superior to the Treated Group of HT-29 Xenografts
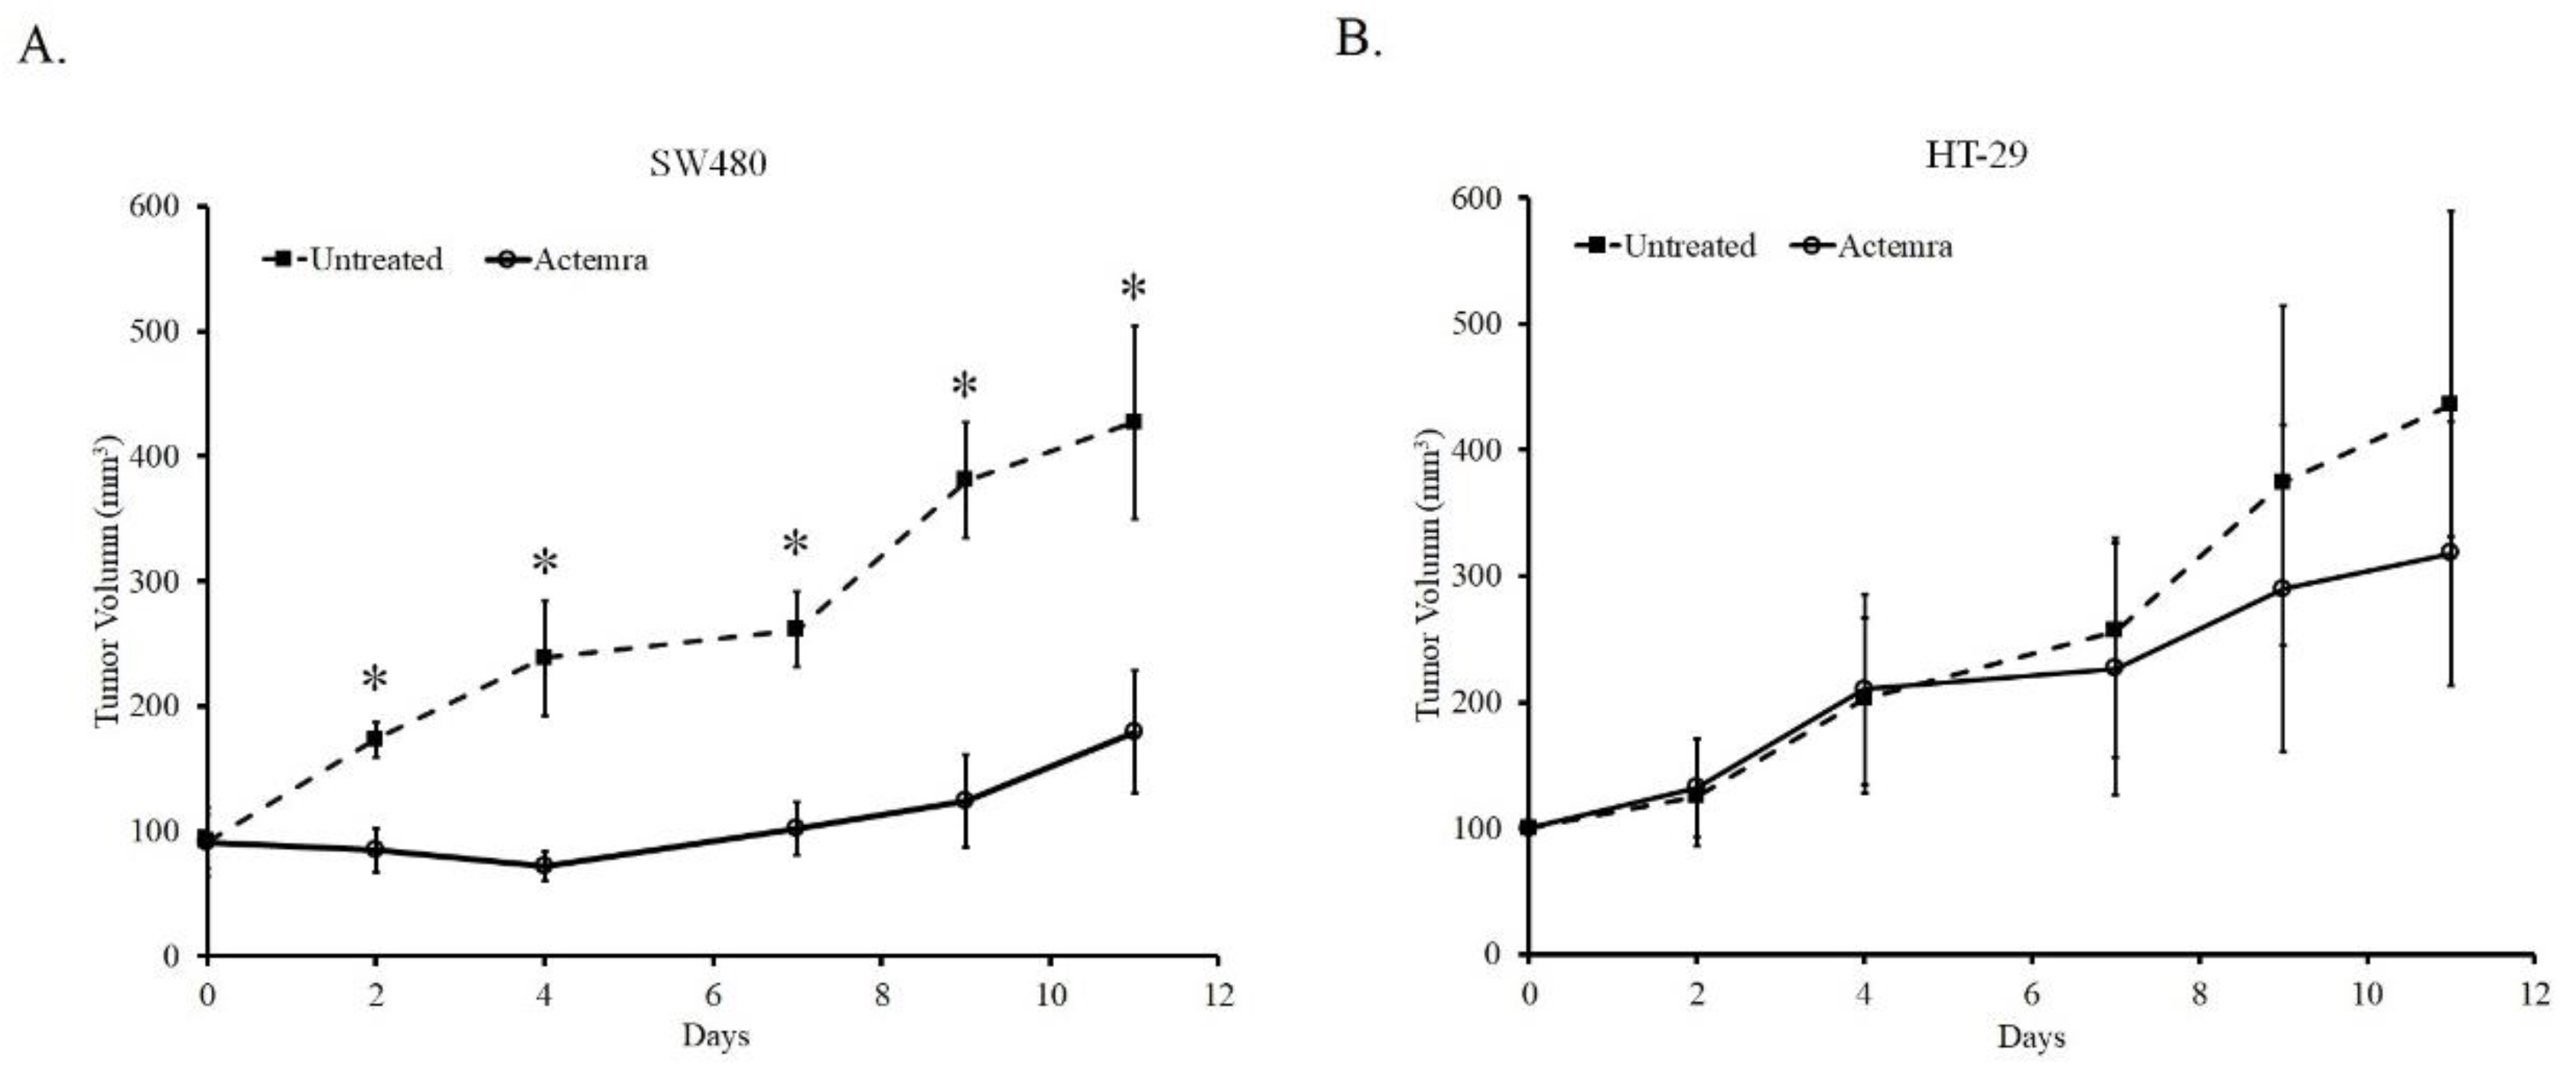
As shown in
Figure 2, the tumor size of both untreated SW480 and HT-29 xenografts gradually grew from a volume of 100mm
3 to approximately 400mm
3 after 11 days. In anti-IL-6R antibody (Tocilizumab; ACTEMRA
®) treatment group, the tumor growth was inhibited only in SW480 xenograft. The tumor was almost sustained at the original size after 7 days and increased to approximately 160mm
3 at the end of the experiment. In contrast to the treated group of SW480, the tumors in Actemra treated HT-29 xenograft showed the similar growing potential to the untreated group after 7 days despite of a slight decrease due to treatment at the end of the experiment. Although the average of tumor volume in the treated-HT-29 group was lower than that in the untreated group, the difference between the groups was not statistically significant. The results showed the tumor response to anti-IL-6R antibody therapy was associated with the IL-6R expression levels in the human CRC xenografts.
3.3. Inhibition Effect of anti-IL-6R Antibody (Tocilizumab; ACTEMRA®) on the Tumor Cell Proliferation of Human CRC SW480 Xenografts Was Superior to the Treated Group of HT-29 Xenografts
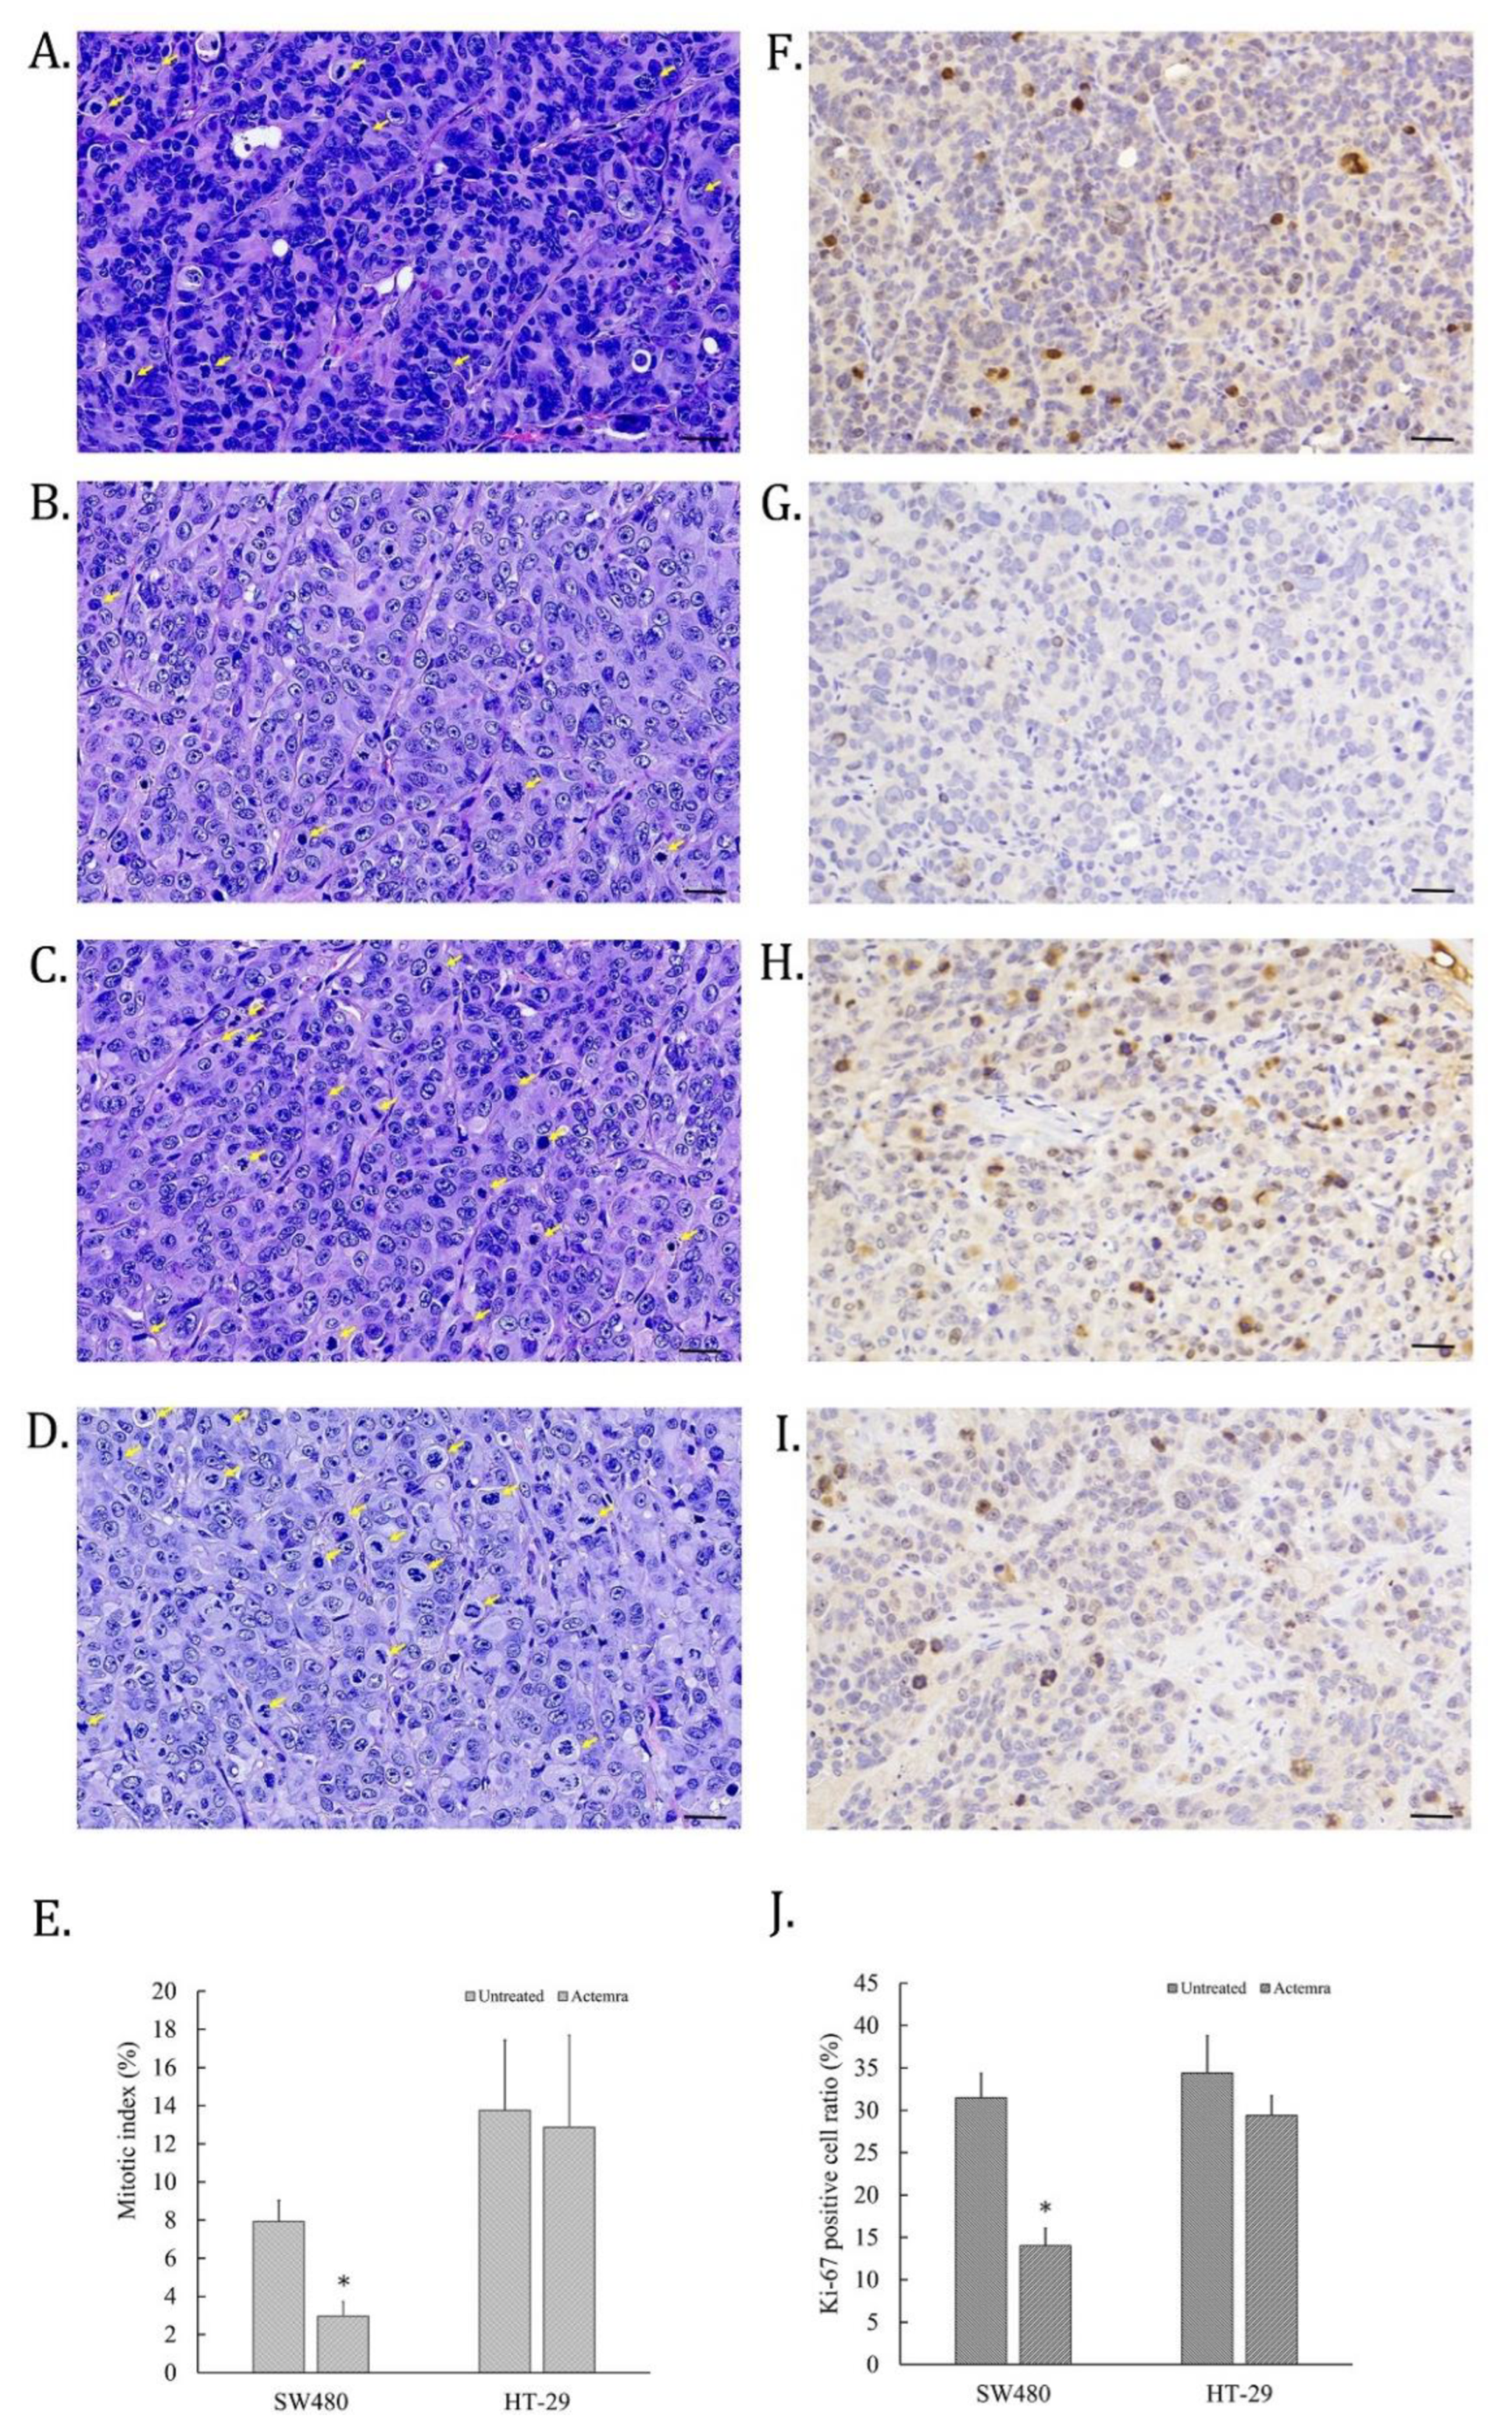
The cell proliferative ability of CRC in SW480 and HT-29 xenografts were evaluated by H&E staining for mitotic cells and IHC staining for anti-Ki-67 antibody on the tumor slices. As shown in
Figure 3A, some cell nucleus of untreated SW480 tumors were disappear and replaced with deep dark blue chromosomes, which were identified as the mitotic cells (yellow arrow). However, the mitotic cells in anti-IL-6R antibody-treated SW480 tumors were fewer than untreated tumors (
Figure 3B). On the other hand, the mitotic cells in the tumors of untreated HT-29 xenografts were more than that of SW480 (
Figure 3C), whereas the similar numbers of mitotic cells were also found in that of treated HT-29 tumors (
Figure 3D). To further confirm the cell dividing potential in the tumors of CRC xenografts, Ki-67 expression in the tumor slices was assessed by the IHC staining. The Ki-67 positive cells were scattered on the mitotic cells of tumor slices in untreated SW480, and HT-29 cell xenografts (
Figure 3E and G). Only a few cells were Ki-67-positive on Actemra-treated SW480 tumor slices (
Figure 3F). However, Actemra-treated HT-29 tumors showed more Ki-67 positive cells than the treated SW480 group (
Figure 3H). Based on the calculation of the mitotic index on these tumor slices, untreated SW480 showed 8% of total cells, in contrast to only 3% in Actemra-treated SW480 group (
Figure 3I). Both untreated and treated HT-29 showed more than 12% mitotic cells with an insignificant difference between the two groups. The numbers of dividing cells in each group were further confirmed by Ki-67 positive cells. There was no significant difference between treated and untreated HT-29 groups. On the contrary, less than 15% Ki-67positive cells were found in the treated SW480 group compared with approximately 30% positive cells in the untreated group (
Figure 3J). The results indicated the therapeutic effect of anti-IL-6R on cell proliferative ability was closely correlated with IL-6R expression level in CRC tumors.
3.4. Inhibition Effect of anti-IL-6R antibody (Tocilizumab; ACTEMRA®) on the Tumor Cell Invasiveness of Human CRC SW480 Xenografts Was Superior to the Treated Group of HT-29 Xenografts
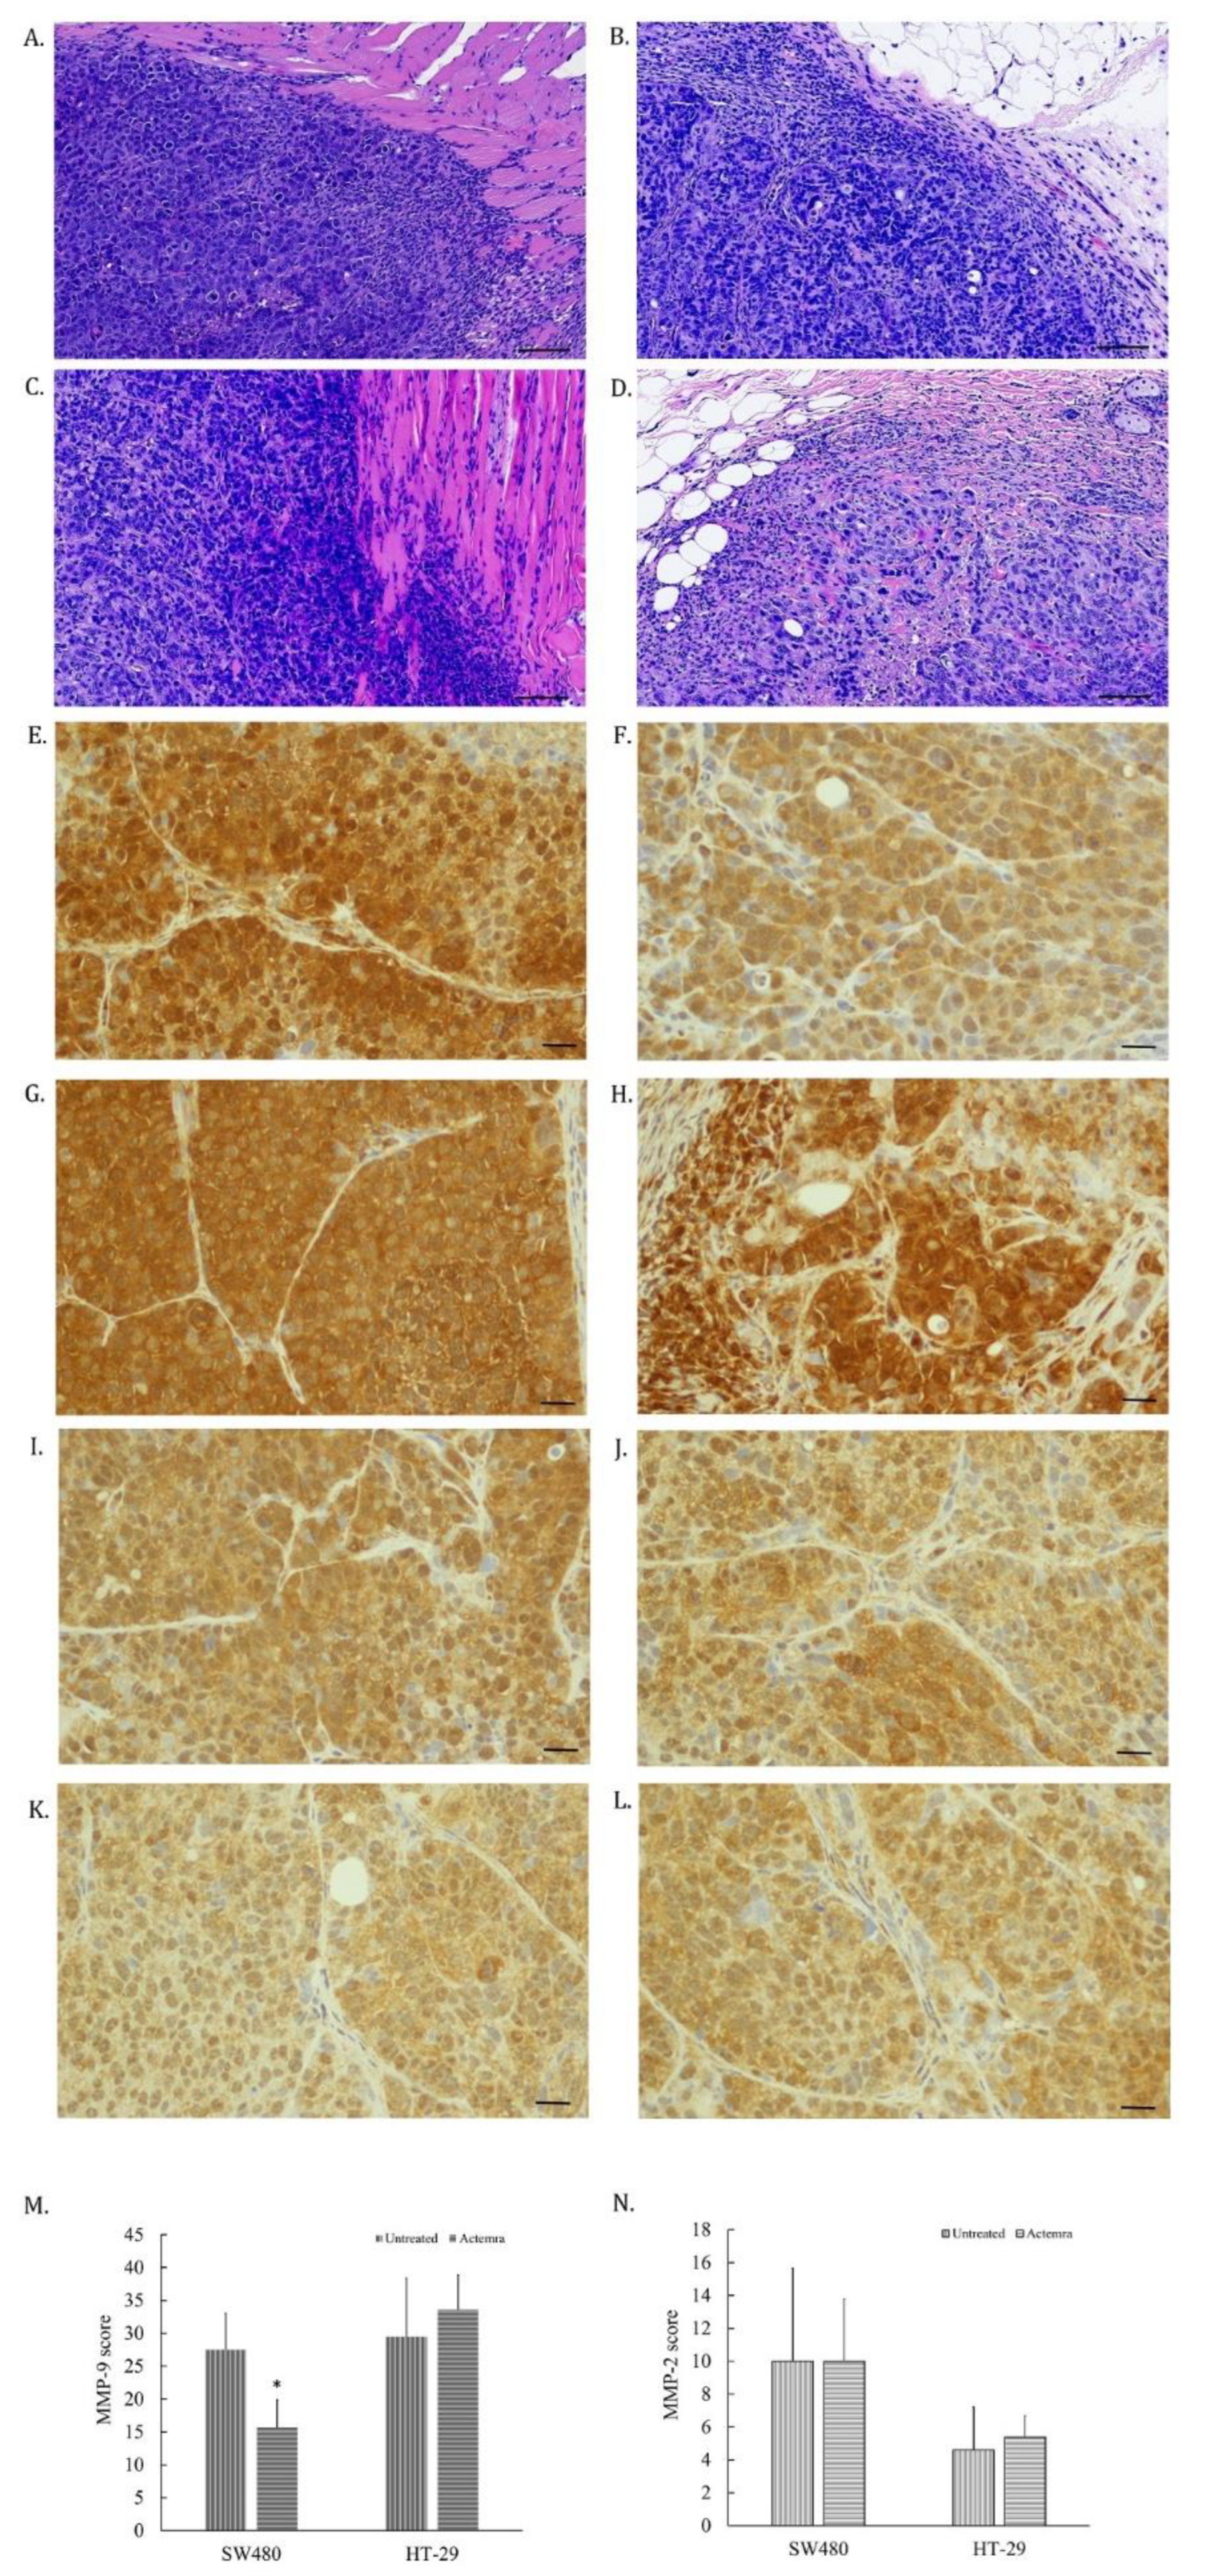
The tumor cells invading to surrounding tissues in SW480 and HT-29 xenografts were evaluated by morphological features of H&E staining and the expression of matrix metaloprotease-2 and -9 (MMP2 and MMP9) on the tumor slices. As shown in
Figure 4A, the edge of tumor was dispersed, and some cancer cells infiltrated into the muscle layer in untreated SW480 tumors. However, anti-IL-6R antibody-treated SW480 tumors were surrounded with the fiber tissues (
Figure 4B). Both untreated and treated HT-29 tumors showed infiltrating CRC cells into the surrounding tissues (
Figure 4C and D). The expression of MMP-9 in untreated SW480 tumor cells (
Figure 4 E) was higher than the treated SW480 group (
Figure 4 F). In contrast, the equal expression levels were found in both untreated (
Figure 4G) and the treated HT-29 tumor cells (
Figure 4H). However, the expression of MMP-2 in all tested tumor cells didn’t seem to differ (
Figure 4I to L). The intensity of the MMP-9 expression in the treated SW480 tumors was lower than the untreated SW480 tumors (
Figure 4M), whereas no difference between untreated and treated HT-29 tumors (
Figure 4N). The results revealed that the invasion potential of SW480 tumors was suppressed by anti-IL-6R antibody treatment through suppressing MMP-9 expression in treated tumors, corresponding to the expression level of the IL-6R in the tumors.
3.5. Inhibition Effect of anti-IL-6R antibody (Tocilizumab; ACTEMRA®) on Erk-1/-2 and STAT3 Signaling Transduction of Human CRC SW480 Xenografts Was Superior to the Treated Group of HT-29 Xenografts
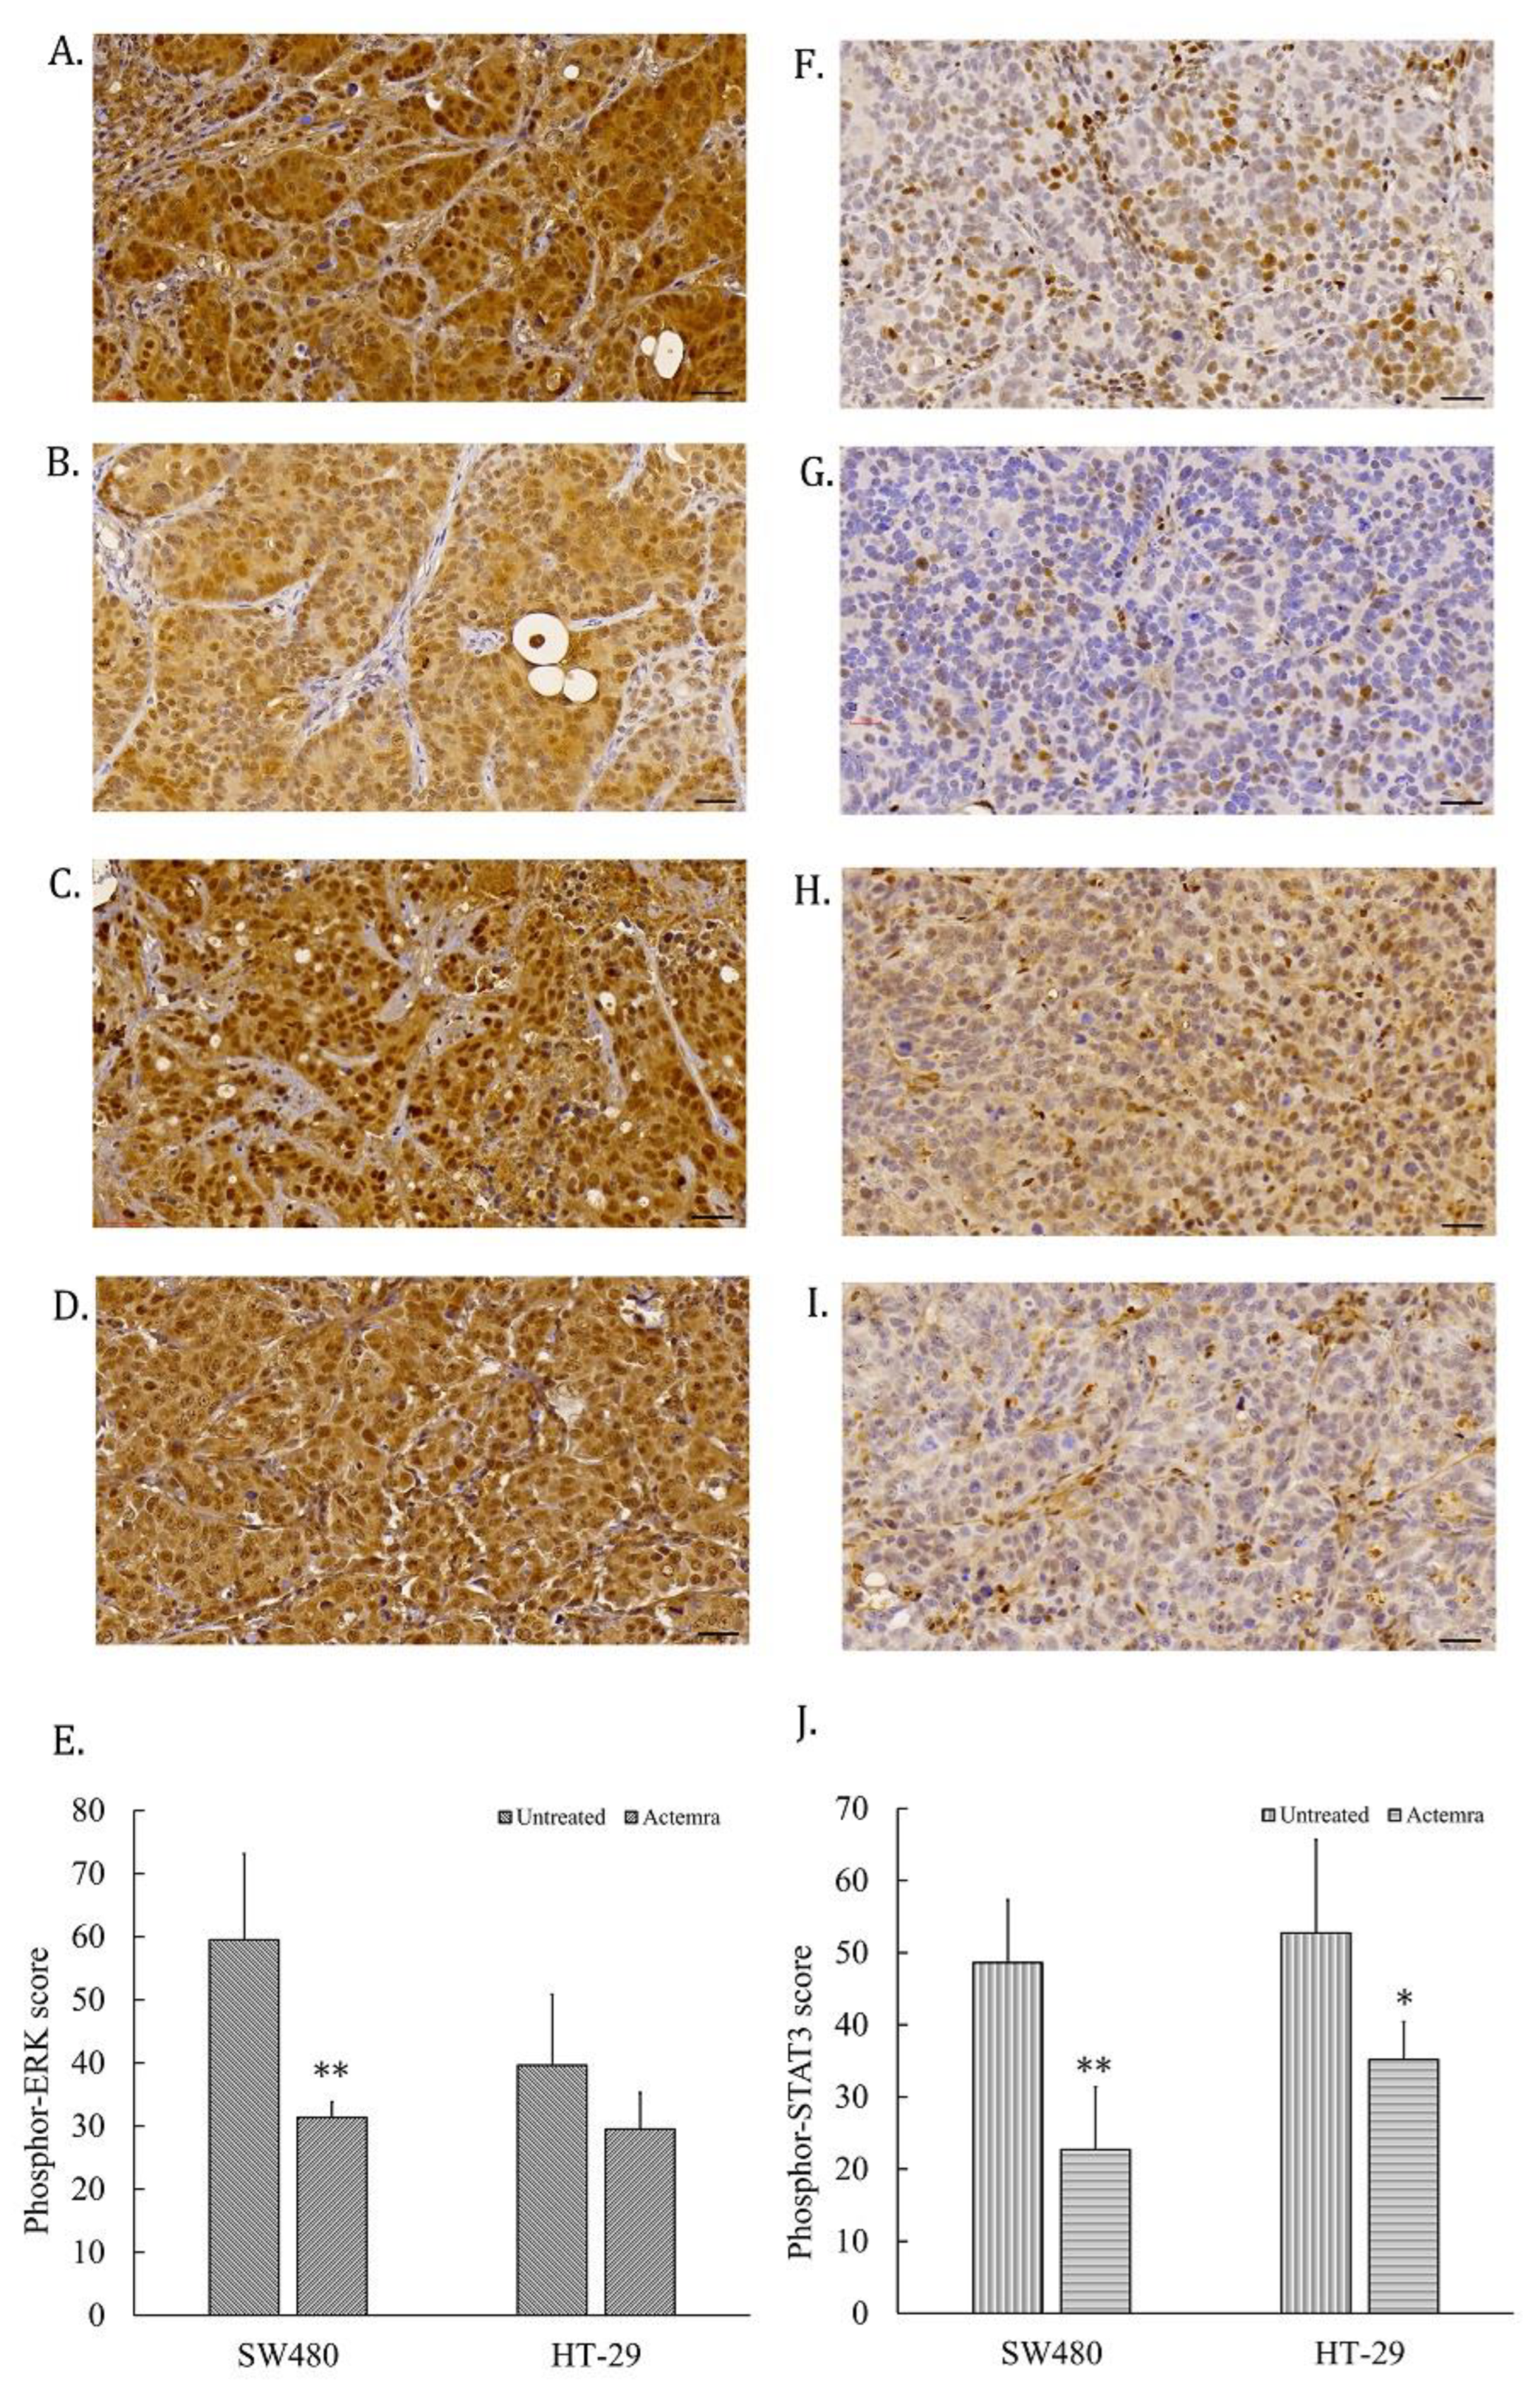
Tumor slices from human CRC SW480 and HT-29 xenografts were subjected to access the IL-6R signaling pathways, including phosphor-STAT3 and phosphor-Erk-1/-2 levels in the untreated and treated groups. As shown in
Figure 5A, the phosphor-Erk-1/-2 staining intensity was strong positive (3+) in almost all the tumor cells from the untreated SW480 group, whereas the intensity was only 1 to 2 plusses within the treated SW480 tumor cells (
Figure 5B). The tumor cells showed the intensity of 2 to 3 plusses from untreated HT-29 group (
Figure 5C) and 2 plusses from treated HT-29 group (
Figure 5D). The total intensity score of phosphor-Erk from untreated SW480 tumor cells was approximately 60 by semi-quantitative analysis, whereas 30 from the anti-IL-6R antibody treated SW480 tumors. The phosphor-Erk staining intensity significantly differed between the untreated and treated groups (P < 0.01). On the other hand, the score was approximately 40 from untreated HT-29 tumors and 30 from treated HT-29 tumor, but there was no significant difference between these two groups (
Figure 5E). Phosphor-STAT3 staining was strong positive in approximate a half of the tumor cells from the untreated SW480 tumors (
Figure 5F) and HT-29 (
Figure 5H); and decreased in the treated group of SW480 (
Figure 5G) and HT-29 (
Figure 5I). The phosphor-STAT3 staining of untreated SW480 tumor cells scored approximately 50 via semi-quantitative analysis that was significantly different from the treated group with a score of 23 (P < 0.01) (F. 5E). The phosphor-STAT3 staining of untreated HT-29 tumor cells was scored approximately 60, whereas 38 in the treated HT-29 group (P < 0.05) (
Figure 5J). The phosphor-STAT3 staining intensity significantly differed between two groups.
4. Discussion
Emerging evidence has illustrated IL-6/IL-6R gp130 inflammation signaling pathway plays a crucial rule in the promotion of carcinogenesis in CRC [
19,
20,
21]. Targeted anti-IL-6R antibody therapy for CRC was capable of an adjuvant strategy [
22,
23]. Our previous studies showed that anti-IL-6R antibody potentially inhibited tumor growth and invasiveness in vitro and in vivo through interfering IL-6 signaling transduction in IL-6R expressing CRC cell lines, including Erk-1/-2, STAT3 and AKT phosphorylation/activation [
15,
16]. Theoretically, the tumor response to targeted treatment drugs is tightly associated with expression levels of target proteins in/on cancer cells [
24]. In the present study, we attempted to further investigate whether IL-6R expression level is the important predictor for the tumor response of the CRC to anti-IL-6R antibody treatment. Two CRC cell lines, SW480 and HT-29, were chosen after evaluating the IL-6R mRNA level in an earlier study that SW480 cells exerted higher IL-6R levels than HT-29 cells [
17]. The tumor slices from the xenografts of these two cell lines showed different protein levels of IL-6R. Indeed, the SW480 tumors exerted more potent IL-6R intensity than HT-29. Also, the inhibitory effect of anti-IL-6R antibody on tumor growth in SW480 xenografts was more powerful than in HT-29. The tumor growth with anti-IL-6R antibody therapy further represented attenuated expressions of the mitotic index and Ki-67 staining. Specifically, SW480 tumors posed high levels of IL-6R that anti-IL-6R antibody treatment effectively suppressed the mitotic cells. On the contrary, the HT-29 tumors with low IL-6R expressions represented equal results of mitotic index and Ki-67 staining between untreated and anti-IL-6R antibody-treated groups. The results indicate that CRC tumor cells with higher IL-6R expression are more sensitive to anti-IL-6R antibody treatment.
The two human CRC cell xenografts represented different invasiveness ability also corresponded to IL-6R expression levels. The Tocilizumab-treated SW480 tumors were surrounding by fibrotic tissue that form a barrier-like structure to avoid CRC cell infiltrating, as described in our previous report [
16]. However, the tumor edge of the same treatment of HT-29 xenografts seemed to be not clear and similar to untreated SW480 or HT-29 tumors. Meanwhile, there were several cancer cells infiltrating into surrounding muscle or fatty tissues. Several studies along with our research revealed that the expression of invasiveness-related proteinases such as MMP-9/MMP-2 were inhibited by interfering IL-6 signaling transduction that suppressed CRC cell invasiveness in vitro [
15,
25,
26,
27]. Herein we found the expression of MMP-9 was suppressed by Tocilizumab treatment in human CRC SW480 xenografts. Nonetheless, the MMP-9 level did not significantly differ between untreated and treated HT-29 groups. IL-6R expressing level in CRC cells would be the key factor for the effect of Tocilizumab on the expression of invasiveness-related proteinases. MMP-2 expression in all groups were not changed, suggesting the underlying mechanism of CRC tumor invasiveness is extremely intricate. Previous reports revealed that cell signals triggering ERK phosphorylation/activation serve as an important regulatory mechanism to modulate MMP-9/MMP-2 expressions [
15,
28,
29]. In the current study, phosphor-ERK was not suppressed by Tocilizumab in HT-29 tumors. Our prior study demonstrated that only simultaneously suppressing ERK and AKT phosphorylation was capable of inhibiting the expression of MMP-9/ MMP -2 and the invasiveness of CRC cells, providing the possible reason to explain the discrepancy between invasiveness-related experiments [
15]. Last but not least, Tocilizumab suppressed the phosphor-STAT3 signaling in both treated SW480 group and HT-29 groups, indicating JAK/STAT-3 signaling transduction is more sensitive to IL-6/IL-6R signaling blockade, even in the lower IL-6R expressing HT-29 cells.
5. Conclusions
Human CRC SW480 xenografts with higher IL-6R expression levels exerted better responsiveness in Tocilizumab therapy than the treated HT-29 group. Likewise, such therapeutic effects on proliferative ability with mitotic index and Ki-67 expressions, the invasiveness with MMP-9 proteinase expressions, ERK 1/2 and STAT3 signaling transduction in SW480 treatment group were superior to HT-29 treatment group. In light of our results, IL-6R is the key indicator for the efficacy of Tocilizumab treatment in CRC xenograft models. From the perspective of precision medicine, tumor response to anti-IL-6R antibody therapy could be predicted on the basis of IL-6R ex-pression levels. In this manner, Tocilizumab could serve as a targeted and promising anti-CRC therapy.
Author Contributions
Y.-C.C., C.-P.H. and J.-F.C. were responsible for the study concept and design, interpretation of data and writing of the manuscript. S.-J.C. and C.-C.H. assisted in electroencephalographic measure, biochemical analysis and experimental support. W.-C.L., M.-T.L., Y.-C. C., T.-Y.K., W.-S.Y. and C.-H.Y. implemented the manuscript revisions. All authors have read and agreed to the published version of the manuscript.
Funding
This work was supported by the Ministry of Science and Technology#1 under grant MOST 107-2314-B-264-001; MOST 109-2628-B-385-001; Research Fund from Taoyuan Branch of Taipei Veterans General Hospital and the Renal care joint foundation.
Data Availability Statement
All data used to support the findings of this study are available from the corresponding author, Chang, J.-F.; upon reasonable request.
Acknowledgments
The authors appreciated the technical support from Dr. Hsien-Neng Huang.
Conflicts of Interest
The authors declare no conflict of interest.
References
- Malemud, C.J. Suppression of Autoimmune Arthritis by Small Molecule Inhibitors of the JAK/STAT Pathway. Pharmaceuticals 2010, 3, 1446–1455. [Google Scholar] [CrossRef]
- Tie, R.; Li, H.; Cai, S.; Liang, Z.; Shan, W.; Wang, B.; Tan, Y.; Zheng, W.; Huang, H. Interleukin-6 Signaling Regulates Hematopoietic Stem Cell Emergence. Exp. Mol. Med. 2019, 51, 1–12. [Google Scholar] [CrossRef]
- Giraldez, M.D.; Carneros, D.; Garbers, C.; Rose-John, S.; Bustos, M. New Insights into IL-6 Family Cytokines in Metabolism, Hepatology and Gastroenterology. Nat. Rev. Gastroenterol. Hepatol. 2021, 18, 787–803. [Google Scholar] [CrossRef]
- Chung, Y.-C.; Chaen, Y.-L.; Hsu, C.-P. Clinical Significance of Tissue Expression of Interleukin-6 in Colorectal Carcinoma. Anticancer. Res. 2006, 26, 3905–3911. [Google Scholar]
- Chung, Y.-C.; Chang, Y.-F. Serum Interleukin-6 Levels Reflect the Disease Status of Colorectal Cancer. J. Surg. Oncol. 2003, 83, 222–226. [Google Scholar] [CrossRef]
- Kakourou, A.; Koutsioumpa, C.; Lopez, D.S.; Hoffman-Bolton, J.; Bradwin, G.; Rifai, N.; Helzlsouer, K.J.; Platz, E.A.; Tsilidis, K.K. Interleukin-6 and Risk of Colorectal Cancer: Results from the CLUE II Cohort and a Meta-Analysis of Prospective Studies. Cancer Causes Control 2015, 26, 1449–1460. [Google Scholar] [CrossRef]
- Kinoshita, T.; Ito, H.; Miki, C. Serum Interleukin-6 Level Reflects the Tumor Proliferative Activity in Patients with Colorectal Carcinoma. Cancer 1999, 85, 2526–2531. [Google Scholar] [CrossRef]
- Knüpfer, H.; Preiss, R. Serum Interleukin-6 Levels in Colorectal Cancer Patients--a Summary of Published Results. Int. J. Colorectal Dis. 2010, 25, 135–140. [Google Scholar] [CrossRef] [PubMed]
- Nagasaki, T.; Hara, M.; Nakanishi, H.; Takahashi, H.; Sato, M.; Takeyama, H. Interleukin-6 Released by Colon Cancer-Associated Fibroblasts Is Critical for Tumour Angiogenesis: Anti-Interleukin-6 Receptor Antibody Suppressed Angiogenesis and Inhibited Tumour–Stroma Interaction. Br. J. Cancer 2013, 110, 469–478. [Google Scholar] [CrossRef] [PubMed]
- Vainer, N.; Dehlendorff, C.; Johansen, J.S. Systematic Literature Review of IL-6 as a Biomarker or Treatment Target in Patients with Gastric, Bile Duct, Pancreatic and Colorectal Cancer. Oncotarget 2018, 9, 29820–29841. [Google Scholar] [CrossRef] [PubMed]
- Varkaris, A.; Katsiampoura, A.; Davis, J.S.; Shah, N.; Lam, M.; Frias, R.L.; Ivan, C.; Shimizu, M.; Morris, J.; Menter, D.; et al. Circulating Inflammation Signature Predicts Overall Survival and Relapse-Free Survival in Metastatic Colorectal Cancer. Br. J. Cancer 2019, 120, 340–345. [Google Scholar] [CrossRef]
- Wang, S.-W.; Sun, Y.-M. The IL-6/JAK/STAT3 Pathway: Potential Therapeutic Strategies in Treating Colorectal Cancer. Int. J. Oncol. 2014, 44, 1032–1040. [Google Scholar] [CrossRef]
- Trikha, M.; Corringham, R.; Klein, B.; Rossi, J.-F. Targeted Anti-Interleukin-6 Monoclonal Antibody Therapy for Cancer: A Review of the Rationale and Clinical Evidence. Clin. Cancer Res. 2003, 9, 4653–4665. [Google Scholar]
- Hsu, C.-P.; Chung, Y.-C. Influence of Interleukin-6 on the Invasiveness of Human Colorectal Carcinoma. Anticancer. Res. 2006, 26, 4607–4614. [Google Scholar] [PubMed]
- Hsu, C.-P.; Chen, Y.-L.; Huang, C.-C.; Chou, C.-C.; Liu, C.-L.; Hung, C.-H.; Kao, T.-Y.; Chung, Y.-C. Anti-Interleukin-6 Receptor Antibody Inhibits the Progression in Human Colon Carcinoma Cells: ANTI-IL-6 RECEPTOR AND CRC PROGRESSION. Eur. J. Clin. Invest. 2011, 41, 277–284. [Google Scholar] [CrossRef] [PubMed]
- Chung, Y.-C.; Ku, Y.-L.; Chiang, H.-C.; Liu, W.-C.; Kao, T.-Y.; Yang, C.-H.; Huang, C.-C.; Hsu, C.-P. Antibody to Interleukin-6 Receptor Inhibits in Vivo Growth of Human Colorectal Carcinoma Cell Xenografts. Anticancer. Res. 2021, 41, 4907–4916. [Google Scholar] [CrossRef]
- Schneider, M.R.; Hoeflich, A.; Fischer, J.R.; Wolf, E.; Sordat, B.; Lahm, H. Interleukin-6 Stimulates Clonogenic Growth of Primary and Metastatic Human Colon Carcinoma Cells. Cancer Lett. 2000, 151, 31–38. [Google Scholar] [CrossRef] [PubMed]
- Inwald, E.C.; Klinkhammer-Schalke, M.; Hofstädter, F.; Zeman, F.; Koller, M.; Gerstenhauer, M.; Ortmann, O. Ki-67 Is a Prognostic Parameter in Breast Cancer Patients: Results of a Large Population-Based Cohort of a Cancer Registry. Breast Cancer Res. Treat. 2013, 139, 539–552. [Google Scholar] [CrossRef]
- Waldner, M.J.; Foersch, S.; Neurath, M.F. Interleukin-6--a Key Regulator of Colorectal Cancer Development. Int. J. Biol. Sci. 2012, 8, 1248–1253. [Google Scholar] [CrossRef]
- Taher, M.Y.; Davies, D.M.; Maher, J. The Role of the Interleukin (IL)-6/IL-6 Receptor Axis in Cancer. Biochem. Soc. Trans. 2018, 46, 1449–1462. [Google Scholar] [CrossRef] [PubMed]
- Turano, M.; Cammarota, F.; Duraturo, F.; Izzo, P.; De Rosa, M. A Potential Role of IL-6/IL-6R in the Development and Management of Colon Cancer. Membranes 2021, 11. [Google Scholar] [CrossRef]
- Bonamichi-Santos, R.; Castells, M. Diagnoses and Management of Drug Hypersensitivity and Anaphylaxis in Cancer and Chronic Inflammatory Diseases: Reactions to Taxanes and Monoclonal Antibodies. Clin. Rev. Allergy Immunol. 2018, 54, 375–385. [Google Scholar] [CrossRef]
- Kampan, N.C.; Xiang, S.D.; McNally, O.M.; Stephens, A.N.; Quinn, M.A.; Plebanski, M. Immunotherapeutic Interleukin-6 or Interleukin-6 Receptor Blockade in Cancer: Challenges and Opportunities. Curr. Med. Chem. 2018, 25, 4785–4806. [Google Scholar] [CrossRef]
- Guo, R.; Luo, J.; Chang, J.; Rekhtman, N.; Arcila, M.; Drilon, A. MET-Dependent Solid Tumours - Molecular Diagnosis and Targeted Therapy. Nat. Rev. Clin. Oncol. 2020, 17, 569–587. [Google Scholar] [CrossRef] [PubMed]
- Liu, H.; Ren, G.; Wang, T.; Chen, Y.; Gong, C.; Bai, Y.; Wang, B.; Qi, H.; Shen, J.; Zhu, L.; et al. Aberrantly Expressed Fra-1 by IL-6/STAT3 Transactivation Promotes Colorectal Cancer Aggressiveness through Epithelial-Mesenchymal Transition. Carcinogenesis 2015, 36, 459–468. [Google Scholar] [CrossRef] [PubMed]
- Han, S.; Jeong, A.J.; Yang, H.; Bin Kang, K.; Lee, H.; Yi, E.H.; Kim, B.-H.; Cho, C.-H.; Chung, J.W.; Sung, S.H.; et al. Ginsenoside 20(S)-Rh2 Exerts Anti-Cancer Activity through Targeting IL-6-Induced JAK2/STAT3 Pathway in Human Colorectal Cancer Cells. J. Ethnopharmacol. 2016, 194, 83–90. [Google Scholar] [CrossRef] [PubMed]
- Tsai, S.-C.; Wu, W.-C.; Yang, J.-S. Tetrandrine Inhibits Epithelial-Mesenchymal Transition in IL-6-Induced HCT116 Human Colorectal Cancer Cells. Onco. Targets. Ther. 2021, 14, 4523–4536. [Google Scholar] [CrossRef] [PubMed]
- Fan, L.; Wu, Y.; Wang, J.; He, J.; Han, X. Sevoflurane Inhibits the Migration and Invasion of Colorectal Cancer Cells through Regulating ERK/MMP-9 Pathway by up-Regulating MiR-203. Eur. J. Pharmacol. 2019, 850, 43–52. [Google Scholar] [CrossRef] [PubMed]
- Zhang, T.; Wang, Z.; Liu, Y.; Huo, Y.; Liu, H.; Xu, C.; Mao, R.; Zhu, Y.; Liu, L.; Wei, D.; et al. Plastin 1 Drives Metastasis of Colorectal Cancer through the IQGAP1/Rac1/ERK Pathway. Cancer Sci. 2020, 111, 2861–2871. [Google Scholar] [CrossRef] [PubMed]
|
Disclaimer/Publisher’s Note: The statements, opinions and data contained in all publications are solely those of the individual author(s) and contributor(s) and not of MDPI and/or the editor(s). MDPI and/or the editor(s) disclaim responsibility for any injury to people or property resulting from any ideas, methods, instructions or products referred to in the content. |
© 2023 by the authors. Licensee MDPI, Basel, Switzerland. This article is an open access article distributed under the terms and conditions of the Creative Commons Attribution (CC BY) license (http://creativecommons.org/licenses/by/4.0/).
