
Submitted:
24 November 2023
Posted:
28 November 2023
You are already at the latest version
Abstract
In this work, we propose a Fog-enabled UAV-as-a-Service (FU-Serve) architecture to address the issues of data transmission delay for serving time-critical Internet of Things (IoT) applications. Traditionally, in a UAV-as-a-Service (UaaS) platform, different UAVs host heterogeneous sensors, which sense the physical phenomenon and transmit the sensed data to a centralized entity. Transmission of data from the sensors to the centralized entity and making any decision for an application consumes a significant amount of time. Consequently, the traditional UaaS architecture is unsuitable for serving time-critical IoT applications such as transportation, healthcare, and industries. To address these issues of service latency for time-critical IoT applications, we present the FU-Serve architecture by introducing the concept of fog computing in the UaaS platform. We discuss all the components of FU-Serve elaborately in this paper. Additionally, we architect optimal and dynamic fog node selection mechanisms for FU-Serve, which reduce the transmission delay in the networks. The simulation results show that the FU-Serve outperforms by $75\%$ compared to the traditional UaaS platform.
Keywords:
Unmanned Aerial Vehicle (UAV)
; Fog computing
; IoT
; UAV virtualization
; Genetic algorithm
; Optimization
I. Introduction
Recent advancements in Micro-Electromechanical Systems (MEMS) have led to rapid Internet of Things (IoT) paradigm development. Different applications such as healthcare, agriculture, transportation, industry, and smart homes [1] use the IoT paradigm for autonomous service delivery. However, different technologies, including communication networks, Artificial Intelligence (AI), blockchain, and Unmanned Aerial Vehicles (UAVs), actively participate in serving several IoT applications. In this work, we focus on a specific architecture – UAV-as-a-Service (UaaS) [2] – which provides different IoT services to multiple end-users, simultaneously using the concept of UAV virtualization. The end-users register with a UaaS platform without knowing the complex background technologies and processes. On the other hand, different UAV owners procure UAVs and register with the same platform to rent their respective UAVs for serving multiple IoT applications. In return, the UAV owners earn a monetary profit. In the process, the service providers maintain the architecture, using different protocols and schemes, and provide the service to the end-users. Therefore, in a platform, an end-user pays the rent based on the utilization of the UAVs for serving their respective applications, and the service providers and UAV owners earn a certain amount of monetary profit from the payment of an end-user.
The UaaS platform is an efficient platform by which the end-users can avail of the UAV services without procuring them. In the traditional UaaS, the UAVs host multiple heterogeneous sensors and transmit the sensed data to a centralized entity such as the cloud and the server. In such an architecture, the delay in data transmission from a UAV to a centralized entity is significant. Consequently, the overall service delay in the system increase, which is unacceptable for time-critical IoT applications. Therefore, in this work, we propose a UAV service delivery architecture (FU-Serve) to minimize the service delay while reducing the data transmission delay between a UAV and the centralized entity. Additionally, we discuss different essential components of FU-Serve that enable the architecture to provide multiple services in less time as compared to the traditional UaaS platform.
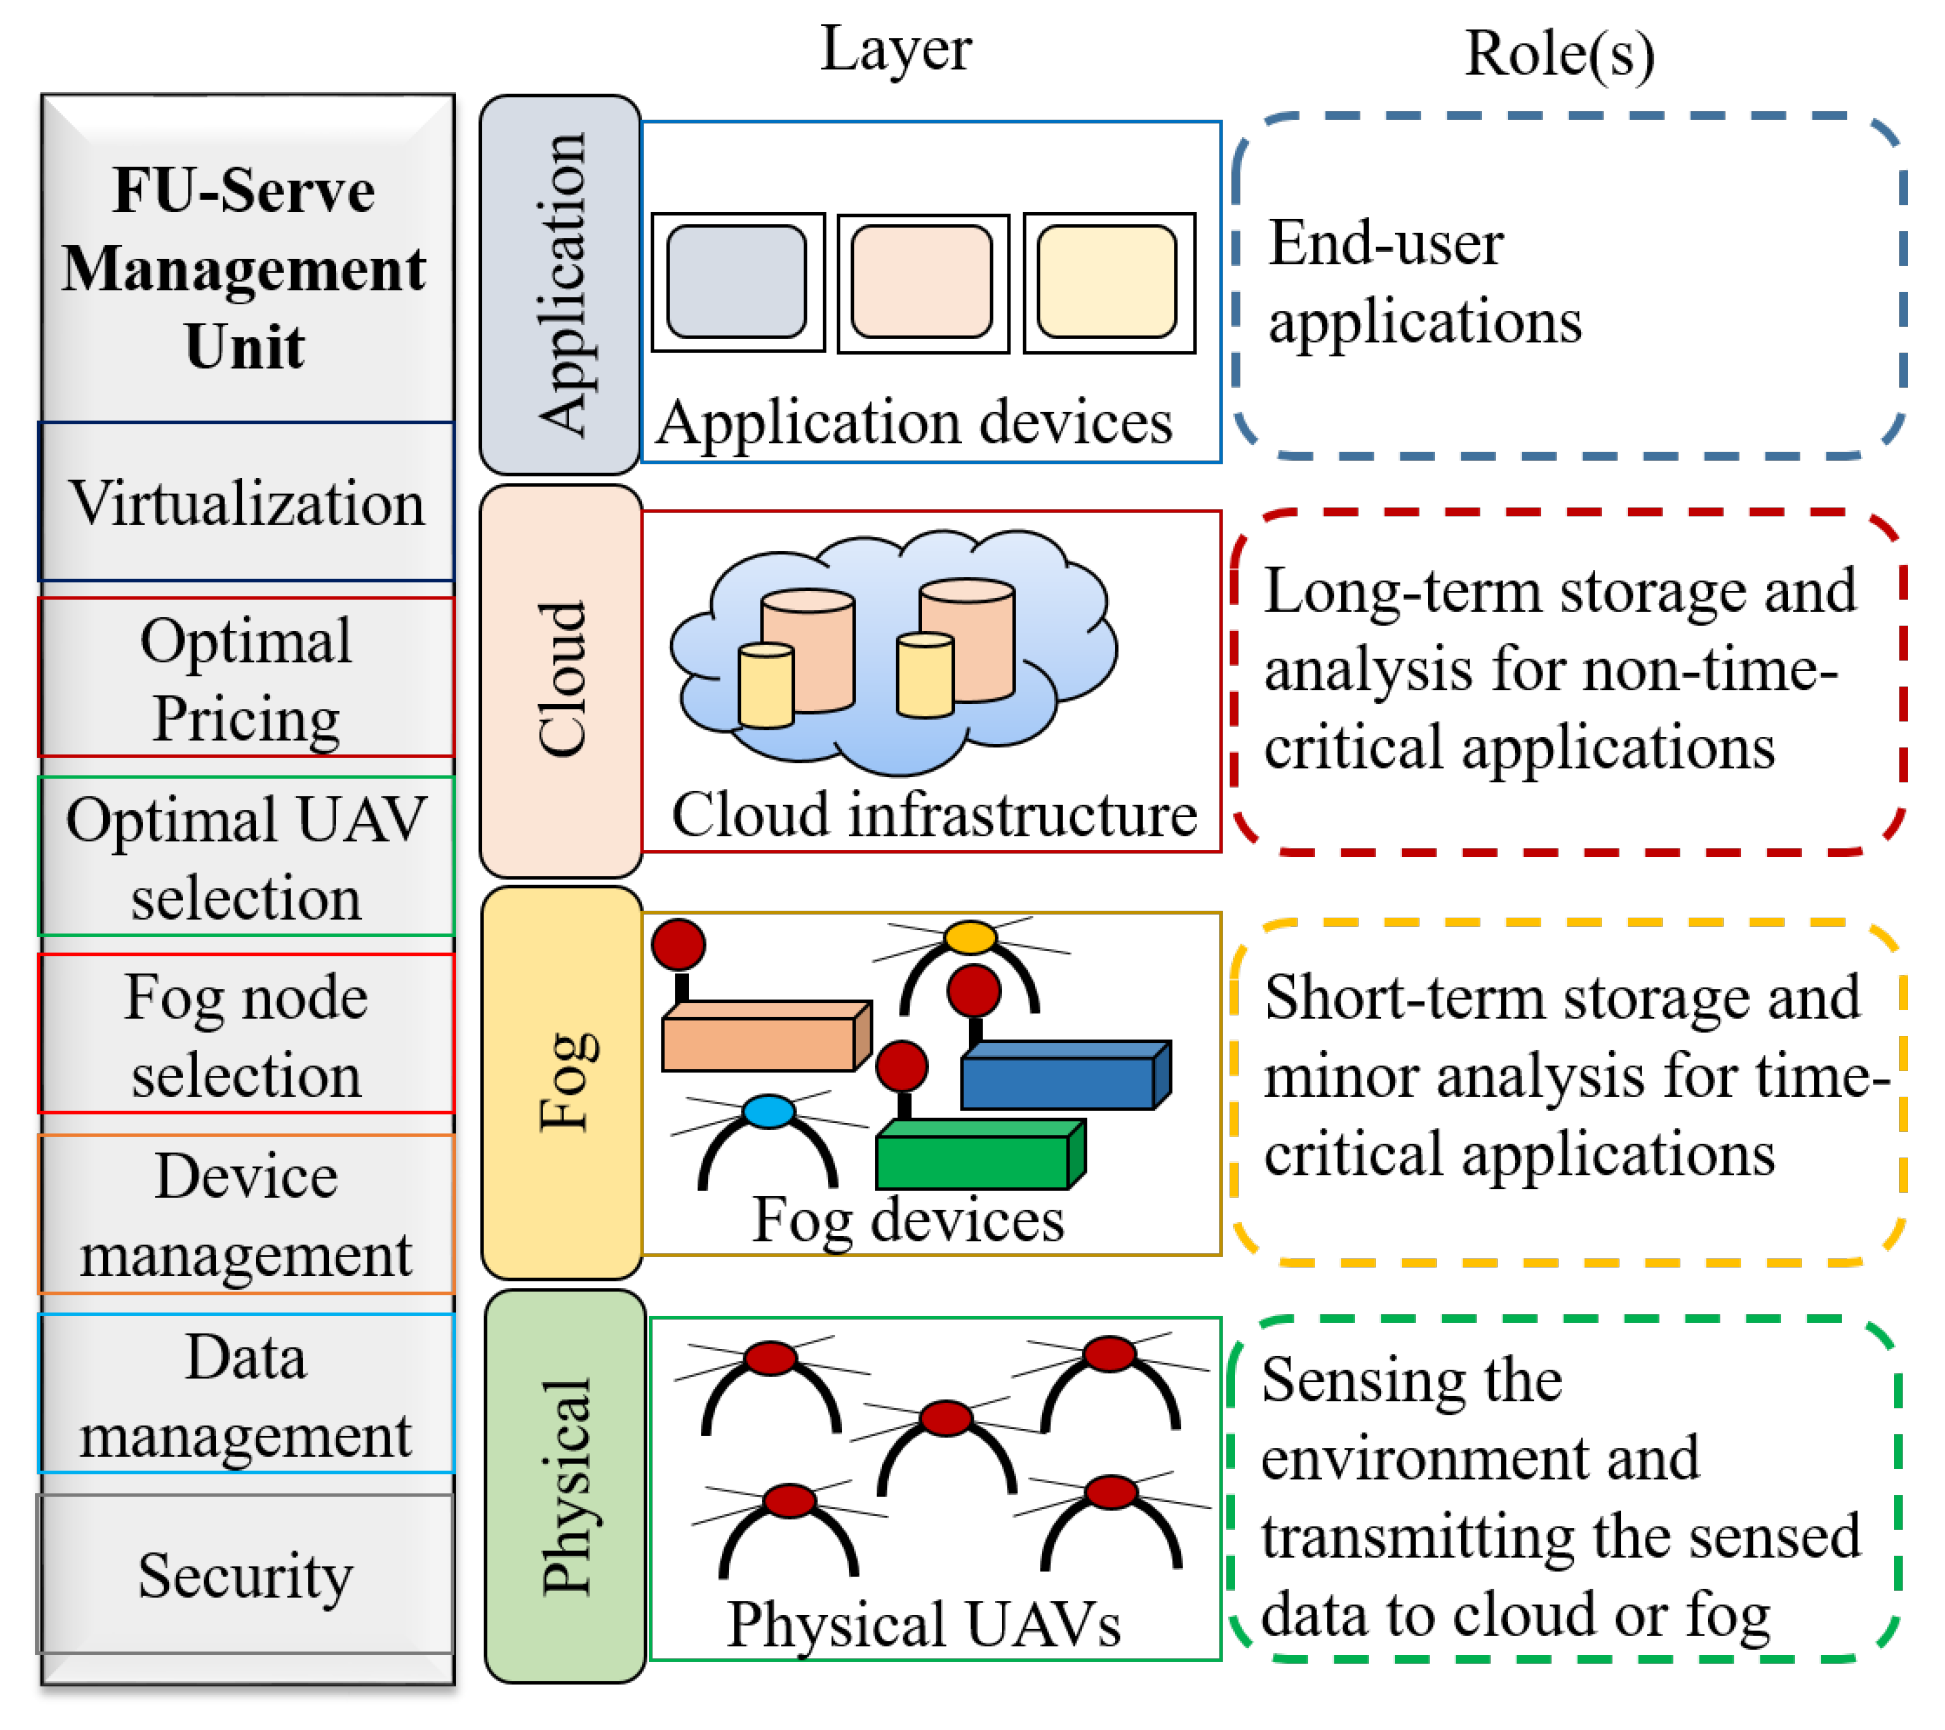
Figure 1.
FU-Serve: The architecture.
A. Motivation
In the existing UaaS architecture, multiple UAVs work collaboratively to serve an IoT application. Typically, these UAVs host a set of heterogeneous sensors, which sense the environment and transmit the sensed data to a centralized entity such as the cloud and the server. A UAV consists of a communication unit that, either directly or through multi-hop, transmits the sensor data to the centralized entity for processing. The data transmission between the UAVs and the centralized entity consumes significant time, which is unsuitable for different time-critical IoT applications such as healthcare, transportation, and industry. On the other hand, the existing literature does not reveal a work that addresses service latency issues while provisioning UAV services using a UaaS platform. Thus, there persists an utmost requirement to design a UAV service delivery architecture capable of minimizing the data transmission delay, thereby reducing the overall service delay.
B. Contributions
In this work, we propose a new UAV service delivery architecture – FU-Serve – for IoT applications and discuss the different components that are involved in it. The specific contributions of this work are as follows:
- The traditional UaaS architecture is unsuitable for delivering time-critical IoT applications. Therefore, we designed a novel architecture – FU-Serve, by integrating the concept of fog computing into the traditional UaaS architecture.
- As FU-Serve is new and significantly different from the traditional UaaS, the existing fog node selection schemes may not be useful for selecting a fog node in FU-Serve. Thus, we devise an optimal fog node selection scheme for FU-Serve, which optimally selects a suitable fog node among the available ones. Additionally, we consider the presence of a static fog node in the FU-Serve.
- The FU-Serve architecture consists of different components that enable the smooth execution of the UAV service delivery platform. In this paper, we elaboratively discuss the components of FU-Servce. As the FU-Serve is new, we evaluate the performance FU-Serve through rigorous simulation.
II. Related Work
In this section, we discuss the existing literature related to our proposed work. We divide the literature survey into two parts as follows:
A. UAVs in IoT Applications
Due to the inherent dynamic characteristics such as mobility, dynamic positioning, and scalability of UAVs, they are widely used in different application areas [3] including goods delivery [4], surveillance [5], and smart agriculture [6]. Typically, an end-user procures a UAV to serve a single application. However, due to Capital Expenditure (CAPEX), Operational Expenditure (OPEX), and technical and non-technical operational issues, using UAVs for different applications is difficult for an end-user. To address these issues in the single user-centric approach of UAV, Yapp et al. [7] proposed UAV-as-a-Service architecture, for serving multiple end-user applications, without procuring the UAVs by them. In this work, the authors presented different components of the proposed architecture and analyzed its performance. Along the same direction, Pathak et al. [2] attempted to theoretically model the platform by including the concept of UAV virtualization. In this work, the authors discussed various issues, such as the formation of Virtual UAVs, coverage of virtual UAVs, effective task allocation, and corresponding possible solutions in an environment. In the platform, multiple UAVs work together to provide end-user applications seamlessly. However, due to the resource-constrained nature of UAVs, they may not be capable of operating continuously. Therefore, Roy et al. [8] proposed an Optimal UAV selection scheme to form a virtual UAV dynamically.
B. Fog in UAVs
We already discussed in Section A that UAVs are widely used for different applications. On the other hand, the existing literature reveals the works on fog computing with UAVs for serving various time-critical applications. Yao et al. [9] presented a mechanism for addressing the issues of online task allocation and flying control in a Fog-aided Internet of Drone/UAV (IoD/U) architecture. In this work, the authors focus on the distribution of tasks among multiple fog nodes while adjusting the speed of the UAVs. Similarly, Munir et. al [10] proposed an architecture, FogSurv, for urban area surveillance. The authors explore the use of fog computing architecture with UAVs to reduce the response time in an emergency in an urban area. The authors claim that, in FogSurv, the latency is reduced by as compared to the traditional cloud architecture. Along with the latency, managing the fog nodes is essential in an IoT platform. Therefore, Khan et al. [11] design a mechanism – B-Drone – for fog node management using blockchain hyper ledger fabric and a metaheuristic-enabled genetic. The authors claimed that the proposed approach schedule, optimize, process, manage, and preserve security in the fog node using the data acquired by a UAV.
Synthesis: In the existing literature, we observe that UAVs are widely used for multiple applications. Considering the CAPEX and OPEX for UAVs utilization, the authors designed the UaaS architecture to serve various IoT applications while increasing the utilization of UAVs. However, in the proposed architecture, the authors missed considering the issue of latency, which is an essential aspect for serving time-critical IoT applications. On the other hand, the existing literature reveals that the use of fog computing with UAVs is useful in addressing the issues of latency for time-critical applications. However, all the existing works concentrate on using fog computing only for a single UAV environment.
III. FU-Serve: The Architecture
In this work, we use the inherent characteristic of fog computing in UaaS architecture for serving multiple applications simultaneously with less service delay. As the proposed architecture is new, we discuss the different components of the architecture elaborately. We present different actor perspectives of FU-Serve and discuss the same in the following three views:
- Front-end view: The proposed architecture of the FU-Serve is based on the traditional UaaS architecture [2]. Therefore, based on the types of requests of the end-users, we divide them into two categories – (i) time-critical application request users and (ii) non-time-critical application request users. However, for both types of end-user, their views are the same. The end-users only view the GUI, register with the systems, avail of the services, and pay the rent. In the process, they are abstracted from the back-end views of the architecture.
-
Back-end view: The back-end architecture of the platform is complex as compared to the front-end. We logically divide the back end of the platform into the following four interconnected layers:
- (i)
- Physical UAVs layer: In this layer, we consider the presence of multiple UAVs owned by the same or different owners. As these UAVs are heterogeneous, they have different processing, storing, and communicating capabilities. Moreover, the initial energy levels of these UAVs differ from one another. A few of the UAVs may have better capabilities than others, which work as the dynamic fog nodes in the platform. On the other hand, UAVs consist of single or multiple sensor nodes in it. Using a communication module, the UAV transfers the sensed data by different sensors, either to cloud or fog, based on time-criticality. In an FU-Serve architecture, there are three different types of UAVs present – (i) UAVs without sensor nodes (F-UAVs), which provide only fog services but no sensing service is available, (ii) UAVs with sensor nodes (H-UAVs), which serves both as a normal UAV with sensing abilities and as a fog device, and (iii) UAVs without the ability of fog computing (N-UAVs).
- (ii)
- Fog layer: The fog layer of the FU-Serve is important, which enables the platform to serve different time-critical applications. We consider the presence of both static and dynamic fog nodes in a FU-Serve platform. Typically, one of the available UAVs in the application region serves as a dynamic fog node. We present an optimal fog node selection scheme in this work. The energy of the selected fog node depletes after a certain amount of operations are performed by it. In such a situation, we apply the dynamic fog node selection mechanism again in the architecture. On the other hand, we incorporate the concept of static fog nodes using the traditional fog computing approach.
- (iii)
- Cloud layer: This layer is similar to the cloud layer of the existing architecture [2]. As the fog nodes may not be capable of executing complex algorithms and storing a huge amount of data for a long time, we consider the presence of cloud computing for the FU-Serve architecture. However, after processing the sensor data, a fog node transfers them to the cloud.
- (iv)
- Application layer: The topmost layer in the back-end of FU-Serve is the application layer. This layer is also very similar to the application layer of the traditional UaaS platform. However, in FU-Serve, the fog layer directly interacts with the application layer, providing the required service to the end users.
- Business view: Unlike the traditional UaaS architecture, FU-Serve has an additional actor as fog owner. All the UAVs may not be suitable for serving as a fog node in FU-Serve. Therefore, the owner of those UAVs, which serve as a fog node considers a fog owner. In FU-Serve, the owner of an H-UAV serves as both a fog owner and a UAV owner, whereas the owner of an F-UAV is only a fog owner. On the other hand, an owner of an N-UAV serves only as a UAV owner. Along with the fog owner, other actors – service providers and end-users participate in FU-Serve and are involved with monetary transactions. Due to the presence of a new actor - fog owner, the business model in FU-Serve differs from the traditional UaaS platform business model.
IV. Selection of Dynamic Fog Node
A. Mathematical model
Let be the set of UAV owners present in an FU-Serve platform. We consider the presence of N number of UAVs in the FU-Serve platform, which is represented as a set . A UAV, denotes the UAV procured by the UAV owner. Each of these UAVs hosts a set of heterogeneous sensors, and based on the availability of the sensors in the UAVs, a virtual UAV is formed. However, these UAVs may belong to either single or multiple UAV owners. Let O number of UAVs participate in forming a virtual UAV, such that . In a UAV, multiple types of sensor nodes are present. represents the presence of the sensor node of type t, in the UAV, owned by the UAV owner. We consider the three states of a UAV as – active, inactive, and inflight – denoted as .
The mapping of a physical UAV to a virtual UAV, depends upon the 5-tuple of an application.
We adopted as presented by Pathak et al. [2] to represent the application. We included one more parameter and represented it as a 5-tuple notation, where is the application ID, is the application type, is the region of interest for the application, is the quality of service required for the application, and is a flag that indicates whether the application requires a smart UAV or not. represents a subset of the set of UAVs that are available and meet the requirements of the application . is a set of the different types of sensors available with UAV owners, and is the subset of sensors present in a UAV that match those specific applications. The sensors which are required at a specific are deployed in the UAVs.
V. Optimal dynamic fog node selection
Multiple UAVs collaboratively work and serve different applications using the FU-Serve architecture. At a particular time instant, a UAV is selected as a dynamic fog node. However, we can not select a random UAV as a fog node. Therefore, we design a dynamic and optimal fog node selection mechanism. In order to select a suitable fog node optimally, we consider a few parameters, such as residual energy, degree of connectedness, and the average distance between two UAVs. The degree of connectedness counts the number of UAVs present within the sensing range of a UAV at the time instant t. Additionally, we introduce two parameters – service index and average load factor – for selecting an optimal fog node.
Definition 1.
Service index () of a UAV, , counts the number of times it served as a fog node in a given time interval.
Definition 2.
The average load factor () of a UAV, , is the number of UAVs that obtained the service from if it served as a fog node in the past instances.
In addition to PCF, we consider another parameter as the Current Condition Factor (CCF) for determining the current condition of a UAV. In order to compute CCF, we use residual energy, degree of connectedness, and the average distance between UAVs.
-
Residual Energy Ratio: The remaining energy after certain operations in a UAV is known as its residual energy. The value of the residual energy of a UAV changes with performing different operations, such as data transmission from various nodes, hovering, flying, and aggregating data. In this work, we compute the residual energy ratio (RER), considering the initial energy of the UAV and the energy consumption.where and are the initial energy and energy consumed by UAV respectively. We compute as: where , , and are the transmission, hovering, and flying energies of the UAV respectively. The energy required to hover the UAV is computed [12] as:andwhere g is the acceleration of gravity, is the air density, is the radius of the rotor, and is the number of rotors of the UAV. denotes the energy required to fly for the UAV computed as:is the energy required by a UAV when it achieves its maximum velocity, . The velocity () of a UAV at the time instant (t).
- Degree of connectedness: It indicates the number of nodes present within the communication range of a UAV with one hop distance. We compute the degree of connectedness () of the UAV as:where R is the sensing range of UAV and is the distance between the and the UAVs.
- The average distance between UAVs: Within the sensing range of a UAV, , multiple neighboring UAVs may present with variable distance. Considering the total distance between the neighboring UAVs and the degree of connectedness of , we compute as , where denotes the individual distance between the and the UAVs, such that:where are the coordinates of the UAVs.
By using the above three parameters, we derive overall value of CCF as follows:
We compute a fitness value () of a dynamic fog node using . Further, we derive the objective function as:
VI. Performance Evaluation
In this section, we highlight the performance of FU-Serve and discuss the results. The details of simulation parameters used are listed in Table 1. We consider the presence of static and dynamic fog nodes in our work. We divide the simulation area into grids, and a static fog node is present at its center in each grid. For simulation, we consider four . In the case of a dynamic fog node, a UAV is elected from the entire simulation area as mentioned in Section V. The sensing range of each UAV is considered as 30m with an initial energy of J. The location of the UAVs changes randomly within the simulation area. As some of the applications served by the FU-Serve are time-critical, we consider the presence of a partial amount of data generated from the applications to be critical. For our simulation, we consider and of data critical.
We consider the presence of static fog nodes in FU-Serve and compare them with traditional architecture in terms of transmission time. Figure 2 presents the existence of and of critical data. In both cases, we observe that the transmission time is elevating with an increasing number of UAVs in the system. Additionally, we notice that the traditional UaaS architecture consumes more transmission time as compared to the FU-Serve. The possible reason for such a trend in the result is that, in the FU-Serve architecture, the fog nodes are present near the UAVs producing data. While in UaaS, all the data produced by the UAVs are transmitted to the cloud only, which consumes more time as compared to the UaaS.
Similar to Figure 2, Figure 3 depicts the performance of FU-Serve in the presence of dynamic fog nodes. In this experiment, the multiple fog UAVs move over different locations in the simulation area. Each of these fog UAVs is responsible for collecting data from its respective cluster as mentioned in Section V. Therefore, in FU-Serve, the UAVs in a cluster transmit the critical data to a selected fog UAV within the cluster. In contrast, in traditional, the only option is to transmit critical and non-critical data to a centralized entity such as a cloud or a server. Consequently, we observe that FU-Serve outperforms in terms of transmission time compared to the traditional UaaS. Figure 3 depicts the variations in transmission time in the presence of dynamic and static fog nodes while considering the critical data and . In both cases, we observe that the transmission time is also increasing with the increasing number of UAVs in the platform. Interestingly, we also notice that when the number of UAVs present in the system is 5, the transmission time is almost equal in both the cases of static and dynamic fog UAVs. Whereas when the number of UAVs increased to 10 and continued to 25, the transmission time in the presence of dynamic fog UAVs is less compared to static fog UAVs. The possible reason for such a trend in the plot is that – a dynamic fog node changes its location after a certain interval and forms a cluster, for which distance is an essential factor. Consequently, the UAVs which want to transmit the critical data obtain a fog UAV in its near vicinity in the cluster. On the other hand, the static fog node located at the center of the grid may be far away from the UAVs in the grid. Therefore, when a UAV wishes to transmit critical data, it takes more transmission time than in the presence of a dynamic fog UAV. Typically, UAVs are resource-constraint in nature. In FU-Serve, multiple UAVs collaboratively perform different operations, and a few serve as fog nodes. During every operation, the UAV consumes a significant amount of energy. Therefore, we consider the residual energy as an essential parameter in performance analysis. Figure 4 shows the variations in average residual energy with the change in the number of UAVs in the network while considering and of critical data in the network. We notice that the residual energy in the case of critical data is less in comparison to of critical data in the network. However, we do not witness any specific increasing or decreasing pattern in the plot. From this plot, we infer that the energy consumption heavily depends on the position and volume of data, not on the number of UAVs present in the system. From Figure 4, we infer that the energy required to process the critical data of is higher than that required for processing the critical data. The reason is that the energy consumption of a UAV depends on the amount of data it is processing. Therefore, for processing of critical data, a UAV consumes more energy as compared to the processing of critical data.
For selecting a UAV as a fog node, the fitness () denoted in Eq. (12) is an important factor. One of the parameters to compute the fitness is the degree of connectedness (DC). Moreover, . Figure 5 witnessed the increasing amount of with the increasing number of UAVs in the networks. In this experiment, we vary the values of DC between and examine the change in . We observe that with the increasing values of the total number of UAVs in the network and DCs, is also increasing.
VII. Conclusion
In this paper, we proposed Fog-enabled UAV-as-a-Service architecture (FU-Serve), which is capable of serving time-critical IoT applications efficiently. We introduced the concept of the fog computing paradigm in FU-Serve, which significantly reduced the transmission time to serve different applications simultaneously. We considered the presence of two types of fog nodes – static and dynamic fog nodes – in the FU-Serve architecture. The FU-Serve architecture is new and different devices – UAVs, fog, and sensors – are present in it. The selection of a particular device is depended on several factors, such as its configuration, application demand, and availability. In such a scenario, optimal device selection is essential in FU-Serve. In the future, we plan to extend this work by proposing an optimal device selection mechanism in FU-Serve. Additionally, we plan to work on the security issues in the FU-Serve as multiple stakeholders are associated with it.
References
- Chen, S.; Xu, H.; Liu, D.; Hu, B.; Wang, H. A Vision of IoT: Applications, Challenges, and Opportunities with China Perspective. IEEE IoTJ. 2014, 1, 349–359. [Google Scholar]
- Pathak, N.; Misra, S.; Mukherjee, A.; Roy, A.; Zomaya, A.Y. UAV Virtualization for Enabling Heterogeneous and Persistent Uav-as-a-Service. IEEE Tras. on Veh. Tech. 2020, 69, 6731–6738. [Google Scholar] [CrossRef]
- Mozaffari, M.; Saad, W.; Bennis, M.; Nam, Y.H.; Debbah, M. A Tutorial on UAVs for Wireless Networks: Applications, challenges, and open problems. IEEE Comm. Sur. & Tut. 2019, 21, 2334–2360. [Google Scholar]
- Chen, K.W.; Xie, M.R.; Chen, Y.M.; Chu, T.T.; Lin, Y.B. DroneTalk: An Internet-of-Things-Based Drone System for Last-Mile Drone Delivery. IEEE Trans. on Int. Trans. Sys. 2022. [Google Scholar] [CrossRef]
- Yun, W.J.; Park, S.; Kim, J.; Shin, M.; Jung, S.; Mohaisen, D.A.; Kim, J.H. Cooperative Multiagent Deep Reinforcement Learning for Reliable Surveillance via Autonomous Multi-UAV Control. IEEE Trans. on Ind. Info. 2022, 18, 7086–7096. [Google Scholar] [CrossRef]
- Mukherjee, A.; Misra, S.; Sukrutha, A.; Raghuwanshi, N.S. Distributed Aerial Processing for IoT-based Edge UAV Swarms in Smart Farming. Comp. Nets. 2020, 167, 107038. [Google Scholar] [CrossRef]
- Yapp, J.; Seker, R.; Babiceanu, R. UAV as a Service: Enabling On-demand Access and On-the-fly Re-tasking of Multi-tenant UAVs using Cloud Services. the 35th IEEE/AIAA Digi. Avios. Sys. Conf. IEEE, 2016, pp. 1–8.
- Roy, A.; Bouvry, P. Opti-U: Optimal UAV Selection for Enabling UAV-as-a-Service. IEEE Int. Conf. on Comm. IEEE, 2022, pp. 1–7.
- Yao, J.; Ansari, N. Online Task Allocation and Flying Control in Fog-Aided Internet of Drones. IEEE Trans. on Veh. Tech. 2020, 69, 5562–5569. [Google Scholar] [CrossRef]
- Munir, A.; Kwon, J.; Lee, J.H.; Kong, J.; Blasch, E.; Aved, A.J.; Muhammad, K. FogSurv: A Fog-Assisted Architecture for Urban Surveillance Using Artificial Intelligence and Data Fusion. IEEE Acc. 2021, 9, 111938–111959. [Google Scholar] [CrossRef]
- Khan, A.A.; Laghari, A.A.; Gadekallu, T.R.; Shaikh, Z.A.; Javed, A.R.; Rashid, M.; Estrela, V.V.; Mikhaylov, A. A Drone-based Data Management and Optimization Using Metaheuristic Algorithms and Blockchain Smart Contracts in a Secure Fog Environment. Comput. Electr. Eng. 2022, 102. [Google Scholar] [CrossRef]
- Ghazzai, H.; Ghorbel, M.B.; Kadri, A.; Hossain, M.J. Energy efficient 3D positioning of micro unmanned aerial vehicles for underlay cognitive radio systems. IEEE International Conference on Communications (ICC). IEEE, 2017. [CrossRef]
- Mitchell, M. An Introduction to Genetic Algorithms MIT Press. Cambridge, Massachusetts. London, England 1996.
Figure 2.
Transmission time with static fog node.
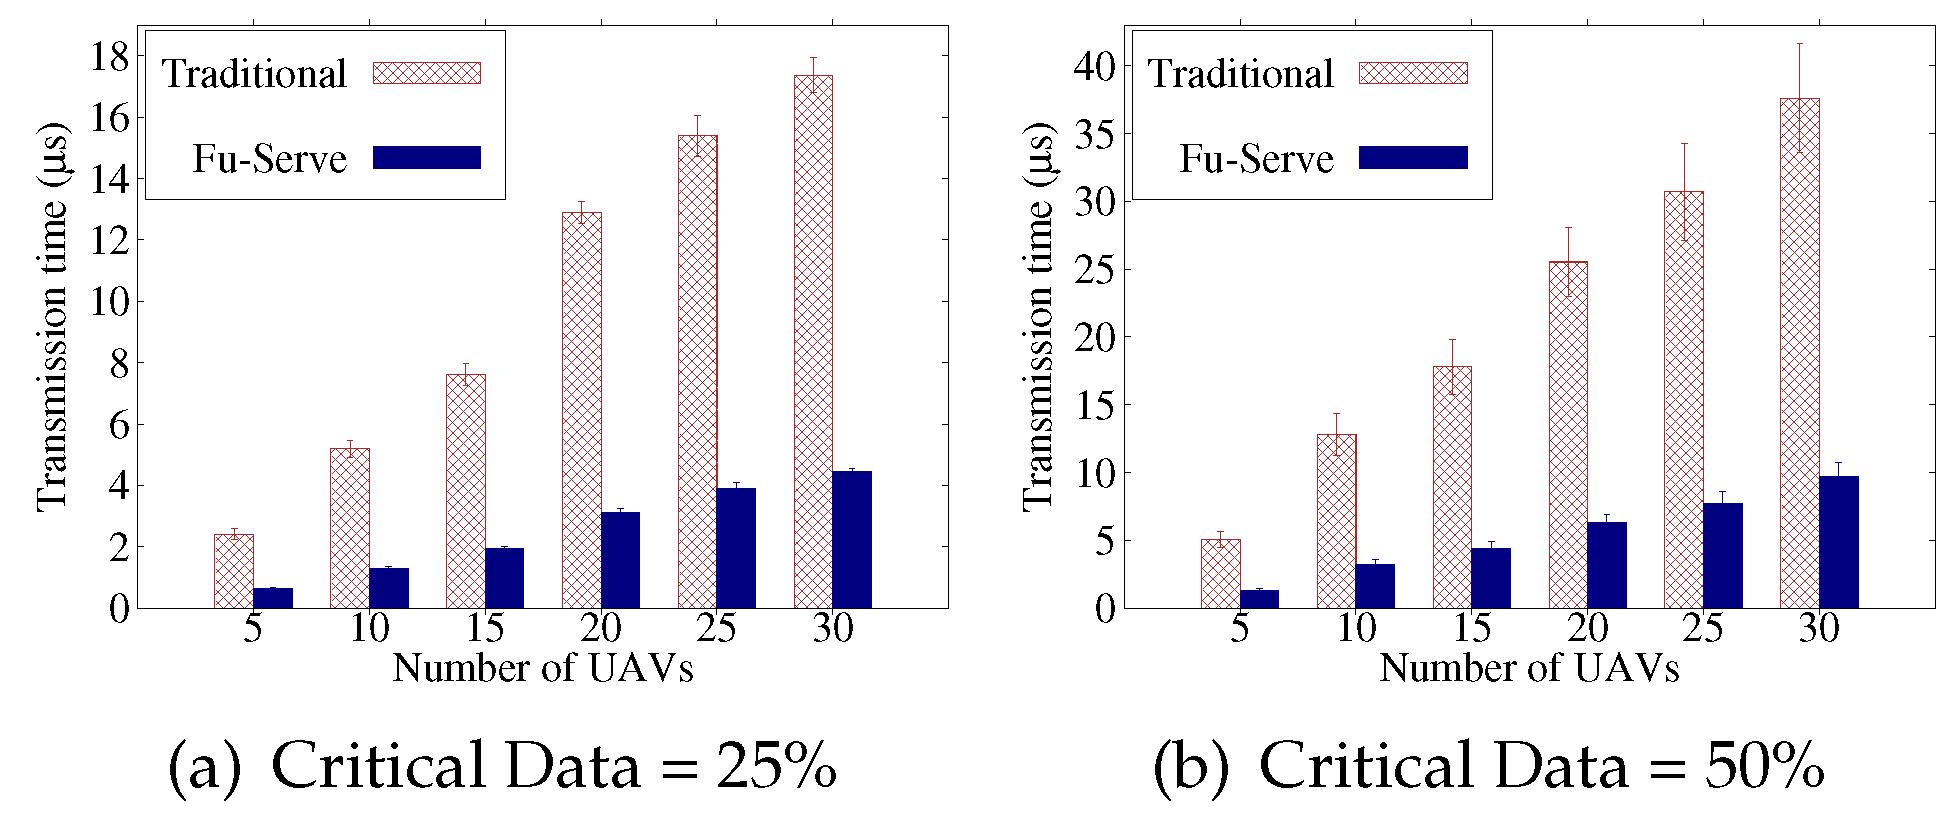
Figure 3.
Transmission time with dynamic fog node.
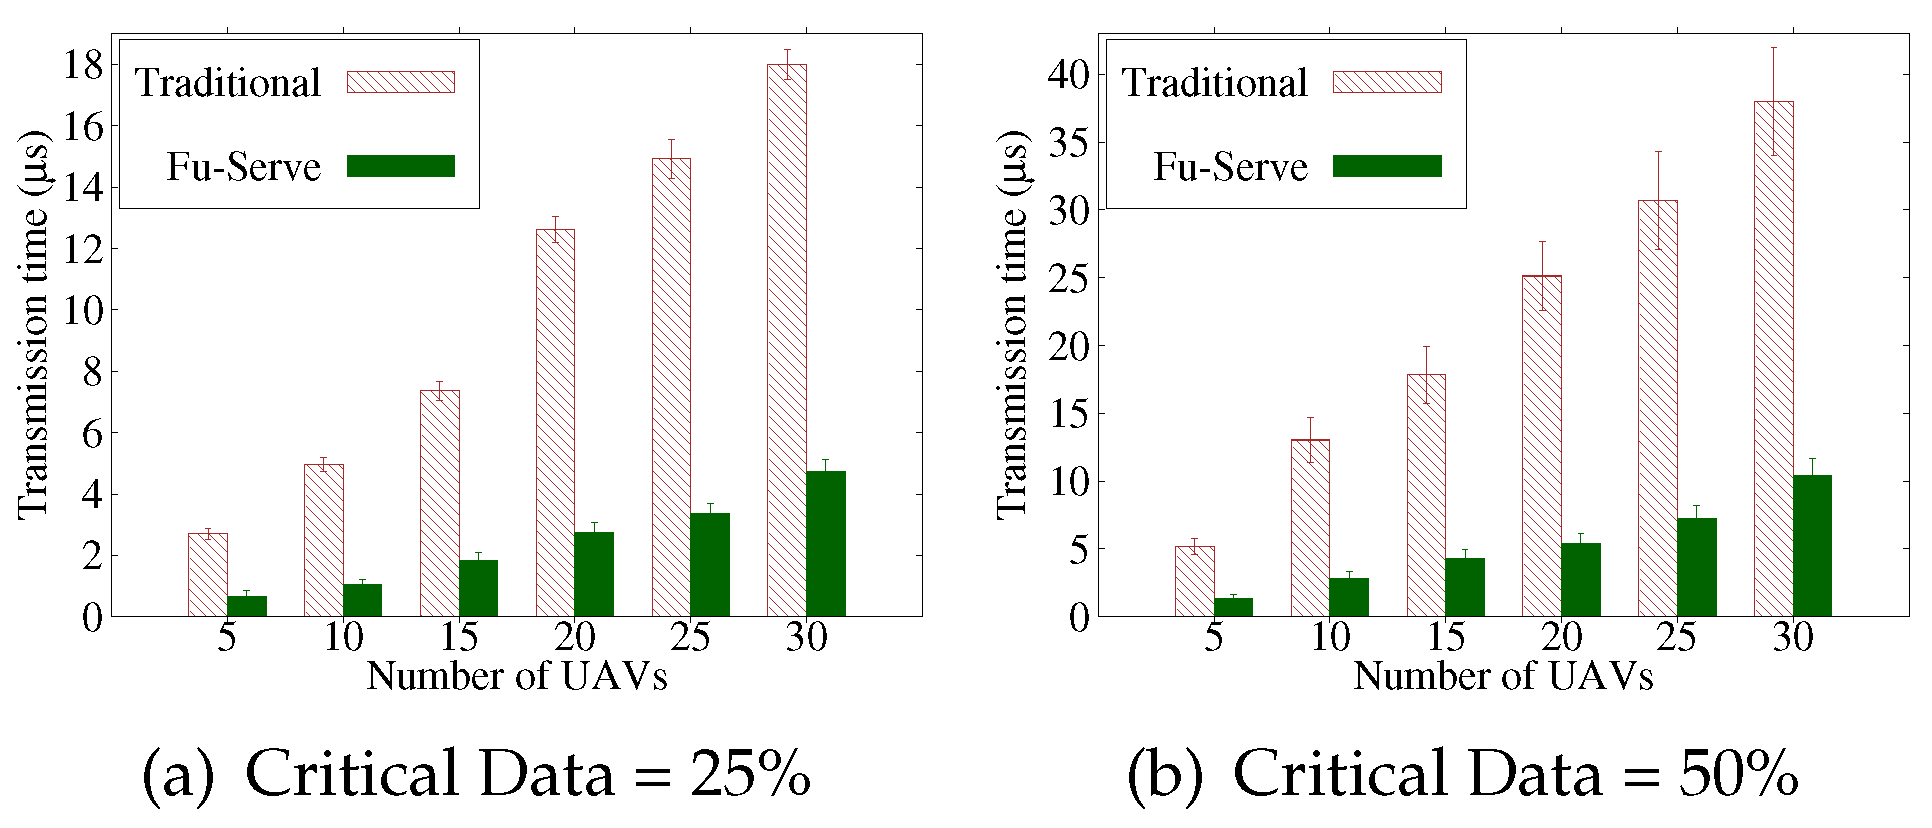
Figure 4.
Residual Energy.
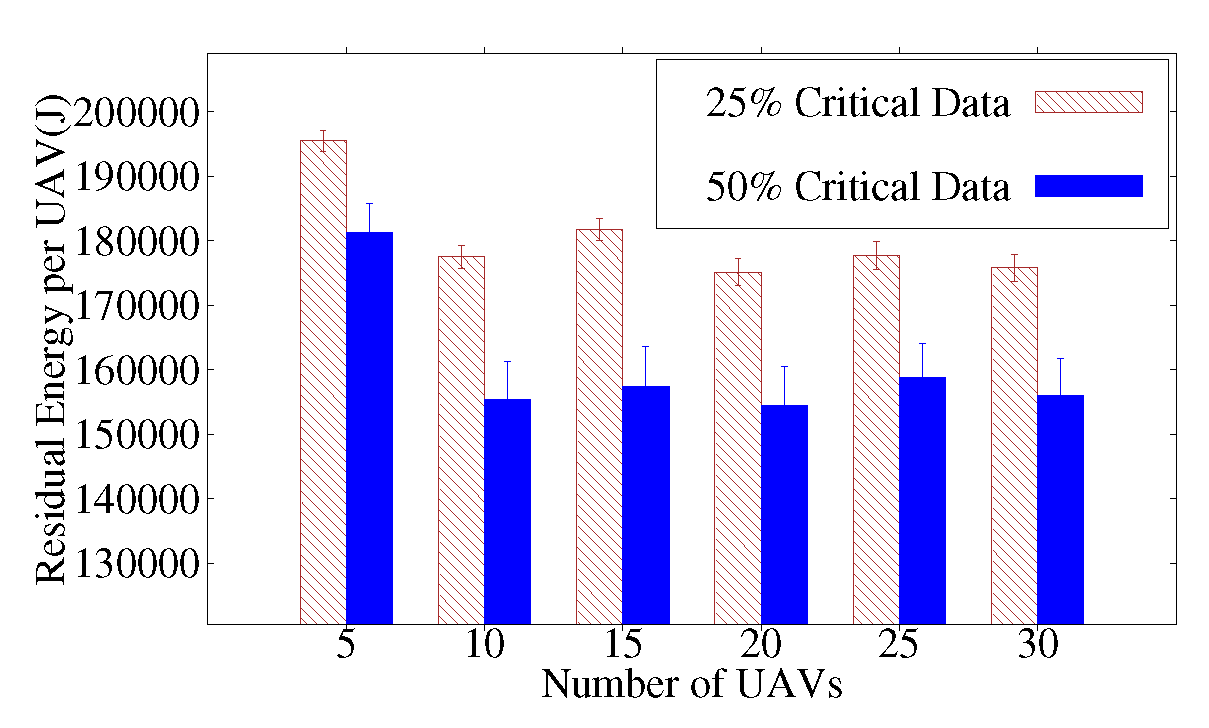
Figure 5.
Fitness value.
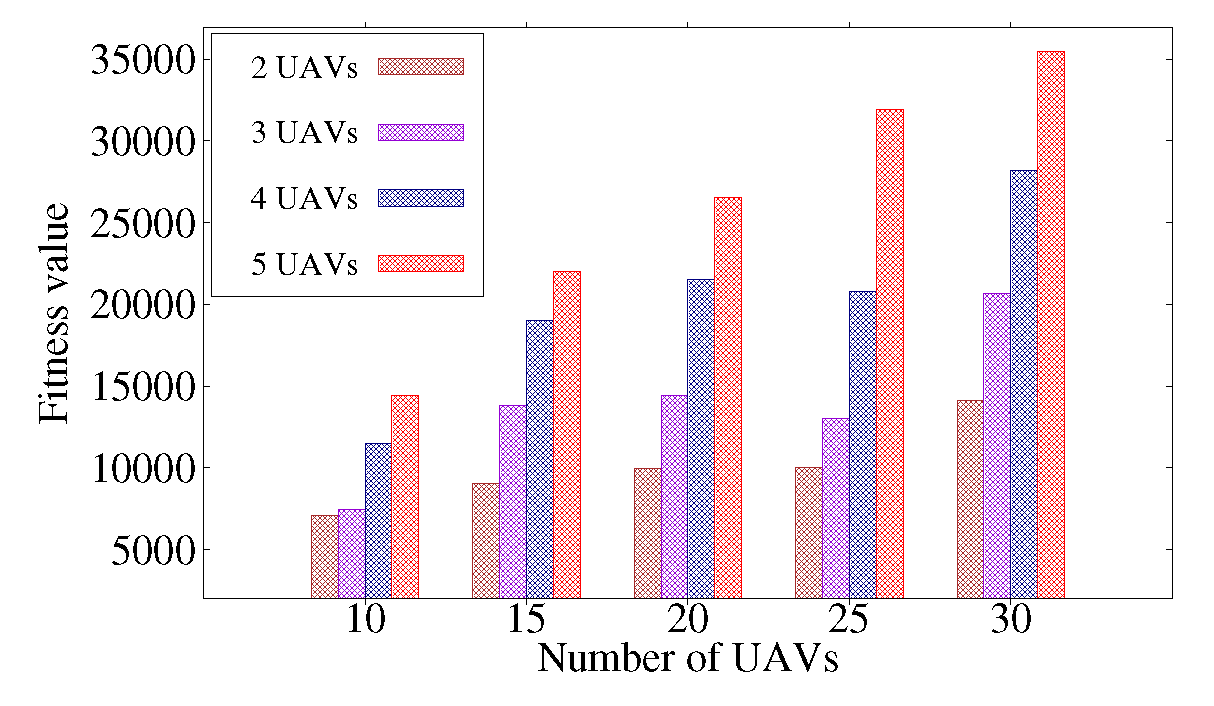

Table 1.
Simulation Parameters.
| Parameter | Value |
|---|---|
| Network Size | |
| Number of UAVs | 5-30 |
| Energy spent by radio electronics | 50nJ/bit |
| Transmitter amplifying free space coefficient | |
| Transmitter amplifying multi-path coefficient | |
| Data Size | 4000 bits |
| Critical Data Percentage | 25% and 50% |
| Propagation Model | Free Space and Multi-path Fading |
Disclaimer/Publisher’s Note: The statements, opinions and data contained in all publications are solely those of the individual author(s) and contributor(s) and not of MDPI and/or the editor(s). MDPI and/or the editor(s) disclaim responsibility for any injury to people or property resulting from any ideas, methods, instructions or products referred to in the content. |
© 2023 by the authors. Licensee MDPI, Basel, Switzerland. This article is an open access article distributed under the terms and conditions of the Creative Commons Attribution (CC BY) license (http://creativecommons.org/licenses/by/4.0/).
Copyright: This open access article is published under a Creative Commons CC BY 4.0 license, which permit the free download, distribution, and reuse, provided that the author and preprint are cited in any reuse.


