1. Introduction
Urban sprawl is threatening the preservation of agricultural land and the security of ecosystems worldwide [
1]. Controlling disorderly urban expansion is crucial to social and ecological sustainability [
2]. Hence, the development of degraded land is becoming the key to realizing sustainable land use [
3]. Since the promulgation of the 1949 Housing Act, the United States carried out a large-scale urban renewal movement to promote the redevelopment of old urban areas [
4]. Similarly, China has paid more attention to urban renewal projects in the recent decade, including making full use of urban degraded land and reconstructing inefficient industrial land [
5]. Such means are expected to tackle the problem of inefficiency in urban land use and to avoid the environmental problems caused by the excessive expansion of urban boundaries. Against this background, the redevelopment of rural industrial parks (RIPs) is becoming an important source of land supply in booming peri-urban areas.
At the early stage of China’s economic reform, RIPs played a crucial role in the rise of the manufacturing industry. This has promoted the transformation of the Pearl River Delta from a coastal and agricultural area to a famous “world factory” [
6]. However, as China pays more attention to the upgrading of industry and people’s demand for a better living environment gradually increases, RIPs with low efficiency and serious pollution are in urgent need of renovation. In the past five years, a number of local governments have successfully carried out large-scale transformations of RIPs and achieved remarkable results. For example, Shunde District of Foshan City, a traditional industrial town where the home appliance giant Midea Group is located, launched the renewal of 231 parks from 2018 to 2022, accounting for 60.5 percent of the total number of parks while 80,000 mu (around 13,200 acres) of inefficient industrial land was vacated [
7]. Meanwhile, not every city has a drastic renovation plan like Foshan. According to a document issued by the municipal government, the city of Dongguan merely planned to complete the demolition of 30,000 mu (around 4900 acres) of rural industrial land during the same period, accounting for only 36.1 percent of that of Shunde District and 9.6 percent of that of Foshan City [
8]. Why is the redevelopment of RIPs in some areas so difficult? How can we decide which park should be retained while the other should be removed? Understanding the decision-making mechanism during the process will be the key to the successful transformation of RIPs in the future.
According to the new institutional economics (NIE) theory, lowering transaction costs is the motive of institutional changes [
9]. Hence identifying “easily demolished industrial parks” has become a priority for local planning authorities. In order to uncover more details of the redevelopment process, this paper selected Nanhai District of Foshan City for further case study. RIPs of Nanhai are typical for three reasons: First of all, it is a district-level area with the largest number of RIPs in the Pearl River Delta. According to the working plan issued by Foshan City, there are 612 RIPs in Nanhai, involving a land area of more than 189 thousand mu, which is equivalent to the area of nearly 20 Zhujiang New Towns, the central business district (CBD) of Guangzhou City. Second, Nanhai has been designated as a pilot area for the provincial urban renewal policy. In July 2019, Nanhai District was approved to build the “Guangdong Provincial Experimental Zone for Urban–Rural Integration”, which is tasked with exploring a new model for the upgrading of urban agglomerations in the Guangdong–Hong Kong–Macao Greater Bay Area. Local officials are encouraged to draft innovative policies to promote urban–rural integration. Last but not least, the redevelopment of Nanhai is rather industry-oriented, which is in line with the Chinese government’s thirst for economic development in the post-epidemic era. Most of the vacated areas can only be used to develop industrial projects instead of profitable commercial or residential projects. In May 2021, Nanhai District even directly revised the plans of three land parcels released from urban renewal projects, changing them from residential land to industrial land, in an attempt to improve the financial sustainability of the city.
Against this background, this paper attempts to classify the existing RIPs of Nanhai by using NIE theories and examines how the local state of China determines the necessity for the demolition of RIPs and what factors should be taken into account. In
Section 2, a literature review is provided to clarify the relationship between urban renewal, transaction costs, and property rights.
Section 3 introduces the study area and how the empirical study is conducted.
Section 4 shows the result of spatial analysis and cluster analysis while the last section concludes this paper.
2. Literature Review
2.1. Urban Renewal, Transaction Costs, and Property Rights
In both China and the West, the ideas of transaction costs and property rights are affirmed to be powerful tools for analyzing urban renewal. It is argued that the initial distribution of property rights is a crucial constraint on the urban renewal process, while allocation is also significantly affected by transaction costs [
10,
11]. When transaction costs are high, it may be more efficient to allocate property rights to a single party rather than to multiple parties [
11]. Some other scholars have deemed that institutions play a key role in shaping economic behavior and outcomes [
9,
12]. Changes in property rights may have a huge impact on economic development because they can incentivize or discourage investment and innovation [
9,
13]. When transaction costs are high, it may be more difficult to reach an agreement on property rights allocation among stakeholders, which may make the implementation of urban renewal projects more challenging [
14]. China’s transaction cost in urban redevelopment consists of negotiation costs attributed to the large number of parties involved and the intensified conflicts of interest between the government and the de facto land owners under state-led land requisition [
15]. As a result, scholars have proposed that diversified government interventions are needed to reduce interest frictions and lower transaction costs, so as to avoid the emergence of a state of market failure and achieve the effective use of resources [
16]. While there is a growing body of research about land development and transaction costs, the adoption of the theory has focused primarily on the implementation process [
15,
17]. In addition, unique cultures and institutions in China, including stakeholder awareness of public projects, state ownership of urban land, and a strong top–down administrative approach are also crucial factors that need to be considered [
18,
19,
20]. In terms of examining the decision-making mechanism at the early stages of the urban renewal process, the most important part is to identify the initial distribution of property rights. In the next subsection, topical reviews on factors affecting the initial distribution of property rights are provided.
2.2. Factors Affecting the Initial Distribution of Property Rights in Urban Renewal
2.2.1. Economic Development Level
The initial distribution of property rights is closely related to the local economic development level. Economists have long argued that urban renewal contributes to the local economy and human habitat through direct investment in the redevelopment of decaying urban areas and through externalities upon project completion [
21,
22]. Areas with high levels of economic development tend to have more urban renewal projects, as they are more likely to attract private investment and generate demand for new development [
23]. However, economic conditions alone are not always sufficient to drive urban renewal; effective governance structures, stakeholder engagement, and community participation are necessary for meaningful urban renewal outcomes as well [
24]. When it comes to redevelopment of RIPs, however, the best-developed industrial parks may be the least eager to transform. This can be explained by the concepts of path dependency and transaction costs. Rural industrial park development involves significant sunk costs, such as infrastructure, buildings, and equipment, which are difficult to reverse or modify [
25]. Industrial parks often involve long-term contracts and agreements between factories and park management, which may further limit the parks’ ability to change [
26]. As a result, the best-developed industrial parks may be locked into their current paths, unable or unwilling to adapt to changing economic or technological conditions. This can lead to a lack of innovation, reduced competitiveness, and a reduced ability to attract new companies and investment. Parks with more flexible contractual arrangements, less rigid physical infrastructure, and a willingness to experiment with new business models may be better able to adapt to changing circumstances and remain competitive. It is therefore important to consider not only the current economic conditions but also the long-term impact of development decisions and investments on the built environment.
2.2.2. Building Quality
Architectural quality, including the condition, design, and historical significance of a building or neighborhood, can also affect its value and redevelopment potential [
27]. In addition, the quality of the built environment is an important consideration for urban renewal because it can affect the quality of life of residents, attract businesses and investment, and contribute to the overall economic vitality of an area [
28]. An urban built environment with better physical conditions of buildings and infrastructure can tackle multiple economic issues and achieve economic sustainability [
29,
30]. Building quality and infrastructure conditions are equally important for achieving long-term economic sustainability. A poorly built environment can reduce the income and consumption levels of local people and lead to business layoffs or closures, which is inconsistent with sustainable economic development. Conversely, better physical conditions of buildings and infrastructure can address these economic issues and achieve significant economic development [
31]. One exceptional case is that buildings with strong historical resonance and community value are less likely to be demolished, even if they are in poor physical condition. Some scholars have argued that site size, location, building condition, and neighborhood context can strongly influence decision-making and lead to significant research costs that are mainly caused by the search for information [
27]. Therefore, building quality is an important factor in the decision-making process of urban renewal projects.
2.2.3. Duration of Tenancy
Duration of tenancy is another factor that should not be neglected, as urban regeneration and the initial allocation of property rights are also highly governed by rules, instruments, and diverse responsible actors such as tenant organizations [
32]. As one of the major groups of participants, tenants are responsible for shaping urban areas and their requirements in urban renewal must be taken into account seriously [
32,
33]. Although some scholars have argued that tenants play an essential role regardless of the duration of their tenancy, fluctuations in demand, and changing household structures, others have discovered that the duration of a lease impacts stakeholder participation and consensus building in the redevelopment process [
33,
34]. Longer lease terms may necessitate more extensive negotiations and consultation with interested parties, thereby increasing transaction costs and the viability of redevelopment projects [
33,
34,
35]. A long-remaining lease term can protect tenants from substantial rent increases caused by large-scale or profitable urban renewal projects [
36]. From the perspective of building owners, they frequently complain about uncooperative long-term tenants while occupants deny sanction for necessary building improvements. For instance, in the heart of east Berlin, the restoration of a residential area was delayed or even prevented due to conflicts of interest between landlords and tenants [
36]. To evict existing tenants, a significant rent increase is effective only when the duration of tenancy is short while other illegal means are also applied on multiple occasions [
36]. Therefore, the duration of tenancy is one of the factors that defines the tenants’ negotiation power and even the transaction costs of urban renewal projects.
2.2.4. Willingness to Renovate
Owners’ or residents’ willingness is one of the key factors in making decisions in urban renewal projects. Major concerns include compensation plans, quality of facilities, and responses to helping potentially displaced people. Some researchers have argued that developing a detailed compensation plan and reaching an agreement for each residential unit requires significant research and coordination/negotiation costs, especially in areas where there may be hundreds of residents with different needs [
37]. It has also been shown that substantial improvement in amenities and the size of housing can greatly increase resident satisfaction with the urban renewal process [
38,
39,
40]. The quality of soft resources such as education, healthcare, shopping, and transportation in older communities also affects residential willingness [
41]. An additional hurdle in China is the ambiguity of property rights. In the US and many European countries, property rights are protected by laws such as the Fifth Amendment to the Constitution (US) or the Basic Law (Germany), which guarantees private property rights and limits the government’s ability to expropriate residents [
42,
43,
44,
45]. In China, however, all land is owned by the state, but the distribution of property rights at the operational level is ambiguous among different land users and local governments [
46]. As a result, current land users have the right to challenge rising redevelopment interests and refuse expropriation or bargaining, which creates a conflict between existing land users and the government–business alliance [
47]. Due to the active role played by nongovernmental land users, demolition and redevelopment in a human-centered and inclusive urban renewal plan are closely linked to the desires and willingness of potentially displaced parties.
2.2.5. Summary
Previous research has shown that transaction costs and property rights are suitable tools for discussing mechanisms in urban renewal. By applying these tools, subsections in this review discuss how economic development level, building quality, duration of tenancy, and willingness to renovate affect the initial distribution of property rights in urban renewal. The first two factors are tangible factors that can be measured using economic performance indicators and building quality assessment data. The other two factors are intangible ones that affect urban renewal imperceptibly, which can only be ascertained through in-depth investigation. Given the lack of data at the micro level, few existing studies have systematically analyzed these two types of factors. Most scholars have only focused on one or a limited number of projects, while there are few empirical studies for large samples of data [
17,
19,
23,
27]. To fill this gap, this paper attempts to provide an analysis based on more than six hundred RIPs to be redeveloped and report the latest urban renewal progress in China.
3. Materials and Methods
3.1. Conceptual Framework of Analysis
The above section thoroughly reviews the relationship between urban renewal and NIE theories such as property rights and transaction costs. Previous studies have confirmed that the success of urban renewal depends on a range of tangible and intangible factors such as economic development, building quality, duration of tenancy, and stakeholders’ willingness to renovate. How do these factors as a whole influence the decision-making process for urban renewal projects? In particular, how do local government authorities determine which existing RIPs should be demolished and which should be preserved? To better answer these questions, the authors of this paper formed an analytical framework, as shown in
Table 1. Fifteen specific factors were distributed in four catalogs. These factors were retrieved from annual statistical reports of local governments and the subsequent onsite investigations. Economic development level is reflected in five factors related to the performance of industrial development. Building quality was determined by the proportion of well-maintained and poorly maintained buildings. Using the year 2020 as the base period, the years 2022 and 2025 were identified as the dividing lines of tenancy duration. Leases expiring before 2022 were considered to have less resistance to redevelopment while those expiring after 2025 were difficult to repudiate. Last but not least, the overall willingness of town-level government to renovate was collected via onsite interviews with local officials. They were also invited to indicate the acreage to be demolished and the acreage to be reserved. Furthermore, some of the industrial buildings built in the early 1990s are unauthorized structures and have been in use for decades. To maintain social stability, local governments in multiple places generally acquiesce in the continuous use of these industrial buildings, as they cannot be rebuilt after demolition.
3.2. Study Area
This paper takes the Nanhai District of Foshan City, which has the longest history of RIP development in the Pearl River Delta region, as a case study. Foshan is located in the center of Guangdong Province and the hinterland of the Pearl River Delta. It is the third largest city of Guangdong after Guangzhou and Shenzhen in terms of economic development. As one of the most active areas in Foshan, Nanhai District has one subdistrict (jiedao) and six towns (zhen) under its jurisdiction, with a total area of 1.072 thousand square kilometers. By the end of 2022, Nanhai District had a population of over 3.65 million people and had generated a GDP of CNY 373.06 billion (USD 50.98 billion), which is even higher than some provinces like Qinghai and Tibet [
48]. The study area of this paper is the 612 RIPs delineated by Foshan City, which are distributed in all the town-level units of Nanhai, with a total area of about 189 thousand mu (about 31.14 thousand acres). Although the boundary of an RIP is not officially demarcated, its delineation is the result of a combination of administrative divisions, tenure, and geographic boundaries. In practice, the demolition or reservation of an RIP, regardless of its size, is considered as a whole, which helps to reduce the transaction costs of project implementation.
RIPs in Nanhai District have been built successively since the 1980s and have attracted a large number of factories since their establishment, forming industrial clusters dominated by low- and medium-end industries such as aluminum profiles, furniture, textiles, and footwear, which contributed great value to local economic development and labor employment in the early years. However, industrial development has also intensified the depletion of natural resources, including land, water, and minerals, leading Nanhai to a classic “tragedy of the commons” dilemma, where traditional collective property rights arrangements have failed to explicitly define the rights and responsibilities for the use of such public goods. Due to the lack of effective planning control, factory buildings are haphazard and poorly licensed. The blurred boundaries of land parcels have also hindered the long-term development of factories. In terms of building quality, most of the buildings were poorly designed and constructed, at the initial stage. After decades of use, these dilapidated and inefficient factory buildings are leading to the substantial dissipation of rental value.
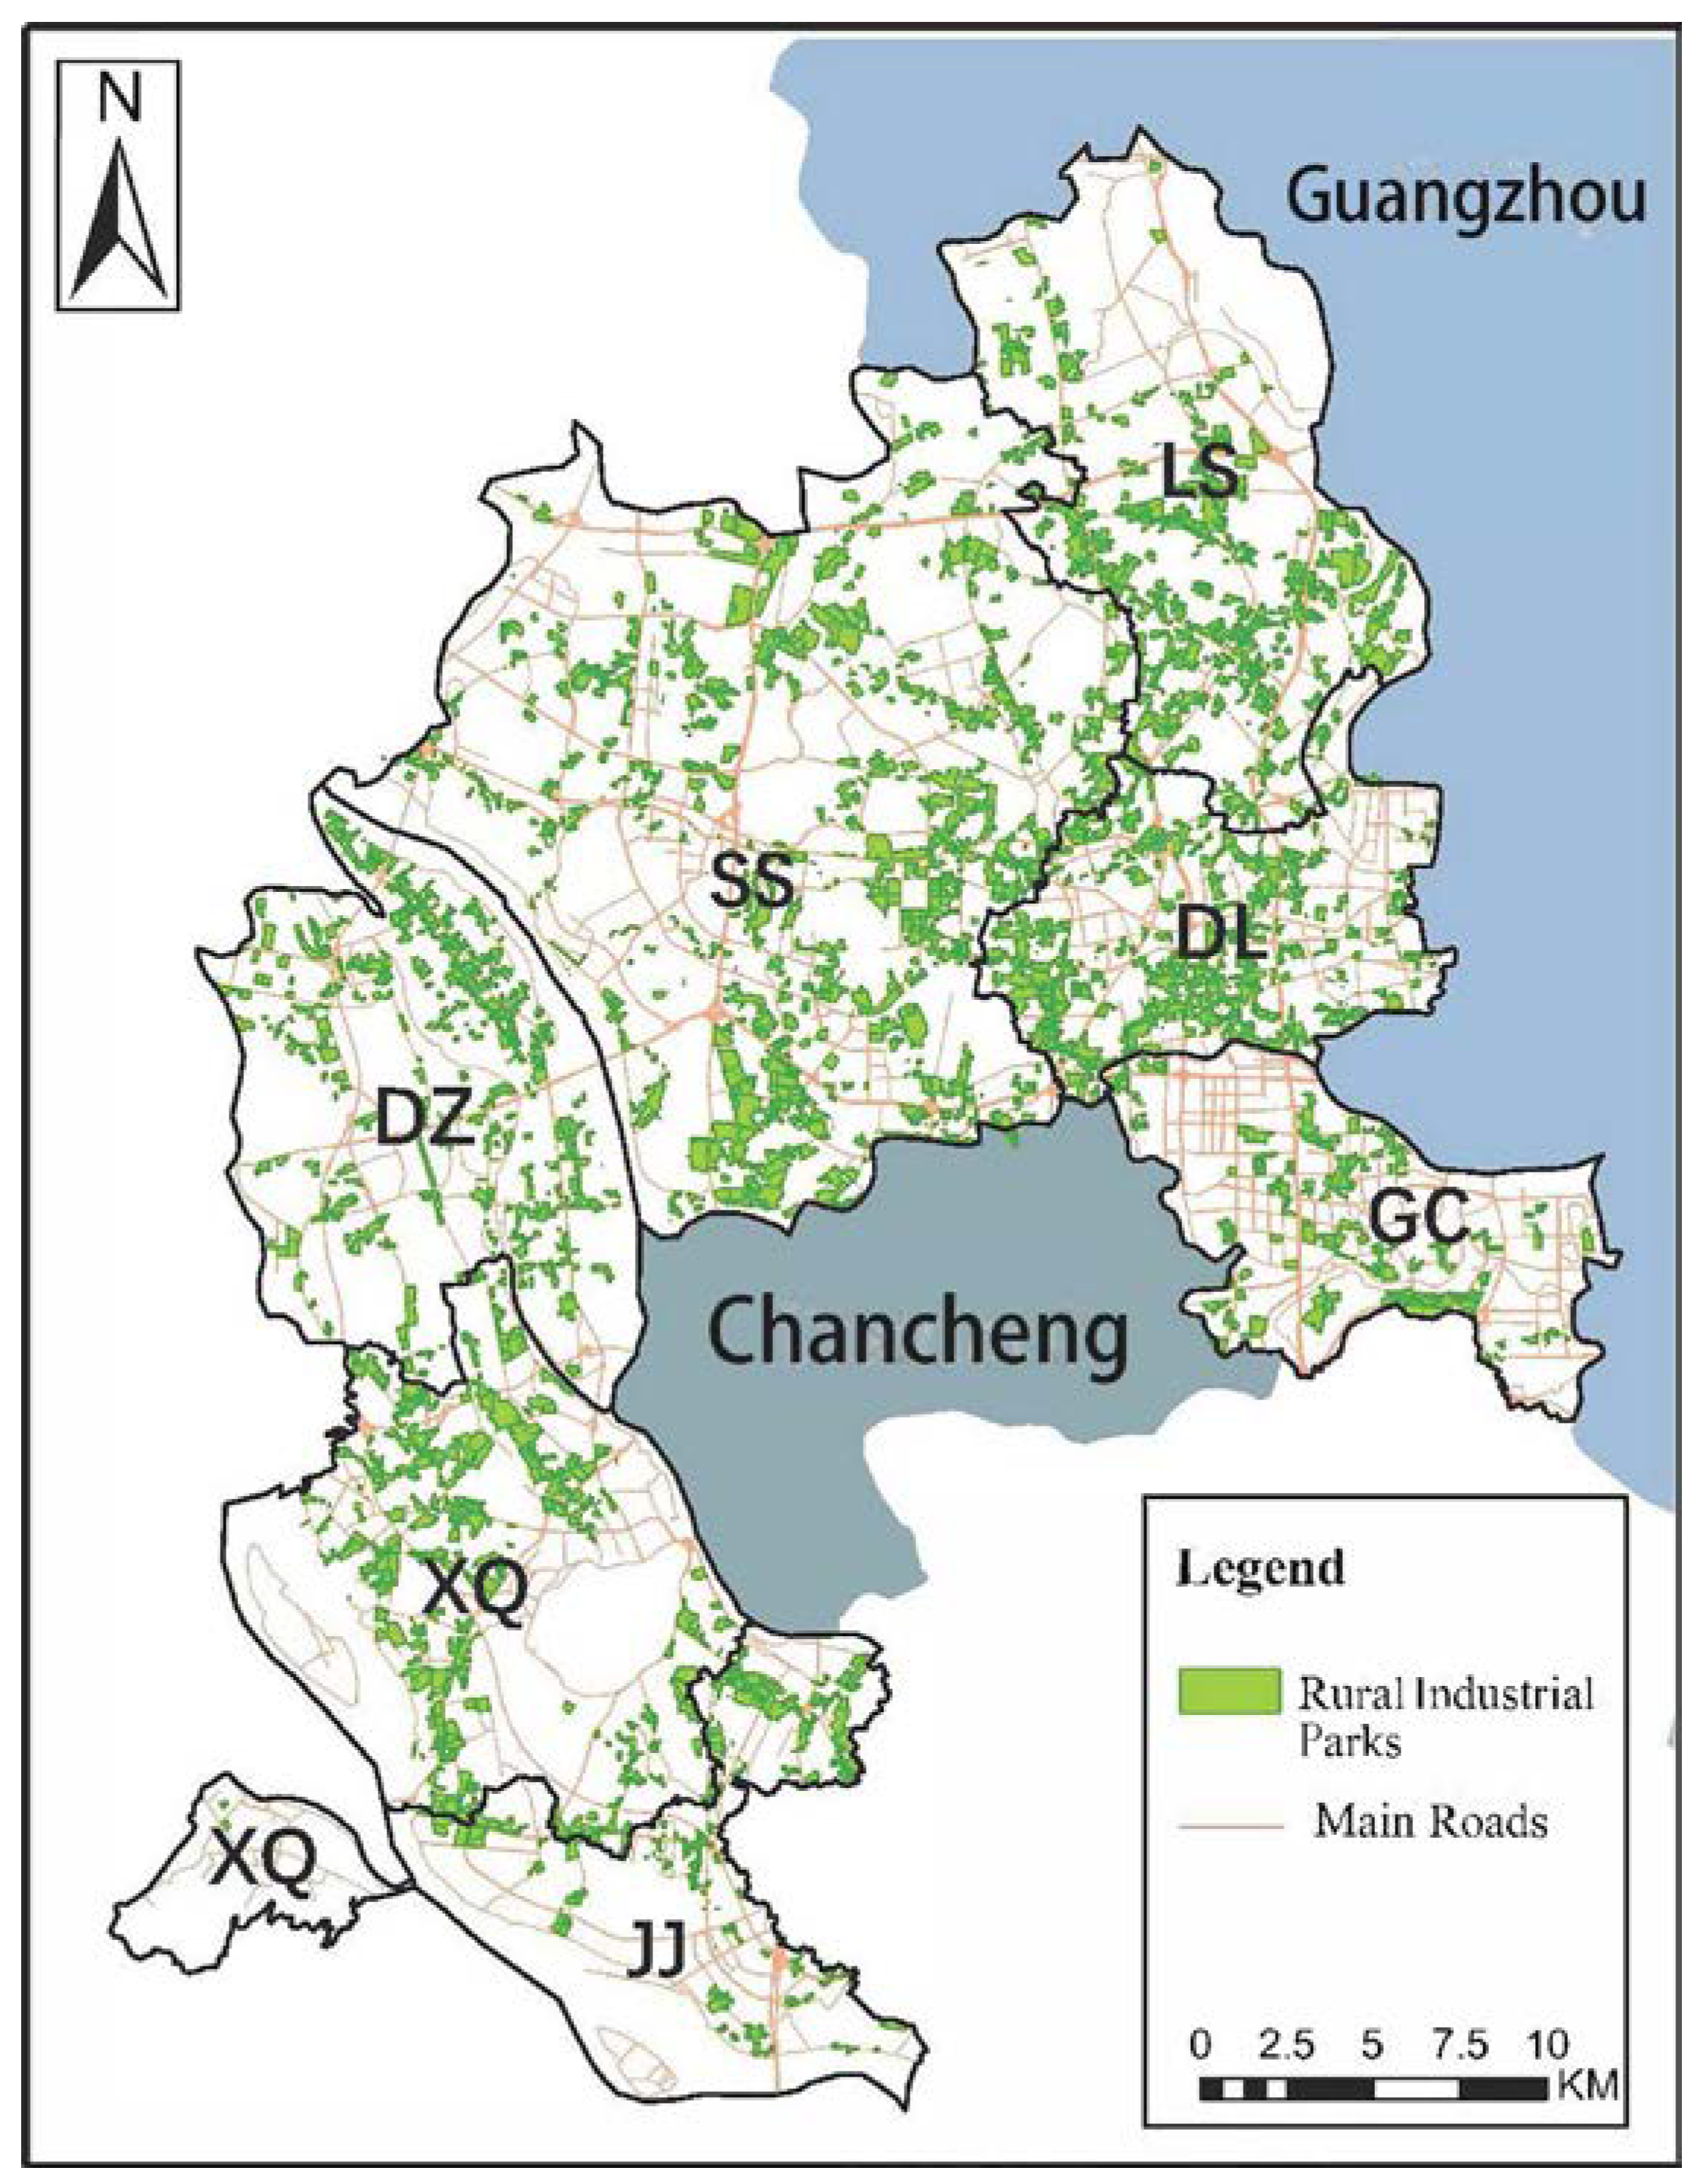
Figure 1 shows the spatial distribution of RIPs in Nanhai District. They are located in all seven town-level units, which are abbreviated as GC, DL, LS, SS, DZ, XQ, and JJ. According to the map, they are either adjacent to the city of Guangzhou or border on Chancheng District, the center of Foshan City. As a place linking Chancheng with Guangzhou, GC Subdistrict is also the administrative center of Nanhai District.
3.3. Data Sources and Methodology
This paper applies a mixed use of spatial, quantitative, and qualitative analytical tools. Based on government-sponsored consultancy work launched in late 2019, the authors of this paper spent more than two years on building a sound local dataset, aiming to comprehensively reflect the development situation of local RIPs. In addition to compiling data and information provided directly by the local government or other public sources, the authors also visited more than 200 stakeholders, including officials from district- and town-level governments, village cadres, active villagers, entrepreneurs, and residents of neighboring urban communities. More than 2700 photographs were taken using drones or via onsite shooting. Spatial data include vector data of the boundaries of 612 RIPs in Nanhai District, aerial photography from Baidu Maps (China’s largest electronic map provider), results of a building quality survey conducted in early 2020, and land use planning documents, which were provided by the local government authorities or accessed through public channels. Nonspatial data mainly refer to socioeconomic data of the RIPs, such as economic performance data reported annually by RIPs to the Nanhai government, tenancy duration of every park, town-level governments’ willingness to renovate, and the proposed acreage for demolition of each RIP.
Table 2 shows a descriptive analysis of fifteen variables collected for further analysis. These variables are organized in accordance with the analytical framework proposed in
Table 1. As the renovation of RIPs has pushed on continuously in recent years, this paper chooses the year 2019 as the study period, while most of the parks have remained intact and only eleven RIPs have been demolished on a trial basis. Therefore, these removed industrial parks did not produce any output during the study period and all the businesses within them have moved out. Furthermore, there is still a significant proportion of industrial parks with good quality buildings and high industrial output. The industrial output of RIPs with the best economic performance in 2019 had exceeded CNY 14 billion (USD 1.9 billion). Thus, determining which RIP to be dismantled is a complex issue that requires careful consideration.
Spatial analysis and cluster analysis were two major tools used to process the acquired data. Using the software ArcMap 10.2, this paper summarizes the spatial distribution pattern of RIPs in the Nanhai District and carries out descriptive spatial analysis by combining the economic and social development cross-sectional data in 2019. To further demonstrate the location conditions of the parks in different areas, the authors also extracted the traffic network data from Baidu Map and calculated the traffic network density. The spatial analysis is mainly presented in the form of kernel density maps. A method of natural breaks classification (Jenks method) was applied, in which similar values are grouped together and differences between classes are maximized.
Cluster analysis, as an exploratory analysis that aims to organize the data based on similarity and measure the similarity between different data sources, was also used to group the RIPs according to their data characteristics. Before beginning the main computational steps, the variables shown in
Table 2 went through collinearity diagnostics and were standardized using the Z-score method. Subsequent clustering was conducted using the K-means method. The analytical tool in ArcGIS uses the Pseudo F Index to calculate the optimal number of clusters and proposes the grouping plan with higher F-statistics. Having imported the variables in
Table 2 into the analytical tool, the optimal number of clusters were set and all industrial parks were successfully categorized. In order to provide an in-depth discussion of the cases, the authors also overlayed the results of the spatial and cluster analyses. Refinement of the characteristics of different types of RIPs also helps better understand how governments make decisions in the urban renewal process.
4. Results
4.1. Spatial Characteristics of RIPs
Descriptive spatial analysis shows that most of the rural industrial parks are concentrated in the eastern part of Nanhai District, which has better transportation and location advantages.
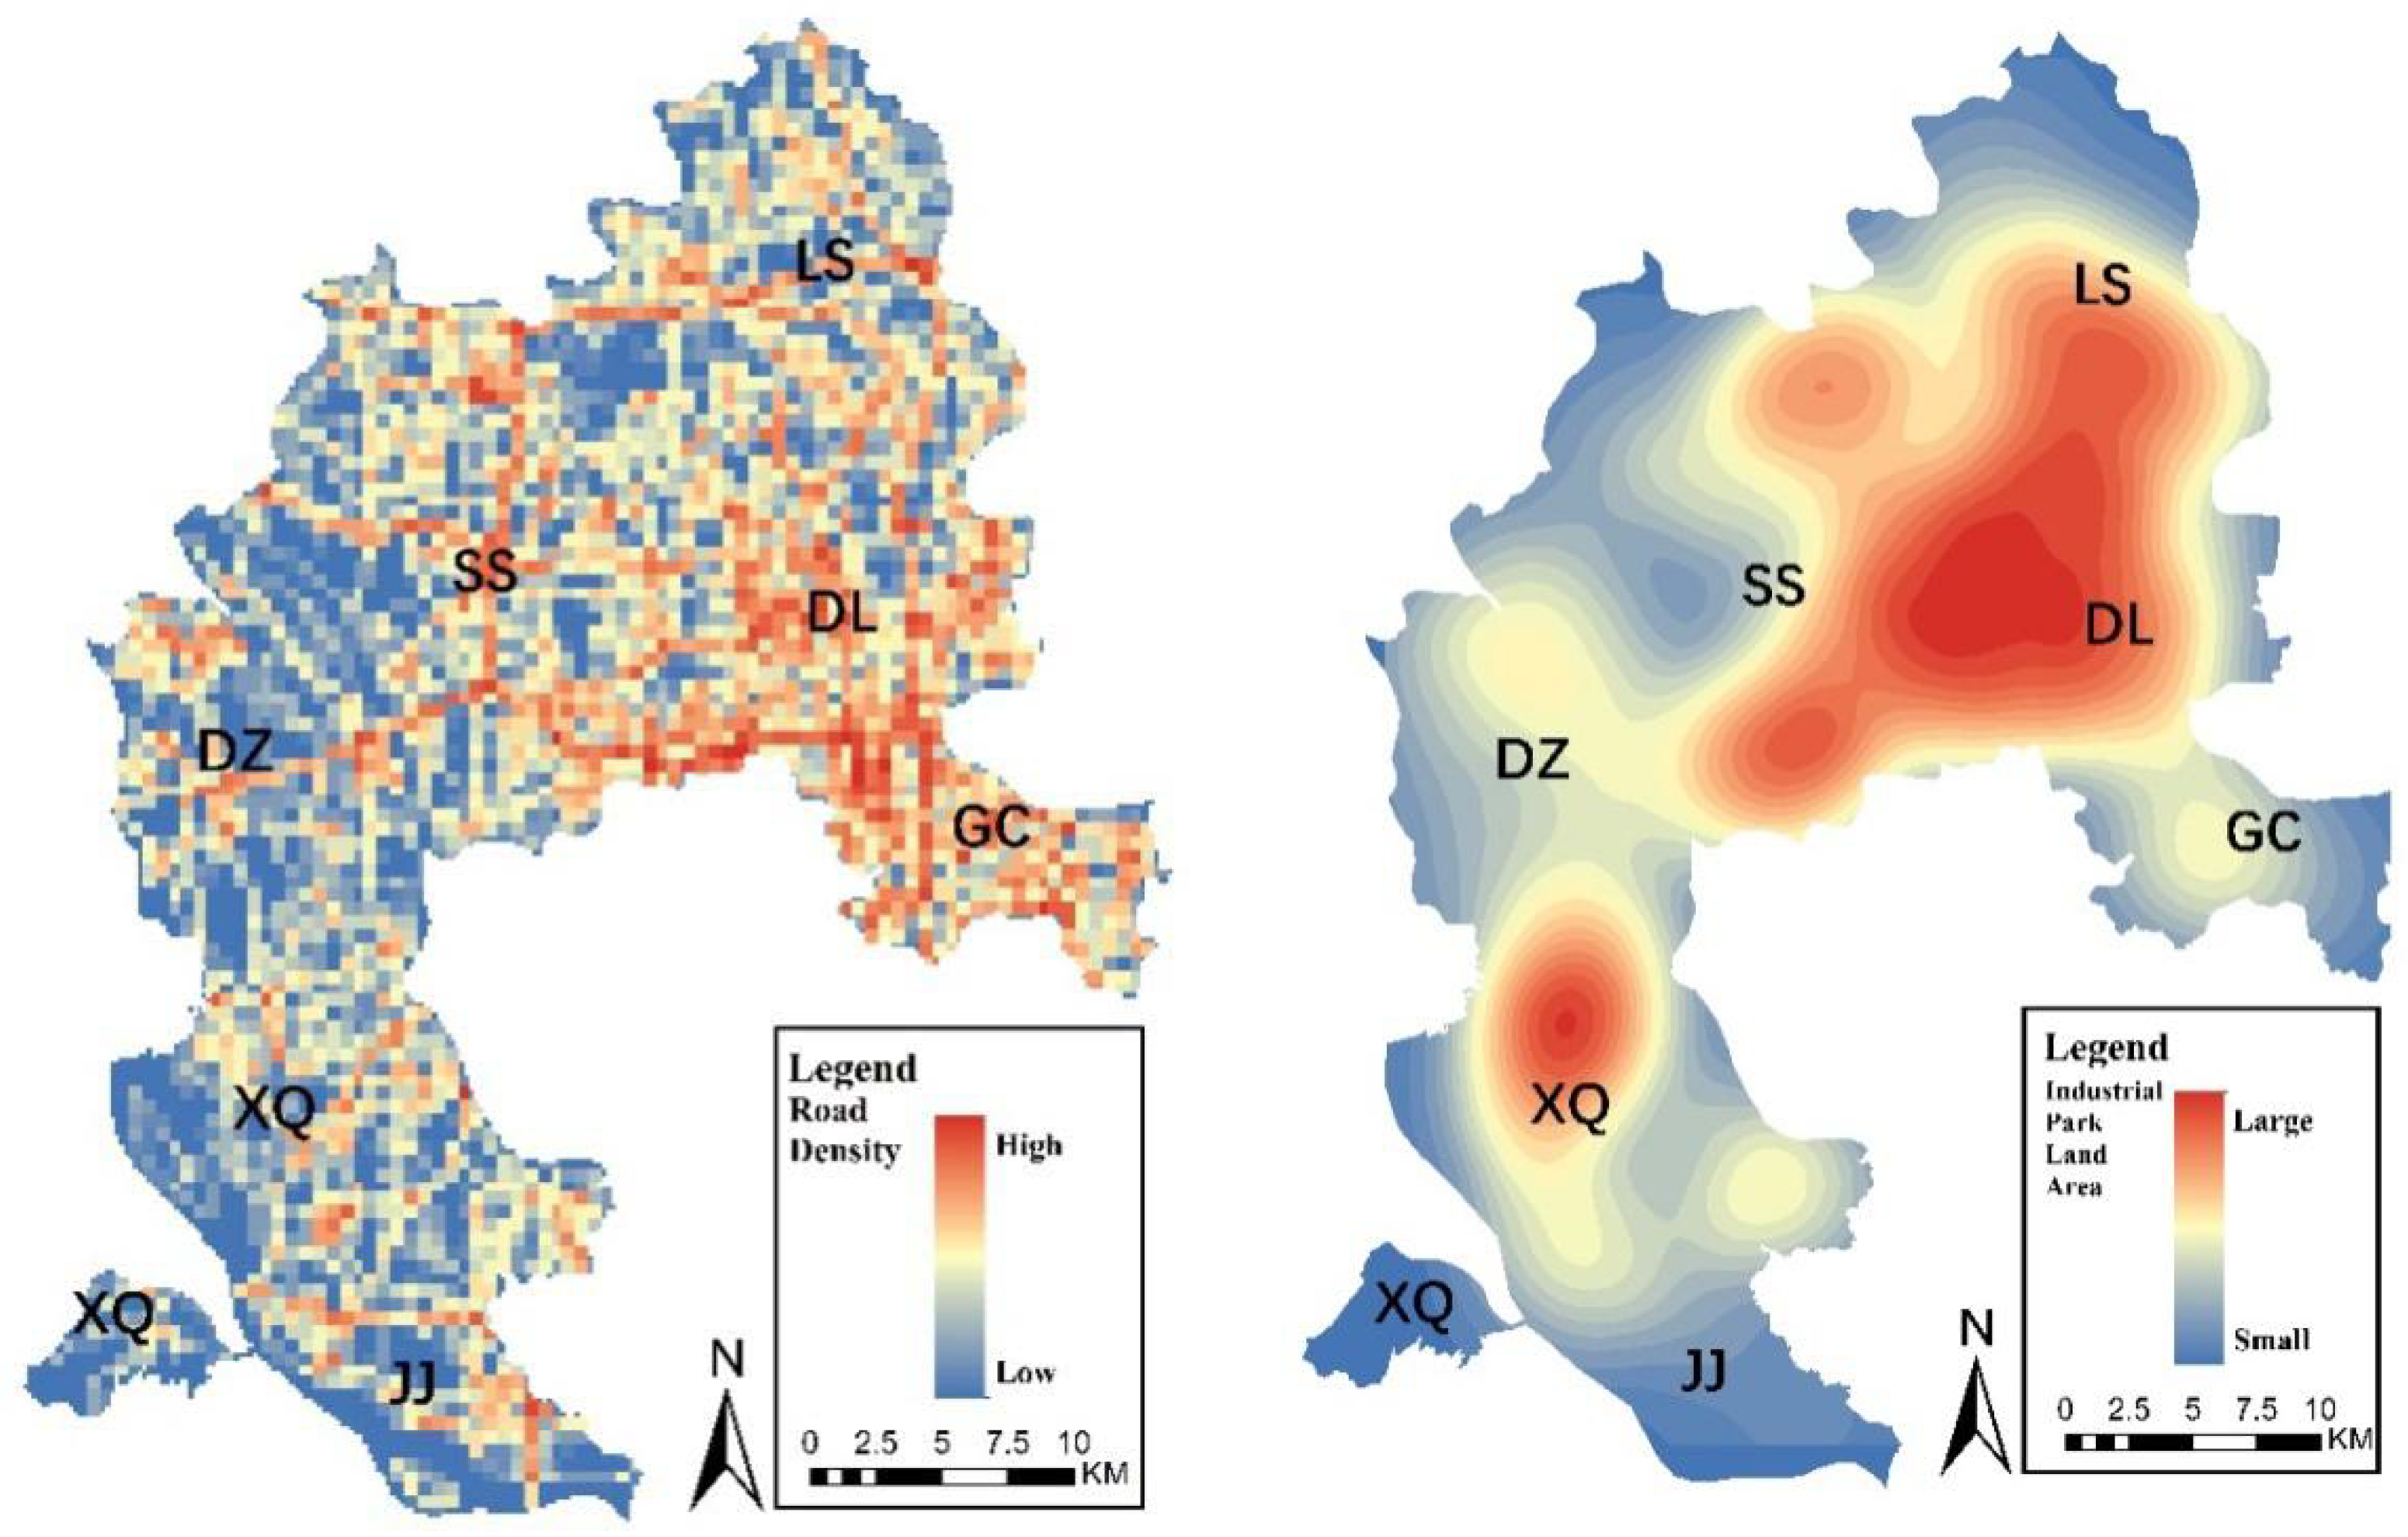
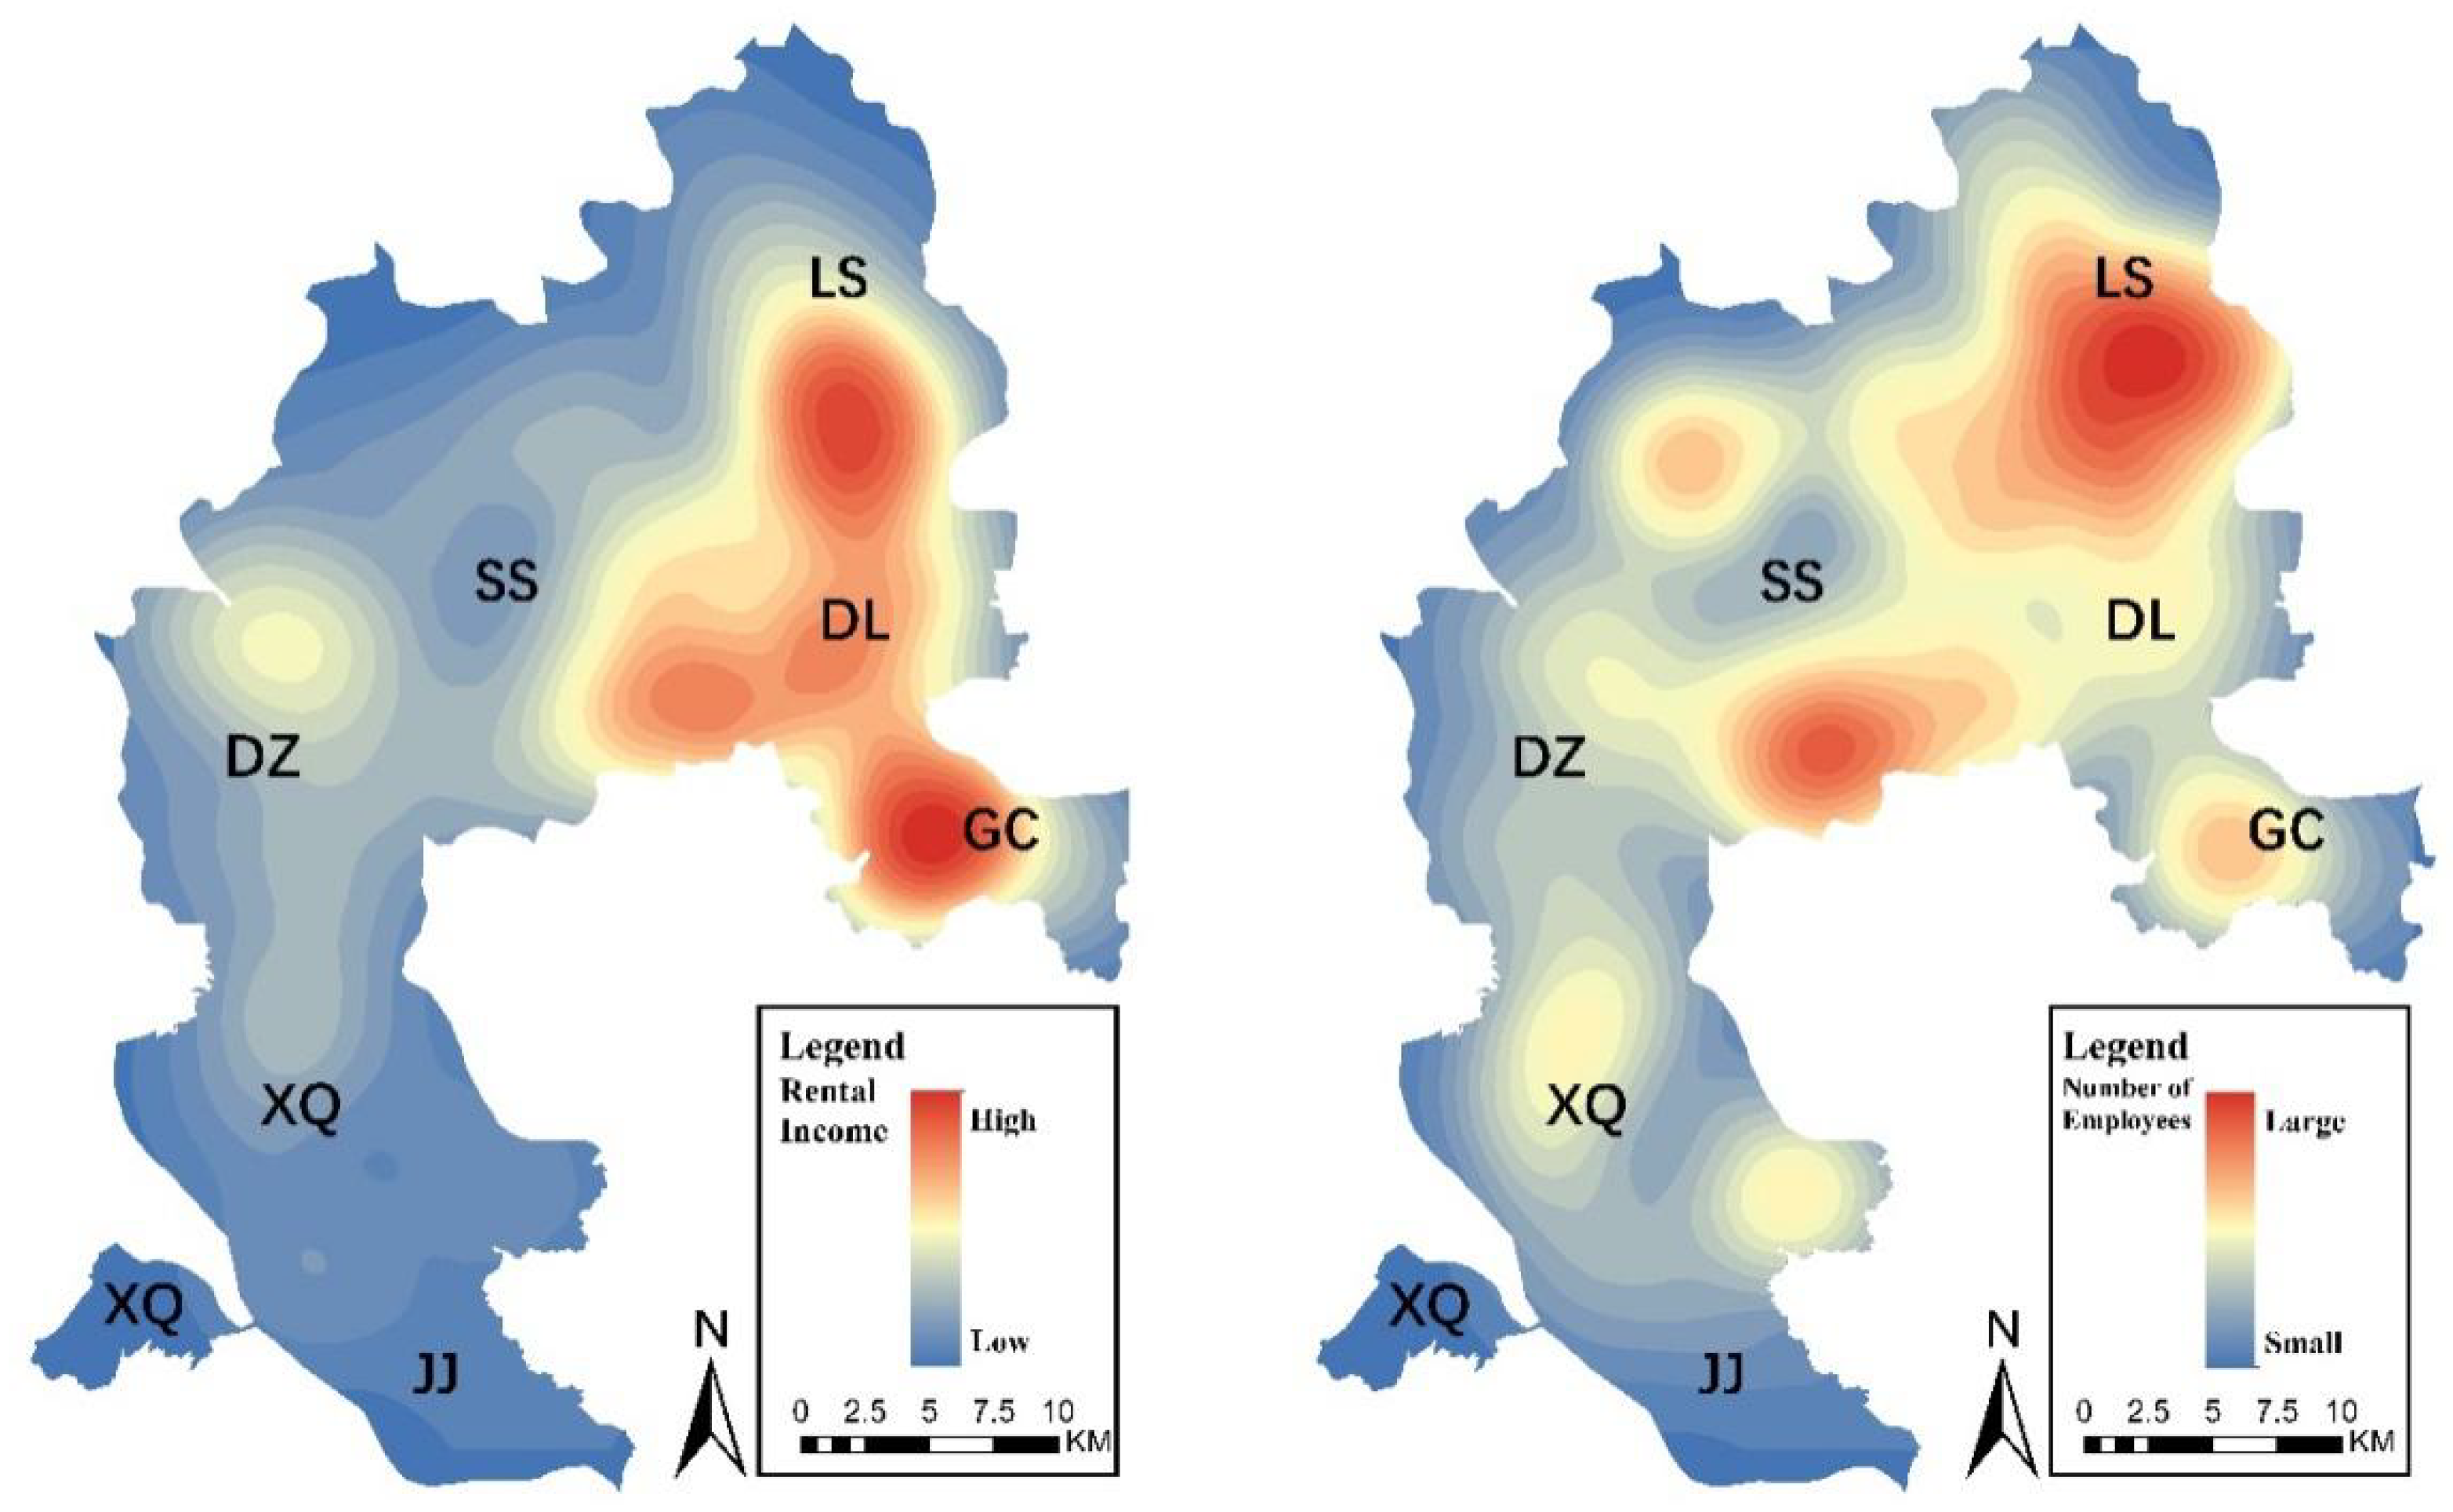
Figure 2 illustrates the spatial distribution and the transportation conditions of the 601 tested RIPs, combining information on road density, land area, rental income, and number of workers employed. The approximate geographic locations of all the seven town-level units are also labeled with codes in the figure. Nanhai District borders the city of Guangzhou in the east and Chancheng District, the seat of the Foshan government, in the center. After years of infrastructure development, the transportation accessibility between Guangzhou City and Nanhai District is already at a reasonably high level. Therefore, the upper left of
Figure 2 shows that GC and DL near Guangzhou have the highest road density, followed by SS in the center and LS in the northeast. Owing to the improved transportation conditions, the upper right part of
Figure 2 shows that the intersection of LS, DL, and SS clusters the largest area of RIPs in the whole district. As a highly urbanized subdistrict, the land area of GC RIPs is relatively small. In terms of rental incomes and number of employees, the lower left and lower right parts of
Figure 2 show that RIPs in the eastern part have higher rental income and employ more workers than other parts. For example, it is demonstrated that LS Town has the highest rental income and provides the largest number of jobs.
However, the better-located RIPs do not bring the highest economic returns. According to
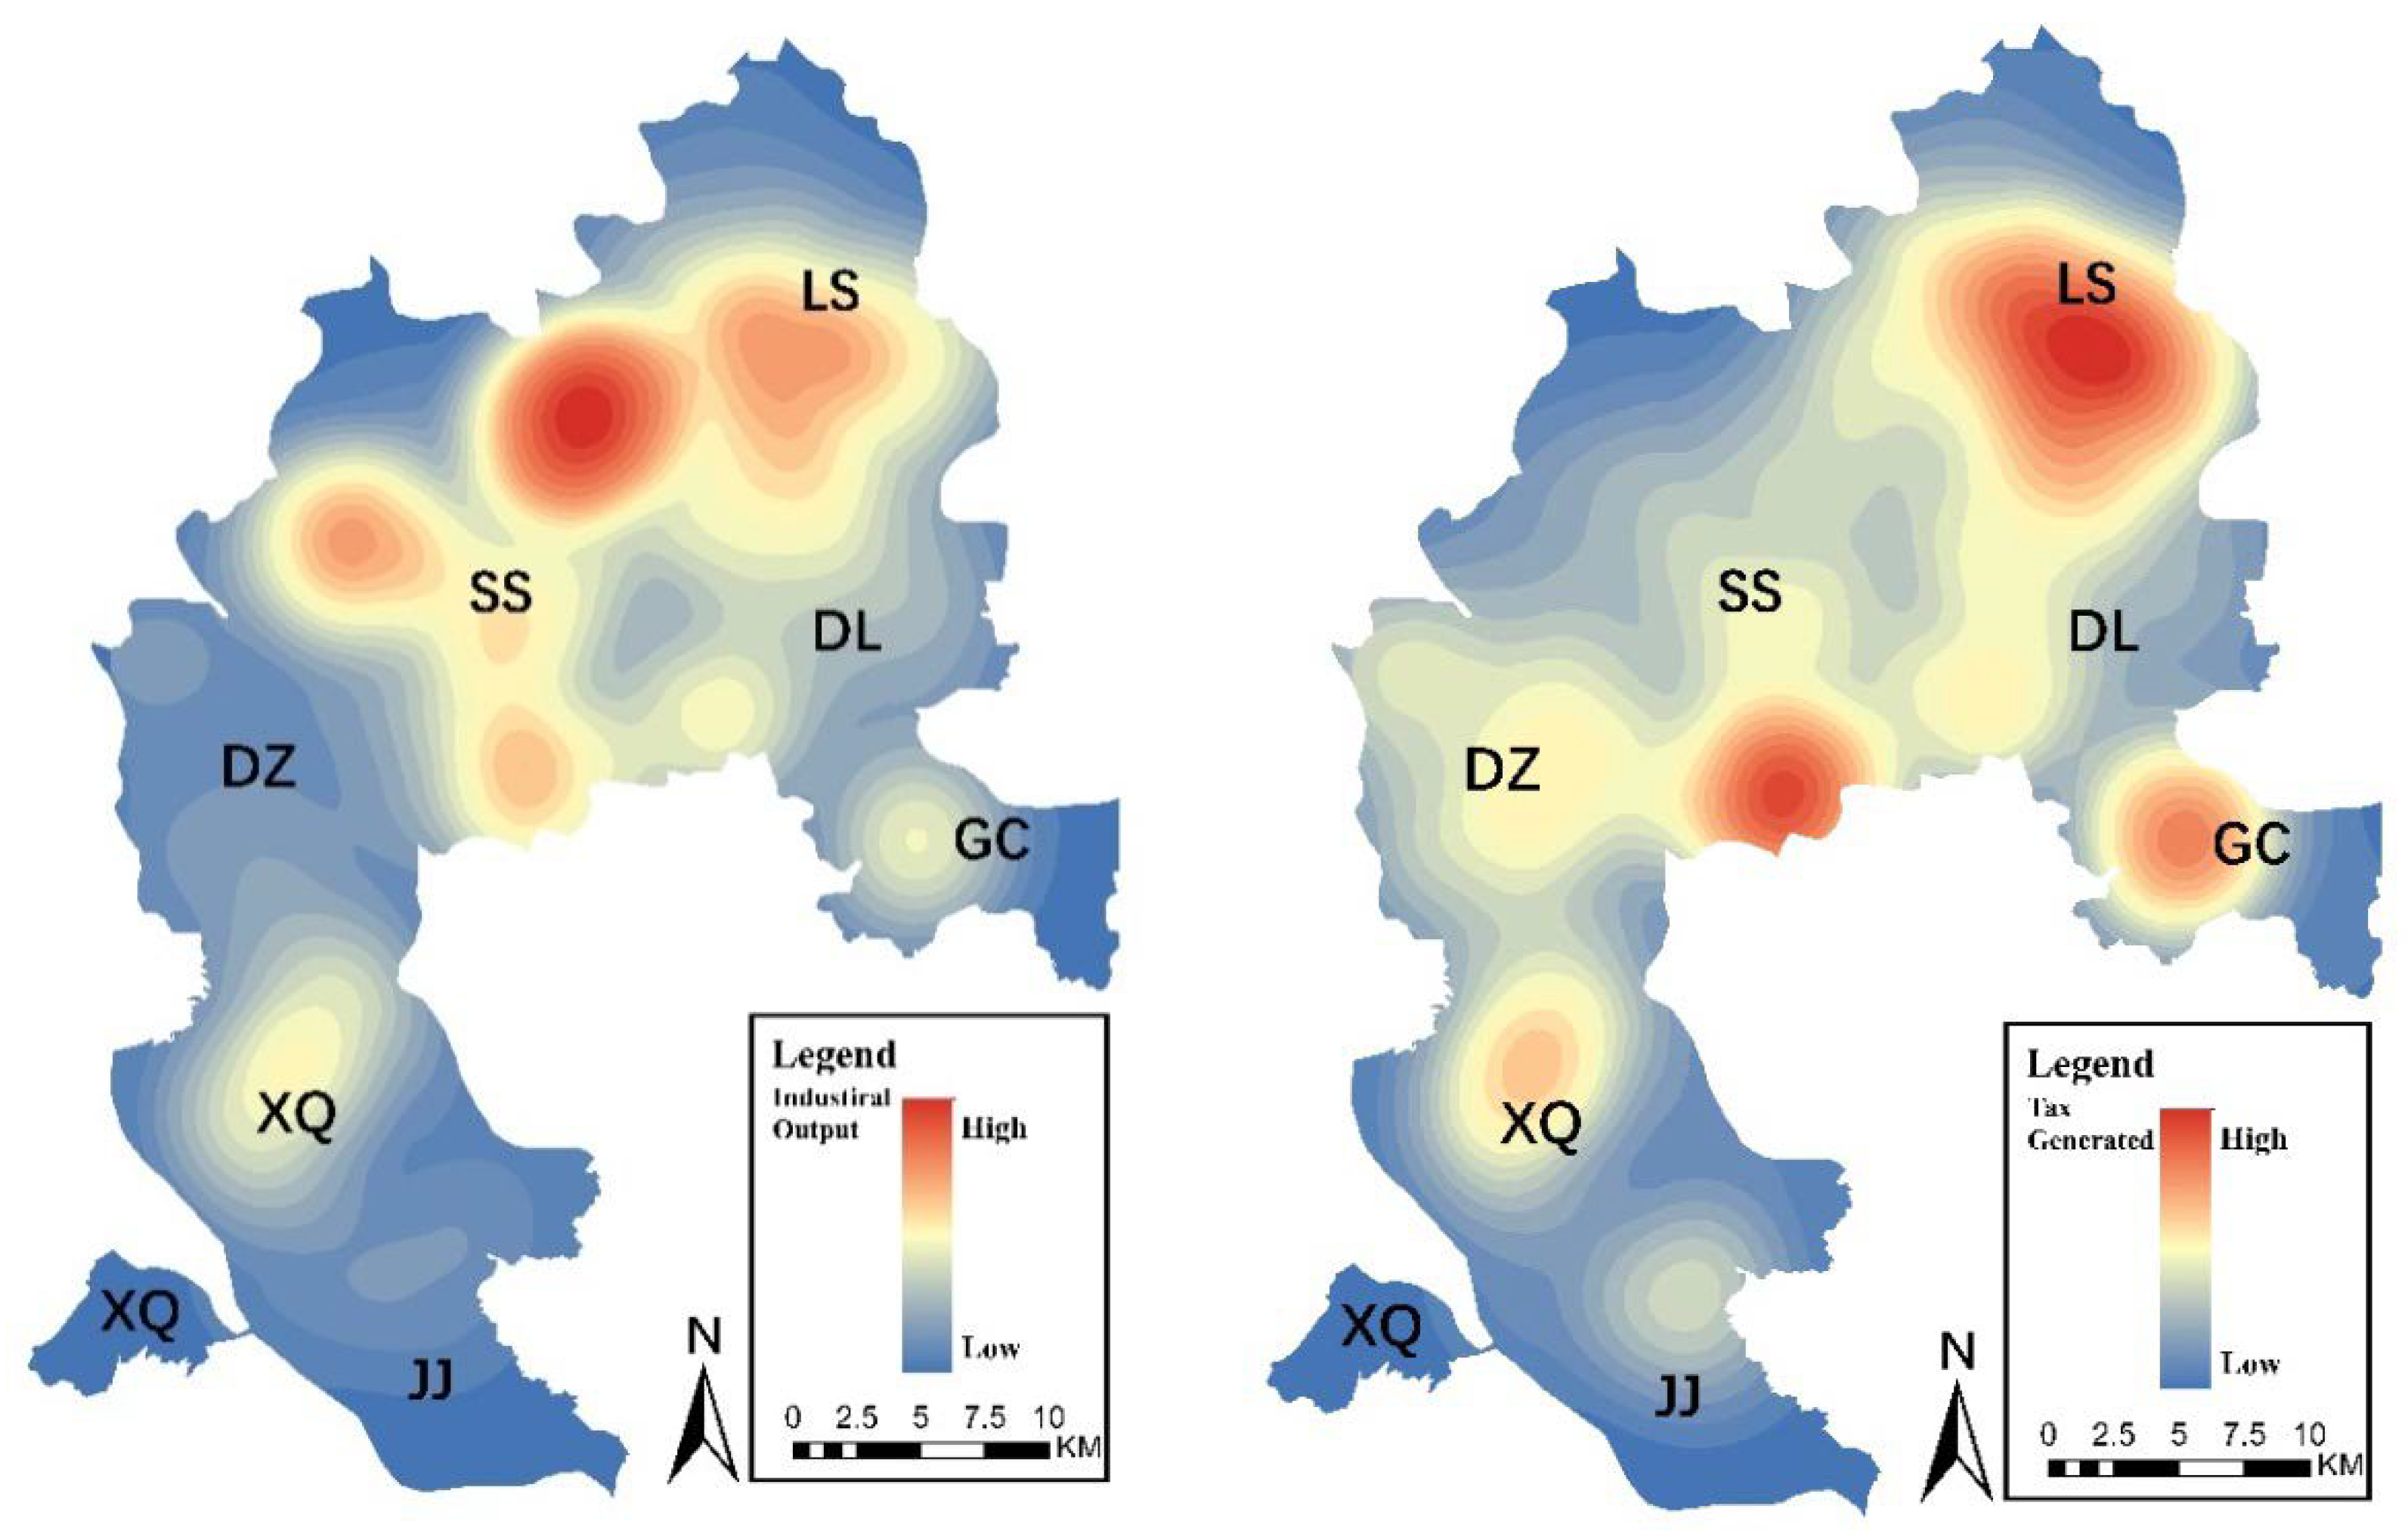
Figure 3, RIPs contributing the highest industrial output and tax revenue are concentrated in the northern towns of SS and LS. This indicates that RIPs in the east are rather inefficient and are in urgent need of renovation. SS is the largest town of Nanhai in terms of both land area and economic development. It also has the largest number of RIPs and contributes the highest industrial output and tax revenue in the region. Another town with better RIP economic performance is LS, which is also located immediately to the east of Guangzhou. In contrast, RIPs in the three western towns of DZ, XQ, and JJ are less effective and have difficulty attracting a sizable employment population. Their road network density is low, and they are far away from Guangzhou and the city center of Foshan. In addition, the southwestern part of Nanhai District has a favorable ecological environment. It has a large area for agricultural production and a national ecological reserve. Some of the RIPs in these three towns have great potential for ecological restoration.
The results of the spatial analysis preliminarily show the characteristics of the spatial distribution of RIPs in Nanhai District. First, RIP development is concentrated in the eastern part of the district. The towns of LS, DL, GC, and SS gather the majority of industrial parks and employment, as well as being the major contributors to industrial output and tax revenues. This feature coincides with the location characteristics of Nanhai District, which is adjacent to Guangzhou to the east. Second, the low efficiency of industrial parks and low industrial output in DL and GC indicate a mismatch of precious land resources. GC and DL are considered the best-located districts in Nanhai. However, their RIPs generate very little industrial output and few job opportunities, while land rents are at a comparatively high level. It is evident that there is a path dependency phenomenon in the development of RIPs in these two towns, and market forces cannot play an effective role in the allocation of land resources.
Figure 3.
Kernel density diagram of industrial output (left) and tax generated (right).
Figure 3.
Kernel density diagram of industrial output (left) and tax generated (right).
4.2. Results of K-Mean Cluster Analysis and Overlay Analysis
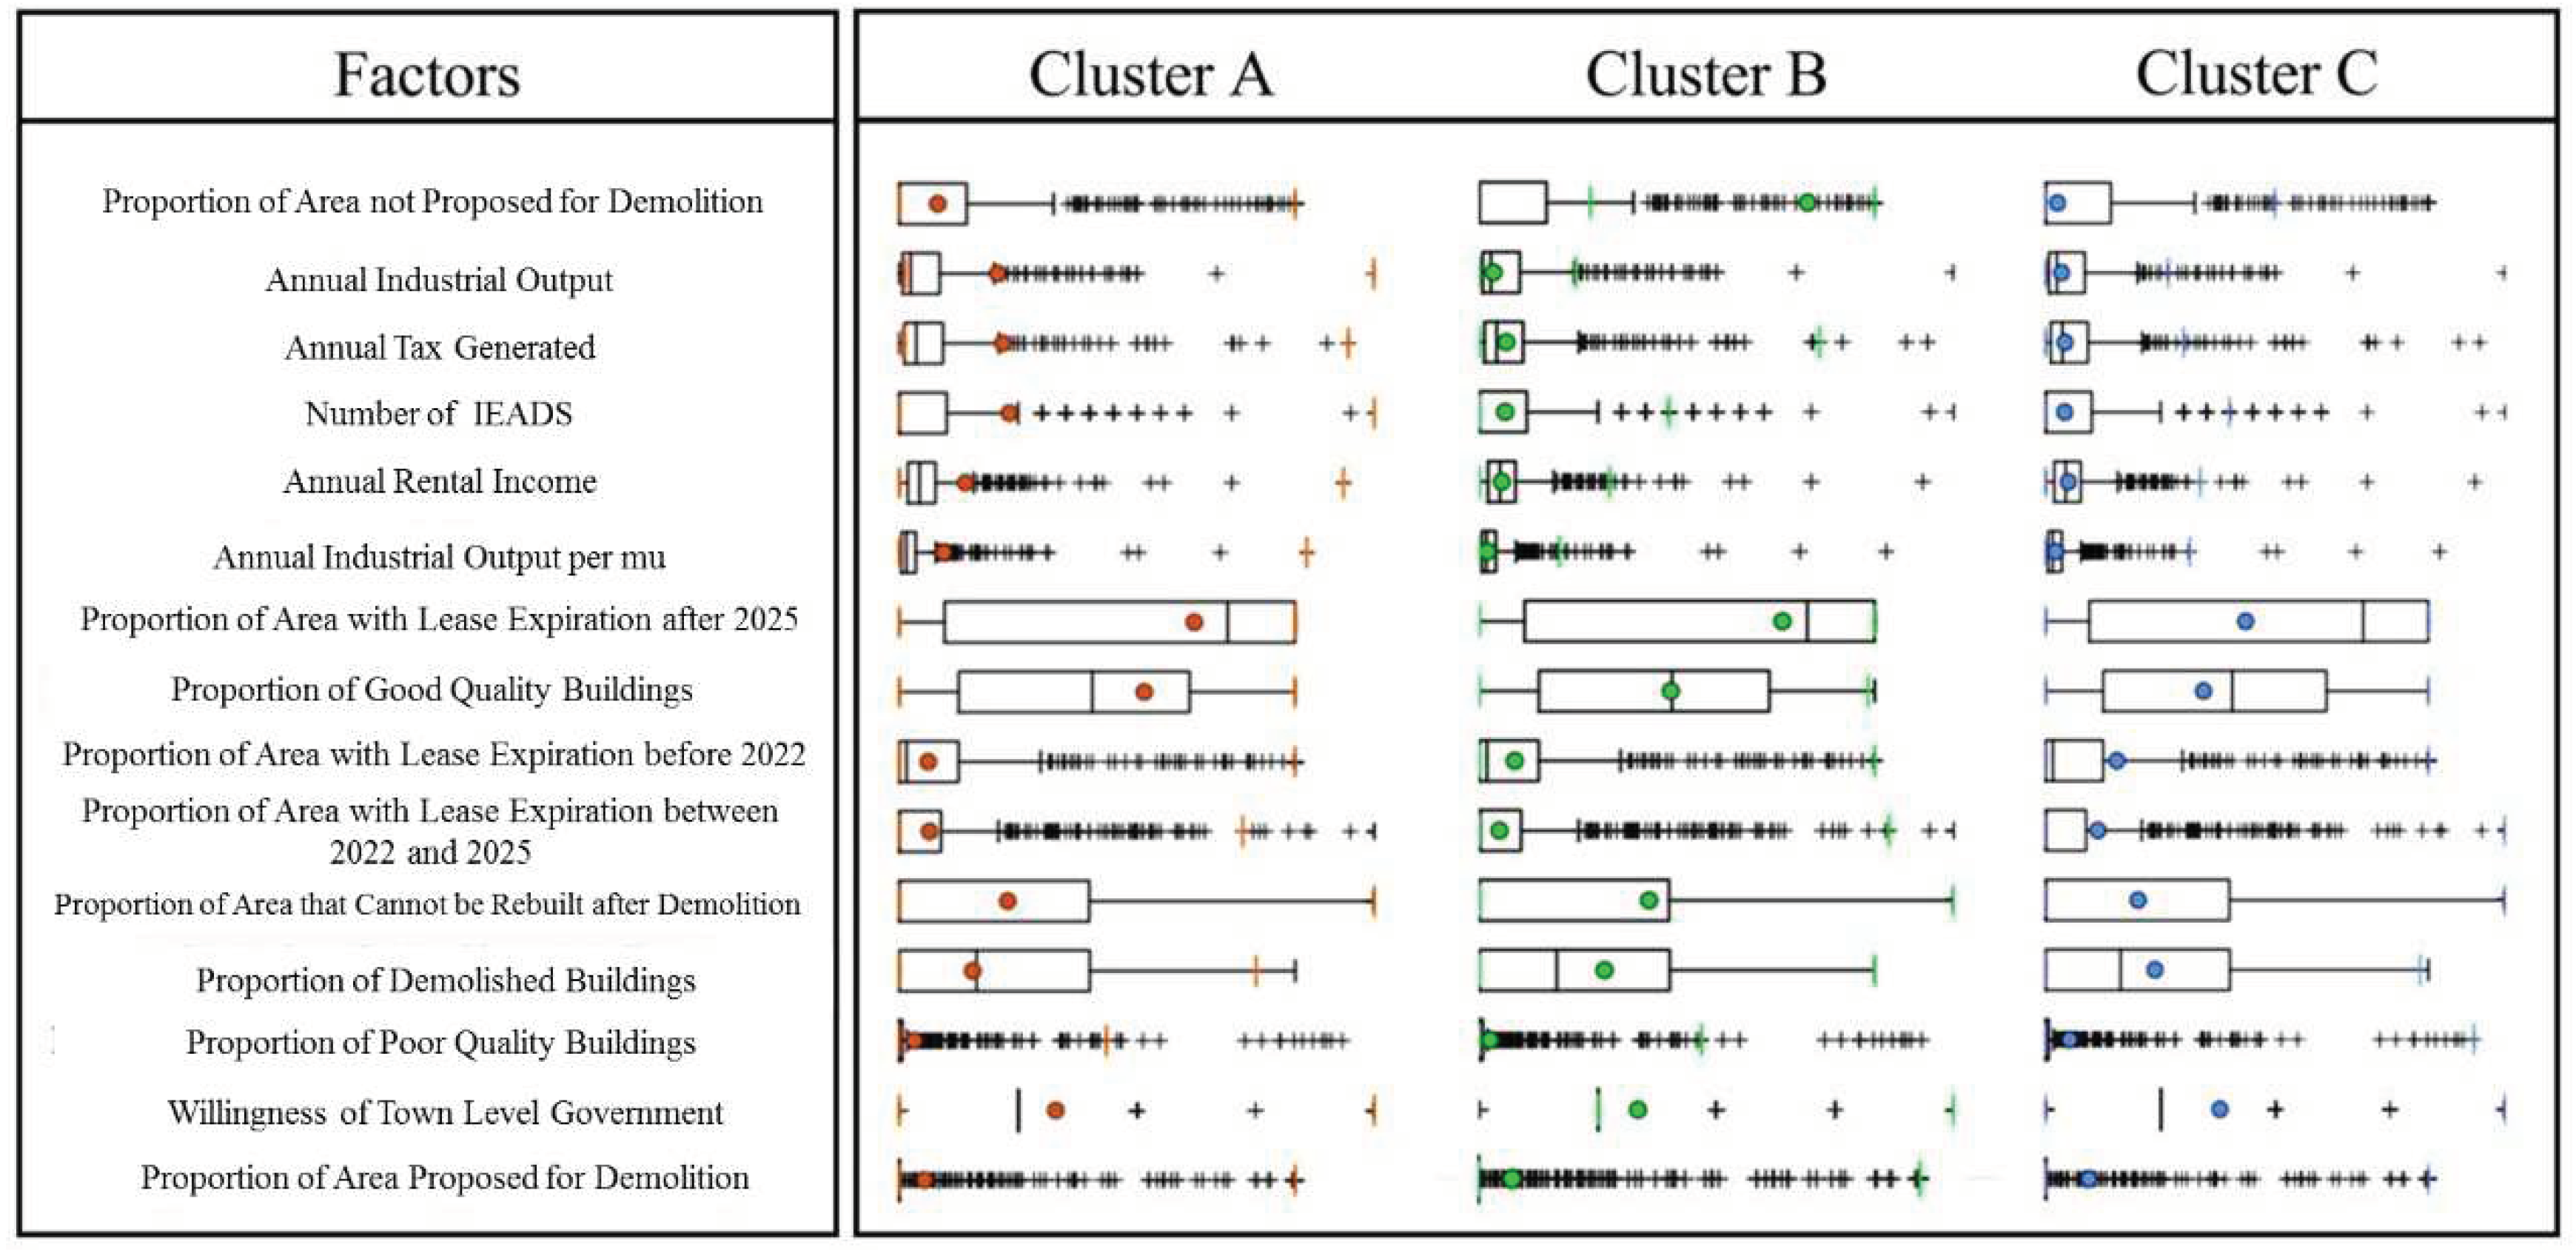
According to the pseudo F-value results, the cluster analysis based on fifteen factors divides the 601 RIPs into three clusters.
Figure 4 shows that the three clusters are well differentiated from each other, indicating that the all the RIPs have been successfully classified in different clusters. ArcGIS 10.2 software was used to temporarily name the three clusters as Cluster A, B, and C. They, respectively, contain 104, 98, and 399 RIPs, which is a reasonable distribution.
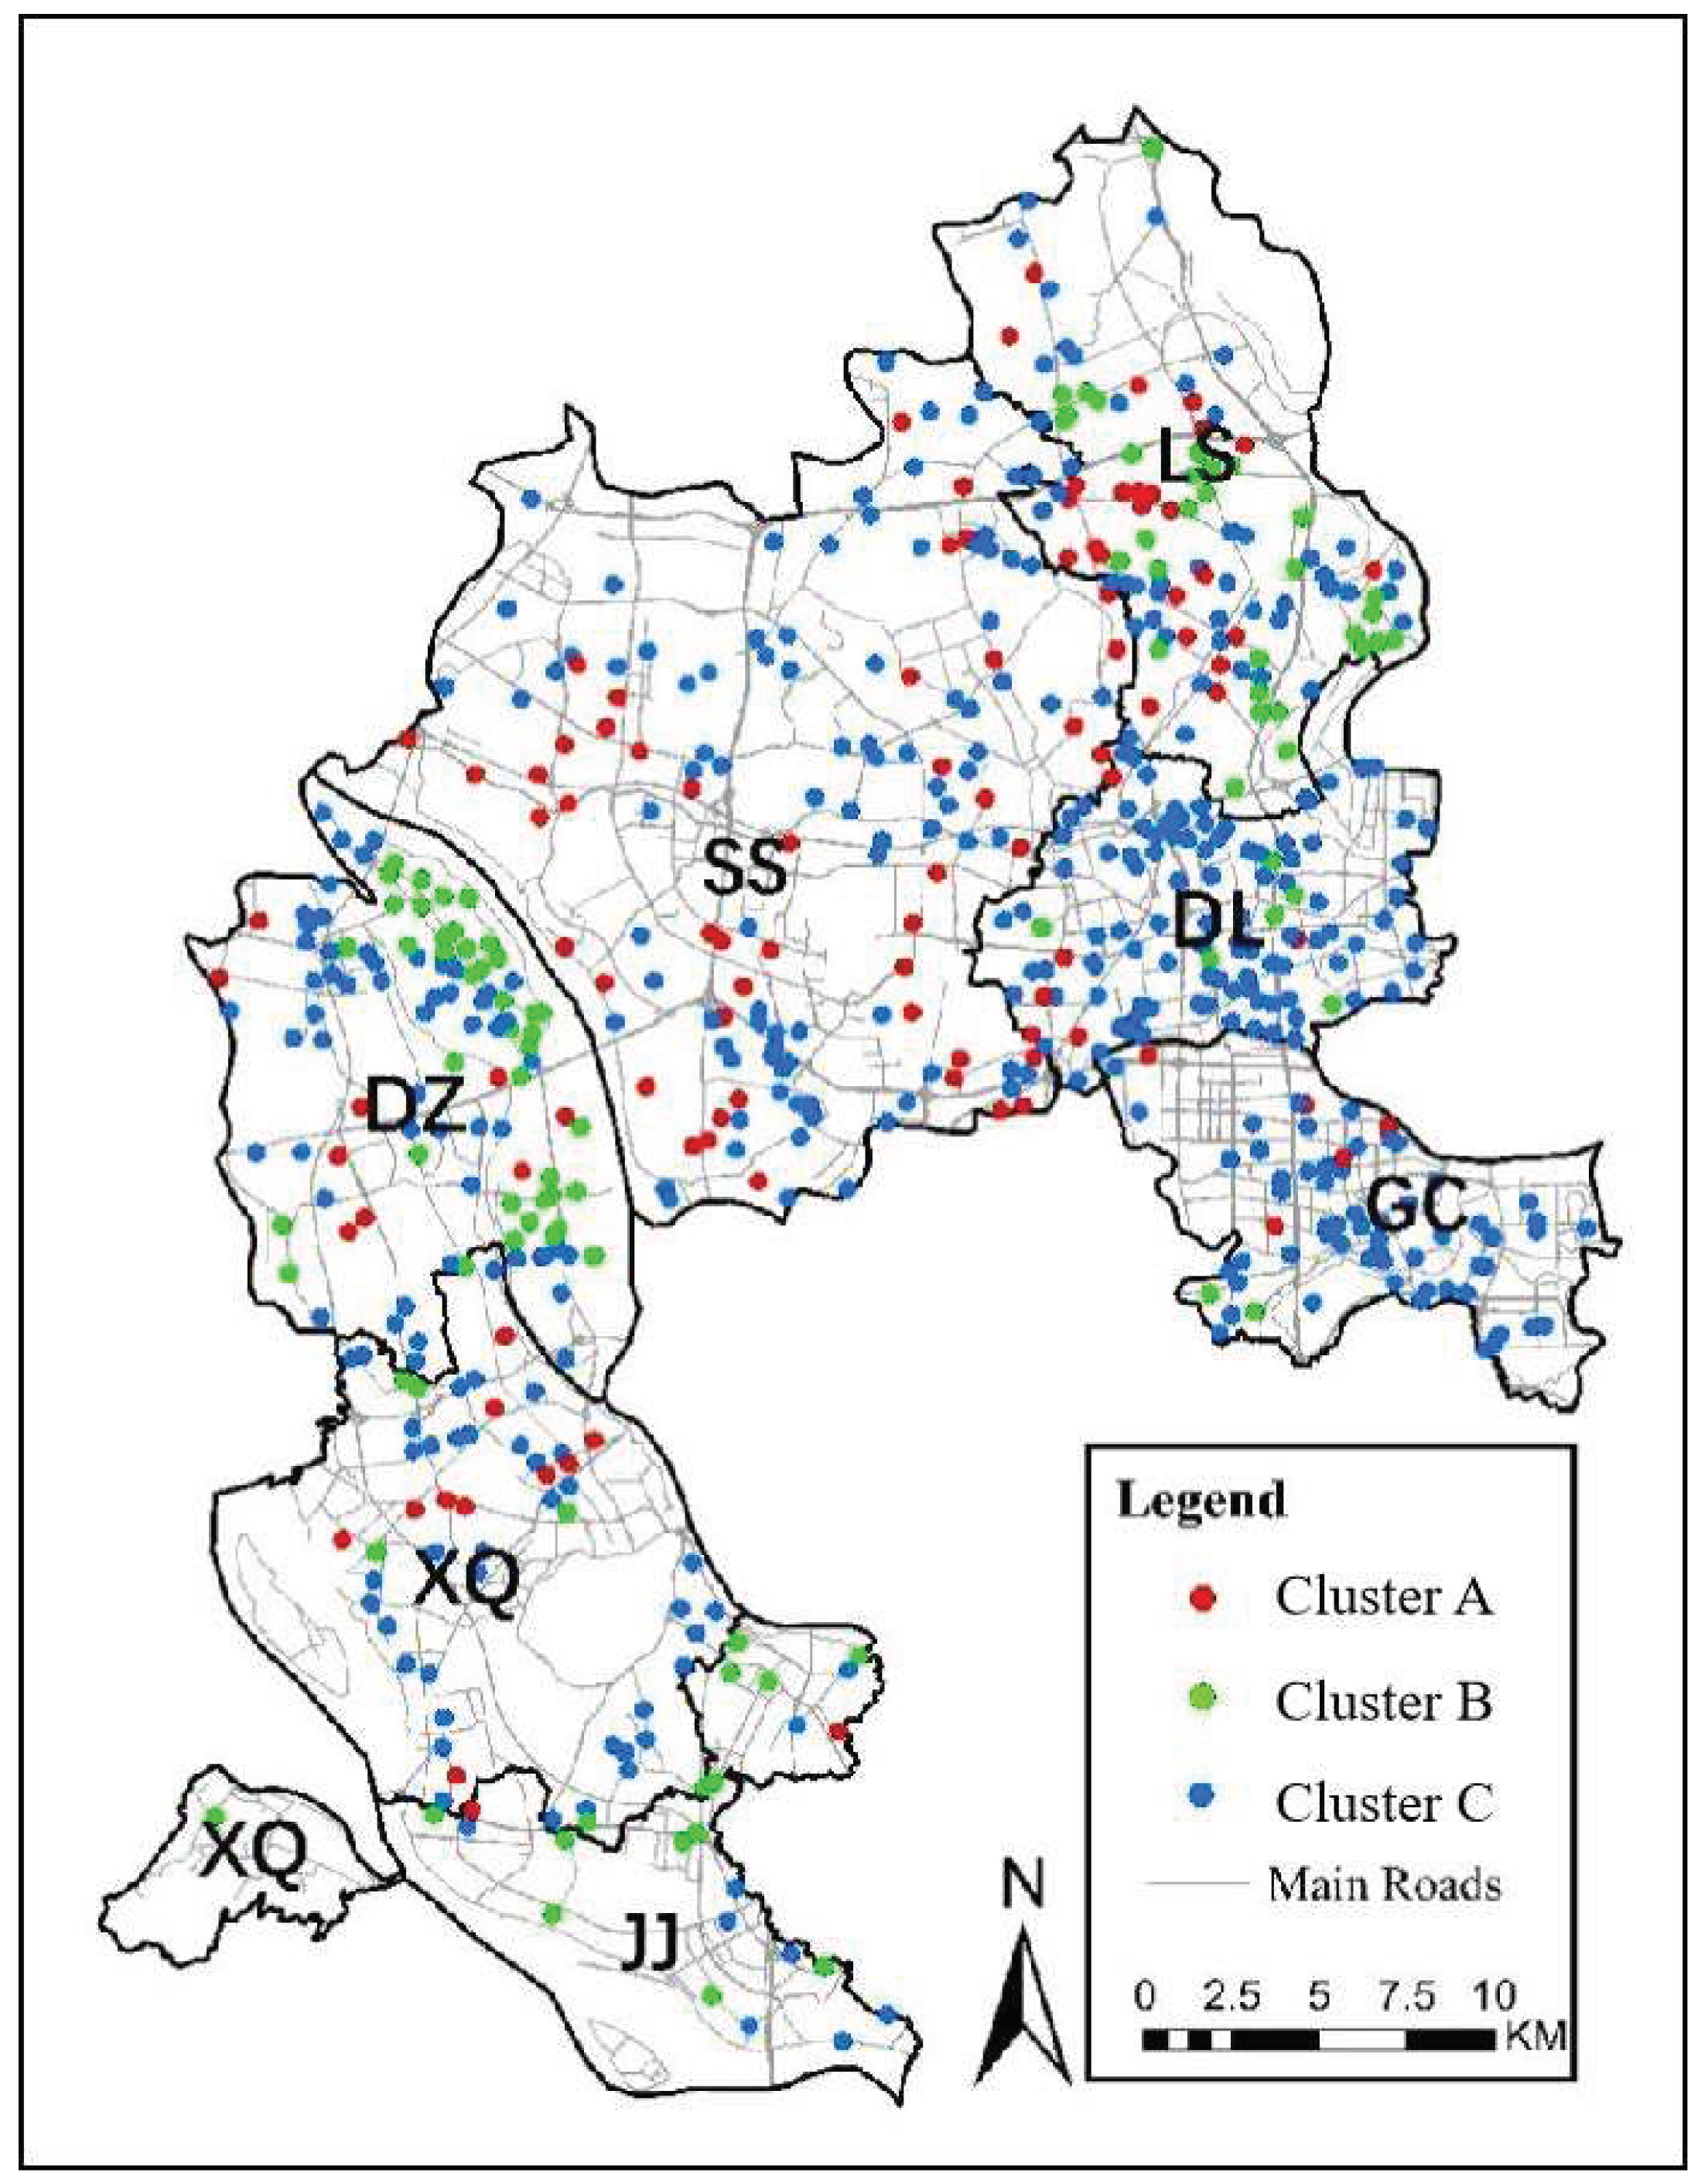
Table 3 and
Figure 5 show the geographical distribution of the three types of RIPs. The data show that SS has the largest number (47) of RIPs in Cluster A. DZ has the has the largest concentration of Cluster B RIPs (39), while there are 99 and 91 Cluster C RIPs in DL and SS, respectively.
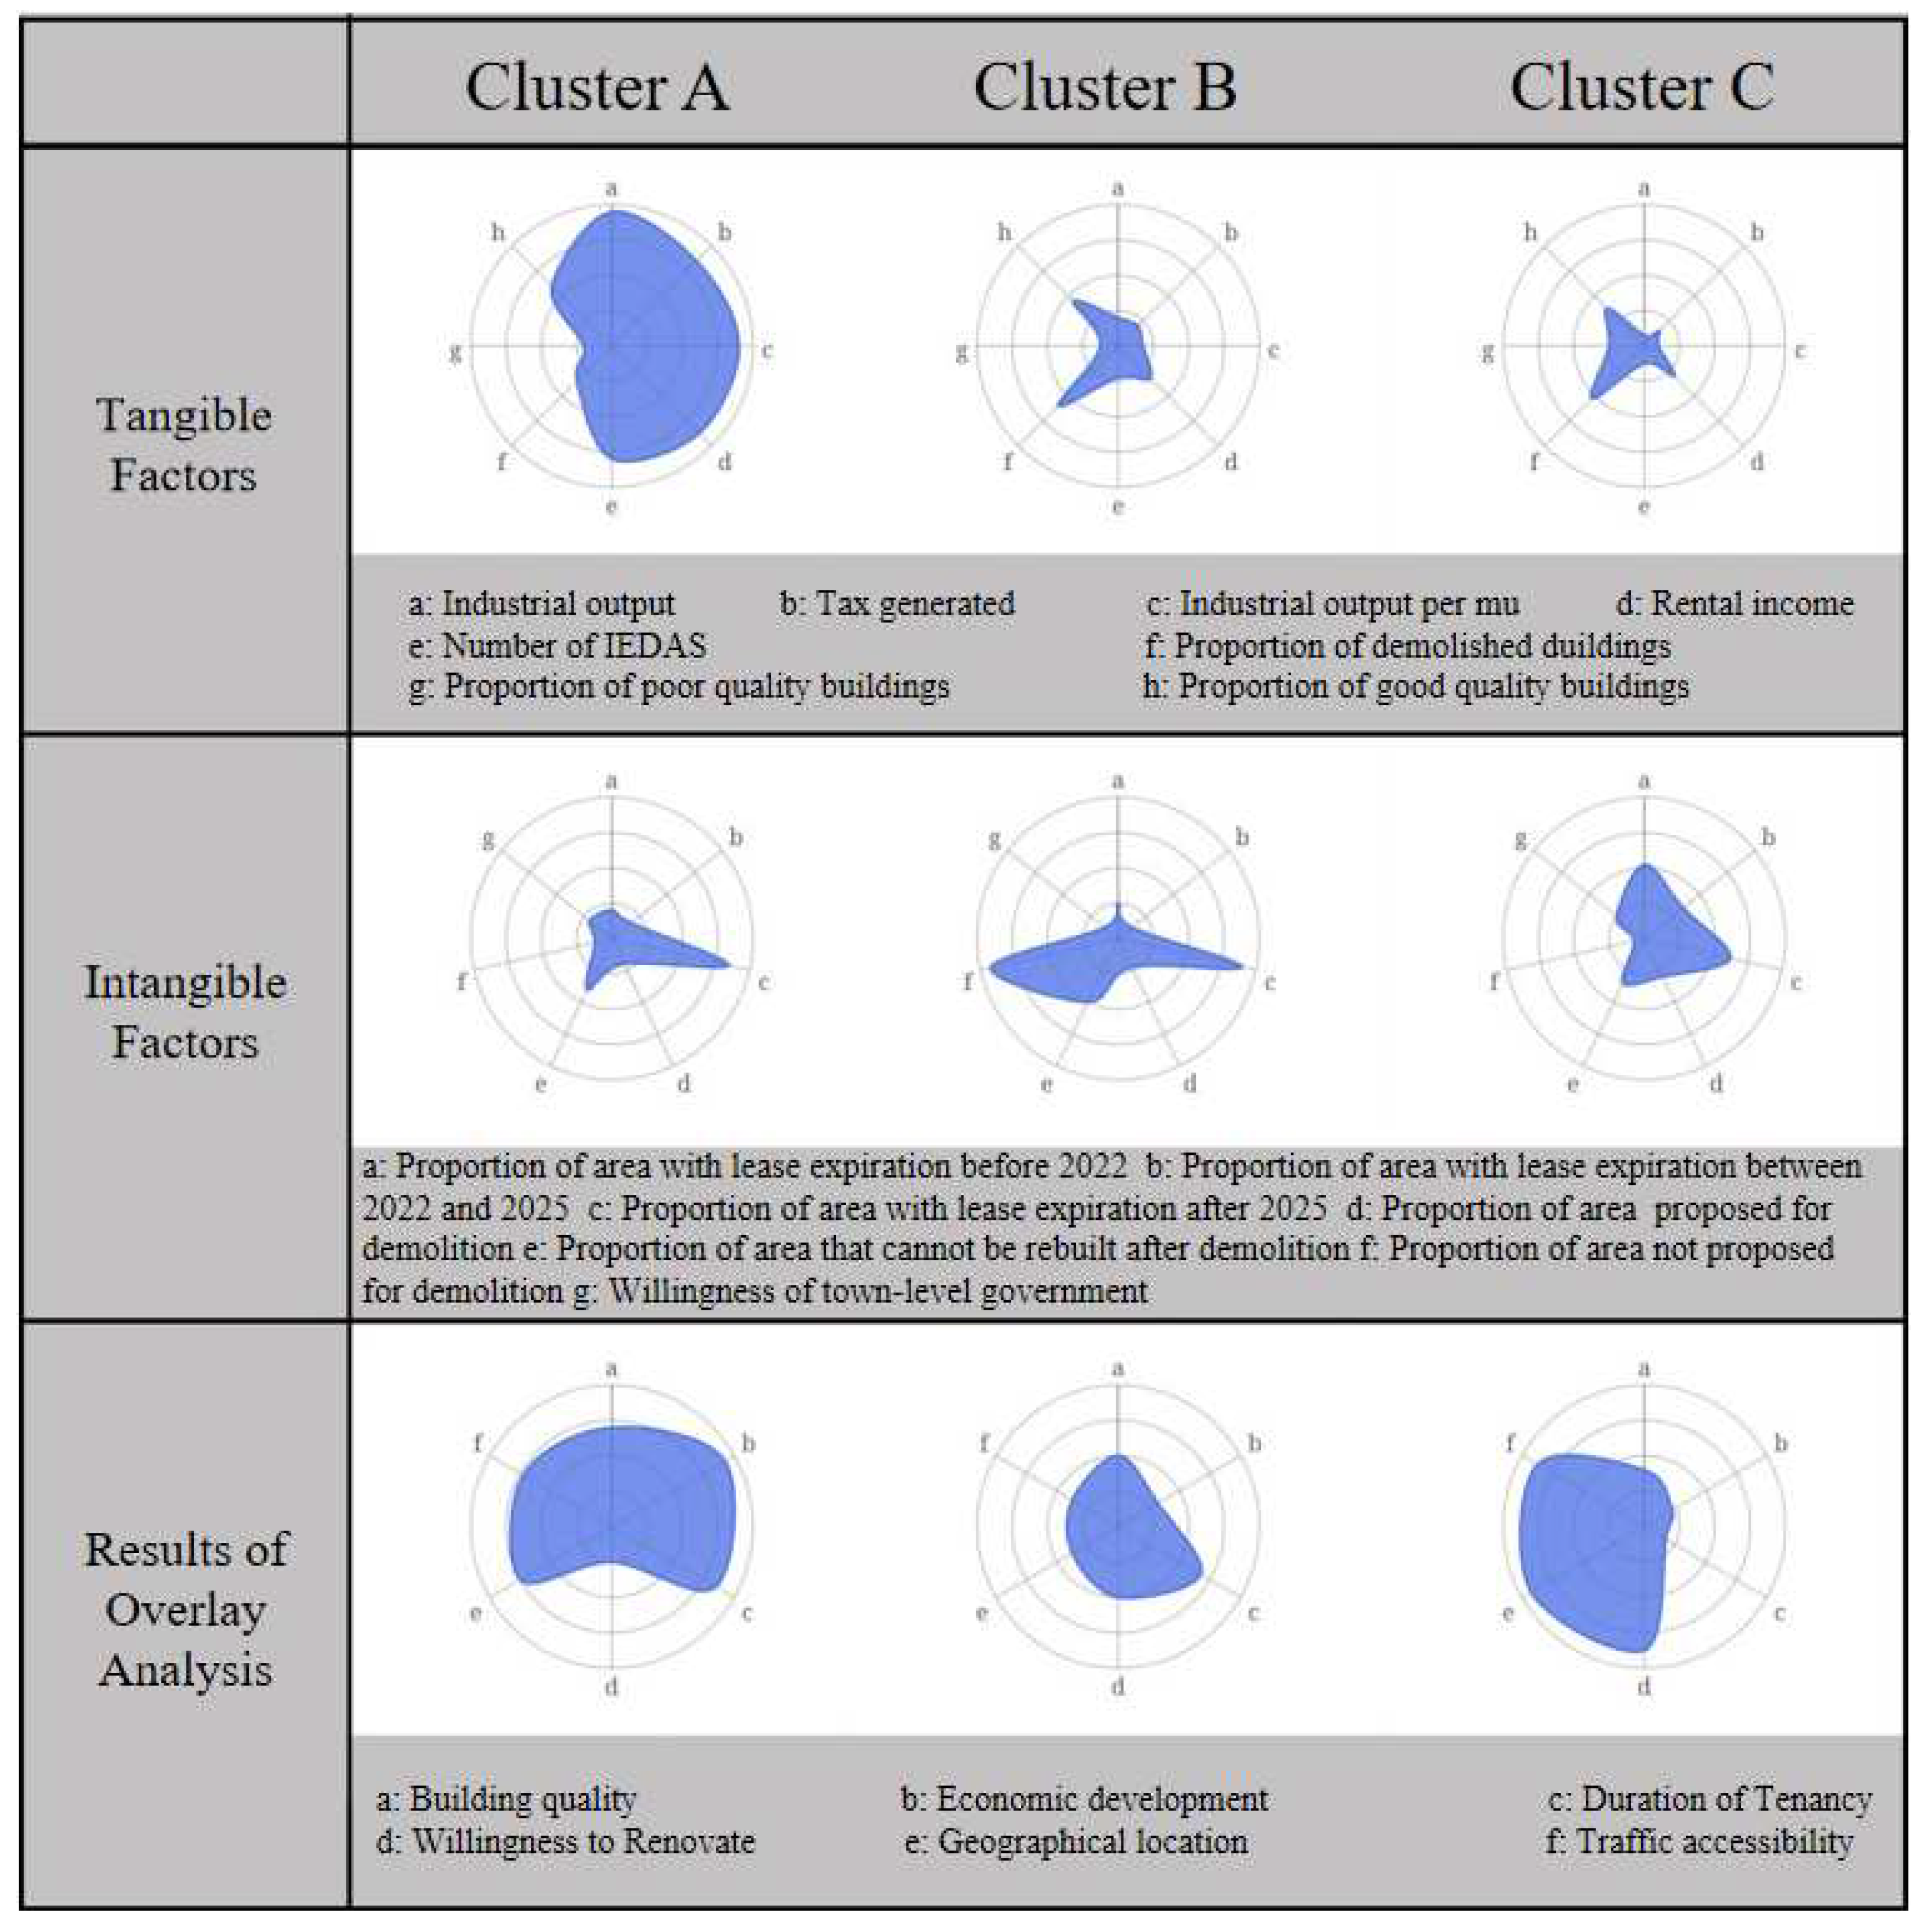
By overlaying the results of spatial and cluster analysis,
Figure 6 shows the detailed data characteristics of the three groups of RIPs. In addition to showing the specific scores for tangible and intangible factors specified in
Table 1, two indicators for spatial analysis were incorporated into the comprehensive evaluation of the three types of RIPs. “Geographical location” refers to the distance from the RIP to the city centers of Foshan and Guangzhou. “Traffic accessibility” measures the distance to major roads from the RIP. The economic performance of RIPs in Cluster A is at the highest level among the three groups, as measured by indicators such as industrial output, tax generated, rent income, and the number of IEDAS. On the other hand, the quality of the existing buildings in this group is relatively good and most existing leases would expire long after 2025, making the town-level government have a strong will to retain them. Therefore, the authors propose naming Cluster A industrial parks “retained RIP”.
The economic performance of Cluster B RIPs is generally poor. In terms of land use, a considerable portion of the old factory buildings have already been demolished, and the lease terms of the remaining buildings are still long. Hence, most of the local managers do not recommend demolishing the properties, which makes the necessity for renovating these RIPs in the near future relatively low. Since these RIPs would not be renovated until years later, they can be defined as “medium-term-removed RIPs”.
Cluster C RIPs accounted for 66.4% of the 601 industrial parks and were widely distributed throughout Nanhai District. These parks fully demonstrate the typical characteristics of RIPs, which are small in scale, low in industrial output, and poor in building quality. Moreover, a Cluster C RIP generally has better transportation and location conditions, and the remaining tenancy period of the factory buildings is relatively short, so the town government’s willingness to renovate is strong. Based on the above features, the renovation of Cluster C industrial parks is rather necessary, as the transaction cost is comparatively low. In summary, they can be called “near-term-removed RIPs”.
4.3. Explaining the Decision-Making for the Redevelopment of Different Types of RIPs
4.3.1. Retained RIP: Shannan Industrial Park
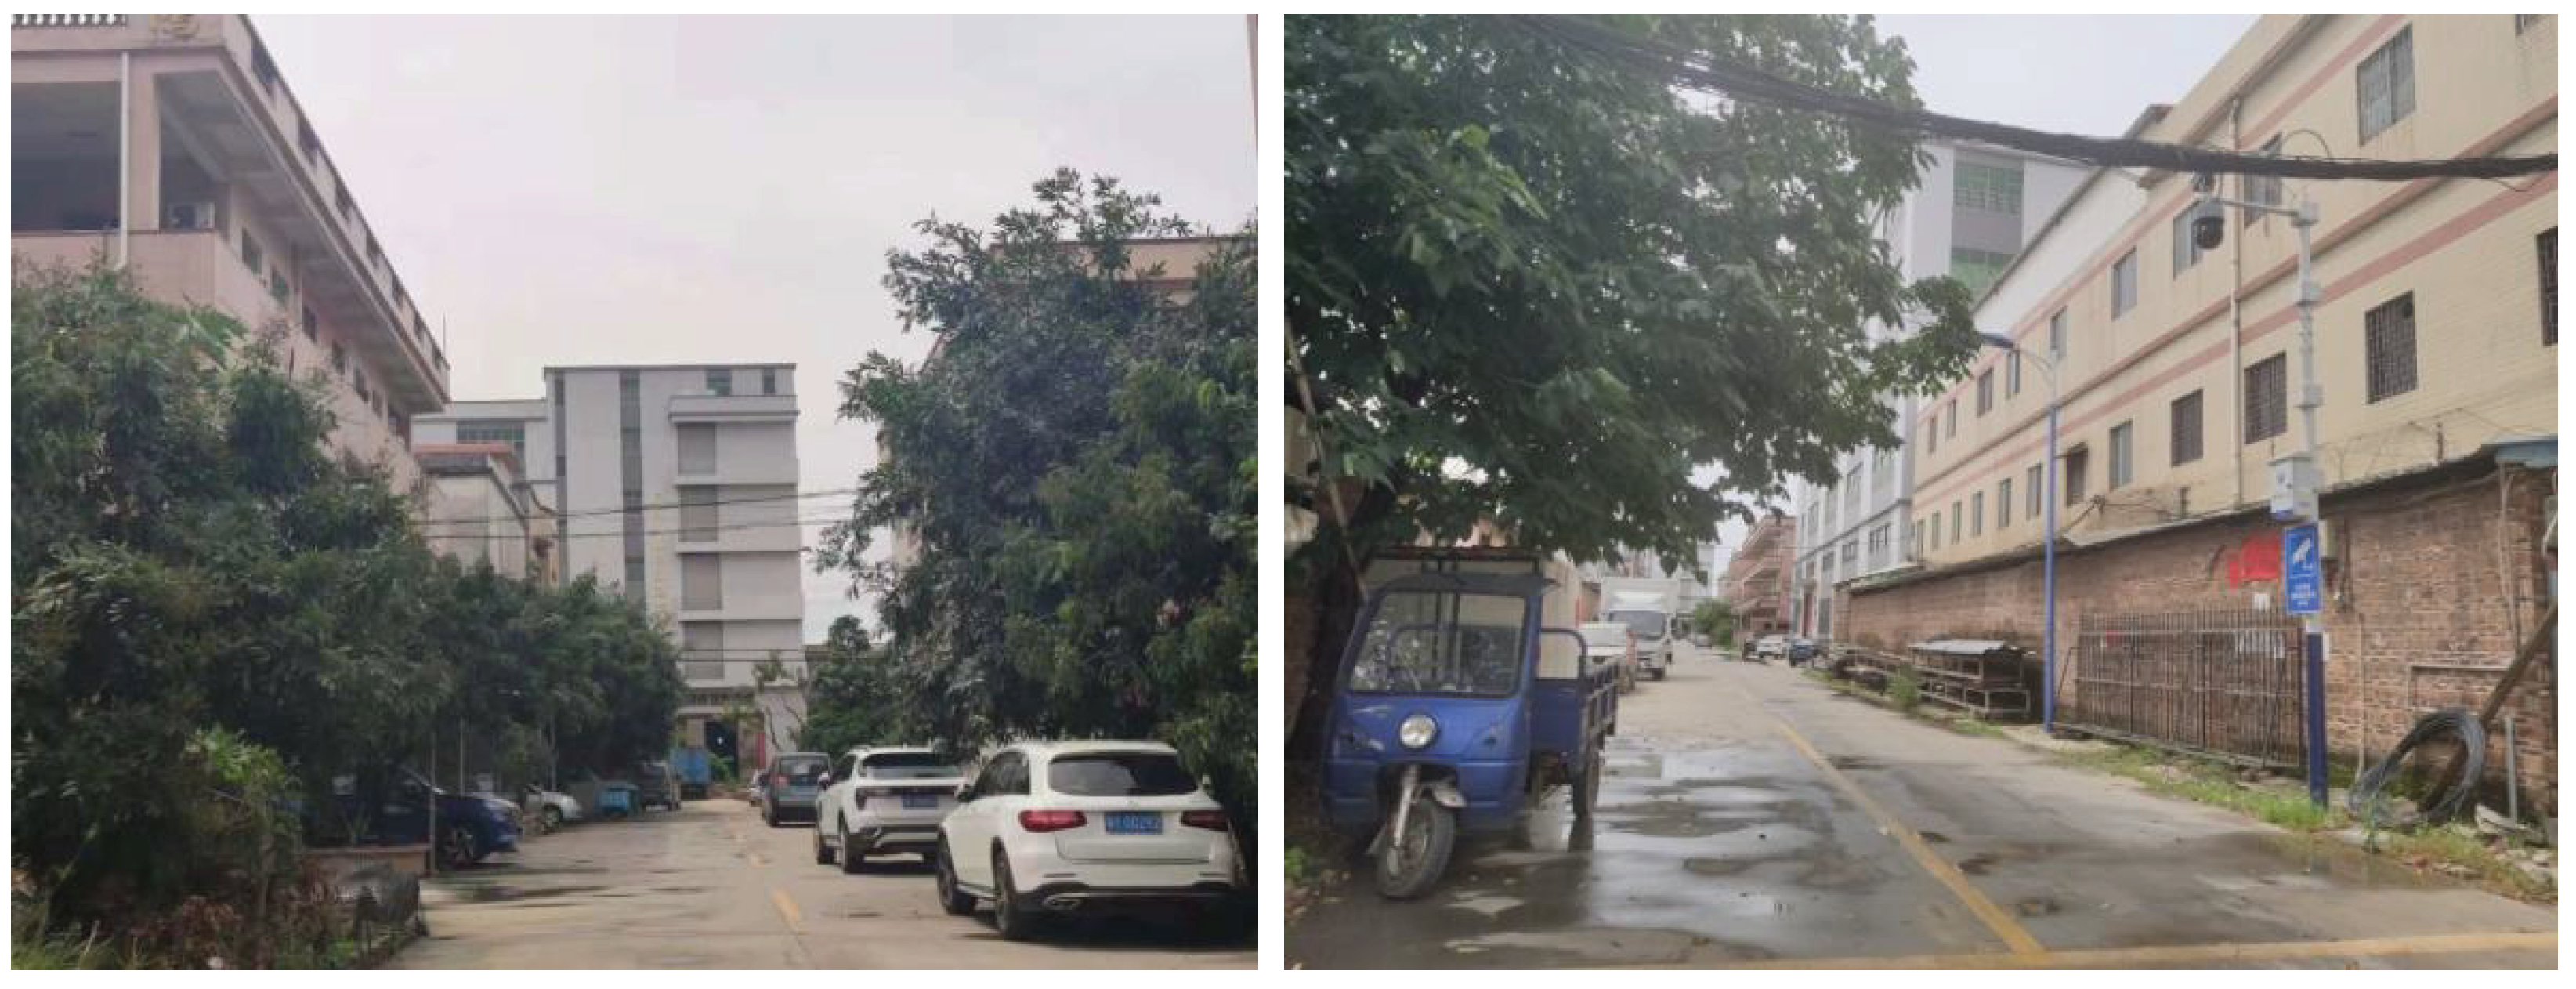
The representative park of Cluster A is Shannan Industrial Park in SS Town, which is also one of the most developed parks in SS. This RIP covered an area of 1556.15 mu (256.36 acres) and its industrial output in 2019 was CNY 1.449 billion (USD 202.6 million), generating tax revenue of CNY 53.76 million (USD 7.51 million). Shannan Industrial Park is home to eleven IEDAS, which is 6.5 times the average level of Nanhai District.
Figure 7 shows that the distribution of factory buildings is dense with a relatively low plot ratio. The quality of the factory buildings is acceptable and there has been a high degree of industrial agglomeration of mold manufacturing, metal processing, door and window manufacturing, and other industries. Driven by industrial development, the industrial park has gathered a large population, and the public facilities are mainly built around the core area of the industrial park. Despite facing problems such as industrial pollution and low-quality facilities, the town-level government still recommends retaining Shannan Industrial Park in order to maintain local employment and economic development.
4.3.2. Medium-Term-Removed RIP: Donglian Jincheng Industrial Park
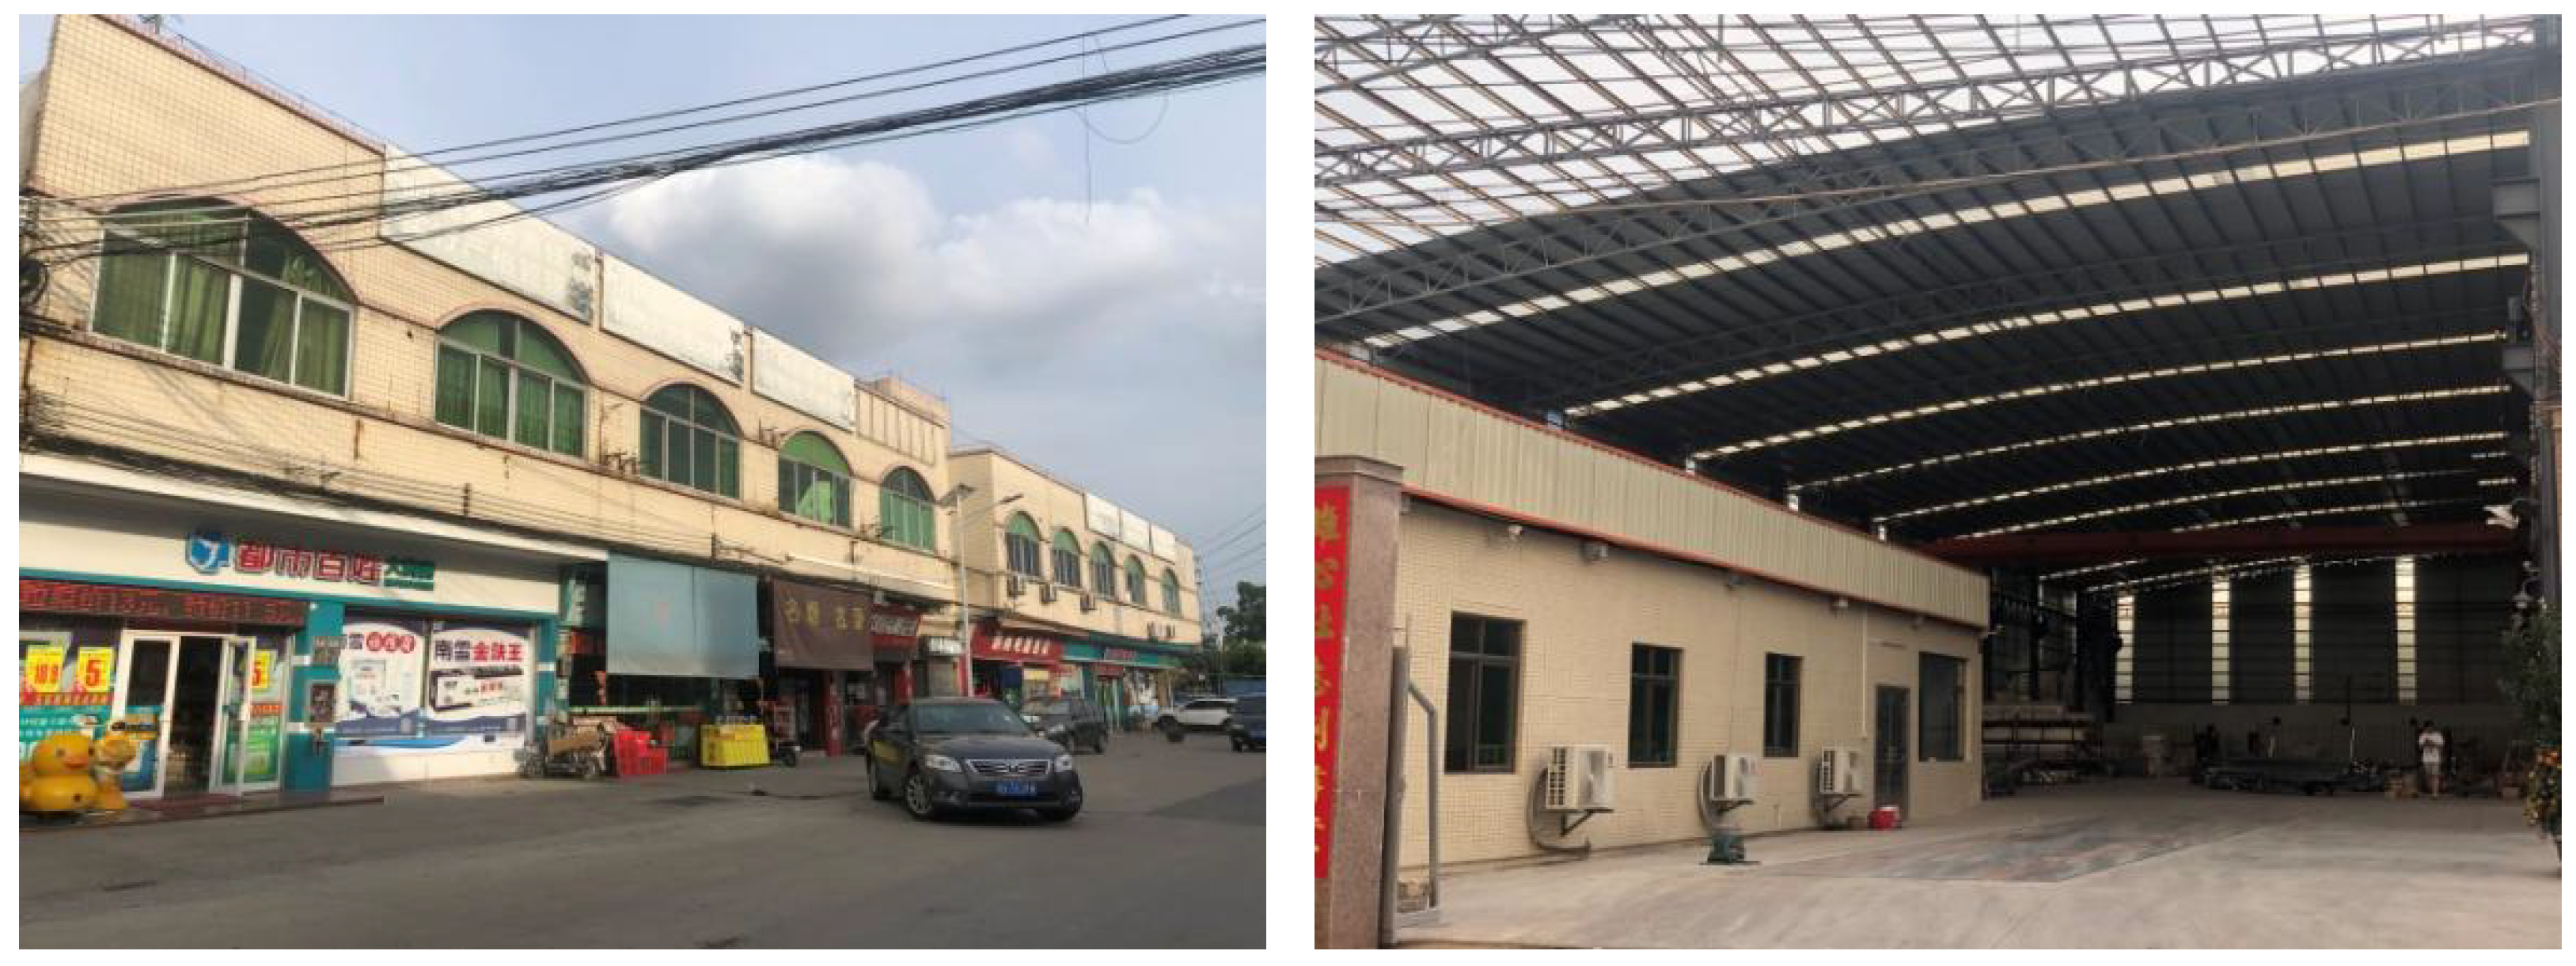
Medium-term-removed RIPs are mainly located in DZ and LS, with a total number of 98. The economic development of Cluster B parks is rather poor in terms of industrial output, average industrial output per mu, and annual tax revenue. However, the redevelopment of such parks needs to overcome multiple obstacles, including a high proportion of area that cannot be demolished and a long remaining tenancy period. Donglian Jincheng Industrial Park in DZ is a typical “medium-term-removed RIP”. Its industrial output in 2019 was merely CNY 55 million (USD 7.69 million), with tax revenue of CNY 5.68 million (USD 794 thousand) and only one IEDAS, all of which are lower than the average level of Nanhai District. Although the park is located along a major road, it is far from the city center of Guangzhou. It lacks quality public facilities and the scale of industrial enterprises is small. Scattered small factory buildings are interspersed with rural dwellings. The existing buildings in the industrial park are of low quality, while as many as 97% of the factory buildings have a remaining tenancy term of more than five years (
Figure 8). To generate rental income, some vacant factory buildings have been converted into apartment buildings for the migrant population. In addition, 64% of the Donglian Jincheng Industrial Park’s land violated land use planning and could only be restored to agricultural or ecological land after demolition. Since illegal buildings have been used for many years, the demolition of illegal construction was not enforced due to high transaction costs. Taking factors such as social stability and transaction costs into account, the town government tends to renovate such industrial parks only in the medium or even long term.
4.3.3. Near-Term-Removed RIP: Dienan Linchang Industrial Park
“Near-term-removed RIPs” have the worst economic performance. The 399 industrial parks accounted for 63.7% of the total number, making them the majority type of Nanhai’s RIPs. This cluster is widely distributed in all towns and is mainly concentrated in GC Subdistrict and DL Town. They are the least developed of the three clusters, with the smallest average size and the lowest development intensity. The average plot ratio is only 1.06. In terms of building quality, a large number of dilapidated buildings have yet to be demolished. The leases of most of their properties would expire within three years. Existing factories are predominantly small and low-end workshops, for most of which the leases would expire within three years. On the positive side, there are fewer institutional impediments to the renewal of near-term-removed RIPs because the transaction costs for demolition and renovation are generally low.
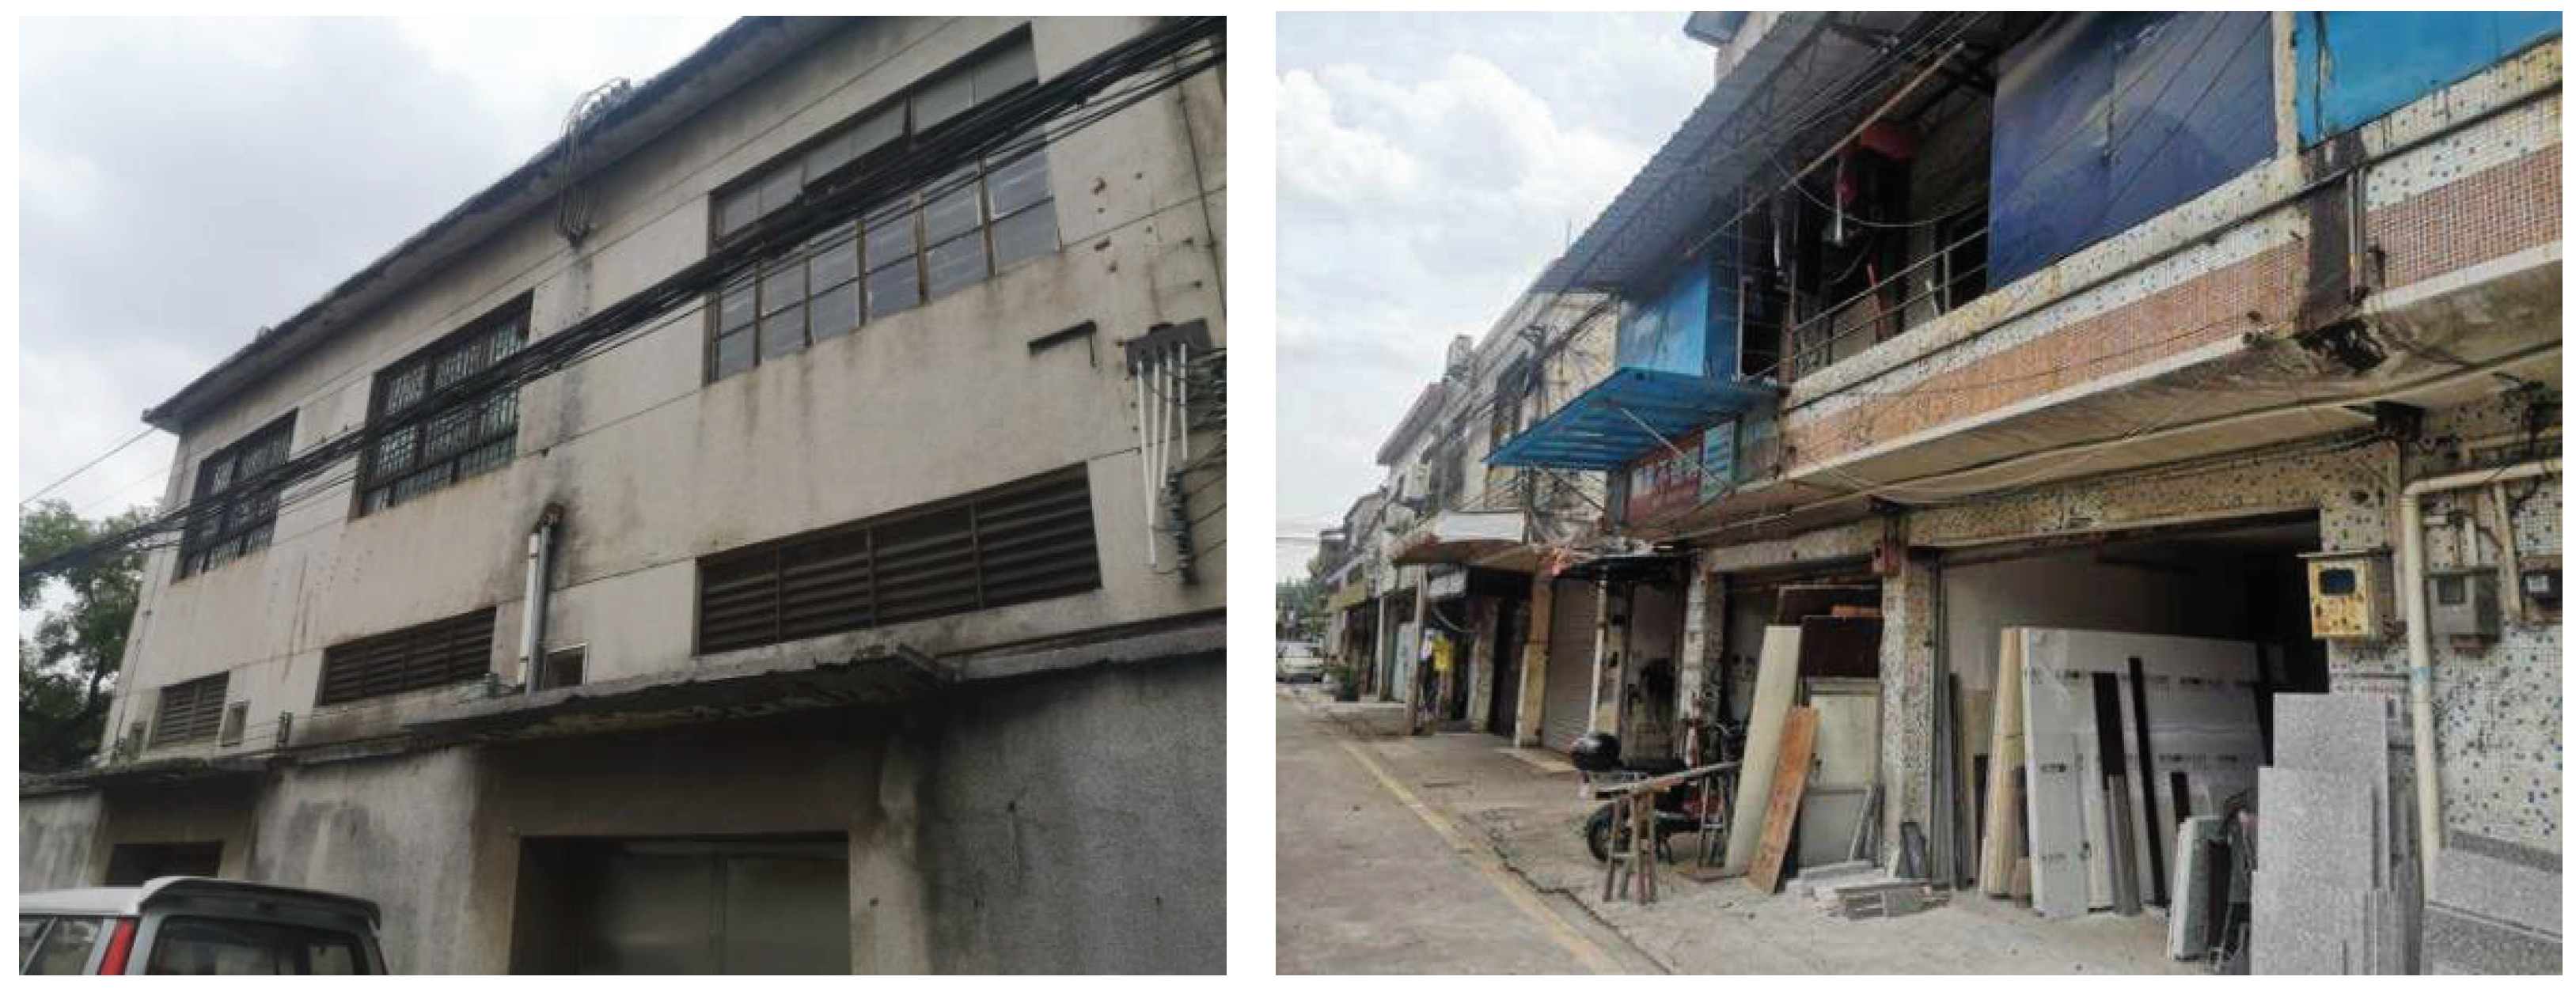
Dienan Linchang Industrial Park, located in GC Subdistrict, is a representative Cluster C RIP. Its land area is only 120.06 mu (19.78 acres). The industrial output and tax revenue generated in 2019 were CNY 31 million (USD 4.34 million) and CNY 500 thousand (USD 69.9), respectively, which are far below the average level of Nanhai District. The factories located in this park are small in scale and are mainly small workshops self-built by individual villagers. The low-rise buildings are outmoded and lack effective land use planning (
Figure 9). Most of them are fusions of staff dormitories, workshops, and warehouses. Problems induced by these RIPs include poor working environment, safety issues, serious environmental pollution, poor production efficiency, and lack of market competitiveness. The large number of Cluster C RIPs echoes the necessity of promoting urban renewal in Nanhai. In the very near future, these RIPs would have great potential for large-scale renovation.
5. Discussion and Conclusions
Taking the rural industrial parks in Nanhai District of Foshan City as studied cases, this paper analyzed how the initial distribution of property rights and transaction costs affect the decision-making for RIP redevelopment. After a time-consuming data collection process, this paper collected fifteen tangible and intangible indicators, which were further classified into four categories based on their characteristics: economic development level, building quality, duration of tenancy, and willingness to renovate. Using ArcMap 10.2 software to analyze the 2019 cross-sectional data and vector data, the results revealed a close relationship between location conditions and rural industrial parks. The authors also pointed out that there is a market failure in RIP development while a vast amount of inefficient industrial parks are occupying large areas of well-located land. Cluster analysis and the subsequent overlay analysis explicitly showed that the difficulty in RIP redevelopment is rather diverse from one to another. By identifying their economic development level and institutional barriers, the authors proposed that the RIPs of Nanhai be divided into three types: reserved, medium-term-removed, and near-term-removed.
It was shown that the Nanhai RIPs have reached a turning point in their history. Their earlier contribution to economic and social development has become dilapidated. Except for the mentioned 104 retained RIPs that still have a significant economic contribution, the majority of the remaining industrial parks need to be upgraded in the near or medium term to free up land space for high-tech industries. This paper also provided some policy-making ideas for the future management of different types of RIPs. For example, retained RIPs should undergo gradual upgrading to maintain their existing economic vitality. Medium-term-removed RIPs should further straighten out property rights relationships, especially to find a suitable way to eliminate long-standing illegal constructions. Near-term-removed RIPs should accelerate the progress of their renovation to set an example for other districts of cities. The follow-up investigation conducted in early 2022 confirmed the accuracy of the findings of this paper. Local departments of the Nanhai government provided feedback that 81.43% of the RIPs were planned for redevelopment following the classification results of this study. Despite the representativeness of RIP development in Nanhai District, the authors also suggest that the sample size still needs to be expanded. Furthermore, future studies should continue to focus on how the renewal of RIPs should proceed in the context of the Chinese government’s increasing emphasis on the development of high-tech industries, including chip manufacturing and artificial intelligence.
Author Contributions
Conceptualization, Z.L. and H.W.; methodology, Z.L.; software, H.F., S.X., Y.W., and K.W.; validation, Z.L. and H.F.; formal analysis, Z.L. and H.F.; investigation, H.F., S.X., Y.W., and K.W.; resources, Z.L.; data curation, Z.L. and Z.S.; writing—original draft preparation, Z.L. and H.F.; writing—review and editing, Z.L.; visualization, H.F., S.X., Y.W., and K.W.; supervision, Z.L. and H.W.; project administration, H.F.; funding acquisition, Z.L. and H.W. All authors have read and agreed to the published version of the manuscript.
Funding
This research was funded by National Office for Philosophy and Social Sciences, grant number 21CZZ043; Guangdong Planning Office of Philosophy and Social Science, grant number GD22XMK01; and Guangzhou Planning Office of Philosophy and Social Science, grant number 2019GZGJ56.
Data Availability Statement
Data are contained within the article..
Acknowledgments
The authors would like to thank the anonymous reviewers and editorial staff for their thorough and constructive engagement with this article.
Conflicts of Interest
The authors declare no conflicts of interest.
References
- Admasu, W.F.; Van Passel, S.; Nyssen, J.; Minale, A.S.; Tsegaye, E.A. Eliciting farmers’ preferences and willingness to pay for land use attributes in Northwest Ethiopia: A discrete choice experiment study. Land Use Policy 2021, 109, 105634. [Google Scholar] [CrossRef]
- Peng, J.; Tian, L.; Liu, Y.; Zhao, M.; Hu, Y.; Wu, J. Ecosystem services response to urbanization in metropolitan areas: Thresholds identification. Sci. Total Environ. 2017, 607–608, 706–714. [Google Scholar] [CrossRef] [PubMed]
- Cowie, A.L.; Orr, B.J.; Castillo Sanchez, V.M.; Chasek, P.; Crossman, N.D.; Erlewein, A.; Louwagie, G.; Maron, M.; Metternicht, G.I.; Minelli, S.; et al. Land in balance: The scientific conceptual framework for Land Degradation Neutrality. Environ. Sci. Policy 2018, 79, 25–35. [Google Scholar] [CrossRef]
- Staples, J.H. Urban Renewal: A Comparative Study of Twenty-Two Cities, 1950–1960. West. Political Q. 1970, 23, 294–304. [Google Scholar] [CrossRef]
- Yao, Z.; Tian, L. Transition of Pattern and Modes of Governance for Urban Renewal in Guangzhou since the 21st Century. Shanghai Urban Plan. Rev. 2017, 5, 29–34. (In Chinese) [Google Scholar]
- Zhou, X.; Yang, J.; Wang, S.; Wang, C. Transformation from Mulberry Fish Pond to Industrial Park: A Case Study of Shunde, Guangdong Province. City Plan. Rev. 2018, 42, 33–42. (In Chinese) [Google Scholar]
- Xiong, C.; Zhang, P.; Lin, H. Shunde plans to dismantle more than 80,000 mu of rural industrial parks in three years. Nanfang Daily, 3 January 2020, p. A1.
- People’s Government of Dongguan City. The Implementation Opinions on Accelerating the Transformation and Upgrading of Rural Industrial Parks in Dongguan. Availale online: http://www.dg.gov.cn/zwgk/zfxxgkml/szfbgs/zcwj/qtwj/content/post_3035242.html (accessed on 1 June 2023). (In Chinese).
- North, D.C. Institutions, Institutional Change and Economic Performance; Cambridge University Press: Cambridge, UK, 1990. [Google Scholar]
- Buitelaar, E.; Segeren, A. Urban Structures and Land. The Morphological Effects of Dealing with Property Rights. Hous. Stud. 2011, 26, 661–679. [Google Scholar] [CrossRef]
- Coase, R.H. The Problem of Social Cost. J. Law Econ. 1960, 3, 1–44. [Google Scholar] [CrossRef]
- Williamson, O.E. The Economic Institutions of Capitalism: Firms, Markets, Relational Contracting; Free Press: New York, NY, USA, 1985. [Google Scholar]
- Demsetz, H. Towards a theory of property rights. Am. Econ. Rev. 1967, 57, 347–359. [Google Scholar]
- Kos, S.; Bazell, C.E. The relationship between transaction costs and property rights in urban regeneration. Urban Stud. 2011, 48, 2115–2132. [Google Scholar]
- Lai, Y.; Tang, B. Institutional barriers to redevelopment of urban villages in China: A transaction cost perspective. Land Use Policy 2016, 58, 482–490. [Google Scholar] [CrossRef]
- Yang, G.; Xu, C. Breakthroughs and Limitations of Urban Renewal Marketization—Based on the Perspective of Transaction Costs. City Plan. Rev. 2016, 40, 32–38. (In Chinese) [Google Scholar]
- Lai, Y.; Tang, B.; Chen, X.; Zheng, X. Spatial determinants of land redevelopment in the urban renewal processes in Shenzhen, China. Land Use Policy 2021, 103, 15330. [Google Scholar] [CrossRef]
- Enserink, B.; Koppenjan, J. Public participation in China: Sustainable urbanization and governance. Manag. Environ. Qual. 2007, 18, 459–474. [Google Scholar] [CrossRef]
- Tang, B.; Wong, S.; Lau, M.C. Social impact assessment and public participation in China: A case study of land requisition in Guangzhou. Environ. Impact Assess. Rev. 2008, 28, 57–72. [Google Scholar] [CrossRef]
- Li, T.H.; Ng, S.T.; Skitmore, M. Public participation in infrastructure and construction projects in China: From an EIA-based to a whole-cycle process. Habitat Int. 2012, 36, 47–56. [Google Scholar] [CrossRef]
- Akita, T.; Fujita, M. Spatial development processes with renewal in a growing city. Environ. Plan. A 1982, 14, 205–223. [Google Scholar] [CrossRef]
- Schall, L.D. Urban renewal policy and economic efficiency. Am. Econ. Rev. 1976, 66, 612–628. [Google Scholar]
- Couch, C.; Dennemann, A. Urban regeneration and sustainable development in Britain: The example of the Liverpool Ropewalks Partnership. Cities 2000, 17, 137–147. [Google Scholar] [CrossRef]
- Vallance, S.; Perkins, H.C.; Dixon, J.E. What is social sustainability? A clarification of concepts. Geoforum 2011, 14, 342–348. [Google Scholar] [CrossRef]
- Park, S.O. Networks and embeddedness in the dynamic types of new industrial districts. Prog. Hum. Geogr. 1996, 20, 476–493. [Google Scholar] [CrossRef]
- Haskins, C. Multidisciplinary investigation of eco-industrial parks. Syst. Eng. 2006, 9, 313–330. [Google Scholar] [CrossRef]
- Zhuang, T.; Qian, Q.K.; Visscher, H.J.; Elsinga, M.G. An analysis of urban renewal decision-making in China from the perspective of transaction costs theory: The case of Chongqing. J. Hous. Built Environ. 2020, 35, 1177–1199. [Google Scholar] [CrossRef]
- Chan, E.; Lee, G.K.L. Critical factors for improving social sustainability of urban renewal projects. Soc. Indic. Res. 2008, 85, 243–256. [Google Scholar] [CrossRef]
- Kylili, A.; Fokaides, P.A.; Jimenez, P.A.L. Key Performance Indicators (KPIs) approach in buildings renovation for the sustainability of the built environment: A review. Renew. Sustain. Energy Rev. 2016, 56, 906–915. [Google Scholar] [CrossRef]
- Zheng, S.; Long, F.; Fan, C.C.; Gu, Y. Urban villages in China: A 2008 survey of migrant settlements in Beijing. Eurasian Geogr. Econ. 2009, 50, 425–446. [Google Scholar] [CrossRef]
- Sui Pheng, L. The Conceptual Relationship between Construction Quality and Economic Development. Int. J. Qual. Reliab. Manag. 1993, 10, 18–30. [Google Scholar] [CrossRef]
- Soltani, K. Redeveloping Tehran: A Study of Piecemeal Versus Comprehensive Redevelopment of Run-Down Areas; Springer: Cham, Switzerland, 2022. [Google Scholar]
- Couch, C.; Sykes, O.; Börstinghaus, W. Thirty years of urban regeneration in Britain, Germany and France: The importance of context and path dependency. Prog. Plan. 2011, 1, 1–52. [Google Scholar] [CrossRef]
- Erfani, G.; Roe, M. Institutional stakeholder participation in urban redevelopment in Tehran: An evaluation of decisions and actions. Land Use Policy 2020, 91, 104367. [Google Scholar] [CrossRef]
- McTague, C.; Jakubowski, S. Marching to the beat of a silent drum: Wasted consensus-building and failed neighborhood participatory planning. Appl. Geogr. 2013, 44, 182–191. [Google Scholar] [CrossRef]
- Reimann, B. The transition from people’s property to private property: Consequences of the restitution principle for urban development and urban renewal in East Berlin’s inner-city residential areas. Appl. Geogr. 1997, 17, 301–313. [Google Scholar] [CrossRef]
- Jo Black, K.; Richards, M. Eco-gentrification and who benefits from urban green amenities: NYC’s high Line. Landsc. Urban Plan. 2020, 204, 103. [Google Scholar] [CrossRef]
- Livingstone, N.; Fiorentino, S.; Short, M. Planning for residential ‘value’ ? London’s densification policies and impacts. Build. Cities 2021, 2, 203–219. [Google Scholar] [CrossRef]
- Skevington, S.M.; Lotfy, M.; O’Connell, K.A. The World Health Organization’s WHOQOL-BREF quality of life assessment: Psychometric properties and results of the international field trial. A Report from the WHOQOL Group. Qual. Life Res. 2004, 13, 299–310. [Google Scholar] [CrossRef]
- Mohit, M.A.; Ibrahim, M.; Rashid, Y.R. Assessment of residential satisfaction in newly designed public low-cost housing in Kuala Lumpur, Malaysia. Habitat Int. 2010, 34, 18–27. [Google Scholar] [CrossRef]
- Guo, B.; Li, Y.; Wang, J. The improvement strategy on the management status of the old residence community in Chinese cities: An empirical research based on social cognitive perspective. Cogn. Syst. Res. 2018, 52, 556–570. [Google Scholar] [CrossRef]
- Schleich, L.M. Takings: The Fifth Amendment, Government Regulation, and the Problem of the Relevant Parcel. J. Land Use Environ. Law 1993, 8, 381–411. [Google Scholar]
- Pritchett, W.E. The “Public Menace” of Blight: Urban Renewal and the Private Uses of Eminent Domain. Yale Law Policy Rev. 2003, 21, 1–52. [Google Scholar]
- Kelly, J.J. “We Shall Not Be Moved”: Urban Communities, Eminent Domainand the Socioeconomics of Just Compensation. St. John’s Law Rev. 2006, 80, 923–990. [Google Scholar]
- Hoops, B. Expropriation Procedures in Germany and the Netherlands: Ready for the Voluntary Guidelines on the Responsible Governance of Tenure? Eur. Prop. Law J. 2016, 5, 3–26. [Google Scholar] [CrossRef]
- Zhu, J. Urban Development under Ambiguous Property Rights: A Case of China’s Transition Economy. Int. J. Urban Reg. Res. 2002, 26, 41–57. [Google Scholar] [CrossRef]
- Li, D.D. A Theory of Ambiguous Property Rights in Transition Economies: The Case of the Chinese Non-State Sector. J. Comp. Econ. 1996, 23, 1–19. [Google Scholar] [CrossRef]
- Nanhai District Bureau of Statistics. Statistical Bulletin on Economic and Social Development of Nanhai District, Foshan City, 2022. Available online: http://www.nanhai.gov.cn/fsnhq/bmdh/zfbm/qtjj/tjgb/content/post_5663588.html (accessed on 20 August 2023). (In Chinese).
|
Disclaimer/Publisher’s Note: The statements, opinions and data contained in all publications are solely those of the individual author(s) and contributor(s) and not of MDPI and/or the editor(s). MDPI and/or the editor(s) disclaim responsibility for any injury to people or property resulting from any ideas, methods, instructions or products referred to in the content. |
© 2023 by the authors. Licensee MDPI, Basel, Switzerland. This article is an open access article distributed under the terms and conditions of the Creative Commons Attribution (CC BY) license (http://creativecommons.org/licenses/by/4.0/).
