Submitted:
22 November 2023
Posted:
28 November 2023
You are already at the latest version
Abstract
Keywords:
1. Introduction
2. Materials and Methods
2.1. Oil Samples
2.2. Spectroscopic Analysis
2.3. Data Treatment
3. Results and Discussion
3.1. Unsupervised Pattern Recognition Methods
3.1.1. Hierarchical Cluster Analysis of Raman Edible Vegetable Oils Fingerprints
3.1.2. Principal Component Analysis
3.2. Supervised Pattern Recognition Methods
Conclusions
Author Contributions
References
- Long, R.; Gulya, T.; Light, S.; Bali, K.; Mathesius, K.; Meyer, R. D. Sunflower Hybrid Seed Production in California. Available on-line: https://escholarship.org/uc/item/14k450p6 (last accessed 11/11/2023).
- European Commission, Directorate-General for Agriculture and Rural Development, EU agricultural outlook for markets, income and environment 2021-2031, Publications Office of the European Union, 2021. Available on-line: https://data.europa.eu/doi/10.2762/753688 (last accessed 11/11/2023).
- Praveen, H. G.; Nagarathna, T. K.; Gayithri, M.; Patil, M. I. Genetic Variability for Seed Yield, Oil Content and Fatty Acid Composition in Germplasm Accessions of Sunflower (Helianthus annuus L.) and their Response to Different Seasons. Int. J. Curr. Microbiol. App. Sci. 2018, 7(6), pp. 2120-2129. [CrossRef]
- Salas, J. J.; Martínez-Force, E.; Harwood, J. L.; Venegas-Calerón, M.; Aznar-Moreno, J. A.; Moreno-Pérez, A. J.; Ruíz-López, N.; Serrano-Vega, M. J.; Graham, I. A.; Mullen, R. T.; Garcés, R. Biochemistry of high stearic sunflower, a new source of saturated fats. Prog. Lipid Res. 2014, 55, pp. 30-42. [CrossRef]
- Salas, J. J.; Bootello, M. A.; Garcés, R. Food Uses of Sunflower Oils. In Sunflower Chemistry, Production, Processing, and Utilization. Salas J. J.; Enrique, M. F.; Dunford, N. T. (Eds.) AOCS Press, Champaign, IL, 2015, pp. 441-464. [CrossRef]
- Harún, M. Fatty Acid Composition of Sunflower in 31 Inbreed and 28 Hybrid. Biomed. J. Sci. Technol. Res. 2019, 16(3), pp.12032-12038. [CrossRef]
- Zambelli, A.; León, A.; Garcés, R. Mutagenesis in sunflower. In Sunflower. American Oil Chemist’s Society Press.: Nueva York, United States of America, 2015, pp. 27-52.
- Anushree, S.; André, M.; Guillaume, D. et al. Stearic sunflower oil as a sustainable and healthy alternative to palm oil. A review. Agron Sustain Dev. 2017, 37 (18), pp. 1-10. [CrossRef]
- Esteki, M.; Simal-Gandara, J.; Shahsavari, Z.; Zandbaaf, S.; Dashtaki, E.; Vander Heyden, Y. A review on the application of chromatographic methods, coupled to chemometrics, for food authentication. Food Control, 2018, 93, pp. 165-182. [CrossRef]
- Jiménez-Carvelo, A. M.; Pérez-Castaño, E.; González-Casado, A.; Cuadros-Rodríguez, L. One input-class and two input-class classifications for differentiating olive oil from other edible vegetable oils by use of the normal-phase liquid chromatography fingerprint of the methyl trans esterified fraction. Food Chem. 2017, 221, pp. 1784-1791. [CrossRef]
- Sherma, J.; Rabel, F. A review of thin layer chromatography methods for determination of authenticity of foods and dietary supplements. J. Liq. Chromatogr. Relat. Technol. 2018, 41(10), pp. 645-657. [CrossRef]
- International Olive Council. Determination of the sterol composition and content and alcoholic compounds by capillary gas chromatography. COI/T.20/Doc. No 26/Rev. 4, 2018.
- Carranco, N.; Farrés-Cebrián, M.; Saurina, J.; Núñez, O. Authentication and quantitation of fraud in extra virgin olive oils based on HPLC-UV fingerprinting and multivariate calibration. Foods, 2018, 7 (4), pp. 1-15. [CrossRef]
- International Olive Council. Method of analysis. Difference between actual and theoretical content of triacyclglycerols with ECN 42. COI/T.20/Doc. No 20/Rev. 4, 2017.
- International Olive Council. Method of analysis. Determination of fatty acid methyl esters by gas chromatography. COI/T.20/Doc. No 33/Rev. 4, 2017.
- Ruiz-Samblás, C.; González-Casado, A.; Cuadros-Rodríguez, L. Triacylglycerols determination by high-temperature gas chromatography in the analysis of vegetable oils and foods: a review of the past 10 years. Crit. Rev. Food Sci. Nutr., 2015, 55 (11), pp.1618-1631. [CrossRef]
- Gómez-Caravaca, A. M.; Maggio, R. M.; Cerretani, L. Chemometric applications to assess quality and critical parameters of virgin and extra-virgin olive oil. A review. Anal. Chim. Acta, 2016, 913, pp. 1-21. [CrossRef]
- Casale, M.; Simonetti, R. Review: Near infrared spectroscopy for analysing olive oils. J. Near Infrared Spectrosc. 2014, 22, pp. 59-80. [CrossRef]
- Jiménez-Sanchidrián, C.; Ruiz, J. R. Use of Raman spectroscopy for analyzing edible vegetable oils. Appl. Spectrosc. Rev. 2016, 51 (5), pp. 417-430. [CrossRef]
- Chen, J.; Zhao, Y.; Wu, R.; Yin, T.; You, J.; Hu, B.; Jia, C.; Rong, J; Liu, R.; Zhang, B.; et al. Changes in the Quality of High-Oleic Sunflower Oil during the Frying of Shrimp (Litopenaeus vannamei) Foods 2023, 12(6), 1332, pp. 1-14. [CrossRef]
- Arroyo-Cerezo, A.; Jiménez-Carvelo, A. M.; González-Casado, A.; Koidis, A.; Cuadros-Rodríguez, L. Deep (offset) non-invasive Raman spectroscopy for the evaluation of food and beverages – A review. LWT, 2021, 149, 111822, pp. 1-8. [CrossRef]
- Cuadros-Rodríguez, L.; Ruiz-Samblás, C.; Valverde-Som, L.; Pérez-Castaño, E.; González-Casado, A. Chromatographic fingerprinting: An innovative approach for food 'identitation' and food authentication - A tutorial. Anal. Chim. Acta, 2016, 909, pp. 9-23. [CrossRef]
- Cuadros-Rodríguez, L.; Ortega-Gavilán, F.; Martín-Torres, S.; Arroyo-Cerezo, A.; Jiménez-Carvelo, A. M. Chromatographic Fingerprinting and Food Identity/Quality: Potentials and Challenges. J. Agric. Food Chem. 2021, 69, pp. 14428−14434. [CrossRef]
- Szymańska, E. Modern data science for analytical chemical data – a comprehensive review. Analytica Chimica Acta 2018, 1028, pp. 1–10. [CrossRef]
- Mialon, N.; Roig, B.; Capodanno, E.; Cadiere, A. Untargeted metabolomic approaches in food authenticity: A review that showcases biomarkers. Food Chem. 2023, 398, 133856, pp. 1-12. [CrossRef]
- Chemometrics vs Machine Learning. Available on-line: https://ondalys.fr/en/scientific-resources/chemometrics-vs-machine-learning/ (accessed on 11/10/2023).
- Bikrani, S.; Jiménez-Carvelo, A. M.; Nechar, M.; Bagur-González, M. G.; Souhail, B.; Cuadros-Rodríguez, L. Authentication of the geographical origin of margarines and fat-spread products from liquid chromatographic UV-absorption fingerprints and chemometrics. Foods 2019, 8(11), 588, pp. 1-12. [CrossRef]
- Pérez-Castaño, E.; Medina-Rodríguez, S.; Bagur-González, M. G. Discrimination and classification of extra virgin olive oil using a chemometric approach based on TMS-4,4′-desmetylsterols GC(FID) fingerprints of edible vegetable oils. Food Chemistry, 2019, 274, pp. 518–525. [CrossRef]
- Ortega-Gavilán, F.; Jiménez-Carvelo, A. M.; Cuadros-Rodríguez, L.; Bagur-González, M. G. The chromatographic similarity profile – An innovative methodology to detect fraudulent blends of virgin olive oils. J. Chromatogr. A. 2022, 1679, 463378, pp. 1-12. [CrossRef]
- Guerrero-Chanivet, M.; Ortega-Gavilán, F. Bagur-González, M. G.; Valcárcel-Muñoz, M. J.; García-Moreno, M. V.; Guillén-Sánchez, D. A. Pattern Recognition of GC-FID Profiles of Volatile Compounds in Brandy de Jerez Using a Chemometric Approach Based on Their Instrumental Fingerprint. Food Bioprocess Technol. 2023, 16, pp. 1963-1975. [CrossRef]
- Guerrero-Chanivet, M.; Ortega-Gavilán, F. Bagur-González, M. G.; Valcárcel-Muñoz, M. J.; García-Moreno, M. V.; Guillén-Sánchez, D. A. Influence of Oak Species, Toasting Degree, and Aging Time on the Differentiation of Brandies Using a Chemometrics Approach Based on Phenolic Compound UHPLC Fingerprints. J. Agric. Food Chem. 2023, XXXX, XXX, XXX-XXX. [CrossRef]
- Ellis, D. I.; Eccles, R.; Xu, Y.; Griffen, J.; Muhamadali, H.; Matousek, P.; Goodall, I.; Goodacre, R. Through-Container, Extremely Low Concentration Detection of Multiple Chemical Markers of Counterfeit Alcohol Using a Handheld SORS Device. Sci. Rep. 2017, 7 (1), pp. 1-8. [CrossRef]
- Schorn-García, D.; Ezenarro, J.; Aceña, L.; Busto, O.; Boqué, R.; Giussani, B.; Mestres, M. Spatially Offset Raman Spectroscopic (SORS) Analysis of Wine Alcoholic Fermentation: A Preliminary Study. Ferment. 2023, 9(2), 115, pp.1-12. [CrossRef]
- Ostovar Pour, S.; Afshari, R.; Landry, J.; Pillidge, C.; Gill, H.; Blanch, E. Spatially offset Raman spectroscopy: A convenient and rapid tool to distinguish cheese made with milks from different animal species. J. Raman Spectrosc. 2021, 52(10), pp. 1705-1711. [CrossRef]
- Arroyo-Cerezo, A.; Jiménez-Carvelo, A. M.; González-Casado, A.; Ruisánchez, I.; Cuadros-Rodríguez, L. The potential of the spatially offset Raman spectroscopy (SORS) for implementing rapid and non-invasive in-situ authentication methods of plastic-packaged commodity foods – Application to sliced cheeses. Food Control, 2023, 146, 109522, pp.1-8. [CrossRef]
- Jiménez-Carvelo, A. M.; Arroyo-Cerezo, A.; Bikrani, S.; Jia, W.; Koidis, A.; Cuadros-Rodríguez, L. Rapid and non-destructive spatially offset Raman spectroscopic analysis of packaged margarines and fat-spread products. Microchem. J. 2022, 178, 107378, pp.1-13. [CrossRef]
- Varnasseri, M.; Muhamadali, H.; Xu, Y.; Richardson, P. I. C.; Byrd, N.; Ellis, D. I.; Matousek, P.; Goodacre, R. Portable through Bottle SORS for the Authentication of Extra Virgin Olive Oil. Applied. Sciences. 2021, 11(18), 8347, pp.1-13. [CrossRef]
- Araújo, G. A.; Azcarate, S. M.; Špánik, I.; Khvalbota, L.; Goicoechea, H. C. Pattern recognition techniques in food quality and authenticity: a guide on how to process multivariate data in food analysis. TrAC Trends Anal. Chem. 2023, 164, 117105, pp.1-26. [CrossRef]
- Zhang, L.; Li, P.; Sun, X.; Wang, X.; Xu, B.; Wang, X.; Ma, F.; Zhang, Q.; Ding, X. Classification and Adulteration Detection of Vegetable Oils Based on Fatty Acid Profiles. J. Agric. Food Chem. 2014, 62 (34), pp. 8745–8751. [CrossRef]
- Kennard, R.; Stone, L. Computer Aided Design of Experiments. Technometrics, 1969, 11(1), pp. 137-148. [CrossRef]
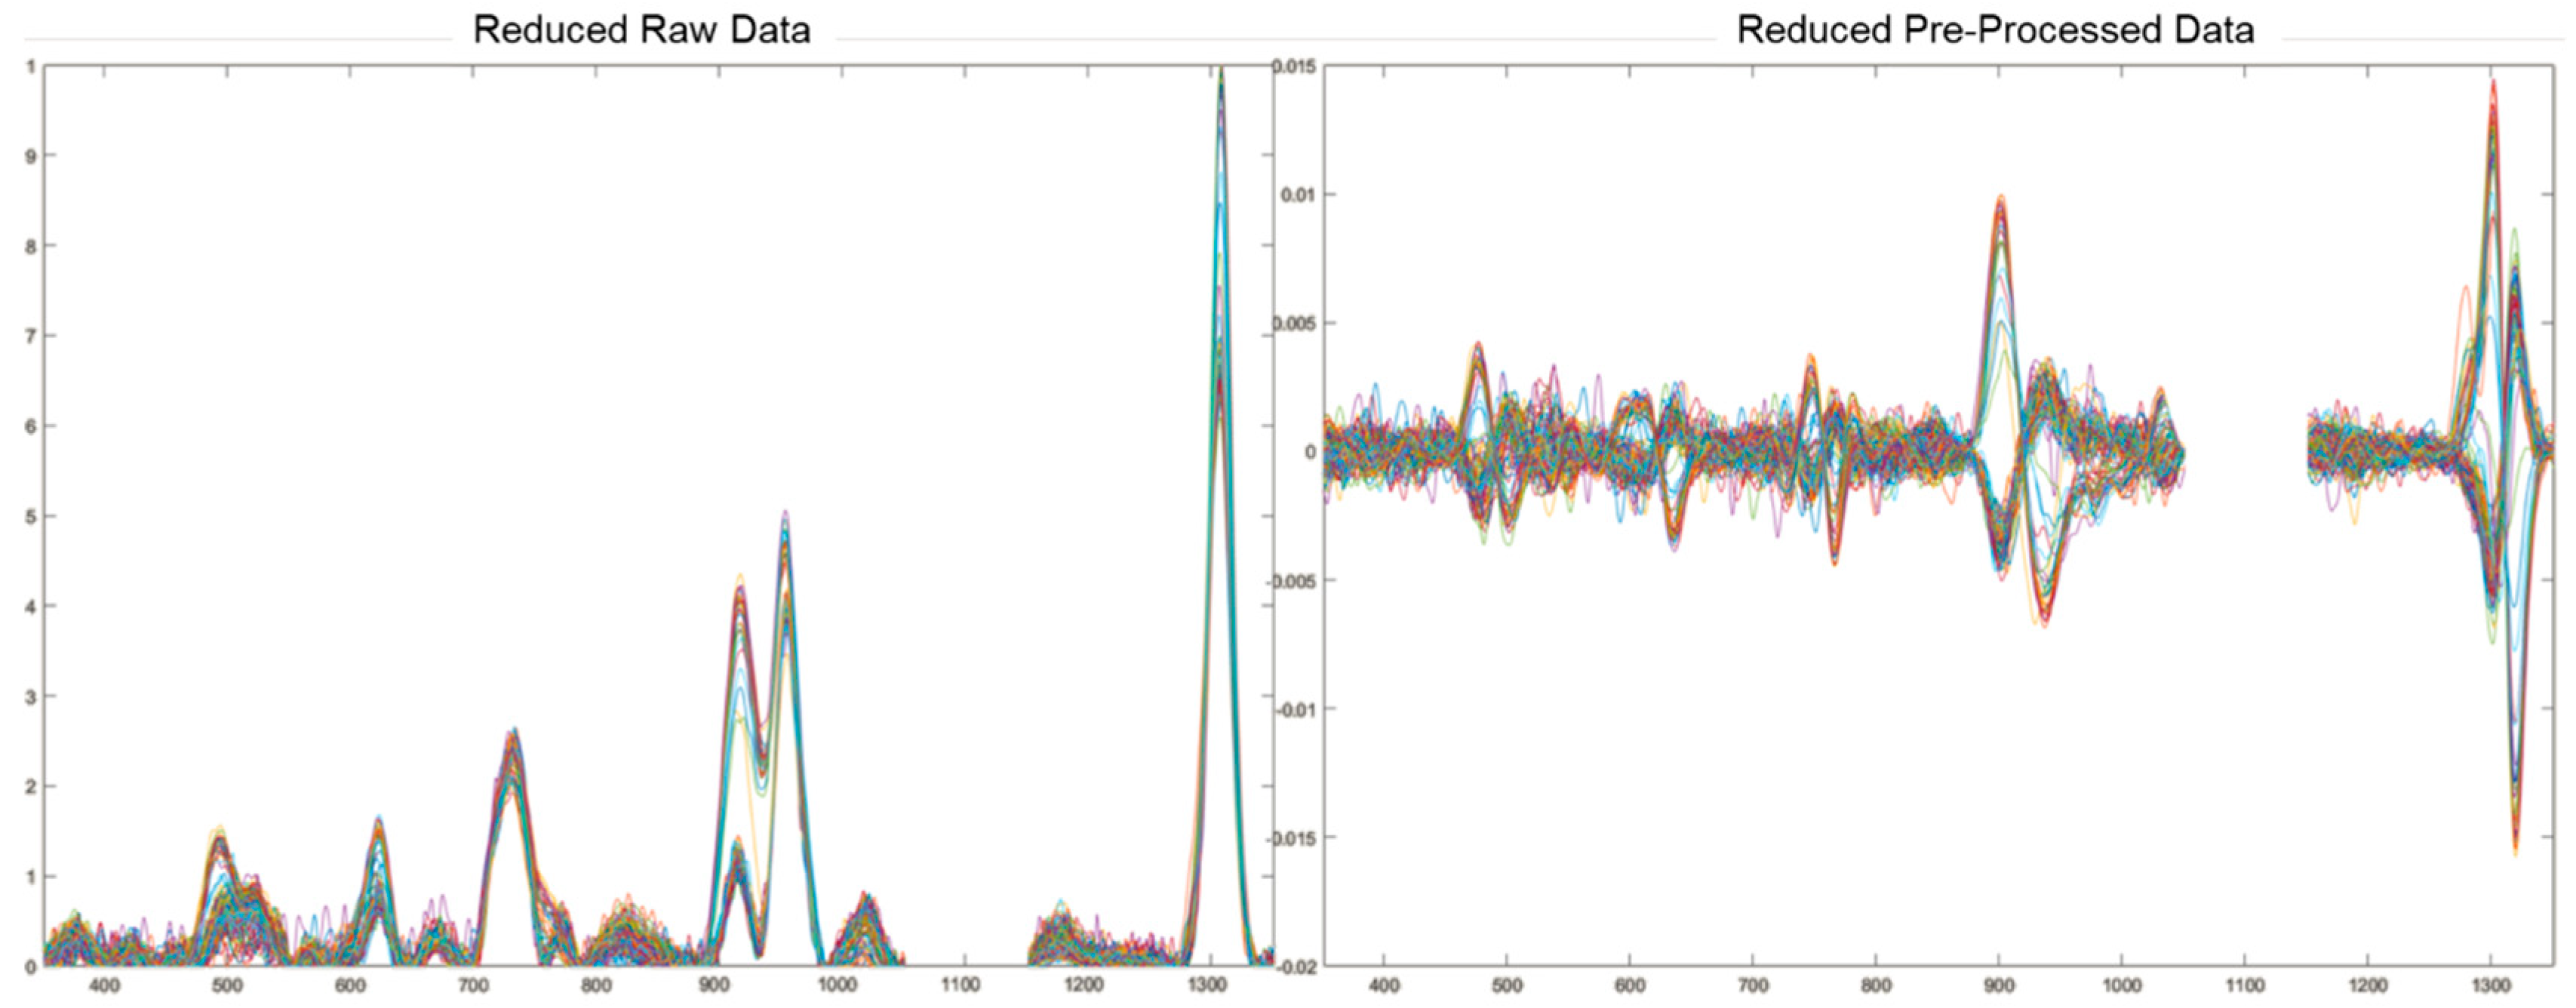
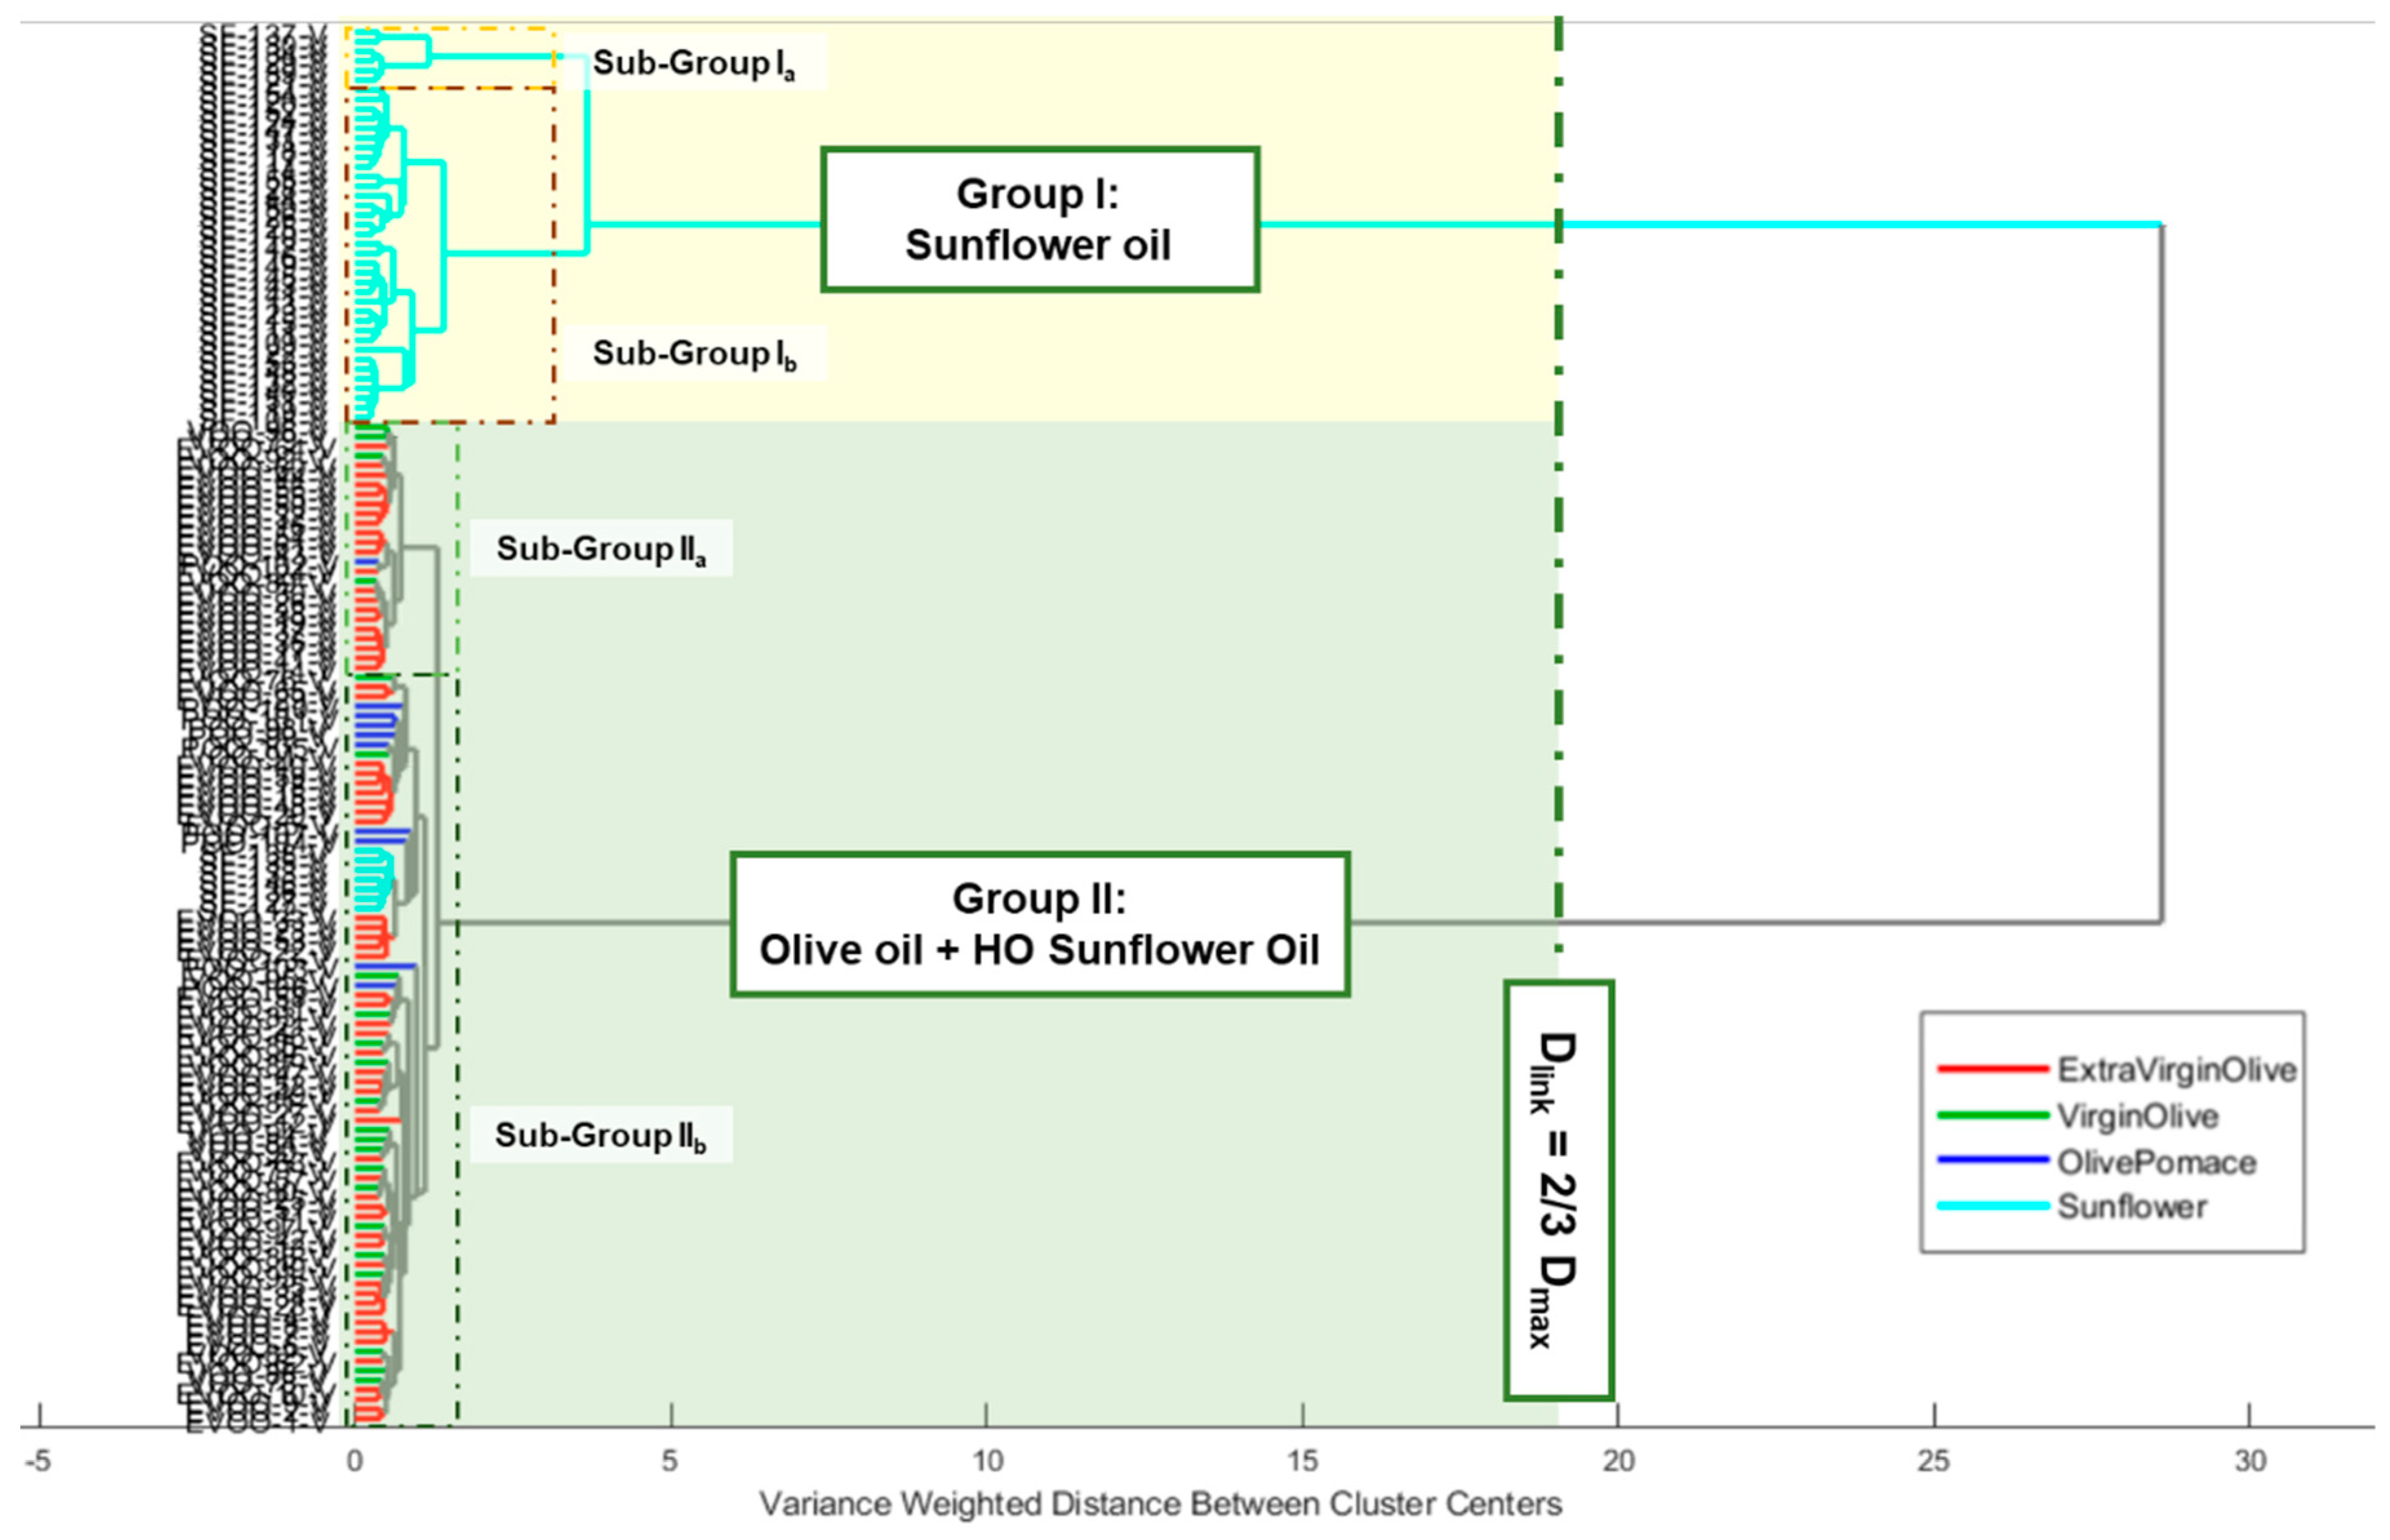
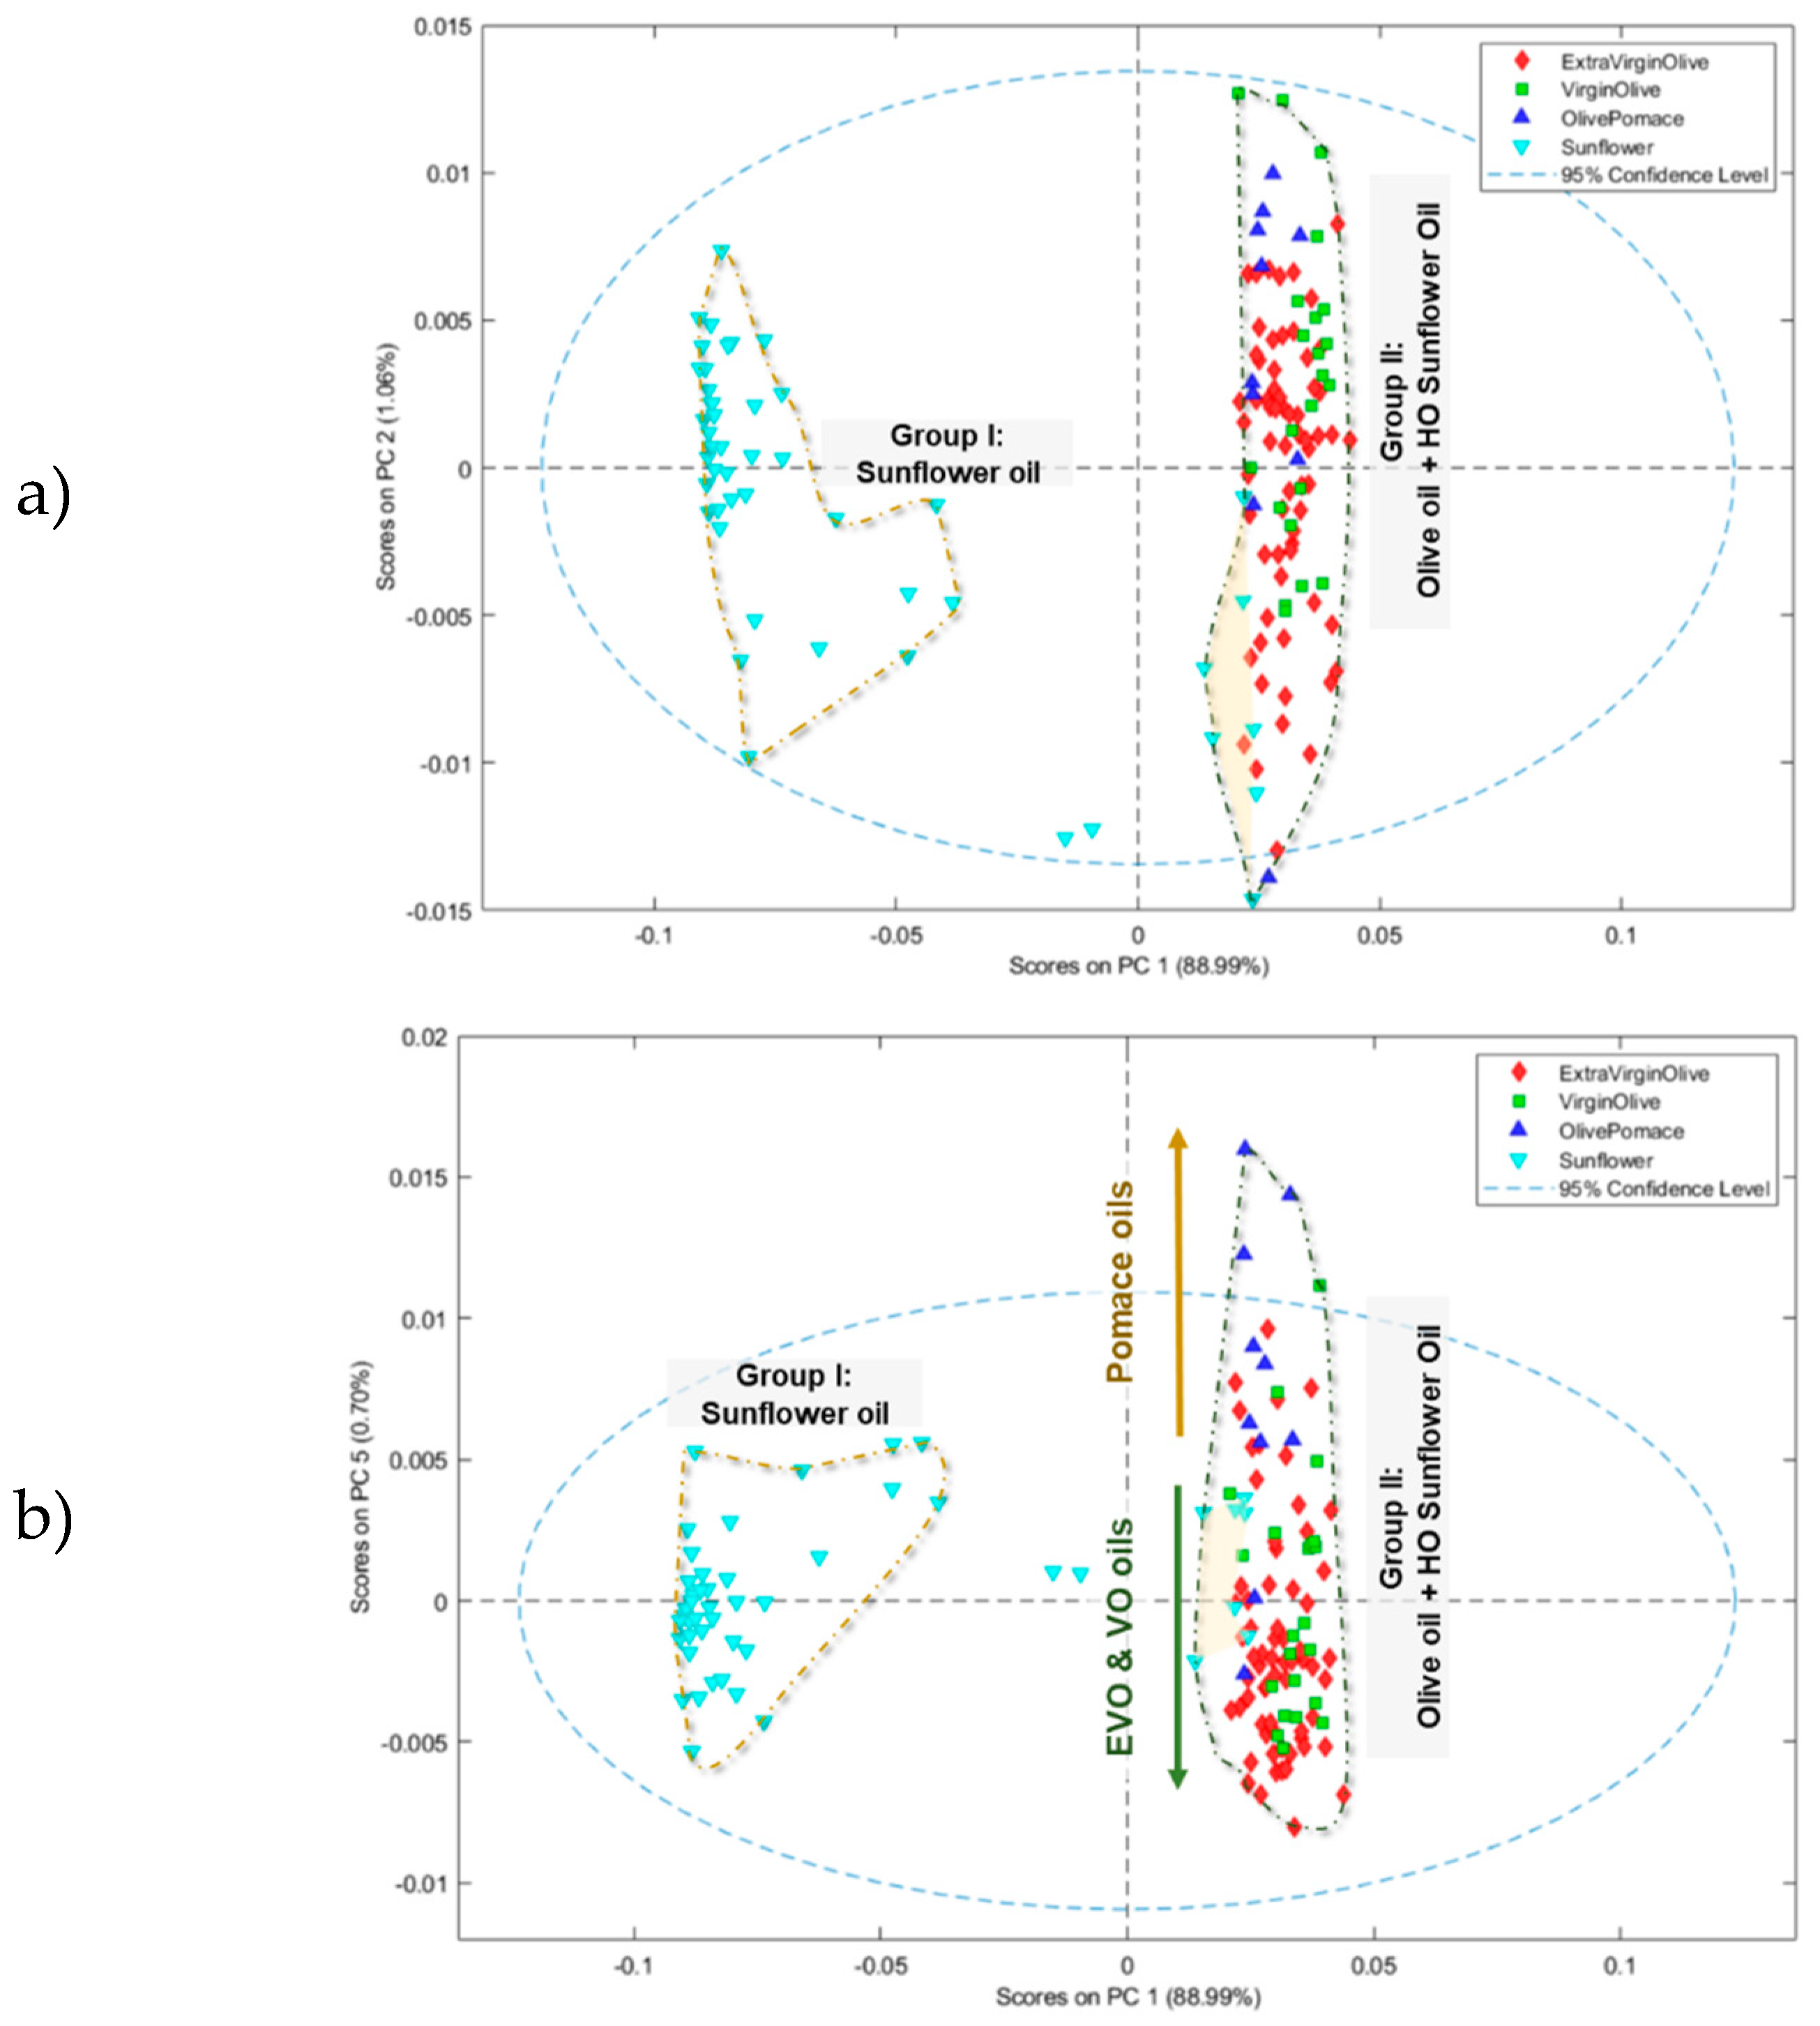
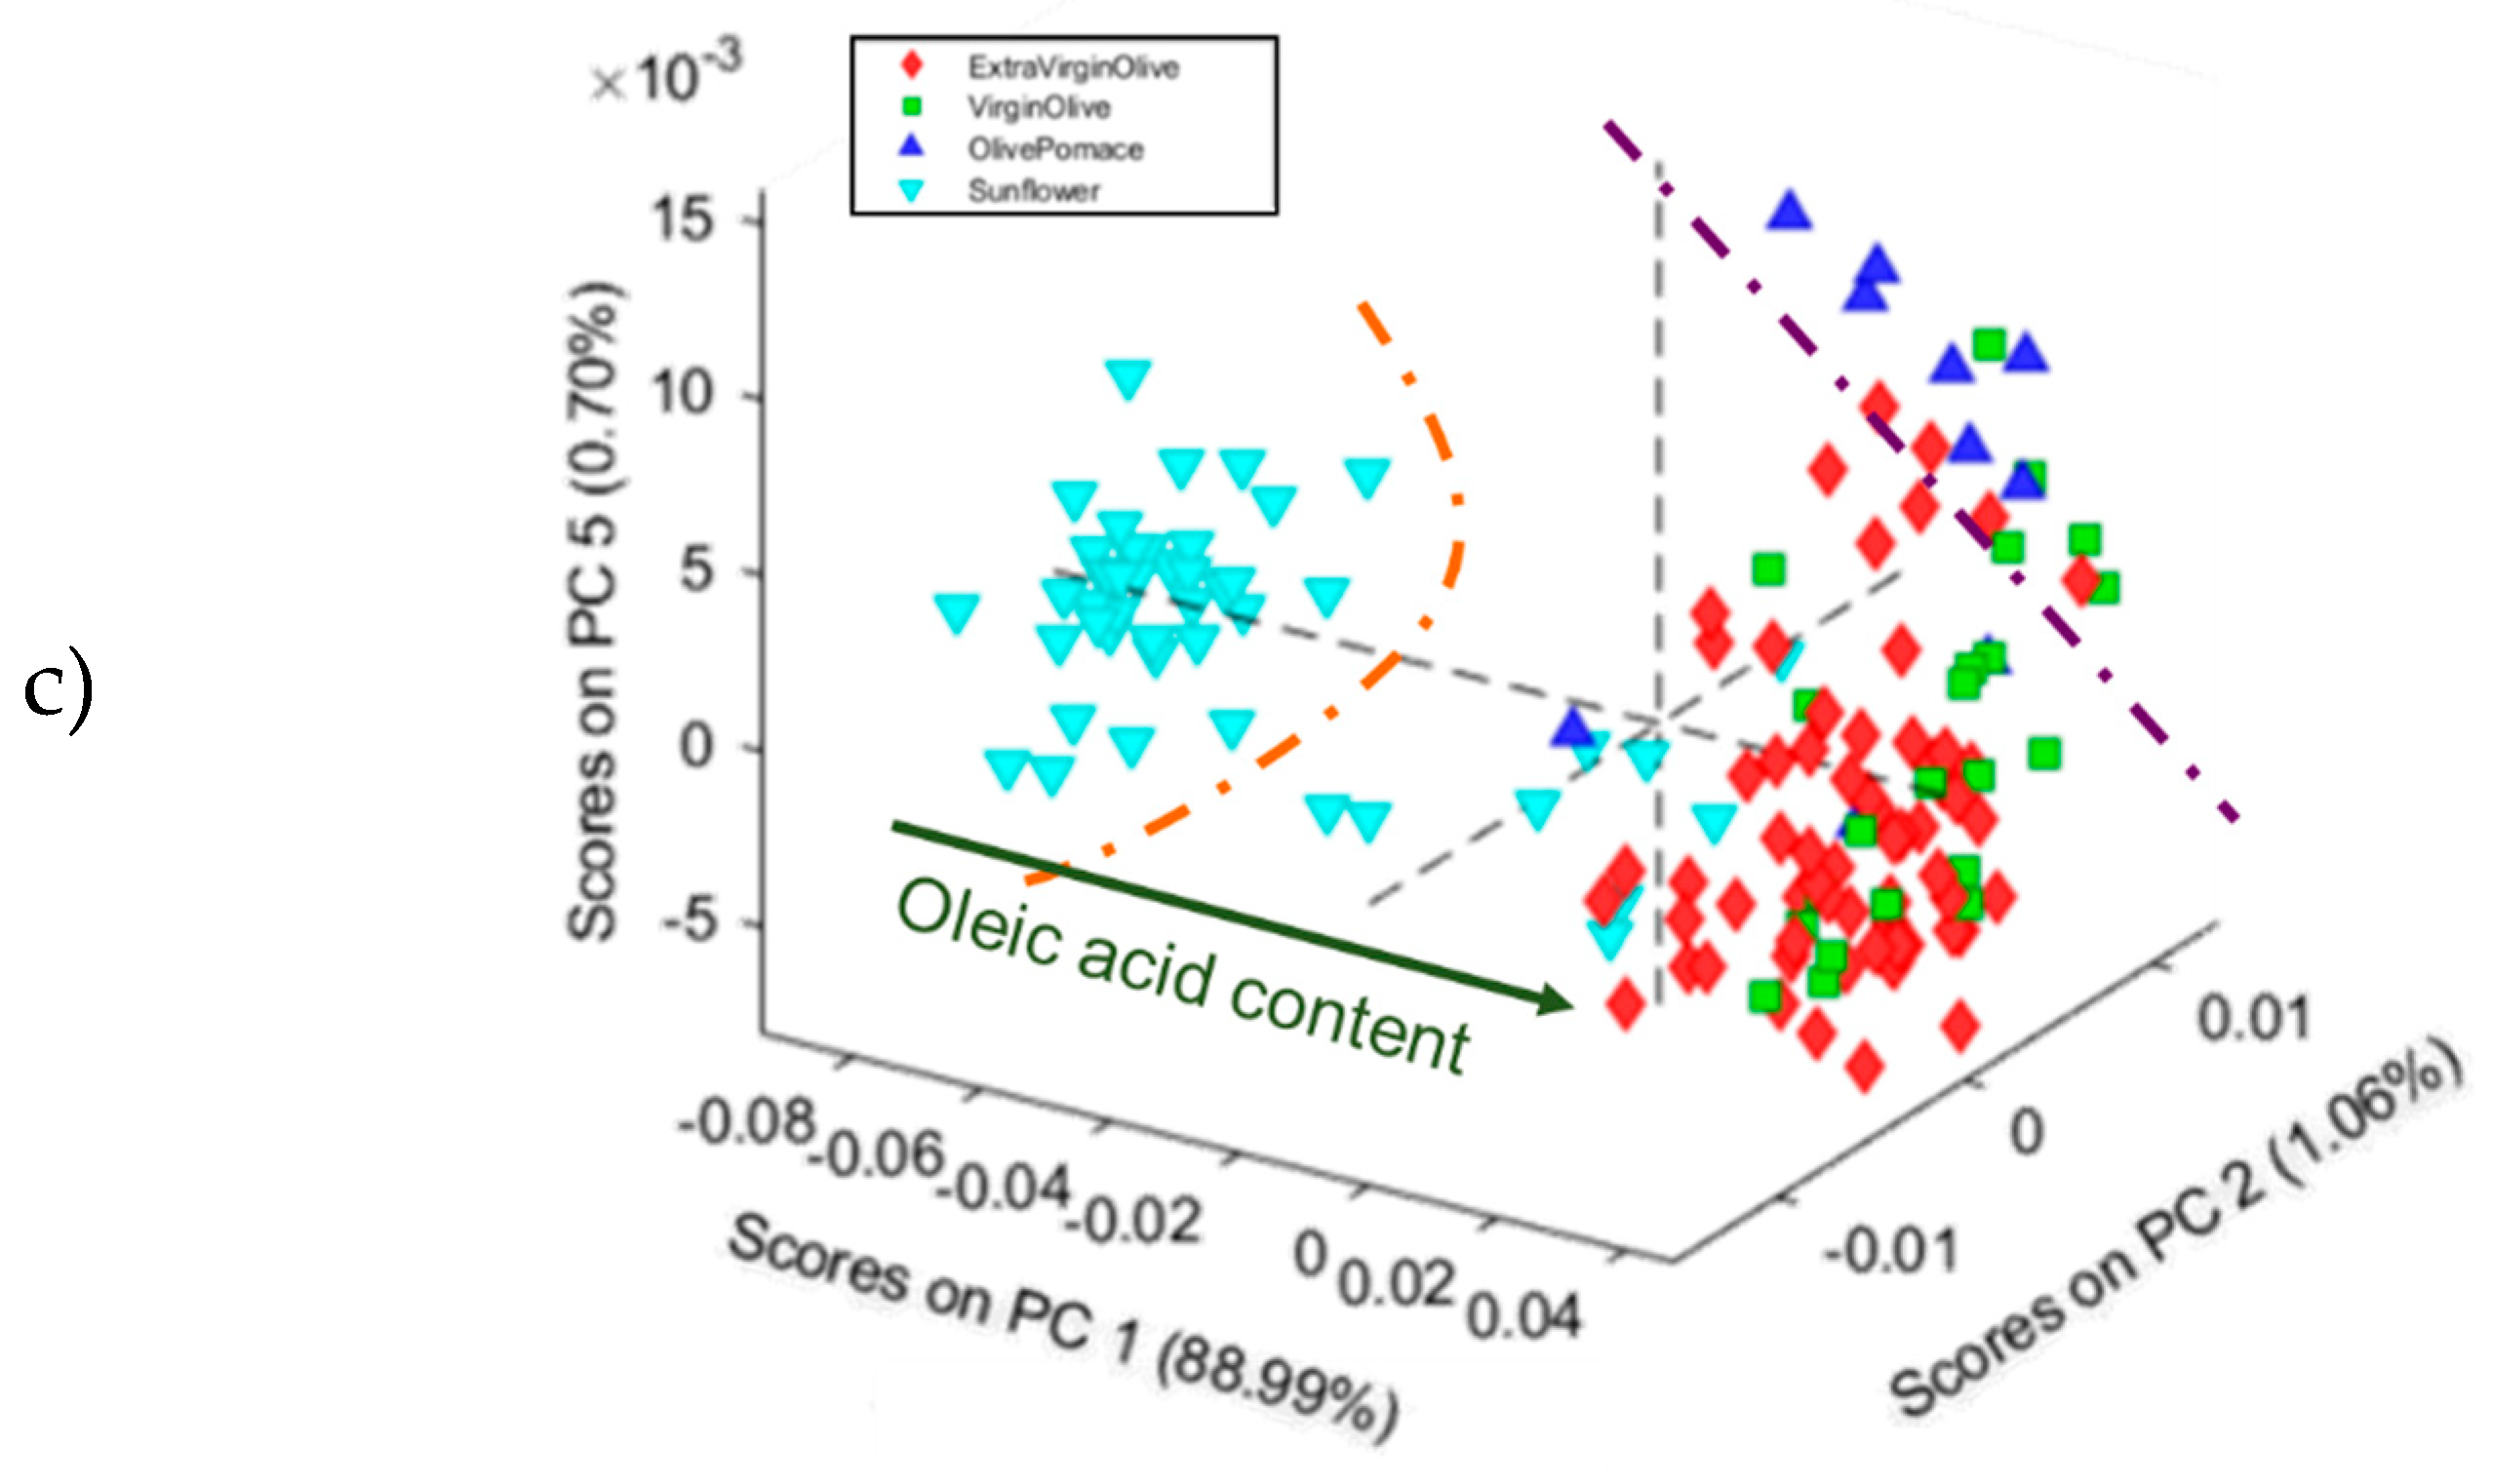
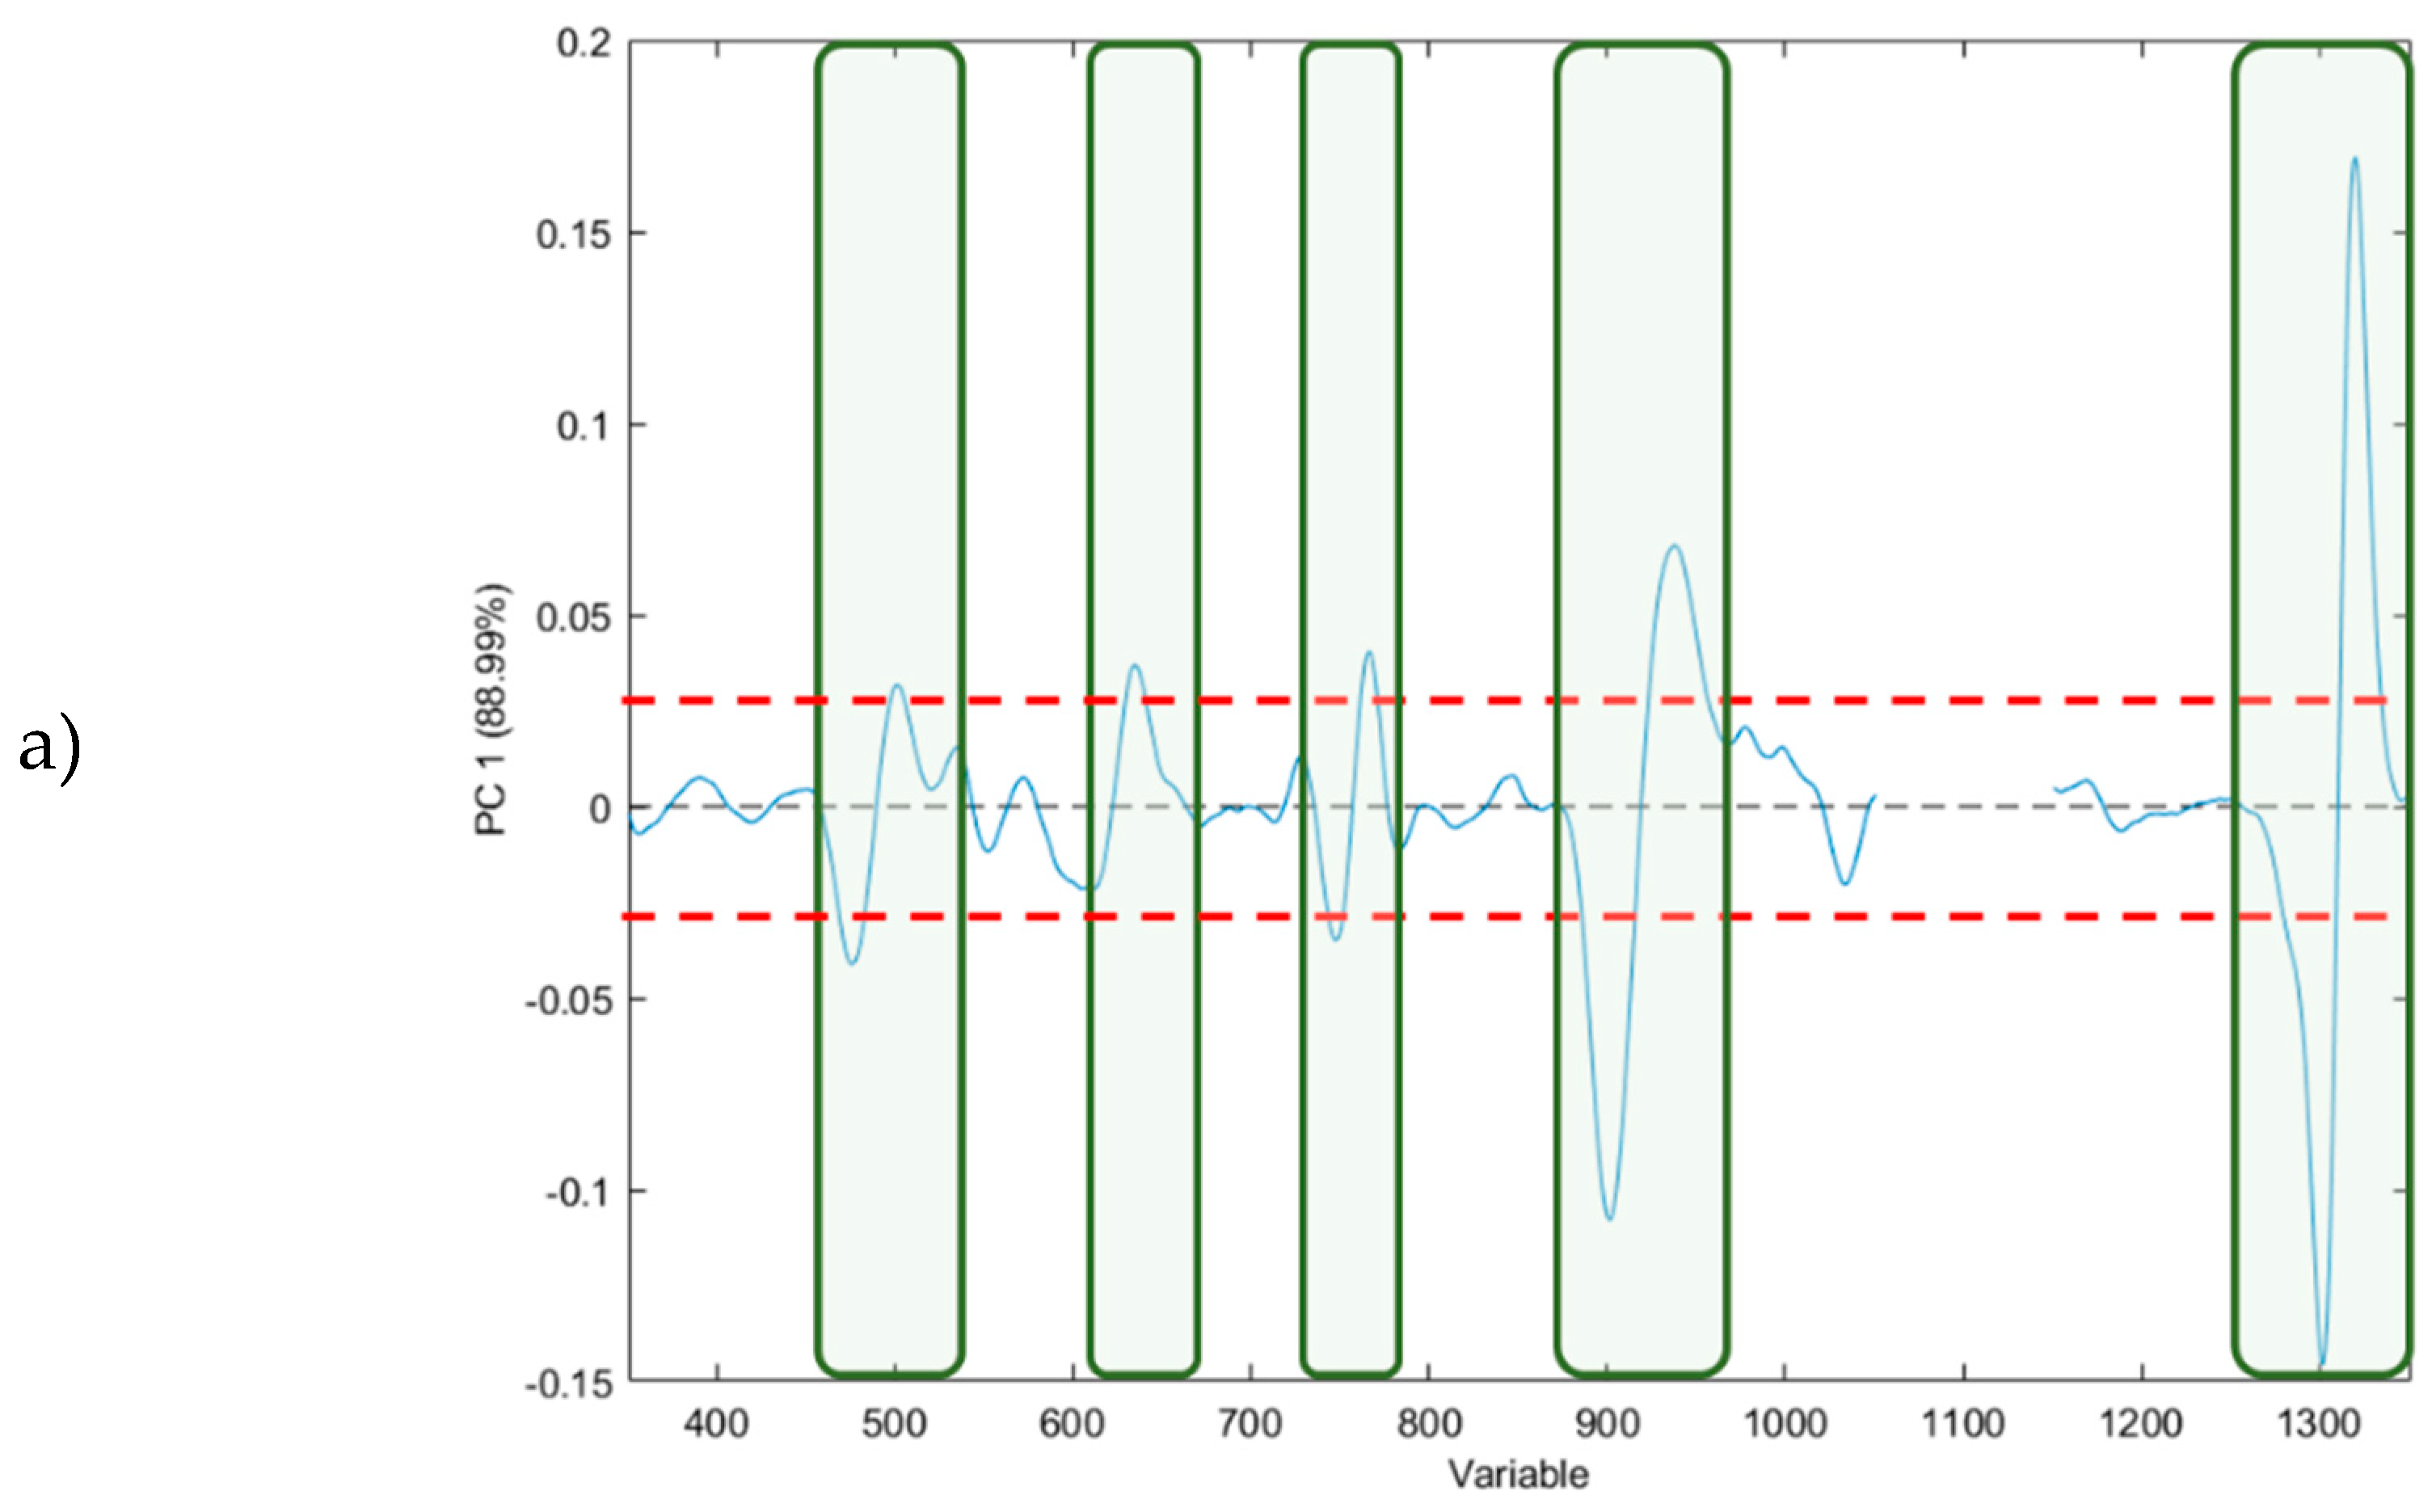
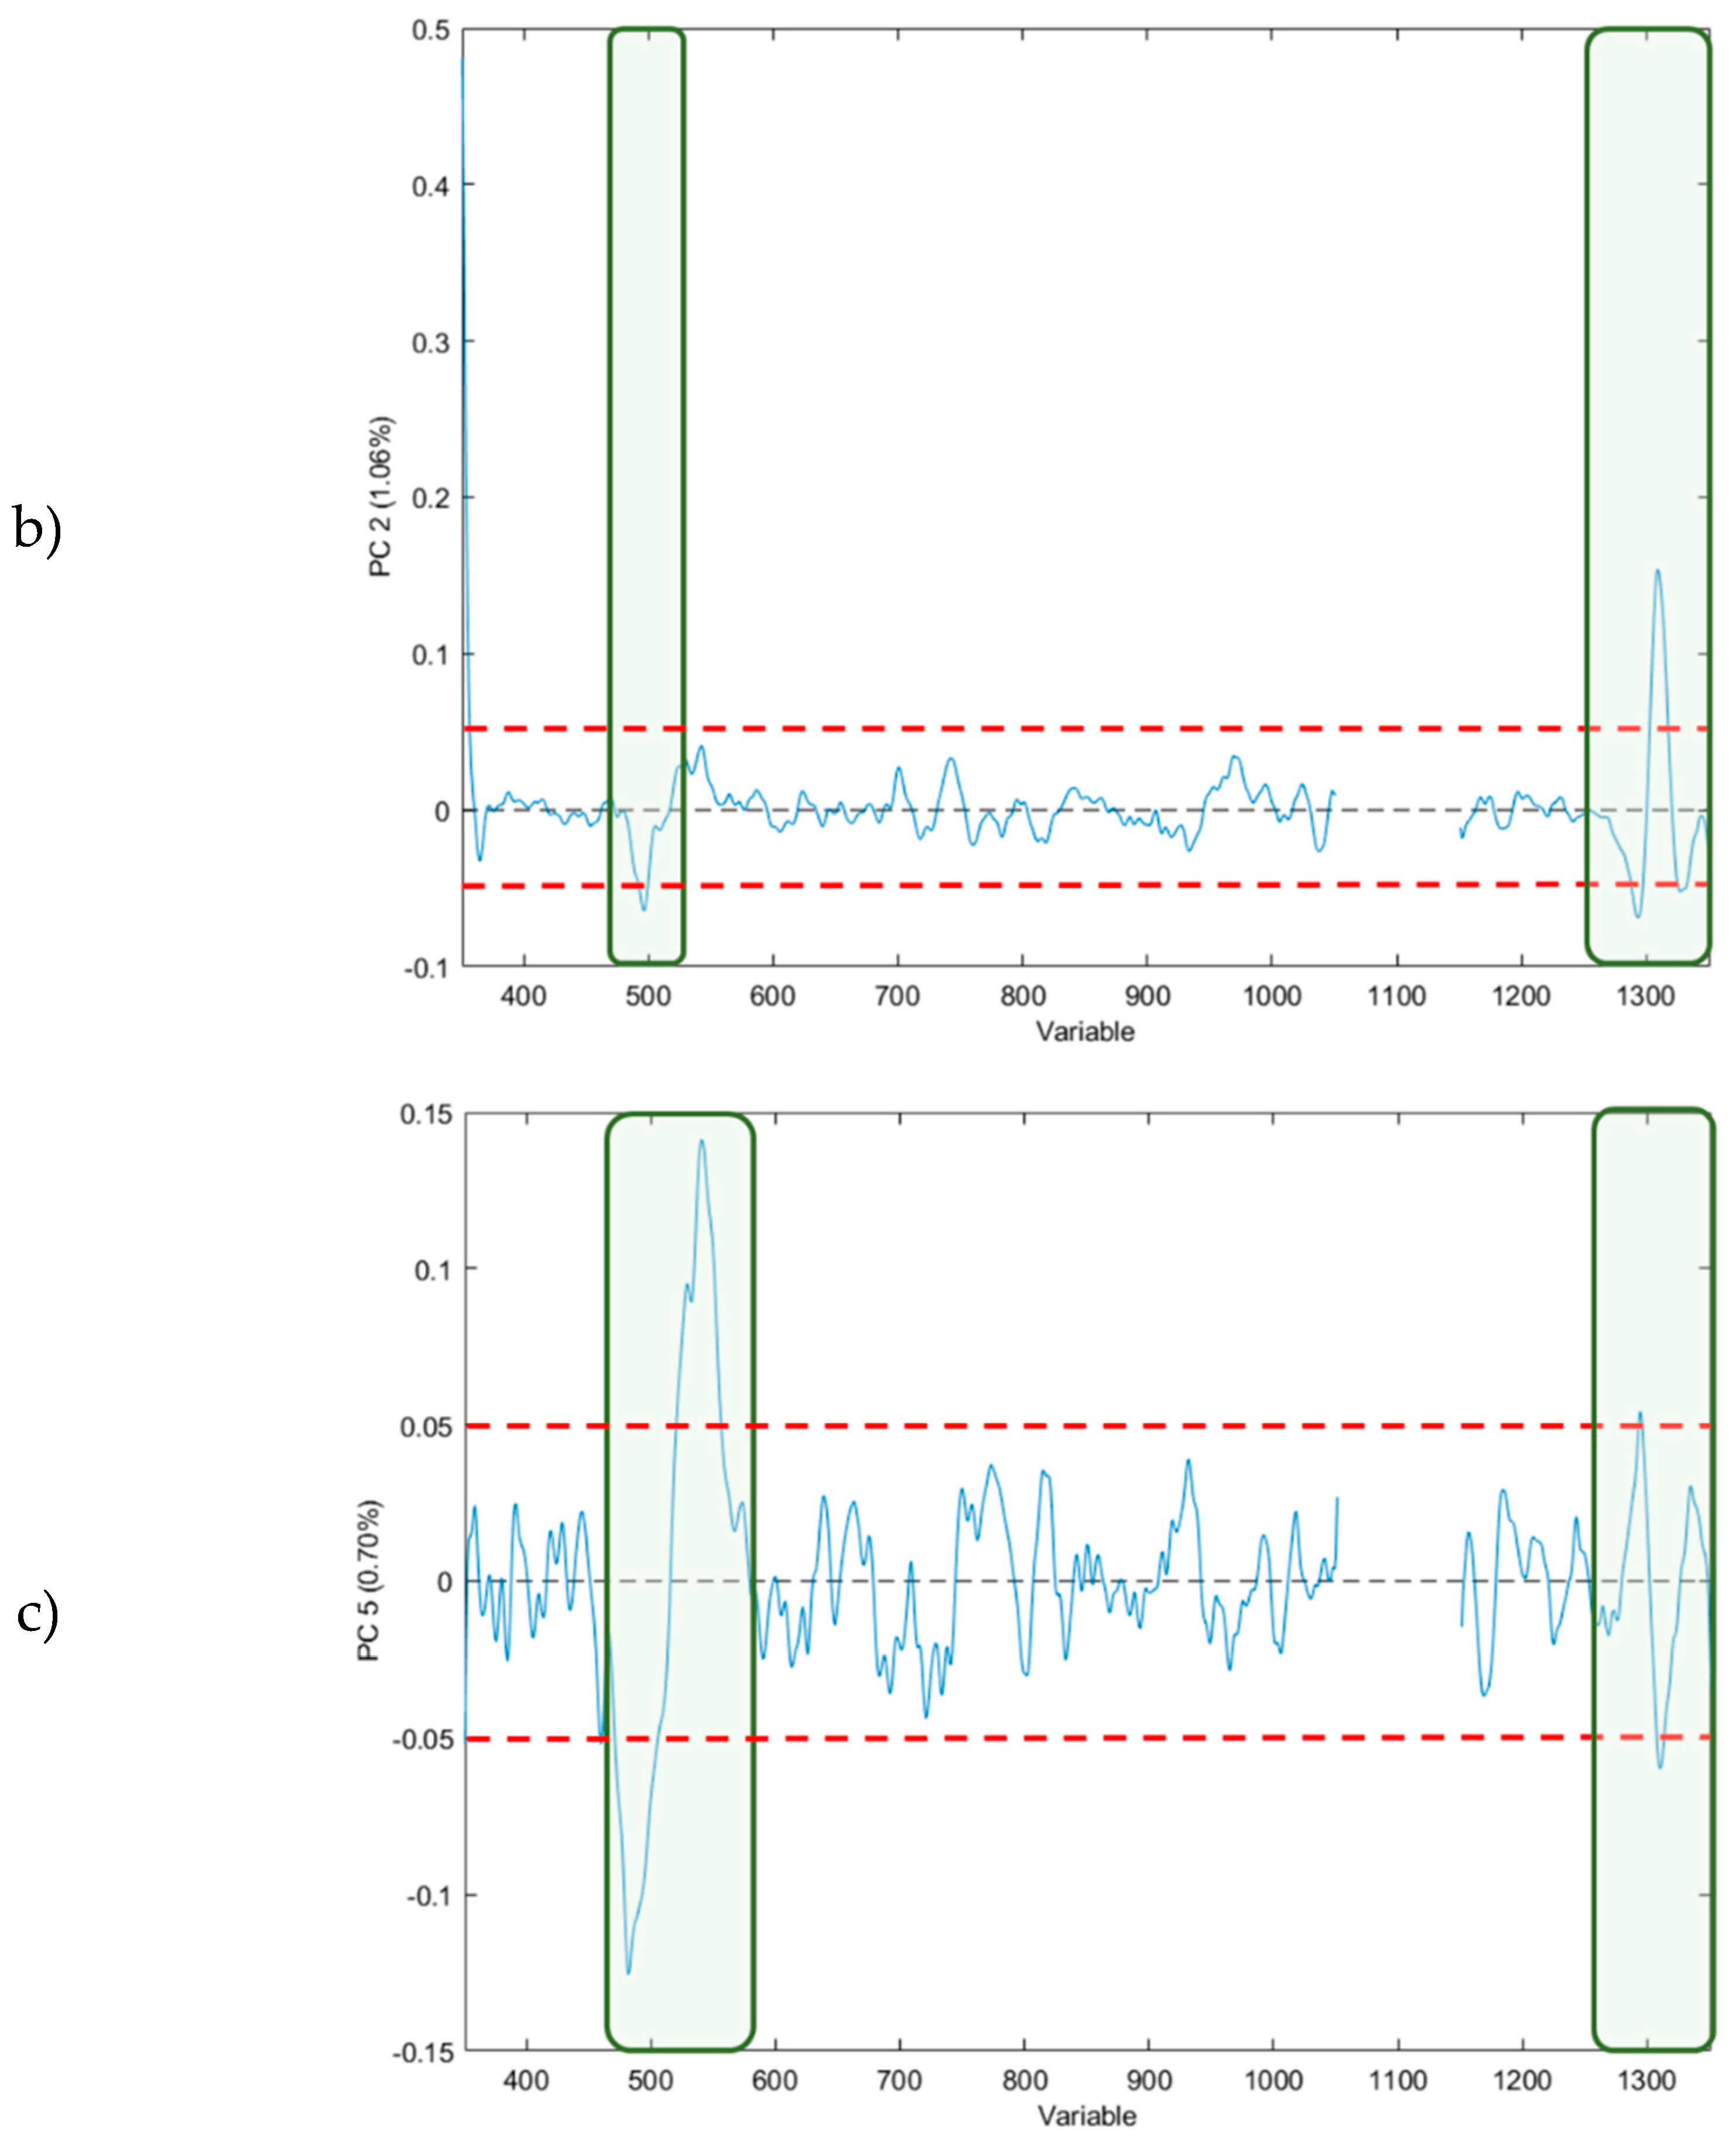
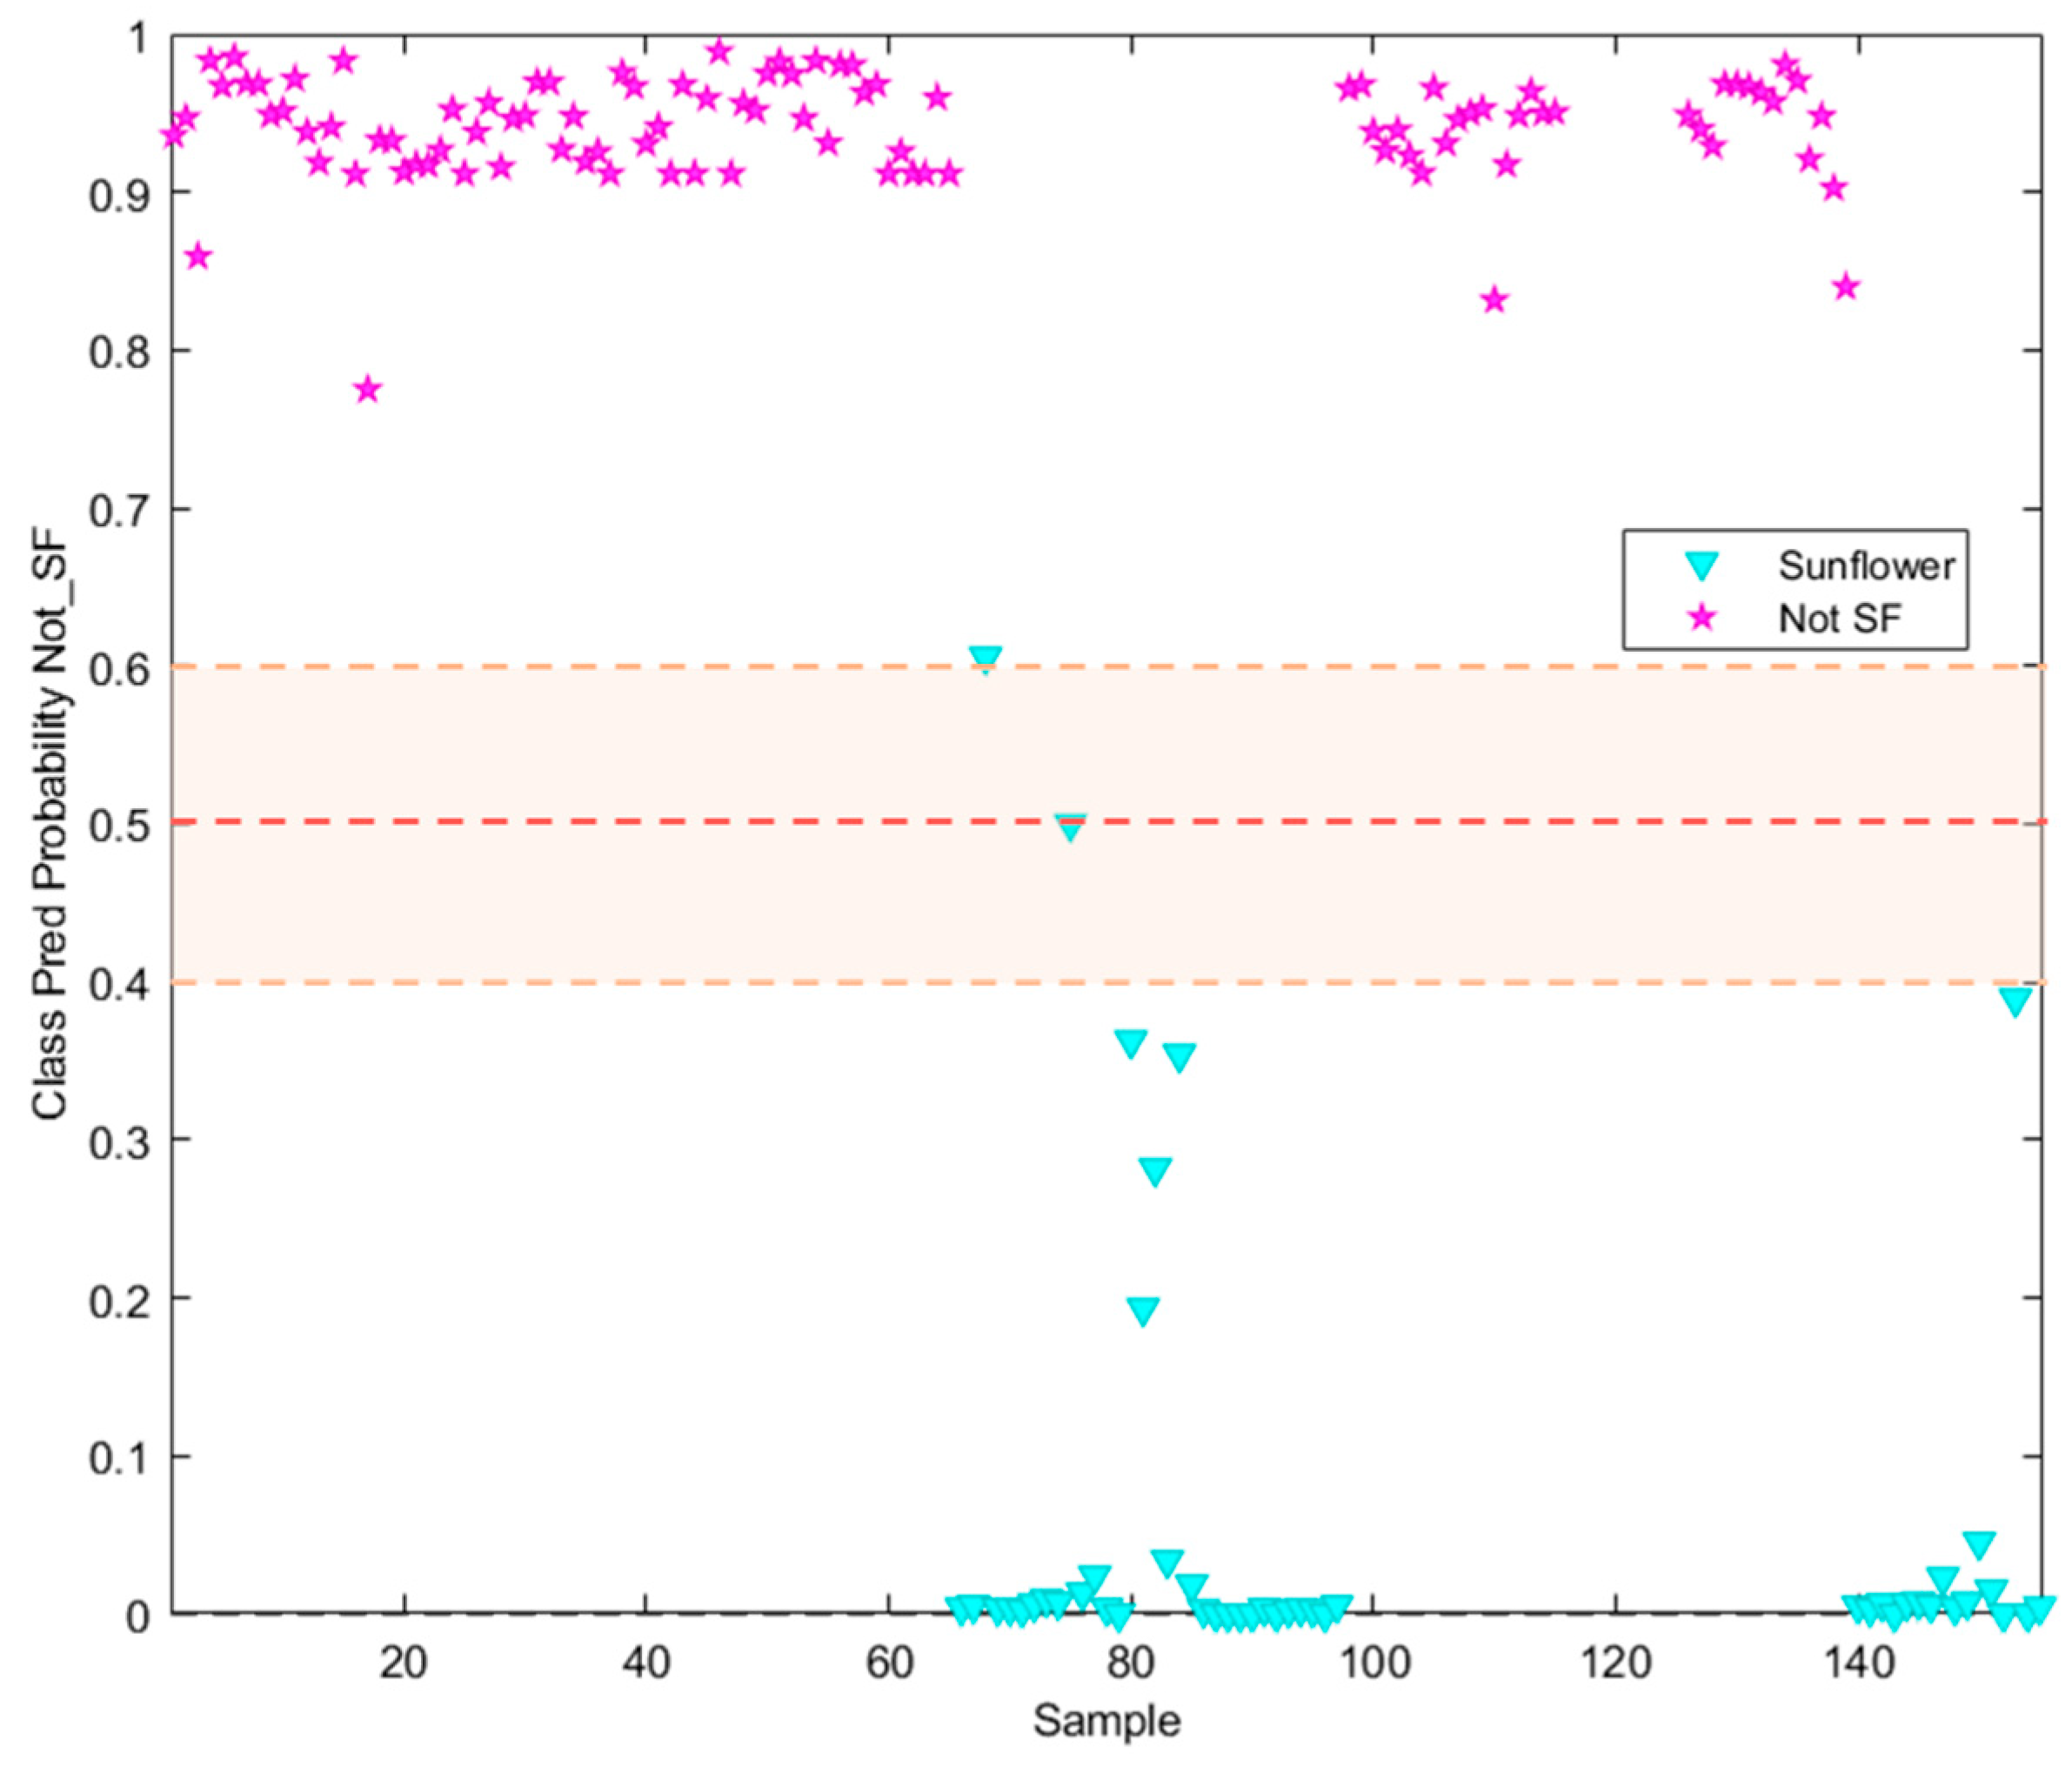
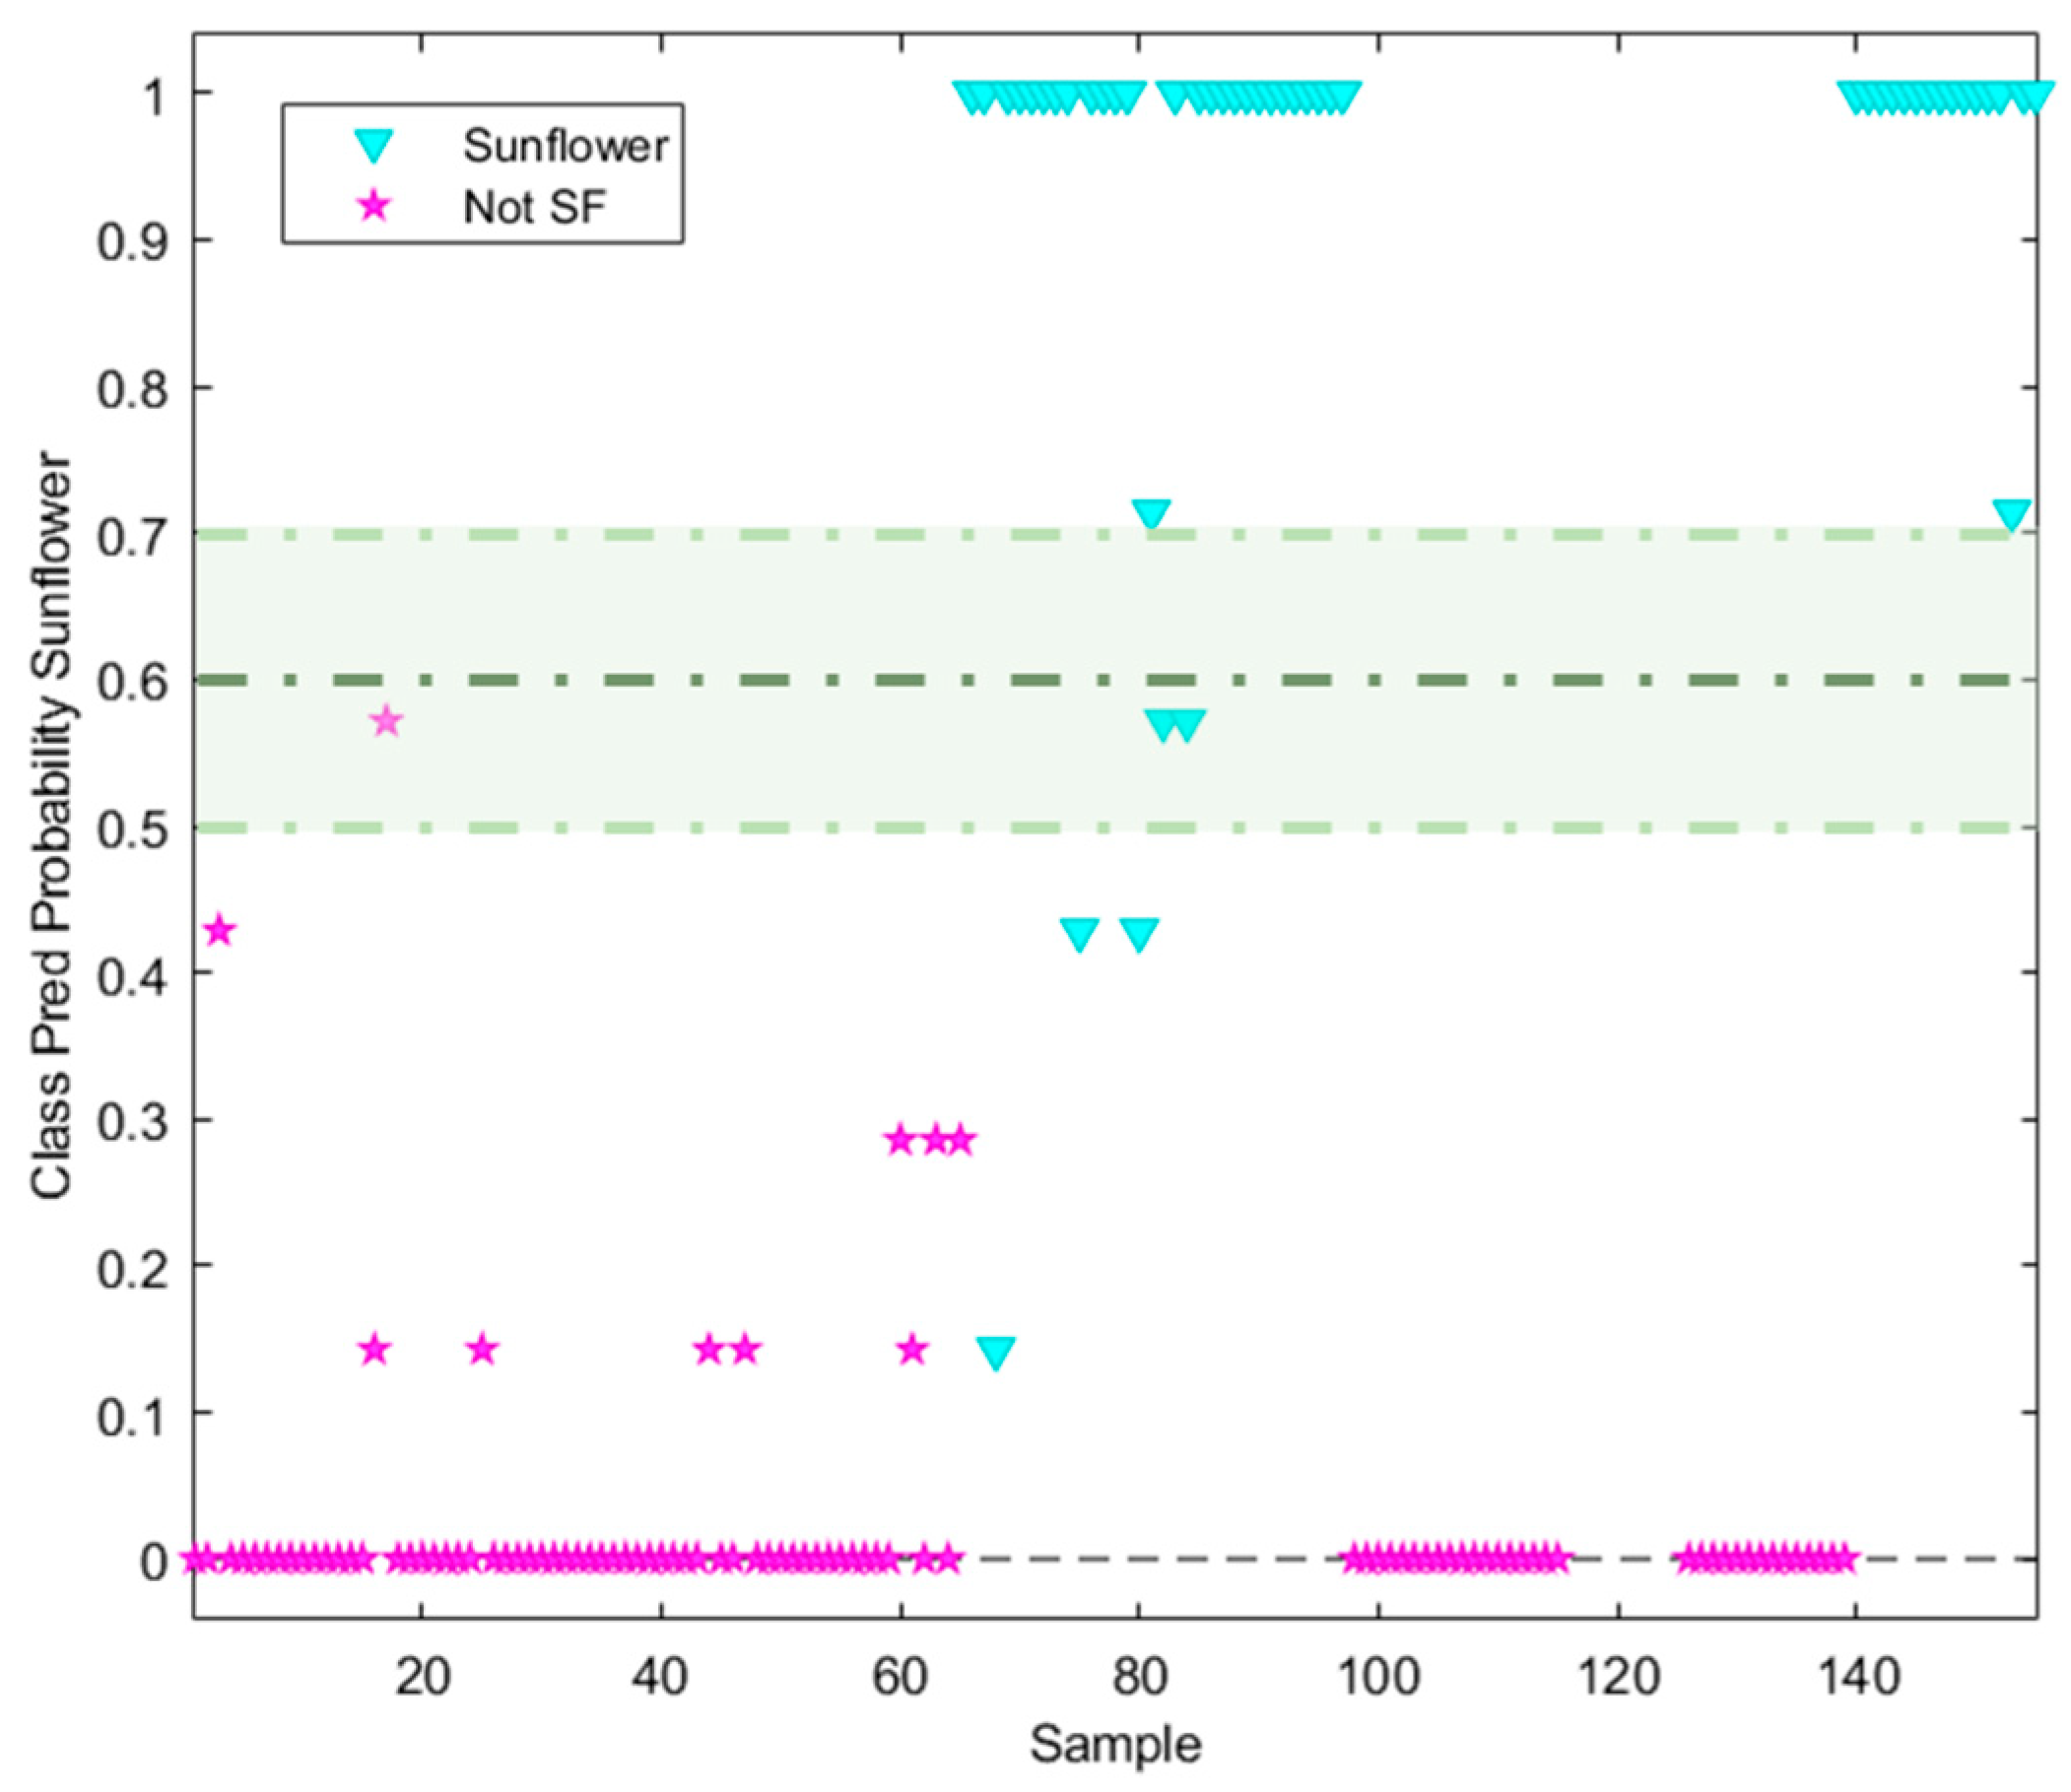
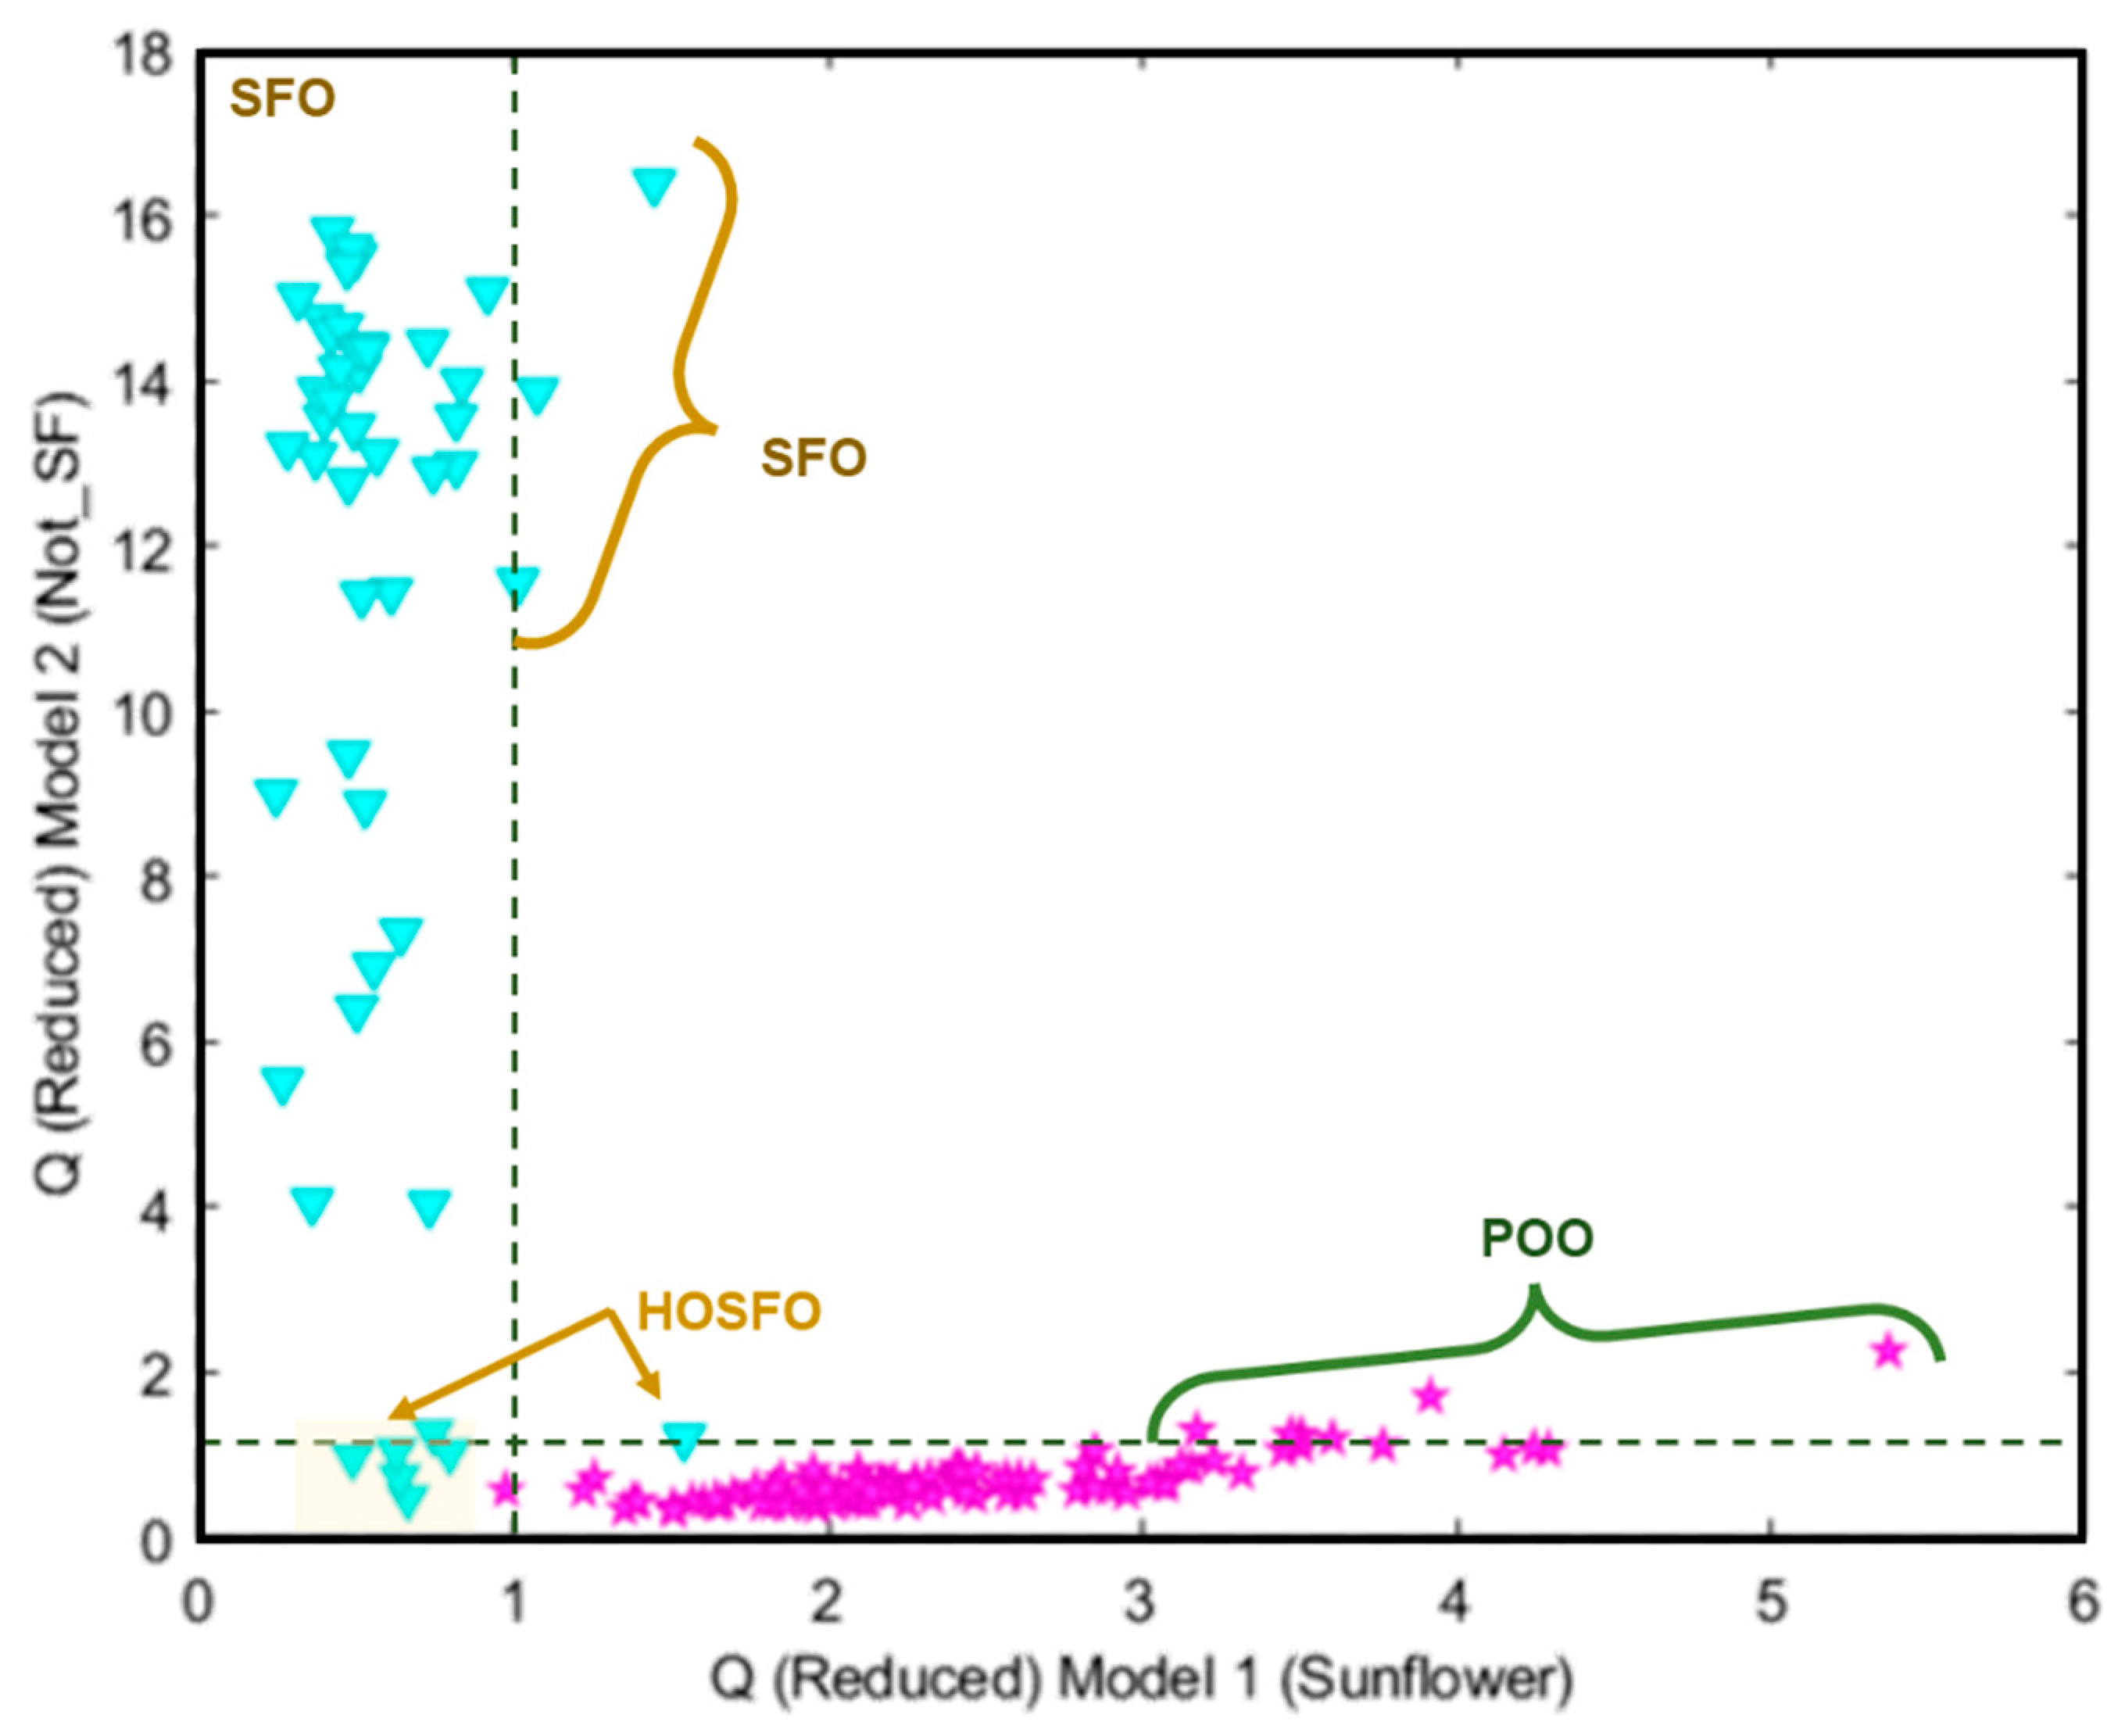
| TARGET Class (TC): Sunflower oil | ||||
|
Features: *X Block: [Reduced RAMAN instrumental fingerprints] *Y Block: [TC (Sunflower oil, SFO); NTC (Non Sunflower oil, Not SFO)] Pre-processing: 1st Derivative (order 2, window;21 pt, tails:polyinterp) + Mean center Training Set: [97 × 902] Prediction Set: [48 × 902] See Confusion Table below |
||||
| Classification performance metrics | TC (SFO) | NTC (Not SFO) | ||
| Sensitivity (SENS -prediction stage) | 0.98 | 1.00 | ||
| Specificity (SPEC-prediction stage) | 1.00 | 0.98 | ||
| False positive rate (FPR) | 0.00 | 0.02 | ||
| False negative rate (FNR) | 0.02 | 0.00 | ||
| Positive predictive value (precision) (PPV) | 1.00 | 0.99 | ||
| Negative predictive value (NPV) | 0.99 | 1.00 | ||
| Youden index (YOUD) | 0.98 | 0.98 | ||
| F-measure (F) | 0.99 | 0.99 | ||
| Discriminant power (DP) | − | − | ||
| Efficiency (or accuracy) (EFFIC) | 0.99 | 0.99 | ||
| Misclassification rate (MR) | 0.01 | 0.01 | ||
| AUC (correctly classified rate) | 0.99 | 0.99 | ||
| Gini coefficient (Gini) | 0.98 | 0.98 | ||
| G-mean (GM) | 0.99 | 0.99 | ||
| Matthews correlation coefficient (MCC) | 0.98 | 0.98 | ||
| Chance agreement rate (CAR) | 0.56 | 0.56 | ||
| Chance error rate (CER) | 0.44 | 0.44 | ||
| Kappa coefficient (KAPPA) | 0.98 | 0.98 | ||
| Confusion Table: | ||||
 |
||||
| TARGET Class (TC): Sunflower oil | ||||
|
Features: *X Block: [Reduced RAMAN instrumental fingerprints] *Y Block: [TC (Sunflower oil, SFO); NTC (Non Sunflower oil, Not SFO)] Pre-processing: 1st Derivative (order 2, window;21 pt, tails:polyinterp) + Mean center Training Set: [97 × 902] Prediction Set: [48 × 902] See Confusion Table below |
||||
| Classification performance metrics | TC (SFO) | NTC (Not SFO) | ||
| Sensitivity (SENS -prediction stage) | 0.90 | 1.00 | ||
| Specificity (SPEC-prediction stage) | 1.00 | 0.90 | ||
| False positive rate (FPR) | 0.00 | 0.10 | ||
| False negative rate (FNR) | 0.10 | 0.00 | ||
| Positive predictive value (precision) (PPV) | 1.00 | 0.95 | ||
| Negative predictive value (NPV) | 0.95 | 1.00 | ||
| Youden index (YOUD) | 0.90 | 0.90 | ||
| F-measure (F) | 0.95 | 0.97 | ||
| Discriminant power (DP) | − | − | ||
| Efficiency (or accuracy) (EFFIC) | 0.97 | 0.97 | ||
| Misclassification rate (MR) | 0.03 | 0.03 | ||
| AUC (correctly classified rate) | 0.95 | 0.95 | ||
| Gini coefficient (Gini) | 0.90 | 0.90 | ||
| G-mean (GM) | 0.95 | 0.95 | ||
| Matthews correlation coefficient (MCC) | 0.92 | 0.92 | ||
| Chance agreement rate (CAR) | 0.57 | 0.57 | ||
| Chance error rate (CER) | 0.44 | 0.44 | ||
| Kappa coefficient (KAPPA) | 0.92 | 0.92 | ||
| Confusion Table: | ||||
 |
||||
| TARGET Class (TC): Sunflower oil | ||||
|
Features: *X Block: [Reduced RAMAN instrumental fingerprints] *Y Block: [TC (Sunflower oil, SFO); NTC (Non Sunflower oil, Not SFO)] Pre-processing: 1st Derivative (order 2, window;21 pt, tails:polyinterp) + Mean center Training Set: [97 × 902] Prediction Set: [48 × 902] See Confusion Table below |
||||
| Classification performance metrics | TC (SFO) | NTC (Not SFO) | ||
| Sensitivity (SENS -prediction stage) | 0.93 | 0.81 | ||
| Specificity (SPEC-prediction stage) | 0.81 | 0.93 | ||
| False positive rate (FPR) | 0.19 | 0.07 | ||
| False negative rate (FNR) | 0.07 | 0.19 | ||
| Positive predictive value (precision) (PPV) | 0.99 | 1.00 | ||
| Negative predictive value (NPV) | 1.00 | 0.99 | ||
| Youden index (YOUD) | 0.74 | 0.74 | ||
| F-measure (F) | 0.96 | 0.90 | ||
| Discriminant power (DP) | 0.96 | 0.96 | ||
| Efficiency (or accuracy) (EFFIC) | 0.89 | 0.89 | ||
| Misclassification rate (MR) | 0.11 | 0.11 | ||
| AUC (correctly classified rate) | 0.87 | 0.87 | ||
| Gini coefficient (Gini) | 0.74 | 0.74 | ||
| G-mean (GM) | 0.87 | 0.87 | ||
| Matthews correlation coefficient (MCC) | 0.86 | 0.86 | ||
| Chance agreement rate (CAR) | 0.51 | 0.51 | ||
| Chance error rate (CER) | 0.44 | 0.44 | ||
| Kappa coefficient (KAPPA) | 0.78 | 0.78 | ||
| Confusion Table: | ||||
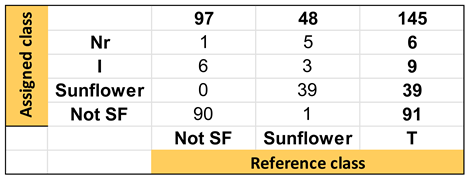 |
||||
Disclaimer/Publisher’s Note: The statements, opinions and data contained in all publications are solely those of the individual author(s) and contributor(s) and not of MDPI and/or the editor(s). MDPI and/or the editor(s) disclaim responsibility for any injury to people or property resulting from any ideas, methods, instructions or products referred to in the content. |
© 2023 by the authors. Licensee MDPI, Basel, Switzerland. This article is an open access article distributed under the terms and conditions of the Creative Commons Attribution (CC BY) license (http://creativecommons.org/licenses/by/4.0/).


