Submitted:
27 November 2023
Posted:
28 November 2023
You are already at the latest version
Abstract
Keywords:
1. Introduction
2. Materials and Methods
2.1. Model for genome chaos
2.2. Gene mutation and translation
2.3. Protein stability prediction
2.4. Protein Function Prediction
3. Results
3.1. Modeling results for the rate of mutation of the BCL2 gene
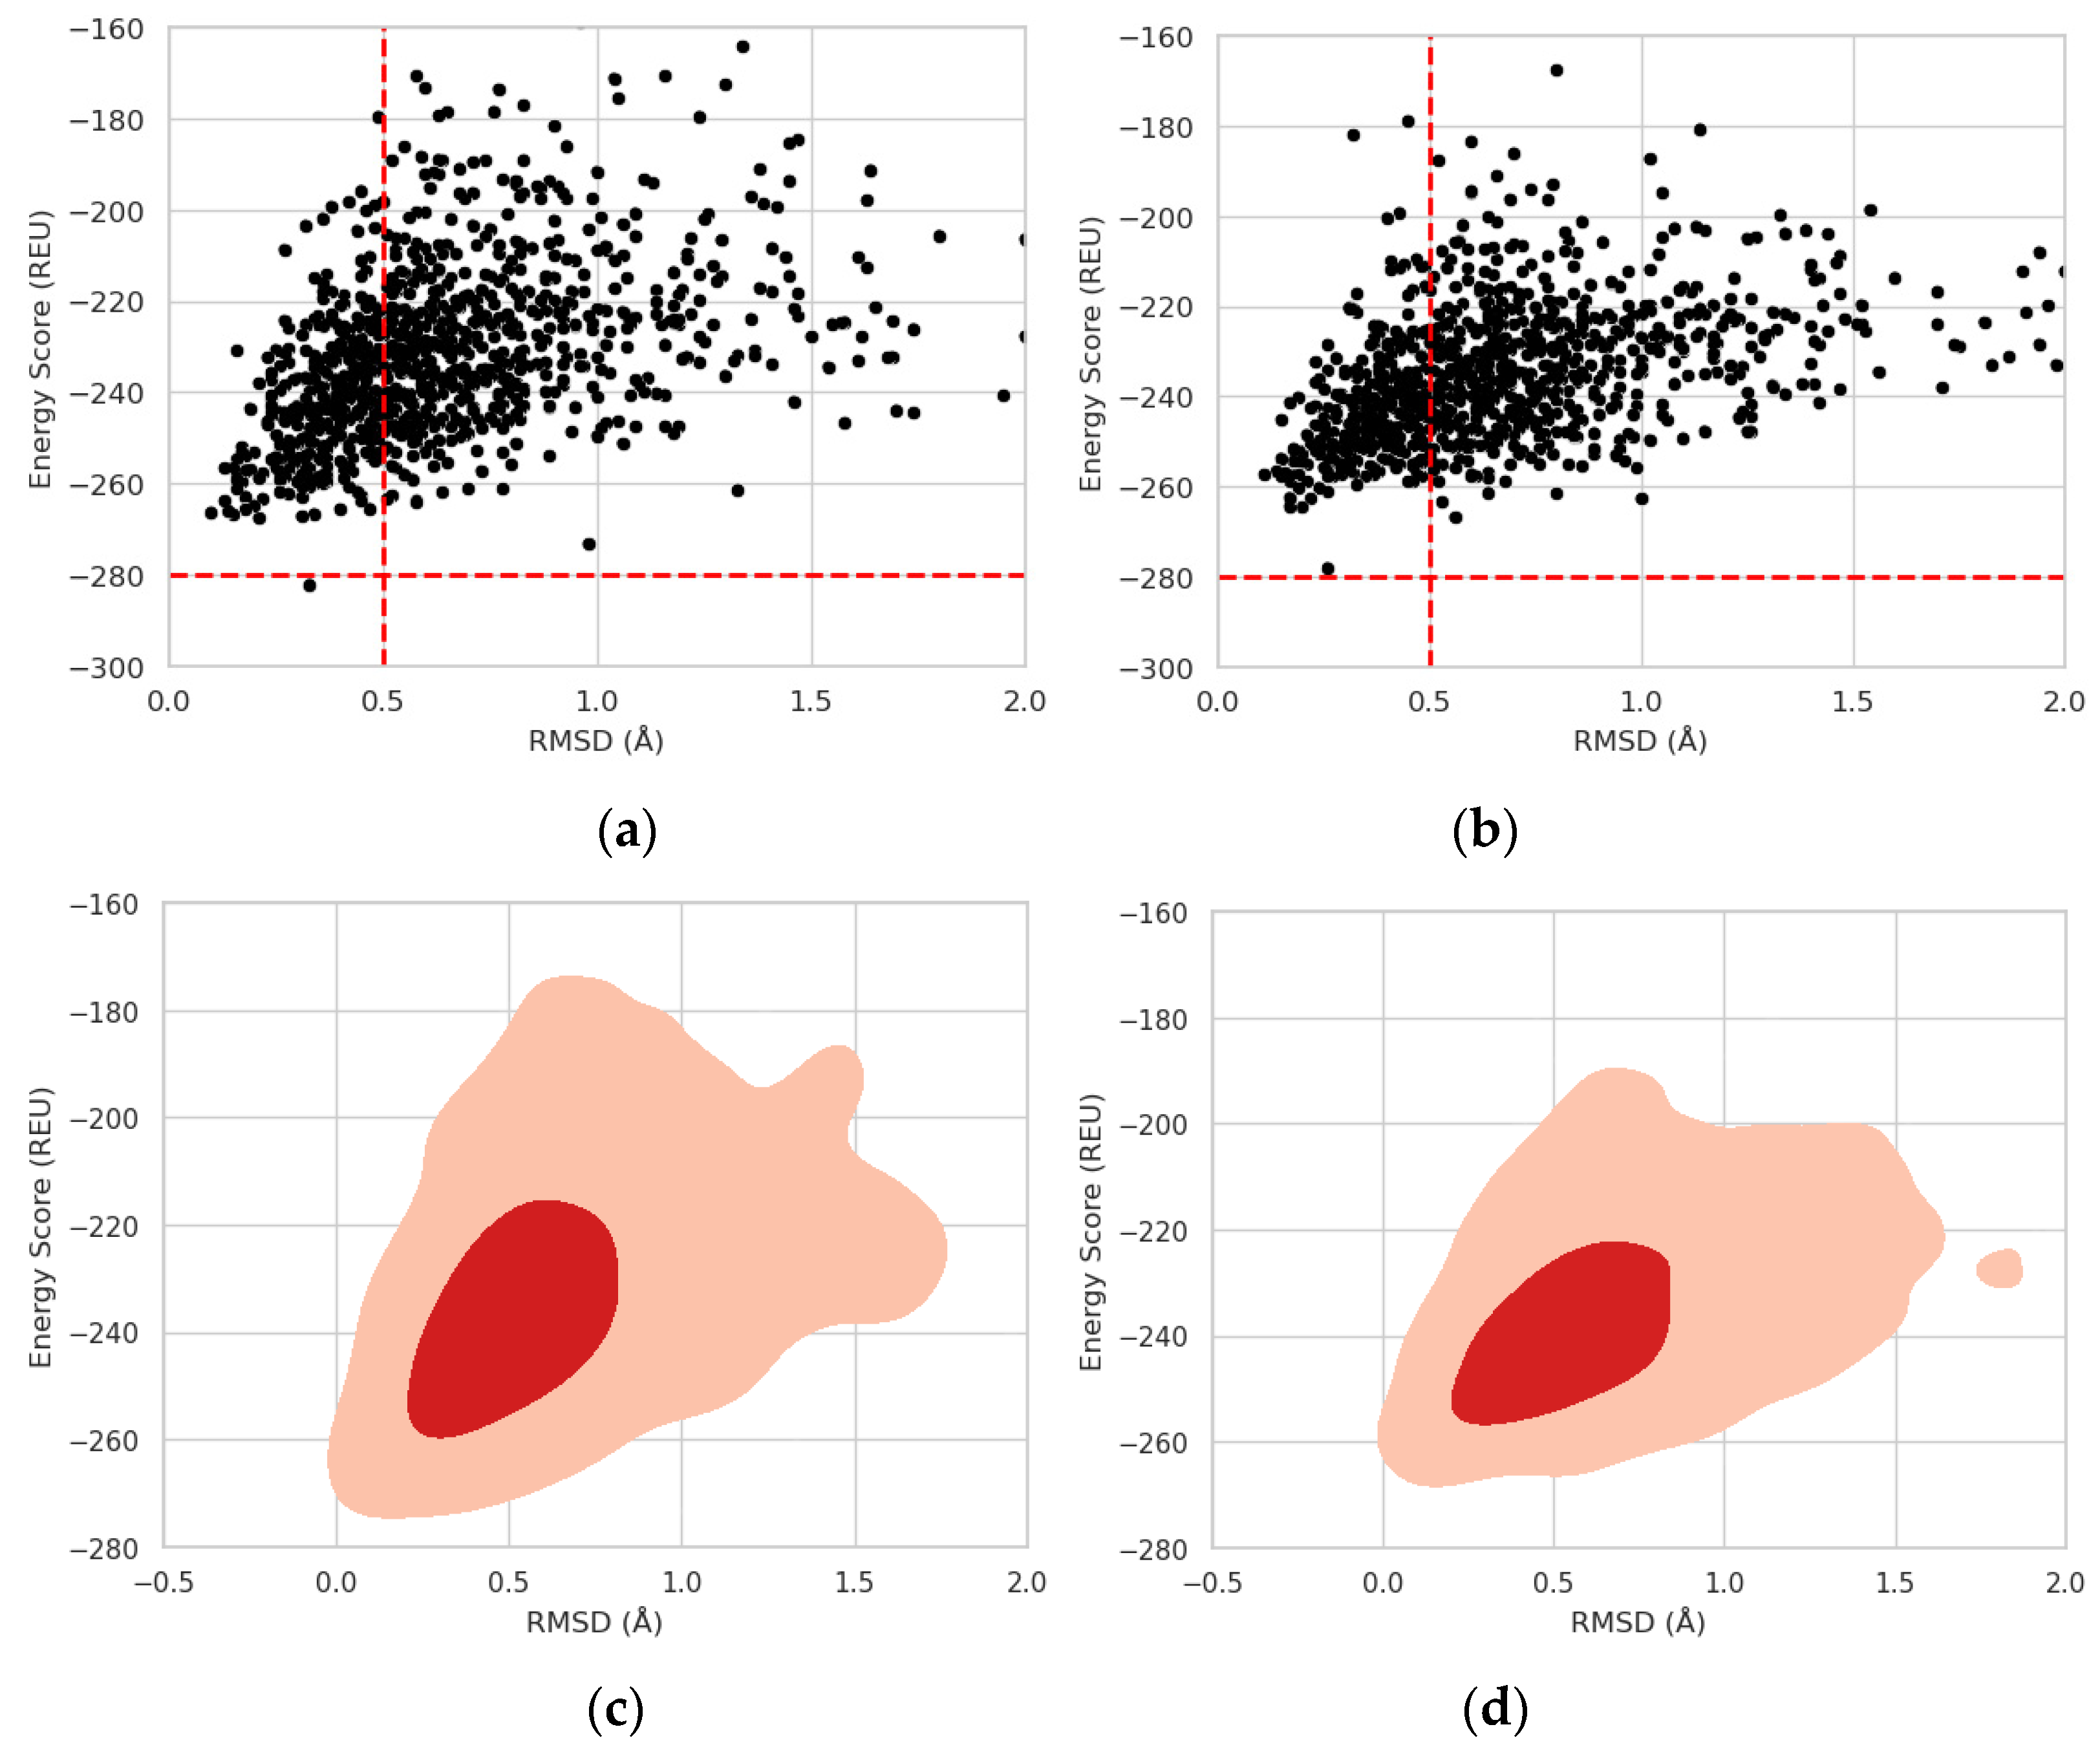
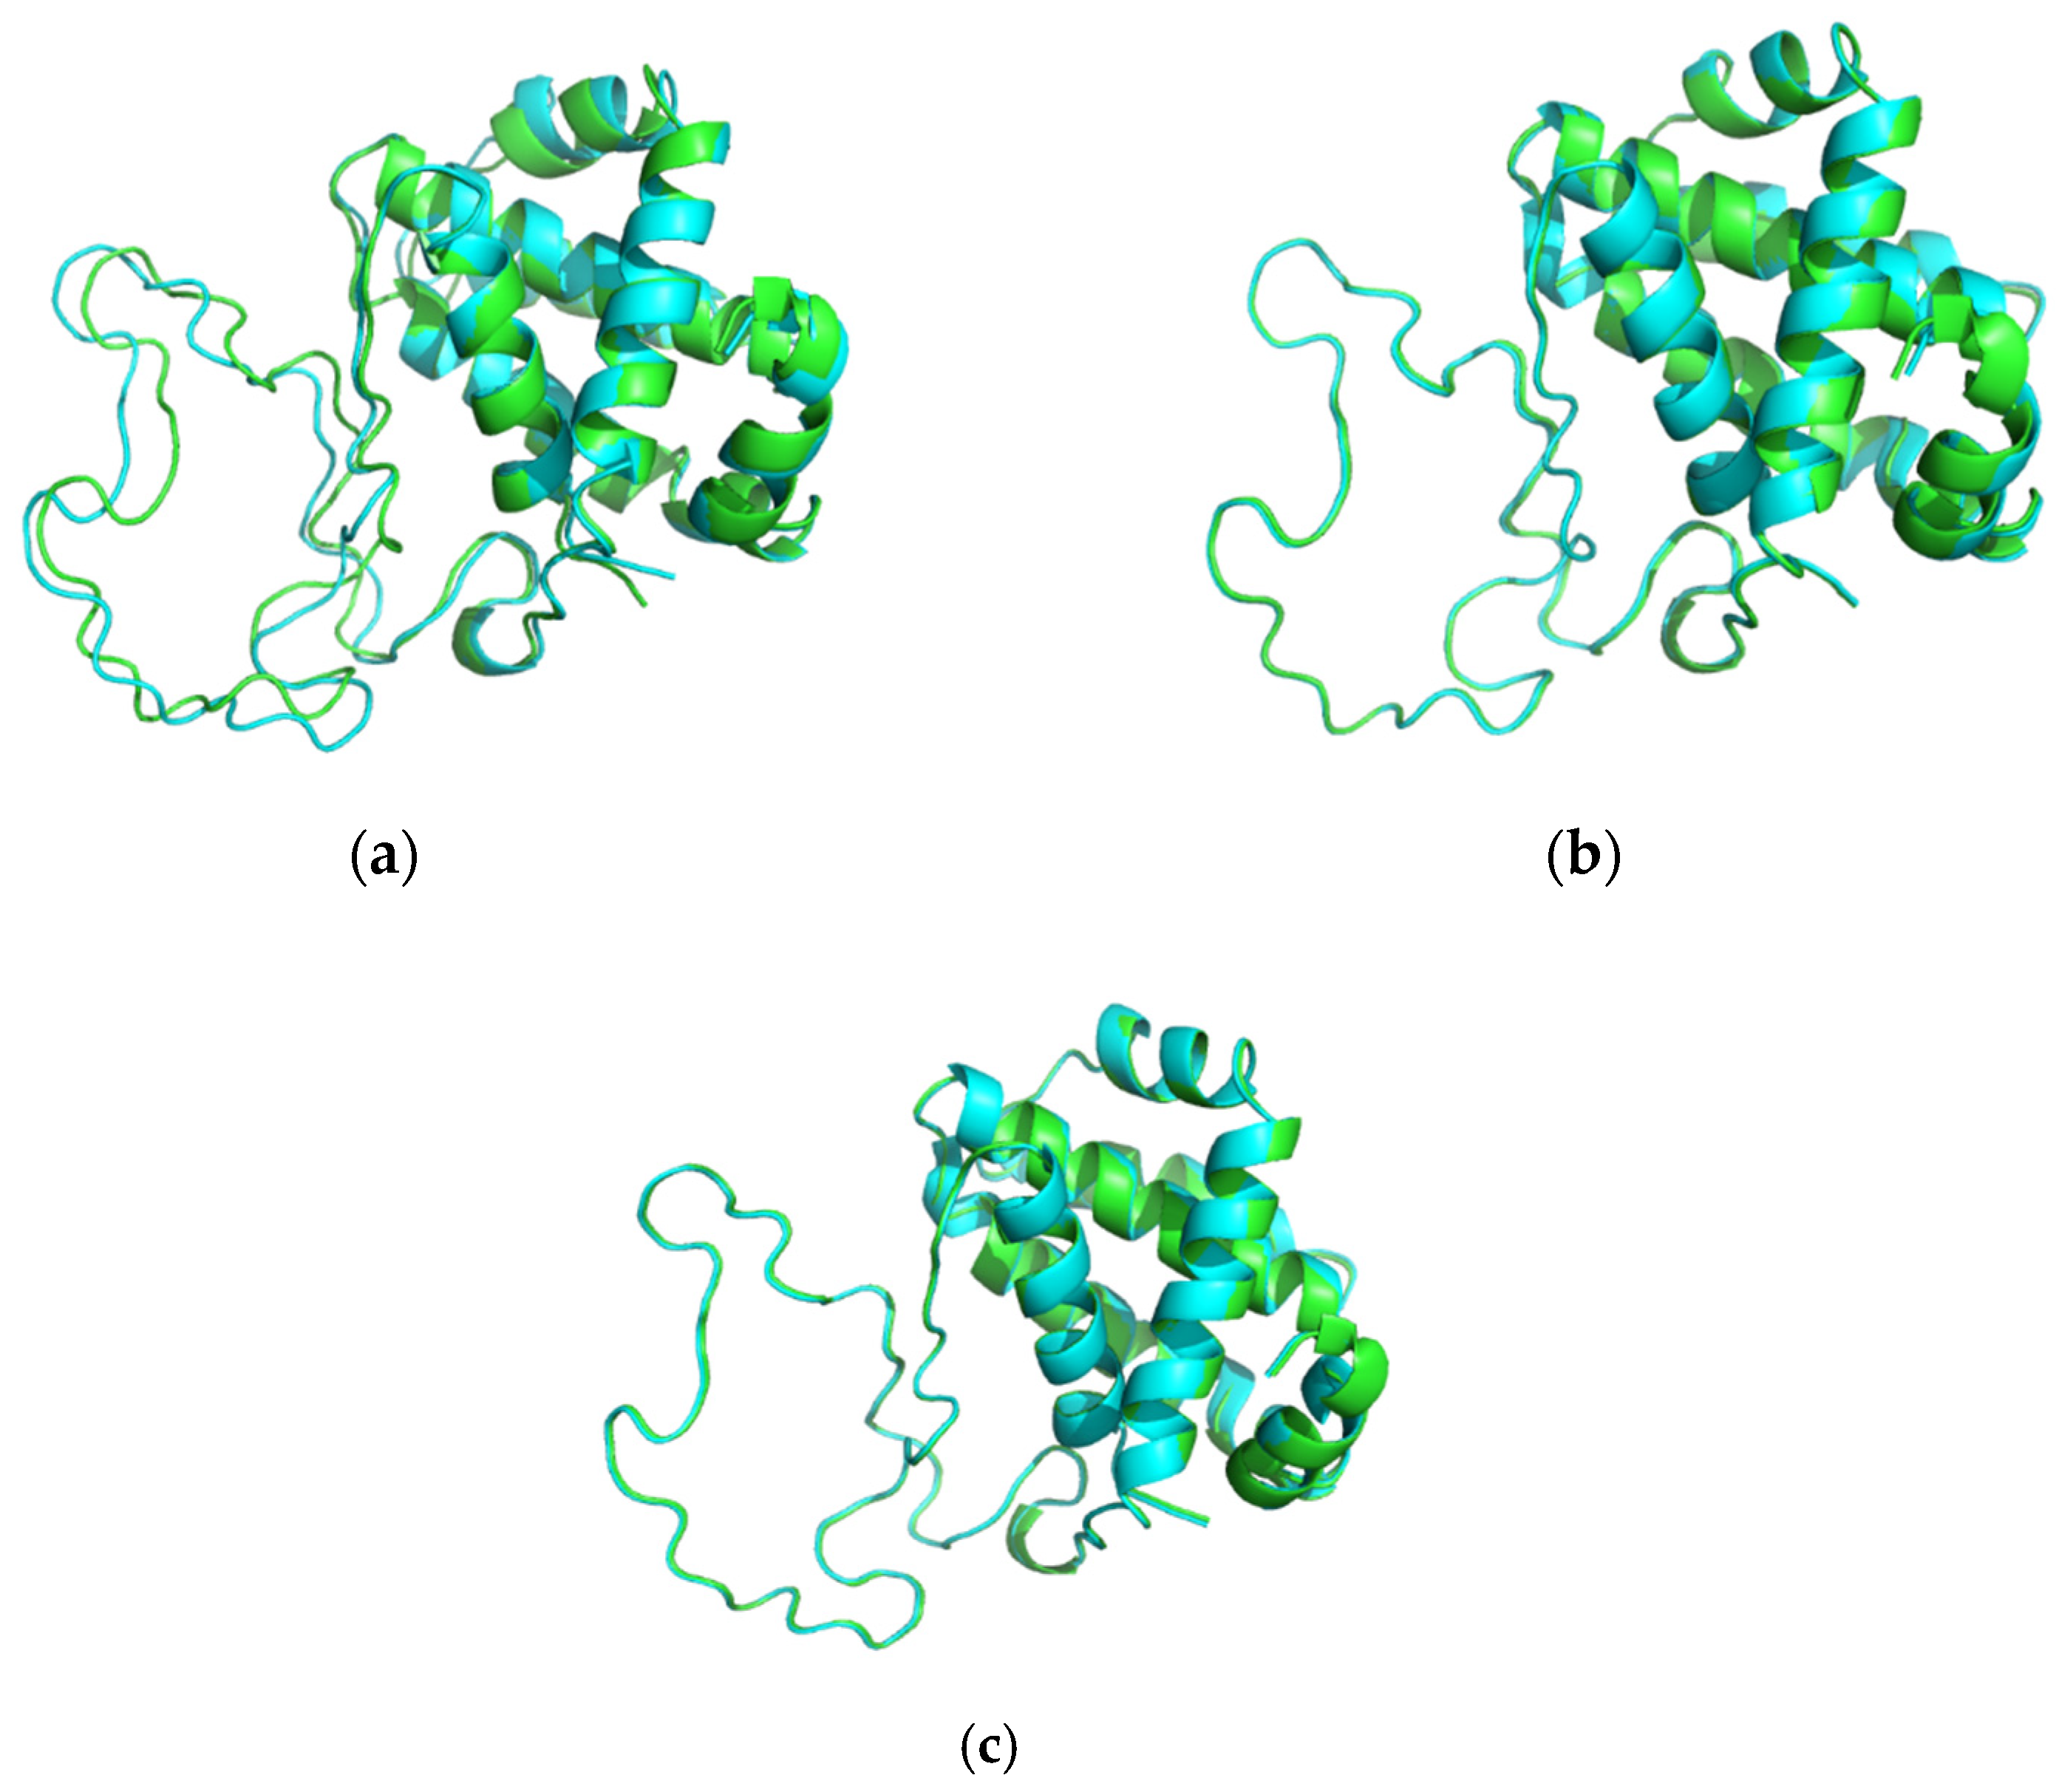
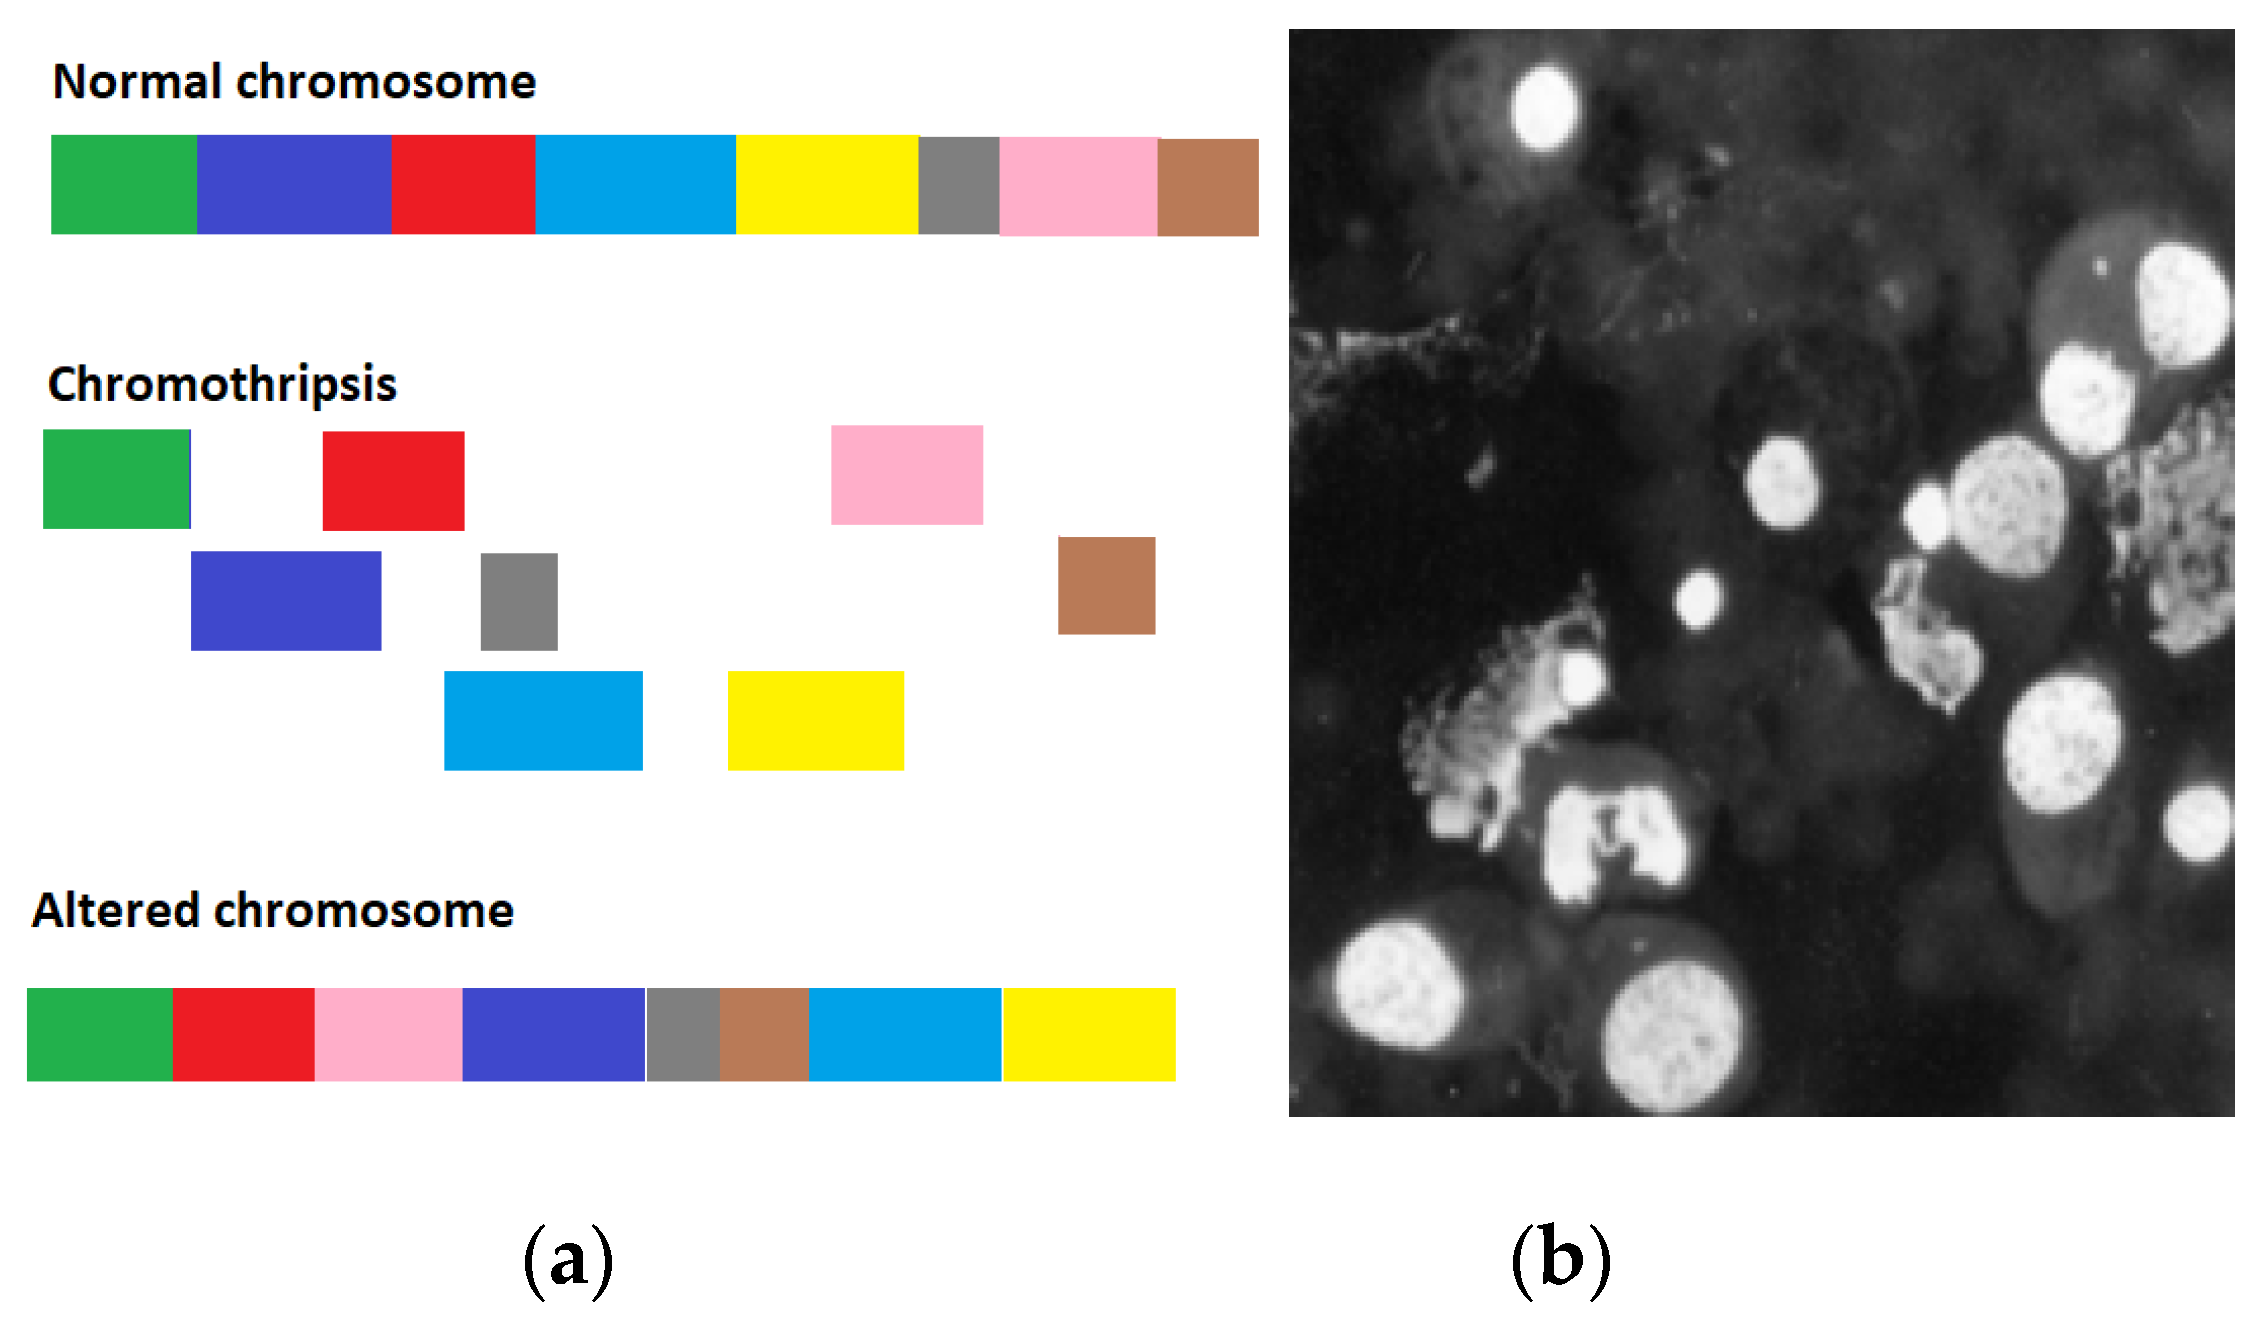
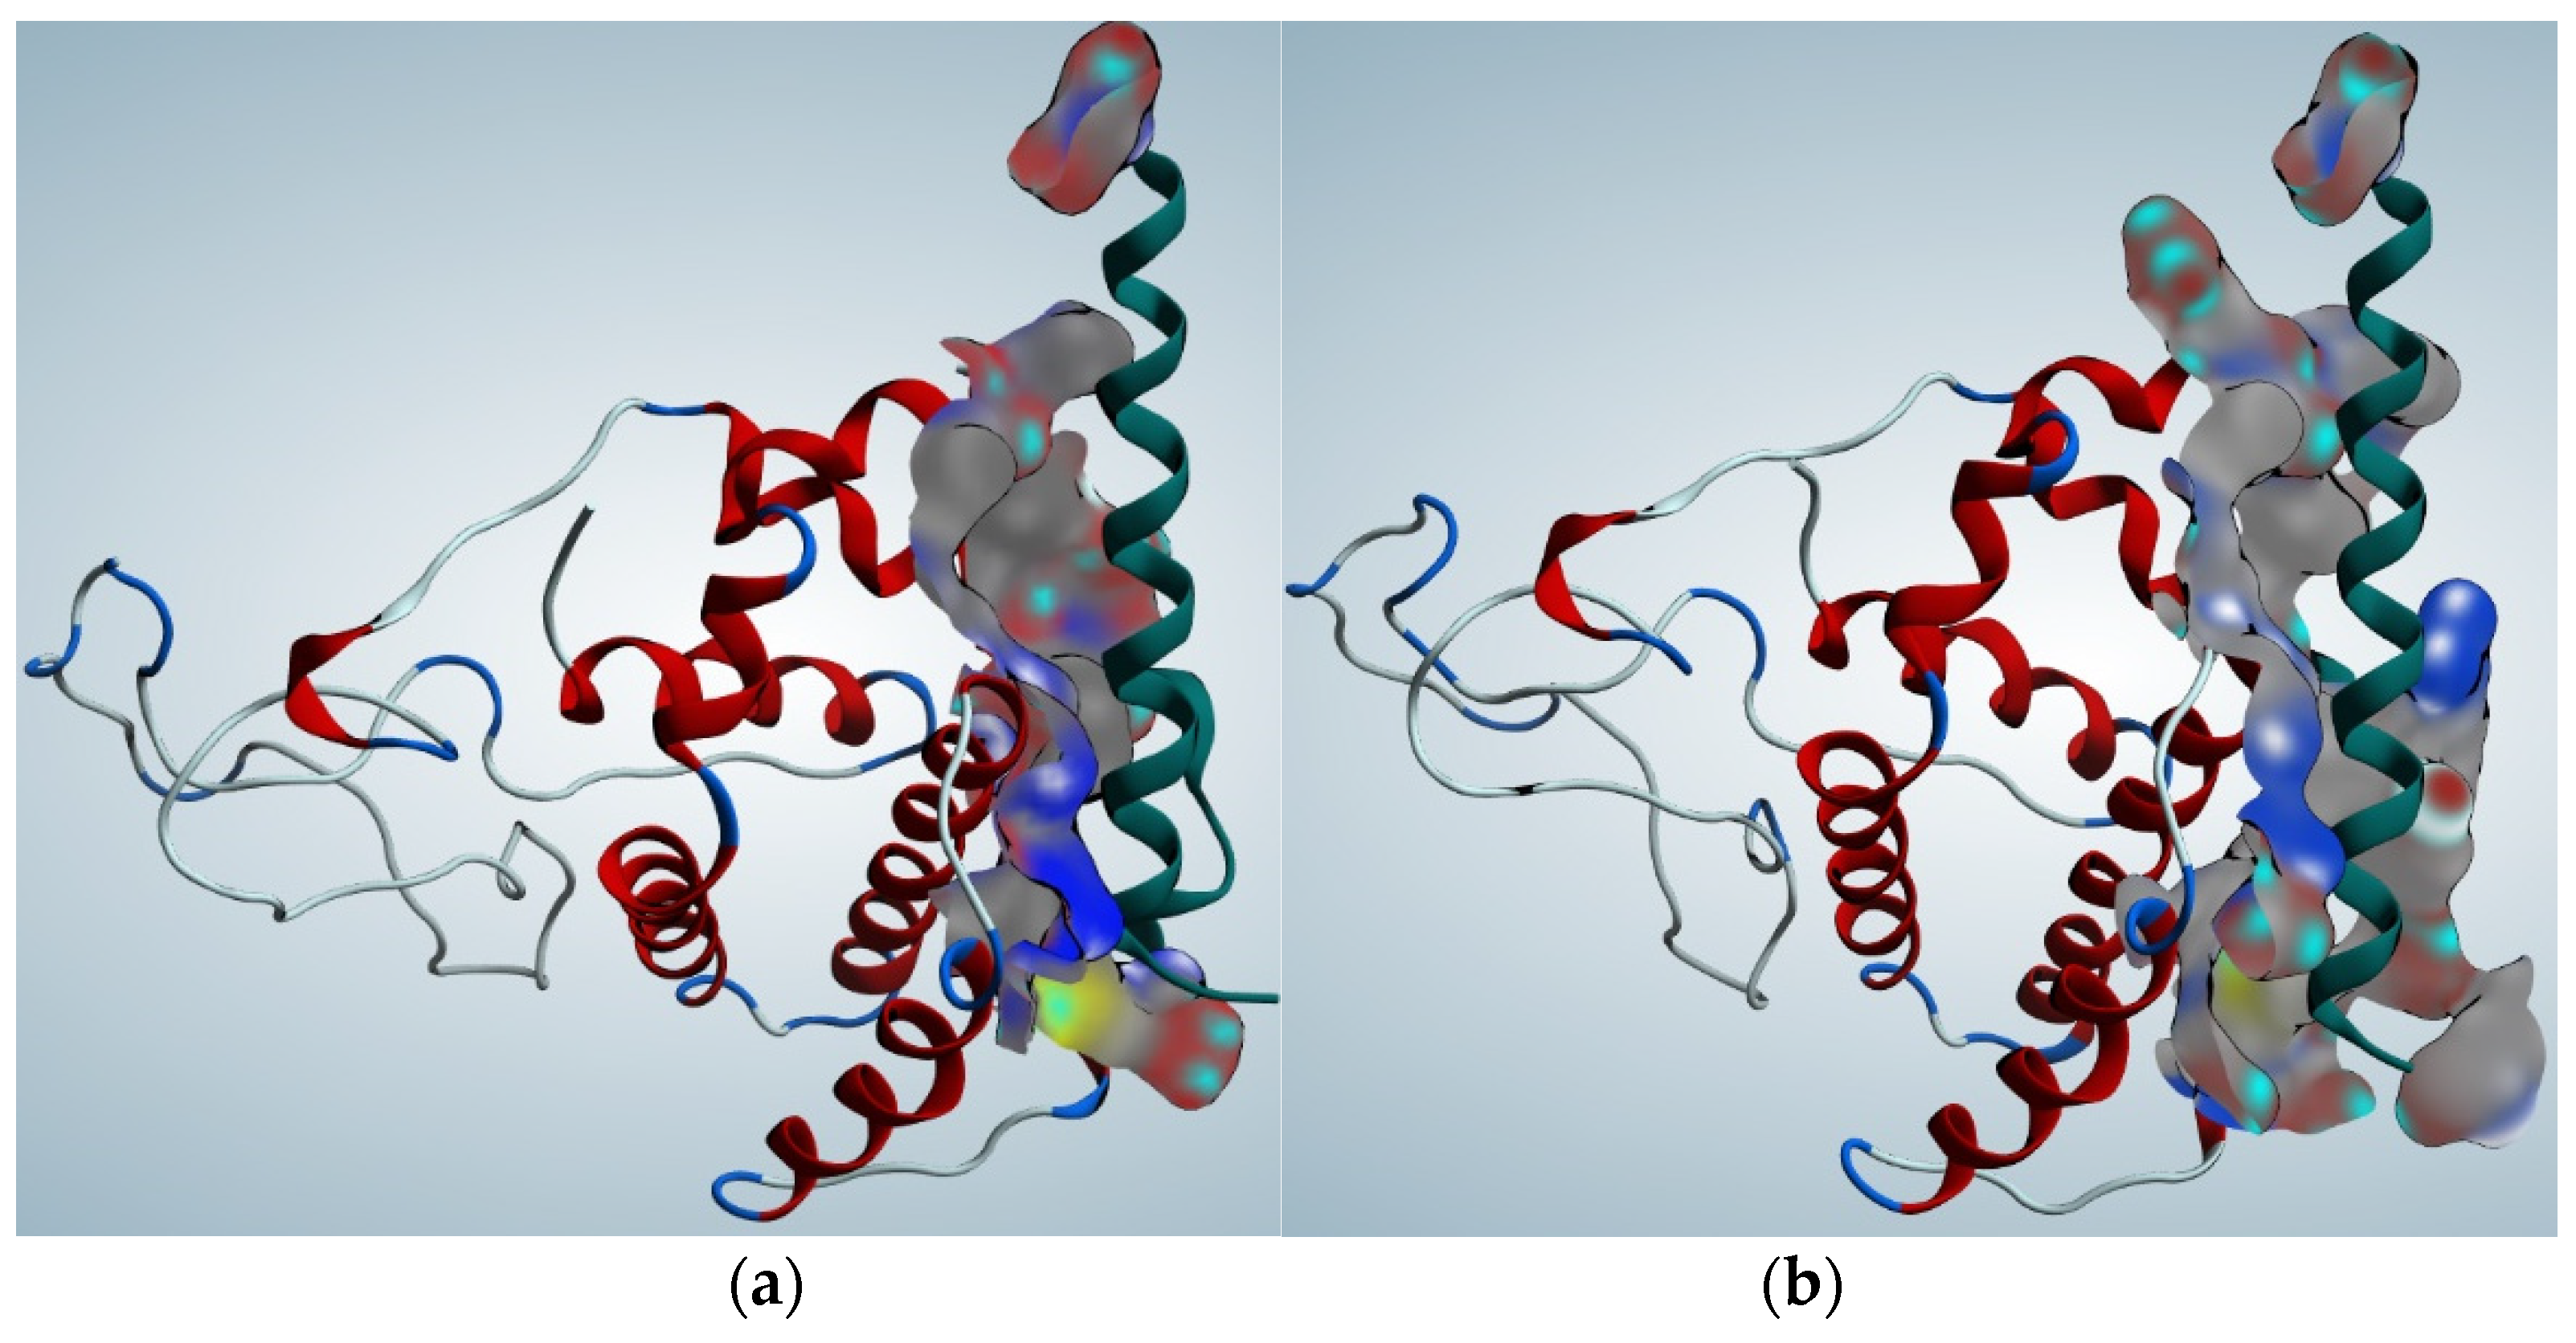
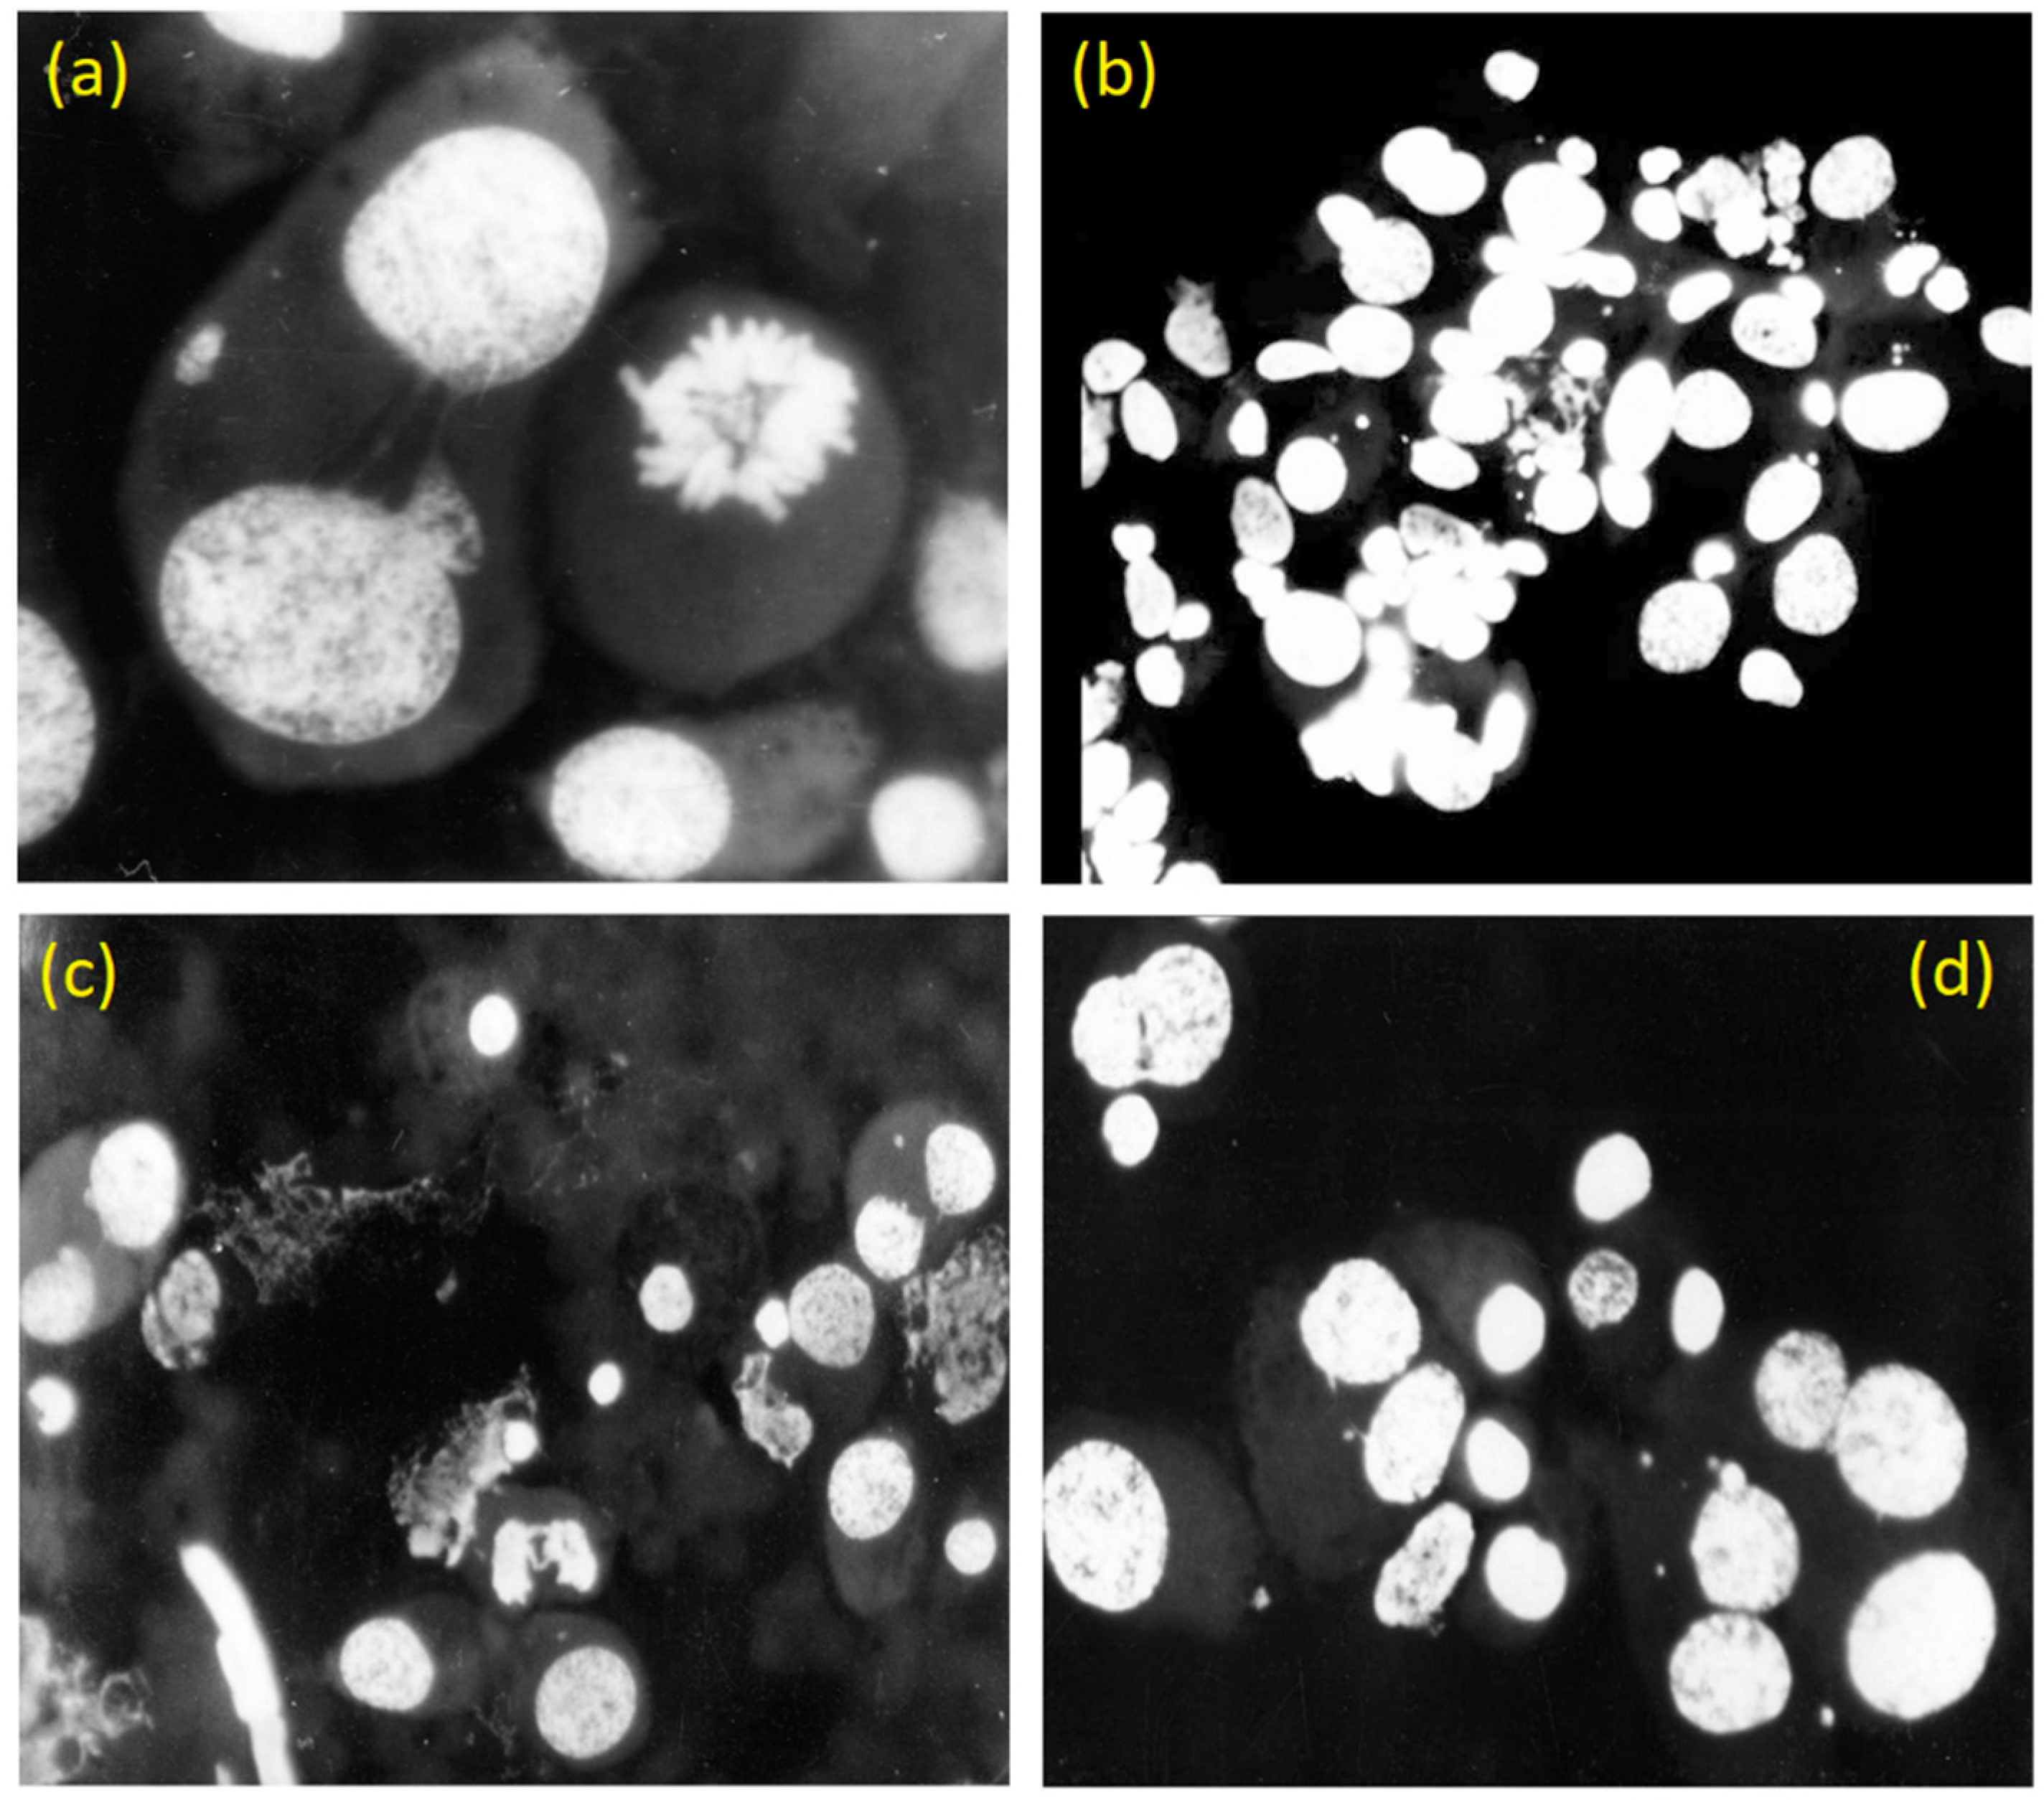
3.2. Case study: self-destruction of rhabdomyosarcoma (RA) of rats
4. Discussion
5. Conclusions
Author Contributions
Funding
Institutional Review Board Statement
Data Availability Statement
Acknowledgments
Conflicts of Interest
References
- Guzman-Sepulveda, J.; Argueta-Morales, R.; DeCampli, W.M.; Dogariu, A. Real-time intraoperative monitoring of blood coagulability via coherence-gated light scattering. Nat. Biomed. Eng. 2017, 1, 0028. [Google Scholar] [CrossRef]
- Magdziarz, M.; Zorawik, T. Lamperti transformation - cure for ergodicity breaking. Commun. Nonlinear Sci. Numer. Simulat. 2019, 71, 202–211. [Google Scholar] [CrossRef]
- Nosonovsky, M.; Roy, P. Allometric scaling law and ergodicity breaking in the vascular system. Microfluid. Nanofluid. 2020, 24, 53. [Google Scholar] [CrossRef]
- Kulkarni, A.M.; Dixit, N.M.; Zukoski, C.F. Ergodic and non-ergodic phase transitions in globular protein suspensions. Faraday Discuss. 2003, 123, 37–50. [Google Scholar] [CrossRef] [PubMed]
- Földes-Papp, Z.; Baumann, G. Fluorescence molecule counting for single-molecule studies in crowded environment of living cells without and with broken ergodicity. Curr. Pharm. Biotechnol. 2011, 12, 824–833. [Google Scholar] [CrossRef]
- Manzo, C.; Torreno-Pina, J.A.; Massignan, P.; Lapeyre, G.J.; Lewenstein, M.; Garcia Parajo, M.F. Weak ergodicity breaking of receptor motion in living cells stemming from random diffusivity. Phys. Rev. X 2015, 5, 011021. [Google Scholar] [CrossRef]
- Galanti, B.; Tsinober, A. Is turbulence ergodic? Phys. Lett. A 2004, 330, 173–180. [Google Scholar] [CrossRef]
- Hofling, F.; Franosch, T. Anomalous transport in the crowded world of biological cells. Rep. Prog. Phys. 2013, 76, 046602. [Google Scholar] [CrossRef] [PubMed]
- Heng, H.H.; Stevens, J.B.; Liu, G.; et al. Stochastic cancer progression driven by nonclonal chromosome aberrations. J. Cell. Physiol. 2006, 208, 461–472. [Google Scholar] [CrossRef]
- Heng, J.; Heng, H.H. Two-phased evolution: Genome chaos-mediated information creation and maintenance. Prog. Biophys. Mol. Biol. 2021, 165, 29–42. [Google Scholar] [CrossRef]
- Heng, J.; Heng, H.H. Genome Chaos, Information Creation, and Cancer Emergence: Searching for New Frameworks on the 50th Anniversary of the “War on Cancer”. Genes 2022, 13, 101. [Google Scholar] [CrossRef] [PubMed]
- Heng, H.H.; Stevens, J.B.; Liu, G.; Bremer, S.W.; Ye, K.J.; Reddy, P.-V.; Wu, G.S.; Wang, Y.A.; Tainsky, M.A.; Ye, C.J. Stochastic cancer progression driven by non-clonal chromosome aberrations. J. Cell. Physiol. 2006, 208, 461–472. [Google Scholar] [CrossRef] [PubMed]
- Kuznetsov, V.A.; Makalkin, I.A.; Taylor, M.A.; Perelson, A.S. Nonlinear dynamics of immunogenic tumors: Parameter estimation and global bifurcation analysis. Bull Math. Biol. 1994, 56, 295–321. [Google Scholar] [CrossRef] [PubMed]
- Letellier, C.; Denis, F.; Aguirre, L.A. What can be learned from a chaotic cancer model? J. Theor. Biol. 2013, 322, 7–16. [Google Scholar] [CrossRef]
- Abernethy, S.; Gooding, R.J. The importance of chaotic attractors in modelling tumour growth. Phys. A: Stat. Mech. Appl. 2018, 507, 268–277. [Google Scholar] [CrossRef]
- Huang, S. Genetic and non-genetic instability in tumor progression: Link between the fitness landscape and the epigenetic landscape of cancer cells. Cancer Metastasis Rev. 2013, 32, 423–44817. [Google Scholar] [CrossRef] [PubMed]
- Nikolov, S.; Wolkenhauerad, O.; Vera, J. Tumors as chaotic attractors, Molecular BioSystems 2014, 10, 172–179.
- Rocco, A.; Kierzek, A.M.; McFadden, J. Slow Protein Fluctuations Explain the Emergence of Growth Phenotypes and Persistence in Clonal Bacterial Populations. PLoS ONE 2013, 8, e54272. [Google Scholar] [CrossRef] [PubMed]
- Zhang, C.-Z.; Leibowitz, M.L.; Pellman, D. Chromothripsis and beyond: rapid genome evolution from complex chromosomal rearrangements. Genes Dev. 2013, 27, 2513–2530. [Google Scholar] [CrossRef]
- Lawrence, A.; Loeb, A. Mutator Phenotype in Cancer, Cancer Res. 2001, 61, 3230–3239.
- Tomlinson, I.P.; Novelli, M.R.; Bodmer, W.F. The mutation rate and cancer. Proc. Natl. Acad. Sci. 1996, 93, 14800–14803. [Google Scholar] [CrossRef] [PubMed]
- Olivier, M.; Hollstein, M.; Hainaut, P. TP53 mutations in human cancers: Origins, consequences, and clinical use. Cold Spring Harb Perspect Biol. 2010, 2, a001008. [Google Scholar] [CrossRef]
- Zack, T.I.; Schumacher, S.E.; Carter, S.L.; Cherniack, A.D.; Saksena, G.; Tabak, B.; Lawrence, M.S.; Zhang, C.Z.; Wala, J.; Mermel, C.H.; et al. Pan-cancer patterns of somatic copy-number alteration. Nat. Genet. 2013, 45, 1134–1140. [Google Scholar] [CrossRef] [PubMed]
- Fareed, M.M.; Dutta, K.; Dandekar, T.; Tarabonda, H.; Skorb, E.V.; Shityakov, S. In silico investigation of nonsynonymous single nucleotide polymorphisms in BCL2 apoptosis regulator gene to design novel protein-based drugs against cancer. J Cell Biochem. 2022, 123, 2044–2056. [Google Scholar] [CrossRef] [PubMed]
- Bormashenko, E.; Fedorets, A.A.; Dombrovsky, L.A.; Nosonovsky, M. Survival of Virus Particles in Water Droplets: Hydrophobic Forces and Landauer’s Principle. Entropy 2021, 23, 181. [Google Scholar] [CrossRef] [PubMed]
- Scott, S.E.; Redd, T.C.; Kuznetsov, L.; Mezić, I.; Jones, C.K.R.T. Capturing deviation from ergodicity at different scales. Physica D 2009, 238, 1668–1679. [Google Scholar] [CrossRef]
- Berger, S.; Procko, E.; Margineantu, D.; Lee, E.F.; Shen, B.W.; Zelter, A.; Johnson, R. Computationally designed high specificity inhibitors delineate the roles of BCL2 family proteins in cancer. Elife 2016, 5, e20352. [Google Scholar] [CrossRef] [PubMed]
- Schwede, T.; Kopp, J.; Guex, N.; Peitsch, M.C. SWISS-MODEL: an automated protein homology-modeling server. Nucleic Acids Research 2003, 31, 3381–3385. [Google Scholar] [CrossRef] [PubMed]
- Fareed, M.M.; et al. In silico investigation of nonsynonymous single nucleotide polymorphisms in BCL2 apoptosis regulator gene to design novel protein-based drugs against cancer. J. Cell Biochem. 2022, 123, 2044–2056. [Google Scholar] [CrossRef] [PubMed]
- Ramelot, T.A.; et al. Improving NMR protein structure quality by Rosetta refinement: a molecular replacement study. Proteins 2009, 75, 147–167. [Google Scholar] [CrossRef]
- Ku, B.; et al. 2011. Evidence that inhibition of BAX activation by BCL-2 involves its tight and preferential interaction with the BH3 domain of BAX. Cell Res. 2011, 21, 627–641. [Google Scholar] [CrossRef]
- Pierce, B.G.; Wiehe, K.; Hwang, H.; Kim, B.H.; Vreven, T.; Weng, Z. ZDOCK Server: Interactive Docking Prediction of Protein-Protein Complexes and Symmetric Multimers. Bioinformatics 2014, 30, 1771–1773. [Google Scholar] [CrossRef]
- Romero-Molina, S.; et al. PPI-Affinity: A Web Tool for the Prediction and Optimization of Protein-Peptide and Protein-Protein Binding Affinity. J. Proteome Res. 2022, 21, 1829–1841. [Google Scholar] [CrossRef] [PubMed]
- Kravtsov, V. Yu.; Rozanov, I.M.; Kaminskaia, E.V.; Iakovlev, A.F.; Vakhtin, Y.B. Izmenenie Chastoty Kletok s Mikroiadrami v Kletochnykh Populiatsiiakh Perevivnoĭ Rabdomiosarkomy RA-2 Krys v Resul’tate Otbora Na Povyshennuiu i Ponizhennuiu Chastotu Takikh Kletok [Changes in the Frequency of Cells with Micronuclei in Cell Populations of Rat Transplantable Rhabdomyosarcoma RA-2 as a Result of Selection for an Increased and a Decreased Frequency of Such Cells]. Tsitologiia 1992, 34, 91–102. [Google Scholar] [PubMed]
- Kravtsov, V.Y.; Iakovlev, A.F.; Kaminskaia, E.V.; Vakhtin, Y.B. Chastotoa Kletok s Mostami Pri Otbore Klonov Kletok Perevivnoĭ Rabdomiosarkomy RA-2 Krys Na Povyshenie i Snizhenie Chastoty Kletok s Mikroiadrami [Frequency of Cells with Bridges during Selection of Clone Cells of Transplantable Rat Rhabdomyosarcoma RA-2 on the Increase and Decrease of Micronucleated Cells]. Dokl. Akad. Nauk 1992, 324, 440–444. [Google Scholar] [PubMed]
- Kravtsov, V.Y.; Kaminskaia, E.V.; Iakovlev, A.F.; Vakhtin, Y.B. Patologicheskie Mitozy v Klonakh Sublinii Perevivnoĭ Rabdomiosarkomy Krys RA-2, Otselektirovannykh Na Povyshennuiu i Ponizhennuiu Chastotu Formirovaniia Spontannykh Mikroiader [Pathological Mitoses in Clones of the RA-2 Subline of Rat Transplantable Rhabdomyosarcoma Selected for Increased and Decreased Frequencies of the Formation of Spontaneous Micronuclei]. Tsitologiia 1994, 36, 211–214. [Google Scholar] [PubMed]
- Shityakov, S.; et al. Topological bio-scaling analysis as a universal measure of protein folding. R. Soc. Open. Sci. 2022, 9, 220160. [Google Scholar] [CrossRef]
- Shityakov, S.; et al. Folding-unfolding asymmetry and a RetroFold computational algorithm. R. Soc. Open Sci. 2023, 10, 221594. [Google Scholar] [CrossRef]
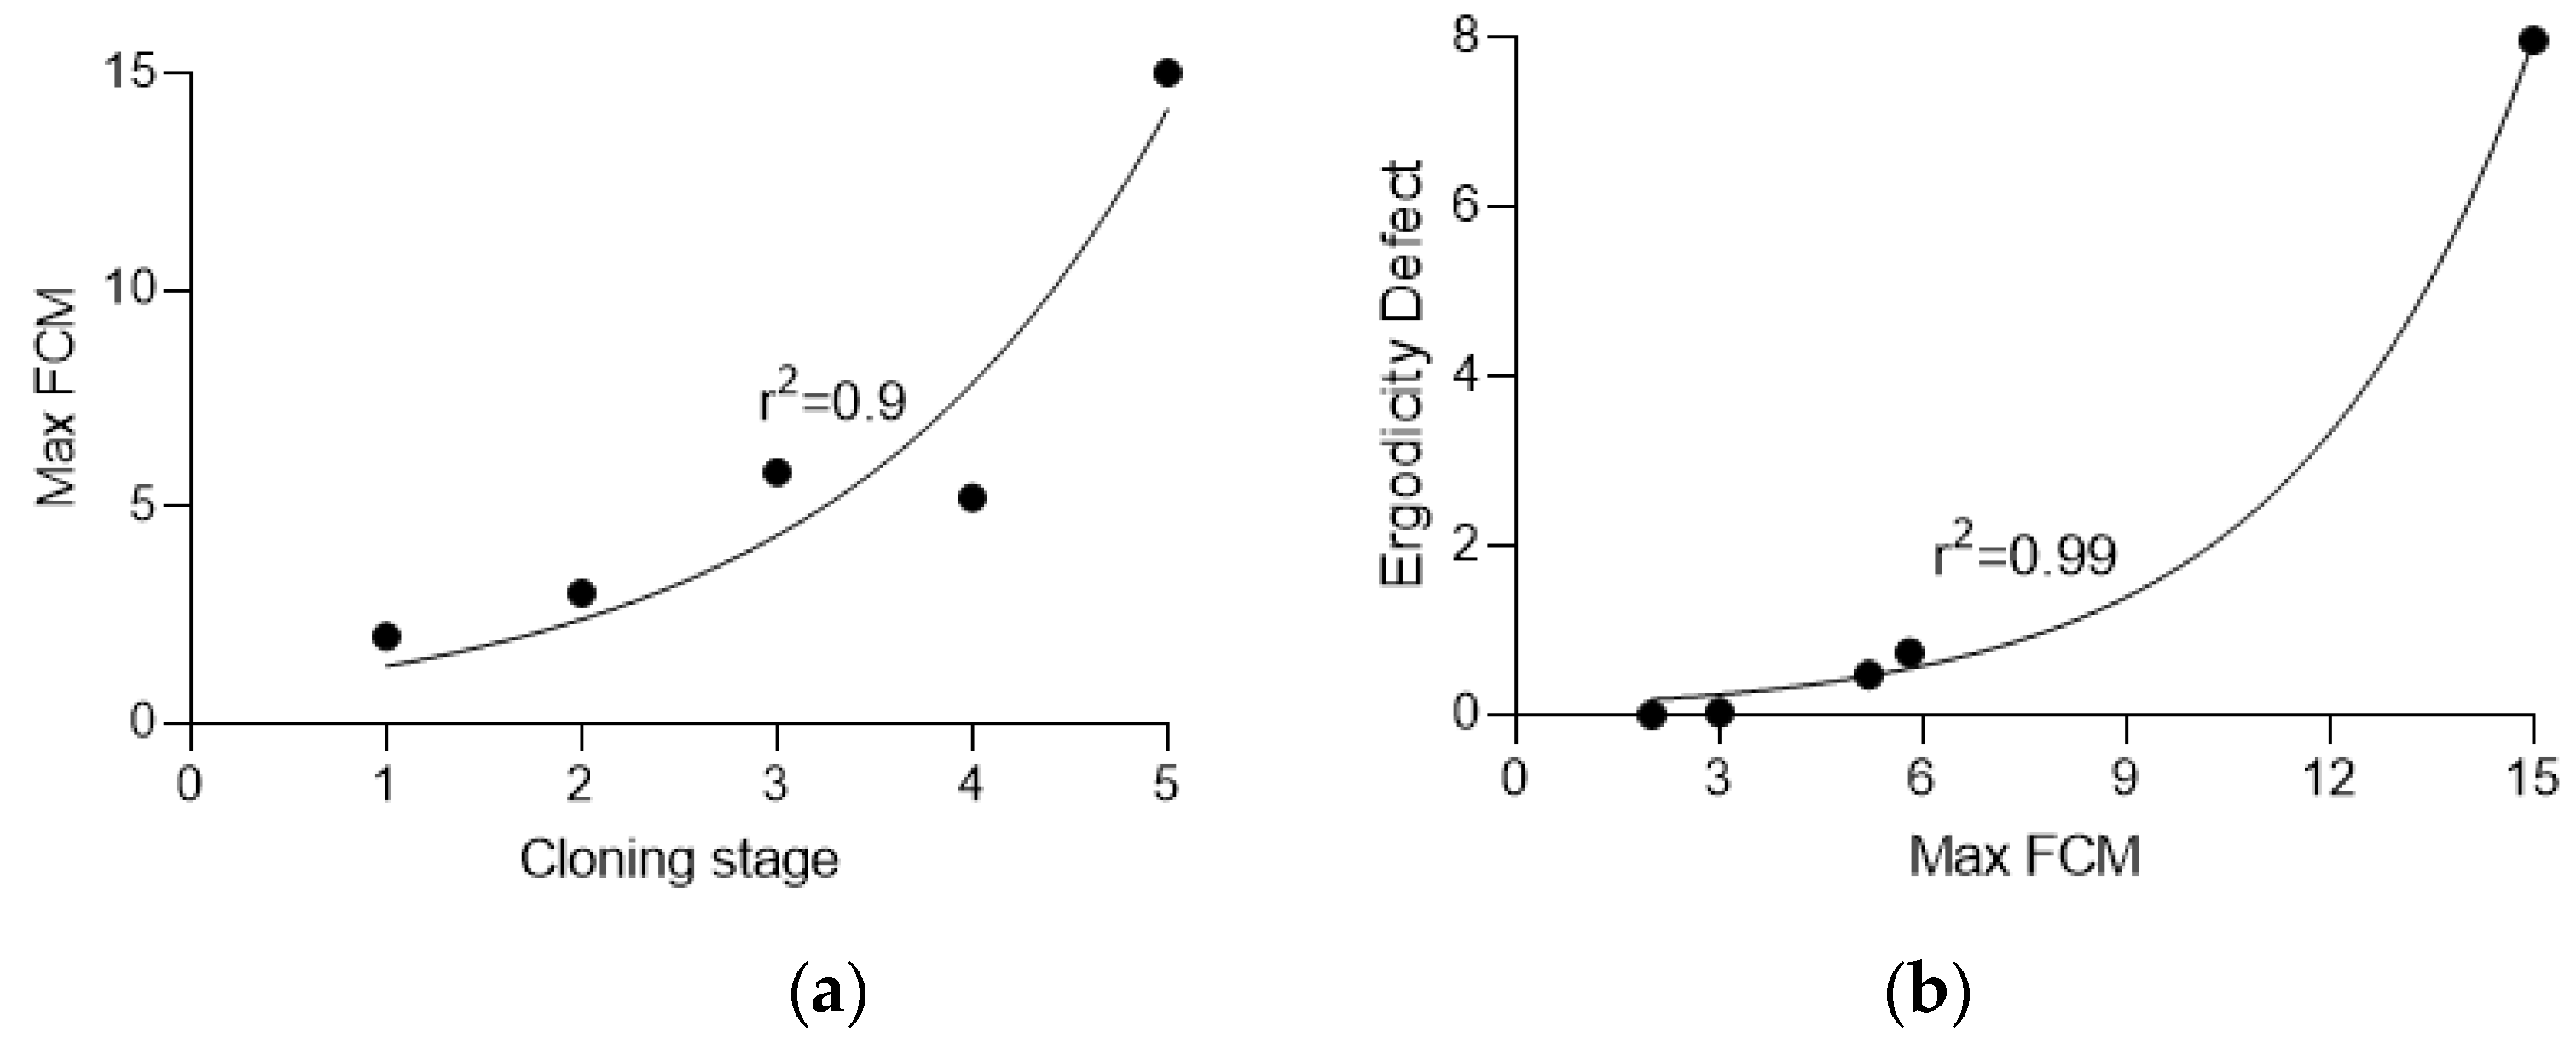
| Stage | Clones | Min FCM | Average FCM | Max FCM | Effective mutation rate, ×10-4 | Ergodicity defect |
|---|---|---|---|---|---|---|
| 0 | 48 | 0.0 | 0.6 | 2.0 | 6.99 | 0 |
| 1 | 50 | 0.0 | 0.8 | 3.0 | 8.99 | 0.03 |
| 2 | 52 | 0.0 | 1.7 | 5.8 | 17.98 | 0.74 |
| 3 | 48 | 0.0 | 1.6 | 5.2 | 16.98 | 0.48 |
| 4 | 47 | 1.0 | 4.7 | 15.0 | 47.95 | 7.96 |
Disclaimer/Publisher’s Note: The statements, opinions and data contained in all publications are solely those of the individual author(s) and contributor(s) and not of MDPI and/or the editor(s). MDPI and/or the editor(s) disclaim responsibility for any injury to people or property resulting from any ideas, methods, instructions or products referred to in the content. |
© 2023 by the authors. Licensee MDPI, Basel, Switzerland. This article is an open access article distributed under the terms and conditions of the Creative Commons Attribution (CC BY) license (http://creativecommons.org/licenses/by/4.0/).


