Preprint
Article

Sustainable Development: Why Is It Not Delivering on Its Promises? Insights from a Social-Ecological System Modelling Perspective

Altmetrics

Downloads

162

Views

44

Comments

0

A peer-reviewed article of this preprint also exists.

Submitted:

28 November 2023

Posted:

29 November 2023

You are already at the latest version

Alerts
Abstract
At the Rio Conference in 1992, the sustainable development agenda promised a new era for natural resource management, where the well-being of human society would be enhanced through the sustainable use of natural capital. Several decades on, economic growth continues unabated at the expense of natural capital, as evidenced by biodiversity loss, climate change and further environmental issues. Why is this happening and what can be done about it? In this research, we present three Agent-Based Models that explore the social, economic and governance factors driving (un)sustainability in complex social-ecological systems. Our modelling results reinforce the idea that the current economic system does not protect the natural capital on which it depends. This is due to a disjunction between the economic and environmental elements upon which the sustainable development paradigm is founded. Additionally, various factors appear to enhance social-ecological system unsustainability: the role of financial entities and monetary debt; economic speculation; technological development and efficiency; lack of long-term views and late government interventions; inefficient tipping point management; and the absence of strong top-down and bottom-up conservation forces. Interestingly, alternative scenarios showed that these same factors could be redirected to enhance sustainable development. The current economic system may, therefore, not be inherently unsustainable, but rather specific economic mechanisms, agents’ decision-making, and the kinds of links between economic and natural systems could be at the root of the problem. We argue that short- and medium-term sustainability can be enhanced by implementing mechanisms that shift capitalist forces to support environmental conservation. Long-term sustainability, however, requires further paradigm change: where the economy integrates, and fully accounts for, externalities and recognises the actual value of natural capital.
Keywords: 
Subject: Environmental and Earth Sciences  -   Other

1. Introduction

It is widely recognized that sustainability represents the greatest challenge for humanity in the Anthropocene (Wu 2013; IPBES 2019). Much has been written on the complex set of environmental problems facing humanity, such as climate change and biodiversity loss, although the practical solutions are less evident (Costanza 2007; UN 2016; IPBES 2019).
One of the key challenges to developing and deploying these solutions is the fact that our economic system is not institutionally embedded within the wider, more important environmental system (Berkes and Folke 1998). The current economic paradigm, therefore, remains the growth strategy initiated by the Bank of England around 1700 (Martenson 2010), where the economic system was neither constrained by, nor created upon, the biophysical limits of the environment. Whilst this system may have served us well for 400 years, the degradation and damage to the environment highlights the need for a different approach to securing human health and wellbeing (Ward et al. 2016).
Global sustainability is only possible with transformative changes that address the actual drivers of the root economic, social, and technological causes of nature’s deterioration (Diaz et al. 2018). If economic growth is not absolutely decoupled from environmental pressures, the systems that support life on this planet will collapse (Smith et al. 2010), jeopardising the future availability of natural resources, such as food, water, and minerals, as well as human wellbeing (Costanza et al. 1997; World Economic Forum 2014). Only immediate transformation of global business-as-usual economies and operations will sustain nature.
Different pathways have been proposed to enhance a more sustainable economy, including steady state and degrowth approaches (Daly 1991; Jackson 2009), green growth (OECD 2011), circular economy (Pearce and Turner 1990), among others. However, none of these have been successful at transforming our economic system (Smith et al. 2010). One of the problems is that most existing approaches are based on the largely monodisciplinary science of the 1950s, '60s and '70s, which were not designed to address the current complex environmental problems (De Greene 1993; Gunderson et al. 1995; Lee 1993; Meadows and Robinson 1985). In the mid-20th century, sustainability issues were considered to be largely local, reversible, and direct; today, we know that impacts are dynamic, interconnected and occur across broad geographical and economic scales (Daily 2000; Lambin et al. 2001). Thus, while past scientific approaches were based on mono-disciplinary ideas that neglected system complexity (Gleick 2003; Holling and Meffe 1996; Ludwig 2001; Pahl-Wostl 1995), today it is widely recognized that sustainability cannot be attributed to a single cause, but rather to a set of multivariate, non-linear, cross-scale and dynamic factors (Holling et al. 1998; Dearing et al. 2011).
With the aim of addressing system complexity, scholars have started to treat social, economic, and ecological systems within a single coupled system (Folke, 2006; Gunderson and Pritchard 2002; Ostrom 2007 & 2009). This system is composed of people and nature, defined as a social-ecological system (SES) (Redman et al. 2004). This shift in the mindset of researchers emphasized that humans should be seen as a part of, and not apart from, nature (Holling et al. 1998; Redman et al. 2004). In response, diverse frameworks have been developed to structure research into SESs (see Redman 1999; Holling and Allen 2002; Newell et al. 2005; Ostrom 2007 & 2009; Pahl-Wostl 2009; Scholz 2011), characterized by being complex, dynamic, adaptive, interactive, and multi-scalar (Redman et al. 2004).
Given the multiple timescales of ecological change, and the complex features of socioeconomic dimensions (Brock and Carpenter 2007), systemic, holistic, integrative, interdisciplinary approaches, and conceptual frameworks are needed to better understand SESs. In this regard, SES science has much to gain from computer modelling approaches that allow for a better understanding of system complexity, such as Agent-Based Modelling (ABM). ABM facilitates the exploration of the interactions among autonomous and heterogenous agents through the property of emergence, by evolving relationships among the elements that characterize systems and their diverse equilibria (Epstein 2006). This modelling approach integrates heterogeneity, feedback loops and multi-scalar interactions (Heckbert et al. 2010) and has been widely used in ecology —known as individual-based modelling (IBM) (Grimm 1999; DeAngelis 2005)— and economics through Agent-Based Computational Economics (ACE) (Farmer and Foley 2009). ABMs are helpful for studying complex dynamics in SES, and for gaining insights that support sustainable management of natural resources (An et al. 2014; Filatova et al. 2013; Gonzalez-Redin et al. 2018; Schulze et al. 2017).
Here we present three ABMs, one conceptual and two that are based on case-studies, developed under a SES framework, to analyse if socioeconomic and governance factors hinder sustainable development in SESs. The three ABMs, initially constructed as part of a doctoral thesis —see Gonzalez-Redin (2018)— have been published as scientific articles (see Gonzalez-Redin et al. 2018; Gonzalez-Redin et al. 2019 (a,b)). This article summarizes the main modelling outcomes, and provides new SES insights on the following question: what drives (un)sustainable development in SESs?

2. Materials and Methods

The Methodology is divided into four sections. First, the conceptual framework of the research is presented, where the SES integrated in the three ABMs is analyzed and described. Second, the context of the research is detailed, together with a description of the study areas. Third, the overall ABM approach is addressed. Finally, the specific ABMs are characterized and described to highlight detailed aspects of the SES being investigated.

2.1. Modelling framework

We built an integrated framework as a basis for the ABMs to be developed. This framework is based on the preprint doctoral thesis performed by Gonzalez-Redin (2018). The framework itself is inspired by two well-known SES frameworks; the Social Ecological Systems Framework (SESF) (Agrawal 2003; Ostrom 2007 & 2009), and the Ecosystem Services Framework (ESF) (Costanza et al. 1997; MEA 2005; TEEB Foundations 2010; Turner and Daily 2008).
Our integrated framework (Figure 1) includes a natural and socioeconomic system, where ecosystem services (ESS) flow in both directions, including feedbacks and nonlinearities. ESS and biodiversity —understanding biodiversity as the biotic element of natural capital— act as links between the socioeconomic and natural systems. Additionally, economic-financial, and protection-conservation forces refer, respectively, to market and economic powers (e.g., land privatization and acquisition, bank credit lending to companies involving deforestation), and environmental governance powers (e.g., land restoration and protection policies), that drive land-use change (LUC) and other anthropic processes, thus affecting natural capital and its biodiversity. Consequently, these changes affect land capacity to provide different ESS, as well as the socioeconomic context of the system (i.e., ES beneficiaries), and the financial capital of users.
The framework is bi-directional, thus decisions from ES users also affect biodiversity and the capacity of the natural system to deliver different ESS. Similarly, both economic-financial and protection-conservation forces influence each other directly —as represented by the dashed-arrows on top of Figure 1— and are also affected by the state of the SES itself —note the bi-directional arrows coming into both forces. Also, both protection-conservation and economic-financial forces are located inside and outside the SES boundary, since these represent inner and outer (to SESs) forces affecting SES sustainability. Finally, the dashed-shaped overlap in the centre of the SES represents the current disjunction between socioeconomic and natural systems, and the extent of (de)coupling between both systems is represented by the dashed arrows to the sides of the dashed oval.

2.2. Context and study years

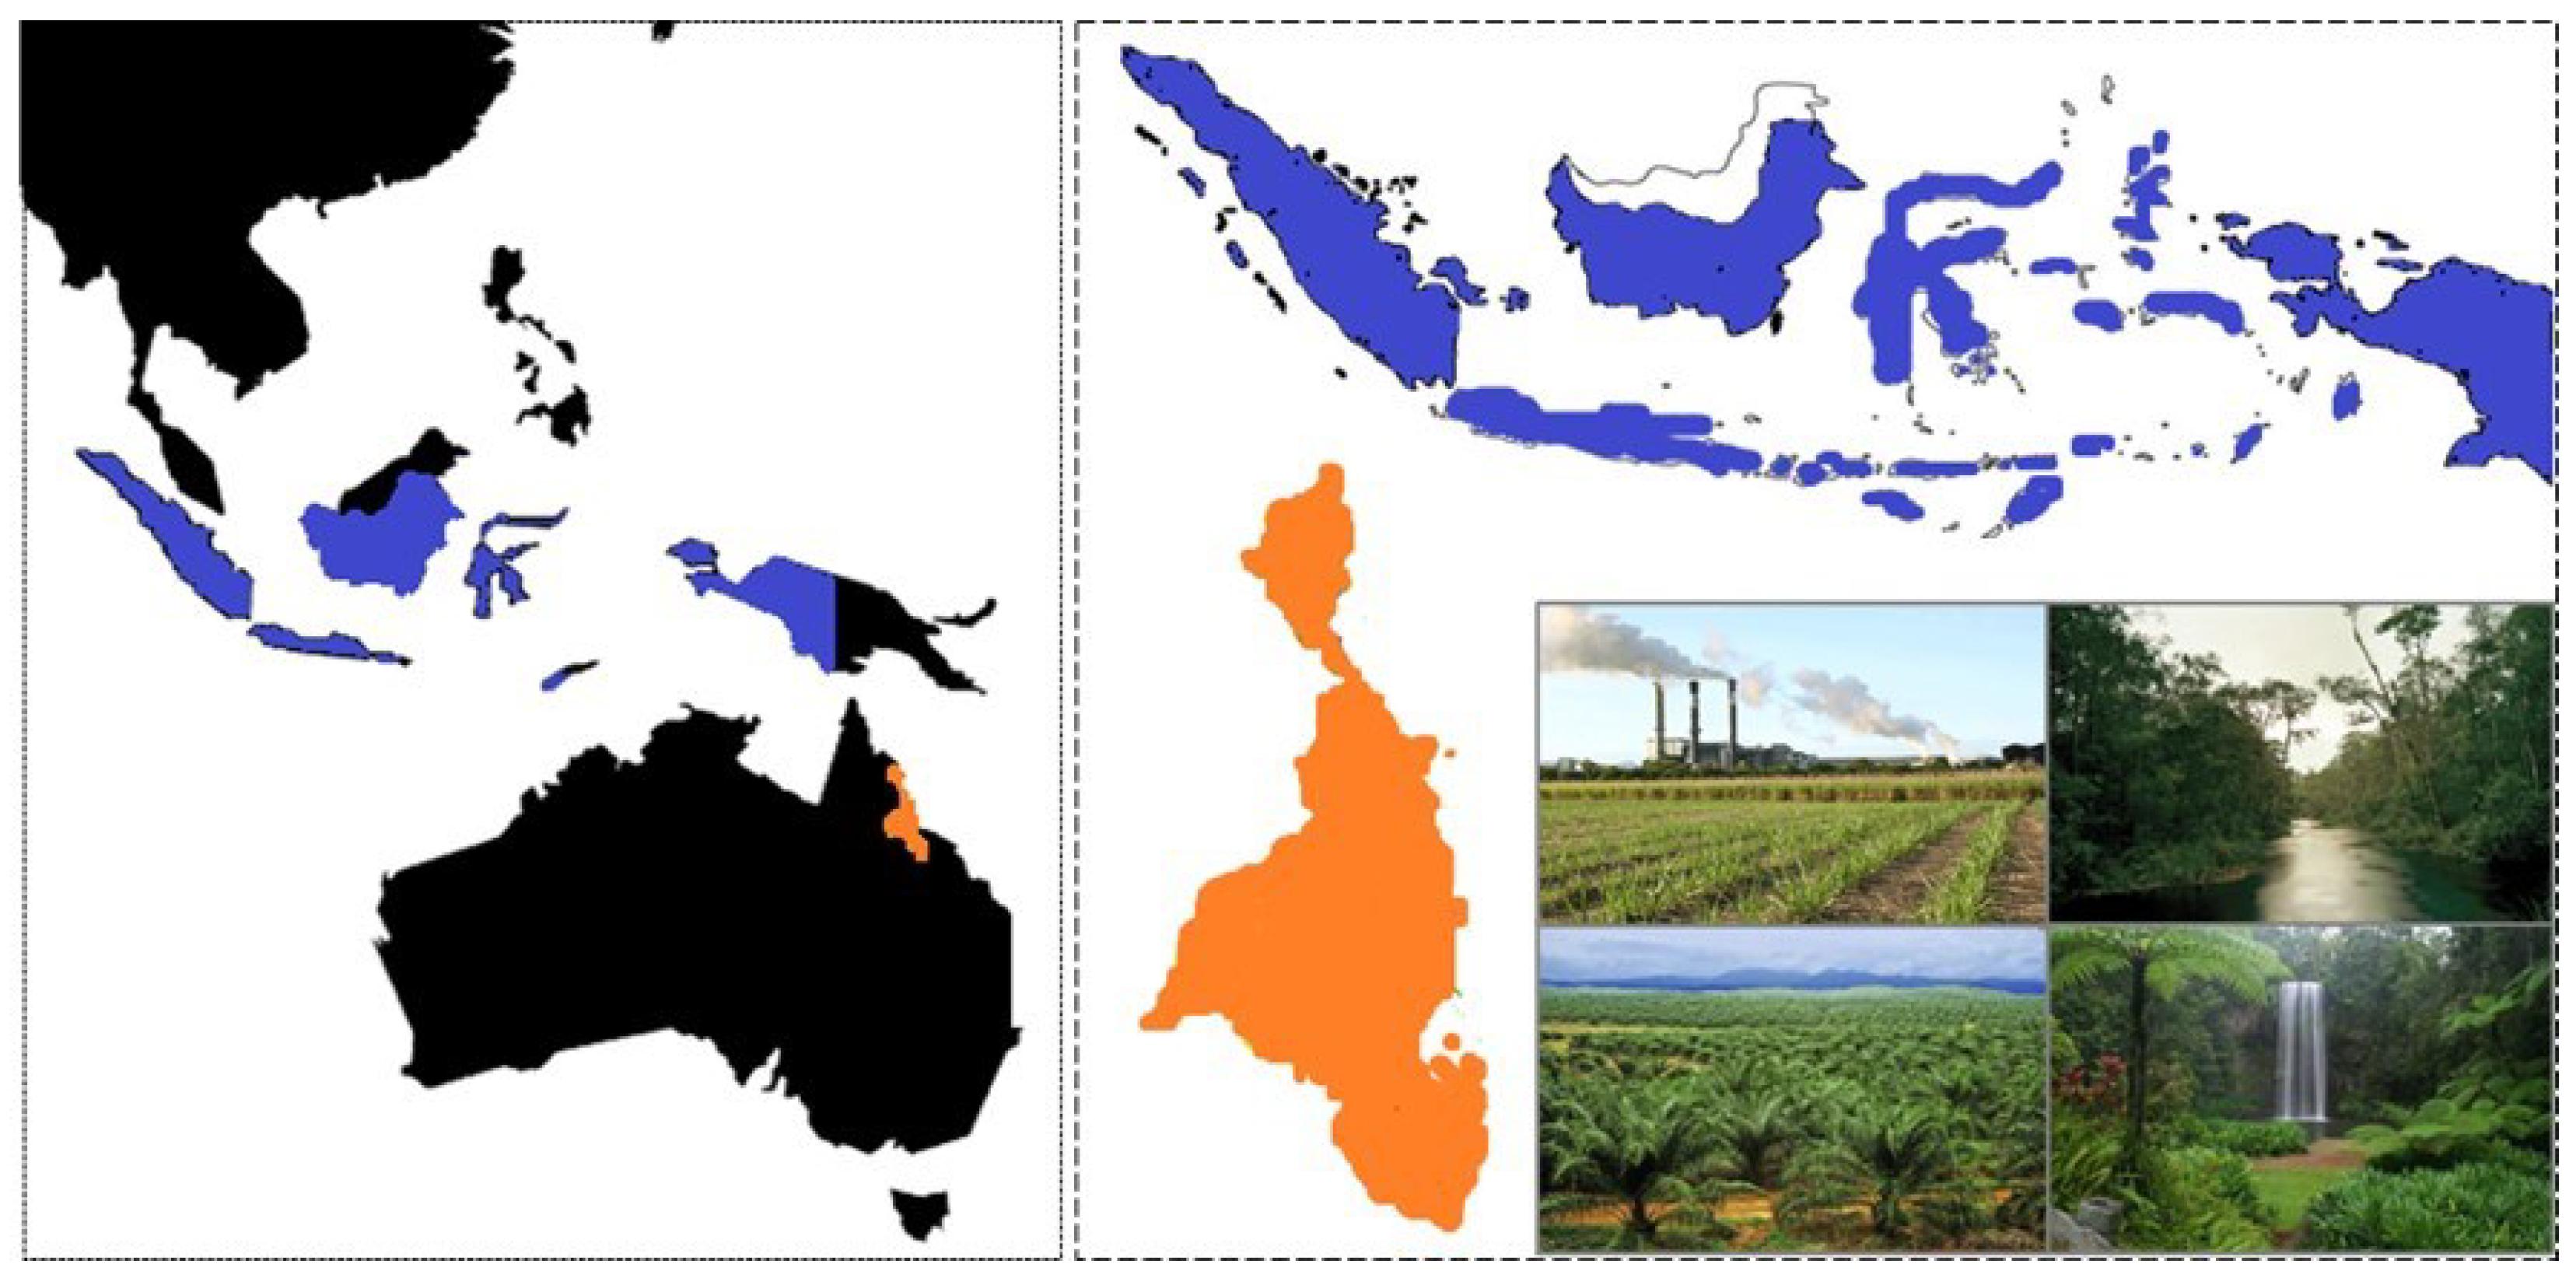
Our research adopts both conceptual and empirical approaches, where two of the models are case studies, one in Indonesia and the other in the Wet Tropics of Queensland, Australia (Figure 2). Tropical regions are suitable examples of SESs, where the interactions between the human society and the environment are strong, complex, and dynamic (Folke et al. 2002; Redman et al. 2004). Furthermore, tropical SESs present a suitable context to explore those factors enhancing SES (un)sustainability, i.e., based on a key trade-off for achieving global sustainability: food production–climate change mitigation–biodiversity conservation (Neldner, et al. 2017; Taylor 2010). First, tropical SESs are essential areas for feeding the growing human population (Fedoroff et al. 2010), where a 50% increase in food production will be needed by 2050 to sustain the rising food demand, in addition to ending hunger, achieving food security, and improving nutrition (Nellemann et al. 2009, Swamy et al. 2018; Molotoks et al. 2020). Second, there is a need to reduce emissions from deforestation and land degradation to halt global warming (Angelsen 2008), where tropical SESs serve as an important medium for urgent action to combat climate change (Swamy et al. 2018). Third, tropical SESs play a key role in conserving terrestrial ecosystems and halting biodiversity loss (Swamy et al. 2018).
The above-noted trade-offs is present in both Indonesia and the Wet Tropics of Queensland (AgriFutures 2017; ICCT 2016; Neldner et al. 2017). However, the socioeconomic and governance contexts of these regions are almost opposing. While in Indonesia deforestation forces are stronger than those driving forest protection —as is the case for most tropical regions in developing countries (Hill et al. 2015)— the opposite is the case in the Wet Tropics of Queensland, where protected areas increased by around 20% from 1999 until 2015, with a total of almost 80% of land currently protected (DSITI, 2016; Weber et al 2021). The governments of Queensland and Australia have more funding available for conservation as compared to Indonesia, while developing countries’ ability to focus on environmental goals is impeded because basic living necessities have not been achieved (Omoju 2014). In fact, halting environmental pressures in developing countries may undermine growth and competitiveness of an economy that is highly dependent upon natural resources (Omoju 2014).
In short, the almost opposing socioeconomic and governance contexts in Indonesia and the Wet Tropics, while having the same trade-offs among climate change, biodiversity conservation and food production, provide an interesting research opportunity to examine what socioeconomic and governance factors drive (un)sustainability in complex SESs.

2.3. Agent-Based Modelling

ABM explores how interactions among agents generate the property of emergence, by revealing patterns that characterize system dynamics (Epstein 2006). More specifically, ABMs simulate interconnected autonomous and heterogeneous agents. These agents interact with each other and the environment, with decisions and actions affecting each other and the environment as a result (Ferber 1999). The benefits of using ABM to simulate SESs can be captured in four statements (Bonabeau 2002): (i) ABM captures emergent phenomena; (ii) agents are heterogeneous, which allows the simulation of complex and nonlinear behaviour as well as limiting agent rationality; (iii) ABM provides a dynamical natural description of a system rather than the final output results; and (iv) ABM allows the inclusion of social networks and physical spatial interactions, which is difficult to account for with other modelling approaches.
The capacity of ABM to model complex SESs from the bottom-up, based on interactions among heterogeneous actors, is essential to model our SESs. Furthermore, ABM allows for outcomes that occur at one point in time to influence future events, an essential characteristic to model future scenarios and a key aspect of our research. Finally, very few modelling methods offer the possibility of creating spatially explicit and hybrid models that integrate two or more modelling techniques.

2.4. Models’ description

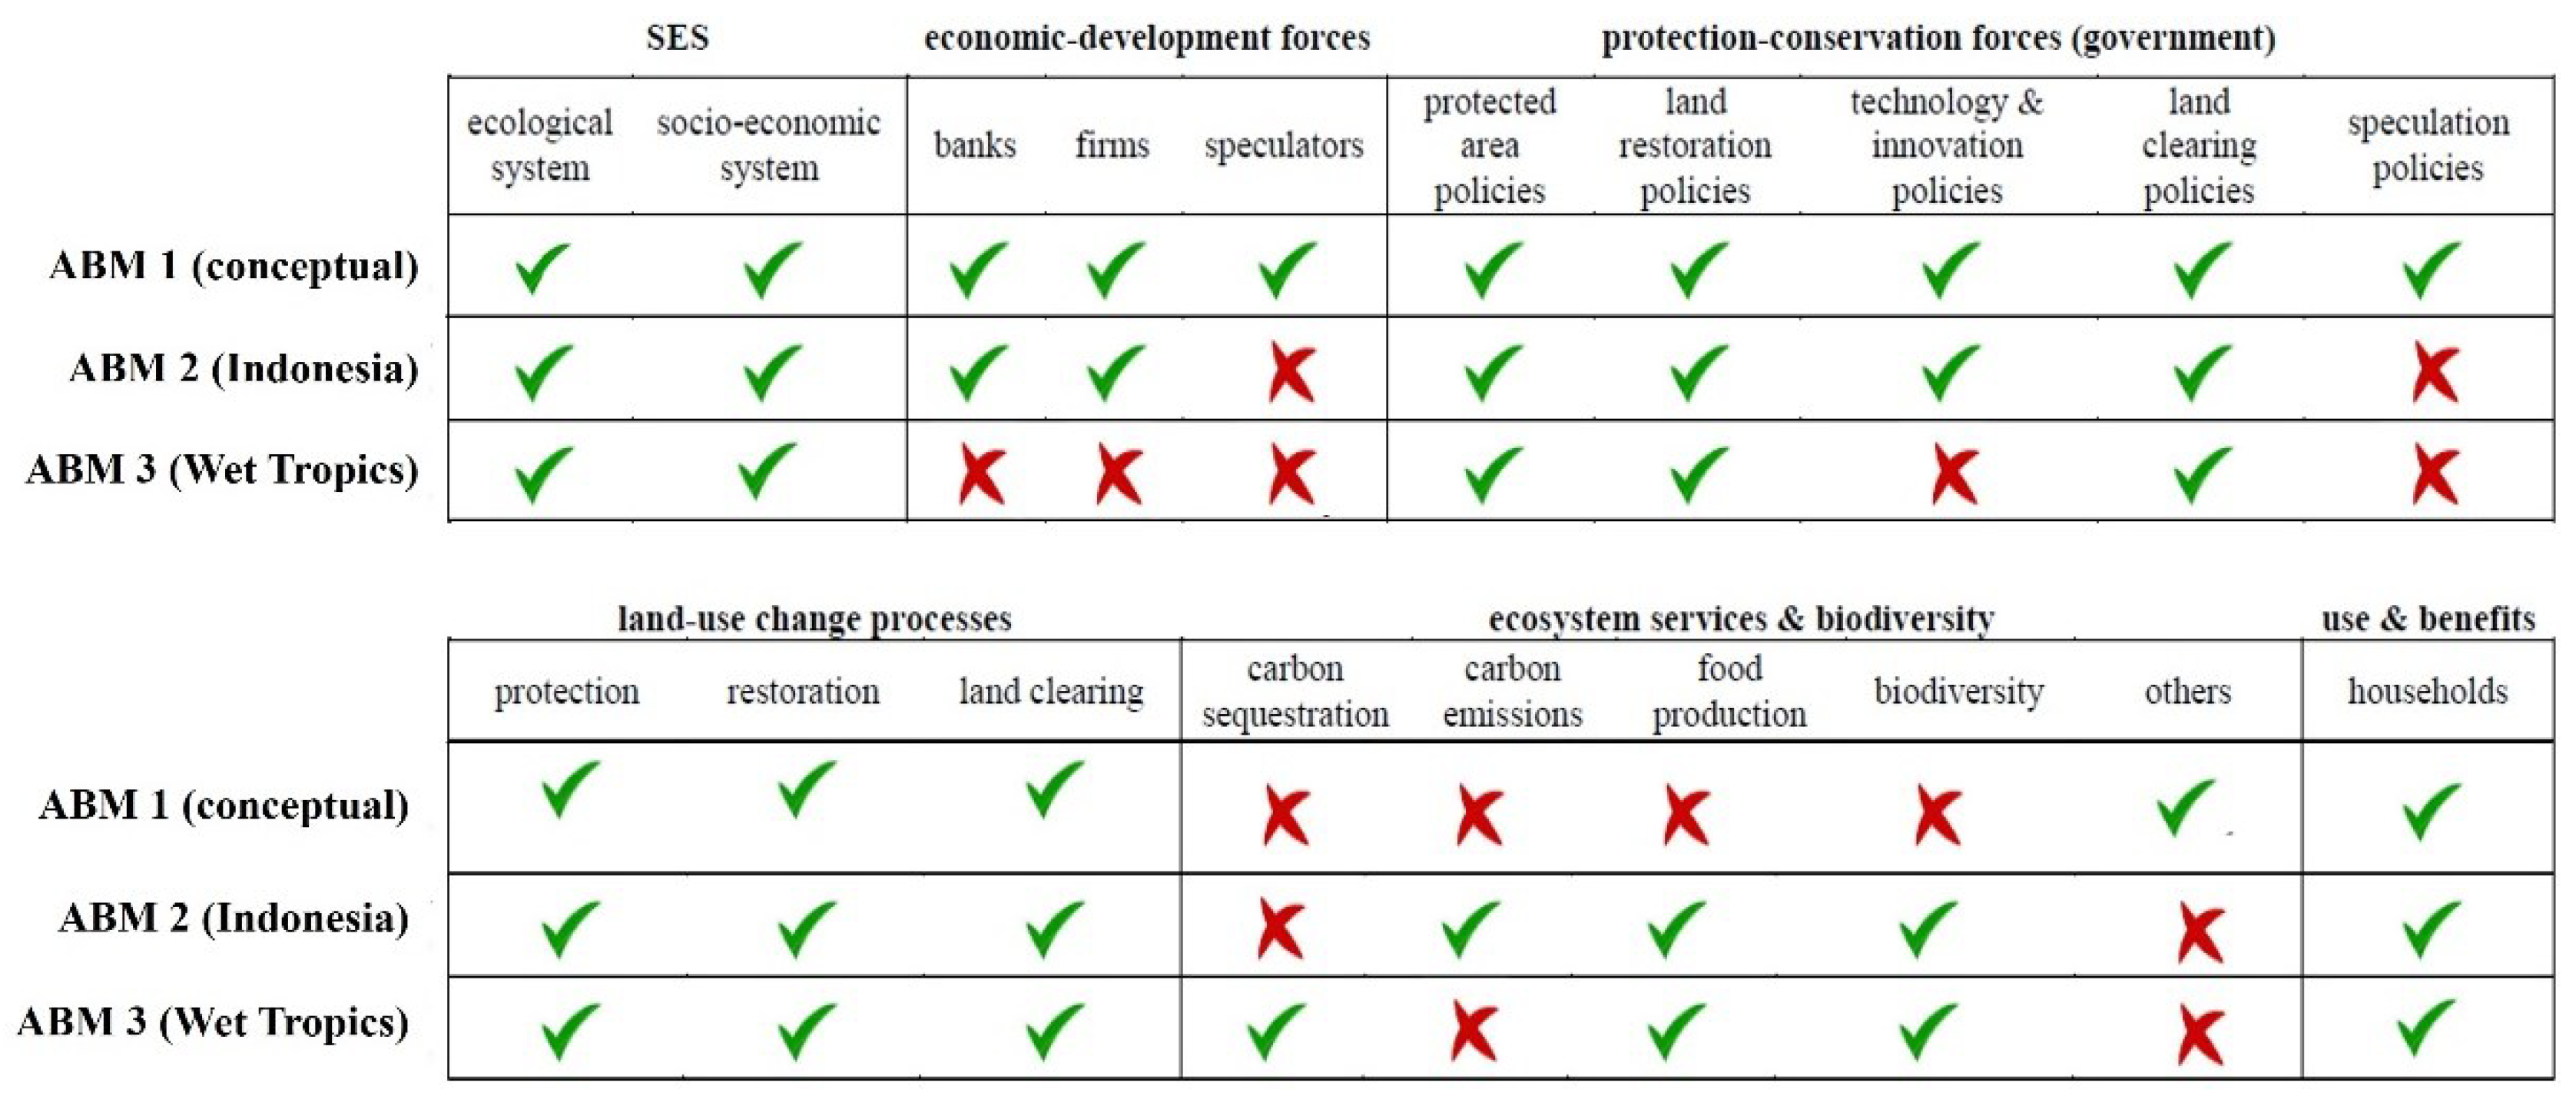
Our three models —one conceptual, two case-study-based— were developed using NetLogo (Wilensky 1999) as part of the preprint doctoral study of Gonzalez-Redin (2018). The models integrate the conceptual framework (Figure 1) and, as such, share certain modelling processes and characteristics. With the aim of describing the basic, and shared, framework and modelling elements between the three models, Figure 3 shows the model interoperability. This figure analyses those framework characteristics (top row, in bold) and modelling elements and processes (second row from top) that are present in each of the three models (left column). The filled circle in Figure 3 means that the corresponding framework or model element is explicitly modelled in the ABM, while the empty circle means that it has been modelled implicitly. In other words, explicitly modelled elements are those with specific variables, agents, input data and/or processes in the model that represent them. Implicitly modelled elements are distinct from not being modelled at all, yet these can be inferred from the status of other parts of the model.
The key entities in all three models are agents —representing firms, banks, speculators, governments, and households (consumers)— and the environment —consisting of a grid of land-covers (i.e., patches). Although agents are heterogeneous and, therefore, follow their own decision-making processes in each model, we set a common ground for all ABMs by modelling two types of agents: economic agents and conservation agents. Economic agents, in all models, drive resource extraction, production and consumption processes. In particular, economic agents consist of firms, extracting and selling resources; households, buying and consuming such resources; banks, funding resource extraction processes through credits; and speculators, borrowing credits from banks to purchase derivatives and speculate on what price produced goods (i.e., assets) will reach by a future date.
Economic agents possess a profit-seeking behaviour, which enhances (directly or indirectly) continuous economic growth through agricultural expansion, regardless of the potential environmental impacts exerted on the environment. Thus, economic agents are self-interested entities and individuals focused on maximizing utility as a consumer, and profit as a producer, in a competitive market setting. Our economic agents also integrate personal-irrationality, subjectivity, and more complex decision-making processes. The latter aligns with recent criticisms with the conception of Homo economicus (e.g., Jones 2015; Rankin 2010), which argues that considering market actors as fully rational, self-serving individuals is an overtly simplistic and one-dimensional proposition.
The other relevant agent type in our ABMs is the one representing conservation forces, i.e., conservation agents. Thus, government agents, in our models, represent those government policies focused on enhancing environmental benefits, e.g., land protection, degraded land restoration. The goal of government agents is to counterbalance the negative effects exerted on the environment by economic agents. The inclusion in the models of two opposing types of agents (economic and conservation agents) sets a suitable context to study the extent to which power (im)balances between economic growth and environmental sustainability enhance SES (un)sustainability.
A detailed description of the ABMs can be found both in Gonzalez-Redin (2018) —preprint doctoral thesis— and in the following three articles, each corresponding to one of the three ABMs: Gonzalez-Redin et al. (2018); and Gonzalez-Redin et al. 2019 (a,b).

3. Results

We present the results from the three ABMs, which simulate the dynamics of different complex SES, each of which integrates a particular debt-based economic system driven by economic growth. Economic growth is opposed by environmental forces, thereby enabling us to analyse which socioeconomic and governance factors drive SES (un)sustainability.

3.1. ABM 1 (SES: conceptual): re-coupling economic growth and natural resource availability

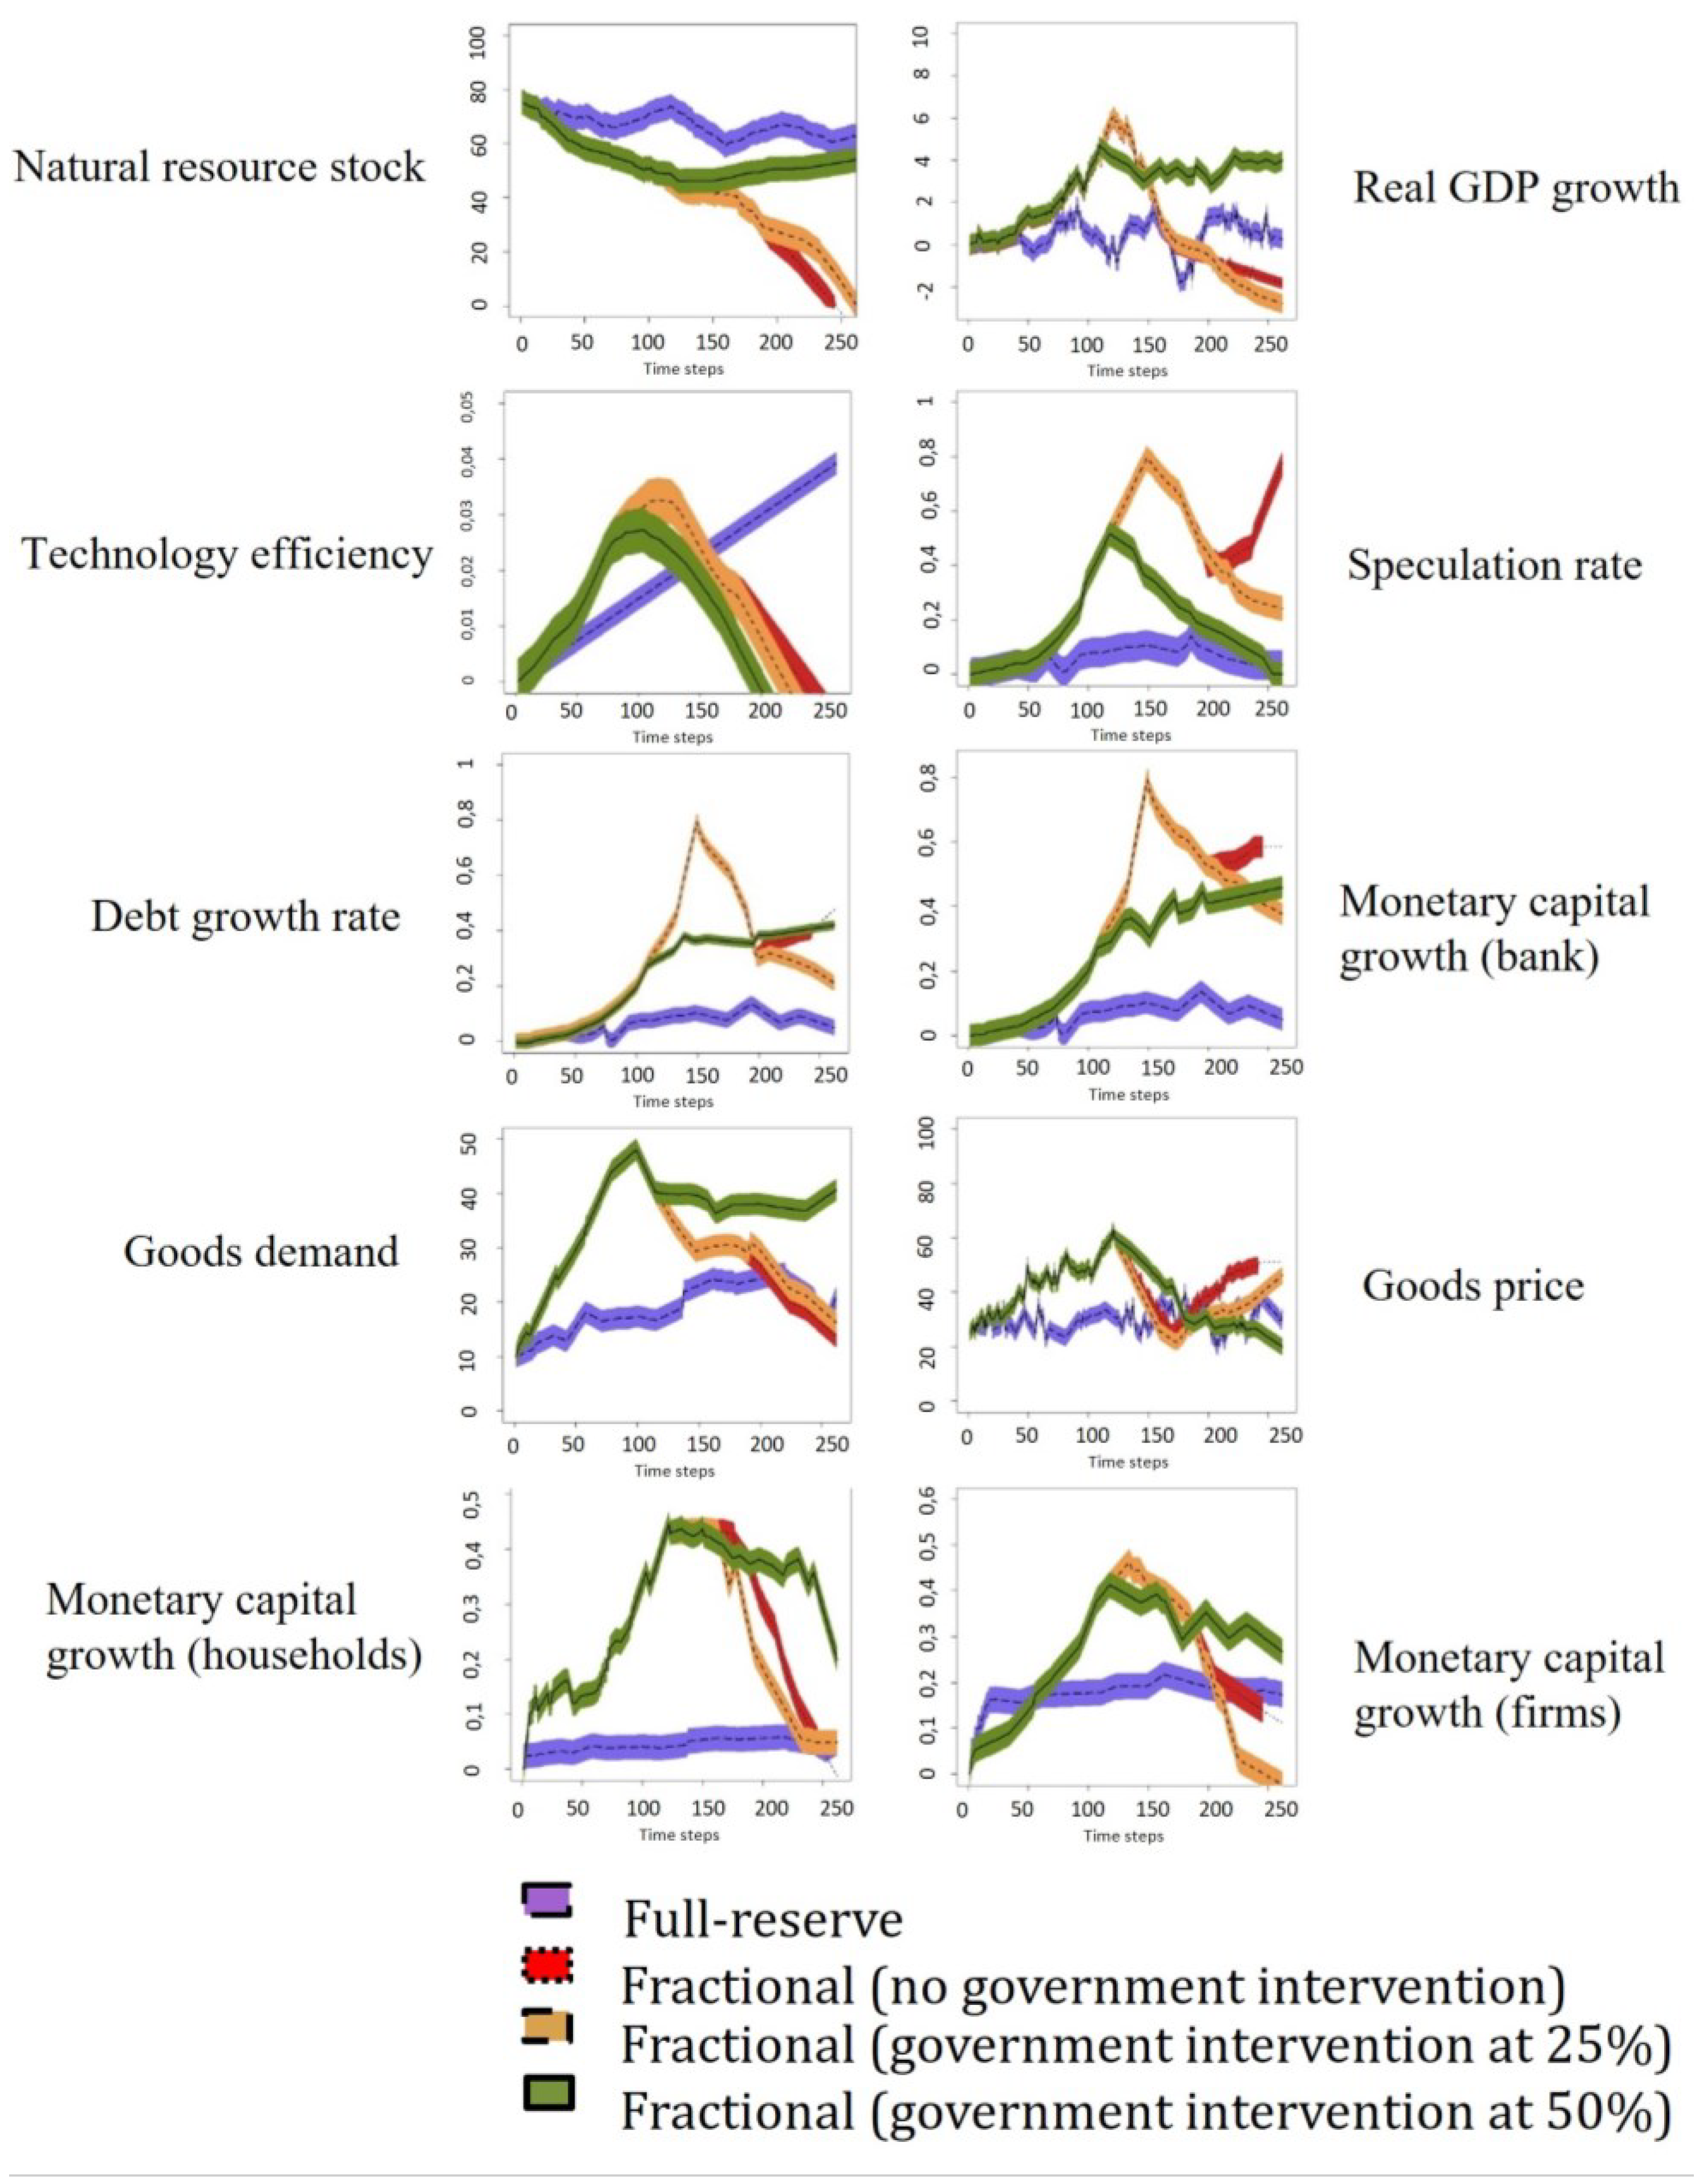
Table 1 describes the two scenarios modelled under ABM 1: non-debt (full-reserve) and debt-based (fractional-reserve) economic systems, the latter also including government intervention through conservation policies for two different critical biomass stock thresholds: 25% and 50%. These values state the maximum stock of natural resources (in per cent values) that need to be left in the system for the government to intervene (see Gonzalez-Redin et al. (2018) for the justification on the selection of these values). Figure 4 shows the results obtained from ABM 1.

3.1.1. Debt-based fractional-reserve system (no government intervention)

Under debt-based (fractional) economic systems, with no government intervention (see red curves), firms can cover their daily expenditures, wages, and investments for technological development, due to the high availability of natural resources and bank credits. In the processes of selling goods and borrowing (lending) credits, both firms and banks gain profits. Households also benefit from the consequent rise in wages implemented by firms. Overall, this process maintains continuous economic growth, fuelled by loans that drive increasing labour productivity. The increasing level of debt, and the tendency to borrow more when profits increase, has no apparent effect on the economy at this point. From an environmental perspective, the increasing extraction of resources affects natural resource stocks, thus showing decreasing values as the simulation continues.
At the same time, the rise in speculation shows that some monetary capital funding economic growth enters the system according to speculative goals, instead of purely production-oriented goals. This is due to the presence of speculator agents, who also borrow credits to gain future profits by trading assets on a rising market. As credit borrowing by speculator agents occurs when prices and GDP increase, this process starts enhancing price inflation and, as a result, further speculation. This reinforcing cycle enhances a growing debt burden that adds no productivity value to the system.
Once speculation, economic growth and the debt burden indicators reach their peak, households cannot afford to consume goods anymore. As a result, the demand for goods and firms’ monetary capital decrease, which in turn reduces labour due to the inability of firms to pay wages. This purchasing power loss by households enhances a deflationary process, while firms are no longer able to fund investment in technological development for improving production efficiency. Furthermore, price deflation reduces speculation, since the number of speculators in the system is directly correlated with inflationary processes. Thus, most speculators go bankrupt, which reinforces further price deflation. Because most speculators are not able to pay back debt credits to the bank, unpaid debt stocks become the bank’s debt. This reduces the capital available for credit lending, thus creating a domino effect affecting firms and households.
From an environmental perspective, the reduction of resource extraction processes benefits natural resource stocks. Eventually, the drop in prices encourages higher household demand for goods and a period of system stability. However, because this rise is not sufficient to increase firms’ monetary capital, GDP values continue to decrease —albeit at a lower rate than under high speculation values. The economy starts to recover slightly, and the rise in prices attracts speculator agents again, which enhances debt stocks and further increase in prices —albeit at a lower rate than at the beginning of the simulation. Because natural resources are almost fully depleted from the excessive resource extraction, both firms’ income and production of goods are affected, thus reducing the capacity of firms to repay borrowed credits back to the bank. This new context affects banks, firms, speculator agents and households negatively. Eventually, natural resource collapse occurs, thus creating the breakdown of the system and ending the simulation.

3.1.2. Non-debt based full-reserve system

Figure 4 also shows the results obtained under a full-reserve system (see purple curves), where the bank is forced to keep 100% of households’ deposits available for withdrawal. The amount of capital allocated by the bank for credit lending is not 0%, though it is nevertheless comparatively low, since the bank still generates money for credit lending from the difference between credit interests (gains) and deposit interests (losses).
Under this scenario, most environmental and economic indicators remain relatively stable over time, compared to those under fractional-reserve systems. Yet, this stability is achieved at low ranges of values regarding ‘Natural resources stock’, ‘Real GDP growth’, ‘Debt growth rate’, ‘Speculation rate’, and ‘Monetary capital growth (firms, households and bank)’, as well as the rest of indicators. Basically, the low allocation of credits (debt) by the bank for both production-oriented (through firms) and speculative (through speculators) goals creates a system with low income and profits, yet also with low environmental impacts. As a result, model results neither show economic nor environmental collapses during the simulation period, since the risk of natural resource depletion, as well as high speculation, debt, or inflation rates (which increase the probability of economic collapses) is low.

3.1.3. Government intervention in fractional-reserve systems

The implementation of government policies under a fractional-reserve system was modelled. In our model, conservation governance is used as a process to counterbalance the negative environmental impacts exerted by economic activities. The policies focus on enhancing the sustainability of natural resources only if their total stock in the system drops below two specific thresholds, i.e., 25% and 50% (of the initial stock). Figure 4 shows that conservation policies, implemented only after ‘Natural resources stock’ drops below 25% of its initial capacity, are not able to prevent system collapse (see yellow short-dash curves). In particular, the small amount of natural resources left by then, as well as the high rates of technological development and resource extraction processes, create an unsolvable context for the government in terms of avoiding system collapse. Interestingly, GDP, after government intervention, decreases over time at a higher rate than under fractional-reserve systems with no government intervention. In contrast, conservation policies implemented before the system’s total natural resource stock drops below 50% (green solid curves) are able to enhance natural resource stability over time, with no system collapses during the simulation period.

3.2. ABM 2 (SES: Indonesia): the how, instead of the what, to achieve sustainability

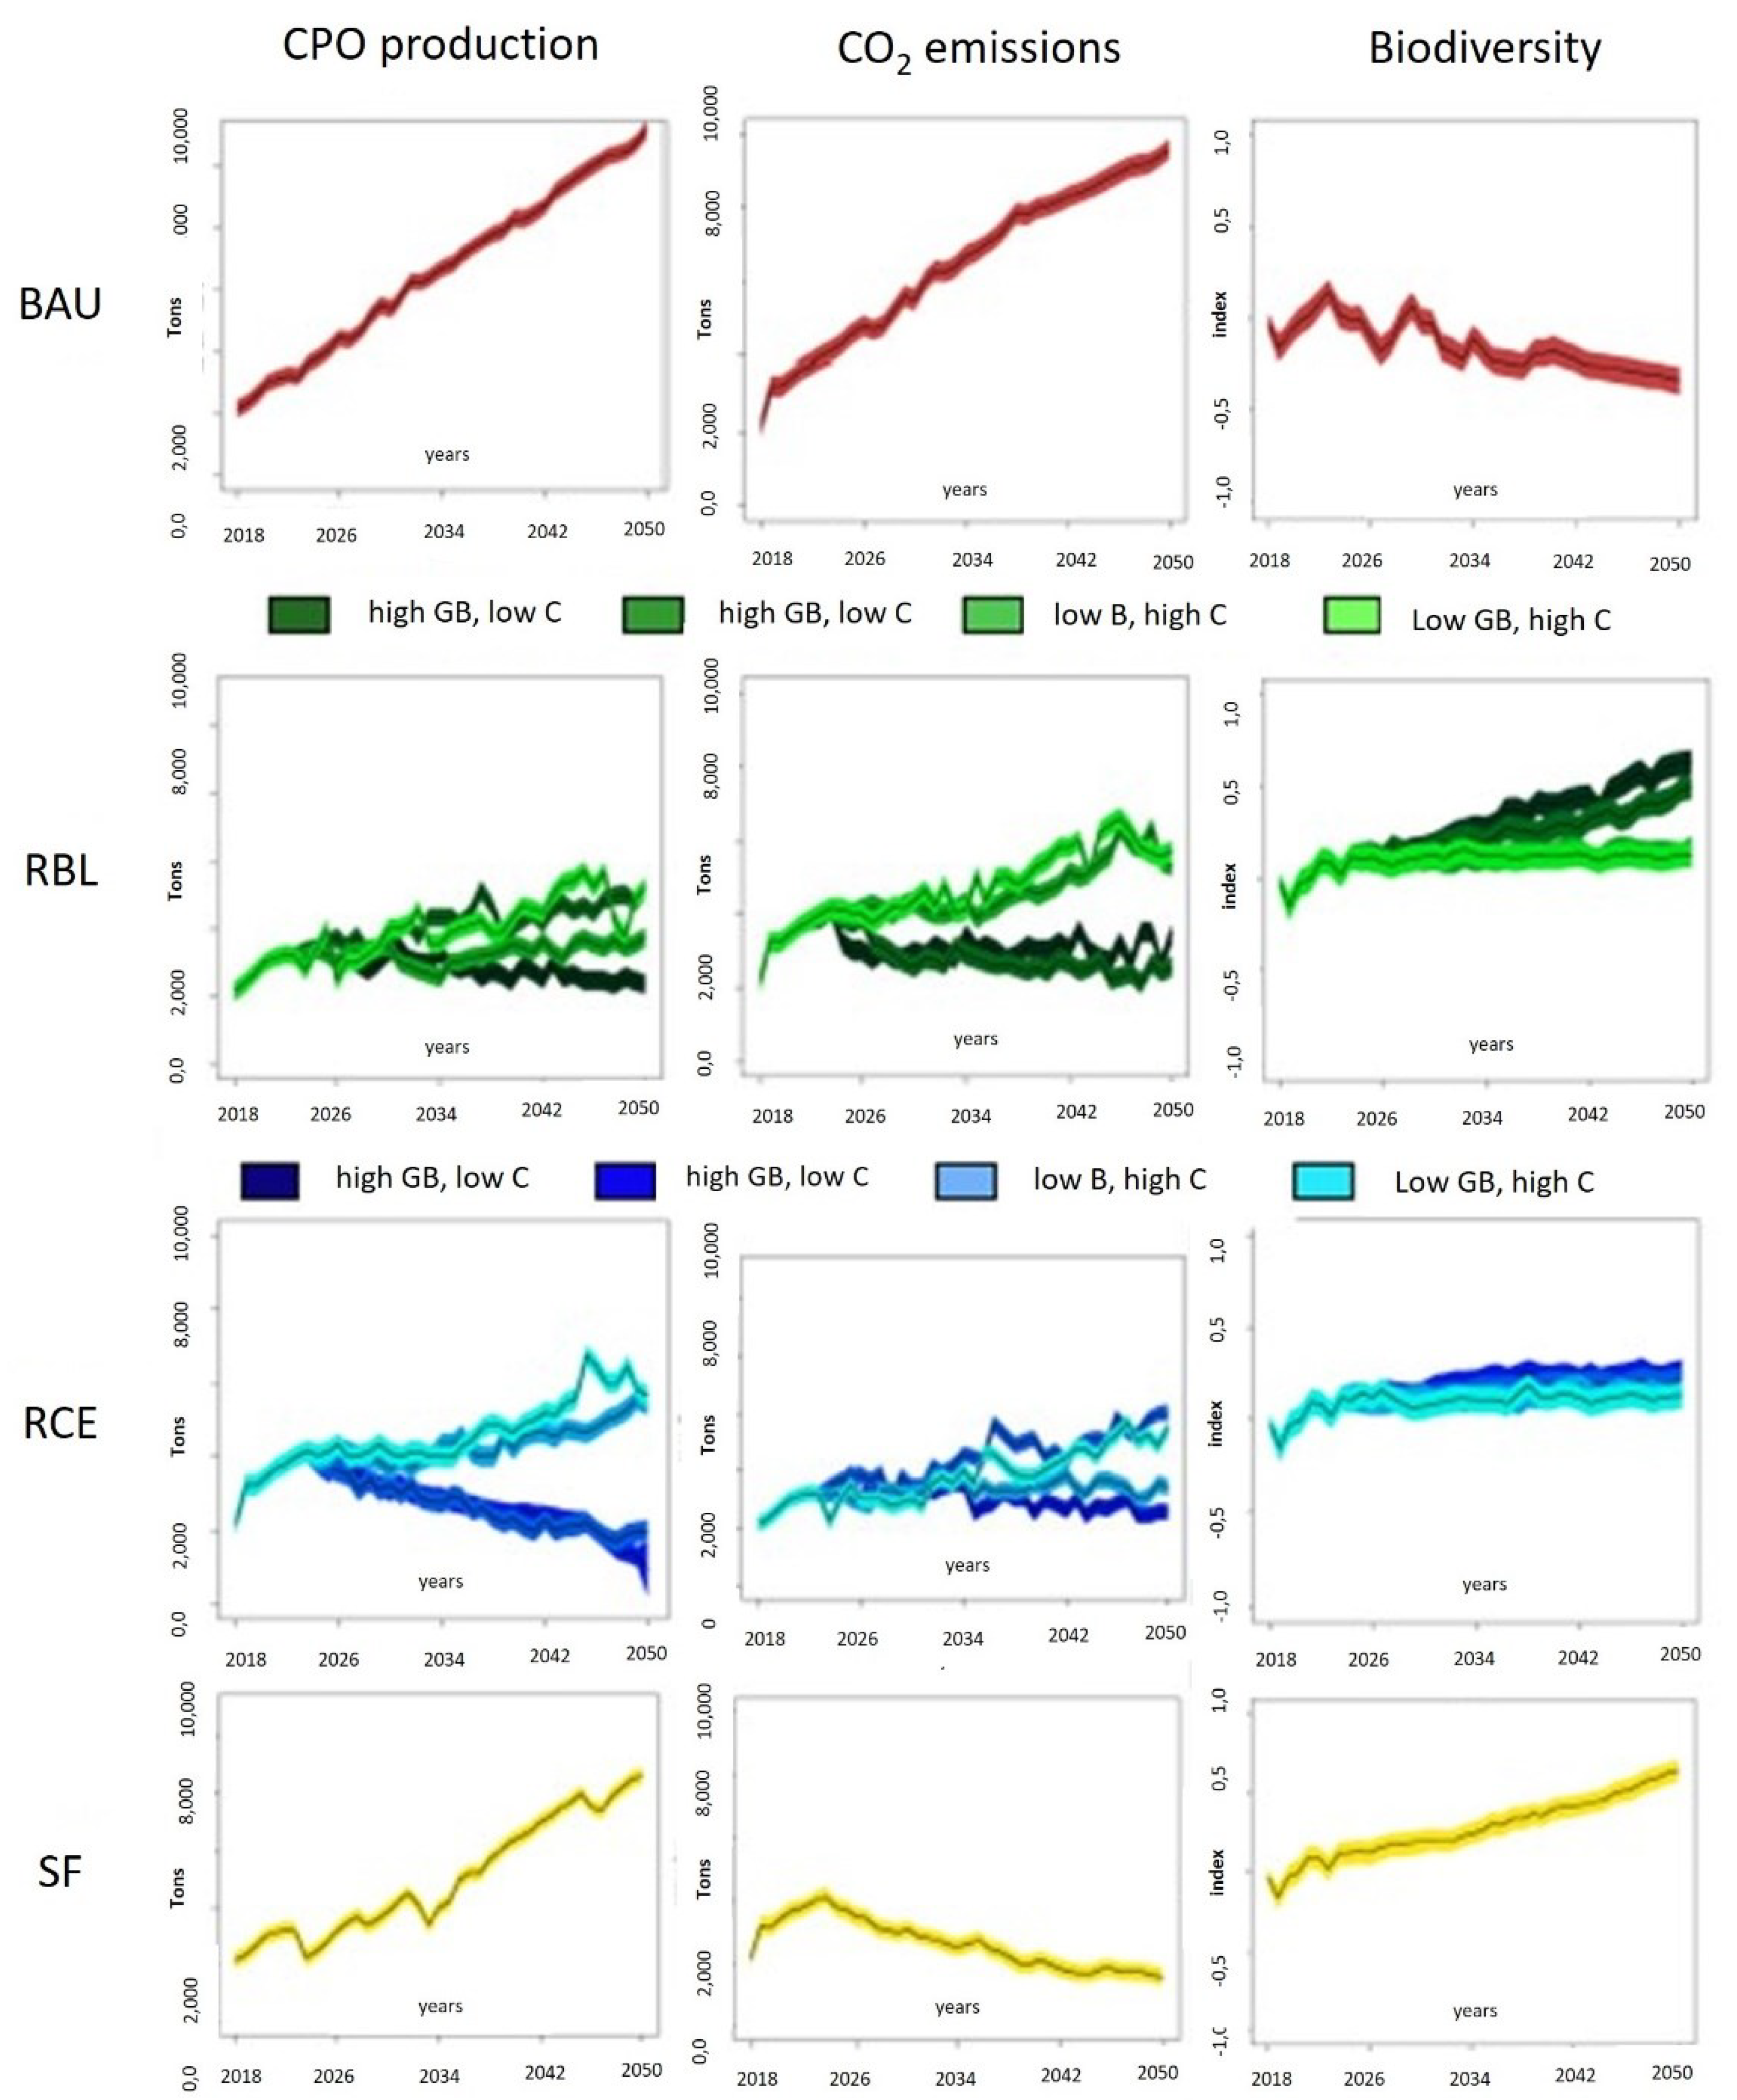
Table 2 describes the four scenarios modelled under ABM 2, while Figure 5 shows the modelling results of ABM 2. This model, which uses Indonesia as a SES case-study, shows the results concerning two ESS: crude palm oil (CPO) production and CO2 emissions —in addition to biodiversit. The other economic, social, and environmental indicators are included in the corresponding published article —see Gonzalez-Redin et al. (2019a).

3.2.1. Business As Usual (BAU)

The first row in Figure 5 shows the results obtained under BAU. This scenario shows the highest values for CPO production and CO2 emissions, while biodiversity outcomes show a negative trend. This is due to protection forces in Indonesia not being sufficiently strong to halt the economic forces driving land clearing for CPO production. Generally, oil palm firms require a continuous flow of bank credits to expand oil palm plantations, normally into areas with high biodiversity (e.g., undisturbed upland forests,) and high carbon stocks (e.g., swamp forests).
As a result, the number of credits borrowed and CPO production increase over time, while the opportunity cost of not converting land into oil palm plantations continues to decrease. Concurrently, biodiversity loss and CO2 emissions are reinforced, also due to the reduced government budget allocated for conservation purposes.

3.2.2. Reducing Biodiversity Loss (RBL) and Carbon Emissions (RCE)

The second and third rows in Figure 5 show the results obtained for RBL and RCE scenarios, respectively. RBL and RCE scenarios show similar trends for most indicators, which, as per SF scenario (see below), minimize land requirements by intensifying CPO production. CPO production shows more negative results than those under BAU, due to economic forces driving land clearing for oil palm production being weaker than conservation forces. Under RBL, strict enforcement of forest protection enhances the creation of new protected areas, land restoration and the creation of new policies that force firms to decrease the number of new plantations in areas with high biodiversity. Biodiversity, therefore, increases, and the same context occurs for CO2 emissions, where more sustainable results are obtained under scenarios with high conservation governance values (i.e., GB values). The main difference between RBL and RCE in terms of biodiversity and CO2 emissions is based on the type of forests restored: while moderately degraded forest is least favoured for restoration under RCE, highly degraded forest is least favoured under RBL, thus enhancing higher biodiversity values under RBL and lower CO2 emissions under RCE (see Table 1).

3.2.3. Sustainable Futures (SF)

The fourth row in Figure 5 shows the results obtained under SF scenario. This is the only scenario showing synergies between CPO production, CO2 emissions and biodiversity, as well as relatively positive results for the rest of the indicators (see published article). Interestingly, this is achieved under the same credit-based economic system as the one modelled under the BAU scenario, where the number of credits borrowed by firms increases over time. These results are obtained due to the combination of the following factors: (i) the use of technology by firms to increase production efficiency in existing cultivations, which significantly minimizes land requirements for CPO production; (ii) the creation of new plantations solely in degraded lands, thus avoiding plantation expansion into areas with high biodiversity and carbon stocks; (iii) the increase in the amount of degraded land restored; and (iv) the increase in the number and extent of protected areas.

3.3. ABM 3 (SES: Wet Tropics): evidencing a sustainable Business As Usual scenario

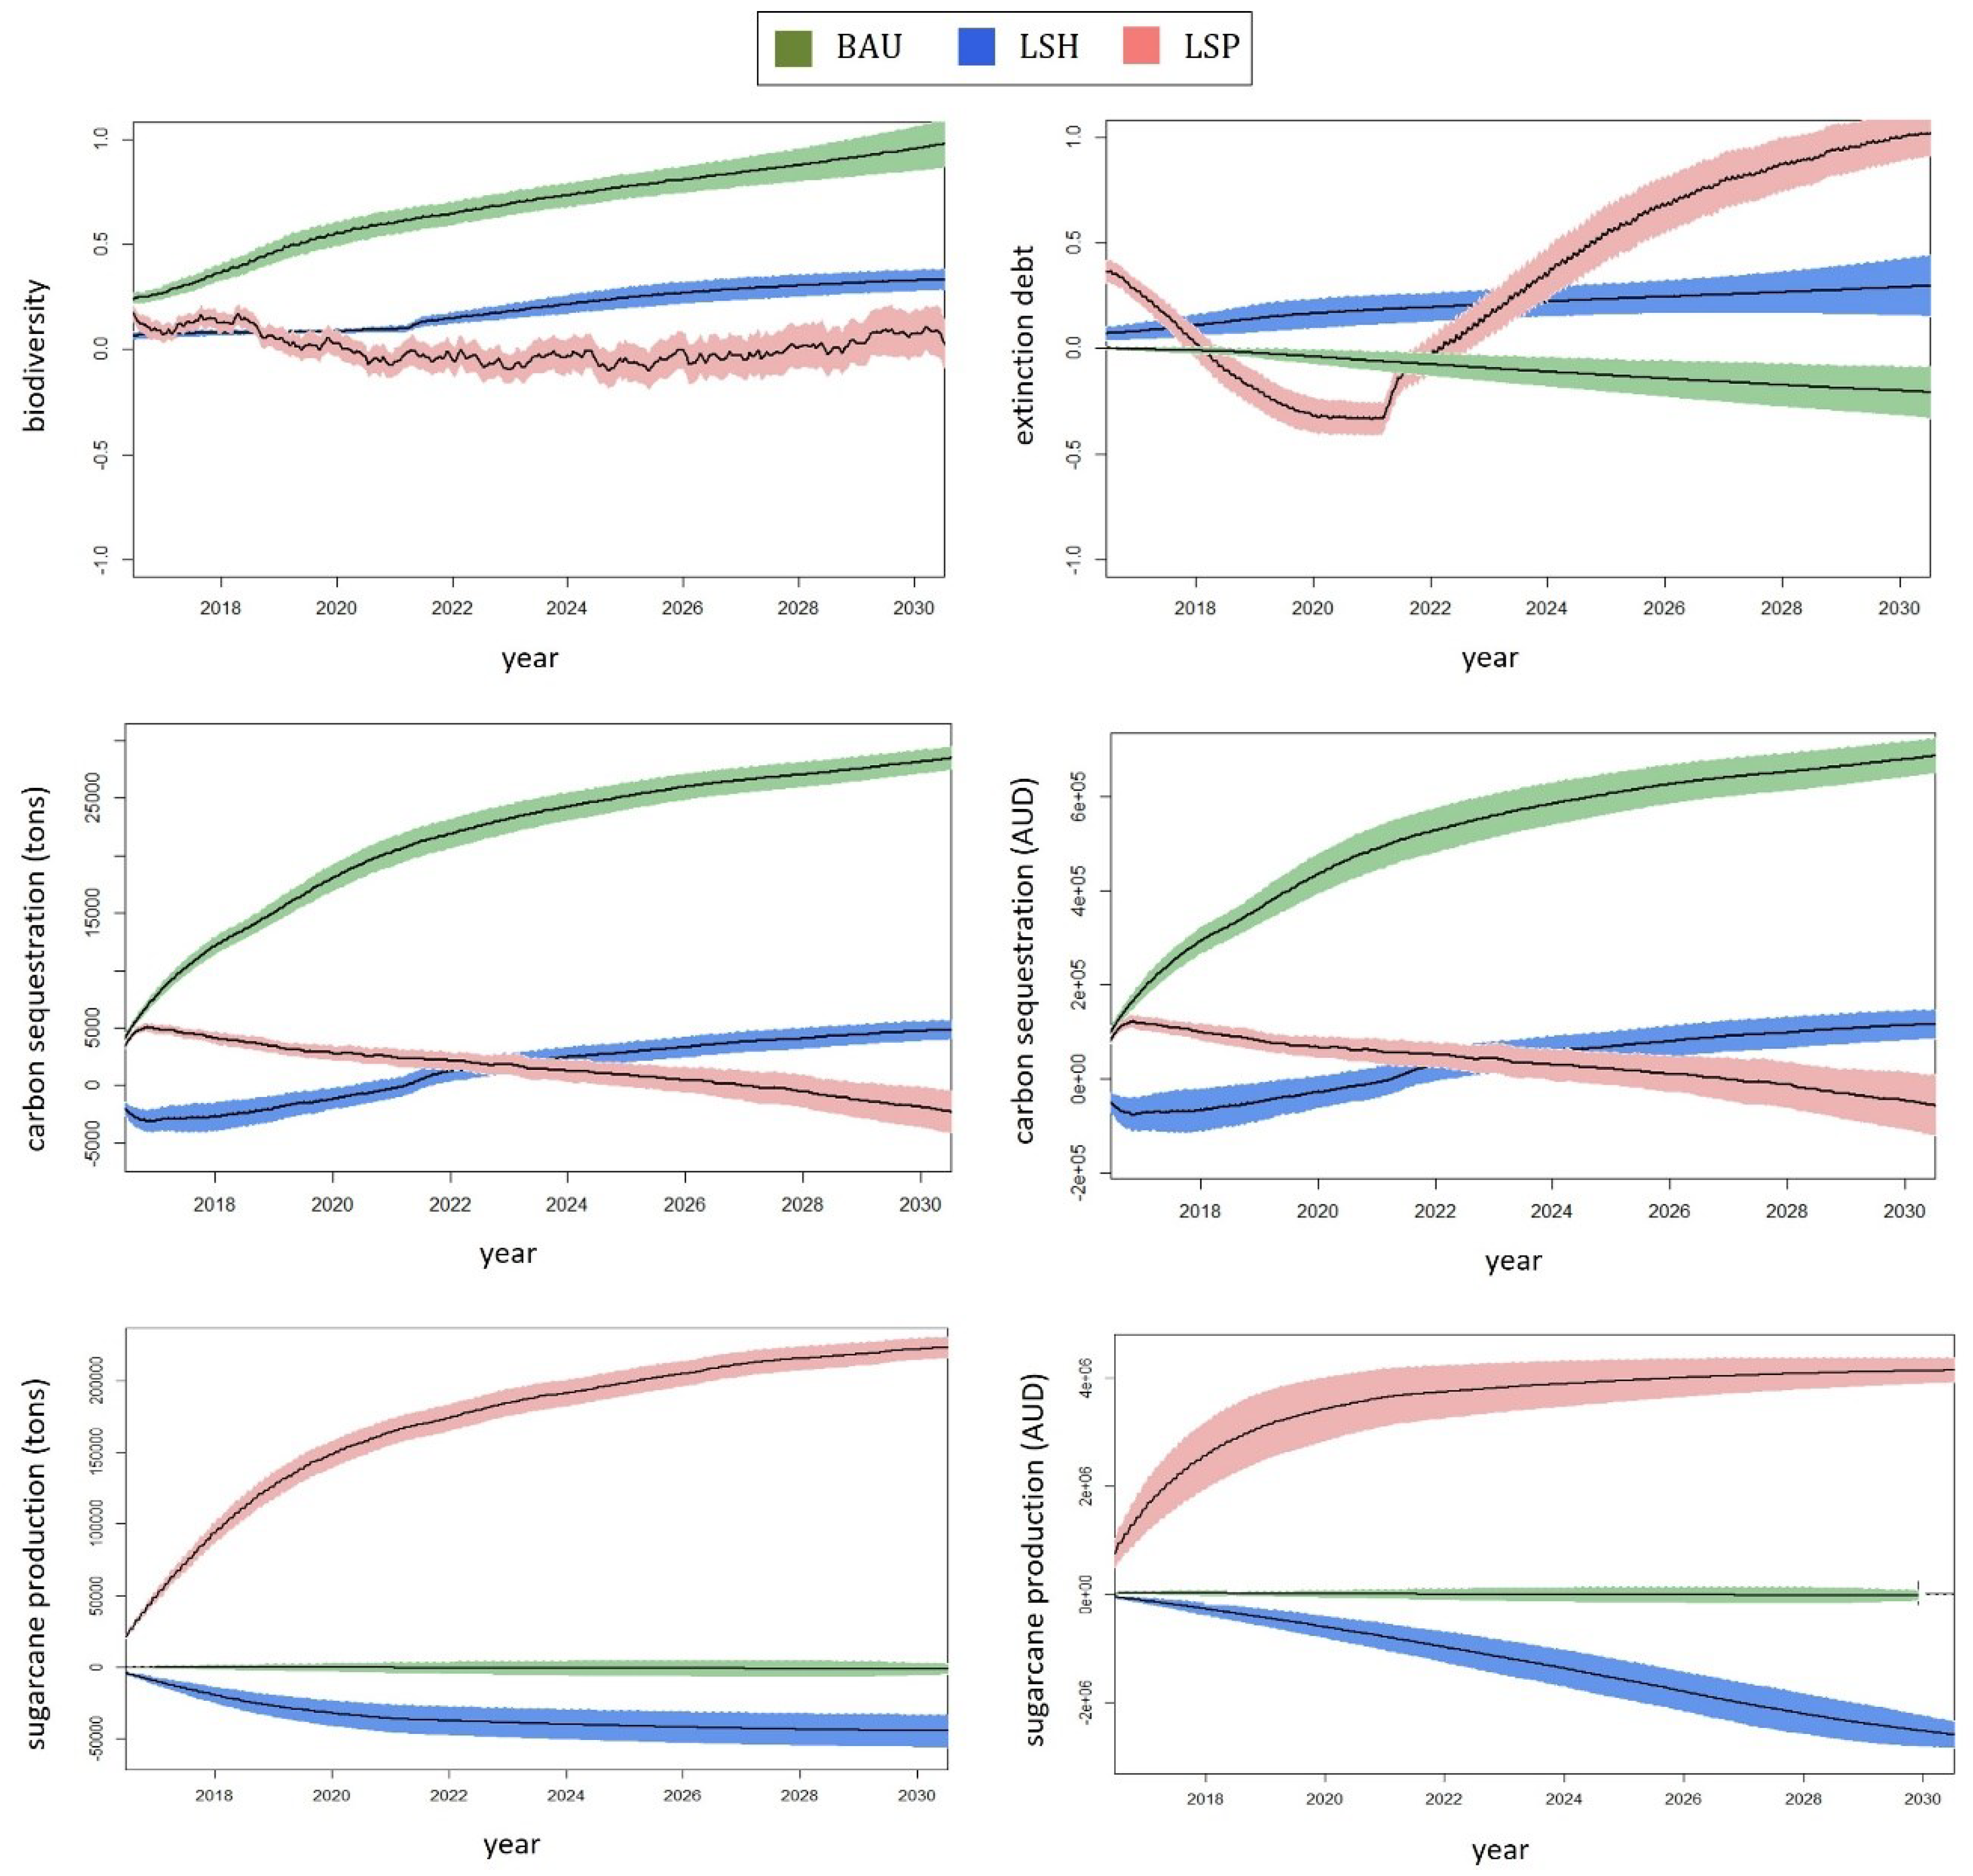
Table 3 describes the three scenarios modelled under ABM 3, while Figure 6 shows the modelling results of ABM 3. Like ABM 2, only the results concerning the two ESS —i.e., sugarcane production and carbon sequestration— and biodiversity are presented here, while other indicators are included in the corresponding published article —see Gonzalez-Redin et al. (2019b).

3.3.1. Estimated spatial impacts

The model produces spatially explicit results (see Gonzalez-Redin et al. (2019b). The resulting maps show the spatial distribution of land uses, and their temporal variations, over time for each of the scenarios modelled. The full article provides a detailed explanation of the reasons and drivers behind the specific LUC in each scenario. Likewise, the LUC trends for each scenario can also be found in Gonzalez-Redin et al. (2019b).

3.3.2. Estimated impacts

Figure 6 shows the empirical graphical results from the SES sustainability indicators selected for the three scenarios modelled: BAU, LSH and LSP (see Table 2).
Among BAU, LSH and LSP, while the first scenario shows positive trends for both biodiversity and carbon sequestration, with steady state sugarcane production, the LSH scenario shows slightly positive biodiversity and carbon sequestration trends with decreasing sugarcane production. Regarding LSP, sugarcane production increases, while biodiversity remains stable and carbon sequestration decreases slightly.

4. Discussion

4.1. It is not the what, but the how

The SESs modelled show that the current economic system, driven by a debt-based growth paradigm, is not environmentally sustainable. These results align with previous studies arguing that our economic system is not capable of providing solutions to the current environmental challenges (Keen, 2020). However, our models show that, through various structural changes, sustainable pathways can be achieved, even under the current economic structure. The ‘how’ is shown to be more relevant than the ‘what’; understanding the ‘how’ as the need to re-adapt and re-adjust system characteristics and mechanisms to enhance sustainable development, being the ‘what’ our economic system itself.

4.2. What factors drive (un)sustainability in social-ecological systems?

The SESs modelled reveal their susceptibility towards various factors affecting (un)sustainability. An analysis of such mechanisms is included below:

4.2.1. Monetary debt and financial entities: avoiding the blindness of the market economy

The ABM 1 (conceptual model) shows that the current debt-driven SES creates a context where continual economic growth becomes a necessity. Under this scenario, an ever-faster growth rate, fuelled by increasing debt stocks, requires the use of resources and emission of pollutants. Interestingly, Model 1 shows that the economy does not collapse due to the debt burden, or the debt-based nature of the economic system itself. Yet, this is the outcome due to the inappropriate use that firms and speculators make of debt. The system does not, therefore, impose a growth imperative per se, i.e., the debt-based economic system may not be, by definition, environmentally unsustainable. Rather, the speculative and profit-seeking behaviour of agents show a tendency to increase natural resource unsustainability.
Similarly, ABM 2 (Indonesian case-study) shows an increase of CO2 emissions and biodiversity loss due to the inappropriate use of bank credits by oil palm companies. Here, again, the problem is not the “what” —i.e., the (type of) SES—, but the “how”—i.e., the role of entities and their use of credits. More specifically, ABM 2 shows that allocating bank credits for other purposes than fuelling deforestation could help in halting biodiversity loss and carbon emissions, while still meeting CPO production demand targets. In this regard, increasing the production efficiency of existing oil palm cultivations and planting oil palms on degraded land (Koh and Ghazoul, 2010) could help meet the global CPO demand, while avoiding the release of excessive CO2 and further biodiversity loss.
The problem here is that debt-dependent palm oil companies are unlikely to use credit facilities to finance less profitable, financially riskier ‘innovative’ CPO production processes, e.g., high-yielding oil palm genome projects, or information systems providing real-time results on palm oil plantations. Similarly, banks are unlikely to lend credits to firms unless the credit is used to finance processes or activities that ensure short-term profits and, thus, provide financial security for banks. Additionally, ‘innovative’ palm oil companies (i.e., firms implementing the above-noted sustainable strategies) would be under-cut on international markets by traditional palm oil producers from other countries, unless there was a premium paid for their products. As a result, current traditional oil palm cultivation takes place mainly in biologically rich areas since it provides security for banks and higher short-term profits for firms.
Our models show that SES systems can result in a complete collapse of both natural and economics systems due to debt burdens. However, the results show that debt-driven fractional-reserve economic systems do not impose a growth imperative per se, i.e., the debt-based system is not by definition unsustainable. Rather, the behaviour of entities and agents, and their environmental decisions and relationships, show a tendency to increase natural resource unsustainability. Thus, there is a need to shift the current speculation- and profit-based debt use to a production- and efficiency-based one.

4.2.2. Technological development: two sides of the same coin

Our models show that technological development is another key factor driving SES (un)sustainability. Yet, SES collapses are not specifically driven by the net peak values reached by technology efficiency (i.e., high technological efficiency rates), but rather by the speed (i.e., growth rate) at which technological development takes place. For instance, Model 1 shows how technology efficiency, under full-reserve systems —i.e., systems with low investments in technological development— reaches a higher long-term net value compared to fractional reserve systems —i.e., systems with no government intervention. However, the speed of reaching this value is higher in the latter. We argue that a slower, yet constant, increase in technological development, focused on production efficiency rather than speculation, could help create win-win scenarios for GDP and natural resource availability.
Overall, there is a social tendency to believe in technology as an article of faith or based on statistically flawed extrapolations of historical trends, despite the lack of support for this proposition (Brown et al. 2011). Economists have usually resorted to technology and innovation as a source of ever-increasing efficiency and economic growth, regardless of the uncertainty and unpredictable nature of technological innovation (Ritter et al. 2011). Technological progress is, in fact, a discontinuous process, in which most significant innovations occur by “fits and starts” (Lafforgue 2008). The discontinuous nature of technology has the risk of affecting the entire economic system and can lead to far-reaching changes in different social factors (Helpman 1998), as well as socioeconomic collapse (Diamon 2005). Moreover, the Jevons Paradox establishes that increases in efficiency of resource use are usually outpaced by the rate at which consumption of those resources increases (Jevons 1865).
Conversely, it is important to note that technological development, applied to different fields, has positive implications for SES sustainability. For instance, those implementations of technological development focused on improving waste management (e.g., reduce, reuse, recycle) are beneficial for the environment, among many others. Therefore, it is important to specify and analyse the particular use of technology at the time of arguing or stating whether technological development enhances/diminishes SES sustainability.

4.2.3. Speculation and price volatility: the need to recouple economic and natural systems

The economic and natural systems are currently decoupled: not only in terms of GDP and environmental impacts —which is a yet-to-achieve key goal for global sustainability— but regarding the idea that the economy needs to behave and act upon, and within, the state and condition of the environment.
Our models show that speculation, and its effect on price volatility, is an important factor enhancing the decoupling process between economic and natural systems. International policy makers and non-governmental actors have become increasingly concerned that the entry of speculators into the system might distort commodity prices by creating excess price volatility (Cox 1976; UNCTAD 2011). The fractional-reserve banking scenario in our ABM 1 creates volatile, artificial and difficult-to-predict speculative markets. This is because monetary debt is not used by the private sector to increase profits through increasing productivity and, thereby, benefit society (e.g., by enhancing technological efficiency); rather, it is mainly used by speculators to increase their own profits. As a result, prices and demand processes are rather influenced by economic (i.e., the grade of speculation in the system) instead of environmental factors (i.e., resource availability). Thus, those periods in our models when speculation follows positive increasing trends show weak coupling values between the economy (represented by the GDP) and the environment (represented by natural resource stocks), while those periods where artificial speculative markets are absent show a strong coupling between the economy and the environment.
These results support our previously described argument that debt is not the main cause of SES unsustainability, but rather the use that firms and speculators make of it. Our results also align with Keen (2009), who states that money funding in the current debt-based economic system occurs according to speculation, instead of production-oriented goals. We argue that commodity price changes should be linked to supply-demand processes and the availability of natural resources, rather than speculative processes and markets, thus helping to move towards decoupling GDP and the use and availability of natural resources.

4.2.4. Government timely interventions: the importance of tipping points and supporting long-term views

As previously mentioned, the economy does not necessarily have to grow, or become unstable, due to the debt burden encouraged by the monetary system; yet this is the common outcome because of the inappropriate use that firms make of credits (Sealey, Binder and Burch 2018). In our models, this is addressed by implementing government policies focused on enhancing natural resource conservation and more sustainable practices by firms.
In this regard, late government intervention in our models is incapable of either enhancing a reduction of firms' resource extraction rate or increasing resource replenishment rates. The slower pace at which conservation policies are implemented by the government under our BAU scenarios is not sufficient to counterbalance the negative effects exerted on resources by faster technological development rates. Hence, a mismatch occurs between government's capacity to implement conservation policies and the promotion of economic growth induced by firms.
This is related to the difficulty of detecting tipping points and predict environmental changes in complex coupled SES (Dawson et al 2010). Complex systems are characterized by having multiple scales, non-linearity and interactive dynamics that are often unpredictable (Axelrod and Michael 2001; Holling, Berkes and Folke, 1998). Institutions have the difficult task of anticipating the complexity of SES dynamics over multiple temporal and spatial scales to avoid SES collapse, as seen, for example, in common pool resources, such as marine fisheries (Beddington, Agnew and Clark 2007) and freshwater systems (Alaniz et al. 2019).
The mismatch between government's implementation of conservation policies and economic growth under our BAU scenarios could be addressed through timely governmental interventions. Such interventions could prevent market failures through environmental policies that focus on the long-term stability and resilience of SESs. For instance, our Indonesia case-study (Model 2) shows that market intervention through different policies could address the Indonesian smallholders’ aversion to risk, currently represented by their unwillingness to use credit facility to create new plantations in degraded lands (Ruysschaert et al. 2011). Hence, cheaper bank financing mechanisms (e.g., interest-free loans) offered by more secure financial entities, e.g., micro-finance institutions (see Ruysschaert et al. 2011) could incentivize a more sustainable use of bank credits by farmers.
A balance is likely needed between government interventions and the market. The problem here is that, as shown by our models, seeking long-term objectives under the current economic paradigm is penalized by a system focused on short-term gains. Increased opportunities should be given to the economic system to invest in long-term environmental goals. Using climate change as an example, Nordhaus (2007) argues that limited and gradual government interventions in the economy are necessary, where optimal regulation should reduce long-run growth by only a modest amount. Stern's (2007) view is less optimistic; it calls for more extensive and immediate interventions and argues that these interventions need to be in place permanently even though they may entail significant economic cost. The more pessimistic answers, such as those coming from degrowth economics (Jackson and Victor 2015; Meadows et al. 2004; Victor and Rosenbluth 2007), argue that, essentially, all growth needs to come to an end in order to save the planet.
Our results stand between both viewpoints: responsible, partial and gradual, yet not marginal, and strong interventions are needed to prevent the economy from collapsing.

4.2.5. Overcoming government powerlessness and unwillingness to protect the environment: the need to combine bottom-up and top-down conservation forces

Our models show that there is a need to enhance, and integrate, both top-down and bottom-up conservation forces to engender SES sustainability. This challenging context is currently being achieved in the Wet Tropics of Queensland (see Model 3 results). Thus, the BAU scenario in the forested landscape of the Wet Tropics is helping to provide food, conserve biodiversity and sequester atmospheric carbon.
Such results have their origin in the stronger conservation forces compared to economic, land clearing forces. Back in the 1970s, bottom-up forces started to rise on account of an increasingly growing public awareness about the importance of wilderness areas in this region (Burg, 2017). Scientists, conservation groups and the society overall started to mobilise and take action against the economic forces driving land clearing for agriculture. Eventually, this bottom-up movement was able to influence top-down conservation processes (Burg, 2017), culminating in the listing of the Wet Tropics rainforests on the World Heritage Register in December 1988, as well as the formation of the Wet Tropics Management Authority. As a result, a solid and multilayer policy network —top-down conservation force—, focused on the protection of rainforest biodiversity, was created (Weber et al. 2021).
This top-down–bottom-up initiative can be considered a remarkable example of polycentric governance, i.e., a governance system in which multiple governing bodies interact to make and enforce rules within a specific policy arena or location, to achieve collective action in the face of disturbance change (Morrison et al., 2019). The Wet Tropics case shows the importance of developing a multilayer set of rules, efficiently coordinated by different centres of authority (see Morrison et al., 2019), that allows the protection of nature in the face of land clearing forces.
As a result, currently almost 80% of the Wet Tropics is protected (Wet Tropics Management Authority, 2021), mainly rainforest, helping to protect biodiversity and enhance the supply of multiple ES, such as climate regulation, air quality regulation, and cyclone protection (Alamgir et al., 2016). The Wet Tropics case of combining both bottom-up and top-down conservation forces is unique due to various local and regional conditions and characteristics (see next section). Poorer, developing countries have weak environmental governance schemes, which means that they need external financial support to strengthen their conservation governance. Governments from developed countries need to assist developing countries through different incentive mechanisms (Balmford et al. 2002). In this regard, international schemes, related to payment for ecosystem services (PES) (Farley and Costanza 2010), have been offering incentives to developing countries to preserve and enhance forests through REDD programs (Angelsen 2008). As an example, Indonesia signed a US$1 billion deal with Norway in 2010, under the REDD framework, aimed at reducing deforestation (Lang 2010). So far, the agreement has not made much difference to the rate of deforestation, due to corruption, bad practices, and stronger economic forces compared to conservation (Lang 2010, 2017). Yet, supporting these types of international agreements and schemes is key to overcoming the political difficulty of implementing policies that, indirectly, reduce the power of influential financial institutions that are not interested in any paradigm shift. In fact, governments from poorer countries are forced to take account of the influence of industries and other interest groups (Abel et al. 2006), due to the high dependency of national economies on very few corporations or monopolies.
In conclusion, there is a need to shift market-driven, capitalist forces to support environmental conservation, for which strong bottom-up and top-down conservation forces will be needed. Achieving sustainability largely depends on whether national and international governments are prepared to either pay the financial and societal externality costs of those industries built upon the current development model, or accept a comparatively smaller trade-off with agricultural land in return for increasing SES sustainability.

4.2.6. Careful with extrapolations: considering specific factors and conditions to each social-ecological system

Besides the rather generalist factors addressed so far, there exist particular factors, specific to each SES, that need to be considered separately. This is, for instance, the case for the Wet Tropics of Queensland (ABM 3). The current BAU context in the forested SES of the Wet Tropics region is helping to reconcile biodiversity conservation, climate change mitigation and sugarcane production. We use this case-study to highlight the importance of analysing and considering specific local and regional factors in SES studies.
The forested area of the Wet Tropics shows an unusual example of a tropical SES where both economic growth and environmental conservation are achieved under the current economic system. While most tropical regions world-wide, located in developing countries, find it challenging to achieve this win-win scenario, the forested landscape of the Wet Tropics possesses specific local and regional characteristics that facilitate this scenario: (1) Economic —temperate forests are around twenty times more productive of timber than tropical forests, being the prior the main provider of industrial wood worldwide (FAO, 2004; Sedjo and Simpson, 1999). Additionally, the banning of logging due to the World Heritage protection in 1988 reduced the use of tropical wood for timber production (Vanclay, 1994), making timber production from forests in the Wet Tropics an uncompetitive economic use (Valentine and Hill, 2008) compared to other sectors, such as tourism (Wet Tropics Management Authority, 2015). Furthermore, Australia, as a developed country, attracts and has more access to funding for conservation programmes than any other developing countries with tropical rainforests, which are more focused on solving poverty and social issues (Ceddia et al., 2014; Hill et al., 2013). (2) Governance —different public governance indicators, such as corruption and poor governance, show more positive results for Australia compared to other countries in Southeast Asia (Sodhi et al., 2010). In fact, countries with lower values for some indicators such as corruption control and quality public services are more likely to support or experience the spatial expansion of agriculture through deforestation (Ceddia et al., 2014). (3) Legal —under the Australian Constitution, the national government can over-ride the States and Territories over matters tied to international treaties, such as the World Heritage Convention. Thus, the Australian Government can stop environmentally unsustainable activities, such as the logging of the Wet Tropics forests. (4) social-political —additionally, conservation of tropical forests was strengthened by politicians seeking their own political benefit (Redfield, 1996). Timber harvesting in north Queensland had ceased since the inscription of the region on the World Heritage List in 1988 (Vanclay, 1993); thus, the national government took advantage of the previously described bottom-up conservation mobilisation to make forest conservation a vote-winner nationally (Redfield, 1996). As a result, support for conservation by politicians was a key factor to enhance SES sustainability in the Wet Tropics. (5) Environmental-scientific —the importance of the Wet Tropics World Heritage Site from a scientific and environmental perspective facilitates the justification and the reception of both political and financial support for conservation. (6) Geographical —from a land-use, landscape and protected area management perspective, Australia has no spatial conflicts with neighbouring countries. Thus, the Queensland Government can manage the Wet Tropics without dealing with potential cross-national or international conflicts.
In conclusion, the positive results obtained for the Wet Tropics case-study (ABM 3) are worthwhile exploring further. This is an outstanding achievement for a tropical region; considering that most of other areas of the tropics are characterized for having stronger economic, land clearing forces compared to conservation, thus enhancing biodiversity loss, habitat destruction, climate change, and other environmental issues. However, the context present in the Wet Tropics forested landscape should not be compared, nor extrapolated, to other SESs or tropical areas worldwide. For example, the political, cultural, environmental, and socioeconomic context in Indonesia, as shown by our ABM 2, is completely the opposite, thus the Wet Tropics scenario cannot be implemented in Indonesia. In fact, specific factors to the Indonesian SES could be preventing it from achieving sustainability. First, Indonesia is the top exporter of palm oil in the world (USDA 2014), where the contribution of the national economy is essential (Zen et al. 2005). Second, CPO production has resulted in economic improvement of rural areas by providing jobs for local people (Hirawan 2011). Third, the current debt-based palm oil industry is supported by both banks and the industry itself, since it enhances a win-win economic context, where the former gain benefits from the interest on their loans and the latter continues to increase its turnover due to the rising demand for CPO. As a result, the current debt-based palm oil industry is supported by both banks and the industry itself. Last, but by no means least, weak conservation governance in Indonesia does not help to counterbalance the stronger land clearing processes, thus placing BAU economic forces at a privileged position at the expense of conservation forces (Hill et al. 2015).

5. Conclusions

Our three Agent-Based Models, under the framework and contexts modelled, showed that there is a disjunction between the economic and conservation elements upon which the sustainable development paradigm is founded. The economy does not hold inherent, internal mechanisms to protect the natural capital on which it depends, thereby resulting in the current decoupling between the economic and natural systems. In attempting to find solutions for such disjunction, our research reinforces the idea that social-ecological systems are complex, dynamic, and non-linear. Hence, each geographic context, and set of stakeholders, needs to explore their own pathway towards sustainability. Yet, our results also showed that there are common social, economic and governance factors to most social-ecological systems that are key drivers of (un)sustainability. Namely: the role of financial entities and particular use of monetary debt; technological development and efficiency; market and economic speculation; detecting tipping points and timely government interventions; long-term priorities and views over short-term gains; and the need to integrate and consider both top-down and bottom-up conservation forces. Our research shows that most of these factors have a dual role, since they can both diminish or enhance sustainability in social-ecological systems upon their own context and particular conditions. We argue that social-ecological systems, and the embedded economic system, may not be inherently unsustainable: it is the institutions and (polycentric) governance systems and agents’ decision-making, including their relationship with the environment, that drives social-ecological system unsustainability. We demonstrate that it is possible to pursue a short-term course of sustainable development that substantially minimizes trade-offs between economic gains and environmental conservation. This will require efforts from different societal and economic agents through the development, and acceptance, of mechanisms that can help to shift away from the current capitalist forces towards strengthening environmental conservation. This should be the first step toward transforming our economic-production system into one that integrates, and fully accounts for, externalities and the value of natural capital, thus ensuring that the human society is embedded within the wider, and more important, natural system.

Author Contributions

Conceptualization, J.G.R., I.J.G., J.G.P., T.P.D. and R.H.; methodology and software, J.G.P. and J.G.R.; writing—review and editing, J.G.R., I.J.G., J.G.P., T.P.D. and R.H. All authors have read and agreed to the published version of the manuscript.

Funding

This research received no external funding.

Data Availability Statement

Data available to ask the corresponding author.

Acknowledgments

This work was supported by the James Hutton Institute (Aberdeen, UK), the University of Dundee (UK) and the CSIRO – Commonwealth Scientific Industrial Research Organisation (Cairns, Australia).

Conflicts of Interest

The authors declare no conflict of interest.

References

  1. Agrawal A (2003) Sustainable governance of common-pool resources: context, methods, and politics. Annual Review of Anthropology 32: 243-262. [CrossRef]
  2. Abel N, Cumming DHM and Anderies JM (2006) Collapse and Reorganization in Social-Ecological Systems: Questions, Some Ideas, and Policy Implications. Ecology and Society 11(1): 17.
  3. AgriFutures. (2017). Sugarcane-Overview [Online]. Available at: < https://www.agrifutures.com.au/publications-resources/farm-diversity-search/> [Accessed 27 Jul 2021].
  4. Alamgir M et al. (2016) Assessing regulating and provisioning ecosystem services in a contrasting tropical forest landscape. Ecological Indicators 64: 319-334. [CrossRef]
  5. Alaniz AJ, Carvajal MA, Nuñez-Hidalgo I and Vergara PM (2019) Chronicle of an Environmental Disaster: Aculeo Lake, the Collapse of the Largest Natural Freshwater Ecosystem in Central Chile. Environmental Conservation 46(03):0-4. [CrossRef]
  6. An, L., et al. (2014) Agent based modelling in coupled human and natural systems (CHANS): lessons from a comparative analysis. Ann. Assoc. Am. Geogr. 104 (4): 723-745. [CrossRef]
  7. Angelsen A ed. (2008) Moving Ahead with REDD: Issues, Options and Implications. (CIFOR, Bogor, Indonesia).
  8. Axelrod R and Michael DC (2001) Harnessing Complexity: Organizational Implications of a Scientific Frontier. Reprint edition. New York: Basic Books.
  9. Balmford A et al. (2002) Economic Reasons for Conserving Wild Nature. Science 297(5583): 950-953. [CrossRef]
  10. Beddington JR, Agnew DJ and Clark CW (2007). Current problems in the management of marine fisheries. Science. [CrossRef]
  11. Berkes F and Folke C (Eds.). (1998) Linking Social and Ecological Systems: Management Practices and Social Mechanisms for Building Resilience. Cambridge University Press, New York.
  12. Bonabeau E (2002). Agent-based modelling: Methods and techniques for simulating human systems. PNAS 99(3): 7280-7287. [CrossRef]
  13. Brock WA and Carpenter SR (2007) Panaceas and diversification of environmental policy. Proceedings of the National Academy of Sciences USA 104: 15206-15211. [CrossRef]
  14. Brown JH, Burnside WR, Davidson AD, DeLong JP, Dunn WC, Hamilton MJ, et al. (2011) Energetic Limits to Economic Growth. BioScience 61(1): 19-26. [CrossRef]
  15. Burg, M. - Cairns and Far North Environment Center. (2017) How The Wet Tropics Was Won – CAEFNEC. [online] Available at: <https://cafnec.org.au/about/how-the-wet-tropics-was-won/> [Accessed 27 Jul. 2021].
  16. Ceddia MG et al. (2014) Governance, Agricultural Intensification, and Land Sparing in Tropical South America. Proceedings of the National Academy of Sciences of the United States of America 111(10:, 7242-7247. [CrossRef]
  17. Costanza R et al. (1997) The value of the world’s ecosystem services and natural capital. Nature 387: 253-260. [CrossRef]
  18. Cox CC (1976) Futures trading and market information. J. Polit. Econ 84: 1215-1237 24. [CrossRef]
  19. Daily GC (2000) Management objectives for the protection of ecosystem services. Environmental Science and Policy 3: 333-339. [CrossRef]
  20. Daly H (1991) Towards an environmental macroeconomics. Land Econ 67(2): 255-259. [CrossRef]
  21. Dawson TP, Rounsevell MDA, Kluva´nkova´-Oravska´ T, Chobotova V and Stirling A (2010) Dynamic properties of complex adaptive ecosystems: implications for the sustainability of service provision. Biodiversity and Conservation: 19(10): 2843-2853. [CrossRef]
  22. DeAngelis DL and Mooij WM (2005) Individual-based modelling of ecological and evolutionary processes. Annual Review of Ecology, Evolution, and Systematics 36: 147-168. [CrossRef]
  23. Dearing JA, Bullock S, Costanza R, Dawson TP, Edwards ME, Poppy GM and Smith GM (2012) Navigating the Perfect Storm: research strategies for socio-ecological systems in a rapidly evolving world, Environmental Management 49: 767-775. [CrossRef]
  24. De Greene KB (1993) A systems-based approach to policy making. Kluwer Academic, Boston, Massachussetts, USA.
  25. Diamond J (2005) Collapse: How Societies Choose to Fail or Succeed. Viking press, United States.
  26. Diaz S et al (2018) Assessing nature’s contributions to people. Science 359(6373): 270-272. [CrossRef]
  27. DSITI (2016). Land-use Summary 1999–2015: Wet Tropics, Department of Science, Information Technology and Innovation, Queensland Government [online]. Available at: <https://www.publications.qld.gov.au/dataset/land-use-summary-1999-2015> [Accessed 27 Jul 2021].
  28. Epstein JM (2006). Generative Social Science: Studies in Agent-Based Computational Models. Princeton University Press.
  29. FAO – Food and Agriculture Organization of the United Nations (2004). The state of food and agriculture. Agriculture Series 27.
  30. Farley J and Costanza R (2010) Payments for ecosystem services: From local to global. Ecological Economics 69(11): 2060-2068. [CrossRef]
  31. Farmer JD and Foley D (2009) The economy needs agent-based modelling. Nature 460(7256): 685-686. [CrossRef]
  32. Fedoroff NV et al. (2010) Radically rethinking agriculture for the 21st century. Science 327 (5967): 833-834. [CrossRef]
  33. Ferber J (1999) Multi-agent systems: an introduction to distributed artificial intelligence. Addison-Wesley Longman, Harlow, UK, 509.
  34. Filatova T, Verburg PH, Parker DC and Stannard CA (2013) Spatial agent-based models for socio-ecological systems: challenges and prospects. Environ. Model. Softw 45 (0): 1-7. [CrossRef]
  35. Folke C. et al. (2002) Resilience and sustainable development: building adaptive capacity in a world of transformations. Ambio 31: 437-440. [CrossRef]
  36. Folke C (2006) Resilience: the emergence of a perspective for social-ecological systems analyses. Global Environmental Change 16: 253-267. [CrossRef]
  37. Gleick P (2003) Global freshwater resources: soft-path solutions for the 21st Century. Science 302: 1524-1528. [CrossRef]
  38. Gonzalez-Redin, J (2018) Sustainable development: Why is it not delivering on its promises? Preprint at: https://discovery.dundee.ac.uk/ws/files/49341283/PhD_Thesis_Julen_Gonzalez_Redin.pdf.
  39. Gonzalez-Redin J, Polhill JG, Dawson TP, Hill R, Gordon IJ (2018) It’s not the ’what’, but the ’how’: Exploring the role of debt in natural resource (un)sustainability. PLoS ONE 13(7): e0201141.
  40. Gonzalez-Redin J, Gordon IJ, Rosemary Hill, Polhill JG and Dawson TP (2019a) Exploring sustainable land use in forested tropical social-ecological systems: A case-study in the Wet Tropics. Journal of Environmental Management 231: 940-952. [CrossRef]
  41. Gonzalez-Redin J, Polhill JG, Dawson TP, Hill R and Gordon iH (2019b) Exploring sustainable scenarios in debt-based social-ecological systems: The case for palm oil production in Indonesia. Ambio 49: 1530-1548. [CrossRef]
  42. Grimm V (1999) Ten years of individual-based modelling in ecology: what have we learned and what could we learn in the future? Ecological Modelling 115(2–3): 129-148. [CrossRef]
  43. Gunderson LH, CS Holling and SS Light (Eds.) (1995) Barriers and bridges to the renewal of ecosystems and institutions. Columbia University Press, New York, USA.
  44. Gunderson LH and L Pritchar Jr. (Eds.) (2002) Resilience and the behavior of large-scale systems. Island Press, Washington, D. C., USA.
  45. Heckbert S, Baynes T and Reeson A (2010) Agent-based modelling in ecological economics. Annals of the New York Academy of Sciences. Issue: Ecological Economics Reviews.
  46. Helpman E (Eds.) (1998) General Purpose Technologies and Economic Growth. MIT Press, Cambridge MA.
  47. Hill R et al. (2013) The maturation of biodiversity as a global social-ecological issue and implications for future biodiversity science and policy. Futures 46: 41-49. [CrossRef]
  48. Hill R et al. (2015) Why biodiversity declines as protected areas increase: the effect of the power of governance regimes on sustainable landscapes. Sustainability Science 10(2): 357-369. [CrossRef]
  49. Hirawan FB (2011) The impact of palm oil plantations on Indonesia’s rural economy. Agricultural Development, Trade and Regional Cooperation in Developing East Asia, 66, ERIA, Jakarta.
  50. Holling CS and Meffe GK (1996) Command and control and the pathology of natural resource management. Conservation Biology 10: 328-337. [CrossRef]
  51. Holling CS, Berkes C, Folke C. (1998) Science, Sustainability, and Resource Management. In: Berkes F. and Folke C. (Eds.) Linking Social and Ecological Systems: Management Practices and Social Mechanisms for Building Resilience, pp. 342-362. Cambridge, UK: Cambridge University Press.
  52. Holling CS and CR Allen (2002) Adaptive inference for distinguishing credible from incredible patterns in nature. Ecosystems 5: 319-328. [CrossRef]
  53. ICCT (2016) International Council on Clean Transportation. Ecological Impacts of Palm Oil Expansion in Indonesia. White Paper.
  54. Jackson T (2009) Prosperity without Growth–economics for a finite planet. London: Routledge.
  55. Jackson T and Victor PA (2015). Does slow growth lead to rising inequality? Some theoretical reflections and numerical simulations. Ecological Economics 121: 206-219. [CrossRef]
  56. Jevons WS (1865) The Question of Coal. Macmillan, London.
  57. Jones IM (2015). Homo Economicus: A Terrible Economic Theory. Uffpost [online]. Available at: <https://www.huffingtonpost.co.uk/ioan-marc-jones/terrible-economic-theory_b_6803380.html > [Accessed 28 Jul 2021].
  58. Keen S (2009) Household Debt-the final stage in an artificially extended Ponzi Bubble, Australian Economic Review 42: 347-357.
  59. Keen S (2020) The appallingly bad neoclassical economics of climate change. Globalizations.
  60. Koh LP and Ghazoul J (2010) Spatially explicit scenario analysis for reconciling agricultural expansion, forest protection, and carbon conservation in Indonesia. Proc. Natl. Acad. Sci. 107: 11140-11144. [CrossRef]
  61. Lafforgue G (2008) Stochastic technical change, non-renewable resource and optimal sustainable growth. Resource and Energy Economics 30(4): 540-554. [CrossRef]
  62. Lambin EF et al. (2001) The causes of land-use and land-cover change: moving beyond the myths. Global Environmental Change 11: 261-269. [CrossRef]
  63. Lang C (2010) Brazil: The double role of Norway in conserving and destroying the Amazon. REDD-Monitor [online]. Available at: <http://www.redd-monitor.org/2010/05/26/brazil-the-double-role-of-norway-in-conserving-and-destroying-the-amazon/> [Accessed 28 Jul 2021].
  64. Lang C (2017) After seven years, Norway’s US$1 billion REDD deal in Indonesia is still not stopping deforestation. REDD-Monitor [online]. Available at: <http://www.redd-monitor.org/2017/12/28/after-seven-years-norways-us1-billion-redd-deal-in-indonesia-is-still-not-stopping-deforestation/> [Accessed 28 Jul 2021].
  65. Lee KN (1993) Compass and gyroscope. Integrating science and politics for the environment. Island Press, Washington D. C.
  66. Ludwig D (2001) The era of management is over. Ecosystems 4: 758-764. [CrossRef]
  67. MEA – Millennium Ecosystem Assessment (2005) Ecosystems and human well-being: Synthesis. Washington DC.
  68. Meadows DH and Robinson JM (1985) The electronic oracle: computer models and social decisions. John Wiley, Chichester, UK; New York, New York, USA.
  69. Meadows DH, Meadows DL and Randers J (2004) Limits to Growth: The 30-Year Update. Chelsea Green Publishing Co., White River Junction, Vermont.
  70. Molotoks A, Smith P and Dawson TP (2020) Impacts of land use, population, and climate change on global food security. Food and Energy Security 10 (1): e262. [CrossRef]
  71. Morrison T, et al. (2019) The black box of power in polycentric environmental governance. Global Environmental Change 57: 101934. [CrossRef]
  72. Neldner VJ et al. (2017) Scientific review of the impacts of land clearing on threatened species in Queensland. Queensland Government, Brisbane.
  73. Nelleman C et al. (2009) The Environmental Food Crisis: The Environment’s Role in Averting Future Food Crises. A UNEP Rapid Response Assessment. United Nations Environment Program, GRID-Arendal, Arendal, Norway.
  74. Newell B et al. (2005) A conceptual template for integrative human–environment research. Global Environmental Change 15. 299-307. [CrossRef]
  75. Nordhaus WD (2007) A review of the Stern Review on the economics of climate change. Journal of Economic Literature 45: 686-702.
  76. OECD (2011). Towards green growth–A summary for policy makers. OECD Meeting of the Council at Ministerial Level, 25-26.
  77. Omoju O (2014) Environmental Pollution is Inevitable in Developing Countries. Breaking Energy[online]. Available at: <https://breakingenergy.com/2014/09/23/environmental-pollution-is-inevitable-in-developing-countries/> [Accessed 28 Jul 2021].
  78. Ostrom E (2007) A diagnostic approach for going beyond panaceas. Proceedings of the National Academy of Sciences of the United States of America 104: 15181-15187. [CrossRef]
  79. Ostrom E. (2009) A general framework for analyzing sustainability of social-ecological systems. Science 325: 419-422. [CrossRef]
  80. Pahl-Wostl C (1995) The Dynamic Nature of Ecosystems: Chaos and Order Entwined. Wiley, Chichester: 288.
  81. Pahl-Wostl C (2009) A conceptual framework for analysing adaptive capacity and multi-level learning processes in resource governance regimes. Global Environmental Change 19: 354-365. [CrossRef]
  82. Pearce DW and Turner RK (1990) Economics of Natural Resources and the Environment. Harvester Wheatsheaf, Hertfordshire England.
  83. Rankin DJ (2010) The social side of Homo economicus. Trends in Ecology & Evolution 26(1): 1-3.
  84. Redfield E (1996) North Queensland’s Tropical Rainforests: The World Heritage Controversy. In: Palo M., Mery G. (Eds.), Sustainable Forestry Challenges for Developing Countries. Environmental Science and Technology Library, 10. Dordrecht: Springer.
  85. Redman CL (1999). Human dimensions of ecosystem studies. Ecosystems 2: 296-298. [CrossRef]
  86. Redman CL, Grove JM and Kuby LH (2004) Integrating Social Science Into the Long-Term Ecological Research (LTER) Network: Social Dimensions of Ecological Change and Ecological Dimensions of Social Change. Ecosystems 7(2): 161-171. [CrossRef]
  87. Ritter FE, Schoelles MJ, Quigley KS and Klein LC (2011) Determining the number of simulation runs: Treating simulations as theories by not sampling their behaviour. In: Narayanan S. and Rothrock L. (Eds.). Human-in-the-loop Simulations: Methods and Practice. London: Springer-Verlag: 97-116.
  88. Ruysschaert D, Darsoyo A, Zen R, Gunung G. and Singleton I. (2011) Developing palm-oil production on degraded land – Technical, economic, biodiversity, climate and policy implications [online]. Available at: <https://www.ifc.org/wps/wcm/connect/534db066-91a5-4816-a277-97eb687c0dd5/Developing+OP+plantation+on+degraded+land-draft_Output+22.pdf?MOD=AJPERES&CVID=kjG1KkB> [Accessed 28 Jul 2021].
  89. Scholz RW (2011) Environmental literacy in science and society: from knowledge to decisions. Cambridge University Press, Cambridge, UK.
  90. Schulze J et al. (2017) Agent-Based Modelling of Social-Ecological Systems: Achievement, Challenges, and a Way Forward. JASSS 20(2): 8. [CrossRef]
  91. Sealey K, Burch RK and Binder P-M (2018) Will Miami Survive? The Dynamic Interplay between Floods and Finance. SpringerBrief.
  92. Sedjo RA and Simpson RD (1999) Tariff Liberalization, Wood Trade Flows, and Global Forests – Dicussion Paper 00-05. Resources for the Future, Washington DC.
  93. Smith M, Hargroves KC, Desha, C (2010) Cents and Sustainability—Securing Our Common Future by Decoupling Economic Growth from Environmental Pressures, London: Earthscan.
  94. Sodhi NS et al. (2010) The state and conservation of Southeast Asian biodiversity. Biodivers. Conserv. 19: 317-328. [CrossRef]
  95. Stern N (2007) The Economics of Climate Change: The Stern Review. Cambridge and New York: Cambridge University Press.
  96. Swamy L, Drazen E, Johnson WR and Bukoski JJ (2018) The future of tropical forests under the United Nations Sustainable Development Goals. Journal of Sustainable Forestry 37(2): 221-256. [CrossRef]
  97. Taylor M (2010) Queensland land clearing is undermining Australia’s environmental progress. The Conversation [online]. Available at: <http://theconversation.com/queensland-land-clearing-is-undermining-australias-environmental-progress-54882> [Accessed 28 Jul 2021].
  98. TEEB Foundations (2010) The Economics of Ecosystems and Biodiversity: Ecological and Economic Foundations. Earthscan, London and Washington.
  99. Turner RK and Daily GC (2008) The Ecosystem Services Framework and Natural Capital Conservation. Environmental and Resource Economics 3981: 25-35. [CrossRef]
  100. UNCTAD (2011). Price Formation in Financialized Commodity Markets–The Role of Information, United Nations.
  101. USDA (United States Department of Agriculture) (2014) Indonesia palm oil exports by year [online]. Available at: <http://www.indexmundi.com/agriculture/?country=id&commodity=palm-oil&graph=exports> [Accessed 28 Jul 2021].
  102. Valentine PS and Hill R (2008) The Establishment of a World Heritage Area. In: Living in a Dynamic Tropical Forest Landscape, edited by N.E. Stork and S. M. Turton, 81-93. Oxford: Blackwell Publishing.
  103. Vanclay JK (1993) Tropical Rainforest Logging in North Queensland: Was It Sustainable? Ann. For 1(1) 54-60.
  104. Vanclay JK (1994). Contrasts between biologically-based process models and management-oriented growth and yield models Sustainable timber harvesting: simulation studies in the tropical rainforests of north Queensland. Forest Ecology and Management 69: 299-320.
  105. Victor PA and Rosenbluth G (2007) Managing without growth. Ecological Economics 61: 492-504. [CrossRef]
  106. Weber ET, Catterall CP, Locke J, Ota LS, Prideaux B, Shirreffs L, Talbot L and Gordon IJ (2021) Managing a World Heritage Site in the Face of Climate Change: A Case Study of the Wet Tropics in Northern Queensland Earth 2021 2:248-271. [CrossRef]
  107. Wet Tropics Management Authority (2015) State of the Wet Tropics Report 2014/15: Economic Value of the Wet Tropics World Heritage Area.
  108. Wet Tropics Management Authority (2021). Experience de Wet Tropics. Available at: < https://www.wettropics.gov.au/visit> [Accessed 28 Jul 2021].
  109. WHC-UNESCO (2010) The Gondwana Rainforests of Australia World Heritage Area (extension to existing property). Available at: < https://whc.unesco.org/en/tentativelists/5541/> [Accessed 27 Jul 2021].
  110. Wilensky U (1999) NetLogo [computer software]. Center for Connected Learning and Computer-Based Modeling. Northwestern University, Evanston, IL. Available from: http://ccl.northwestern.edu/ netlogo. Cited 26 July 2021.
  111. World Economic Forum (2014) The Future Availability of Natural Resources: A New Paradigm for Global Resources Availability. World Scenario Series [online]. Available at: <http://www3.weforum.org/docs/WEF_FutureAvailabilityNaturalResources_Report_2014.pdf> [Accessed 28 Jul 2021].
  112. Zen Z, Barlow C and Gondowarsito R (2005) Oil Palm in Indonesian Socioeconomic Improvement. A Review of Options. Working Paper (Australian National University, Canberra, Australia).
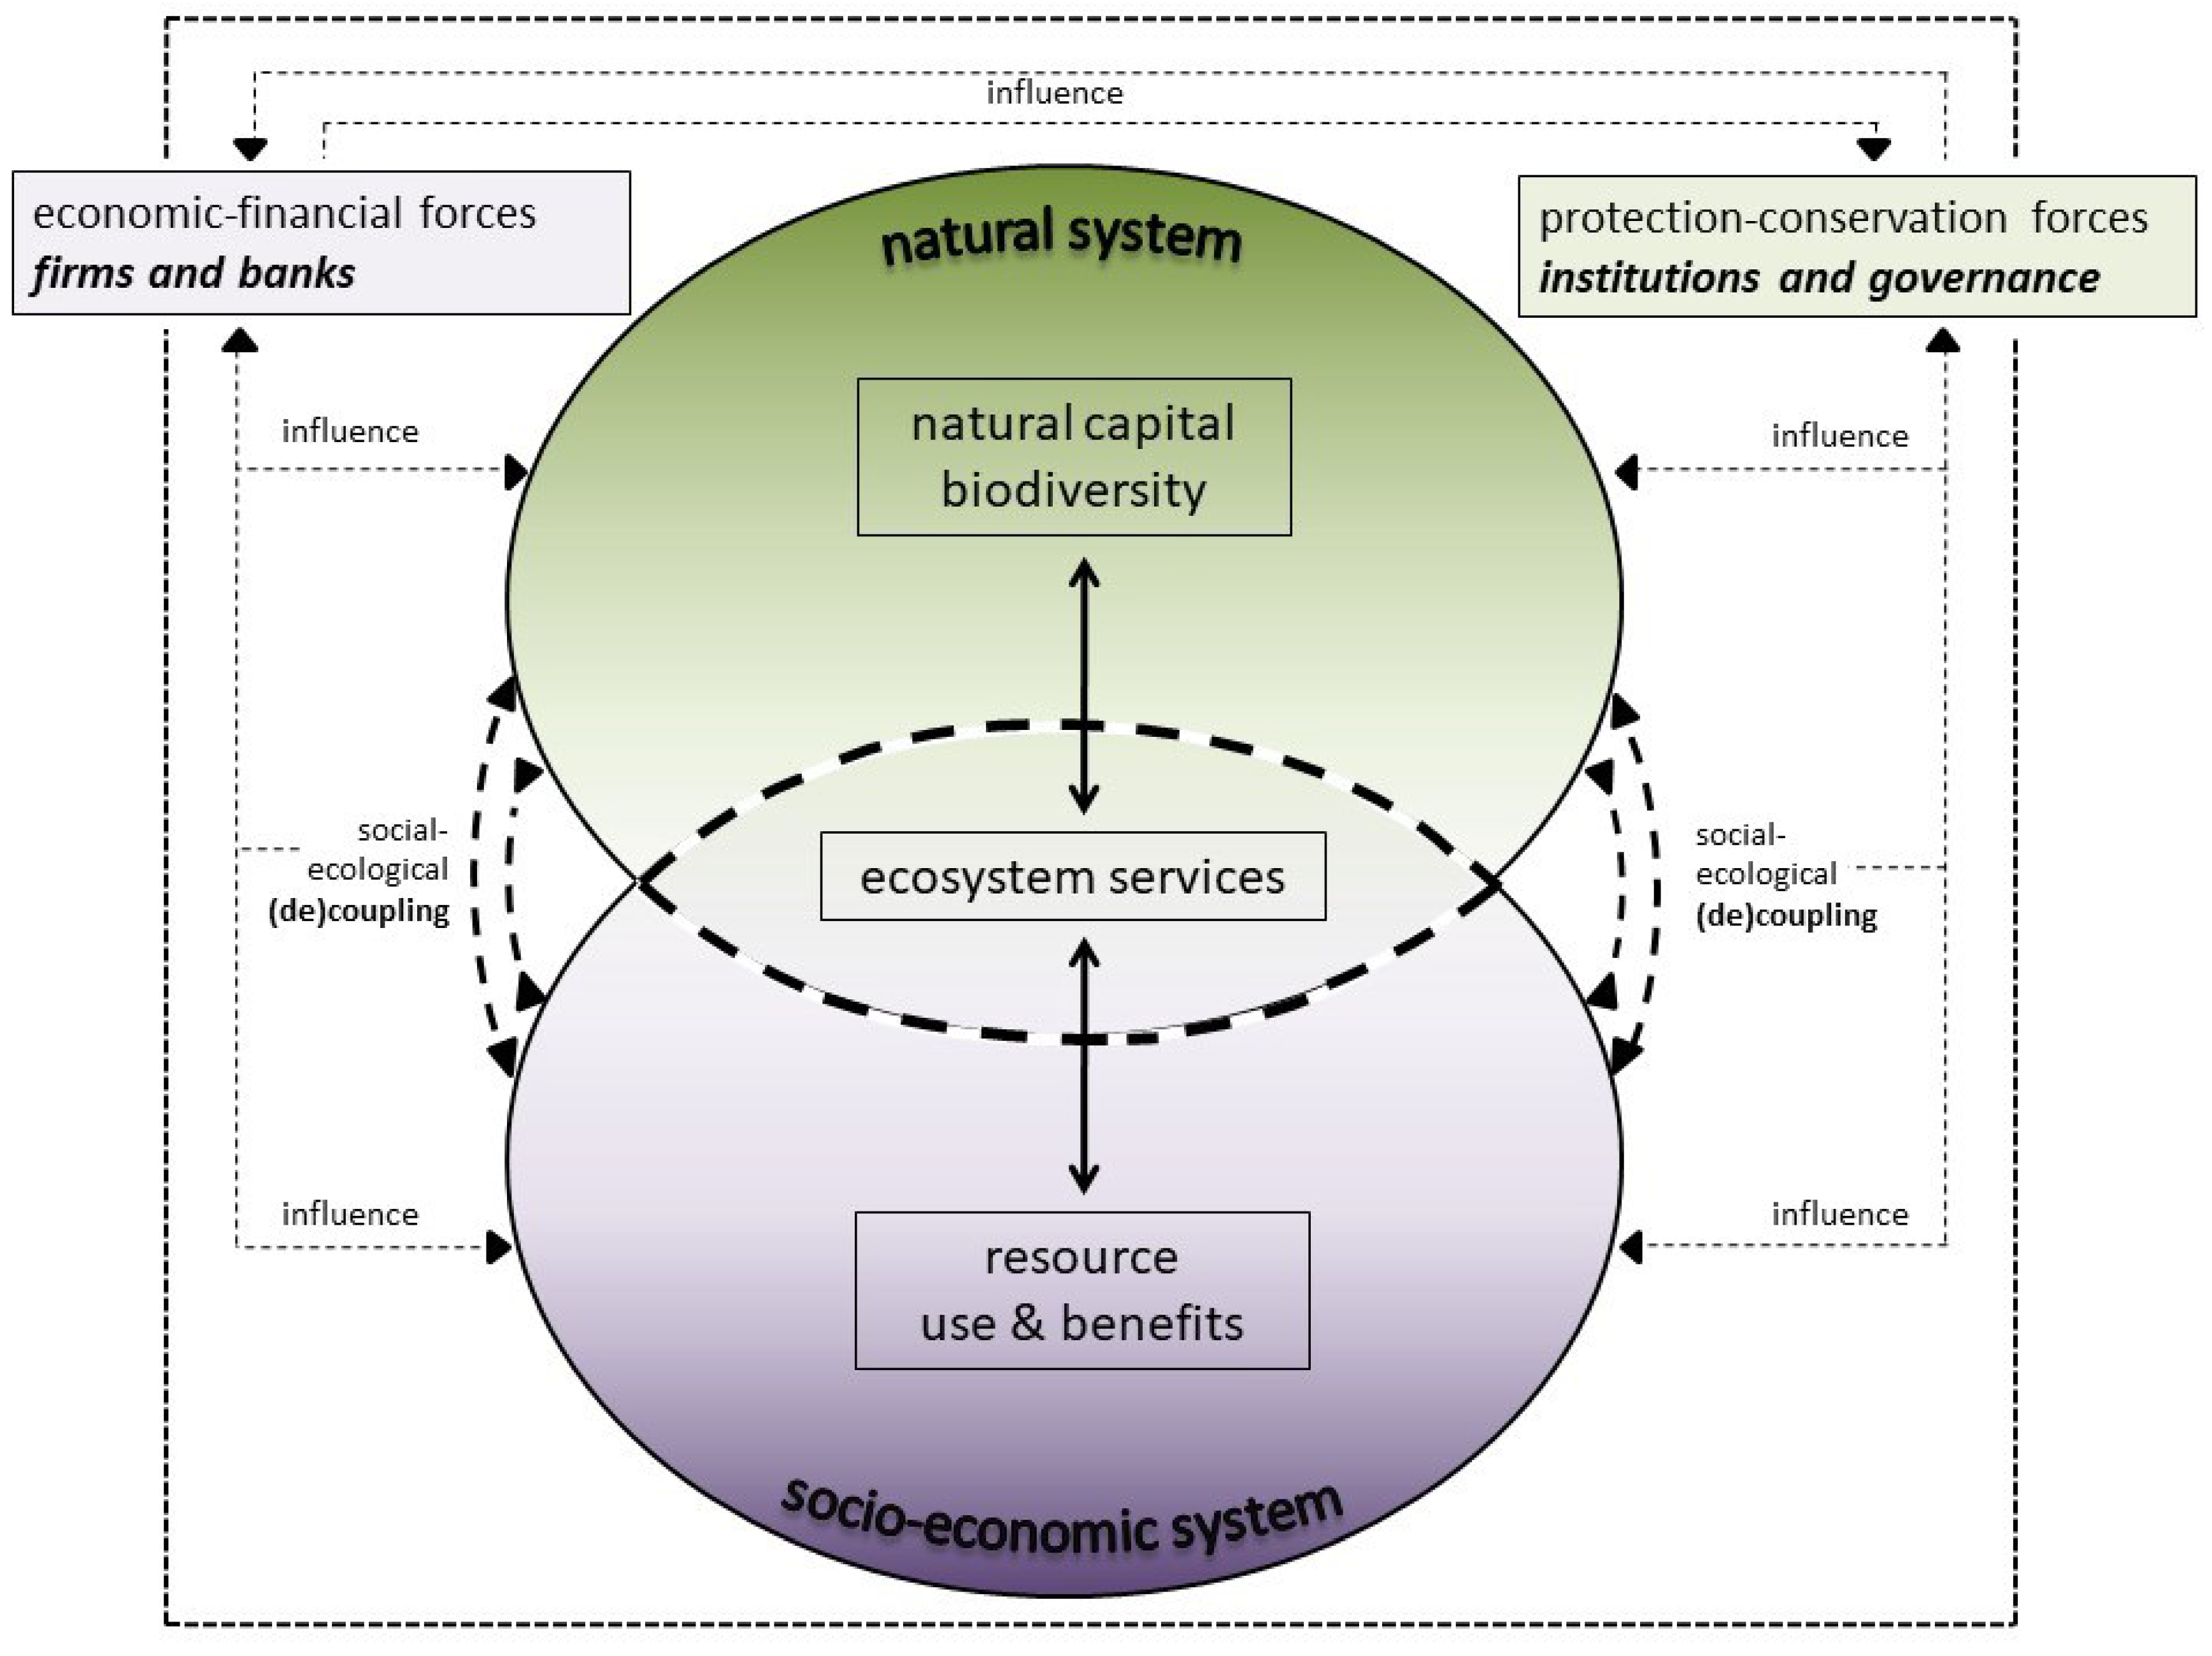
Figure 1. Integrated conceptual framework to study the extent of (un)sustainability in social-ecological systems. The framework consists of coupled natural and socioeconomic systems, where economic and conservation forces affect natural capital and its biodiversity; this originates ecosystem services trade-offs and synergies that have an implication for beneficiaries. The dashed-shaped pointed oval in the centre represents the (de)coupling process between the socioeconomic and natural systems.
Preprints 91675 g001
Figure 2. Modelled social-ecological systems. Map of Southeast Asia (left), where the two case studies of this research are located: Indonesia (blue) and Wet Tropics of Queensland in Australia (orange).
Preprints 91675 g002
Figure 3. Model interoperability. Both tables show the application of the main conceptual framework (top row, in bold) and modelling (second row) elements in each model (left column). Filled circles refer to explicitly modelled elements, while empty circles show those implicit elements.
Preprints 91675 g003
Figure 4. Simulation results for different indicators regarding ABM 1. Results are divided in full-reserve (in purple) and fractional-reserve system – without government intervention (in red) and with government intervention when the total natural resource stock is at 25% (in yellow) and 50% (in green). Black lines within each band colour (i.e., dotted, solid and dashed) show the mean values, whereas coloured bands represent the standard error bars included all the runs computed for each indicator under every scenario.
Preprints 91675 g004
Figure 5. Simulation results for different indicators regarding ABM 2. Indicators include crude palm oil (CPO) production (metric tons), CO2 emissions (metric tons) and biodiversity (index). RBL and RCE scenarios are divided in four different sub-scenarios: dark green (or blue) coloured curves refer to scenarios with strong conservation (high GB) and weak economic (low C) forces.
Preprints 91675 g005
Figure 6. Simulation results from ABM 3. Results are shown as the temporal variation (in net gains & losses) of biodiversity, carbon sequestration and sugarcane production for each scenario modelled: BAU (green), LSP (red) and LSH (blue). Both sugarcane and carbon sequestration are shown in tons and Australian Dollars (AUD). Colour bands represent the standard error bands regarding all the runs computed for each indicator under every scenario. The black-coloured lines show the mean values.
Preprints 91675 g006
Table 1. Description of the two scenarios modelled under ABM 1.
SCENARIO DESCRIPTION
Fractional-reserve banking The Most common form of banking practised by commercial banks worldwide. Involves accepting deposits from customers and making loans to borrowers while holding in reserve an amount only equal to a fraction of the bank’s deposit liabilities.
Full-reserve banking Also known as 100% reserve banking; banks are required to keep the full amount of depositors’ funds in cash, ready for immediate withdrawal on demand.
Table 2. Description of the four scenarios modelled under ABM 2.
SCENARIO DESCRIPTION
Business As Usual
(BAU)
Rising global demand for vegetable oils drives oil palm plantation expansion in Indonesia, which consequently enhances increasing amounts of borrowed credits from overseas banks to finance CPO production. This process is financially beneficial for both banks and palm oil companies, yet it incurs biodiversity loss and global warming. The Government of Indonesia is more focused on creating jobs and reducing poverty through expanding the area of oil palm plantations. This situation is reinforced by weak environmental governance, as well as lack of funding allocated by international organizations for conservation.
Reduce Biodiversity Loss (RBL) Funding for (international) conservation increases, thus benefiting biodiversity by enlarging the protected area network and restoring moderately degraded forests in Indonesia. Furthermore, biodiversity loss is halted by firms using credits and public funding to cover the additional costs of creating new plantations in degraded lands and to increase production efficiency in existing plantations.
Reduce Carbon Emissions (RCE) The government of Indonesia receives international funding to maximize above-ground biomass accumulation and reduce carbon emissions. Highly degraded forests are restored due to their high potential to sequestrate carbon. The protected area network is enlarged, yet investments are lower than in RBL since area protection benefits biodiversity conservation more. Carbon sequestration is also enhanced by firms using credits and public funding to create plantations in degraded lands (with low carbon stocks) and increasing productivity in existing cultivations.
Sustainable Futures
(SF)
Economically supported by international bodies and developed countries, the government’s goal is to enhance win-win contexts regarding climate change mitigation and biodiversity conservation. Restoration of degraded land takes place in both highly and moderately degraded lands, which benefit biodiversity and carbon conservation. Furthermore, firms use credits and public funding to increase production efficiency in existing cultivations and create plantations in degraded lands.
Table 3. Description of the four scenarios modelled under ABM 2.
SCENARIO DESCRIPTION
Business As Usual (BAU):
“World Heritage”
The number and extent of protected areas in the Wet Tropics NRM Region keep increasing to be able to meet conservation targets as a World heritage listing site. The total extent of semi-natural areas increases slightly following the trends from the period 1999-2015. Production (mainly sugarcane) remains stable over time due to other regions in Queensland (e.g., Mackay-Whitsundays) being more focused on meeting national production demands.
Land Sparing (LSP):
“World Heritage
and Queensland’s ‘food bowl’ region”
The region continues to meet conservation targets by increasing the number and extent of protected areas. However, this is combined with increases in the amount of land focused on agricultural (sugarcane) production, enhanced by the Queensland and Australian governments. The goal is for the Wet Tropics NRM Region to improve its contribution to the so-known Australian ‘food bowl’ process.
Land Sharing (LSH):
“Multifunctional landscapes”
Queensland and Australian Governments lead a transition towards more multifunctional discourses and governance framework, where wildlife-friendly farming practices are enhanced at the expense of lower sugarcane yields. Thus, the Wet Tropics NRM Region follows opposite trends than in the LSP scenario, where both protected areas and sugarcane lands decrease in exchange for semi-natural areas (above all production forestry).
Disclaimer/Publisher’s Note: The statements, opinions and data contained in all publications are solely those of the individual author(s) and contributor(s) and not of MDPI and/or the editor(s). MDPI and/or the editor(s) disclaim responsibility for any injury to people or property resulting from any ideas, methods, instructions or products referred to in the content.
Copyright: This open access article is published under a Creative Commons CC BY 4.0 license, which permit the free download, distribution, and reuse, provided that the author and preprint are cited in any reuse.
Prerpints.org logo

Preprints.org is a free preprint server supported by MDPI in Basel, Switzerland.

Subscribe

© 2024 MDPI (Basel, Switzerland) unless otherwise stated