Preprint
Article

Interaction of O2 with Reduced Ceria Nanoparticles at 100–400 K: Fast Oxidation of Ce3+ Ions and Dissolved H2

Altmetrics

Downloads

96

Views

46

Comments

0

A peer-reviewed article of this preprint also exists.

Submitted:

28 November 2023

Posted:

28 November 2023

You are already at the latest version

Alerts
Abstract
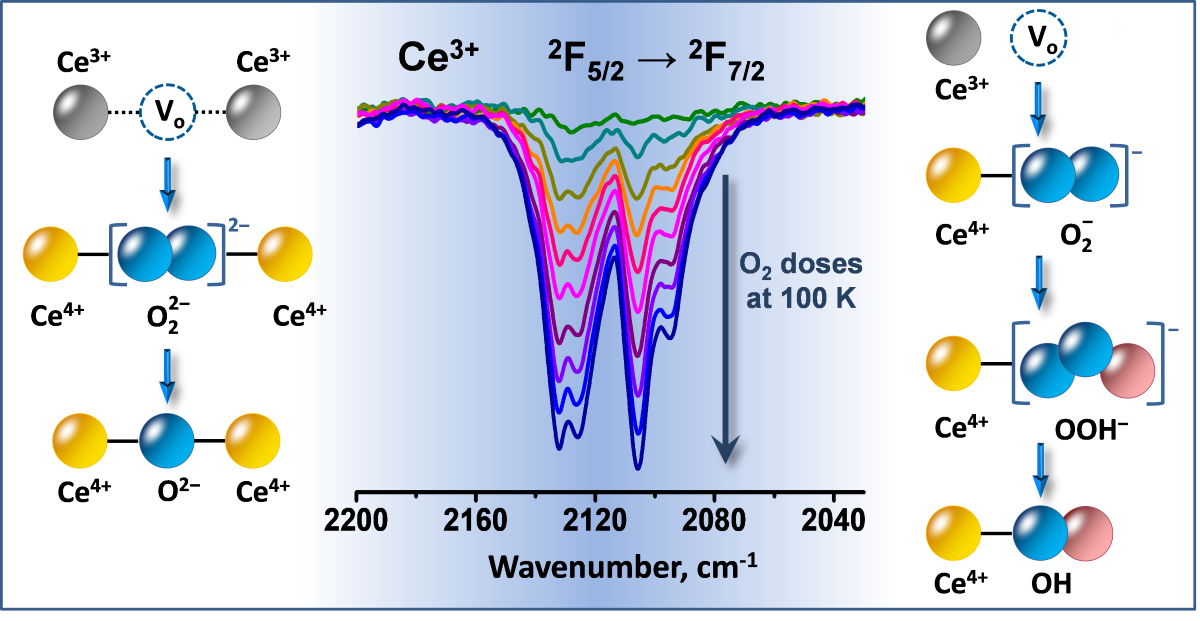
The interaction between O2 and reduced ceria nanocubes was mainly investigated by FTIR spectroscopy. Nanorods and nanoparticles were also studied for comparison. Adsorption of O2 at 100 K on unreduced ceria produces only O2 molecularly adsorbed on Ce4+ sites. The Ce3+ cations in H2-reduced ceria were monitored by the 2F5/2 → 2F7/2 electronic transition band at 2133-2095 cm-1. This band possesses a fine structure well resolved at 100 K. The positions of the individual components depend on the Ce3+ environment, including the presence of nearby species such as OH groups. Even at 100 K, the interaction of O2 with reduced ceria leads to fast oxidation of about half of the Ce3+ cations, including all Ce3+ sites bound to OH groups and carbonates, and the simultaneous formation of superoxo (O2) and peroxo (O22) species. The remaining fraction of Ce3+ sites disappears upon heating up to 348 K. At higher temperatures, the peroxo species decompose directly, yielding lattice oxygen. Superoxides are converted to hydroperoxides, which then decompose to terminal OH groups. Reduced samples evacuated at T < 773 K contain sorbed H2. Part of this hydrogen is also fast oxidized to H2O even at 100 K.
Keywords: 
Subject: Chemistry and Materials Science  -   Surfaces, Coatings and Films

1. Introduction

Ceria has found important application in various branches of industry and, in particular, is widely used as a catalyst, catalyst component, support or additive [1]. It is generally recognized that one of the key advantages of ceria in catalysis is its redox chemistry: under operating conditions, Ce4+ cations can be easily and reversibly reduced to Ce3+, thereby forming oxygen vacancies, all without changing the crystallographic structure [2,3,4]. Thus, ceria can provide or store oxygen in the course of redox catalytic reactions. For the design of new efficient catalysts, a detailed knowledge of the mechanism of oxidation and reduction of the ceria surface is extremely important. This knowledge is also essential for the biomedical applications of ceria nanoparticles [5,6,7].
Stoichiometric cerium dioxide is quite stable in the absence of reducing agents. For instance, TPD experiments show no substantial desorption of O2 from the (111) ceria plane below 1300 K [8]. At lower temperature, Ce3+ can be easily produced by interaction of ceria with reducing agents or by irradiation [4].
Many TPR studies have revealed that reduction of ceria with hydrogen occurs in two steps [9,10,11,12,13,14,15,16,17,18,19,20,21,22,23,24,25,26,27,28,29,30]. During the first step Ce4+ cations situated on the surface are reduced and this is reflected by one or more TPR peaks in the temperature range 685-835 K. Indeed, the ceria surface oxygen is mobile and can be easily removed at low temperatures [14,31]. A correlation between CeO2 surface area and low-temperature hydrogen consumption has been reported [9,10,11,13,14,16,22,23]. Reduction of bulk takes place at higher temperature (TPR peaks between 1010 and 1170 K) because bulk oxygen must be first transported to the surface [14].
Although the general picture of ceria reduction by H2 is clear, there are many factors affecting the precise interpretation of the TPR results. Different crystal faces are exposed on the surface and they are expected to have different reducibility. This leads to a complex structure of the low-temperature TPR peak.
During the last two decades many investigations appeared on ceria nanoparticles with different well defined shapes: e.g. nanocubes, nanorods, nanopolyhedra, etc. [5,6,7,19,20,23,25,28,32,33,34,35,36,37,38,39,40,41,42,43,44,45] Each shape is characterized with a preferential exposure of one or more crystal facets on the surface. Although there is still some disagreement in different details, these studies in principle allow estimation of the reactivity of one or another plane in particular process. For instance, it has been reported that nanooctahedra (exposing mainly {111} facets) are more difficult to reduce than nanocubes (selectively exposing the {100} facets) [19] which are considered to demonstrate higher catalytic activity.
The presence of surface impurities, such as adsorbed oxygen [25,46], residual carbonates, etc. [10,16,47,48,49] may also provoke some variation of the TPR signal. Hydrogen adsorption and surface area drop in this temperature range could also contribute to the TPR profile [16,49].
A powerful technique for surface characterization is vibrational spectroscopy, mainly in its IR and Raman modes. It gives information on the surface hydroxyl coverage and presence of some impurities, as residual carbonates or nitrates. Moreover, this technique is unique for determination of the structure of adsorbed species. Other important information, e.g. on the surface acidity, can be obtained by the use of the so-called probe molecules. Especially for ceria, vibrational spectroscopy can be also used to follow its reduction degree. This is due to the fact that the Ce3+ 2F5/22F7/2 spin-orbit electronic transition is observed in the IR spectra around 2147-2110 cm-1 [44,50,51,52,53,54,55,56]. Although the band is reported in a wide spectral region, no attempts have been made to correlate its position with Ce3+ sites in different environment. It should also be noted that reduction also strongly affects the hydroxyl spectra of ceria [44,52,53,55,57].
While the reduction of ceria is relatively well studied, there are less works considering its reoxidation. Ayastuy et al. [18] studied temperature-programmed oxidation (TPO) of ceria just after a TPR run and observed one peak at 326 К, attributed to surface oxidation. Fally et al. [17] also found that oxidation of ceria pre-reduced at 973 K occurred easily and the process was nearly complete even at 298 K. Similar results were reported for ceria reduced at 773 K [55]. It was also noted [58] that reduced ceria surfaces are not stable at ambient conditions and that the kinetic of reoxidation is very fast.
Spectroscopic studies have revealed that O2 adsorption on reduced ceria leads to formation of superoxide (O2) [39,41,43,59,60,61,62] and peroxide (O22−) species [39,41,43,60,61,62]. Superoxide is characterized by a ν(O−O) band at 1139-1127 cm-1 and are stable up to 348 К [43]. Peroxide species are different kinds and ν(O−O) was detected in the 890-830 cm-1 region [43,60]. They are more stable and disappear from the spectra after treatment above 473 K. A stepwise conversion between O2, O2, O22−, O and lattice O2− has been proposed [43,60]. Note that the production of superoxide and peroxide species leads to immediate (fast) oxidation of Ce3+. This means that the redox process occurs simultaneously with adsorption.
In the light of the above considerations, many studies reporting a significant concentration of Ce3+ ions on ceria samples pre-exposed to air [7,35,40,63,64,65] seem surprising. Analysis of these results show that in most cases the conclusions were made on the basis of results from two techniques: XPS and Raman spectroscopy. However, now it seems to be well established that Ce4+ reduction in vacuo can occur as a result of the X-ray irradiation [66] and it has been pointed out that the initial Ce3+/Ce4+ ratio can be strongly overestimated when determined by the Ce3+ XPS signals. In addition, is has been recently underlined that the widespread assignment of a XPS peak at 531-532 eV to oxygen vacancies is wrong [67].
Consider now the Raman results. The most important feature in the Raman spectra of stoichiometric ceria is an intense F2g mode at 460 cm-1. Reduction of ceria leads to development of the so-called D1-band (D stands for defects) observed around 550 cm-1. This band is attributed to Ce3+–O2––Ce4+ modes [68] and is associated with the presence of oxygen vacancies [33,34,56,69,70,71]. It develops after reduction and disappeared after adsorption of oxygen, which confirms its assignment [39,72].
Very often another D-band (the so-called D2 band at ca. 600 cm-1) is incorrectly also attributed to oxygen vacancies in ceria which is consequently associated with presence of reduced Ce3+ sites [19,25,28,30,32,34,35,37,48,73,74,75,76,77,78,79]. Therefore, it may be concluded that in some of these studies the Ce3+/Ce4+ ratio is also strongly overestimated.
In this study we first analyze the Ce3+ electronic band appearing after reduction and then study oxidation of the Ce3+ ions by oxygen. We have shown that O2 easily oxidizes a large part of Ce3+ to Ce4+ even at 100 K, as well as adsorbed hydrogen. Some residual Ce3+ sites resist fast oxidation even in presence of gas-phase O2, but at 400 K the oxidation is complete. We also made first attempts to associate the separate components of the Ce3+ electronic band with particular Ce3+ sites.

2. Results

2.1. Initial Characterization of the Samples

We have studied three ceria samples prepared by hydrothermal synthesis and differing in morphology: nanocubes, nanorods and nanoparticles. Some basic characteristics as well as the notation of the samples that will be used further on in the text, are presented in Table 1.

2.1.1. TEM Studies

TEM images of the investigated samples are shown in Figure 1. The CeO2-NC sample consists of agglomerates of nanoparticles with a cubic morphology and a typical particle size of ca. 30 – 35 nm, although smaller particles also exist (Figure 1a). A few particles with a polyhedral, sphere-like morphology were also noticed. Analysis showed that mainly {100} facets were exposed on the sample surface, while {111} and {110} facets were found to a small extent. The nanorods (CeO2-NR) are between 80 and 140 nm in length and about 8 nm in diameter (Figure 1b). With this sample the most exposed facets are {110} and {111}, while only a small fraction of {100} facets was detected. The CeO2-NP sample is composed of polyhedral nanoparticles with a size of 2 – 8 nm (Figure 1c). They are packed randomly with {100}, {110} and {111} lattice fringes. In this case the presence of traces of nanorods was also noticed.

2.1.2. XRD Studies

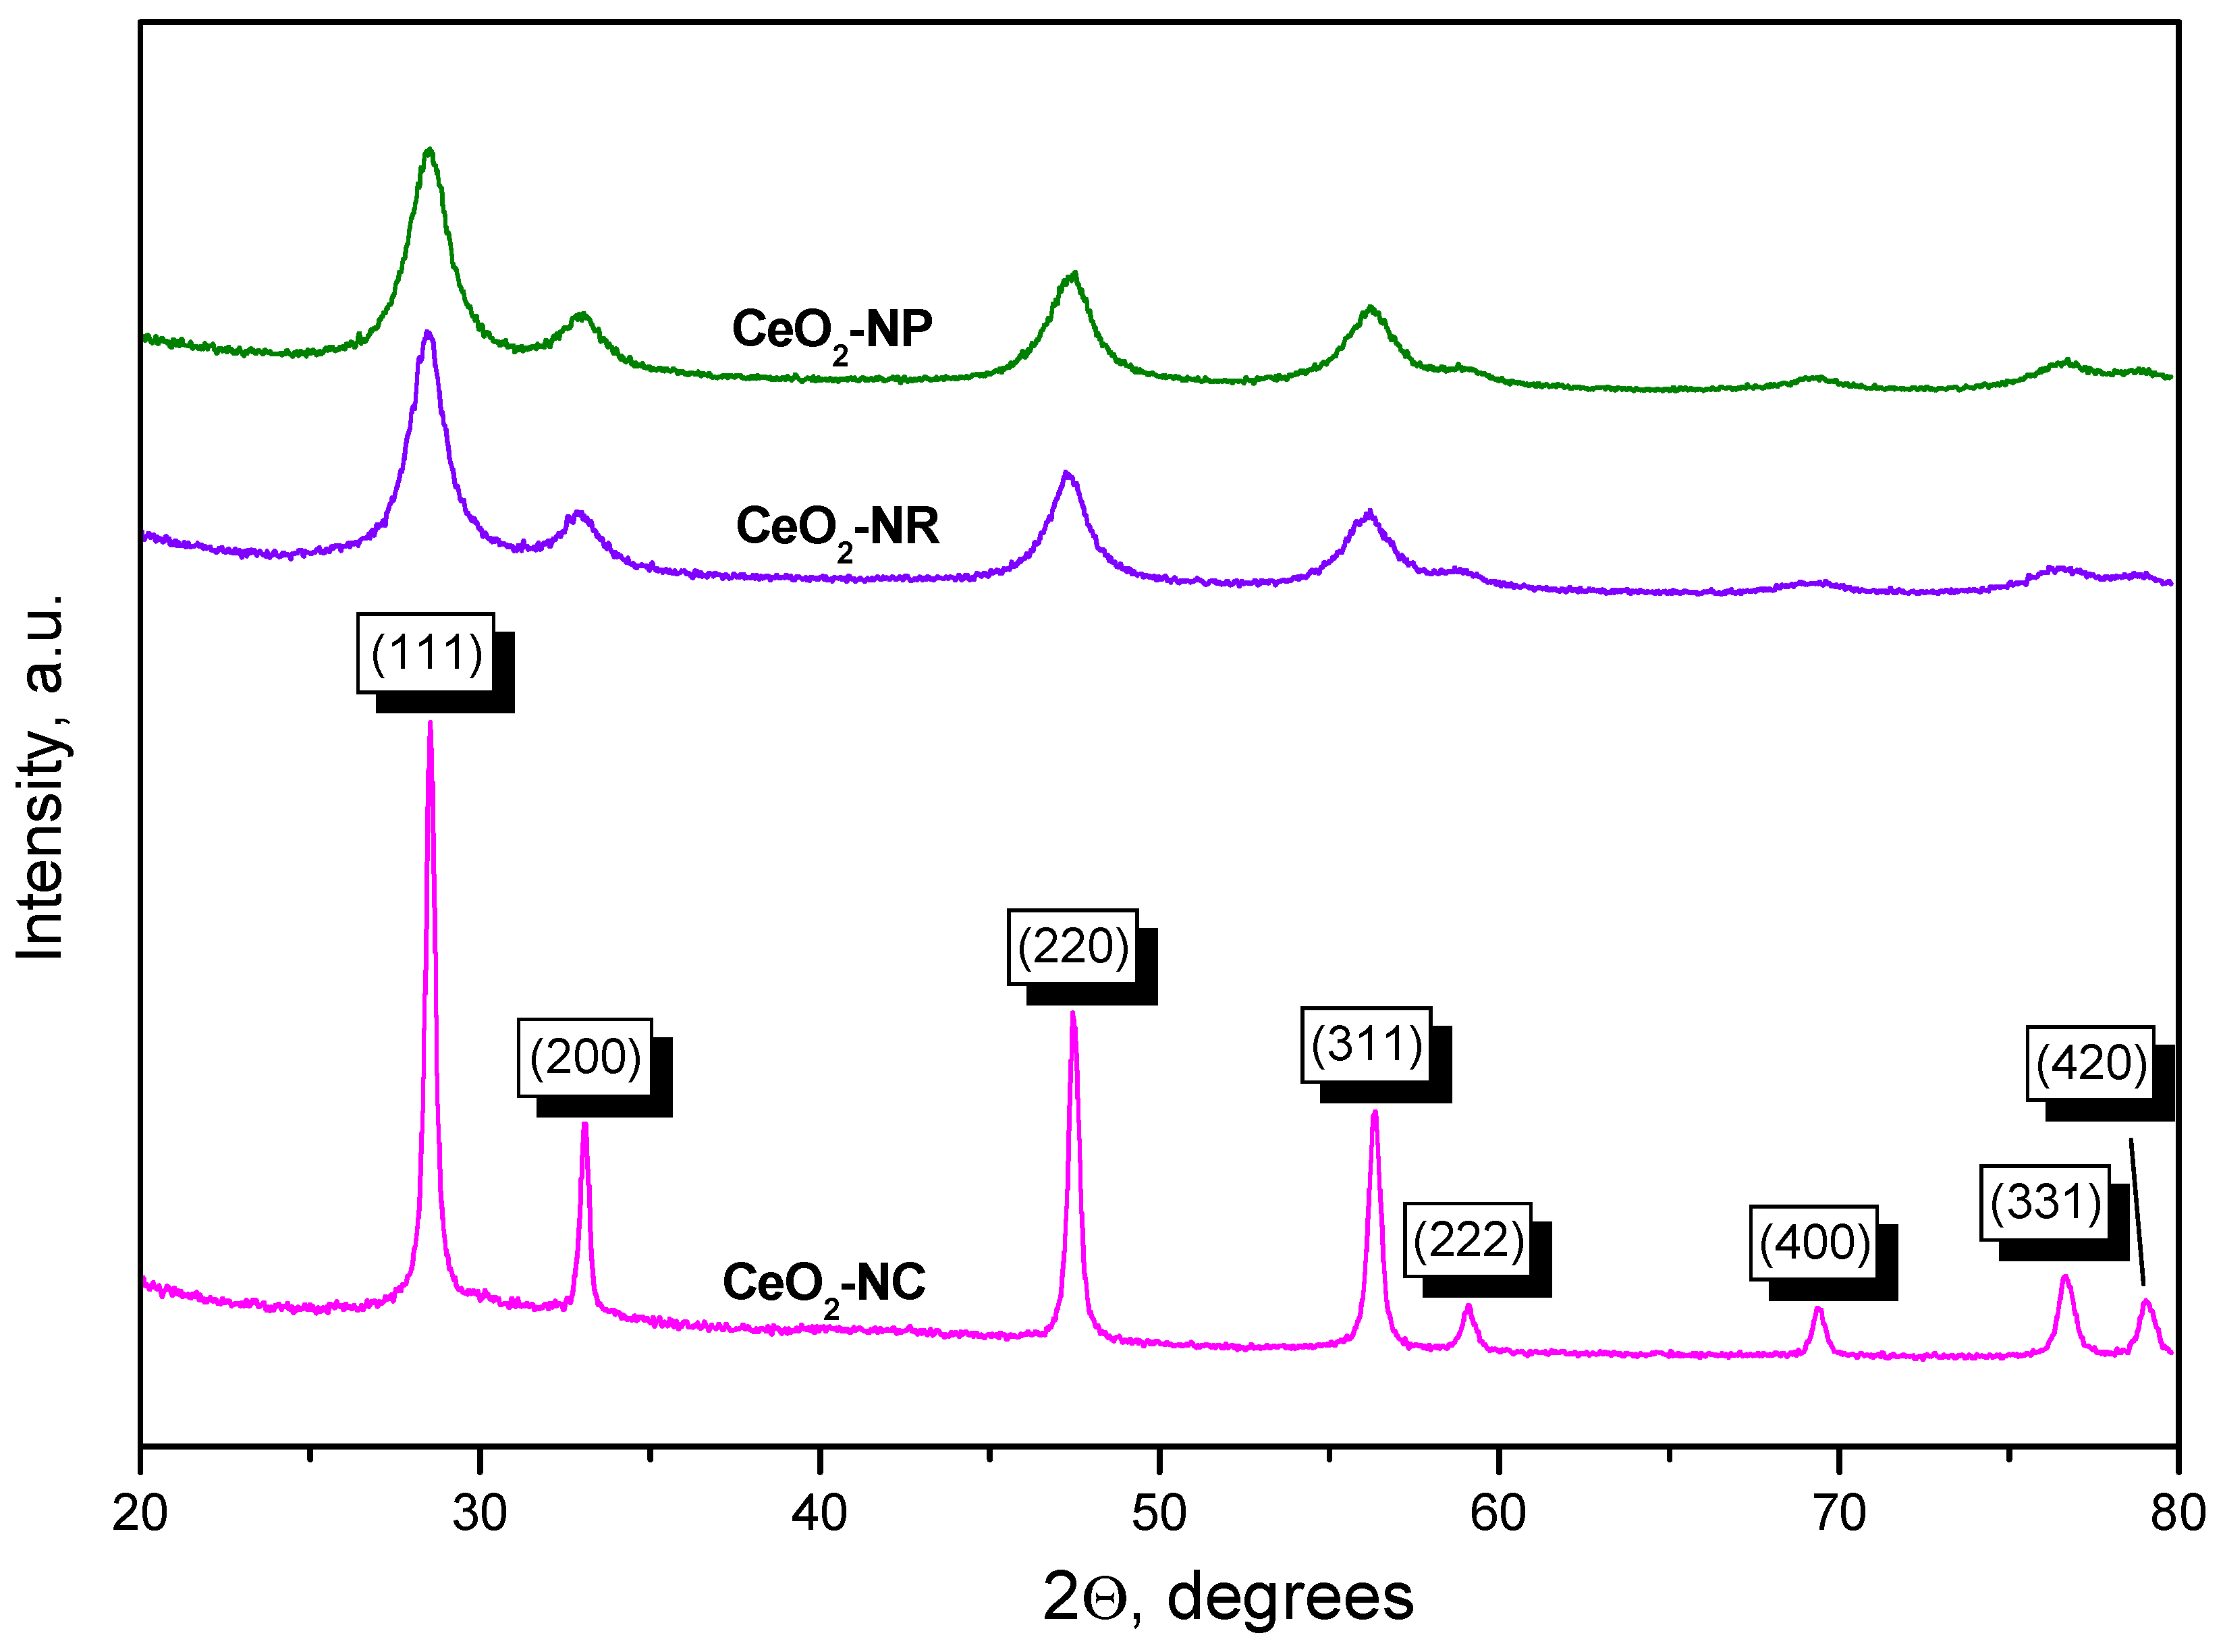
Figure 2 shows the XRD patterns of our ceria samples. CeO2-NC shows sharp peaks at 28.5°, 33.0°, 47.4°, 56.2°, 59.1°, 69.4°, 76.7°and 79°. These peaks are attributed to the (111), (200), (220), (311), (222), (400), (331) and (420) Miller indices of the cubic fluorite structure of CeO2 (CaF2 structural type, space group Fm3m) according to the ICSD file 29046.
The XRD patterns of CeO2-NP and CeO2-NR are very similar. Compared to CeO2-NC sample, the peaks are broader, which is consistent with the smaller particle size and higher specific surface area of these two samples.

2.1.3. TPR Studies

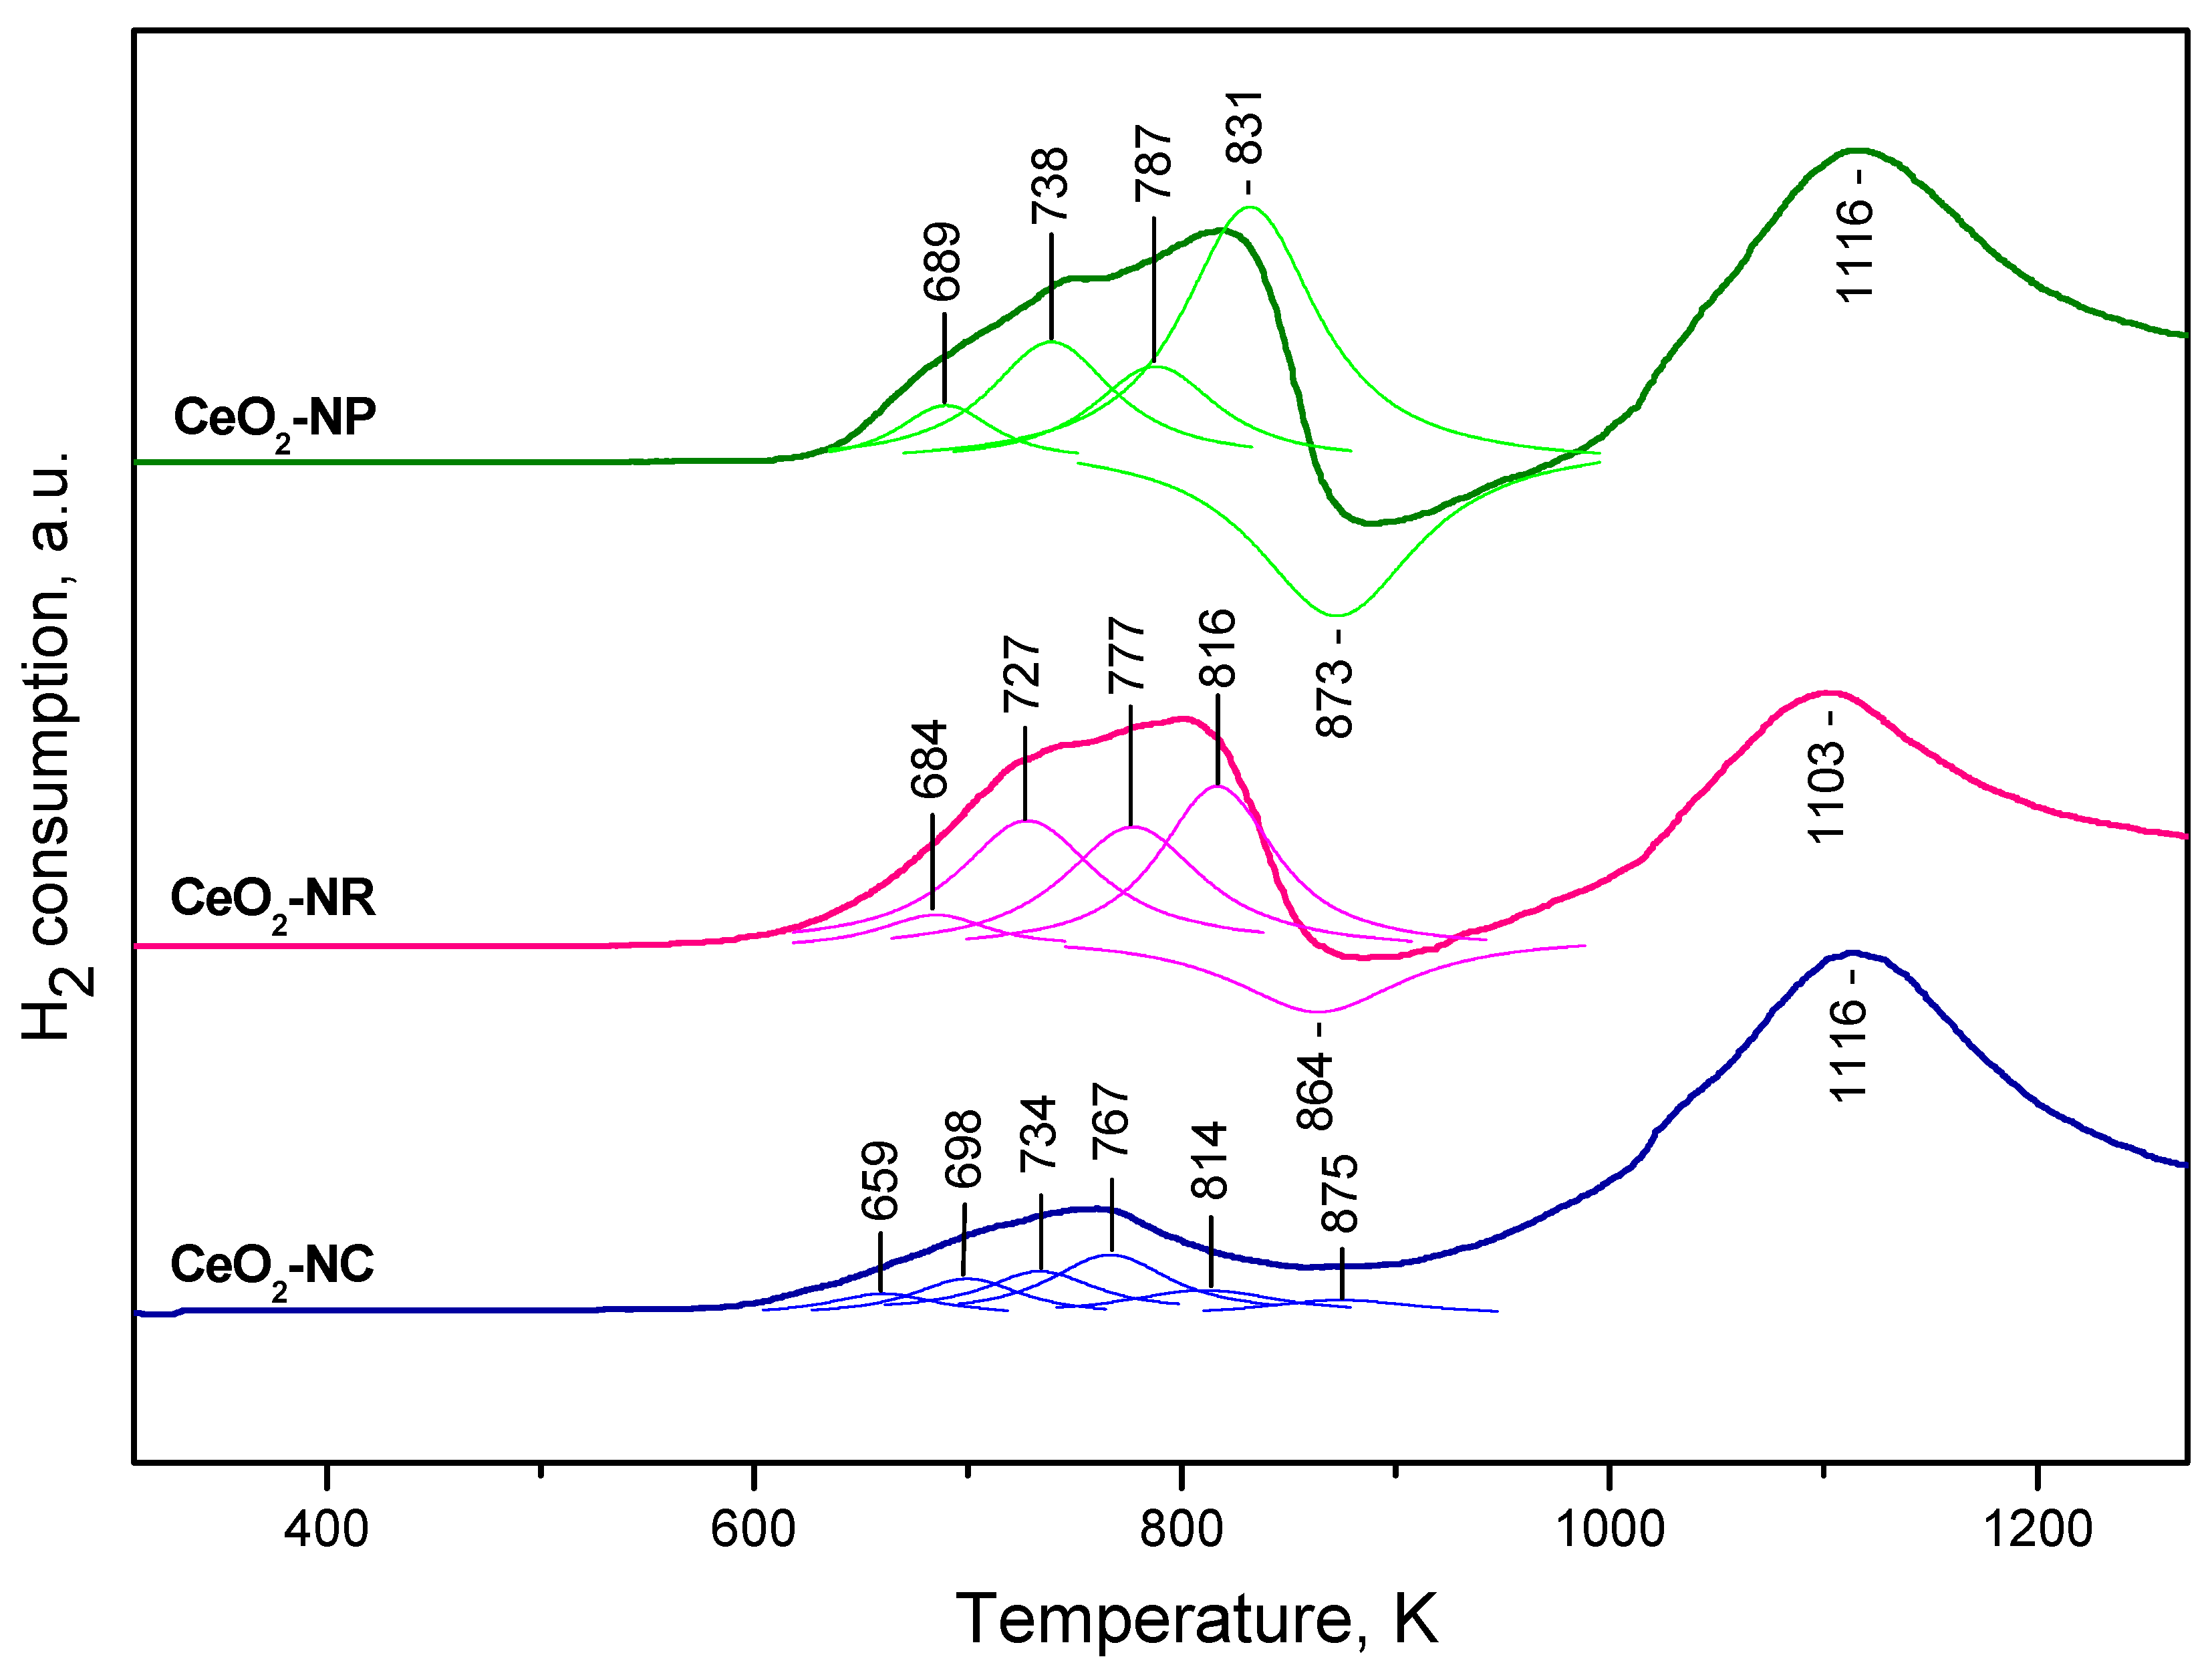
The TPR profiles obtained with our ceria samples (Figure 3) are in general agreement with previous findings [9,10,11,12,13,14,15,16,17,18,19,20,21,22,23,24,25,26,27,28,29,30]. The CeO2-NR and CeO2-NP samples show similar TPR profiles. The bulk reduction is associated with the peaks at 1116 and 1103 K where surface reduction gives rise to composite peaks below 900 K. Computer deconvolution suggests that the low-temperature peaks consist of at least four components each. In addition, negative peak around 870 K is also detected with both samples. This peak was attributed to desorption of H2 [12,80]. However, reduction of residual surface carbonates and release of CO could also contribute to the peak, as proposed by Perrichon et al. [10]. Indeed, some carbonates were detected by IR spectroscopy with all samples (see below).
The CeO2-NC sample is more easily reduced. It is characterized by a less intense first peak which is consistent with the lower specific surface of this sample. The peak appears at ca. 760 K, i.e. at temperature lower than that for the CeO2-NP and CeO2-NR samples. It also has a complex character. The second peak attributed to bulk reduction is registered at 1116 K. No negative peak was discernible with this sample. However, we cannot rule out the possibility for its existence and cancelation by a positive peak around this temperature.

2.2. Background IR Spectra of Oxidized and Reduced Samples

2.2.1. CeO2-NC

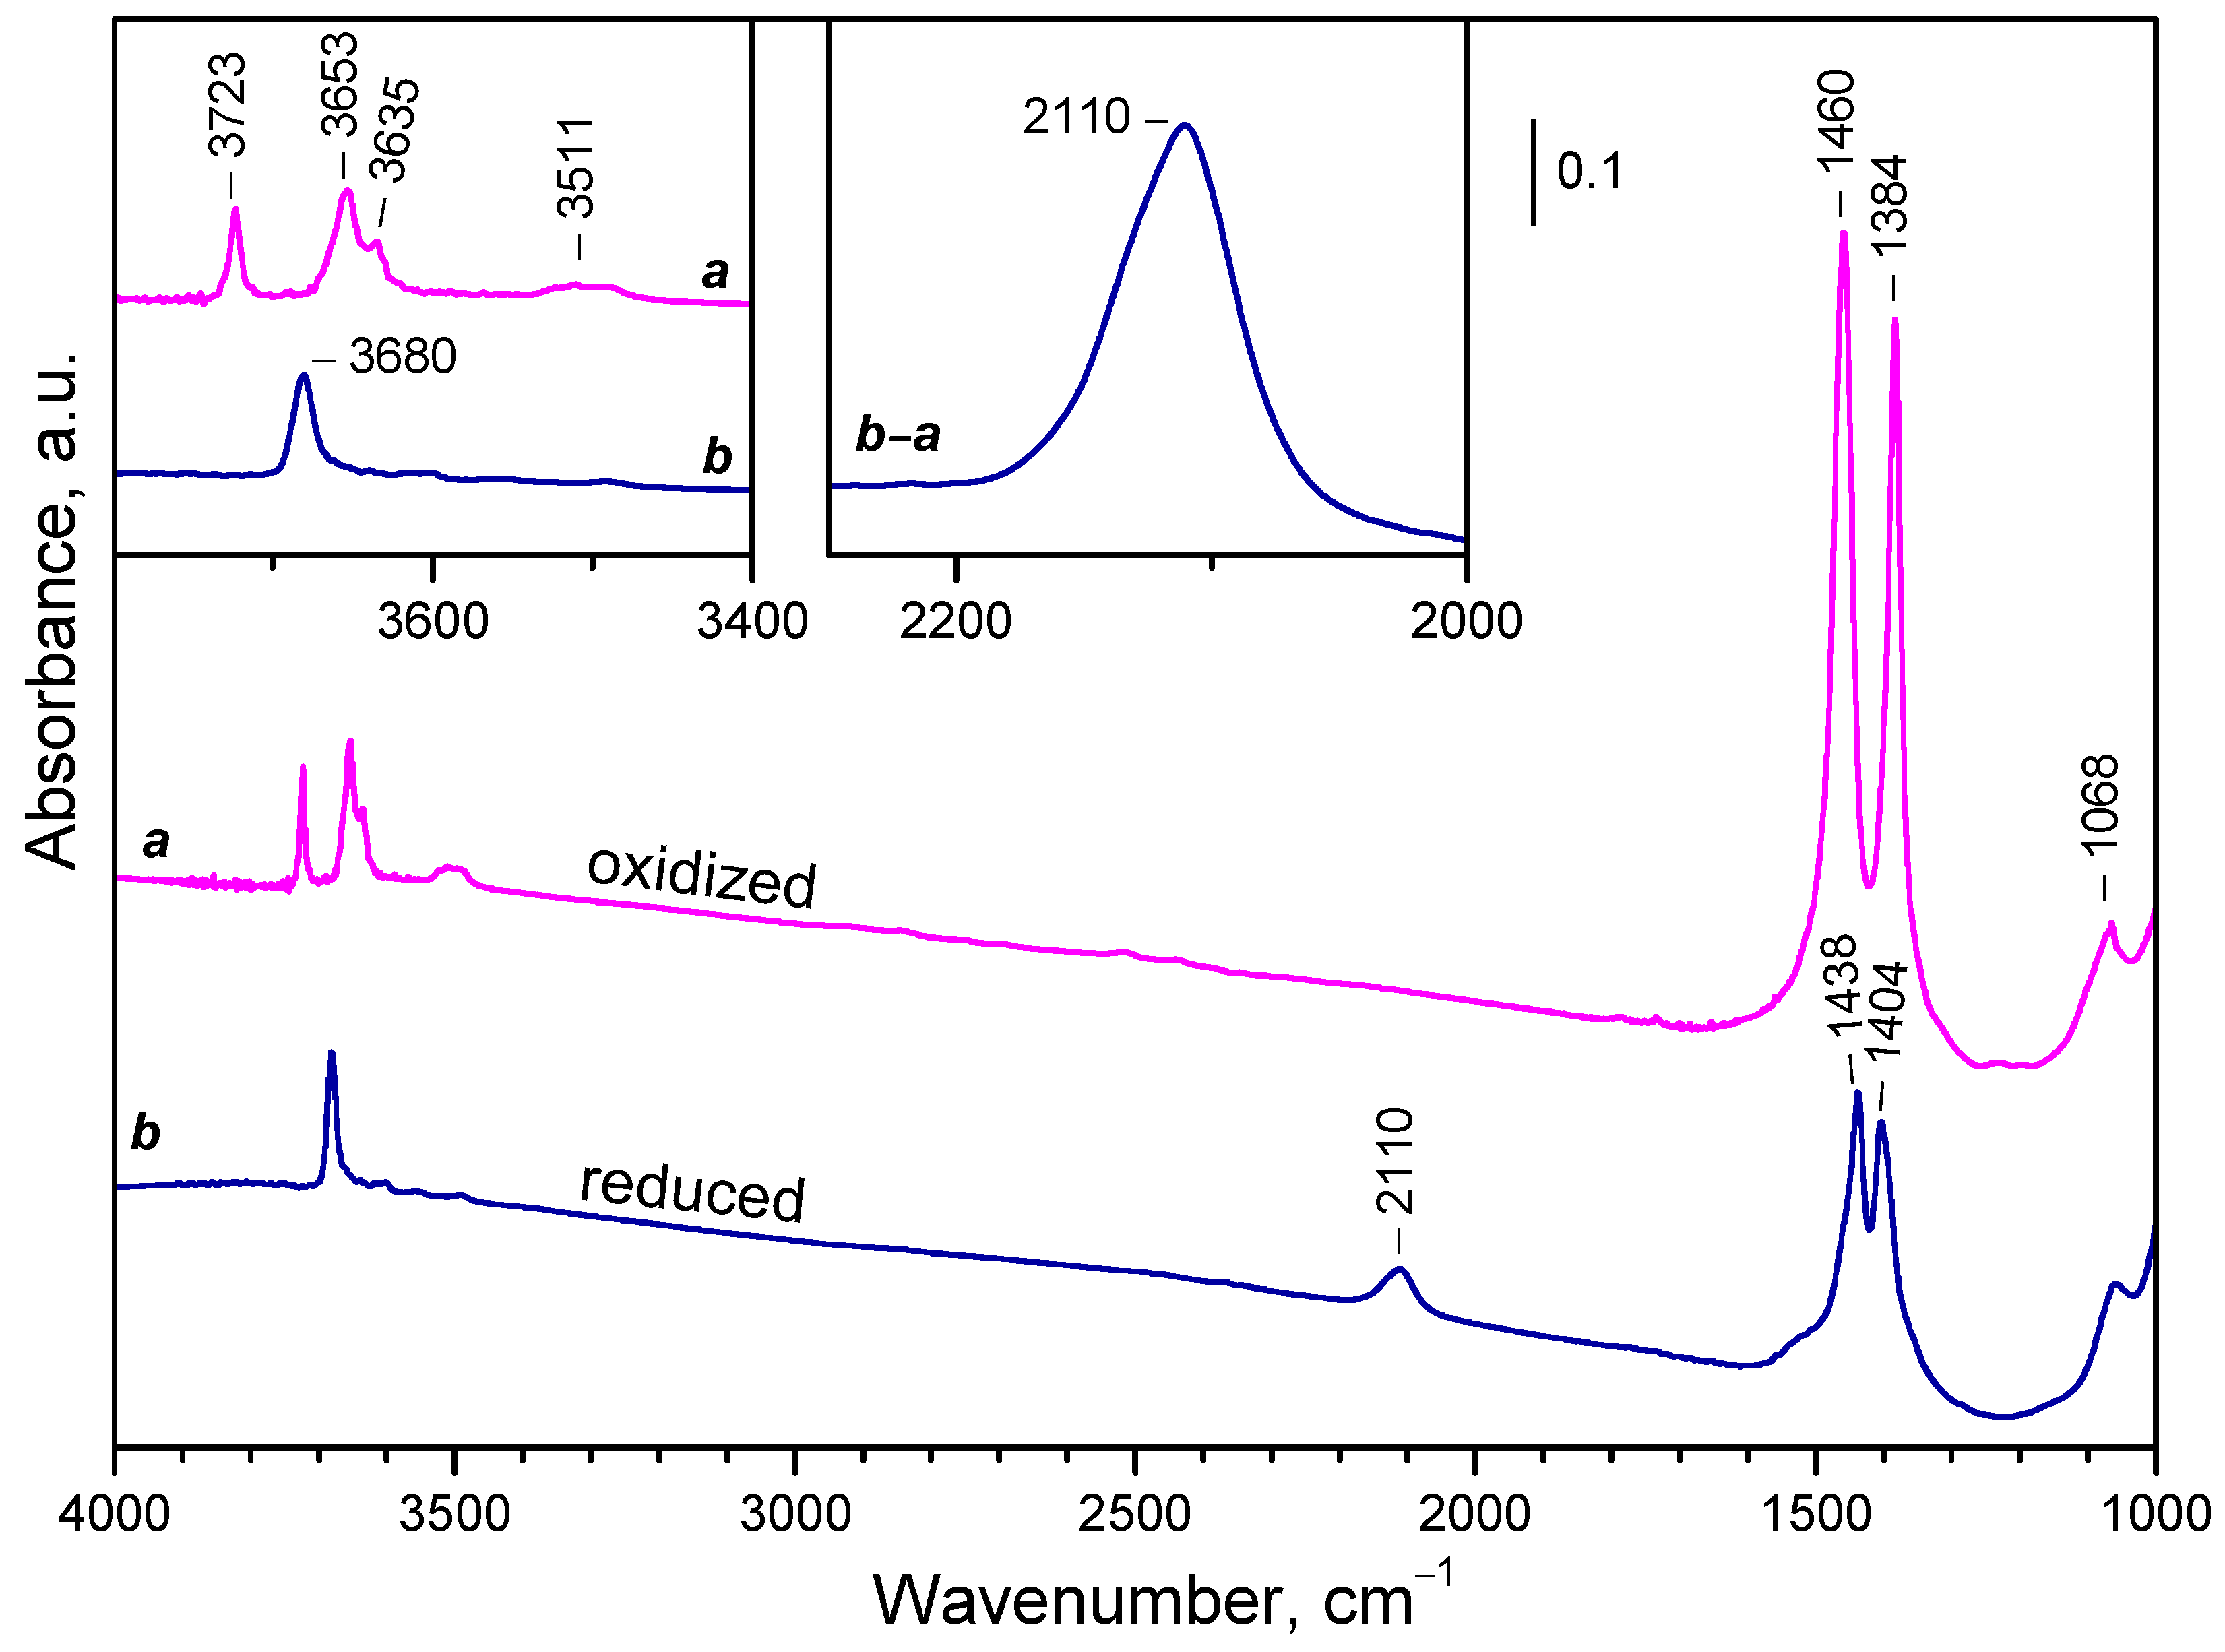
The FTIR spectra of activated and reduced CeO2-NC sample are compared in Figure 4. Activated sample is characterized by a typical of oxidized ceria hydroxyl spectrum (see the left inset in Figure 4): a band at 3723 cm–1 is assigned to terminal Ce4+-OH groups, while the bands at 3653 and 3635 cm–1 correspond to bridging hydroxyls [32,45,51,52,55,81]. A weak composite band at 3511 cm–1 is also visible. It is often attributed to oxy-hydroxide phase [51,52,55,81] or triply-bridging OH groups [32,55,81]. We support the former assignment because the frequency is too low for bridging species [82] and indicates that the hydroxyls are H-bonded. In the low-frequency region two sharp bands at 1460 and 1384 cm–1 and weaker bands at 1068 and 857 cm–1 are detected. These bands are attributed to residual carbonate species [83].
Reduction at 773 K, followed by evacuation at the same temperature leads to some changes in the IR spectrum. First, the bands due to linear and bridging OH groups disappeared and a new hydroxyl band appeared at 3680 cm–1. This band is typical of bridging hydroxyls on reduced ceria [12,52,84]. The bands of H-bonded hydroxyls (around 3500 cm-1) strongly decreased in intensity. This also happened with the carbonate bands at 1460 and 1384 cm–1. They also shifted in order to become closer in position. It was also noticed that the carbonate bands slightly decrease after each reoxidation/reduction step. Finally, a new band at 2110 cm–1 emerged (see the right inset in Figure 4). This band is assigned to the 2F5/22F7/2 electronic transition of Ce3+ [44,50,51,52,53,54,55] and is used in what follow to estimate the reduction degree of our samples. The band has a complex contour and computer deconvolution suggests it consists of several components.

2.2.2. CeO2-NR and CeO2-NP

The FTIR spectra of the CeO2-NR sample (Figure S1) slightly differ from those of CeO2-NC. The band due to terminal OH groups is of negligible intensity with the oxidized sample, while the hydroxyl spectrum of the reduced sample is more complex. Carbonate bands were of lower intensity and detected at 1573, 1486, 1353, 1292 and 1068 cm–1 with the oxidized sample. After reduction only two main bands were found at 1459 and 1371 cm-1, i.e. again they became closer in positions. The Ce3+ electronic band is composite, but the main component appears to be at 2128 cm-1.
The spectra of CeO2-NP (Figure S2) are rather similar to the spectra of CeO2-NR. The main difference is the existence for both oxidized and reduced samples of a broad band centered at ca. 3400 cm-1 which is attributed to occluded H-bonded hydroxyl groups.

2.2.3. Temperature Changes of the IR Spectra

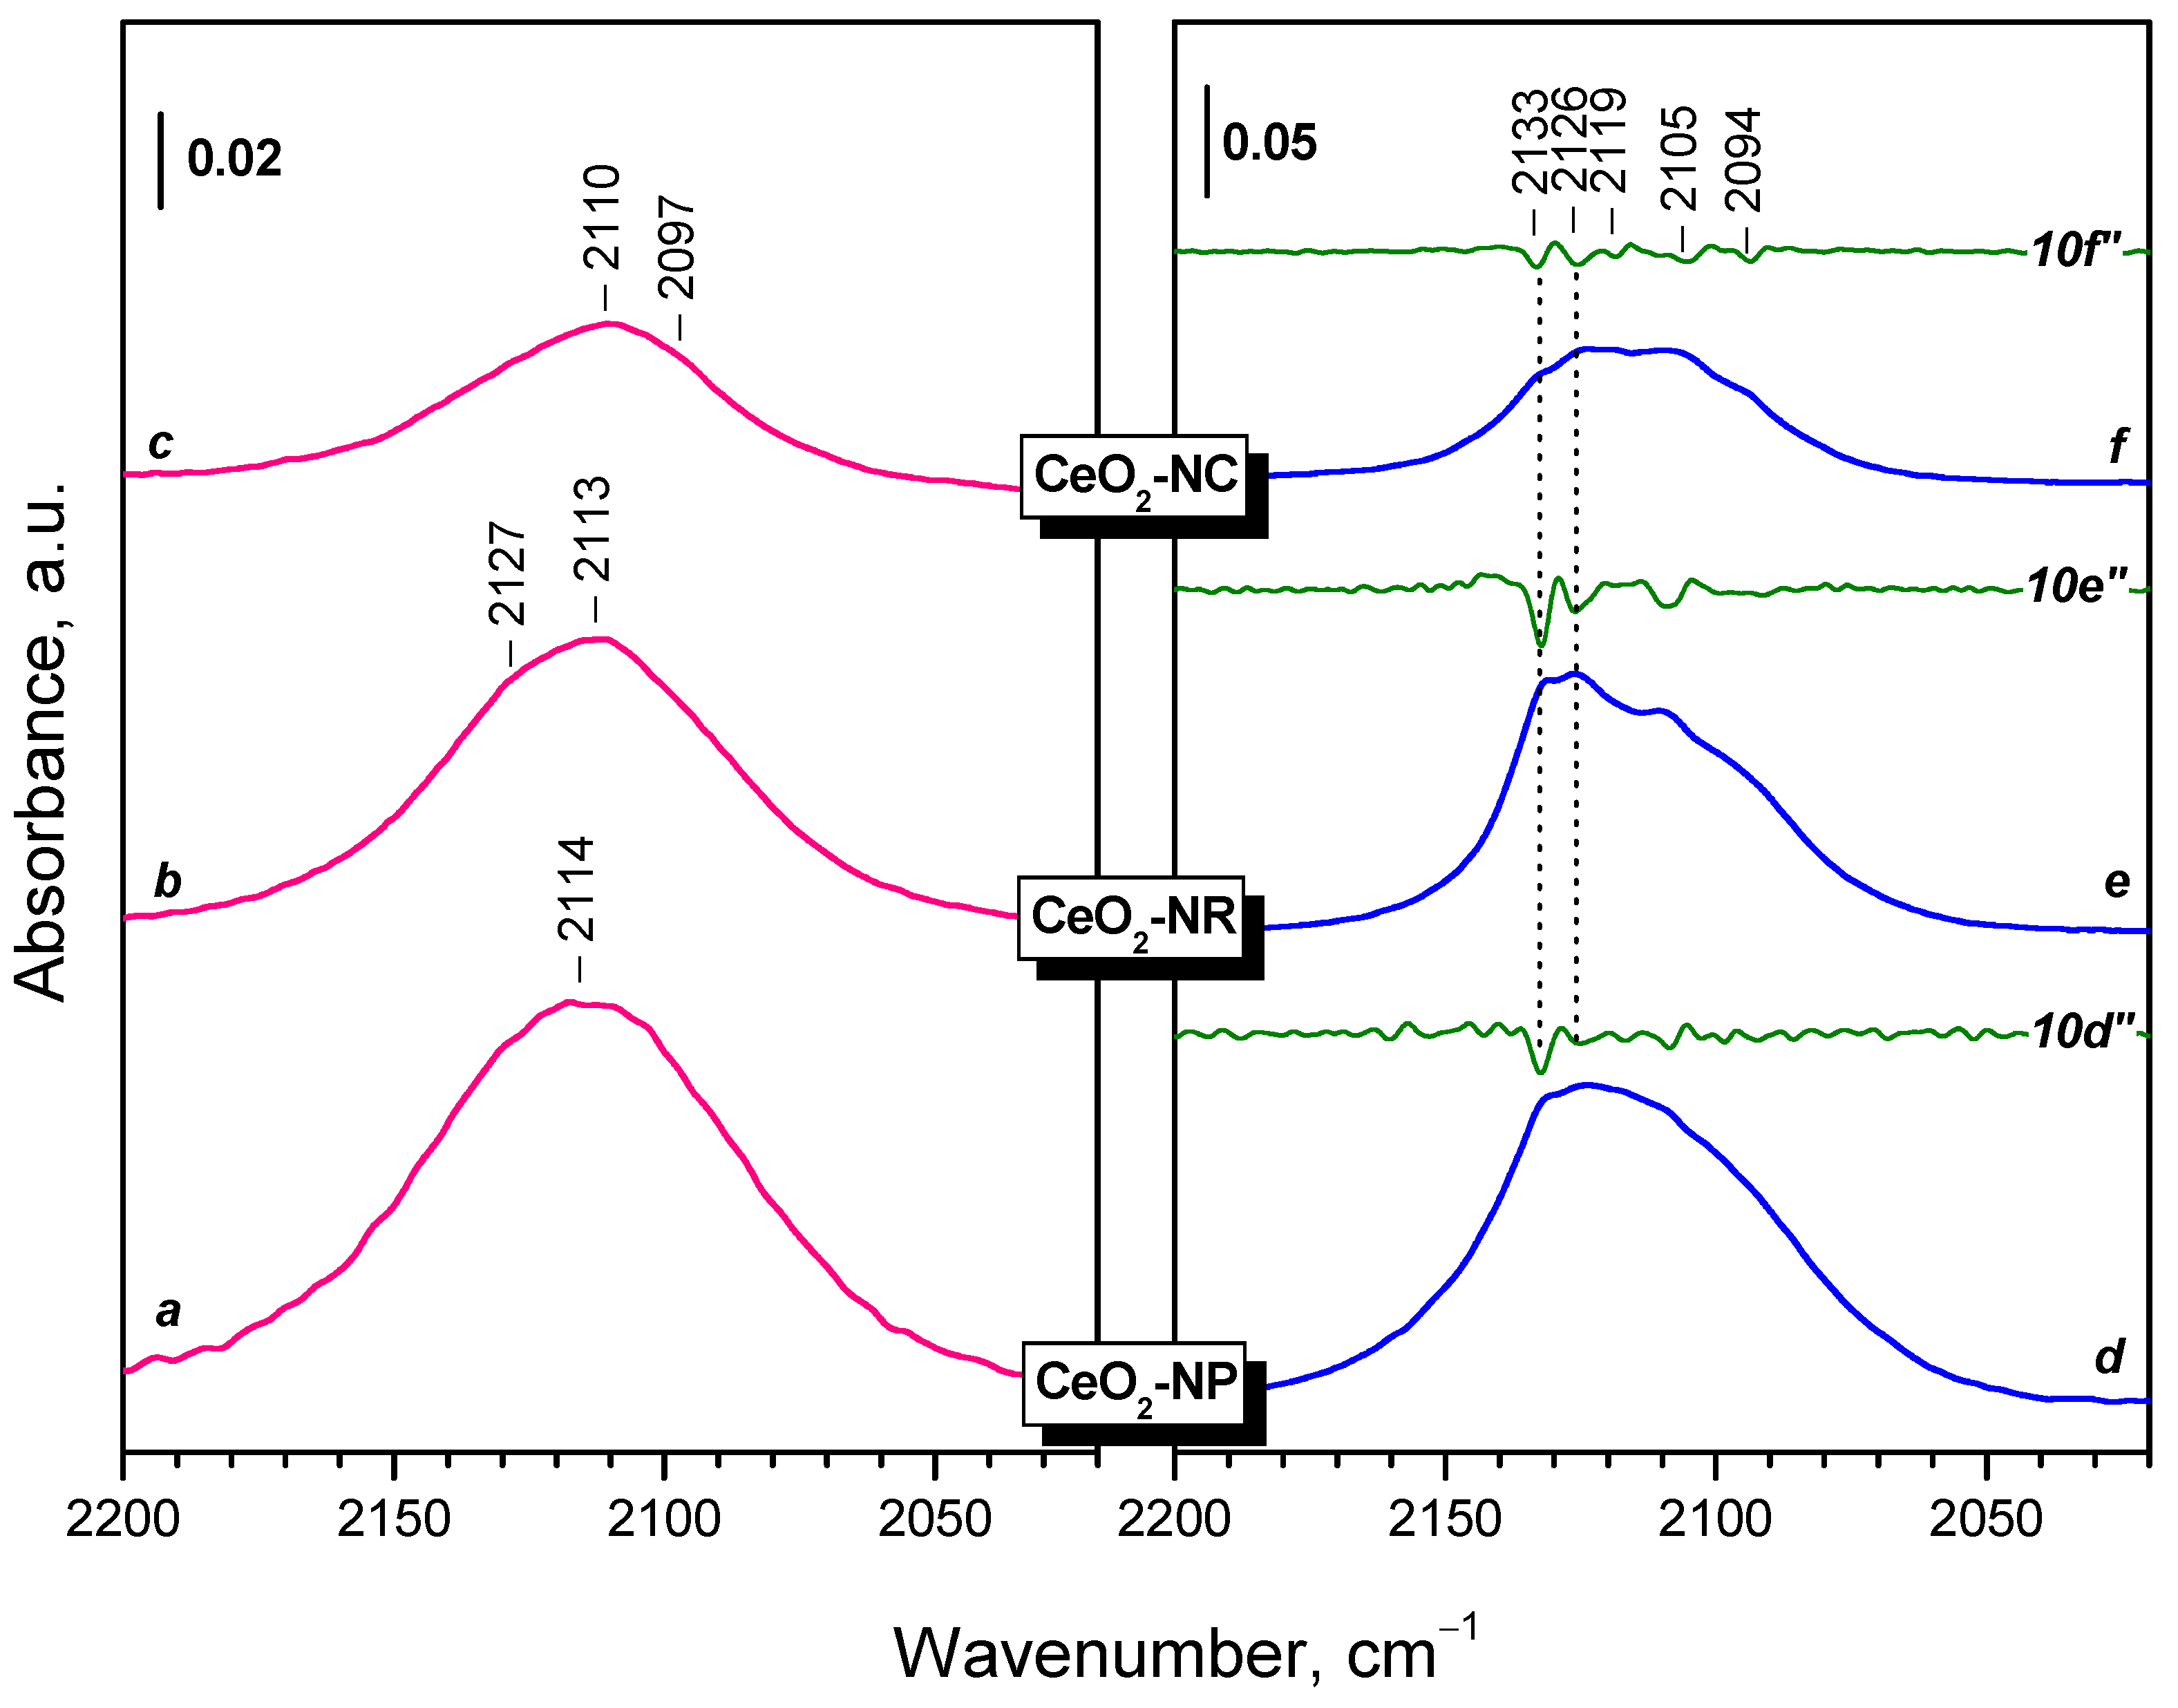
It is known that lowering temperature could lead to better resolution of superimposed bands. Figure 5 compares the spectra in the region of Ce3+ electronic transition of reduced samples registered at RT and at 100 K. First, the Ce3+ band increases in intensity at low temperature (note the different scales in the two panels). Secondly, several components become well resolved. The low-frequency components (2105 and 2094 cm–1) are emphasized for the CeO2-NC sample which may suggest that they are associated with the {100} facets.
The hydroxyl spectra, and to a smaller extent the carbonate bands, are also affected by temperature (see Figure S3).

2.3. Interaction of Activated Samples with O2 at Variable Temperatures

Although most authors are of the opinion that reactive oxygen adsorption on ceria occurs on reduced Ce3+ cations, there are also opinions that the adsorption sites are Ce4+ cations [60,61]. In order to check this, we have studied O2 adsorption on activated (oxidized) samples. No Ce3+ electronic band was detected on CeO2-NC samples activated at 573, 673 and 773 K, indicating the lack of Ce3+ sites. Adsorption of O2 (2 mbar equilibrium pressure) at 100 K on these sample after each of these pretreatments led only to the appearance of a weak band at 1555-1553 cm-1 attributed to molecularly adsorbed O2 (Figure S4). These results are in agreement with the findings of Pushkarev et al. [62] and Wu et al. [43] who have observed no reactive O2 adsorption on oxidized ceria. The band increases in intensity with the activation temperature. Warming the sample up to ambient temperature leads only to the fast disappearance of this band. The same situation was found with the other two samples. Therefore, we conclude that molecular adsorption of O2 proceeds on Ce4+ sites and for reactive O2 adsorption Ce3+ sites are necessary.

2.4. Interaction of Reduced CeO2-NC with O2 at Variable Temperature

In order to follow the initial stages of ceria oxidation, we studied the interaction of reduced samples at 100 K followed by a gradual increase of the temperature. For these experiments we have chosen two samples: CeO2-NC, because of the preferential exposure of the {100} face, and CeO2-NP, because of the highest intensity of the Ce3+ electronic transition peak. For unambiguous assignment of the peaks, we performed also experiments with 18O2.

2.4.1. Interaction with 16O2

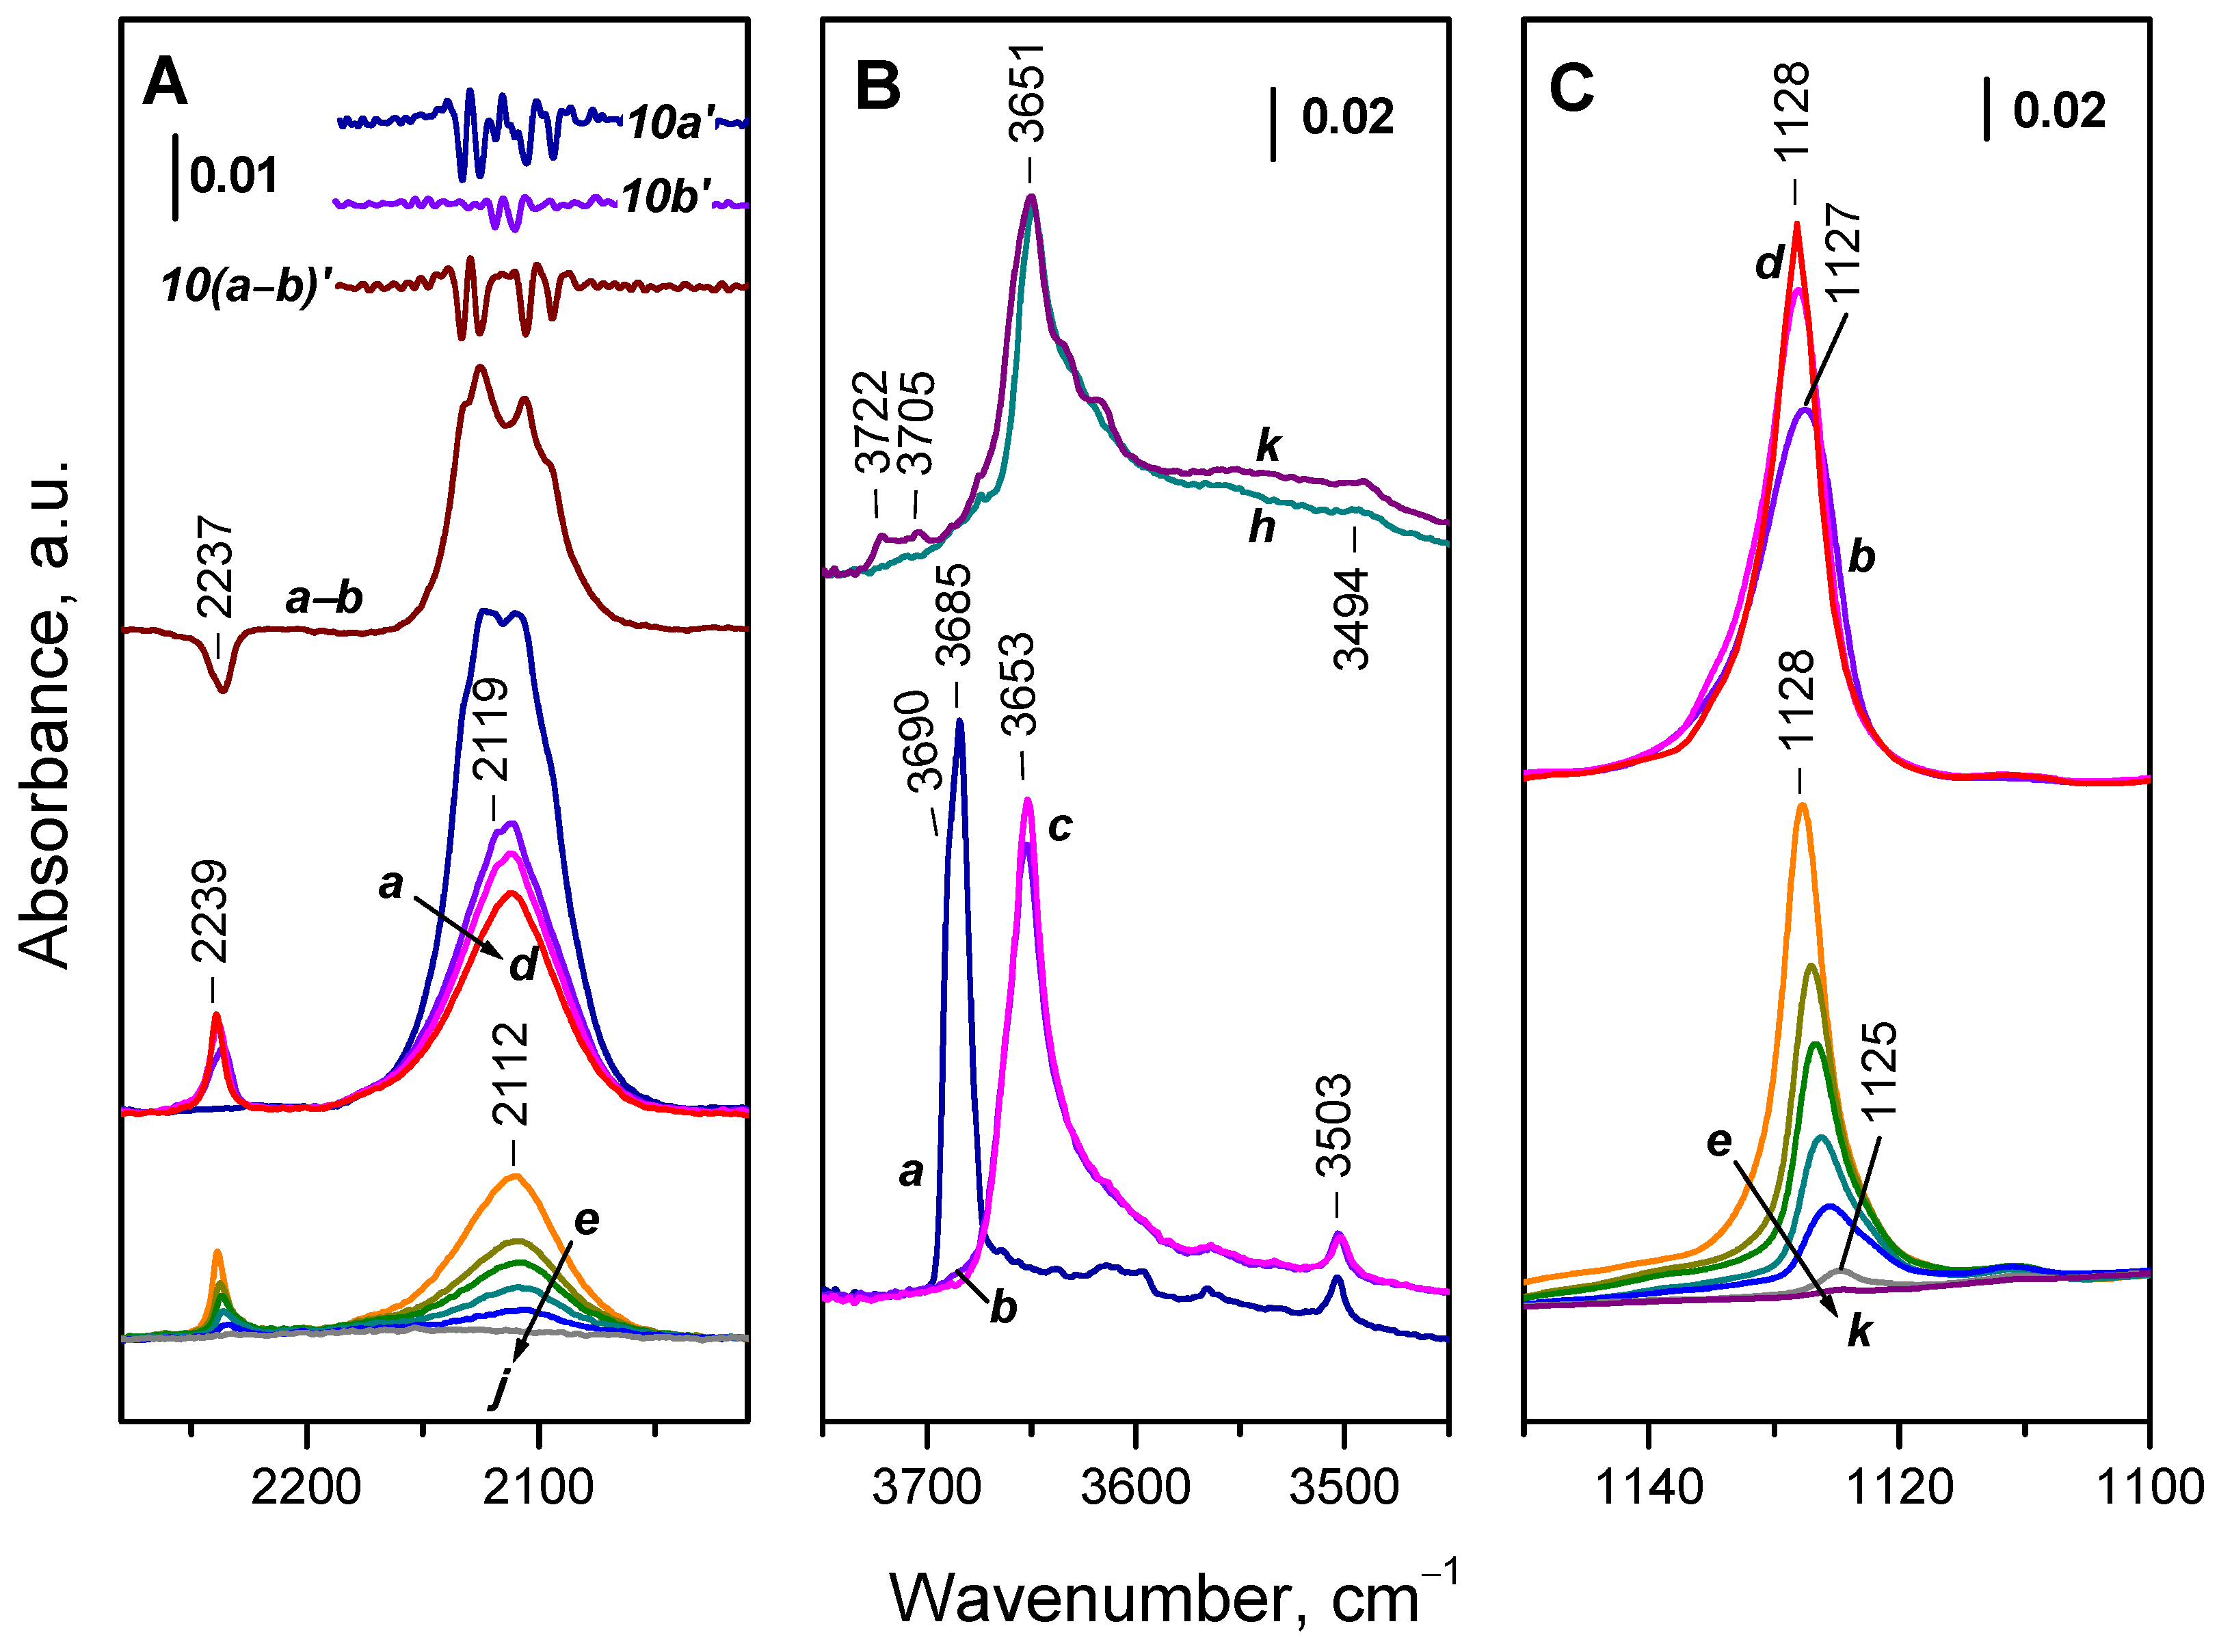
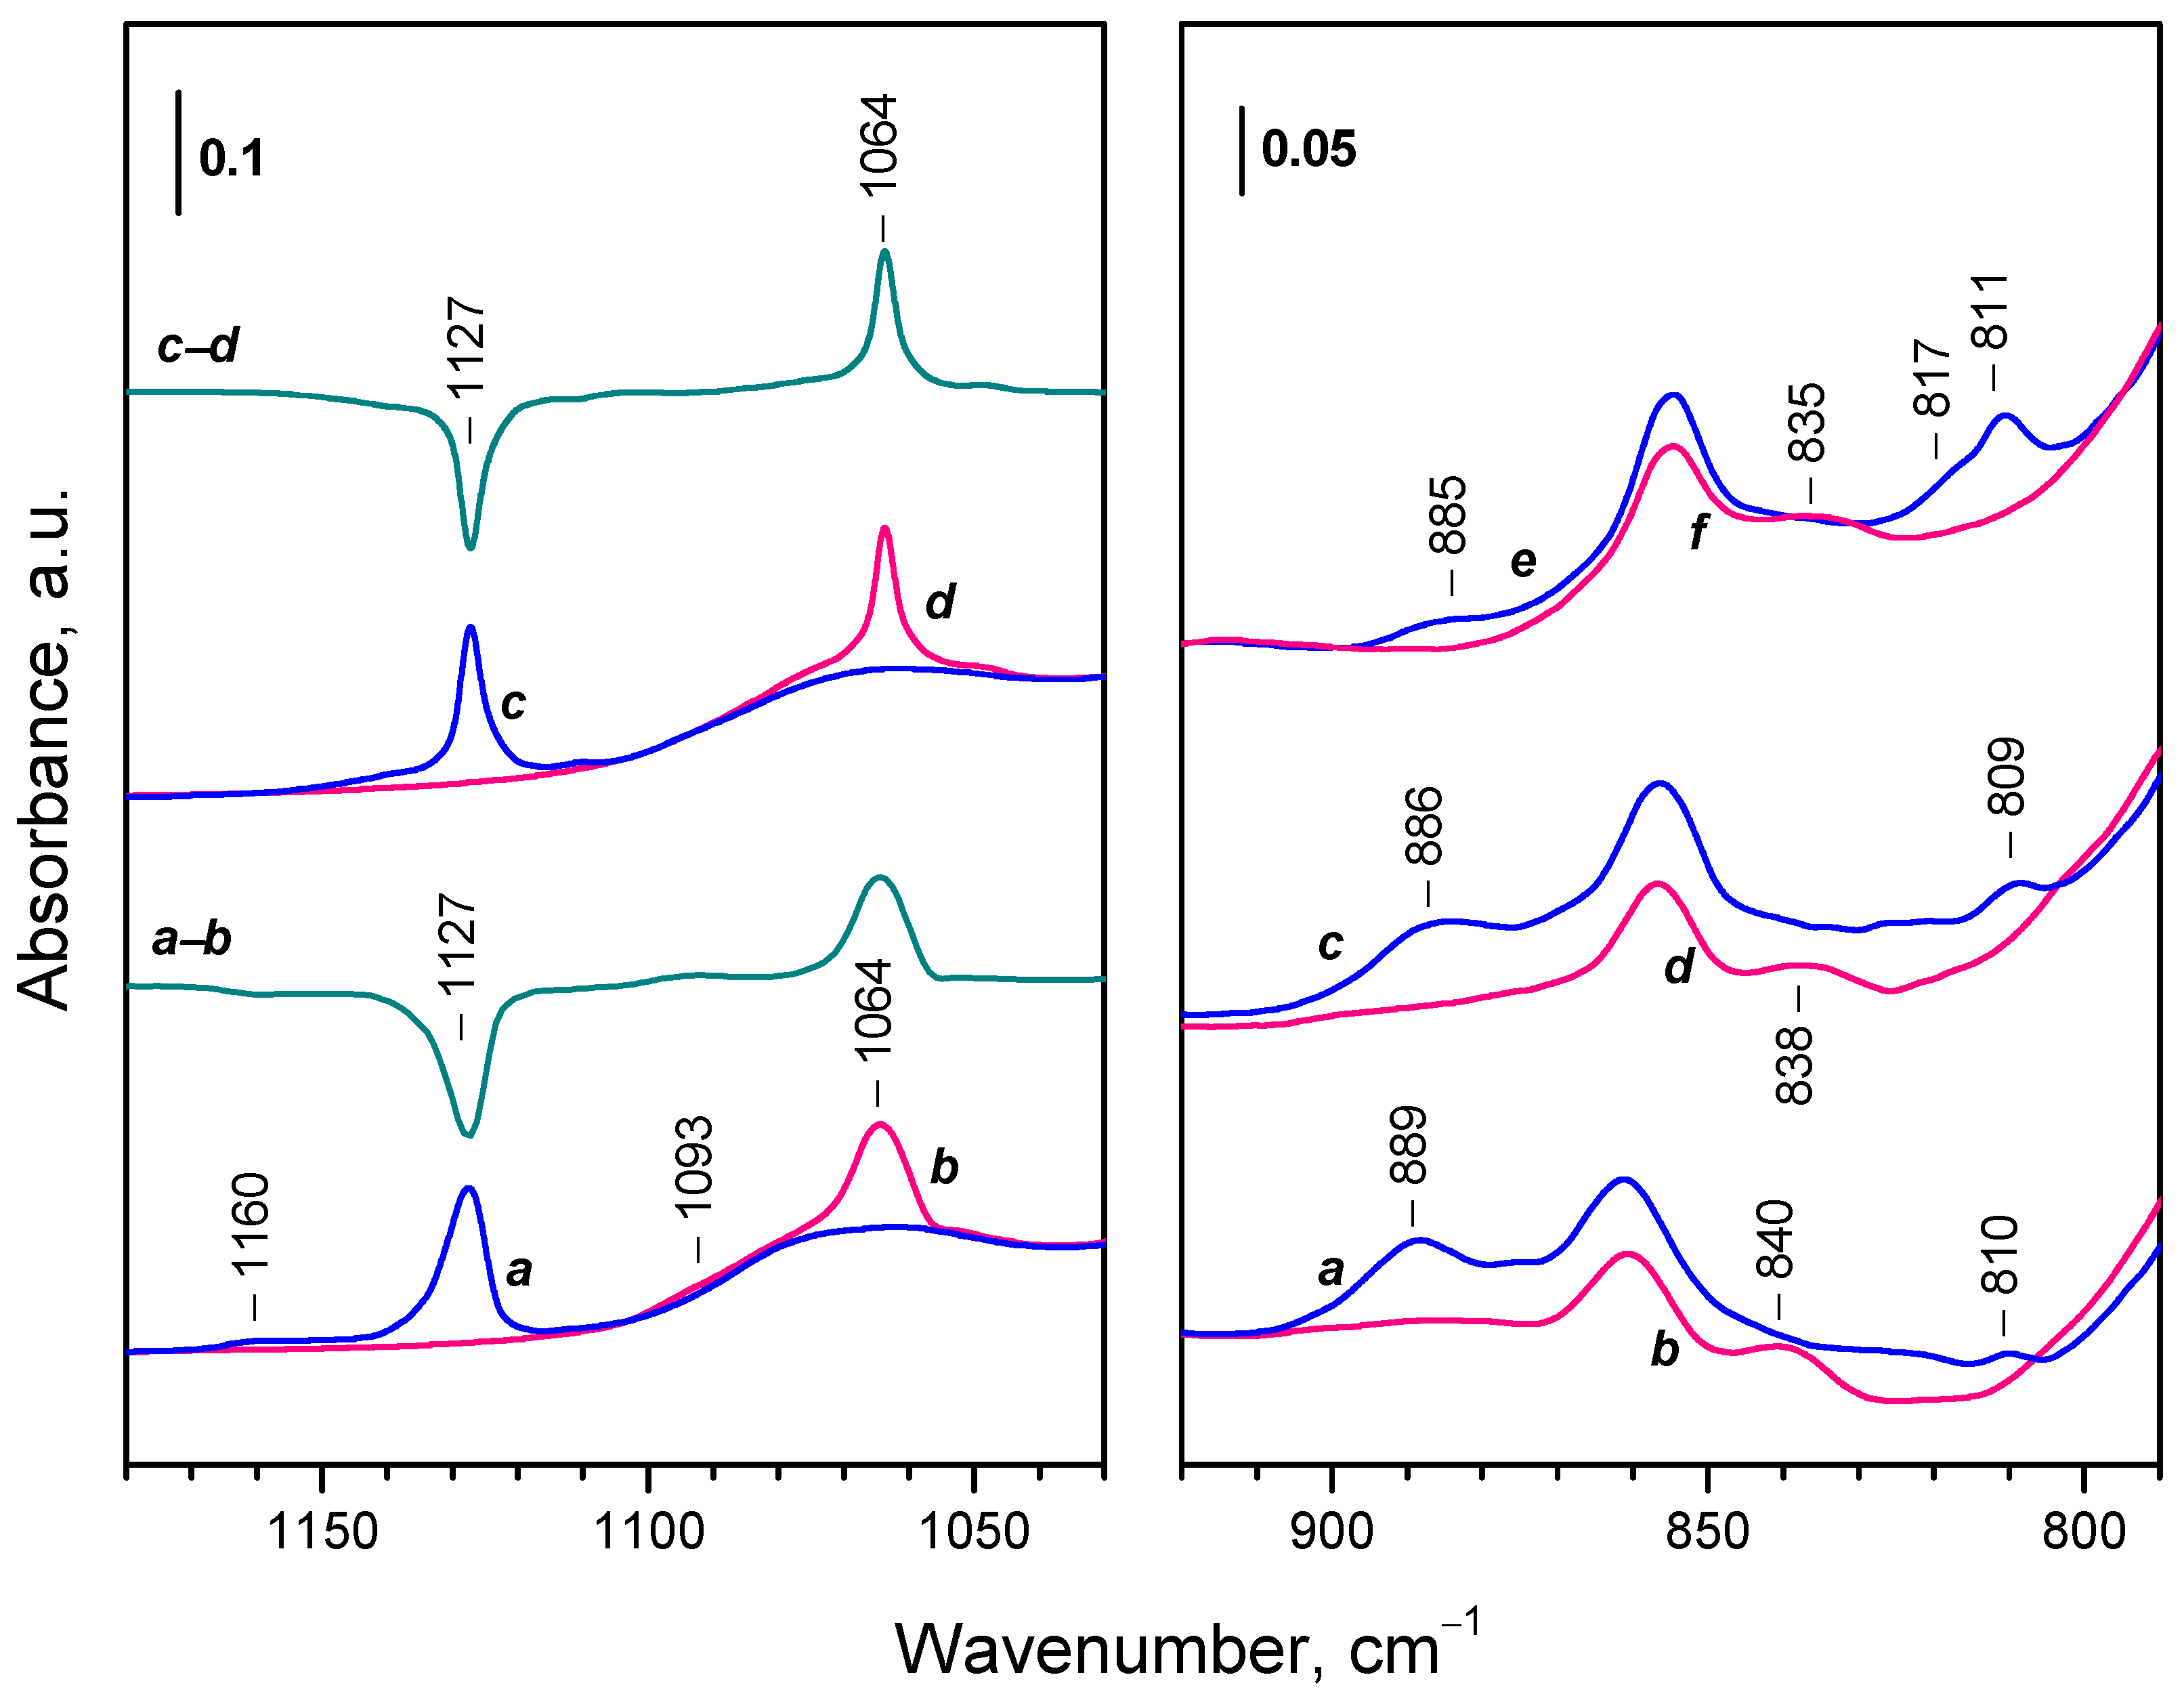
The background spectrum of CeO2-NC registered at 100 K is shown on Figure 6, spectrum a. As already discussed, the intensity of the Ce3+ electronic band is enhanced as compared to the spectrum registered at ambient temperature. The hydroxyl and carbonate bands are slightly shifted. Introduction of O2 (2 mbar) to the sample leads to an immediate substantial drop in intensity of the Ce3+ electronic band (Figure 6, spectrum b). Difference spectra (a-b) indicate that the band was substantially eroded from the higher and lower frequency sides. This indicates the lack of correlation between the band position and the reactivity of the related species. According to the integral band area, 45 % of the Ce3+ sites were immediately oxidized. No further measurable changes occurred when the sample was allowed to stay in O2 atmosphere at 100 K for 10 min.
In the ν(OH) region (Figure 6, panel B) the band at 3685 cm-1 practically disappeared and a new band (typical of oxidized sample) appeared at 3653 cm-1. The band at 3503 cm-1 remained intact. The results indicate that all Ce3+ sites bound to the 3685 cm-1 OH species are very fast oxidized.
A band at 1127 cm-1 was recorded in the lower frequency region (Figure 6, panel C) and attributed to the ν(O−O) modes of superoxo (O2) species [39,41,43,59,60,61,62]. The respective overtone was detected at 2237 cm-1 (see Figure 6, pane A). This implies that oxidation of Ce3+ with the formation of Ce4+–O2 takes place.
It should be also noted that weak bands also developed in the 900 – 800 cm-1 and could characterize peroxo species. However, a strong change of the background in this region hinders the exact assignments. Therefore, the attribution of these band will be provided below, when the spectra of adsorbed 18O2 are described.
Finally, a weak band at 1553 cm-1 was also detected as with the oxidized sample, but its intensity was reduced. The band is of very weak stability and was already attributed to molecularly adsorbed O2. It will not be discussed further on.
As the temperature gradually increases, the erosion of the Ce3+ electronic transition band progresses and it becomes undetectable at 373 K. The intensity of the superoxide band initially slightly increases (Figure 6, spectra c, d) and then starts to decrease, with the band disappearing at 400 K (Figure 6, spectra e-k). The OH band is slightly red shifted to 3651 cm-1 and weak components due to terminal hydroxyls (3722 and 3705 cm-1) developed at 400 K.
Note that the intensity changes and the band shifts in the experiments performed at different temperatures should be taken with care. First, the decrease of the Ce3+ band in intensity is partly due to temperature increase. The shift and the slight decrease in intensity of the OH band at 3633 cm-1 should also be mainly related to temperature change and this most probably applies to the position of the superoxide band.

2.4.2. Interaction with 18O2

To confirm the proposed assignments of bands to superoxo and peroxo species, we performed experiments with 18O2. In order to obtain more information on the elementary reaction steps, we first studied successive adsorption of small doses of 18O2 (Figure 7 and Figure 8).
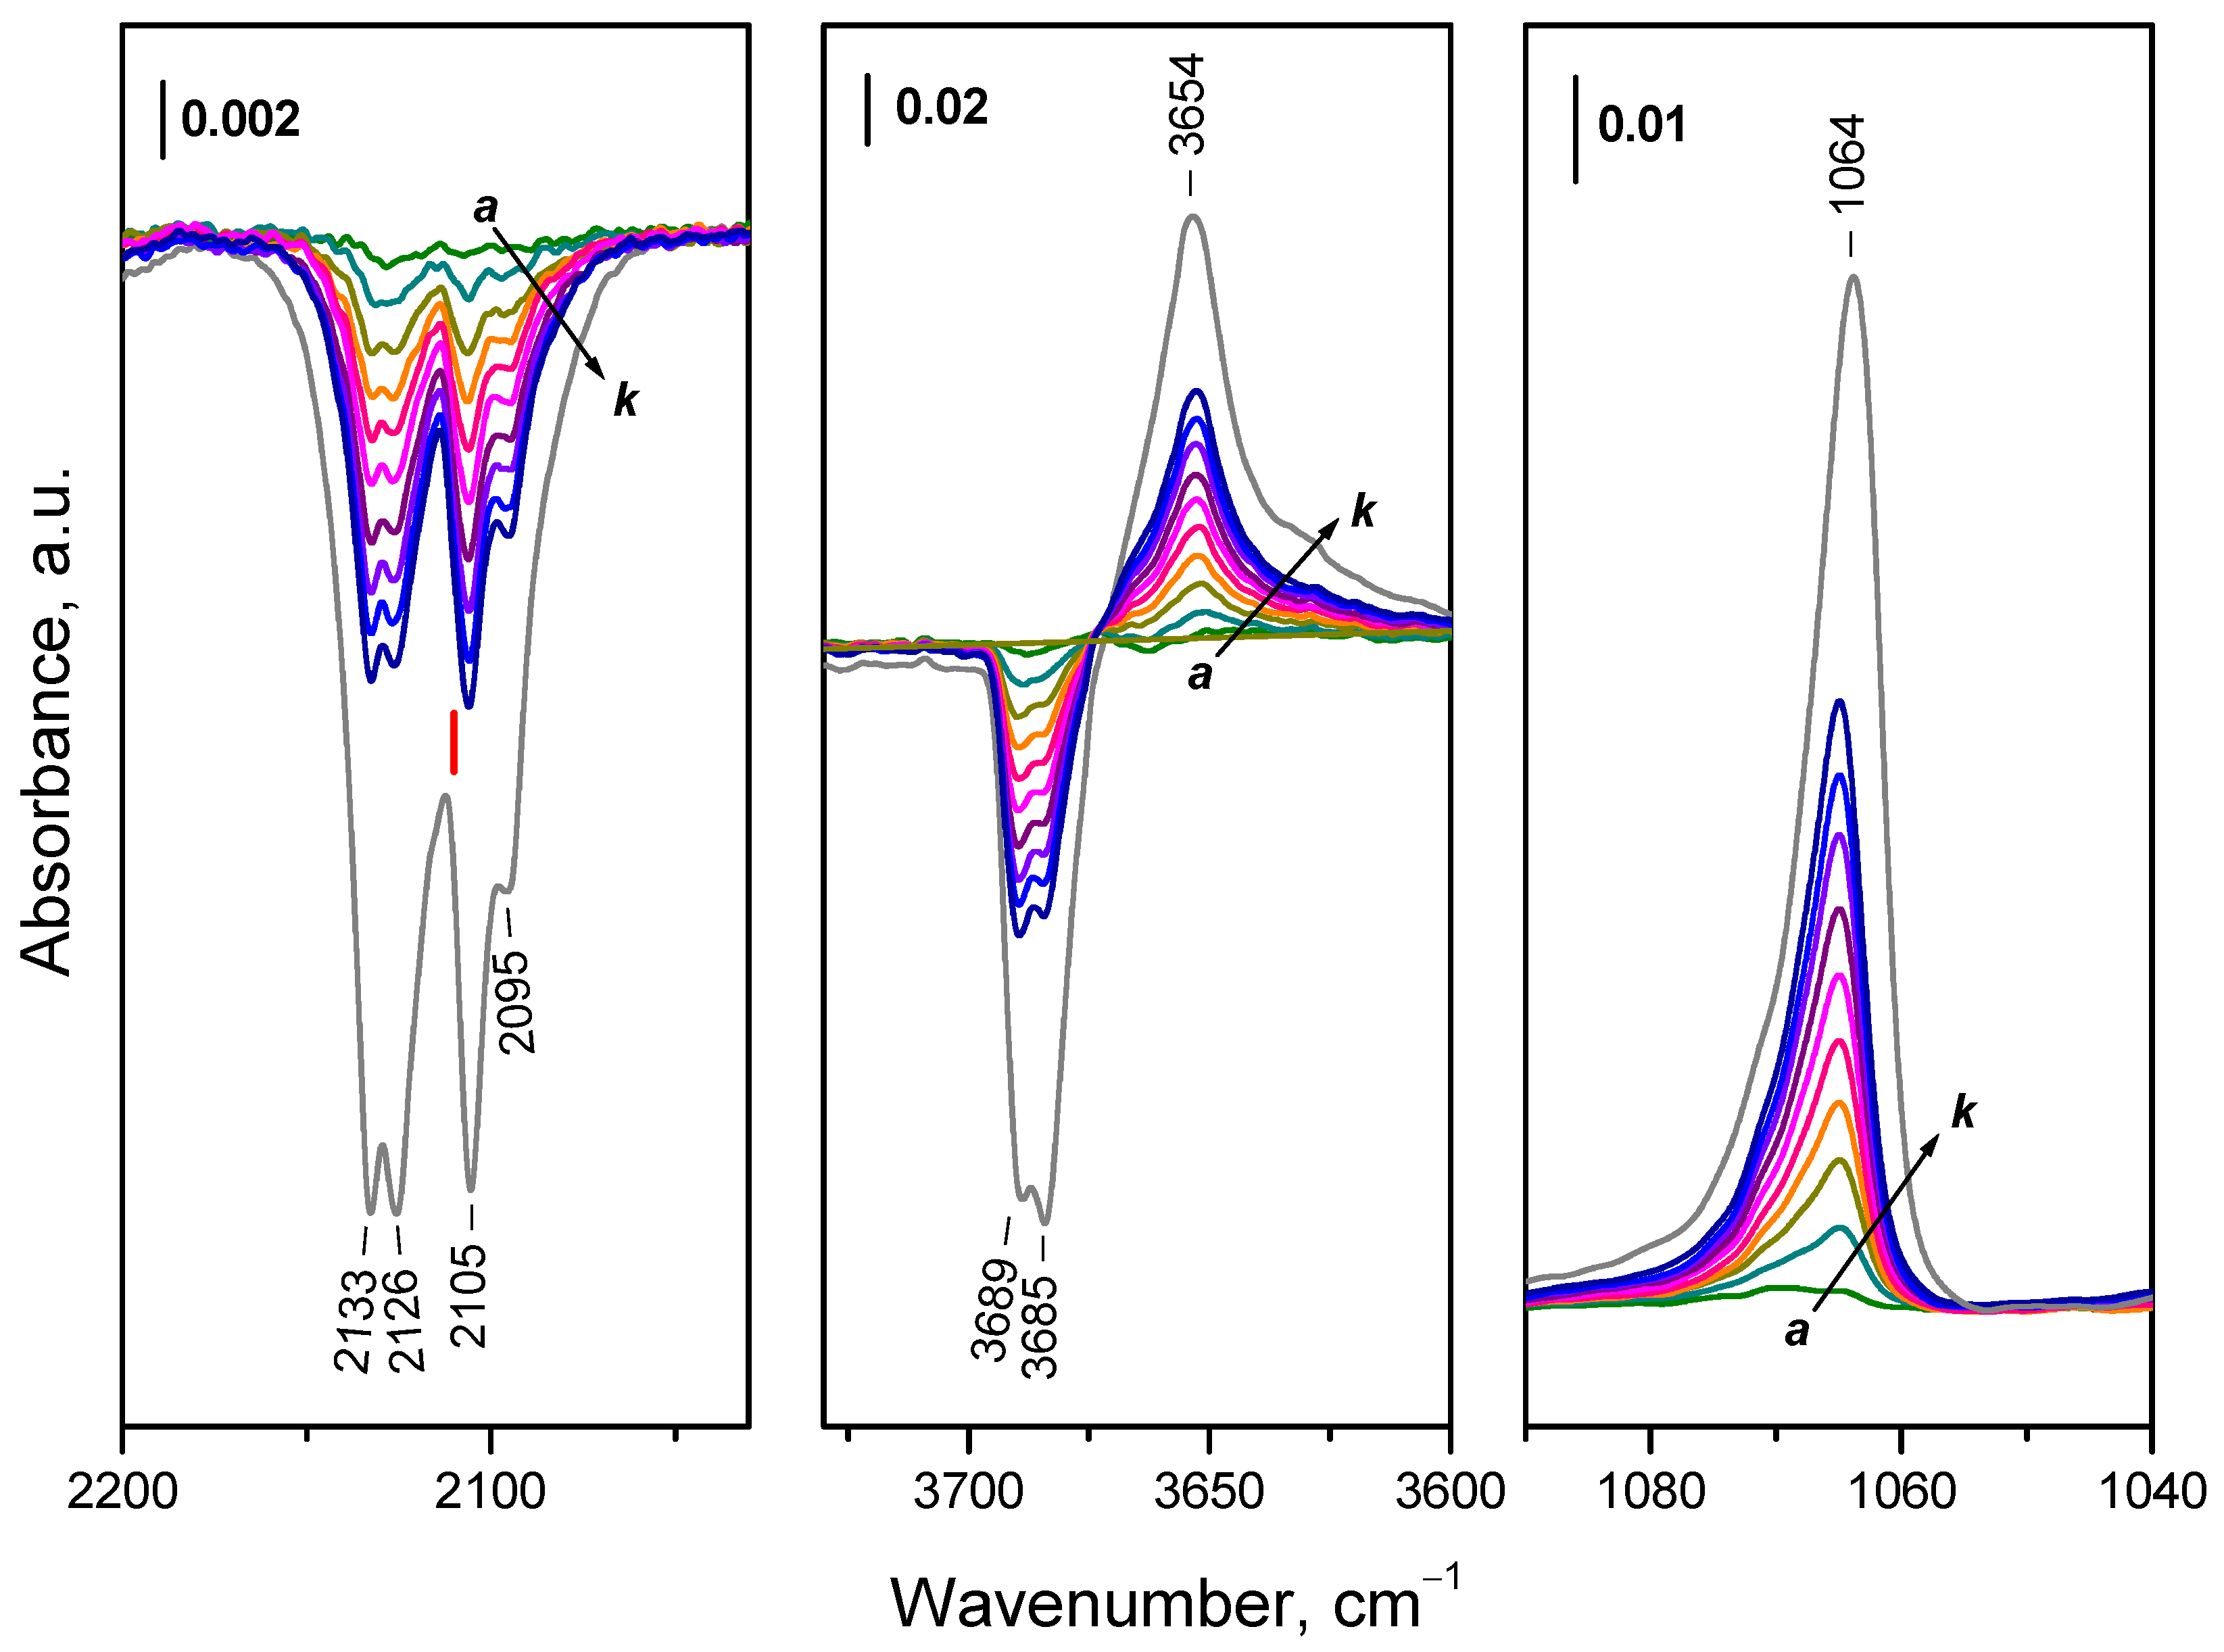
Difference spectra presented in Figure 7 show that with the increase of amount of 18O2 introduced into the IR cell, four components of the Ce3+ electronic band disappear simultaneously, at 2133, 2126, 2105 and 2095 cm-1. This could suggest that these four components characterize one and the same species. However, the probability the bands to be due to more different species cannot be ruled out.
The band at 1128 cm-1 observed after adsorption of 16O2 was not detected, but a band at 1064 cm-1 developed instead. The isotopic shift factor is 1.06, in excellent agreement with the expectation for the ν(O−O) modes. This confirms the assignment of the 1128 cm-1 band to O2 species and also shows that no (16O18O) species are produced during the experiments. As expected, the overtone of the 16O2 band was also missing. According to the isotopic shift factor, it should be observed at 2110 cm-1 but is superimposed with the Ce3+ band. Therefore, one should consider that a small contribution of overtone as a positive band exist in the spectra presented in the left panel of Figure 7 (position marked with red segment).
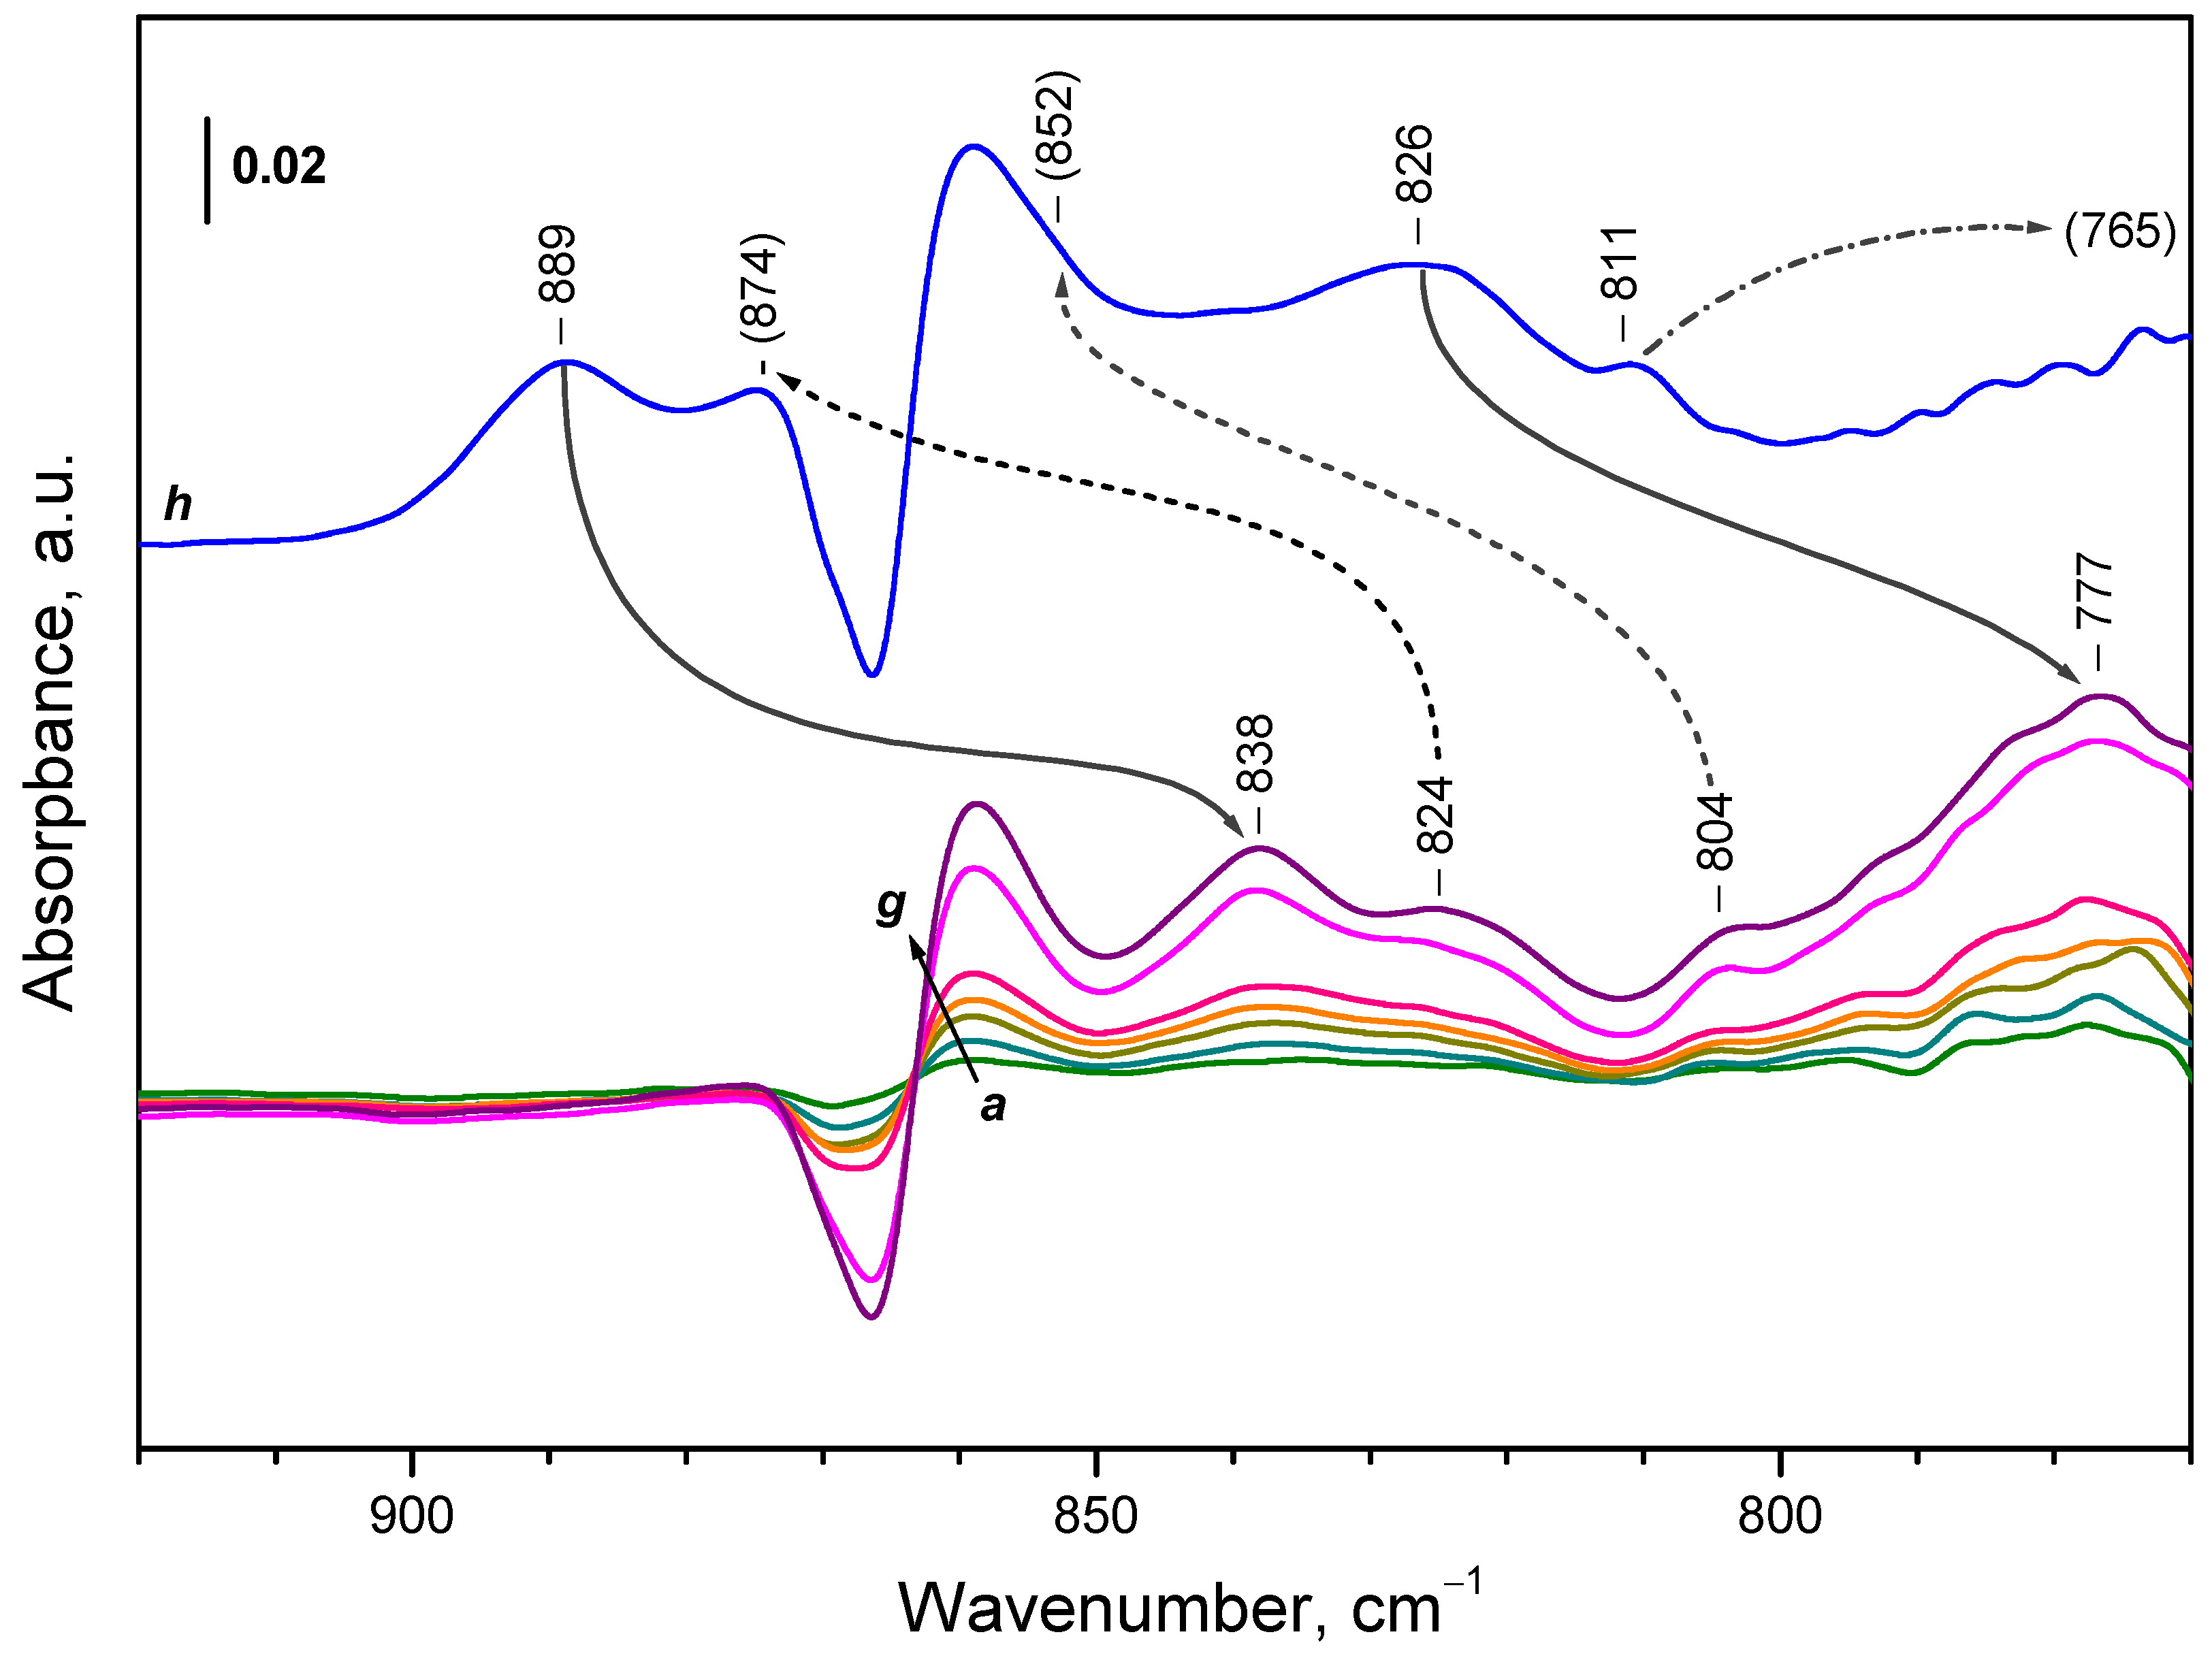
Consider now the region where peroxide species are expected to absorb. Analysis is complicated because of the shift of the background band at ca. 865 cm-1 during sample oxidation and the sample cut-off around 870 cm-1. However, comparison of the spectra of adsorbed 16O2 and 18O2 (Figure 8) allows making definite conclusions. For convenience, the results are summarized in Table 2.
First, the two most intense bands at 889 and 826 cm-1, produced after 16O2 adsorption, are shifted to 838 and 777 cm-1, respectively, when 18O2 was utilized (isotopic shift factor 1.06). Two more bands, at 874 and 852 cm-1 are not well discernible in the spectra of adsorbed 16O2, but are well detected after adsorption of 18O2 at 824 and 804 cm-1, respectively. Another band at 811 cm-1 was observed only after adsorption of 16O2 and the position of the respective 18O2 band was below the sample cut-off. All these bands are assigned to different peroxide species and all of them develop almost in concert.
Analysis of the hydroxyl region (Figure 7) shows that the OH bands associated with reduced surface (3689 and 3685 cm-1 at 100 K) are eroded in parallel with the components of the Ce3+ band and a new band at 3654 cm-1 (typical of oxidized surface) develops at their expense. The superoxide band at 1065 cm-1 and the peroxide bands also grow almost in parallel with these changes. The same is valid for the shift of the carbonate bands (Figure S5). The results show that the fast ceria oxidation at 100 K include oxidation of all Ce3+ sites bound to OH groups and carbonate anions. Note, however, that this does not exclude the possibility of a parallel oxidation processes including Ce3+ sites that are not bound to OH groups and/or carbonates.
Increase of temperature in the presence of 2 mbar 18O2 leads to the same changes described in the experiments with 16O2, although all oxygen bands were shifted. Here we shall only discuss the peroxide bands (Figure 9), because they were not discussed in the previous section.
The band at 889 cm-1 was hardly affected when the temperature was raised from 100 K to ambient one. Only a small decrease in intensity and red shift were noticed. However, the intensity of this band is substantially reduced after heating at 373 K (Figure 9, spectrum e). At this temperature the band at 826 cm-1 disappear. In contrast, the band at 810 cm-1 developed and this was more pronounced after heating at 373 K. In this case a shoulder at 817 cm-1 becomes also well visible. The intensities of the other peroxide bands were too low to follow them accurately.

2.4.3. Interaction of Hydroxylated CeO2-NC with 16O2

In order to obtain information how the hydroxylation degree affects the fine structure of the Ce3+ electronic band and the oxidation process as a whole, we studied oxygen adsorption on a reduced sample that was evacuated only at 573 K. Preliminary experiments have shown that after this pretreatment all of the molecularly adsorbed water is eliminated (lack of δ(H2O) band at ca. 1620 cm-1). Two principal hydroxyl bands appeared in the spectrum, at 3684 and 3659 cm-1 together with two weaker features at 3615 and 3533 cm-1. In addition, a broad band centered at ca. 3300 cm-1 evidences the existence of a fraction of H-bonded hydroxyls. At low temperature the bands shifted and the two main bands were detected at 3690 and 3663 cm-1. The carbonate bands appeared at 1475, 1464, 1440, 1407 and 1380 cm-1. Second derivatives indicated that the Ce3+ band consisted mainly of three components at 2127, 2109 and 2094 cm-1.
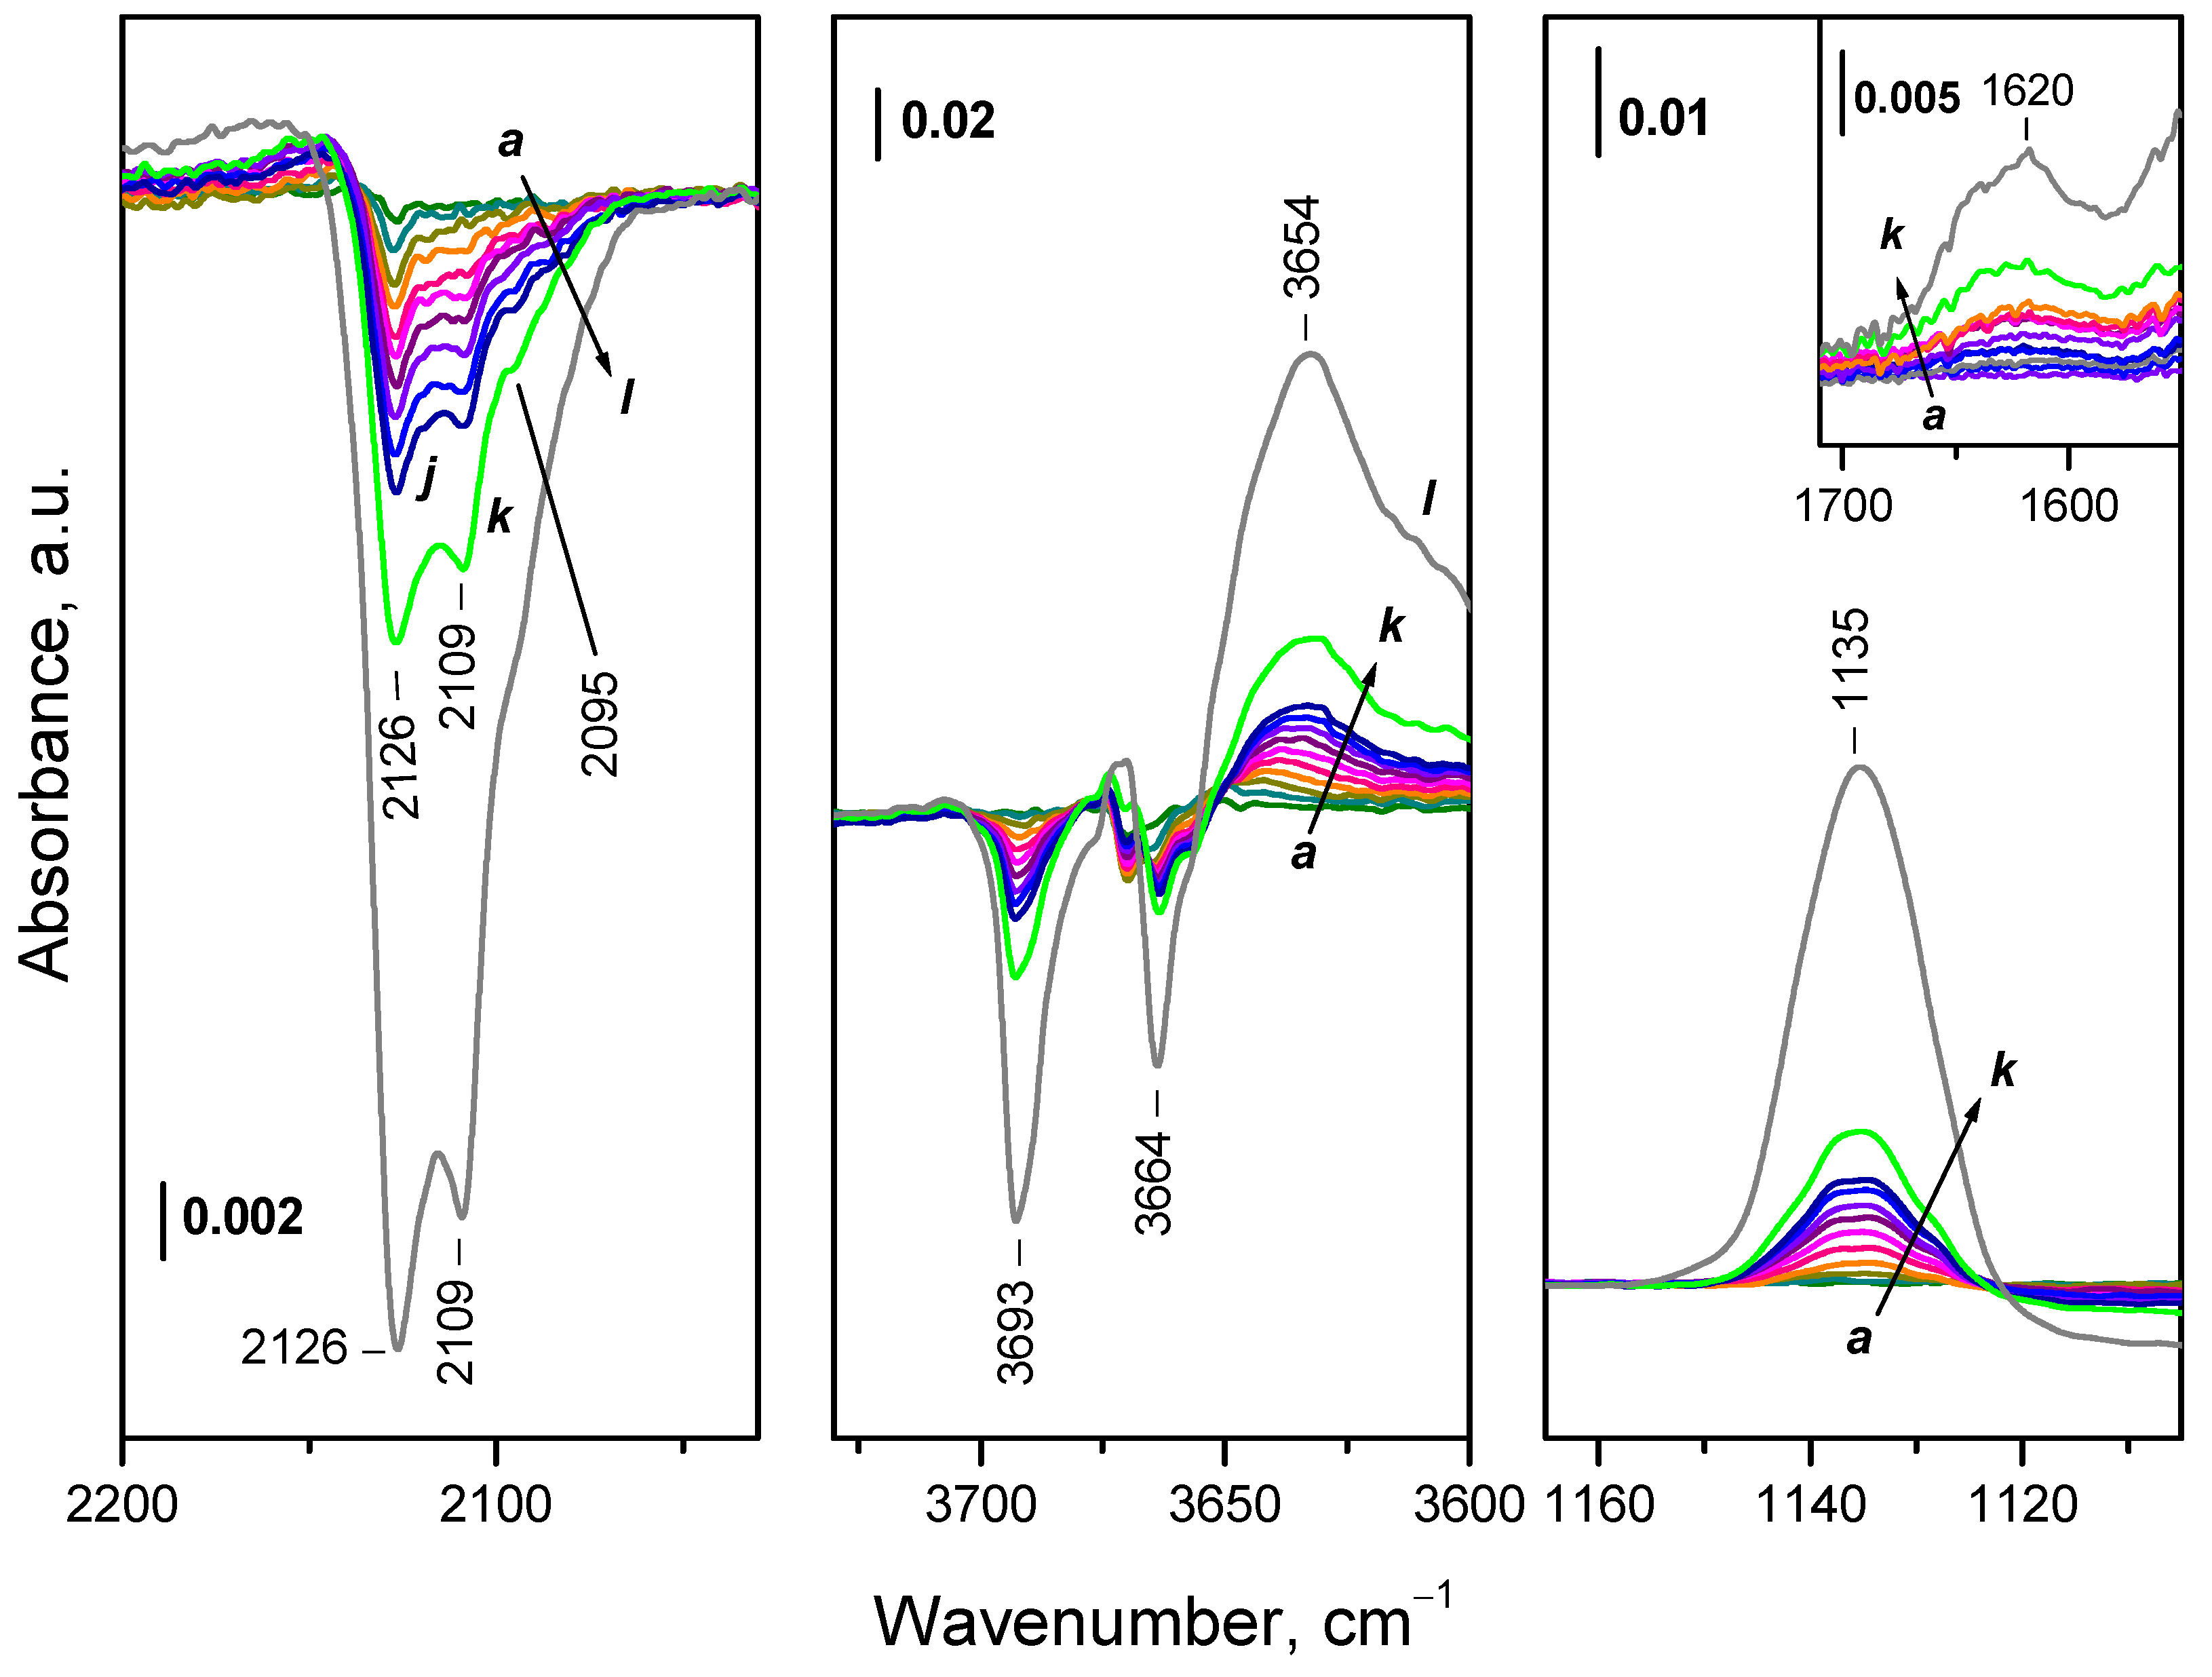
Dosage of 16O2 to the sample led to a gradual development of three negative bands at 2126, 2109 and 2095 cm-1 evidencing oxidation of Ce3+ sites (Figure 10). Simultaneously, a superoxide band at 1135 cm-1 raised in intensity. The OH band at 3693 cm-1 fully disappeared and the band at 3664 cm-1 strongly decreased in intensity. Simultaneously, a band at 3654 cm-1 developed together with a broad band at ca. 3200 cm-1. In parallel with this, a band at 1620 cm-1, assigned to δ(H2O) modes, grew up (see the right inset in Figure 10).
Comparison with the experiments performed with the 773 K evacuated sample allows to underline two important differences. First, the decrease in intensity of the Ce3+ band after dosage of the same amount of O2 was definitely lower. Note that this cannot be due to kinetic limitations because no changes were observed with time after adding of definite amount of doses, i.e. all of the introduced oxygen was consumed. Second, the integral areas of the negative Ce3+ electronic bands in the two sets of experiments were practically identical after introduction of 2 mbar of O2 to the system, which suggests that the same amount of Ce3+ sites have been fast oxidized in the two experiments. We also note that the band around 1553 cm-1, due to weakly bound molecular oxygen, was not discernible even in the presence of 2 mbar O2 in the gas phase.
The above findings can be rationalized assuming that part of the introduced oxygen is consumed for oxidation of Ce3+ sites and another part, for oxidation of hydrogen dissolved in ceria. This explains the slow development of the negative Ce3+ electronic band. When dissolved H2 is oxidized, water is produced and is detected by the δ(H2O) modes and the appearance of broad absorbance in the ν(OH) region due to H-bonded water. Note that existence of dissolved hydrogen in reduced ceria is already reported [16,49]. Thus, the results demonstrate that hydrogen dissolved in ceria can be oxidized even at 100 K in the absence of noble metals.
During temperature increase up to ambient one the band of the superoxide (1135 cm-1) initially slightly develops but disappears before reaching room temperature. Similar is the behavior of the 889 cm-1 peroxide band, which appeared only at intermediate temperatures and was not practically formed at 100 K. In contrast, the low frequency peroxide bands at 843 and 830 cm-1 were much more intense on this hydroxylated sample as compared to the sample evacuated at 773 K. Importantly, water was continuously produced up to ambient temperature. Based on the intensity of the δ(H2O) band, it was roughly estimated that the amount of water formed at 100 K is ca. 15 % of all water produced when the temperature reached ambient one.

2.4.4. Interaction of CeO2-NC Reduced at Lower Temperatures with 16O2

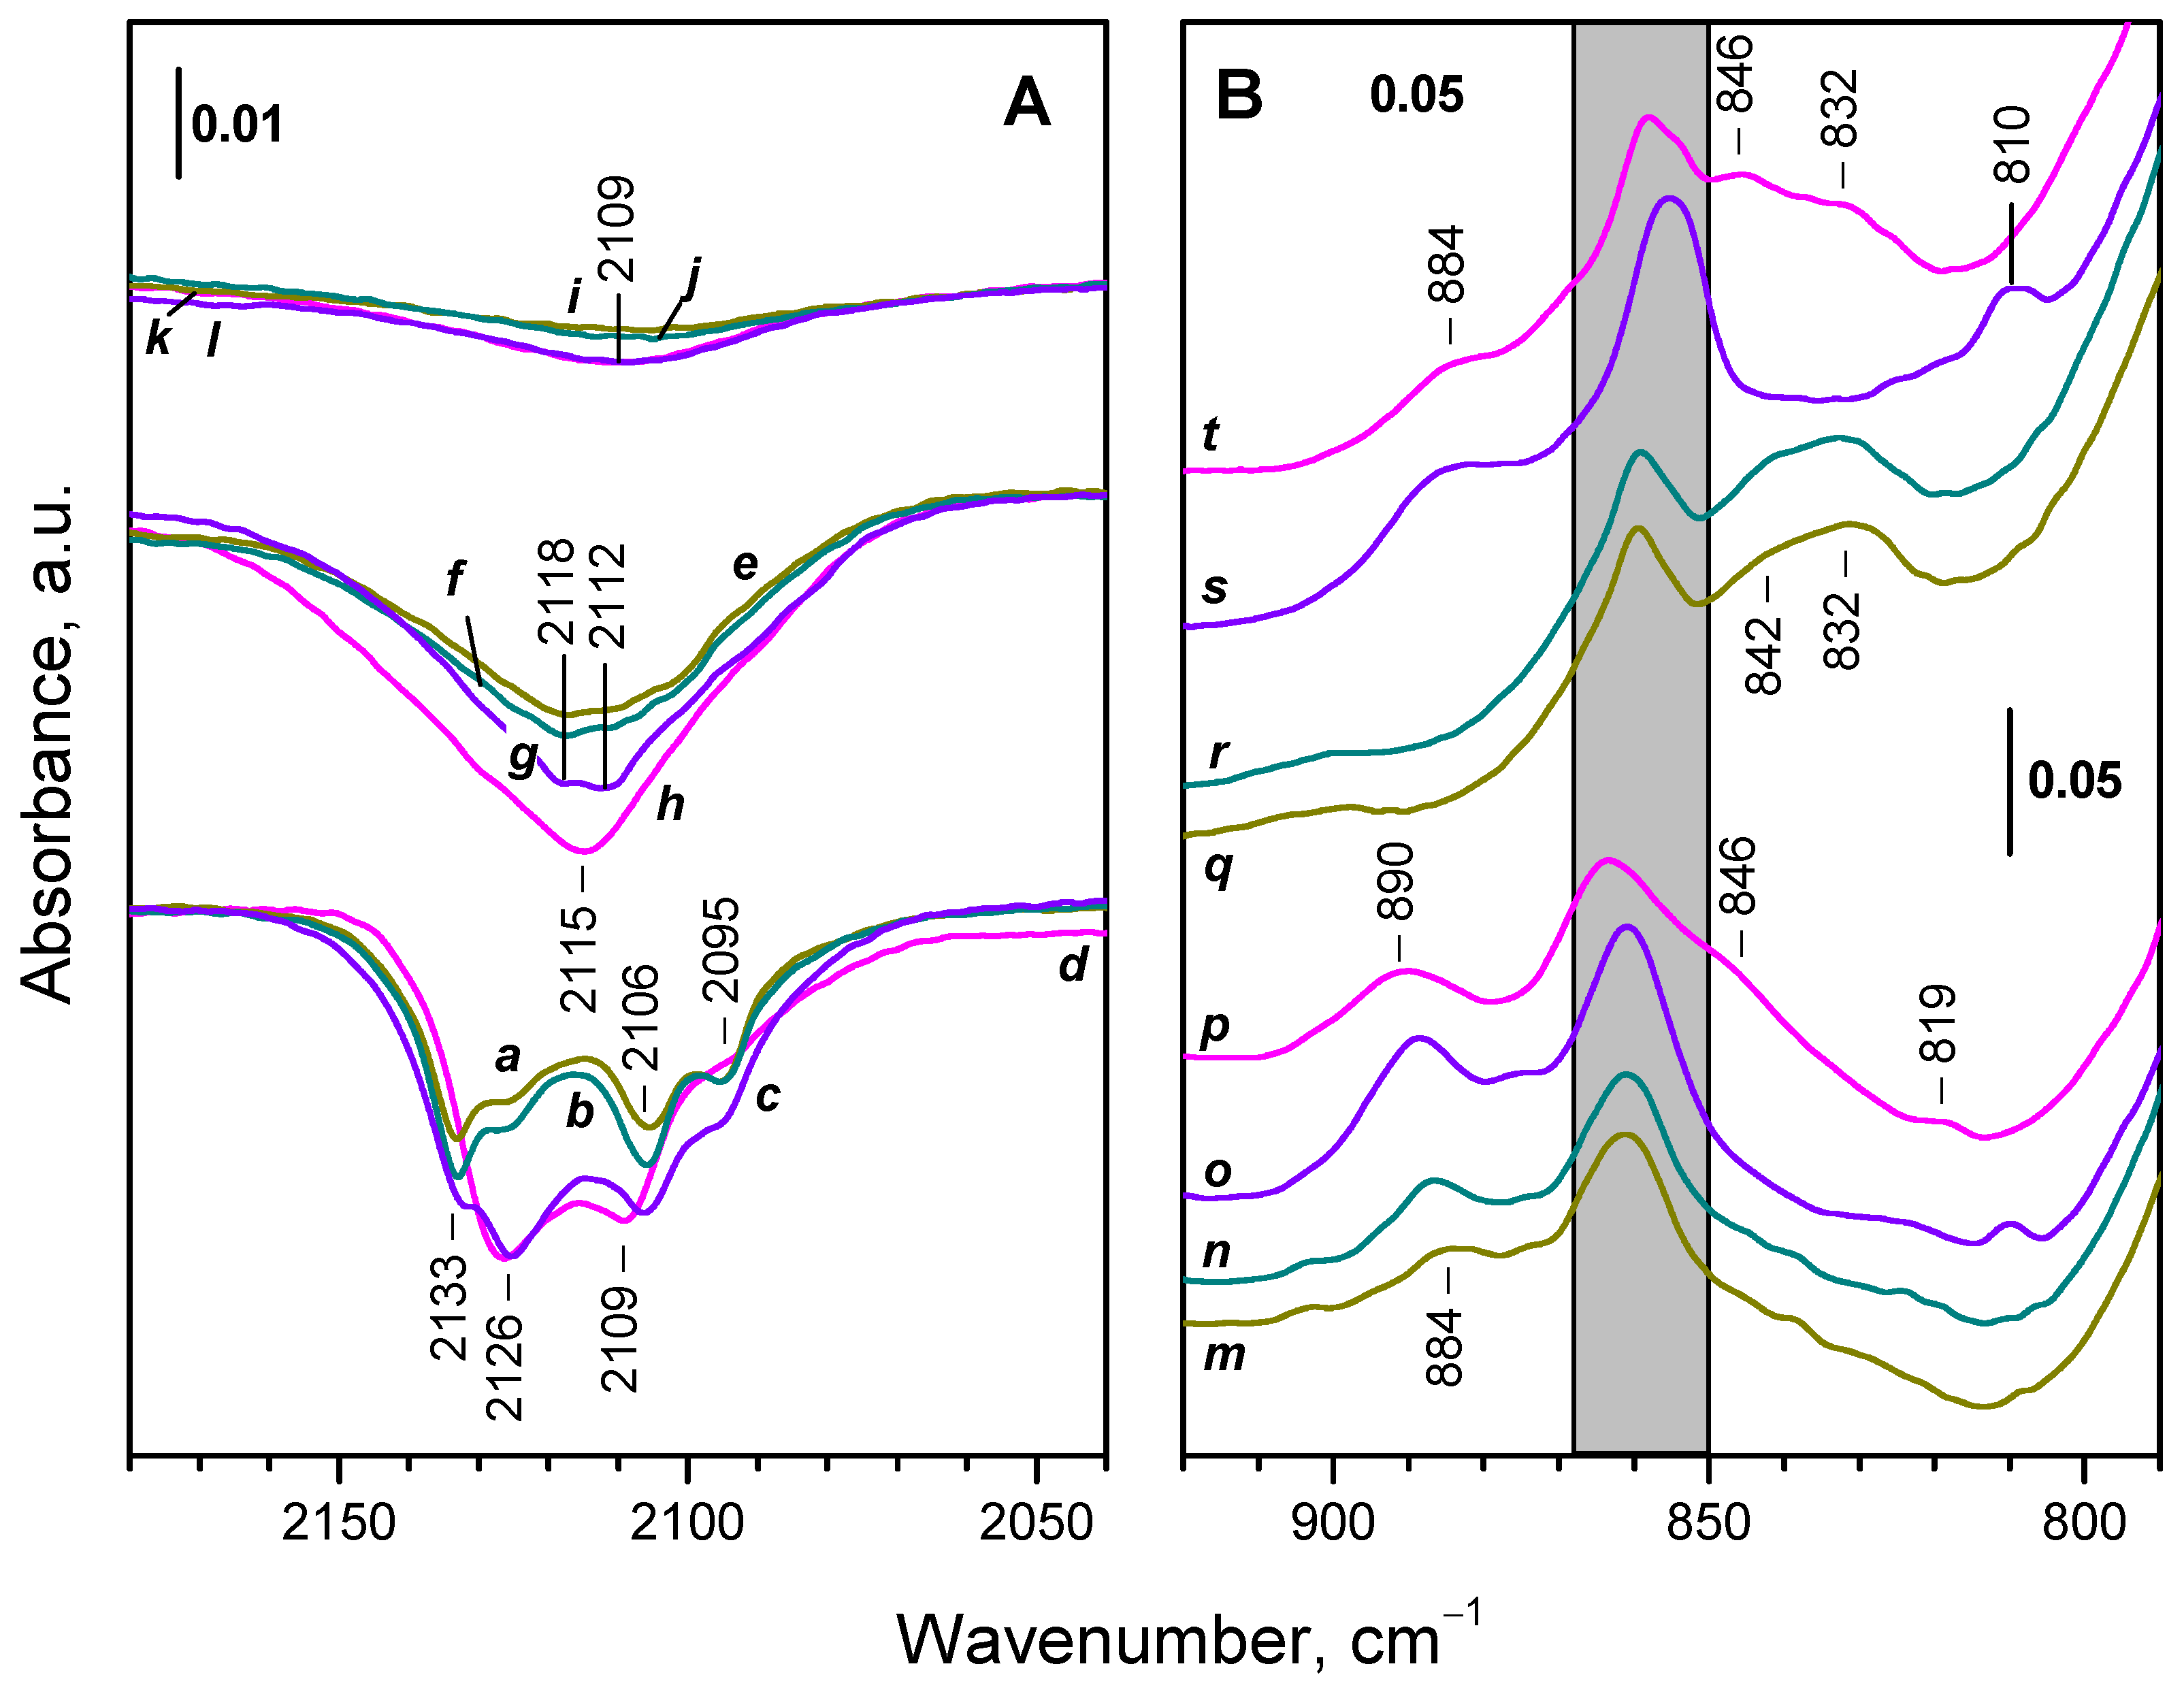
Finally, we studied the interaction of O2 with CeO2-NC reduced at 623 and 673 K and then evacuated at 773 K. Figure 11 compares the spectra in the Ce3+ and peroxide regions of these samples with the spectra of sample reduced at 773 K and evacuated at different temperatures.
It is seen that the reduction degree of the two samples is comparable but lower compared to the sample reduced at 773 K.
When O2 interacted with the samples at 100 K, the main difference between the samples reduced at 623-673 K as compared to that reduced at 773 K is the low intensity of the negative component at 2125 cm-1 (compare spectra (a) and (b) with spectrum (c) in Figure 11A) Therefore, the respective Ce3+ sites are produced at higher reduction temperatures.
The spectra of the samples in the peroxide region exhibited only a weak band at 884-885 cm-1 which was more intense with the sample reduced at higher temperature (Figure 11B, spectra m, n). Only negligible features were discernible in the 850-800 cm-1 region. The superoxide band was slightly less intense compared to the 773 K reduced sample. A full conversion of OH groups and carbonate bands to the oxidized state was established.
When the temperature of the samples was gradually increased to 293 K, the main part of the residual Ce3+ sites were oxidized. Two component, at 2118 and 2112 cm-1 are well discernible in the negative Ce3+ electronic band (Figure 11A, spectra e, f). The same components are seen with the sample reduced at 773 K (Figure 11A, spectrum g).
The superoxide band was no more detected at 293 K. However, intense bands due to adsorbed water appeared at 1620 cm-1 together with a broad absorbance centered around 3400 cm-1 (spectra not shown). The peroxide band at 884-885 cm-1 also disappeared and bands at 842 and 832 cm-1 grew instead (Figure 11B, spectra q, r).
In this case again, a small fraction of Ce3+ resisting oxidation even at 293 K was detected (Figure 11A, spectra i, j).

2.5. Interaction of Reduced CeO2-NP with O2 at Variable Temperature

2.5.1. Interaction with 16O2

As with CeO2-NC, introduction of O2 (2 mbar) to the reduced CeO2-NP sample led to immediate decrease in intensity of the Ce3+ electronic band (Figure 12, spectrum b). Difference spectra show that this happens mainly at the expense of a component at 2131 cm-1, although some components at lower frequencies also disappeared. Based on the band intensities, it was estimated that ca. 23 % of the Ce3+ sites have been oxidized at the conditions applied. This fraction is about two times lower as compared to the CeO2-NC sample. No noticeable changes occurred in the next 10 minutes, i.e. further oxidation at 100 K was restricted.
Simultaneously with the erosion of the Ce3+ electronic band, bands due to adsorbed superoxide and peroxide species emerged. The ν(O−O) band of the O2 species was detected at 1128 cm–1 and second derivatives clearly revealed two more components at 1131 and 1137 cm–1. The peroxide species were homogeneous and characterized by a ν(O−O) band at 889 cm–1. In addition, the carbonate band at 859 cm–1 gained intensity and the band at 865 cm–1 (indicative of carbonates on reduced surface) disappeared. A slight development of the background band at ca. 1070 cm–1 was also noticed.
Increase of the temperature up to ambient one led to a strong reduction and almost full disappearance of the Ce3+ band (Figure 12, spectra c, d), i.e. additional oxidation occurred at temperatures higher than 100 K. The band at 1128 cm–1 initially slightly developed with temperature increase at the expense of the component at 1137 cm–1 (spectra not shown) then the higher-frequency components disappeared and the 1227 cm–1 band strongly decreased in intensity. The peroxide band slightly developed and shifted to 884 cm–1 when the temperature increased.
Heating in oxygen at 323 and 373 K resulted in almost complete and then ultimate disappearance of the Ce3+ band (Figure 12, spectra e, f) and the band characterizing adsorbed O2 species (1127 cm–1). In contrast, the peroxide species (884 cm–1) were stable at 323 K but their band was significantly eroded at 373 K.

2.5.2. Interaction with 18O2

The changes in the spectra of the reduced CeO2-NP sample after adsorption of 18O2 are identical to those already described for 16O2 adsorption, except the red shift of several bands (Figure 12). This demonstrates the good reproducibility of the experiments.
First we note the shift of the weak band at 2238 cm–1 in the region of the Ce3+ electronic transition. Indeed, a band at 2113 cm–1 is discernible in spectrum (i) from Figure 12.
The 18O2 principal band was detected at 1065 cm–1, again in line with the theoretical expectations (Figure 12, spectrum h). The same is valid for the peroxide band detected at 840-834 cm–1 (Figure 12, spectra h and j, respectively).
If the weak component around 1070 cm–1 was due to adsorbed dioxygen, a band around 1010 cm–1 should have appeared after adsorption of 18O2. However, no such a band was detected which indicates that the development of the component around 1070 cm–1 is due to background affection.
Let us discuss the doublet at 865 and 859 cm–1 registered in the background spectrum of the reduced sample (Figure 12, spectrum a). Binet et al. [51], on the basis of 13C-labelling, have concluded that the band is due to residual carbonates and, as the other carbonate bands, is sensitive to reduction. However, in a recent study a new assignment to Ce=O modes was proposed [50]. Our results do not support the latter supposition because the bands were not sensitive to exchange with 18O. Moreover, the relative intensities of the two bands, at 865 and 859 cm–1 could be used as an indicator for the fraction of residual carbonates attached to Ce3+ sites on reduced samples.

2.6. Interaction of the Samples with Oxygen at Ambient Temperature

The studies at ambient temperature allowed us to eliminate the temperature changes of the spectra, which are especially important for the Ce3+ electronic transition and the OH bands. However, the hydroxyl spectra of the CeO2-NP sample were too noisy to allow a precise analysis.

2.6.1. CeO2-NC

Small doses of O2 were successively added to the reduced CeO2-NC sample and after each dose a spectrum was recorded. Dosage of oxygen leads to erosion of the 2110 cm–1 band, preferentially from its higher-frequency side (Figure S6, left inset). However, even in the presence of gas-phase oxygen in the cell the band did not totally disappeared, i.e. some Ce3+ cations (ca. 10 %) resisted fast oxidation even at ambient temperature.
Addition of oxygen provoked also development of a O2 band at 1126 cm-1 with two satellites at 1112 and 1139 cm–1 (see the inset in Figure S6). The satellites are attributed to additive and subtractive combination modes of this band. The overtone is also detected at 2236 cm-1 (Figure S6, main panel). A careful inspection of the spectra reveals also that a very weak peroxide band at 810 cm-1 developed during oxygen dosage.
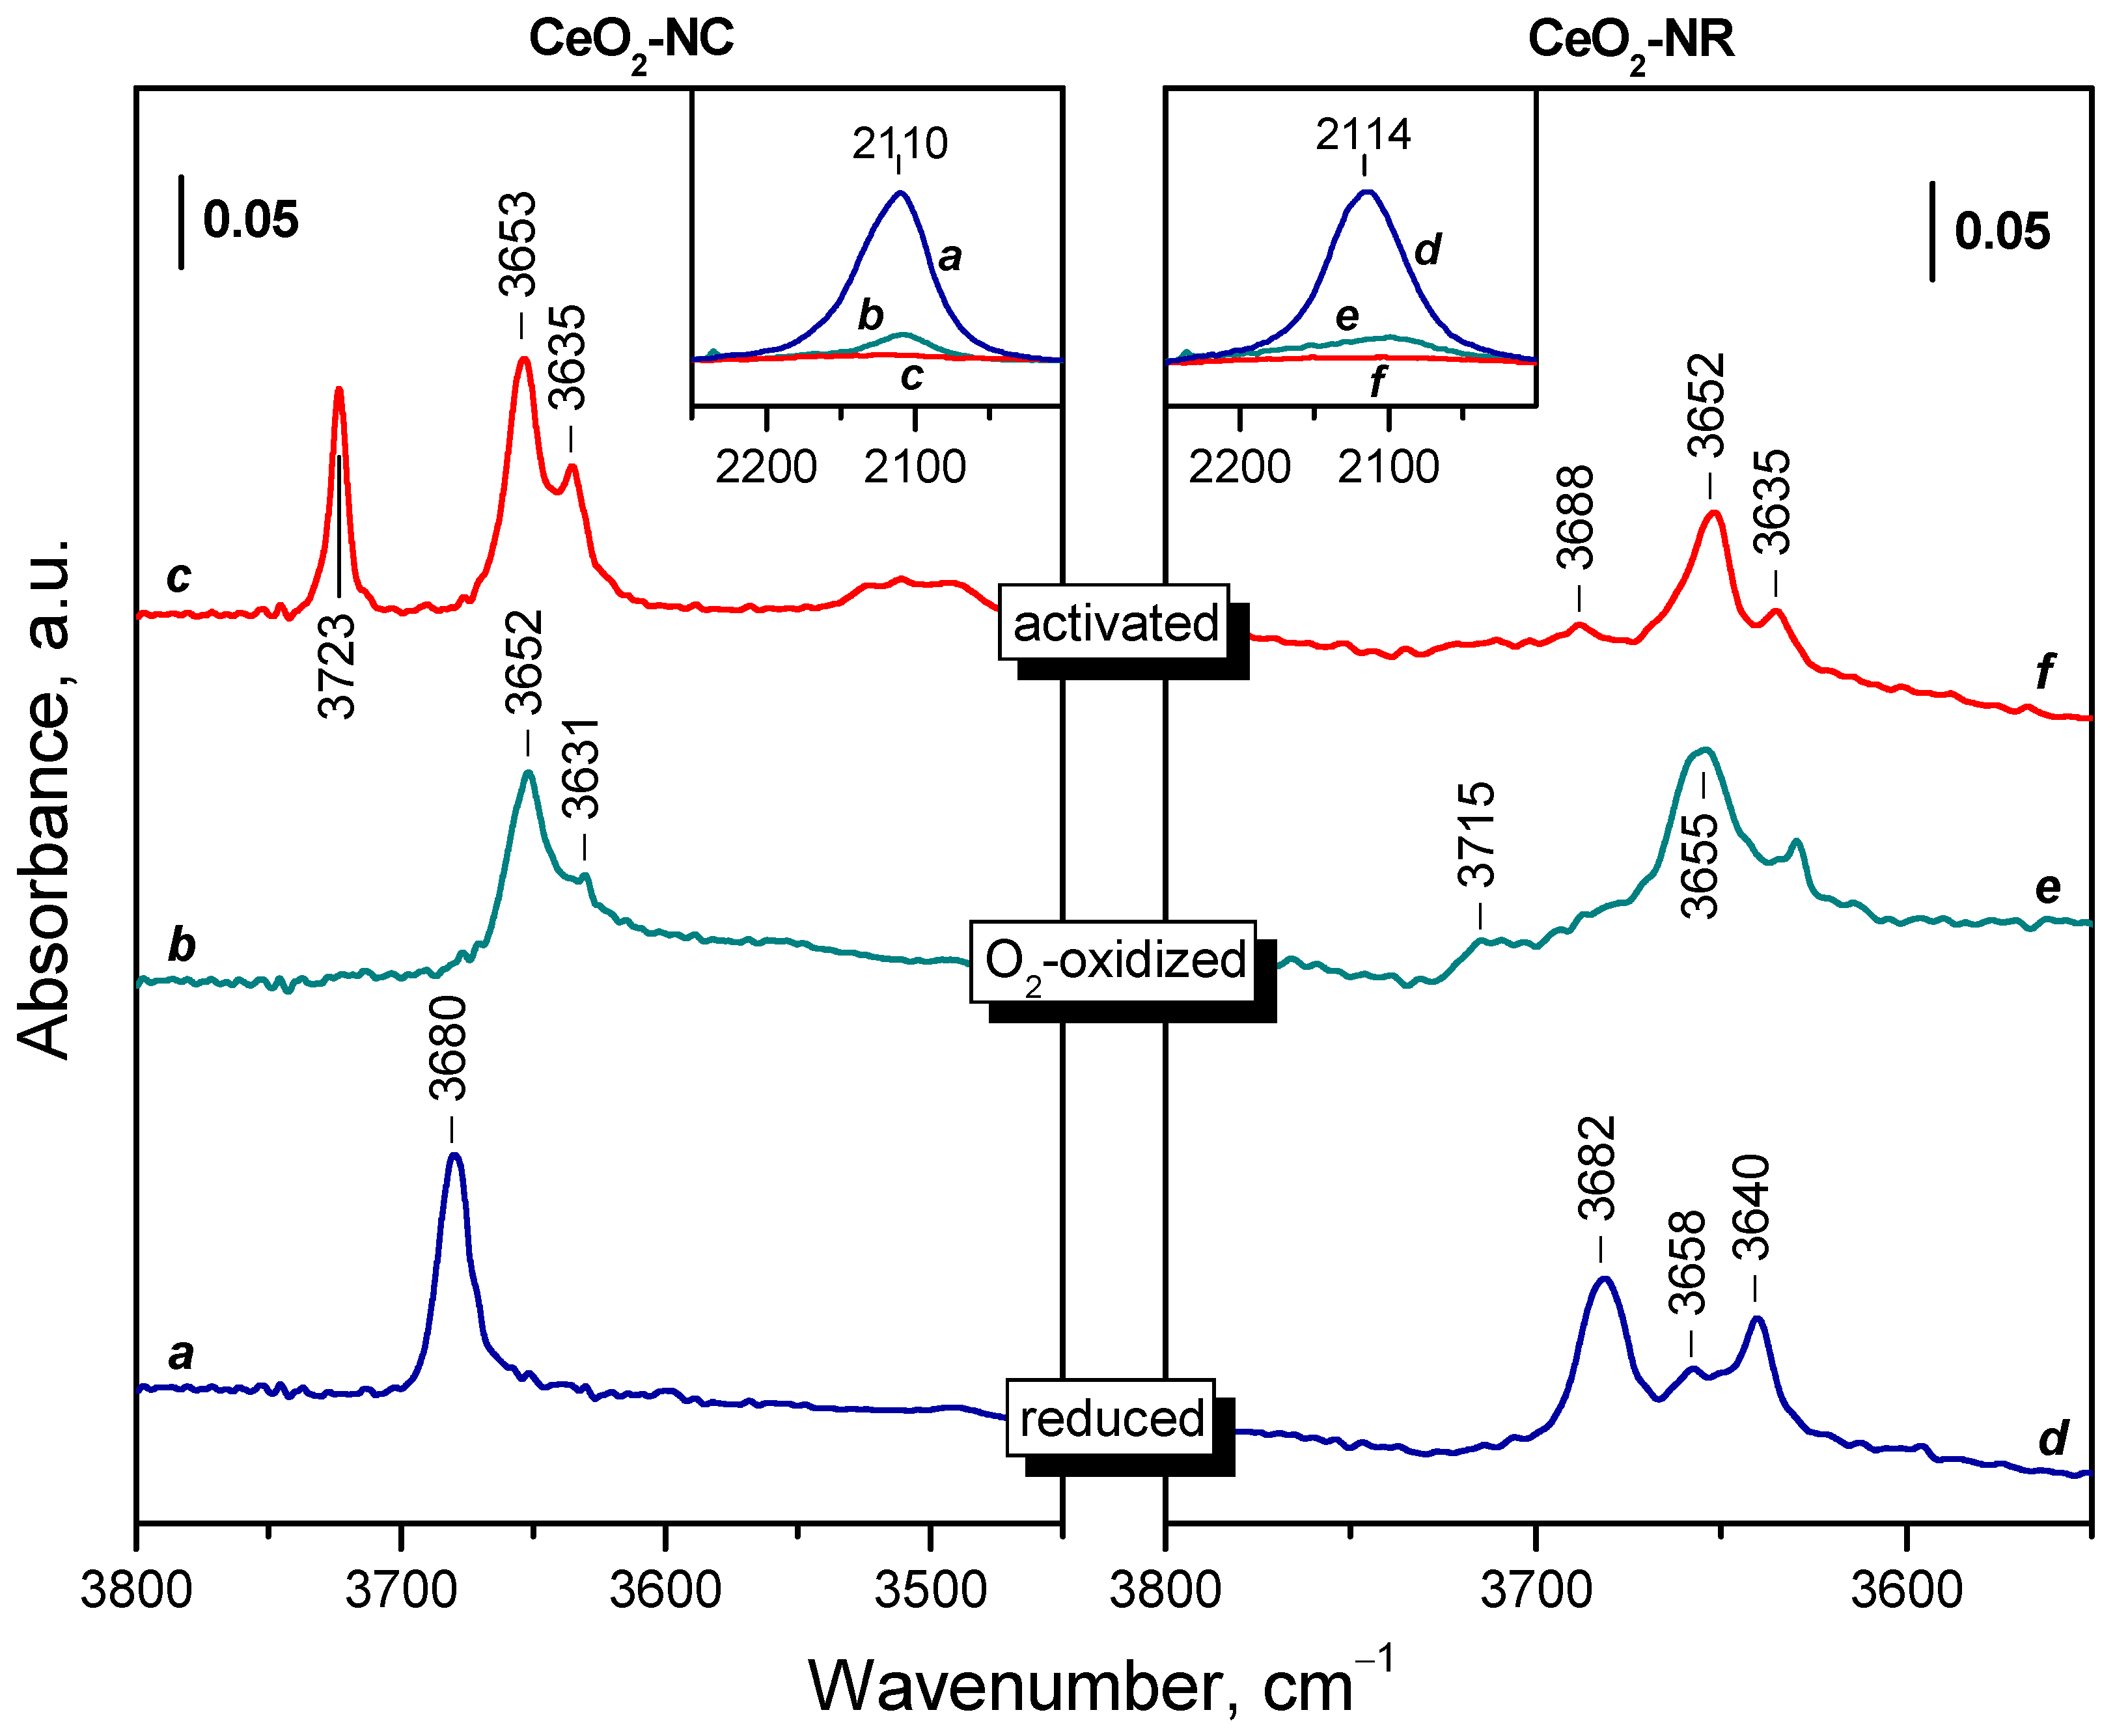
In the OH region the band at 3680 cm–1 is also gradually eroded and practically disappeared in the presence of O2 in the gas phase (Figure 13, spectrum b). Bands at 3652 and 3631 cm-1, typical of freshly activated sample, emerged at its expense (Figure 13, spectrum c). Therefore, we can propose that the O2 species are located at the same sites where the terminal OH groups were originally situated.
Oxygen dosage leads to a gradual shift of the carbonate bands to their original positions with oxidized sample and this conversion was full in the presence of gaseous O2.

2.6.2. CeO2-NR

The changes in the spectra registered after dosing oxygen to the reduced CeO2-NR sample (See Figure S7) are similar to those already described for CeO2-NC. Therefore, here we will highlight only the main peculiarities.
Here again, a small fraction of Ce3+ sites (ca. 13.5 %) remained after interaction of the sample with oxygen at ambient temperature. In the hydroxyl region, oxygen dosage led to gradual conversion to a spectrum typical of oxidized sample. In this case, however, a small band due to terminal OH species appeared at 3715 cm-1 (Figure 13, spectrum e). We note that similar band was detected on the oxidized sample at lower evacuation temperatures. The peroxide species were with negligible concentration. Similar results were obtained with the CeO2-NP sample.

3. Discussion

3.1. Species Formed During Adsorption of O2 on Oxidized and Reduced Ceria

On oxidized ceria, even after evacuation of the samples at 773 K, we have observed only molecularly adsorbed O2 by a weak band at 1555-1553 cm-1. Although some authors report that no reactive O2 adsorption occurs on oxidized ceria [43,62], others have observed superoxides with non-reduced samples evacuated at 673 K [59]. In our experiments with oxidized samples we have treated them in O2 immediately before evacuation at the target temperature (573-773 K). Note that ceria is very easy reduced and even minor amount of organic contaminants originally present in the sample or introduced during the experiments could lead to production of small amount of Ce3+ during thermal treatment.
As a homonuclear diatomic molecule O2 has no IR active mode. However, after adsorption, the symmetry is reduced and the O–O stretching modes, although with low intensity, become IR observable. The same phenomenon has been observed for similar molecules, as N2 and H2 [85].
The possible active site for this adsorption form of oxygen on ceria are coordinatively unsaturated (cus) Ce4+ cations and hydroxyl groups. The results presented in Figure S4, (spectra a-c) clearly show that the ν(O–O) band increases in intensity with sample dehydroxylation which indicates the principal active sites are Ce4+ cations. Indeed, Ce4+ hydroxyls are of weak acidity and their complexes with O2 are expected to be very weak. The conclusion that OH groups are not active sites for adsorption of molecular O2 are consistent with the lack of molecularly adsorbed O2 on the hydrated sample (reduced, evacuated at 573 K and then reoxidized at 100 K).
The ν(O–O) band appeared at 1553 cm-1 with the sample which was reduced and evacuated at 773 K and then fast oxidized at 100 K (Figure S4, spectrum d). The intensity was halved compared to the oxidized sample evacuated at the same temperature. This suggests that the fast oxidation creates some cus Ce4+ sites acting as adsorption centers. However, it is also possible that some Ce4+ sites are blocked by other adsorbed species (see below).
On reduced ceria we have detected two more types of adsorbed oxygen: superoxide and peroxide species and the 18O2 isotopic experiments confirmed this assignment. This is in general agreement with literature data [39,41,43,59,60,61,62].
Superoxide ion is a monovalent radical produced as a result of one-electron reduction of dioxygen and thus has an O−O bond order of ca. 1.5. Consequently the ν(O–O) stretching frequency is lower as compared to O2. This is consistent with the observation of the superoxide band around 1130 cm-1. Simple stoichiometric considerations show that two O2 radicals are necessary to formally substitute one O2− anion.
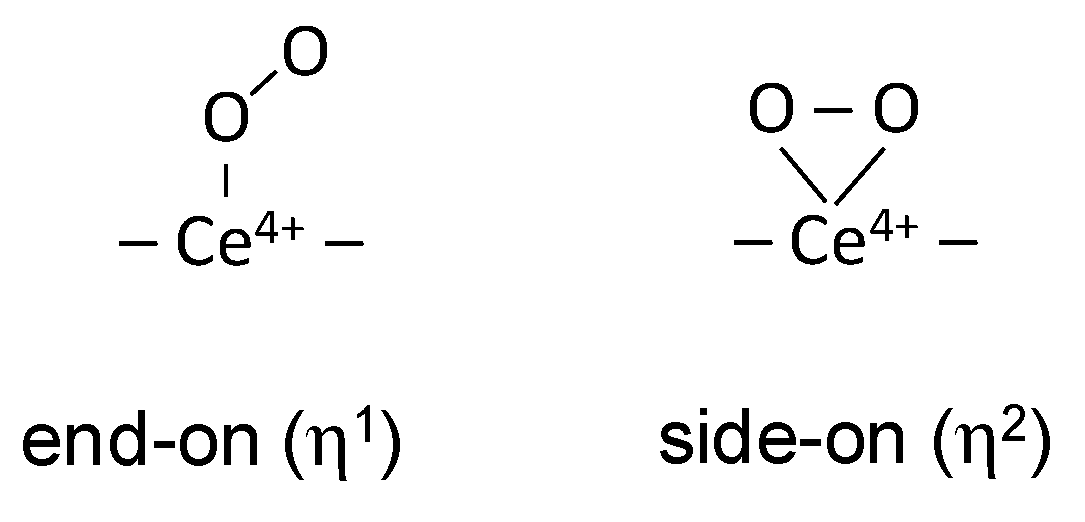
There are two possible configurations of the adsorbed superoxo species: end-on (η1) or side-on (η2) [86], as shown in Scheme 1:
If the end-on configuration is realized, the Ce4+(16O18O)- species should manifest two bands, depending on the position of the labelled atom. In our experiments we have not detected Ce4+(16O18O)- isotopologues. However, Li et al., in experiments with coadsorption of a 16O2-18O2 mixture succeeded to detect such species and reported they were characterized by one band only, at 1095 cm-1. This strongly indicates a side-on configuration of the superoxo species on ceria.
Consider now the peroxo species. In peroxides the oxygen atoms are linked by a single covalent bond and consequently the ν(O–O) modes are observed at lower frequencies as compared to superoxo species. In contrast to superoxide and similarly to O2−, it is a divalent anion. This makes peroxide anion suitable to fill oxygen vacancies on ceria.
Pushkarev et al. [62] have reported that peroxides are not formed when ceria is reduced at 573 K, but appeared on 673 K reduced samples. Similar conclusions were made by Li et al. [60,61], who have not observed peroxides on ceria reduced by treatment in vacuo at 1000 K, but detected them on a hydrogen-reduced sample. This is in agreement with DFT studies [87] indicating that O2 interaction with oxygen vacancies on ceria produces peroxides. Thus, it appears that peroxides should acquire bridging configuration.
Raman studies report two kinds of peroxo species on ceria, characterized by bands at ca. 860 and 830 cm-1 [41,43,62]. A band at 883 cm-1 have been reported in IR studies [60,61].
Interesting results have been reported by Bashir and Idriss [88]. They adsorbed H2O2 on ceria and detected IR bands at 890, 850 and 835 cm-1. The former band was attributed to side-on peroxide and the other two bands, to bridging species. The band at 890 cm-1 almost disappeared after 363 K evacuation while the other two bands were still observable after 433 K evacuation. The similarity of these bands to the bands appearing after O2 adsorption on reduced ceria confirms their assignment to peroxides.
Surprisingly, formation of Ce4+-OOH species has not been reported. In fact, this possibility has been considered, but rejected on the basis of the expectation that OOH- species should absorb at considerably higher wavenumbers [88]. However, analysis of summarized literature data [86] indicates that OOH species absorb at relatively low frequencies. Thus, it has been reported that Ti-OOH species produced by H2O2 adsorption on Ti silicalite sieve are characterized by a ν(O−O) band at 837 cm-1 and a broad ν(O−O) band around 3400 cm-1 [89]. Indeed, H2O2 is weak acid and the protons from the OOH- groups should tend to form H-bonds. This makes the OH mode difficulty discernible from H-bonded hydroxyls. We note that the OOH moiety is univalent and, as will be shown below, formation of Ce−OOH species will answer some open and unresolved question in ceria surface chemistry.
To form OOH species, a source of hydrogen is necessary. One possible source are the residual OH groups. However, it seems that dissolved hydrogen is a more important source. A look at Figure 11B shows that peroxide species absorbing in the 850-820 cm-1 spectral region are readily formed with samples having a high amount of dissolved hydrogen. Therefore, we propose that these species are hydroperoxides. By analogy, we may propose that the same accounts for the band at 810 cm-1. In contrast, the band at 890 cm-1 is typical of the hydrogen-free sample, which suggests that it is due to H-free O22− species.

3.2. Ce3+ Sites Involved in Fast Oxidation

Based on our results, we can divide the Ce3+ sites on reduced ceria according to their reactivity into three groups:
  • Ce3+ cations that are fast oxidized at 100 K;
  • Ce3+ cations fast oxidized between 100 and 293 K, and
  • Ce3+ cations resisting oxidation at 293 K but oxidized at slightly higher temperature, up to 393 K.
The fraction of the sites in the third group is relatively small, about 10-15 % depending on the pretreatment conditions. Probably this is a problem of accessibility, because their Ce3+ electronic transition band is broad, suggesting heterogeneity. This does not exclude the possibility they to be located at subsurface layers.
The fractions of the other two kinds of Ce3+ sites are abruptly equal. This suggest that they are surface situated but differ in reactivity.
Consider first the sites fast oxidized at 100 K. It appears that they are of several different kinds, at least sites connected with OH groups and sites connected with residual carbonates.
Looking on the spectra presented in Figure 7 one could conclude that the Ce3+ sites attached to OH groups are fast oxidized with simultaneous production of O2 species according to the following hypothetic reaction:
Ce3+−(OH)−Ce3+ + O2 → Ce3+−(OH)−Ce4+–O2
However, a careful analysis of the spectra indicates that the situation is much more complicated. Thus, if reaction (1) occurred, the OH band should undergo an additional shift at full oxidation (including the two Ce3+ sites) which was not observed in the experiments.
Note that during the fast oxidation of Ce3+ sites the formation of superoxides and peroxides as well as the concomitant changes (e.g. in the hydroxyl or carbonate regions) proceed in parallel. We attribute this to the so-called “wall effect”. Reactive adsorption of oxygen is irreversible and O2 molecules interact with the first appropriate site they meet in their way. Thus the ratio between the different Ce3+ sites oxidized at 100 K will not be determined by the differences in their affinity to oxygen. From this we may conclude that all Ce3+ sites participating in the fast oxidation are accessible and situated on the surface.
Consequently, an important conclusion on the location of surface carbonates can be made. There are sound arguments that they are not situated on the surface [53,55]. However, it appears that they on reduced samples at least part of them are connected to surface Ce3+ sites. Thus could happen if the carbonates are located at the subsurface layer.
Bridging hydroxyls on ceria are of II or III type, i.e. connected with two or three cerium cations. However, it is important to note that for samples evacuated at 773 K the regular crystal planes are dehydroxylated and the residual hydroxyls are located at edges, corners or other defect sites. Therefore, the Ce3+ ions connected to OH groups should be highly accessible. It is also expected that a large part of Ce3+ sites are not connected to OH groups or carbonate ions.
A widely accepted reaction of ceria reduction is that leading to formation of oxygen vacancies:
Ce4+–O2––Ce4+ + H2 → Ce3+ □ Ce3+ + H2O
where □ denotes an oxygen vacancy.
Reoxidation needs formation of divalent anion and this can be easily achieved according to the reaction:
Ce3+ □ Ce3+ + O2 → Ce4+–O22––Ce4+
At temperatures above ca. 473 K peroxides completely decompose and the original state typical of oxidized ceria surface is restored:
Ce4+–O22––Ce4+ → Ce4+–O2––Ce4+ + ½ O2
Most probably analogous reaction occurs when Ce3+ sites from bridging hydroxyls are oxidized, because it was already noted that no step oxidation of the two Ce3+ sites was detected.
It was, however, noted that the formation of superoxide species cannot be explained by the model of surface oxygen vacancy and is rather indicative of presence of low-coordinated Ce3+ sites [87]. We propose that such Ce3+ sites can be produced by reduction of Ce4+ sites connected to terminal OH groups:
Ce4+–OH + ½ H2 → Ce3+ + H2O
Indeed, the results presented on Figure 6, Figure 7 and Figure 13 show that after the fast oxidation the terminal OH groups on the CeO2-NC sample are not regenerated. It is logic to expect that the charge balance is achieved by formation of a Ce4+-O2 complex, e.g. according to the following reaction:
Ce3+ + O2 → Ce4+–O2
Thus, one of the possible locations of the Ce4+–O2 species is on the place of the original terminal Ce4+–OH groups.
It was established that oxidation at 100 K leads to obtaining of a highly stable semioxidized state of ceria. However, a large part of Ce3+ sites are additionally oxidized at temperatures intermediate between 100 and 293 K. First, some extra superoxide species were produced in this way. This indicates proceeding of reaction (6) and evidences the existence of a fraction of less reactive isolated Ce3+ sites. However, the superoxide band started to decline with the temperature rise and particular peroxide species were produced at its expense.
Based on similar observation, Li et al. [60] proposed the following evolution of the oxygen adspecies on ceria:
O2 ads → O2ads → O22−ads → 2 Oads → 2 O2−lattice
According to our results this equation should be divided in two independent parts: evolution of peroxo and evolution of superoxo species.
It was also noted that peroxides could be directly decomposed thus producing lattice oxygen on the place of the oxygen vacancy.
Consider now the superoxide species. The fact that they form on isolated ex-Ce3+ sites indicates that they must evolve by forming monovalent anions. A hypothetic candidate for this is the O anion. However, we have no indication of its formation. In contrast, we already proposed that the bands below 850 cm-1 characterize hydroperoxo species. Thus, a possible reduction of the Ce4+-O2 species is according to the following reaction:
Ce4+−O2 + ½ H2 → Ce4+−OOH
In this case the interaction proceeds with hydrogen dissolved in ceria. Indeed, it was established that it promotes formation of hydroperoxides. We cannot exclude some hydroperoxides to be formed with participation of hydrogen from surface OH groups.
After decomposition of the Ce4+-OOH groups the original terminal hydroxyls typical of oxidized surface are restored:
Ce4+−OOH → Ce4+−OH + ½ O2
The initial stage of this reaction was documented in our IR results (see Figure 6B, spectrum k).
The O radicals are IR invisible but has been observed on some oxides by ESR [90]. Although suggested [60], these species have not been reported for pure ceria. In any case, we cannot totally rule out the possibility that, under hydrogen-deficient conditions, direct decomposition of O2 to O occurs, the latter ensuring the charge balance instead of OH or OOH.
In conclusions, the evolution of the adsorbed oxygen species on isolated Ce3+ sites and on oxygen vacancies follow two different and independent routes.

3.3. Fine Structure of Ce3+ Band

It was found that Ce3+ band has a fine structure. This explains the different values of the band position reported in the literature. To the best of our knowledge, the fine structure of this band has not been discussed. Therefore, this work is the first attempt to assign the different components of the band. We realize that additional work has to be done for the precise attribution, but our results allow making some definite conclusions.
At first, is was unambiguously established that the position of the sub-bands strongly depends on the presence of OH group(s) in the first coordination sphere of Ce3+ cations. Comparison between the spectra of reduced sample evacuated at 773 K and 573 K (Figure 11A, spectra c and d, respectively) clearly shows that the components around 2133 and 2096-95 cm-1 consumed during the fast oxidation at 100 K are much more intense with the highly dehydroxylated sample and therefore should be associated with Ce3+ sites having no OH groups in vicinity. The same seems to be also valid for the band at 2105 cm-1. In contrast, the band at 2109 cm-1 appears with enhanced intensity with the hydroxylated sample and thus can be associated with Ce3+ cations connected with the extra OH groups on this sample (3664 cm-1).
On the basis of the above considerations one could expect that Ce3+ cations bound on residual carbonates should also possess a specific spectral behavior. Unfortunately, on the basis of our experiments, we are not able to draw any definite conclusions at this stage.
Comparison between the samples reduced at different temperatures (Figure 11A, spectra a-c) clearly shows that the component at 2126 cm-1 corresponds to Ce3+ sites that are produced more difficult during reduction.
The sites that resist fast oxidation at 100 K but are oxidized at higher temperature up to 293 K give rise to a broad Ce3+ band with two resolved components at 2118 and 2112 cm-1.
Finally, the small fraction of sites residual to oxidation at 293 K produce a broad band at 2109 cm-1. Since the band does not differ significantly from the above discussed band, we could suggest that the inertness of these sites could be due to low accessibility. It is not excluded they to be in the subsurface layer.
At the beginning of this study we aimed to establish a clear relationship between the band components and the exposed crystal facets. However, it appears that the positions of the components depend on too many factors and at this stage we desist to make definite conclusions. Further specially designed experiments are necessary to answer this question and to establish eventual dependence between the component position and location of the Ce3+ on different crystal planes and edges.

3.4. Oxidation of Sorbed H2

A surprising observation in this study is the ability of O2 to oxidized dissolved hydrogen at 100 K in the absence of any noble metal. Although the fraction of this hydrogen that is oxidized at 100 K is relatively small, the phenomenon could be of great importance for catalysis. It was also established that this hydrogen strongly affects the conversion pathway of superoxide species. Since it is IR invisible, we suggest that it is highly probable some of the results reported in the literature to have been affected by dissolved hydrogen. Our results indicate that it is more stable on not fully reduced samples and thus can be present in some amount even after evacuation at 773 K. The principal part of the dissolved hydrogen is oxidized at temperatures up to ambient one.

4. Materials and Methods

4.1. Synthesis of the Samples

A hydrothermal method was used for the synthesis of nanosized samples of CeO2 with different morphologies (cubes, rods and polyhedra) [20,38]. 85 mL aqueous solution of 5 g Ce(NO3)3.6H2O (Fluka, 99 % purity) was added with vigorous stirring to 150 mL alkaline solution of 54 g NaOH (Merck, 99 % purity) in water. After obtaining a suspension, stirring was continued for another 30 min, after which the reaction mixture was transferred to an autoclave. Nanocubes (sample CeO2-NC) and nanorods (sample CeO2-NR) were obtained after “aging” in an autoclave for 24 h at 453 and 373 K, respectively. The conditions for the synthesis of the nanopolyhedra (sample CeO2-NP) are identical to those of the nanorods, but the alkaline solution used was more diluted (9 g NaOH in 150 mL water). Finally, the suspensions were centrifuged, the precipitates were washed with deionized water, dried at 393 K and calcined at 673 K for 2 hrs.

4.2. Gases

All non-labelled gases used for the IR and TPR experiments were provided by Messer: hydrogen (>99.999 %); helium (99.999 %); oxygen (99.999 %), 5% O2/He (O2 99.95 %) and 10% H2/Ar (H2 99.95 %). Labelled oxygen, 18O2 was provided by ISOTEC and had and isotopic purity of 99 atom % 18O.

4.3. Methods

4.3.1. FTIR Spectroscopy

FTIR spectra were registered with a Thermo Scientific Nicolet 6700 FTIR Spectrometer equipped with an MCT/A detector. The spectral resolution was 2 cm–1 and 64 scans were accumulated for each spectrum. Self-supporting wafers (ca. 15 mg cm-2) were prepared from the sample powders and treated directly in a purpose-made IR cell connected to a vacuum-adsorption apparatus with a residual pressure below 10-4 Pa. Before the experiments the samples were activated by heating in oxygen (100 mbar) for 30 min at 773 K, followed by 30 min evacuation at the same temperature.
To obtain oxidized sample, the pellet was treated at the desired activation temperature for 10 min in the presence of 2 mbar of O2 and then evacuated for 30 min at the same temperature.
To obtain reduced samples, the pellets were treated in 100 mbar of H2 for 1 h at 773 K, followed by 1 h evacuation at the desired temperature, typically at 773 K. In this way all eventually stored hydrogen (characterized by TPD peak at 580 K [80]) was removed. When lower evacuation temperatures were applied, this is specially noted.
For all low-temperature measurements the IR cell was initially cooled by liquid nitrogen and then 2 mbar of He were added to the system in order to improve heat transfer.
Low-temperature adsorption of O2 on reduced samples was performed either by successive addition of small doses of O2, or by direct introduction of oxygen at 2 mbar pressure. Then the sample temperature was gradually raised. Interaction with O2 at 313-400 K was studies by heating the sample at the target temperature, followed by cooling to ambient temperature.
For the experiments performed at ambient temperature, small doses of O2 were successively added to the system.

4.3.2. Temperature-Programmed Reduction

Temperature programmed reduction with hydrogen (H2-TPR) was carried out using a ChemBET TPR/TPD apparatus (Quantachrome Instruments) equipped with thermal conductivity detector. A nitrogen/ethanol cold trap (placed before the detector) was used to eliminate water vapor from the gas flow. Before the TPR, the samples were heated to 773 K in a flowing stream of 5% O2/He. TPR curves were recorded while reducing the samples (~40 mg) in a 10% H2/Ar mixture at a flow rate of 20 mL min-1 and increasing the temperature from room temperature to 1273 K at a ramp rate of 10 K min-1.

4.3.3. Transmission Electron Microscopy

The Transmission Electron Microscopy (TEM) study was performed with a JEOL 2100 transmission electron microscope at accelerating voltage of 200 kV equipped with X-ray energy-dispersive spectrometer (XEDS) Oxford Instruments, X-MAX N 80 T; CCD Camera ORIUS 1000, 11 Mp, GATAN. Before examination, each sample was suspended in ethanol solution and dripped onto standard holey carbon/Cu grid. The data analysis was carried out by the Digital Micrograph software.

4.3.4. X-ray Diffraction

Powder X-ray diffraction (XRD) analysis was performed with a Bruker D8 Advance diffractometer with a CuKa radiation and a LynxEye solid position-sensitive detector. XRD patterns were recorded in the range of 5.3 to 80o 2θ with a constant step of 0.02o 2θ and counting time of 17.5 s per step. The mean crystallite size was calculated according to the Scherrer’s equation with Bruker Topas v.4.2 software.

4.3.5. BET Surface Area

Brunauer-Emmett-Teller (BET) surface areas were determined by low temperature (77.4 K) nitrogen adsorption in a NOVA 1200e apparatus (Quantachrome Instruments). The samples were degassed overnight at 473 K under vacuum to ensure a clean dry surface.

5. Conclusions

  • No autoreduction of Ce4+ to Ce3+ occurs during evacuation of pure ceria nanoparticles at 573-773 K.
  • Reduction of ceria with H2 at 773 K leads to formation of Ce3+ cations, which are monitored in the IR spectra by a band at 2133-2094 cm-1. This band possess a fine structure, well resolved at 100 K. The positions of the individual components depend on the environment of Ce3+, including the presence of nearby OH groups and likely of residual carbonates.
  • Even at 100 K part of Ce3+ sites on reduced ceria are fast oxidized by O2. These sites are situated on the surface and include all Ce3+ cations bound to OH groups and carbonates.
  • Depending on the location of the Ce3+ sites, O2− or O22− are produced during the fast oxidation of reduced ceria at 100 K.
  • Some Ce3+ sites resist oxidation at 100 K but are oxidized at higher temperatures, in the temperature interval 100 – 400 K. These sites are also assumed to be surface situated, but a location in subsurface layers is not excluded.
  • Peroxide (O22−) species decompose to give lattice oxygen, while superoxides first convert to hydroperoxides (OOH−) and then to terminal OH groups
  • H2 dissolves in reduced ceria and is not completely removed upon evacuation at temperatures < 773 K. Part of this hydrogen is also fast oxidized at 100 K.

Supplementary Materials

The following supporting information can be downloaded at the website of this paper posted on Preprints.org: Figure S1: Background spectra of the CeO2-NR sample; Figure S2: Background spectra of the CeO2-NP sample; Figure S3: Temperature effect on the spectra in the hydroxyl and carbonate regions; Figure S4: IR spectra of molecularly adsorbed O2; Figure S5: Effect of oxidation of CeO2-NC on the position of the carbonate bands; Figure S6: IR spectra of oxygen adsorbed on CeO2-NC at ambient temperature; Figure S7: IR spectra of oxygen adsorbed on CeO2-NR at ambient temperature.

Author Contributions

Conceptualization, M.M. and K.H.; methodology, K.H.; investigation, K.C. and N.D.; writing—original draft preparation, K.H.; writing—review and editing, K.C., N.D., M.M. and K.H; visualization, K.C. and K.H.; funding acquisition, M.M. and K.H. All authors have read and agreed to the published version of the manuscript.

Funding

This research was funded by the Bulgarian Science Fund, grant number КП-06-Н-59/5/2021.

Data Availability Statement

The data presented in this study are available in the article and the supplementary material.

Acknowledgments

Research equipment of the National Centre for Mechatronics and Clean Technologies was used for the experiments (project BG05M2OP001-1.001-0008, funded by the European Regional Development Fund under the Operational Program “Science and Education for Smart Growth 2014-2020”). Thanks are also due to: prof. D. Kovacheva for XRD analysis, Dr. L. Mihaylov for TEM analysis and Dr. L. Dimitrov for sample synthesis.

Conflicts of Interest

The authors declare no conflict of interest.

References

  1. Trovarelli, A.; de Leitenburg, C.; Boaro, M.; Dolcetti, G. The utilization of ceria in industrial catalysis, Catal. Today 1999, 50, 353-367. [CrossRef]
  2. Chung, C.-H.; Tu, F.-Y.; Chiu, T.-A.; Wu, T.-T.; Yu, W.-Y. Critical roles of surface oxygen vacancy in heterogeneous catalysis over ceria-based materials: a selected review, Chem. Lett. 2021, 50, 856-865. [CrossRef]
  3. Chuen, W.C.; Haile, S.M. A thermochemical study of ceria: exploiting an old material for new modes of energy conversion and CO2 mitigation. Phil. Trans. R. Soc. A 2010, 368, 3269-3294. [CrossRef]
  4. Ganduglia-Pirovano, M. V.; Hofmann, A.; Sauer, J., Oxygen vacancies in transition metal and rare earth oxides: Current state of understanding and remaining challenges. Surf. Sci. Rep. 2007, 62, 219-270. [CrossRef]
  5. Li, H.; Xia, P.; Pan, S.; Qi, Z.; Fu, C.; Yu, Z.; Kong, W.; Chang, Y.; Wang, K.; Wu, D.; Yang, X. The advances of ceria nanoparticles for biomedical applications in orthopaedics. Int. J. Nanomed. 2020, 15, 7199-7214. [CrossRef] [PubMed]
  6. Rozhin, P.; Melchionna, M.; Fornasiero, P.; Marchesan, S. Nanostructured ceria: biomolecular templates and (bio)applications. Nanomaterials 2021, 11, 2259. [CrossRef] [PubMed]
  7. Song, G.; Cheng, N.; Zhang, J.; Huang, H.; Yuan, Y.; He, X.; Luo, Y.; Huang, K. Nanoscale cerium oxide: synthesis, biocatalytic mechanism, and applications. Catalysts 2021, 11, 1123. [CrossRef]
  8. Putna, E.S.; Vohs, J.M.; Gorte, R.J. Evidence for weakly bound oxygen on ceria films. J. Phys. Chem. 1996, 100, 17862-17865. [CrossRef]
  9. Yao, H.C.; Yao, Y.F.Y. Ceria in automotive exhaust catalysts. I. Oxygen storage. J. Catal. 1984, 86, 254-265. [CrossRef]
  10. Laachir, A.; Perrichon, V.; Badri, A.; Lamotte, J.; Catherine, E.; Lavalley, J. C.; El Fallah, J.; Hilaire, L.; Le Normand, F.; Quéméré, E.; Sauvion, G. N.; Touret, O. Reduction of CeO2 by hydrogen. Magnetic susceptibility and Fourier-transform infrared, ultraviolet and X-ray photoelectron spectroscopy measurements. J. Chem. Soc., Faraday Trans. 1991, 87, 1601-1609. [CrossRef]
  11. Perrichon, V.; Laachir, A.; Bergeret, G.; Frety, R.; Tournayan, L. Reduction of cerias with different textures by hydrogen and their reoxidation by oxygen. J. Chem. Soc., Faraday Trans. 1994, 90, 773-781. [CrossRef]
  12. Holgado, J. P.; Munuera, G. XPS/TPR study of the reducibility of M/CeO2 catalysts (M=Pt, Rh): Does junction effect theory apply? In Stud. Surf. Sci. Catal., Frennet, A.; Bastin, J. M., Eds. Elsevier: 1995; Vol. 96, pp 109-122.
  13. Terribile, D.; Trovarelli, A.; de Leitenburg, C.; Dolcetti, G. Unusual oxygen storage/redox behavior of high-surface-area ceria prepared by a surfactant-assisted route, Chem. Mater. 1997, 9, 2676-2678. [CrossRef]
  14. Rao, G. R. Influence of metal particles on the reduction properties of ceria-based materials studied by TPR. Bull. Mater. Sci. 1999, 22, 89-94. [CrossRef]
  15. Daturi, M.; Finocchio, E.; Binet, C.; Lavalley, J.-C.; Fally, F.; Perrichon, V.; Vidal, K.; Hickey, N.; Kaspar, J. Reduction of high surface area CeO2-ZrO2 mixed oxides. J. Phys. Chem. B 2000, 104, 9186-9194. [CrossRef]
  16. Giordano, F.; Trovarelli, A.; Leitenburg, C.; Giona, M. A model for the temperature-programmed reduction of low and high surface area ceria. J. Catal. 2000, 193, 273-282. [CrossRef]
  17. Fally, F.; Perrichon, V.; Vidal, H.; Kaspar, J.; Blanco, G.; Pintado, J. M.; Bernal, S.; Colon, G.; Daturi, M.; Lavalley, J.C. Modification of the oxygen storage capacity of CeO2–ZrO2 mixed oxides after redox cycling aging. Catal. Today 2000, 59, 373–386. [CrossRef]
  18. Ayastuy, J. L.; Gil-Rodríguez, A.; González-Marcos, M. P.; Gutiérrez-Ortiz, M. A. Effect of process variables on Pt/CeO2 catalyst behaviour for the PROX reaction. Int. J. Hydrogen Energy 2006, 31, 2231-2242. [CrossRef]
  19. Gao, Y.; Wang, W.; Chang, S.; Huang, W. Morphology effect of CeO2 support in the preparation, metal–support interaction, and catalytic performance of Pt/CeO2 catalysts. ChemCatChem 2013, 5, 3610-3620. [CrossRef]
  20. Zabilskiy, M.; Djinović, P.; Tchernychova, E.; Tkachenko, O.P.; Kustov, L.M.; Pintar, A. Nanoshaped CuO/CeO2 materials: effect of the exposed ceria surfaces on catalytic activity in N2O decomposition reaction, ACS Catal. 2015, 5, 5357−5365. [CrossRef]
  21. Chen, D.; He, D.; Lu, J.; Zhong, L.; Liu, F.; Liu, J.; Yu, J.; Wan, G.; He, S.; Luo, Y. Investigation of the role of surface lattice oxygen and bulk latticeoxygen migration of cerium-based oxygen carriers: XPS and designed H2-TPR characterization. Appl. Catal. B 2017, 218, 249–259. [CrossRef]
  22. Sohn, H.; Celik, G.; Gunduz, S.; Dogu, D.; Zhang, S.; Shan, J.; Tao, F. F.; Ozkan, U. S. Oxygen mobility in pre-reduced nano- and macro-ceria with Co loading: an AP-XPS, in-situ DRIFTS and TPR study. Catal. Lett. 2017, 147, 2863-2876. [CrossRef]
  23. Wang, H.; Luo, S.; Zhang, M.; Liu, W.; Wu, X.; Liu, S. Roles of oxygen vacancy and Ox in oxidation reactions over CeO2 and Ag/CeO2 nanorod model catalysts. J. Catal. 2018, 368, 365–378. [CrossRef]
  24. Gonzalez-A, E.; Rangel, R.; Solís-Garcia, A.; Venezia, A. M.; Zepeda, T. A. FTIR investigation under reaction conditions during CO oxidation over Ru(x)-CeO2 catalysts. Mol. Catal. 2020, 493, 111086. [CrossRef]
  25. Cao, T.; You, R.; Li, Z.; Zhang, X.; Li, D.; Chen, S.; Zhang, Z.; Huang, W. Morphology-dependent CeO2 catalysis in acetylene semihydrogenation reaction, Appl. Surf. Sci. 2020, 501, 144120. [CrossRef]
  26. Schweke, D.; Shelly, L.; Ben David, R.; Danon, A.; Kostirya, N.; Hayun, S. Comprehensive study of the ceria–H2 system: Effect of the reaction conditions on the reduction extent and intermediates. J. Phys. Chem. C 2020, 124, 6180-6187. [CrossRef]
  27. Bogeat, A. B.; Blanco, G.; Pintado, J. M.; Goma, D.; Gamez, J. J. C. Tailoring CO2 adsorption and activation properties of ceria nanocubes by coating with nanometre-thick yttria layers. Surf. Interfaces 2021, 26, 101353. [CrossRef]
  28. Mi, R.; Li, D.; Hu, Z.; Yang, R. T. Morphology effects of CeO2 nanomaterials on the catalytic combustion of toluene: a combined kinetics and diffuse reflectance infrared fourier transform spectroscopy study, ACS Catal. 2021, 11, 7876−7889. [CrossRef]
  29. Wang, Y.; Liu, Z.; Confer, M. P.; Li, J.; Wang, R. In-situ DRIFTS study of chemically etched CeO2 nanorods supported transition metal oxide catalysts. Mol. Catal. 2021, 509, 111629. [CrossRef]
  30. Zhang, B.; Deng, L.; Liebau, M.; Ren, Y.; Luo, C.; Liu, B.; Zhang, S.; Gläser, R. Promotion effect of niobium on ceria catalyst for selective catalytic reduction of NO with NH3, J. Rare Earths 2022, 40, 1535-3545. [CrossRef]
  31. Lee, J.; Ryou, Y. S.; Chan, X.; Kim, T. J.; Kim, D. H. How Pt interacts with CeO2 under the reducing and oxidizing environments at elevated temperature? The origin of improved thermal stability of Pt/CeO2 compared to CeO2. J. Phys. Chem C 2016, 120, 25870–25879. [CrossRef]
  32. Agarwal, S.; Lefferts, L.; Mojet, B. L. Ceria nanocatalysts: shape dependent reactivity and formation of OH. ChemCatChem 2013, 5, 479-489. [CrossRef]
  33. Kovacevic, M.; Agarwal, S.; Mojet, B. L.; van Ommen, J. G.; Lefferts, L. The effects of morphology of cerium oxide catalysts for dehydrogenation of ethylbenzene to styrene. Appl. Catal. A 2015, 505, 354–364. [CrossRef]
  34. Agarwal, S.; Mojet, L. L.; Lefferts, L.; Datye, A. K. Ceria nanoshapes - structural and catalytic properties. In Catalysis by materials with well-defined structures, Elsevier, Amsterdam, 2015, pp. 31-70.
  35. Dang, F.; Kato, K.; Imai, H.; Wada, S.; Haneda, H.; Kuwabara, M. Characteristics of CeO2 nanocubes and related polyhedra prepared by using a liquid-liquid interface, Cryst. Growth Des. 2010, 10, 4537-4541. [CrossRef]
  36. Huttunen, P. K.; Labadini, D.; Hafiz, S. S.; Gokalp, S.; Wolff, E. P.; Martell, S. M.; Foster, M. DRIFTS investigation of methanol oxidation on CeO2 nanoparticles. Appl. Surf. Sci. 2021, 554, 149518. [CrossRef]
  37. Kuan, W.-F.; Yu, W.-Y.; Tu, F.-Y.; Chung, C.-H.; Chang, Y.-C.; Lin, M. M.; Yu, T.-H.; Chen, L.-J. Facile reflux preparation of defective mesoporous ceria nanorod with superior catalytic activity for direct carbon dioxide conversion into dimethyl carbonate. Chem. Eng. J. 2022, 430, 132941. [CrossRef]
  38. Mai, H.-X.; Sun, L.-D.; Zhang, Y.-W.; Si, R.; Feng, W.; Zhang, H.-P.; Liu, H.-C.; Yan, C.-H. Shape-selective synthesis and oxygen storage behavior of ceria nanopolyhedra, nanorods, and nanocubes, J. Phys. Chem. B 2005, 109, 24380-24385. [CrossRef] [PubMed]
  39. Qiao, Z.-A.; Wu, Z.; Dai, S. Shape-controlled ceria-based nanostructures for catalysis applications. ChemSusChem 2013, 6, 1821-1833. [CrossRef] [PubMed]
  40. Reed, K.; Cormack, A.; Kulkarni, A.; Mayton, M.; Sayle, D.; Klaessig, F.; Stadler, B. Exploring the properties and applications of nanoceria: is there still plenty of room at the bottom? Environ. Sci. Nano 2014, 1, 390-405. [CrossRef]
  41. Schilling, C.; Ganduglia-Pirovano, M. V.; Hess, C. Experimental and theoretical study on the nature of adsorbed oxygen species on shaped ceria nanoparticles. J. Phys. Chem. Lett. 2018, 9, 6593-6598. [CrossRef] [PubMed]
  42. Sun, C.; Li, H.; Chen, L. Nanostructured ceria-based materials: synthesis, properties, and applications. Energy Environ. Sci. 2012, 5, 8475-8505. [CrossRef]
  43. Wu, Z.; Li, M.; Howe, J.; Meyer, H. M.; Overbury, S. H. Probing defect sites on CeO2 nanocrystals with well-defined surface planes by Raman spectroscopy and O2 adsorption. Langmuir 2010, 26, 16595-16606. [CrossRef] [PubMed]
  44. Wu, W.; Savereide, L. M.; Notestein, J.; Weitz, E. In-situ IR spectroscopy as a probe of oxidation/reduction of Ce in nanostructured CeO2. Appl. Surf. Sci. 2018, 445, 548-554. [CrossRef]
  45. Wu, Z.; Li, M.; Mullins, D. R.; Overbury, S. H. Probing the surface sites of CeO2 nanocrystals with well-defined surface planes via methanol adsorption and desorption, ACS Catal. 2012, 2, 2224-2234. [CrossRef]
  46. Wei, Y.; Liu, J.; Zhao, Z.; Duan, A.; Jiang, G. The catalysts of three-dimensionally ordered macroporous Ce1-xZrxO2-supported gold nanoparticles for soot combustion: the metal–support interaction, J. Catal. 2012, 287, 13–29. [CrossRef]
  47. Guillén-Hurtado, N.; Atribak, I., Bueno-López, A.; García-García, A. Influence of the cerium precursor on the physico-chemical features and NO to NO2 oxidation activity of ceria and ceria–zirconia catalysts. J. Mol. Catal. A 2010, 323, 52–58. [CrossRef]
  48. Liu, L.; Cao, Y.; Sun, W.; Yao, Z.; Liu, B.; Gao, F.; Dong, L. Morphology and nanosize effects of ceria from different precursors on the activity for NO reduction. Catal. Today 2011, 175, 48-54. [CrossRef]
  49. Zotin, F.M.Z.; Tournayan, L.; Varloud, J.; Perrichon, V.; Frety, R. Temperature-programmed reduction: limitation of the technique for determining the extent of reduction of either pure ceria or ceria modified by additives. Appl. Catal. A 1993, 98, 99-114. [CrossRef]
  50. Afrin, S.; Bollini, P. On the utility of Ce3+ spin-orbit transitions in the interpretation of rate data in ceria catalysis: theory, validation, and application. J. Phys. Chem. C 2023, 127, 234-247. [CrossRef]
  51. Binet, C.; Badri, A.; Lavalley, J.-C. A spectroscopic characterization of the reduction of ceria from electronic transitions of intrinsic point defects. J. Phys. Chem. 1994, 98, 6392-6398. [CrossRef]
  52. Binet, C.; Daturi, M.; Lavalley, J.-C. IR study of polycrystalline ceria properties in oxidised and reduced states. Catal. Today 1999, 50, 207-225. [CrossRef]
  53. Mihaylov, M. Y.; Ivanova, E. Z.; Aleksandrov, H. A.; Petkov, P. St.; Vayssilov, G.N.; Hadjiivanov, K.I. FTIR and density functional study of NO interaction with reduced ceria: identification of N3 and NO2− as new intermediates in NO conversion. Appl. Catal. B 2015, 176-177, 107-119. [CrossRef]
  54. Mihaylov, M. Y.; Ivanova, E. Z.; Aleksandrov, H. A.; Petkov, P. St.; Vayssilov, G.N.; Hadjiivanov, K.I. Formation of N3 during interaction of NO with reduced ceria. Chem. Commun. 2015, 51, 5668-5671. [CrossRef]
  55. Mihaylov, M. Y.; Ivanova, E. Z.; Vayssilov, G.N.; Hadjiivanov, K.I. Revisiting ceria-NOx interaction: FTIR studies. Catal. Today 2020, 357, 613-620. [CrossRef]
  56. Li, H.; Zhang, P.; Li, G.; Lu, J.; Wu, Q.; Gu, Y. Stress measurement for nonstoichiometric ceria films based on Raman spectroscopy. J. Alloys Compounds 2016, 682, 132-137. [CrossRef]
  57. Mihaylov, M. Y.; Ivanova, E. Z.; Aleksandrov, H. A.; Petkov, P. St.; Vayssilov, G.N.; Hadjiivanov, K.I. Species formed during NO adsorption and NO + O2 co-adsorption on ceria: a combined FTIR and DFT study. Mol. Catal. 2018, 451, 114-124. [CrossRef]
  58. Chen, L.; Fleming, P.; Morris, V.; Holmes, J. D.; Morris, M. A. Size-related lattice parameter changes and surface defects in ceria nanocrystals. J. Phys. Chem. C 2010, 114, 12909-12919. [CrossRef]
  59. Descorme, C.; Madier, Y.; Duprez, D. Infrared study of oxygen adsorption and activation on cerium–zirconium mixed oxides. J. Catal. 2000, 196, 167-173. [CrossRef]
  60. Li, C.; Domen, K.; Maruya, K.; Onishi, T. Dioxygen adsorption on well-outgassed and partially reduced cerium oxide studied by FT-IR. J. Am. Chem. Soc. 1989, 111, 7683-7687. [CrossRef]
  61. Li, C.; Domen, K.; Maruya, K.-I.; Onishi, T. Oxygen exchange reactions over cerium oxide: An FT-IR study. J. Catal. 1990, 123, 436-442. [CrossRef]
  62. Pushkarev, V. V.; Kovalchuk, V. I.; d'Itri, J. L. Probing defect sites on the CeO2 surface with dioxygen. J. Phys. Chem. B 2004, 108, 5341-5348. [CrossRef]
  63. Baranchikov, A.E.; Polezhaeva, O.S.; Ivanov, V.K.; Tretyakov, Y.D. Lattice expansion and oxygen non-stoichiometry of nanocrystalline ceria, CrystEngComm 2010, 12, 3531–3533. [CrossRef]
  64. Deshpande, S.; Patil, S.; Kuchibhatla, S.V.; Seala, S. Size dependency variation in lattice parameter and valency states in nanocrystalline cerium oxide. Appl. Phys. Lett. 2005, 87, 133113. [CrossRef]
  65. Kim, K.; Yi, D. K.; Paik, U. Increase in Ce3+ concentration of ceria nanoparticles for high removal rate of SiO2 in chemical mechanical planarization. ECS J. Solid State Sci. Technol. 2017, 6, 681-685. [CrossRef]
  66. Cardenas, L.; Molinet-Chinaglia, C.; Loridant, S. Unraveling Ce3+ detection at the surface of ceria nanopowders by UPS analysis. Phys. Chem. Chem. Phys. 2022, 24, 22815-22822. [CrossRef]
  67. Morgan, D.J. Photoelectron spectroscopy of ceria: reduction, quantification and the myth of the vacancy peak in XPS analysis. Surf. Interface Anal. 2023, 55, 845-850. [CrossRef]
  68. Xu, Y.; Wang, F.; Liu, X.; Liu, Y.; Luo, M.; Teng, B.; Fan, M.; Liu, X. Resolving a decade-long question of oxygen defects in Raman spectra of ceria-based catalysts at atomic level. J. Phys. Chem. C 2019, 123, 18889-18894. [CrossRef]
  69. Filtschew, A.; Hofmann, K.; Hess, C. Ceria and its defect structure: new insights from a combined spectroscopic approach. J. Phys. Chem. C 2016, 120, 6694-6703. [CrossRef]
  70. Schmitt, R.; Nenning, A.; Kraynis, O.; Korobko, R.; Frenkel, A. I.; Lubomirsky, I.; Haile, S. M.; Rupp, J. L. M. A review of defect structure and chemistry in ceria and its solid solutions. Chem. Soc. Rev. 2020, 49, 554-592. [CrossRef] [PubMed]
  71. Wang, X.; Li, M.; Wu, Z., In situ spectroscopic insights into the redox and acid-base properties of ceria catalysts. Chin. J. Catal. 2021, 42, 2122–2140. [CrossRef]
  72. Loridant, S. Raman spectroscopy as a powerful tool to characterize ceria-based catalysts. Catal. Today 2021, 373, 98-111. [CrossRef]
  73. Gao, Y.; Li, R.; Chen, S.; Luo, L.; Cao, T.; Huang, W. Morphology-dependent interplay of reduction behaviors, oxygen vacancies and hydroxyl reactivity of CeO2 nanocrystals. Phys. Chem. Chem. Phys. 2015, 17, 31862-31871. [CrossRef] [PubMed]
  74. Lakshmanan, P.; Averseng, F.; Bion, N.; Delannoy, L.; Tatibouët, J.-M.; Louis, C. Understanding of the oxygen activation on ceria- and ceria/alumina-supported gold catalysts: a study combining 18O/16O isotopic exchange and EPR spectroscopy. Gold Bull. 2013, 46, 233-242. [CrossRef]
  75. Lee, K.-M.; Brito, M.; DeCoster, J.; Linskens, K.; Mehdi, K.; Lee, W.-I.; Kim, E.; Kim, H.; Kwon, G.; Nam, C.-Y., Kim, J. Influence of oxidizing and reducing pretreatment on the catalytic performance of CeO2 for CO oxidation, Mol. Catal. 2022, 538, 112465. [CrossRef]
  76. Ortega, P.P.; Hangai, B.; Moreno, H.; Rocha, L.S.R.; Ramírez, M.A.; Ponce, M.A.; Longo, E.; Simões, A.Z. Tuning structural, optical, and gas sensing properties of ceria-based materials by rare-earth doping, J. Alloys Compounds 2021, 888, 161517. [CrossRef]
  77. Pan, J.; Wang, S.; Chen, A.; Chen, Y.; Wang, M.; Chen, Y. Visible-light-active mesoporous ceria (CeO2) nanospheres for improved photocatalytic performance, J. Alloys. Compounds 2022, 898, 162895. [CrossRef]
  78. Taniguchi, T.; Watanabe, T.; Sugiyama, N.; Subramani, A. K.; Wagata, H.; Matsushita, N.; Yoshimura, M. Identifying defects in ceria-based nanocrystals by UV resonance Raman spectroscopy. J. Phys. Chem. C 2009, 113, 19789-19793. [CrossRef]
  79. Wang, M.; Shen, M.; Jin, X.; Tian, J.; Zhou, Y.; Shao, Y.; Zhang, L.; Li, T.; Shi, J., Mild generation of surface oxygen vacancy on CeO2 for improved CO2 photoreduction activity, Nanoscale 2020, 12, 12374-12382. [CrossRef]
  80. Bruce, L.A.; Hoang, M.; Hughes, A.E.; Turney, T.W., Surface area control during the synthesis and reduction of high area ceria catalyst supports. Appl. Catal. A 1996, 134, 351-362. 050. [CrossRef]
  81. Badri, A.; Binet, C.; Lavalley, J.-C., An FTIR study of surface ceria hydroxy groups during a redox process with H2. J. Chem. Soc., Faraday Trans. 1996, 92, 4669-4673. [CrossRef]
  82. Tsyganenko, A.A.; Filimonov, V.N. Infrared spectra of surface hydroxyl groups and crystalline structure of oxides. J. Mol. Struct. 1973, 19, 579-589. [CrossRef]
  83. Vayssilov, G. N.; Mihaylov, M.; Petkov, P. S.; Hadjiivanov, K. I.; Neyman, K. M. Reassignment of the vibrational spectra of carbonates, formates, and related surface species on ceria: a combined density functional and infrared spectroscopy investigation. J. Phys. Chem. C 2011, 115, 23435-23454. [CrossRef]
  84. Hadjiivanov, K. Identification and characterization of surface hydroxyl groups by infrared spectroscopy, Adv. Catal. 2014, 47, 99-318. [CrossRef]
  85. Zecchina, A.; Otero Areán, C. Diatomic molecular probes for mid-IR studies of zeolites, Chem. Soc. Rev. 1996, 25, 187-197. [CrossRef]
  86. Nakamoto, K. Infrared and Raman Spectra of Inorganic and Coordination Compounds, part B (6th Ed.), John Wiley & Sons, Hoboken, N.J. (2009).
  87. Preda, G.; Migani, A.; Neyman, K. M.; Bromley, S. T.; Illas, F.; Pacchioni, G. Formation of superoxide anions on ceria nanoparticles by interaction of molecular oxygen with Ce3+ sites. J. Phys. Chem. C 2011, 115, 5817-5822. [CrossRef]
  88. Bashir, S. M.; Idriss, H. The reaction of propylene to propylene-oxide on CeO2: An FTIR spectroscopy and temperature programmed desorption study. J. Chem. Phys. 2020, 152, 044712. [CrossRef] [PubMed]
  89. Lin, W.Y.; Frei, H. Photochemical and FT-IR probing of the active site of hydrogen peroxide in Ti silicalite sieve, J. Am. Chem. Soc. 2002, 124, 9292-9298. [CrossRef]
  90. Anpo, M.; Costentin, G.; Giamello, E.; Lauron-Pernot, H.; Sojka, J. Characterisation and reactivity of oxygen species at the surface of metal oxides, J. Catal. 2021, 393, 259-280. [CrossRef]
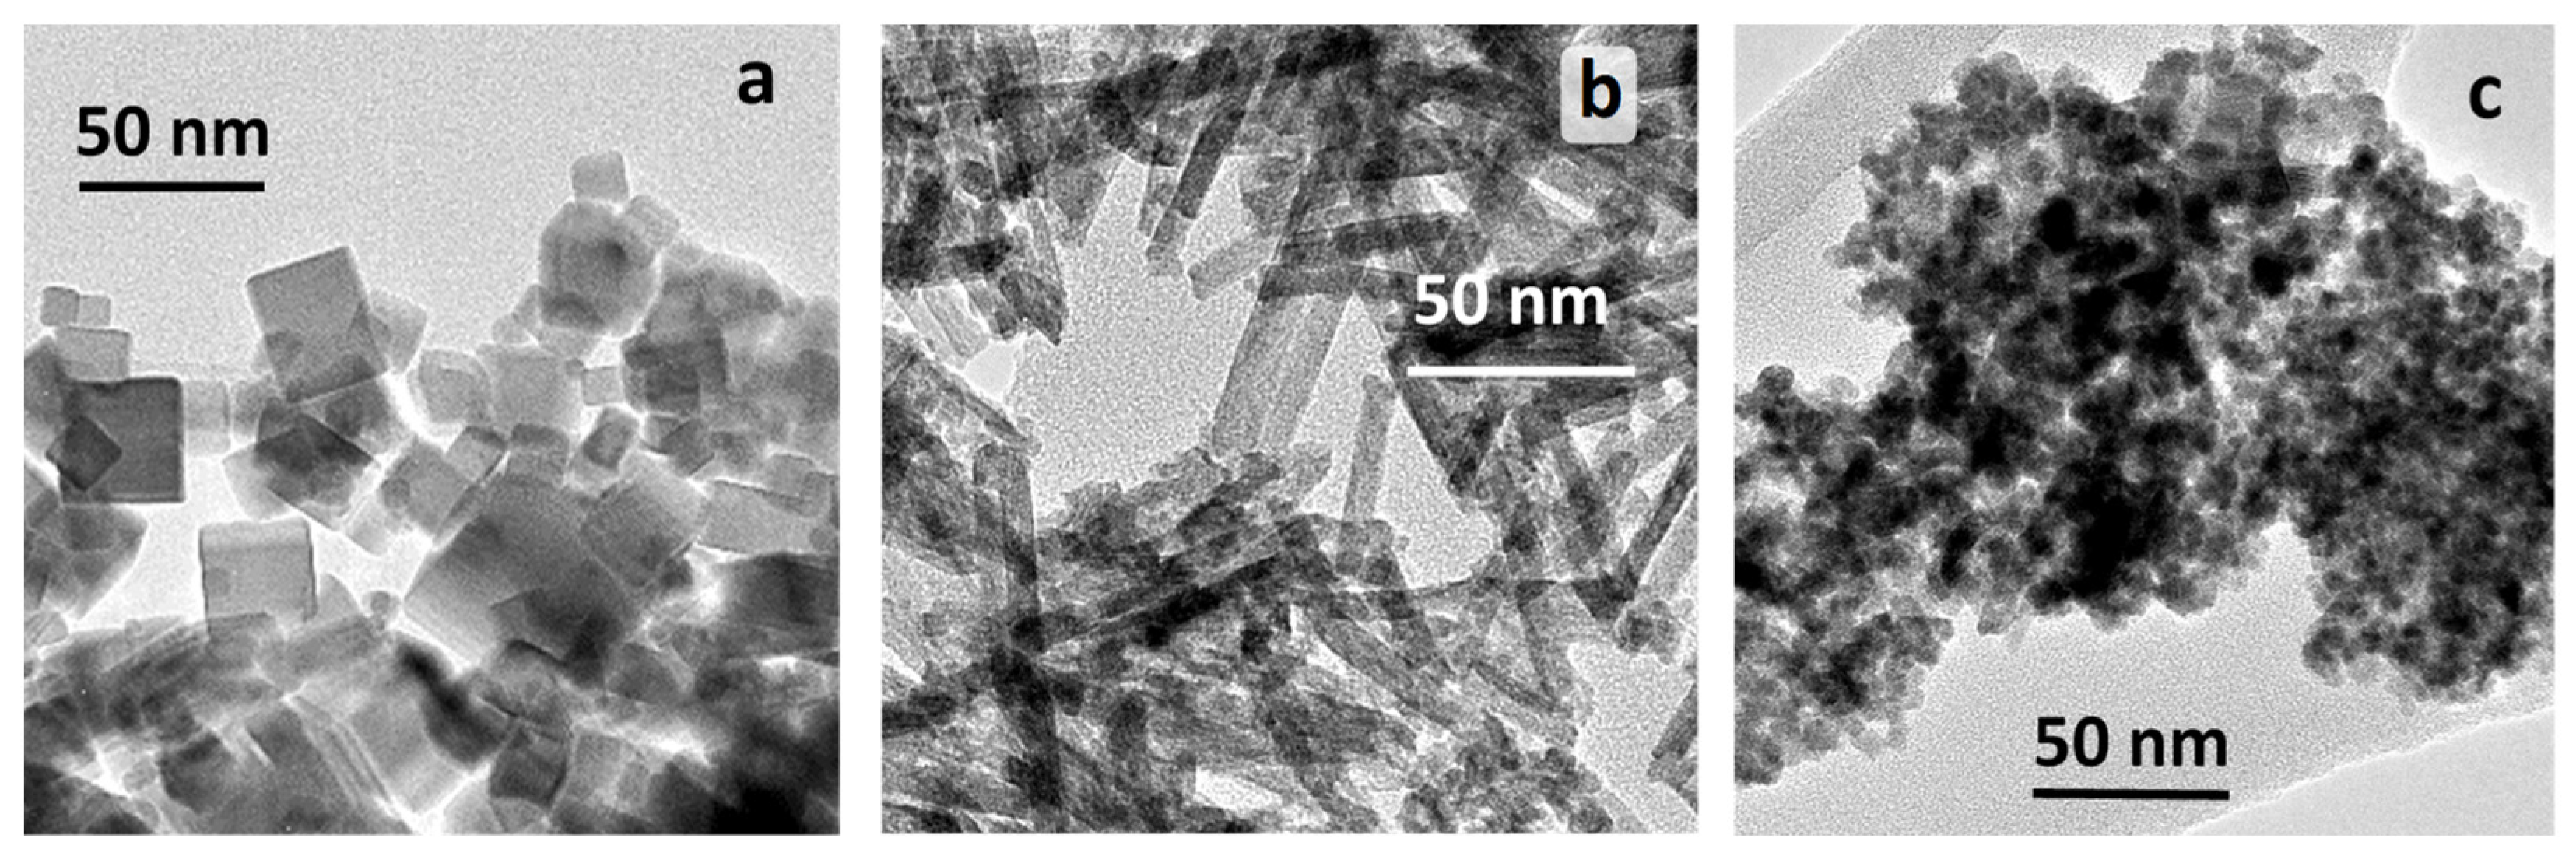
Figure 1. TEM photographs of CeO2-NC (a), CeO2-NR (b) and CeO2-NP (c).
Preprints 91677 g001
Figure 2. XRD patterns of CeO2-NC, CeO2-NR and CeO2-NP.
Preprints 91677 g002
Figure 3. H2-TPR profiles of CeO2-NC, CeO2-NR and CeO2-NP.
Preprints 91677 g003
Figure 4. FTIR spectra of CeO2-NC after activation (a) and reduction (b) at 773 K.
Preprints 91677 g004
Figure 5. FTIR spectra of reduced ceria samples in the region of Ce3+ electronic transition: CeO2-NP (a, d), CeO2-NR (b, e) and CeO2-NC (c, f). Spectra (a-c) are registered at ambient temperature while spectra (d-f), at 100 K. The second derivatives of the spectra (d-f) are multiplied by a factor of 10 and are denoted as 10d’’, 10e’’ and 10f’’. All spectra are baseline corrected.
Preprints 91677 g005
Figure 6. FTIR spectra of reduced CeO2-NC recorded at 100 K (a), after addition of 2 mbar O2 at 100 K (b), gradual increase of temperature up to ambient one (c-h), and after 5 min. heating the sample in the oxygen atmosphere at 323 K (i), 373 K (j) and 400 K (k). Panel A shows the region of Ce3+ electronic transition and the spectra are baseline corrected. Some second derivatives are shown at the top part of the panel. Panel B shows the hydroxyl stretching region. Panel C presents the spectra in the ν(O−O) region of the superoxide anion and the spectra are background corrected.
Preprints 91677 g006
Figure 7. FTIR spectra recorded after successive adsorption of small doses of 18O2 at 100 K on reduced CeO2-NC sample (a-j) and after saturation in the presence of 2 mbar O2 (k).
Preprints 91677 g007
Figure 8. Selected FTIR spectra recorded after successive adsorption of small doses of 18O2 at 100 K on reduced CeO2-NC sample (a-f), in the presence of 2 mbar 18O2 (g) and in the presence of 2 mbar 16O2 (h).
Preprints 91677 g008
Figure 9. FTIR spectra of reduced CeO2-NC registered after interaction with 16O2 (a, c, e) or 18O2 (b, d, f): addition of 2 mbar of 16O2/18O2 to the sample at 100 K (a, b) and after increase of the temperature to 298 K (c, d) and 373 K (e. f).
Preprints 91677 g009
Figure 10. FTIR spectra recorded after successive adsorption of small doses of 16O2 at 100 K on reduced CeO2-NC sample evacuated at 573 K (a-j), after introduction of a bigger dose (k) and in the presence of 2 mbar O2 (k).
Preprints 91677 g010
Figure 11. A. Changes of the IR spectra of CeO2-NC sample after introduction of 2 mbar of O2 at 100 K (a-d). Sample reduced at 623 K (a), 673 (b) and 773 K (c, d); samples evacuated at 773 K (a-c) and at 573 K (d). Increase of temperature up to 293 K in presence of O2: spectra (e-h) are recorder after spectra (a-d), respectively. Increase of temperature up to 373 K in presence of O2: spectra (i-l) are recorder after spectra (e-h), respectively. The lower set of spectra correspond to fast oxidation of Ce3+ at 100 K, the middle set, to fast oxidation between 100 K and 293 K, and the upper set, to Ce3+ residual to oxidation at 293 K. B. IR spectra of CeO2-NC sample recorded after introduction of 2 mbar of O2 at 100 K (m-p) and after increase of temperature to 293 K (q-t). Samples reduced at 623 K (m, q), 673 (n, r) and 773 K (0, p, s, t). Samples evacuated after reduction at 773 K (m, n, o, q, r, s) and at 573 K (p, t). The maxima of the peroxide species are labelled and the grey bar shows the region of a background band.
Preprints 91677 g011
Figure 12. FTIR spectra of reduced CeO2-NP registered at 100 K (a, g) and after interaction with 16O2 (b-f) or 18O2 (h-l): addition of 2 mbar of 16O2/18O2 to the sample at 100 K (b, h) after gradual increase of temperature (c, i), at ambient temperature (d, j) and after interaction with O2 at 323 K (e, k) and 373 K (f, l).
Preprints 91677 g012
Figure 13. FTIR spectra at ambient temperature (hydroxyl stretching region) of CeO2-NC (a-c) and CeO2-NR (d-f). Samples reduced with H2 at 773 K (a, d), re-oxidized by 8 mbar O2 (b, e); and freshly activated (oxidized) samples (c, f). The insets show the region of the Ce3+ electronic transition where the spectra are baseline corrected.
Preprints 91677 g013
Scheme 1. Possible configurations of superoxo species on ceria.
Preprints 91677 sch001
Table 1. Some characteristics of the samples studied
Sample Particle shape SBET, m2 g-1 Mean crystallyte size, nm1
CeO2-NC cubes 27 30.1
CeO2-NR rods 110 6.7
CeO2-NP polyhedra 140 7.2
1 Average particle size determined according to the Scherrer’s equation.
Table 2. Positions of 16O and 18O superoxide and peroxide bands on CeO2-NC and CeO2-NP samples
Sample Assignment ν(16O−16O), cm-1 ν(18O−18O), cm-1 i1
CeO2-NC superoxide 1128 1064 1,060
CeO2-NC superoxide 1160 1093 1,061
CeO2-NP superoxide 1128 1065 1,059
CeO2-NP superoxide 1137 1072 1,061
CeO2-NC peroxide 889 838 1,061
CeO2-NC peroxide 874 824 1,061
CeO2-NC peroxide 852 804 1,060
CeO2-NC peroxide 826 777 1,063
CeO2-NC peroxide 811 765 2 -
CeO2-NP peroxide 889 840 1,058
1 Isotopic shift factor. 2 Calculated value.
Disclaimer/Publisher’s Note: The statements, opinions and data contained in all publications are solely those of the individual author(s) and contributor(s) and not of MDPI and/or the editor(s). MDPI and/or the editor(s) disclaim responsibility for any injury to people or property resulting from any ideas, methods, instructions or products referred to in the content.
Copyright: This open access article is published under a Creative Commons CC BY 4.0 license, which permit the free download, distribution, and reuse, provided that the author and preprint are cited in any reuse.
Prerpints.org logo

Preprints.org is a free preprint server supported by MDPI in Basel, Switzerland.

Subscribe

© 2024 MDPI (Basel, Switzerland) unless otherwise stated