Submitted:
28 November 2023
Posted:
28 November 2023
You are already at the latest version
Abstract
Keywords:
1. Introduction
2. Fracability evaluation method
2.1. Energy brittleness index method
2.1.1. Pre-peak fragility index


2.1.2. Post-peak brittleness index


2.1.3. Combined brittleness index


2.1.4. Calculation of brittleness index from logging data
- (1)
- Velocity conversion of longitudinal and transverse sound waves
- (2)
- Effective stress coefficient (Biot coefficient)
- (3)
- Mud content


- (4)
- Uniaxial tensile strength of rocks
- (5)
- Formation pore pressure
- (6)
- Vertical stress and maximum and minimum horizontal principal stresses
2.2. Brittle-ground stress fracability index
3. Results and Discussion
4. Conclusion
- (1)
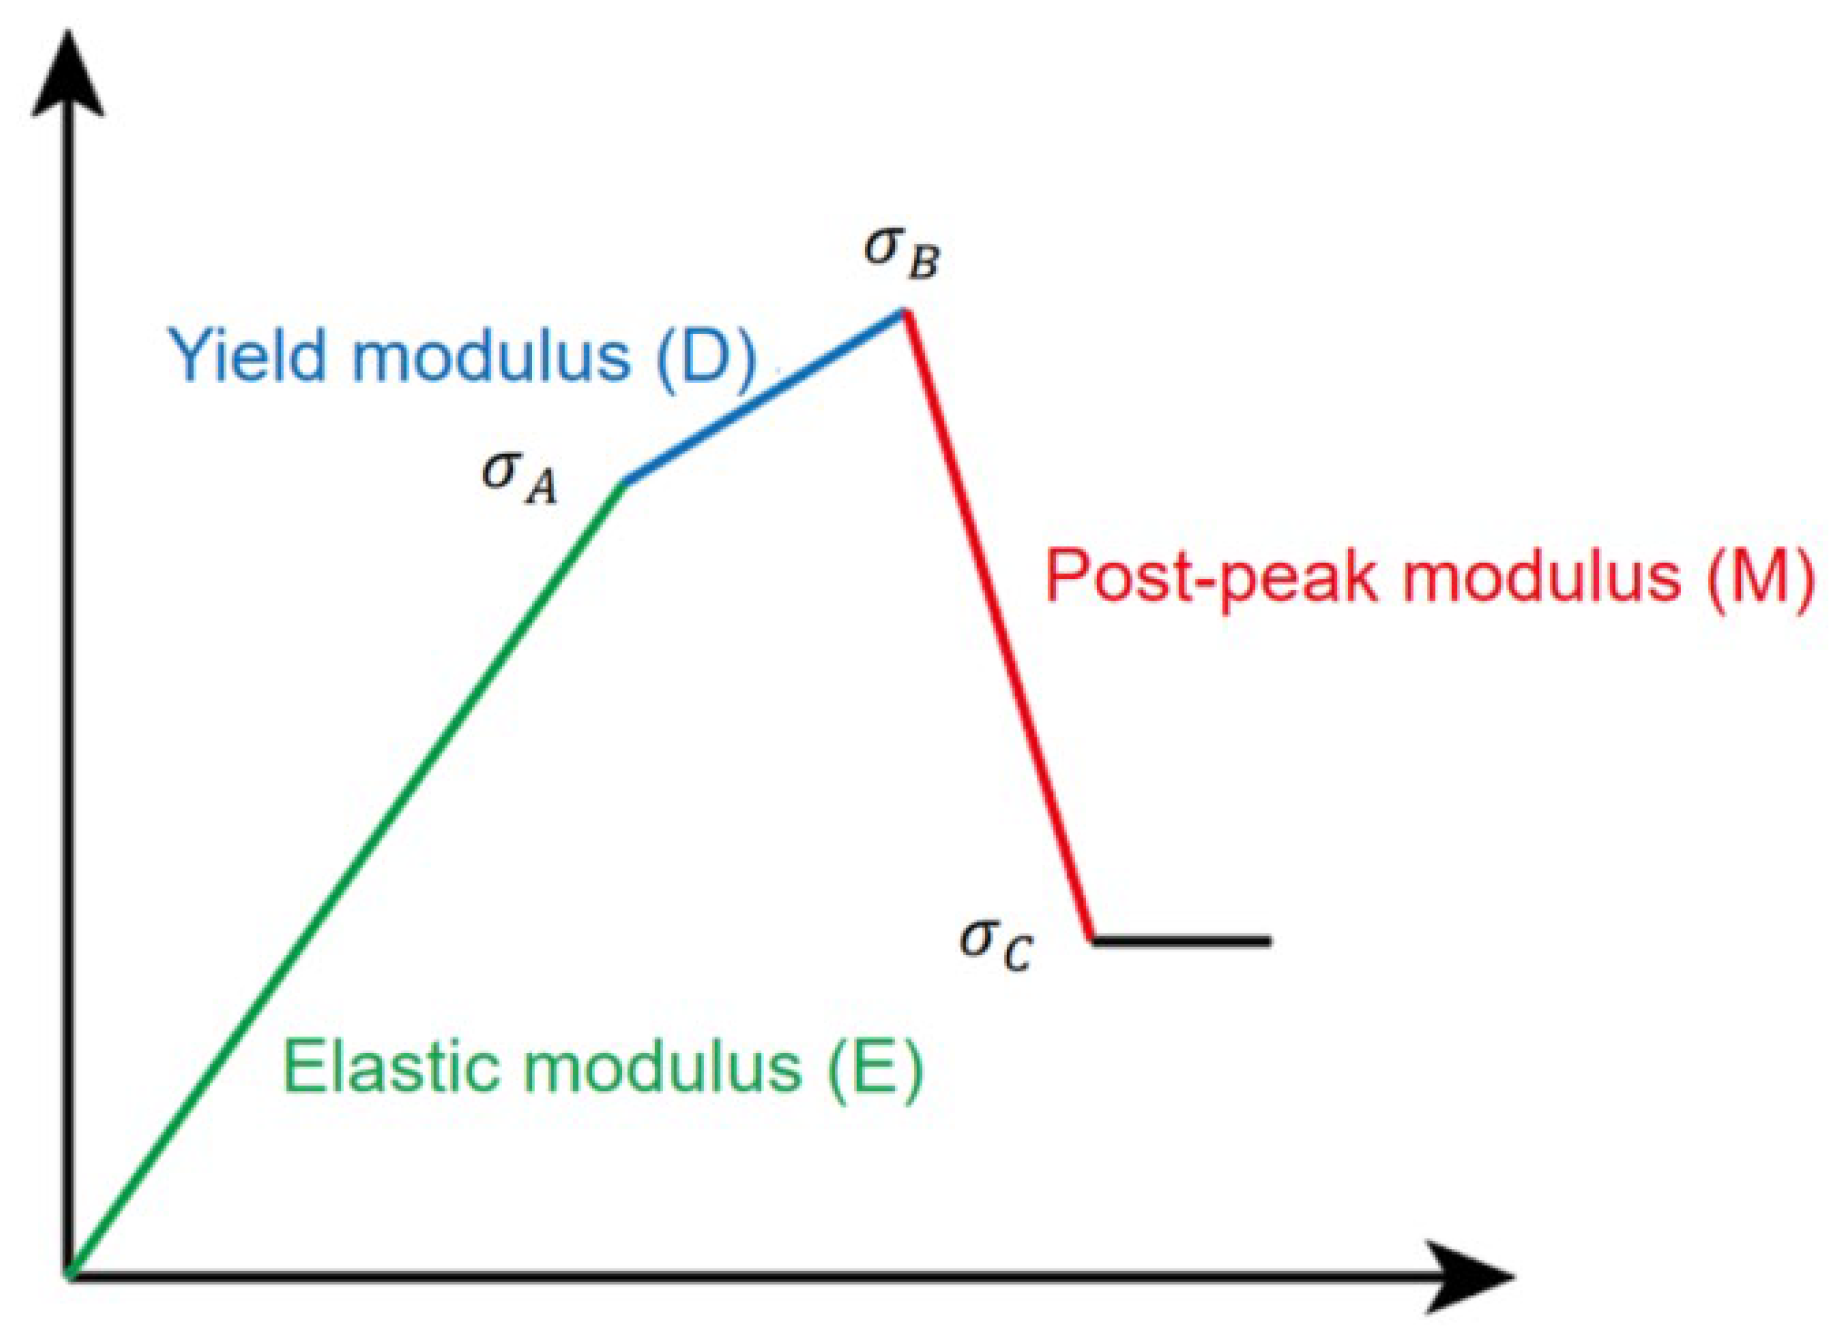
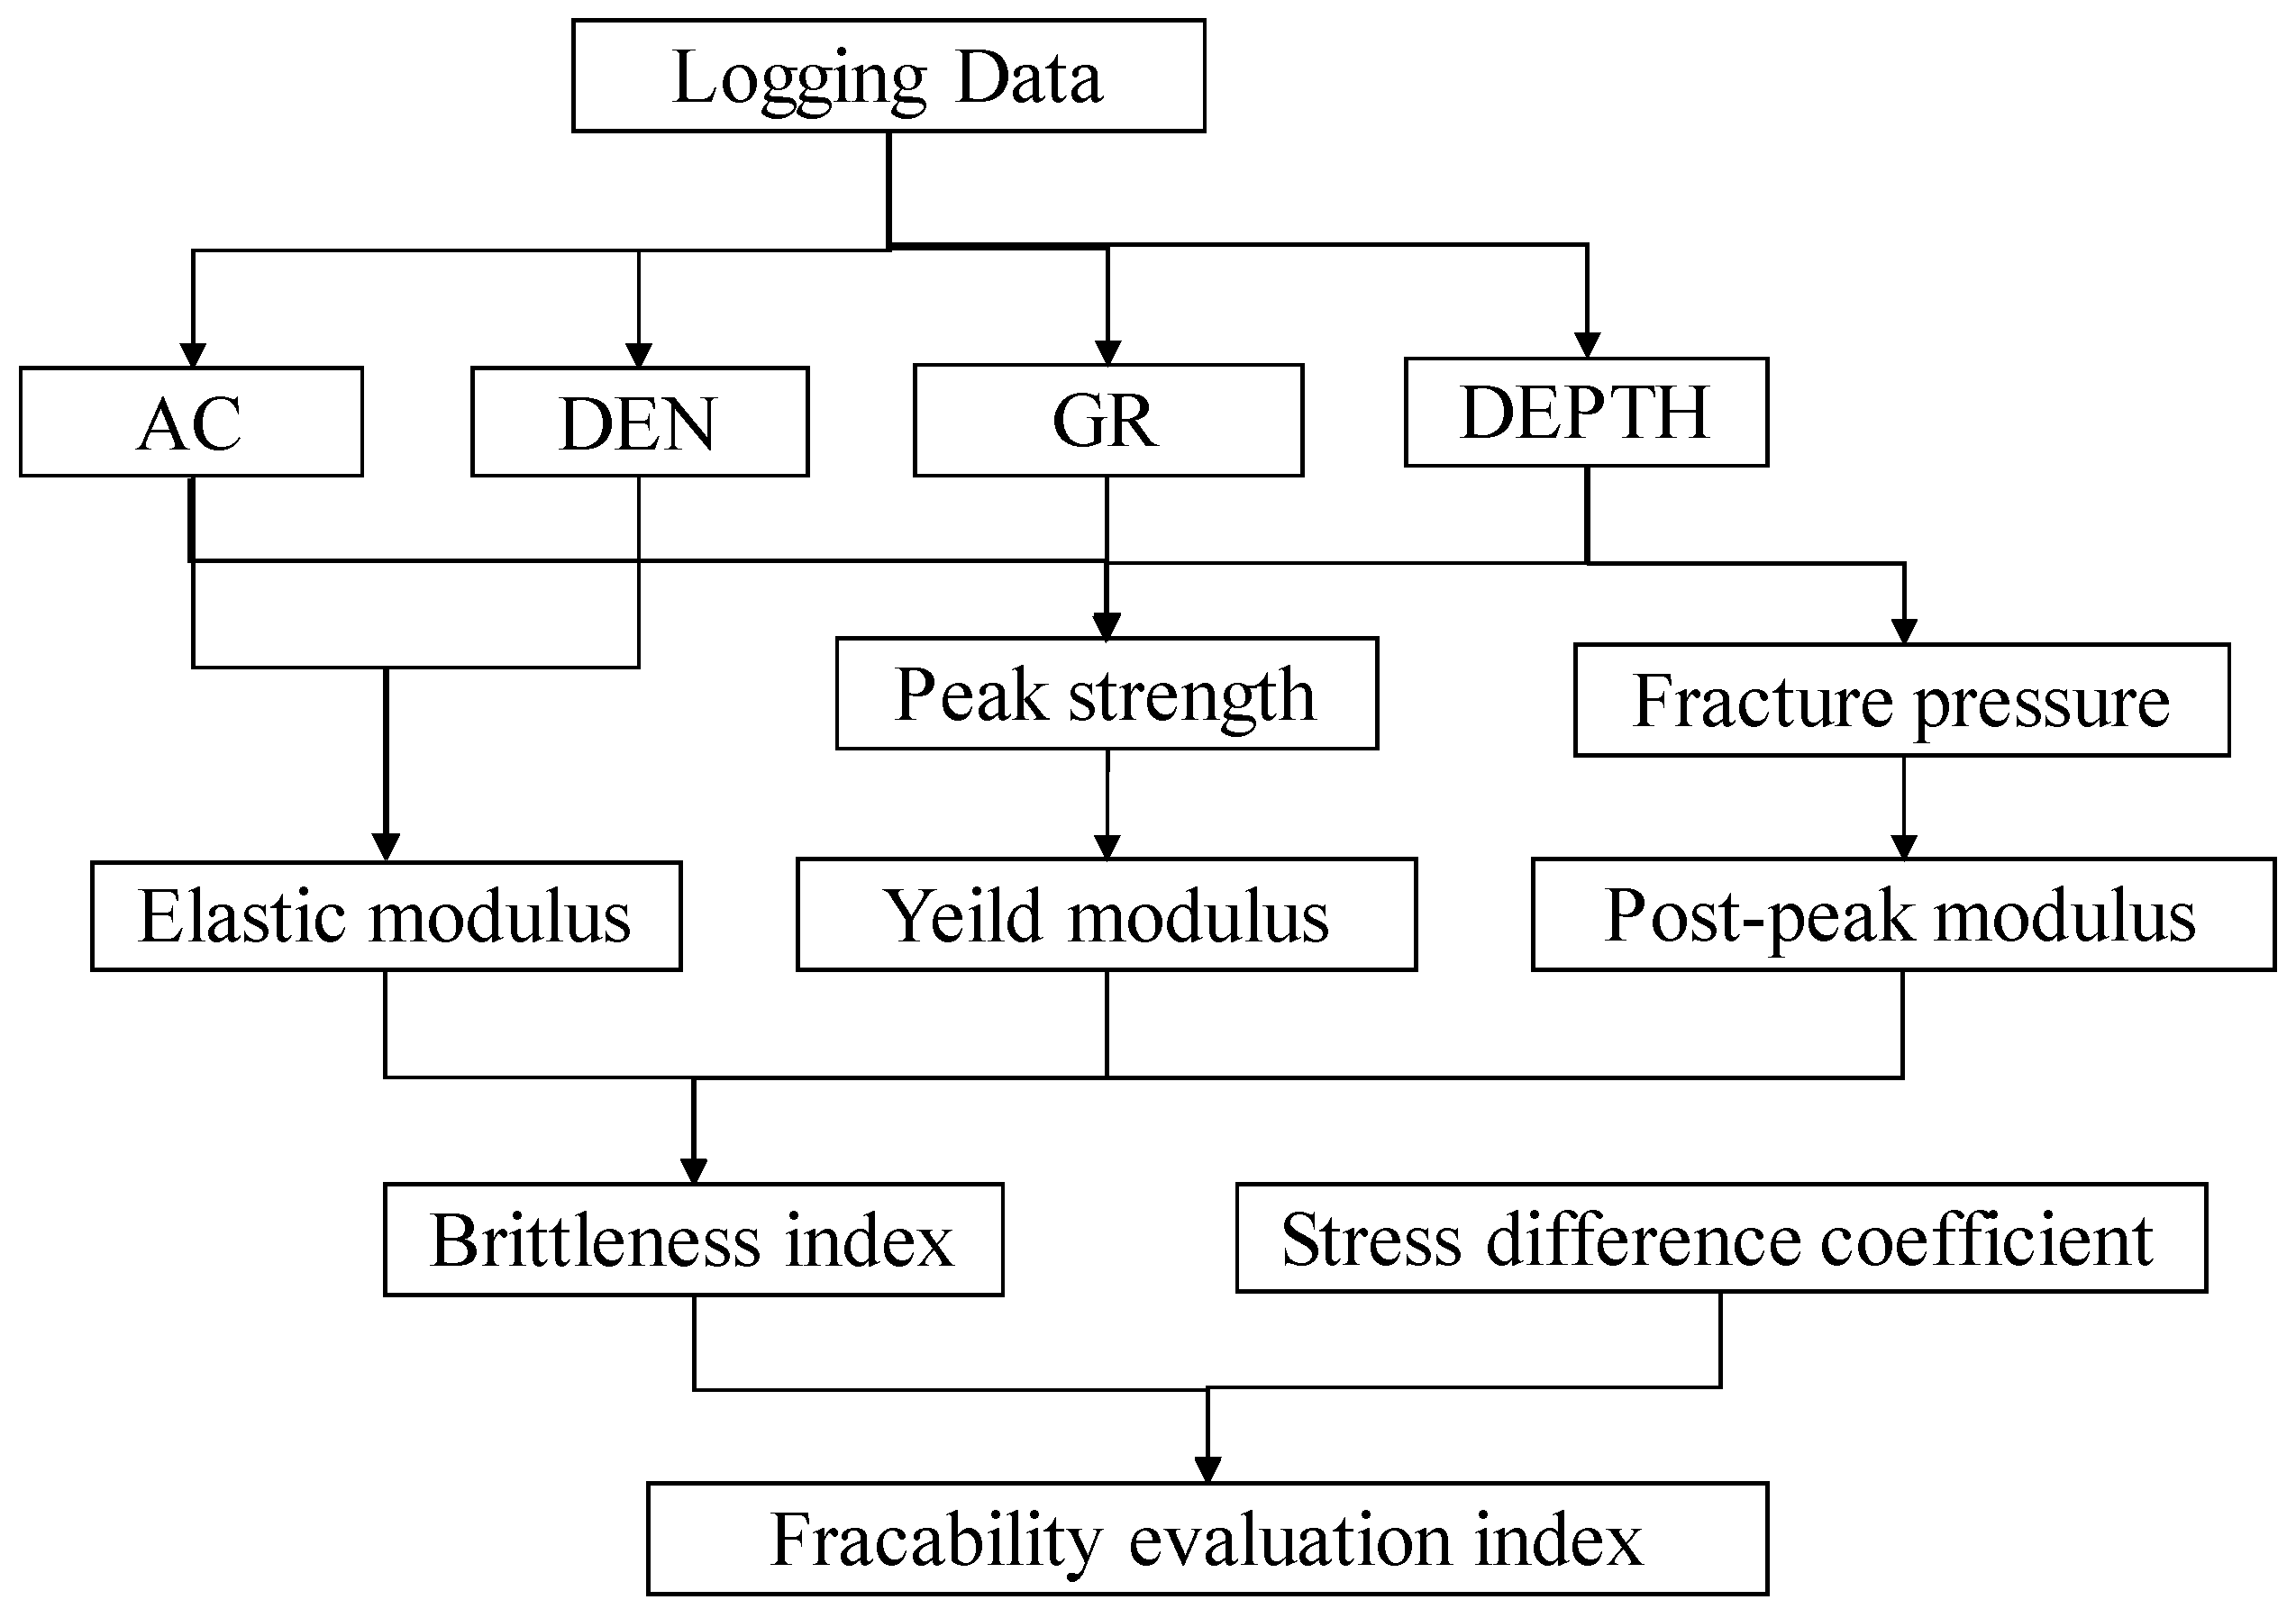
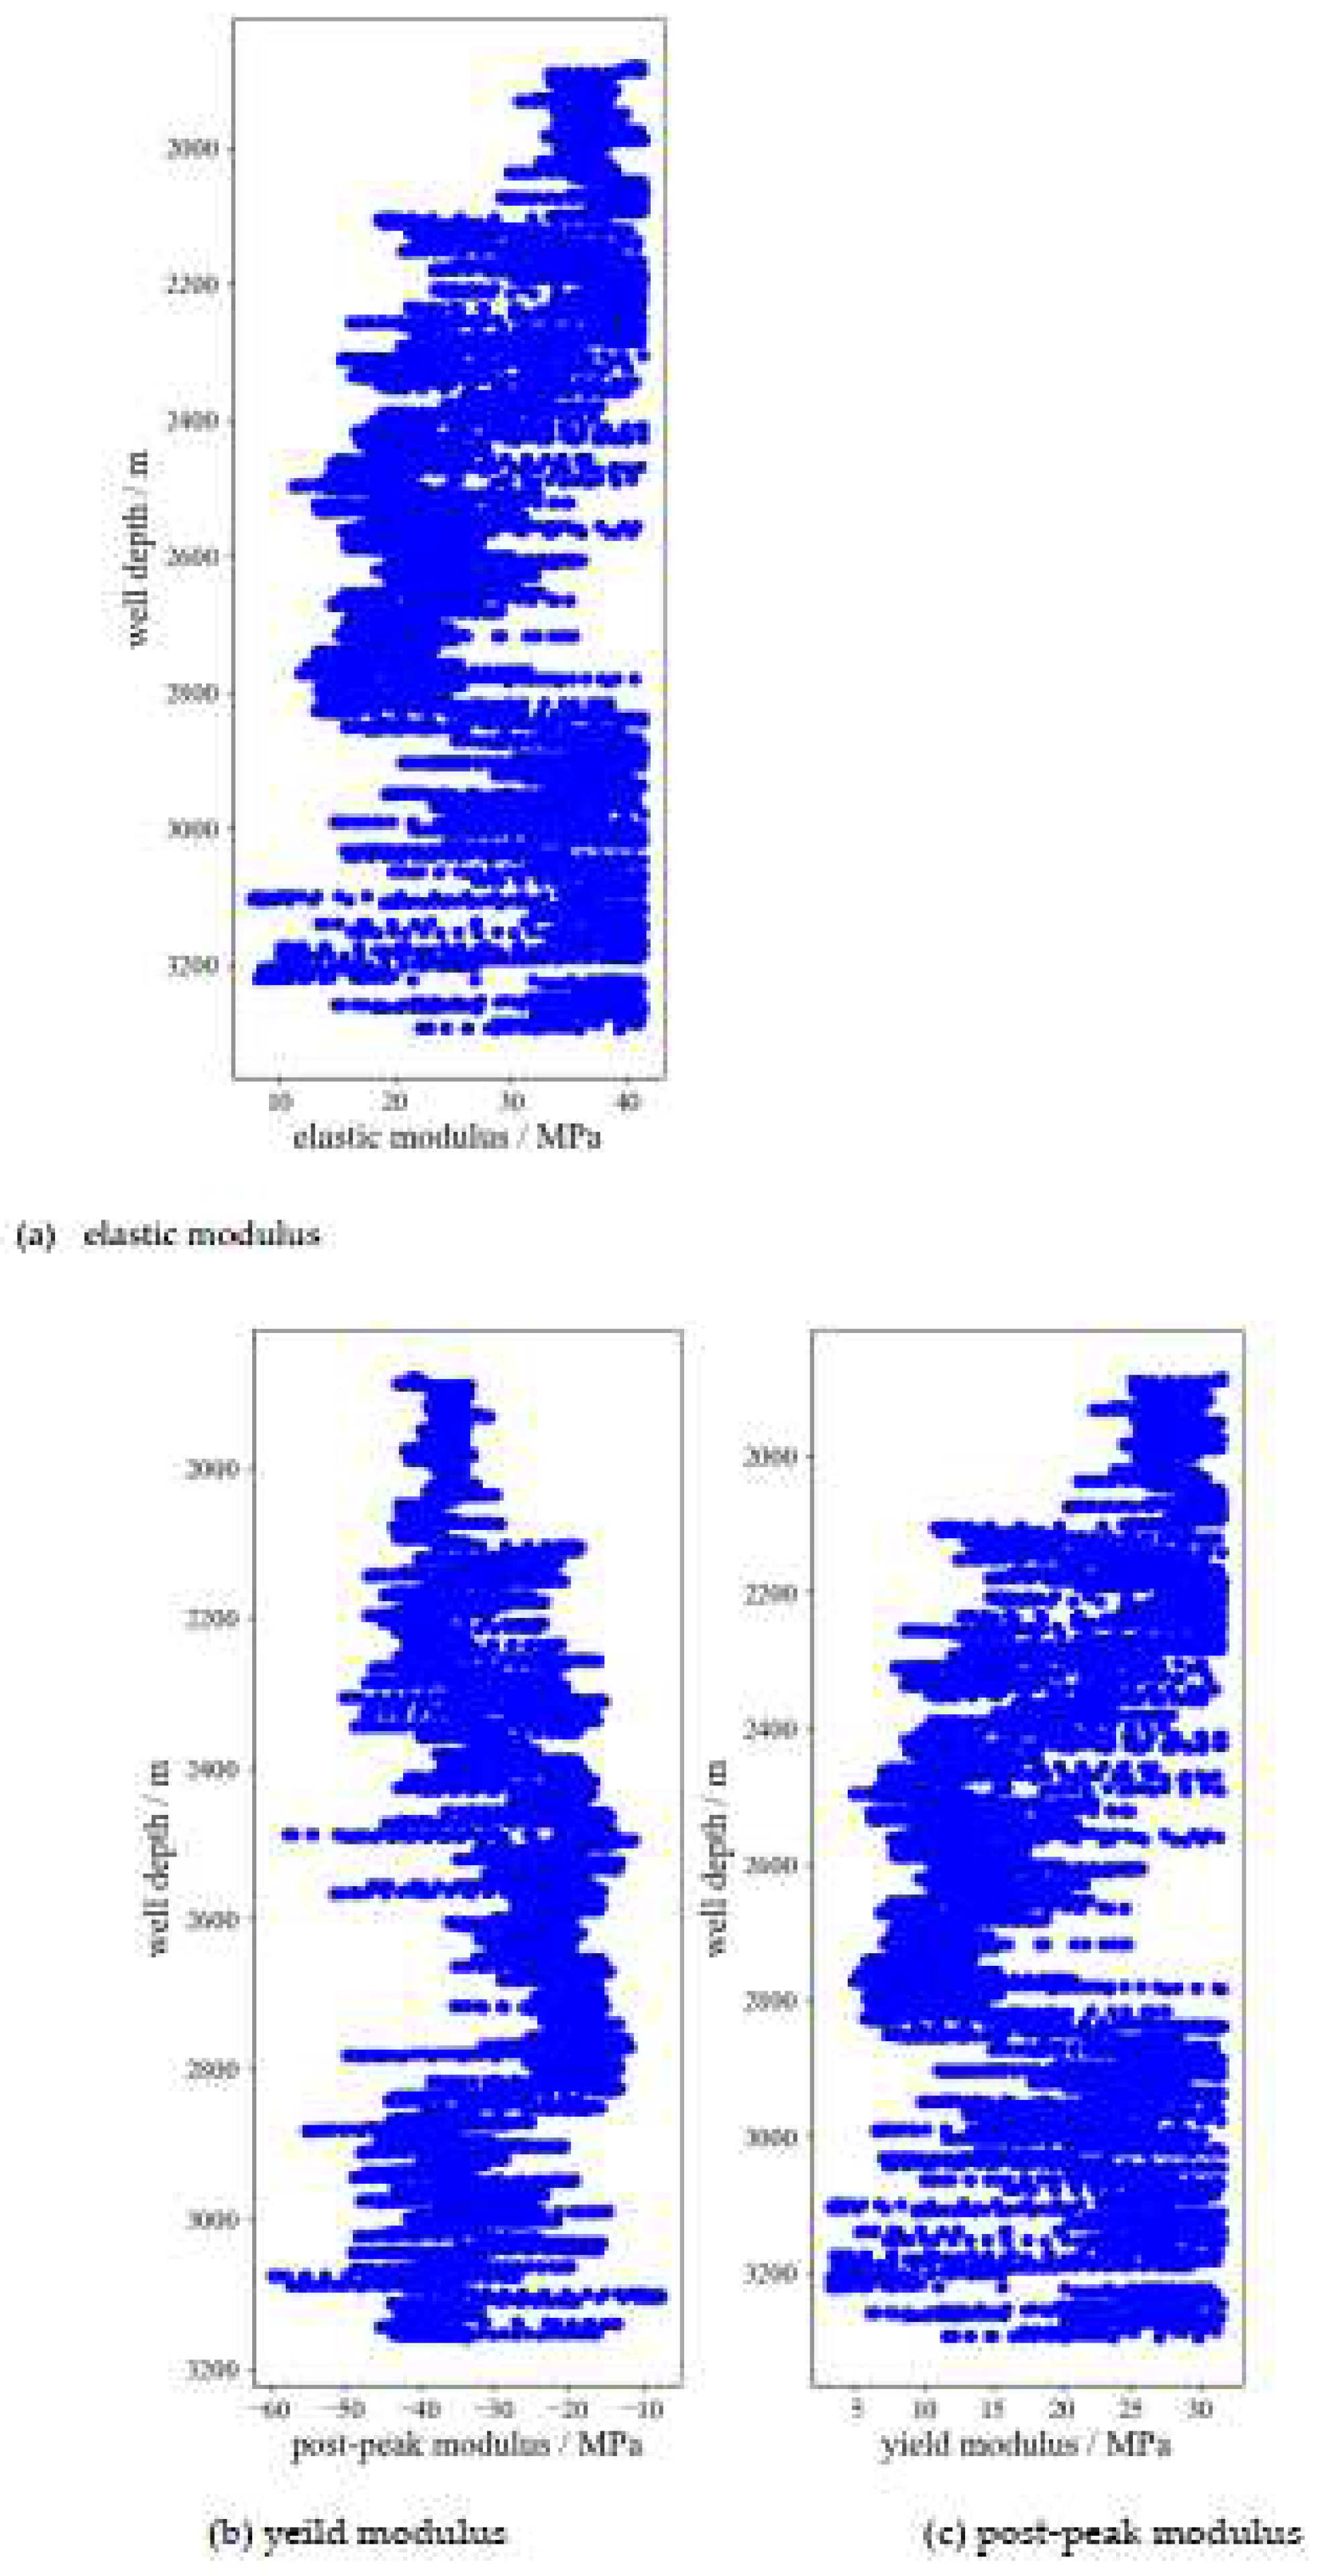
- As the depth of the reservoir increases, both the elastic modulus, yeild modulus and post-peak modulus decrease, resulting in a decrease in reservoir brittleness and fracability, which is more unfavorable for reservoir fracturing.
- (2)
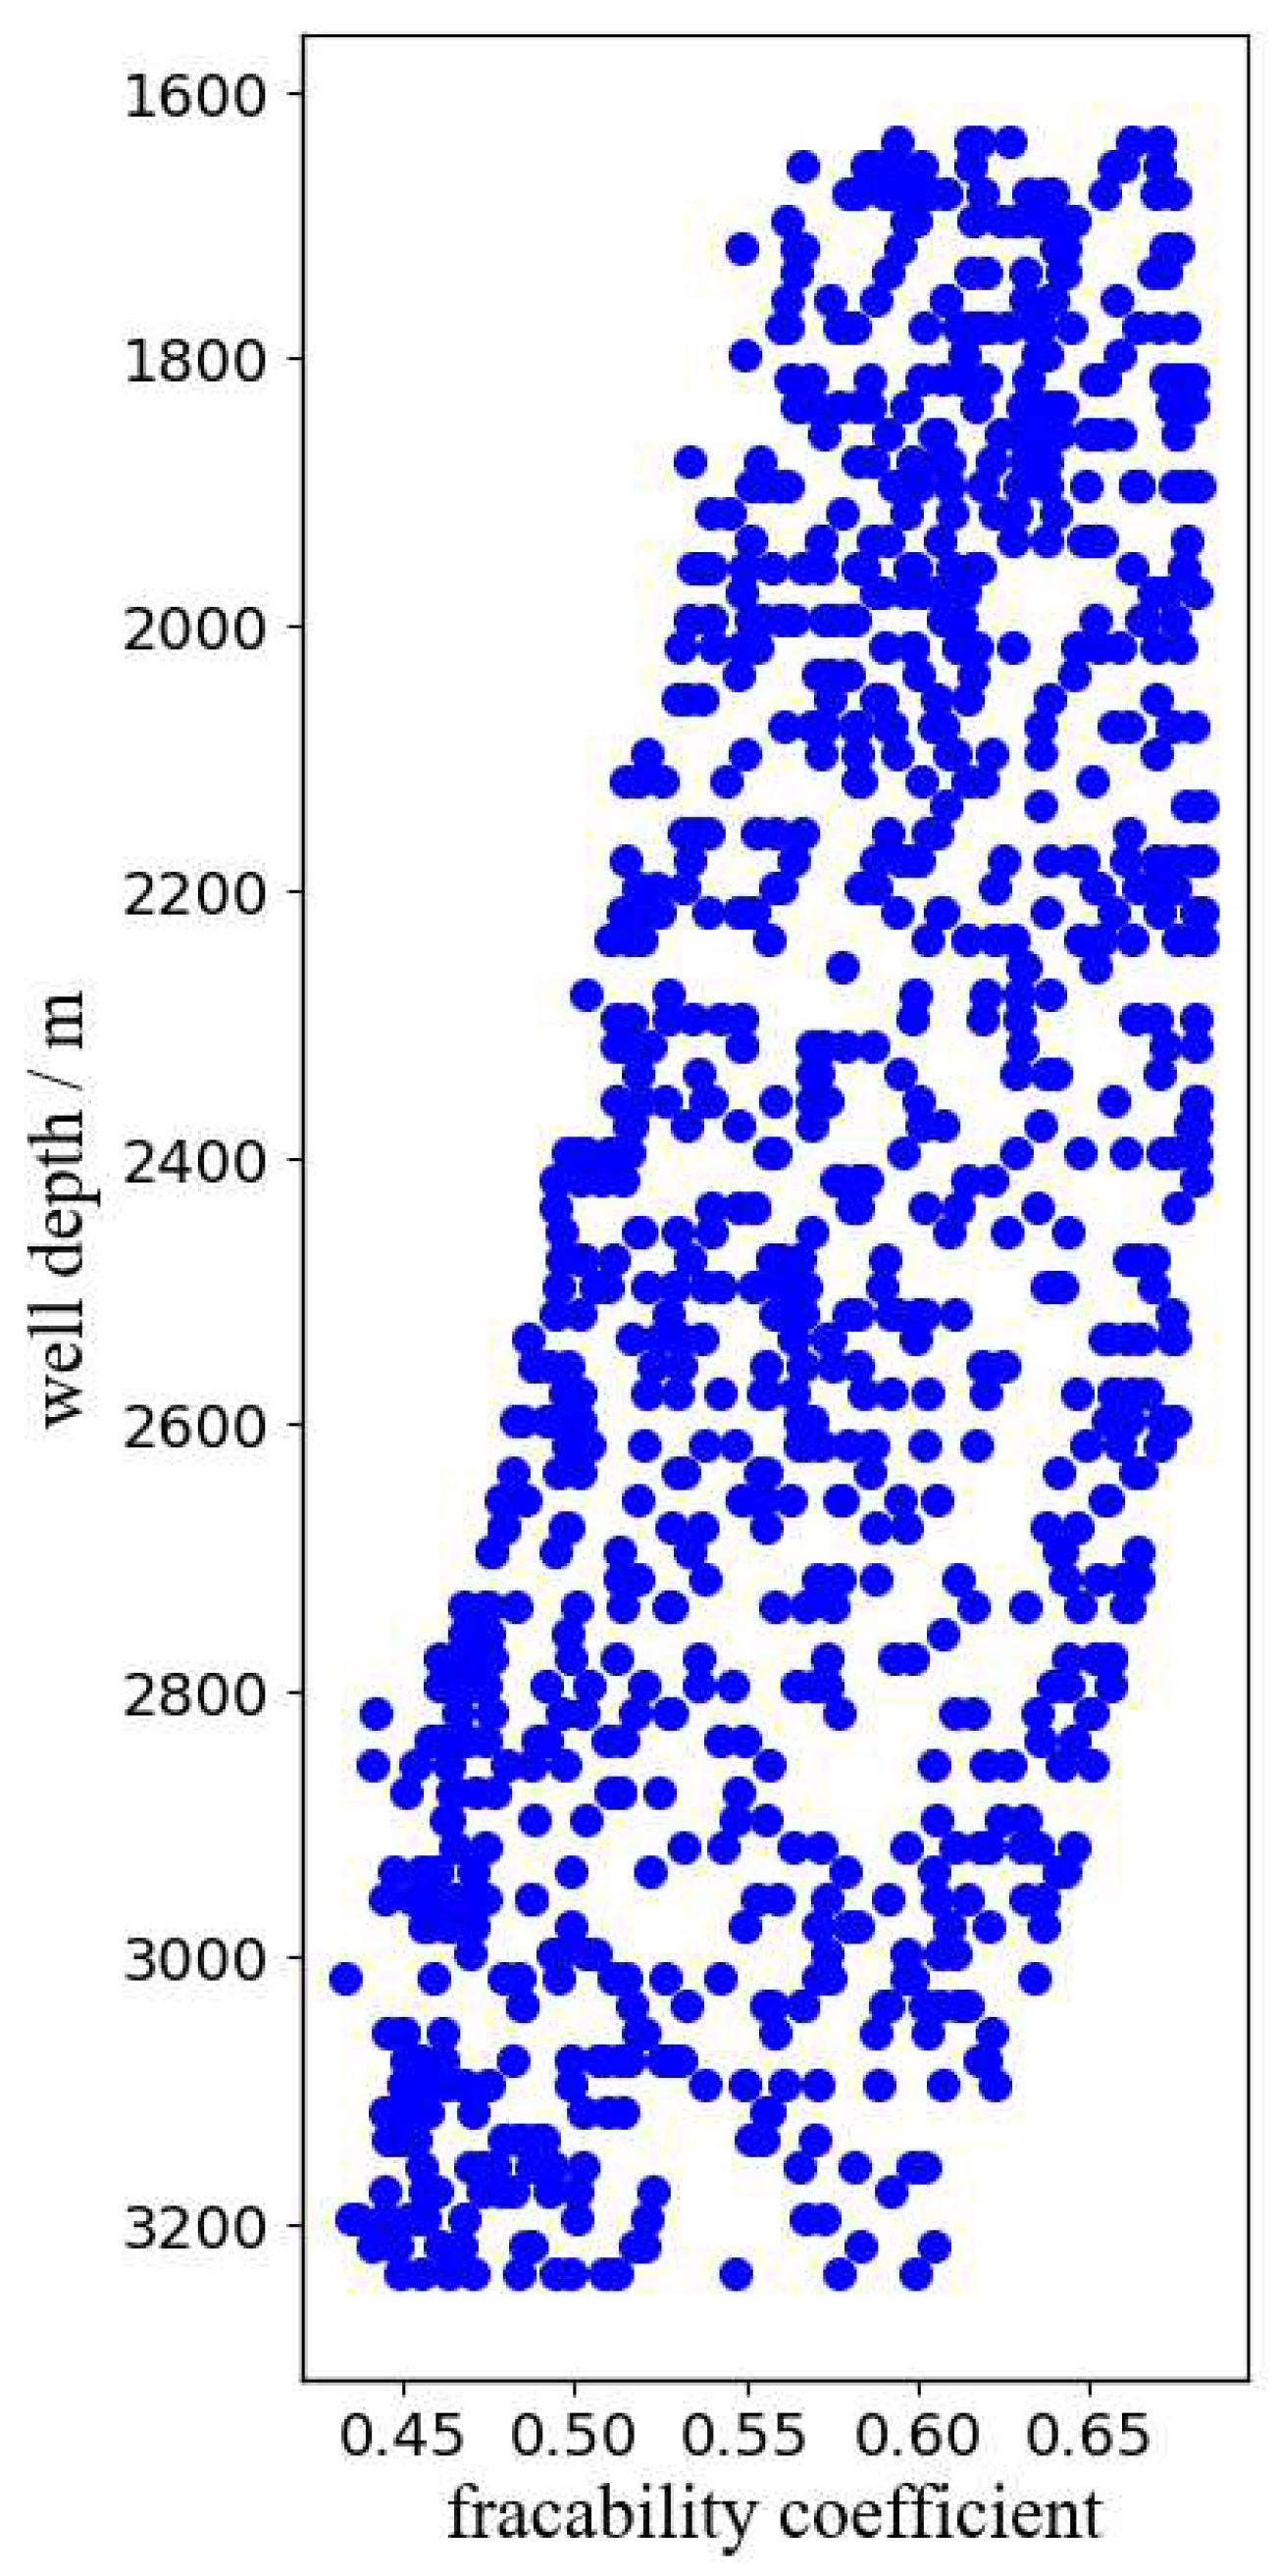
- As the depth increases, the fracability coefficient decreases, but the fracability coefficient of the reservoir is mainly concentrated between 0.45-0.65, indicating that the overall reservoir in this area has fracturing potential.
- (3)
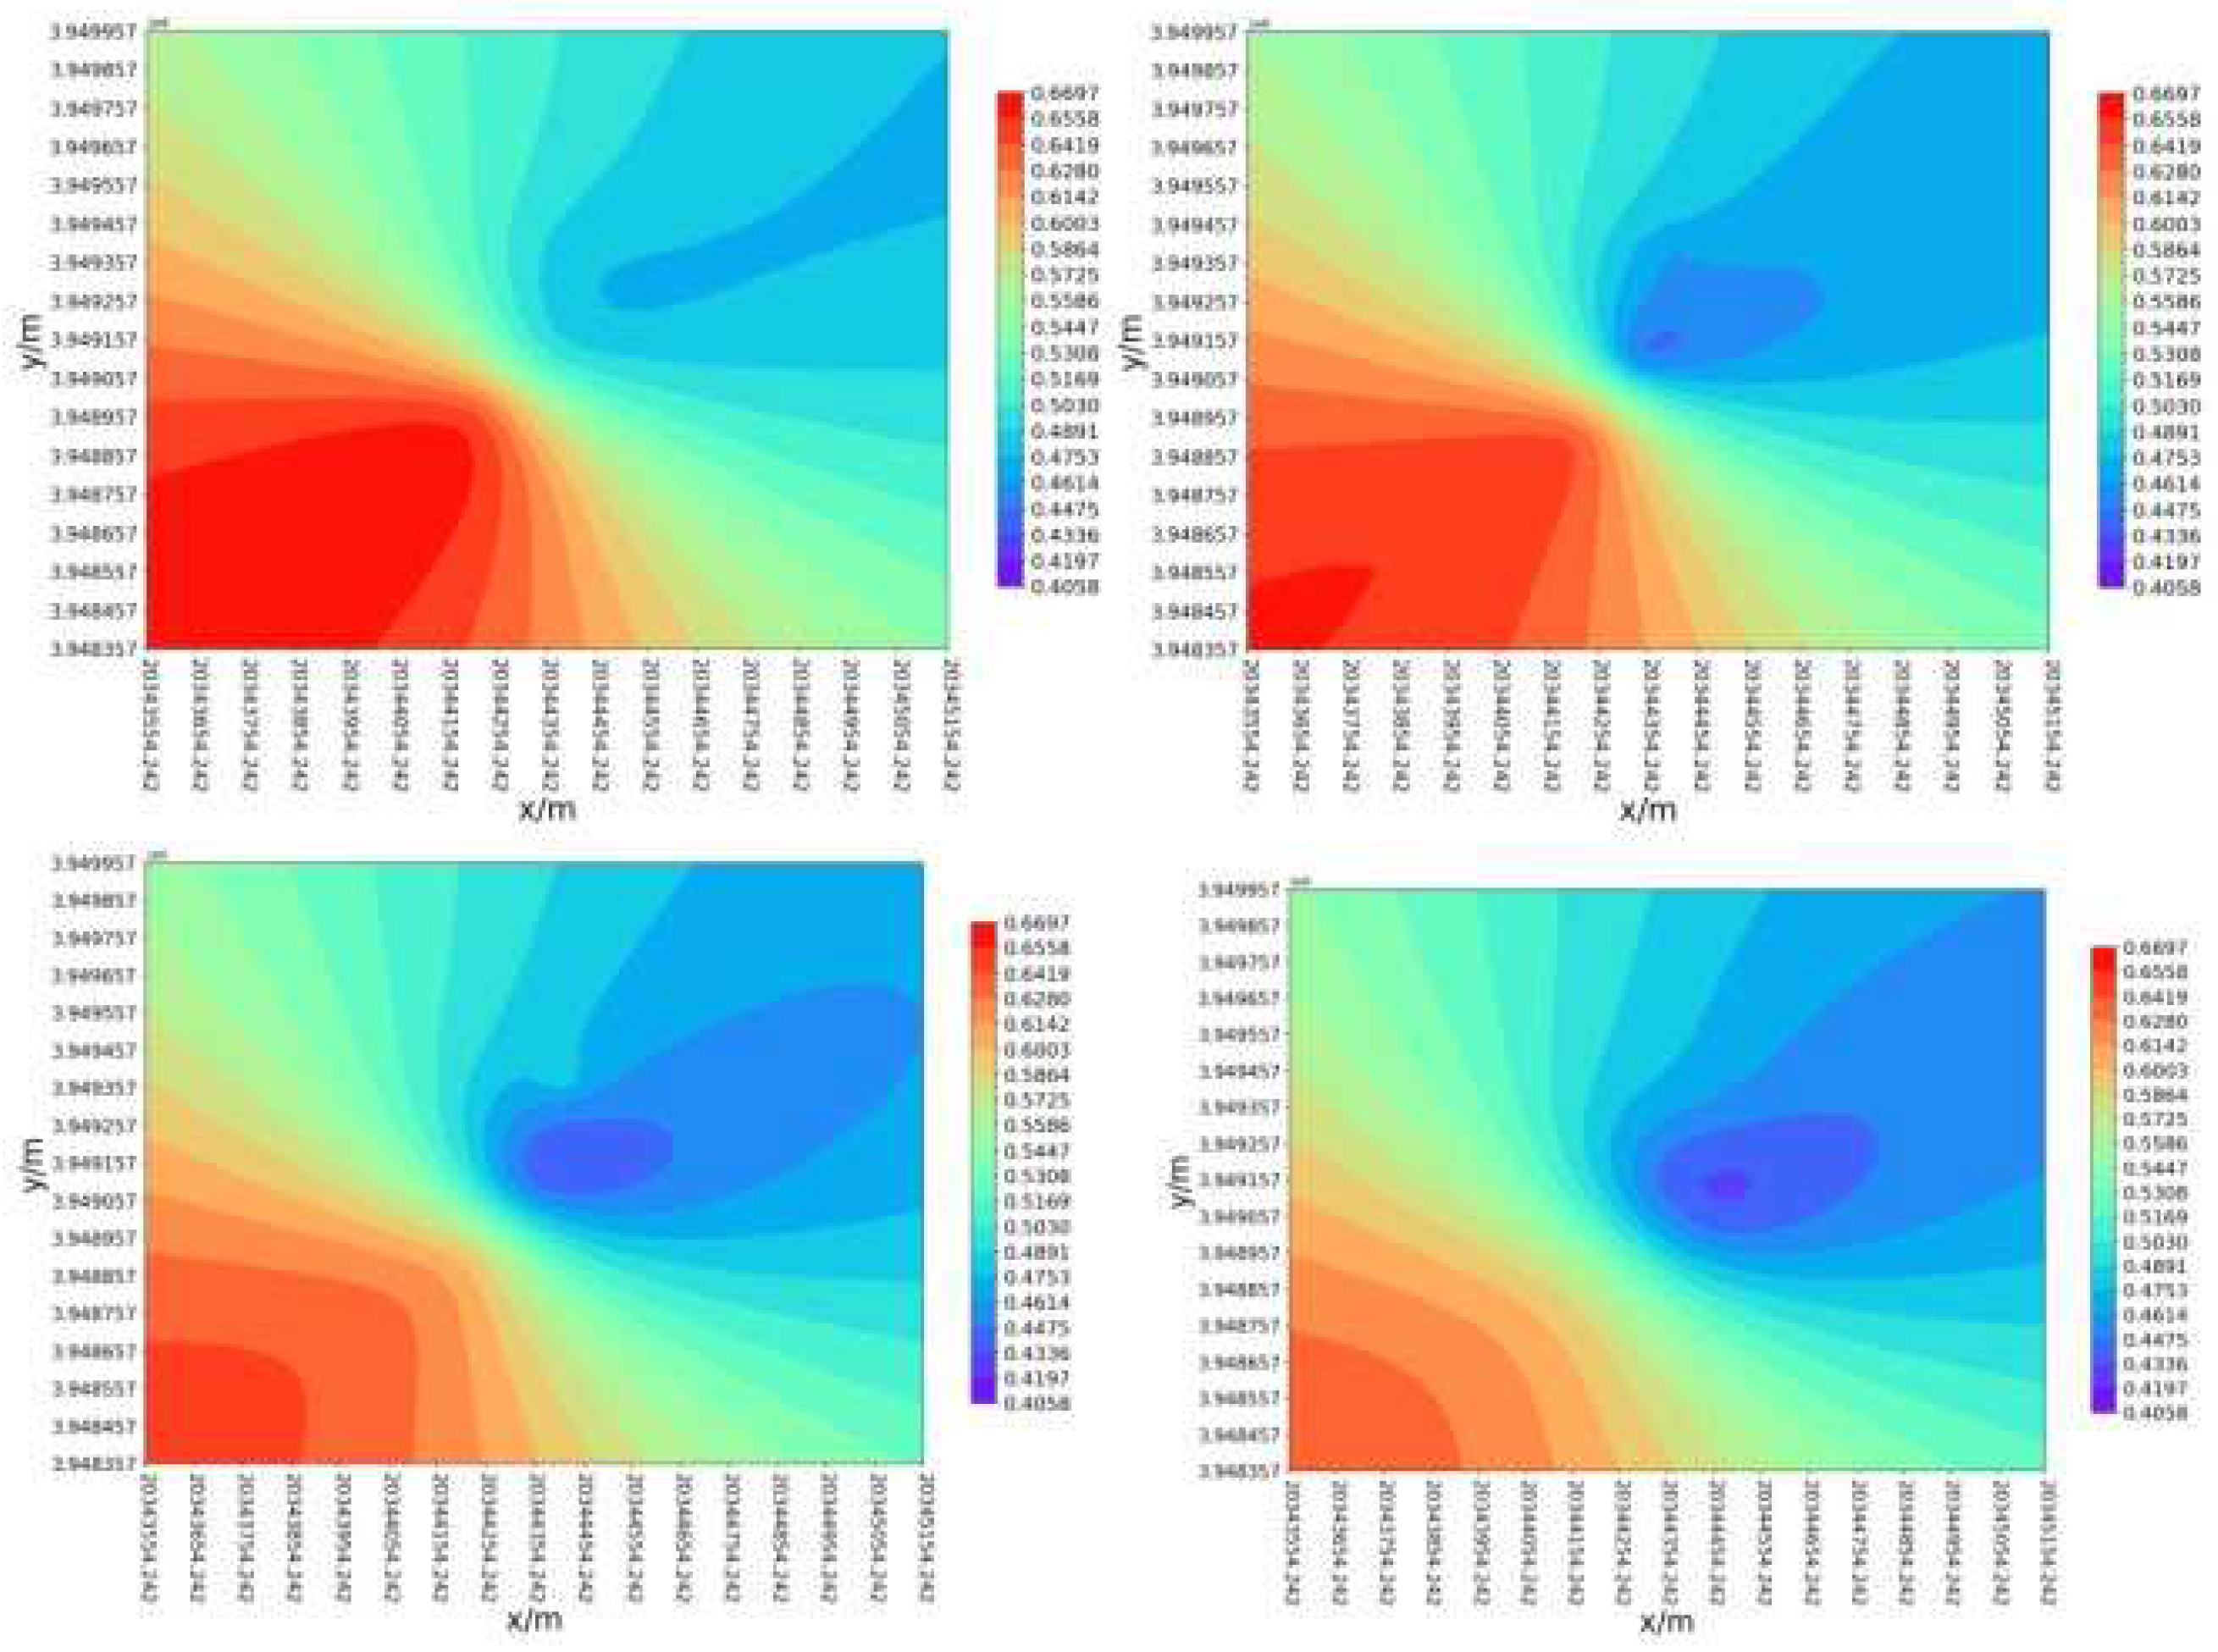
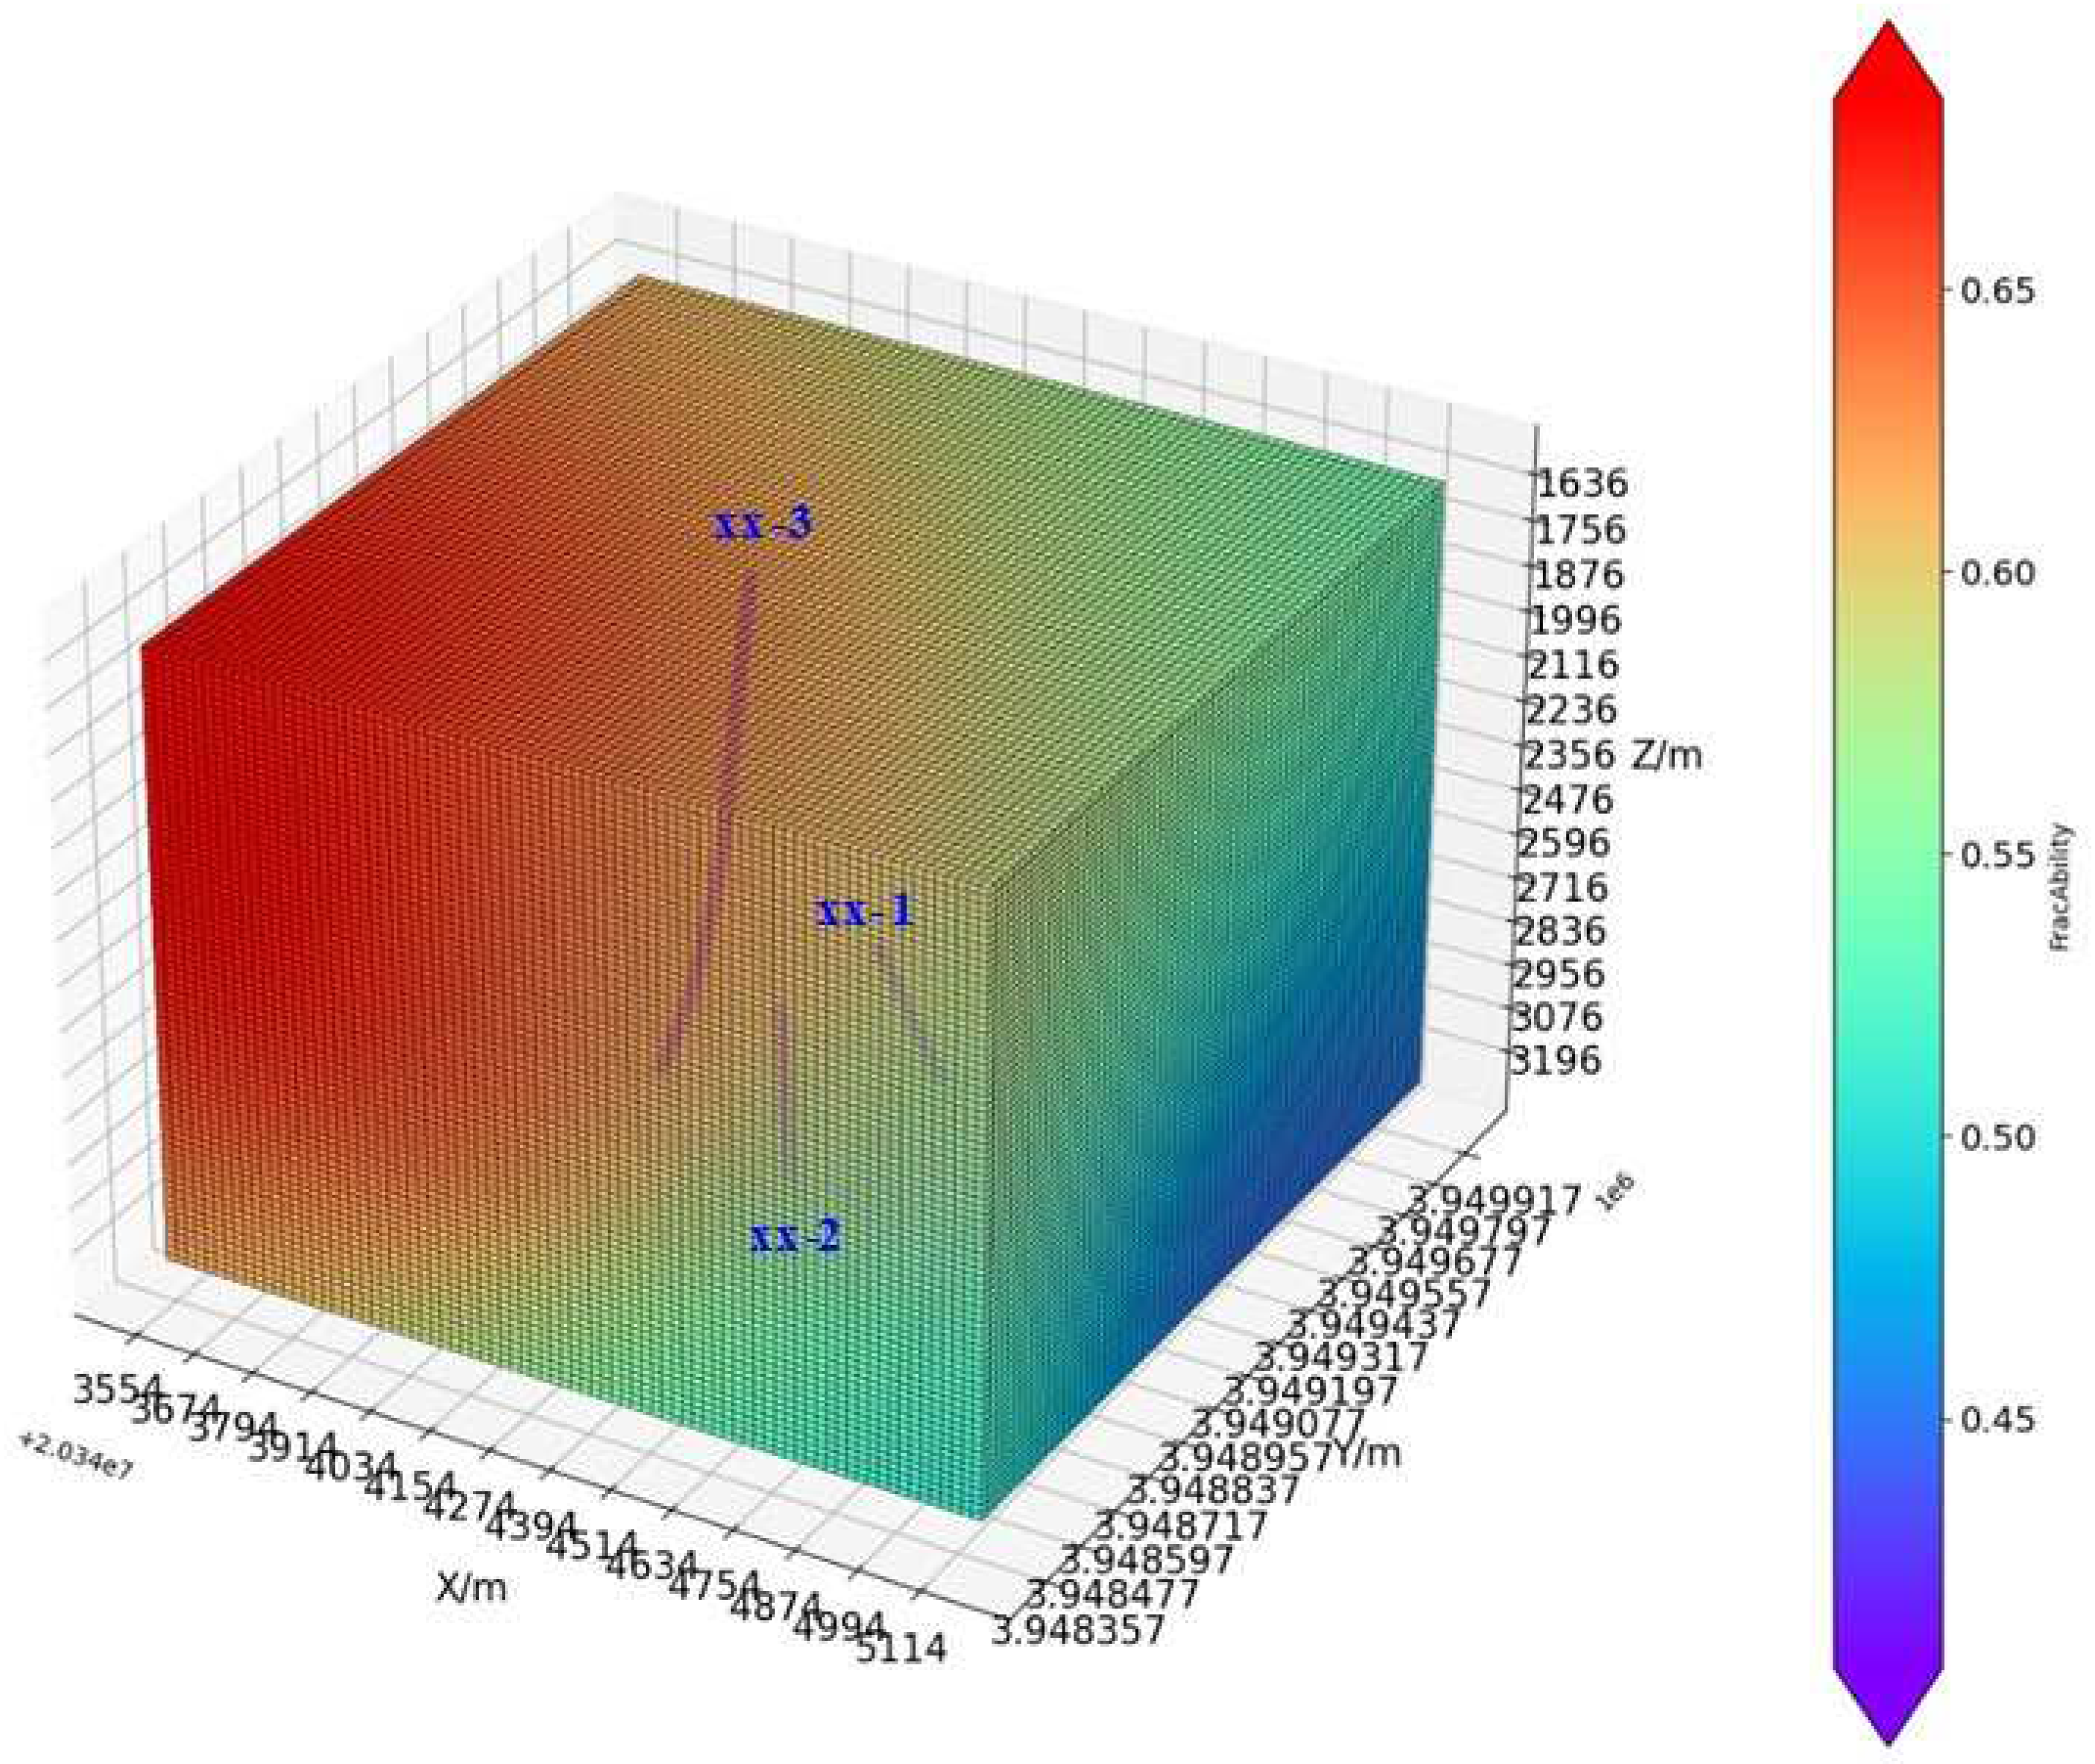
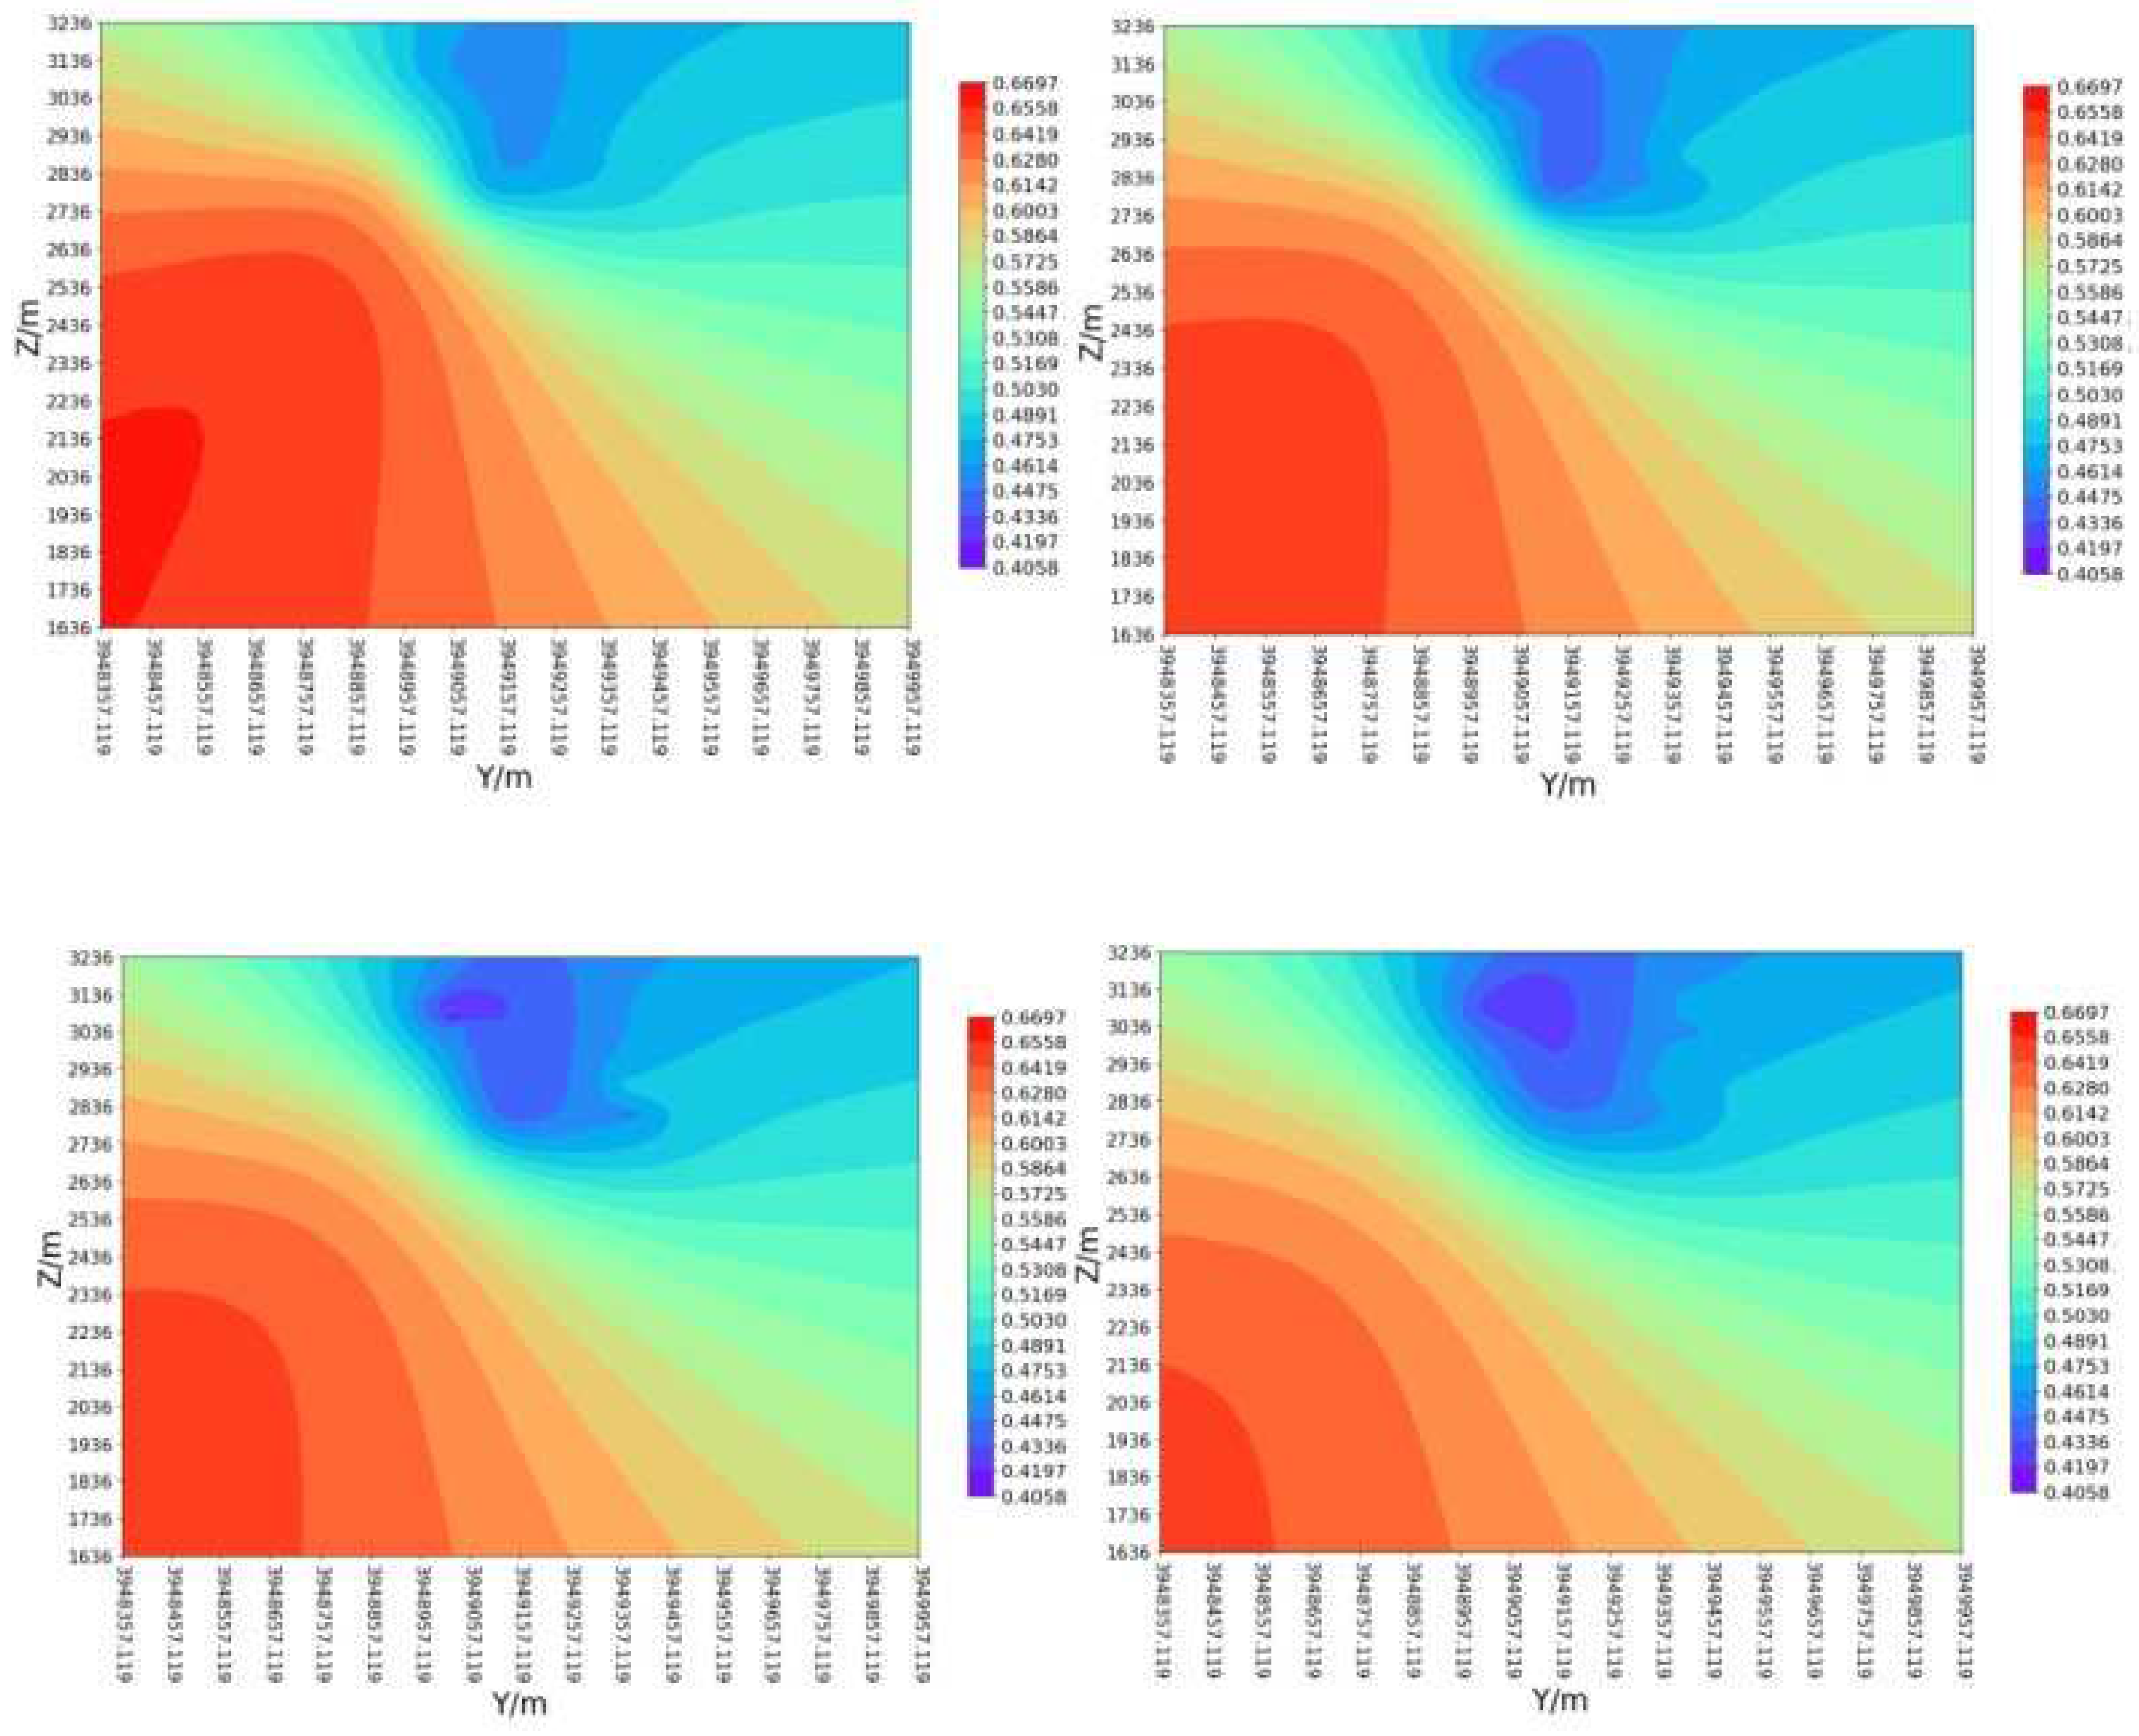
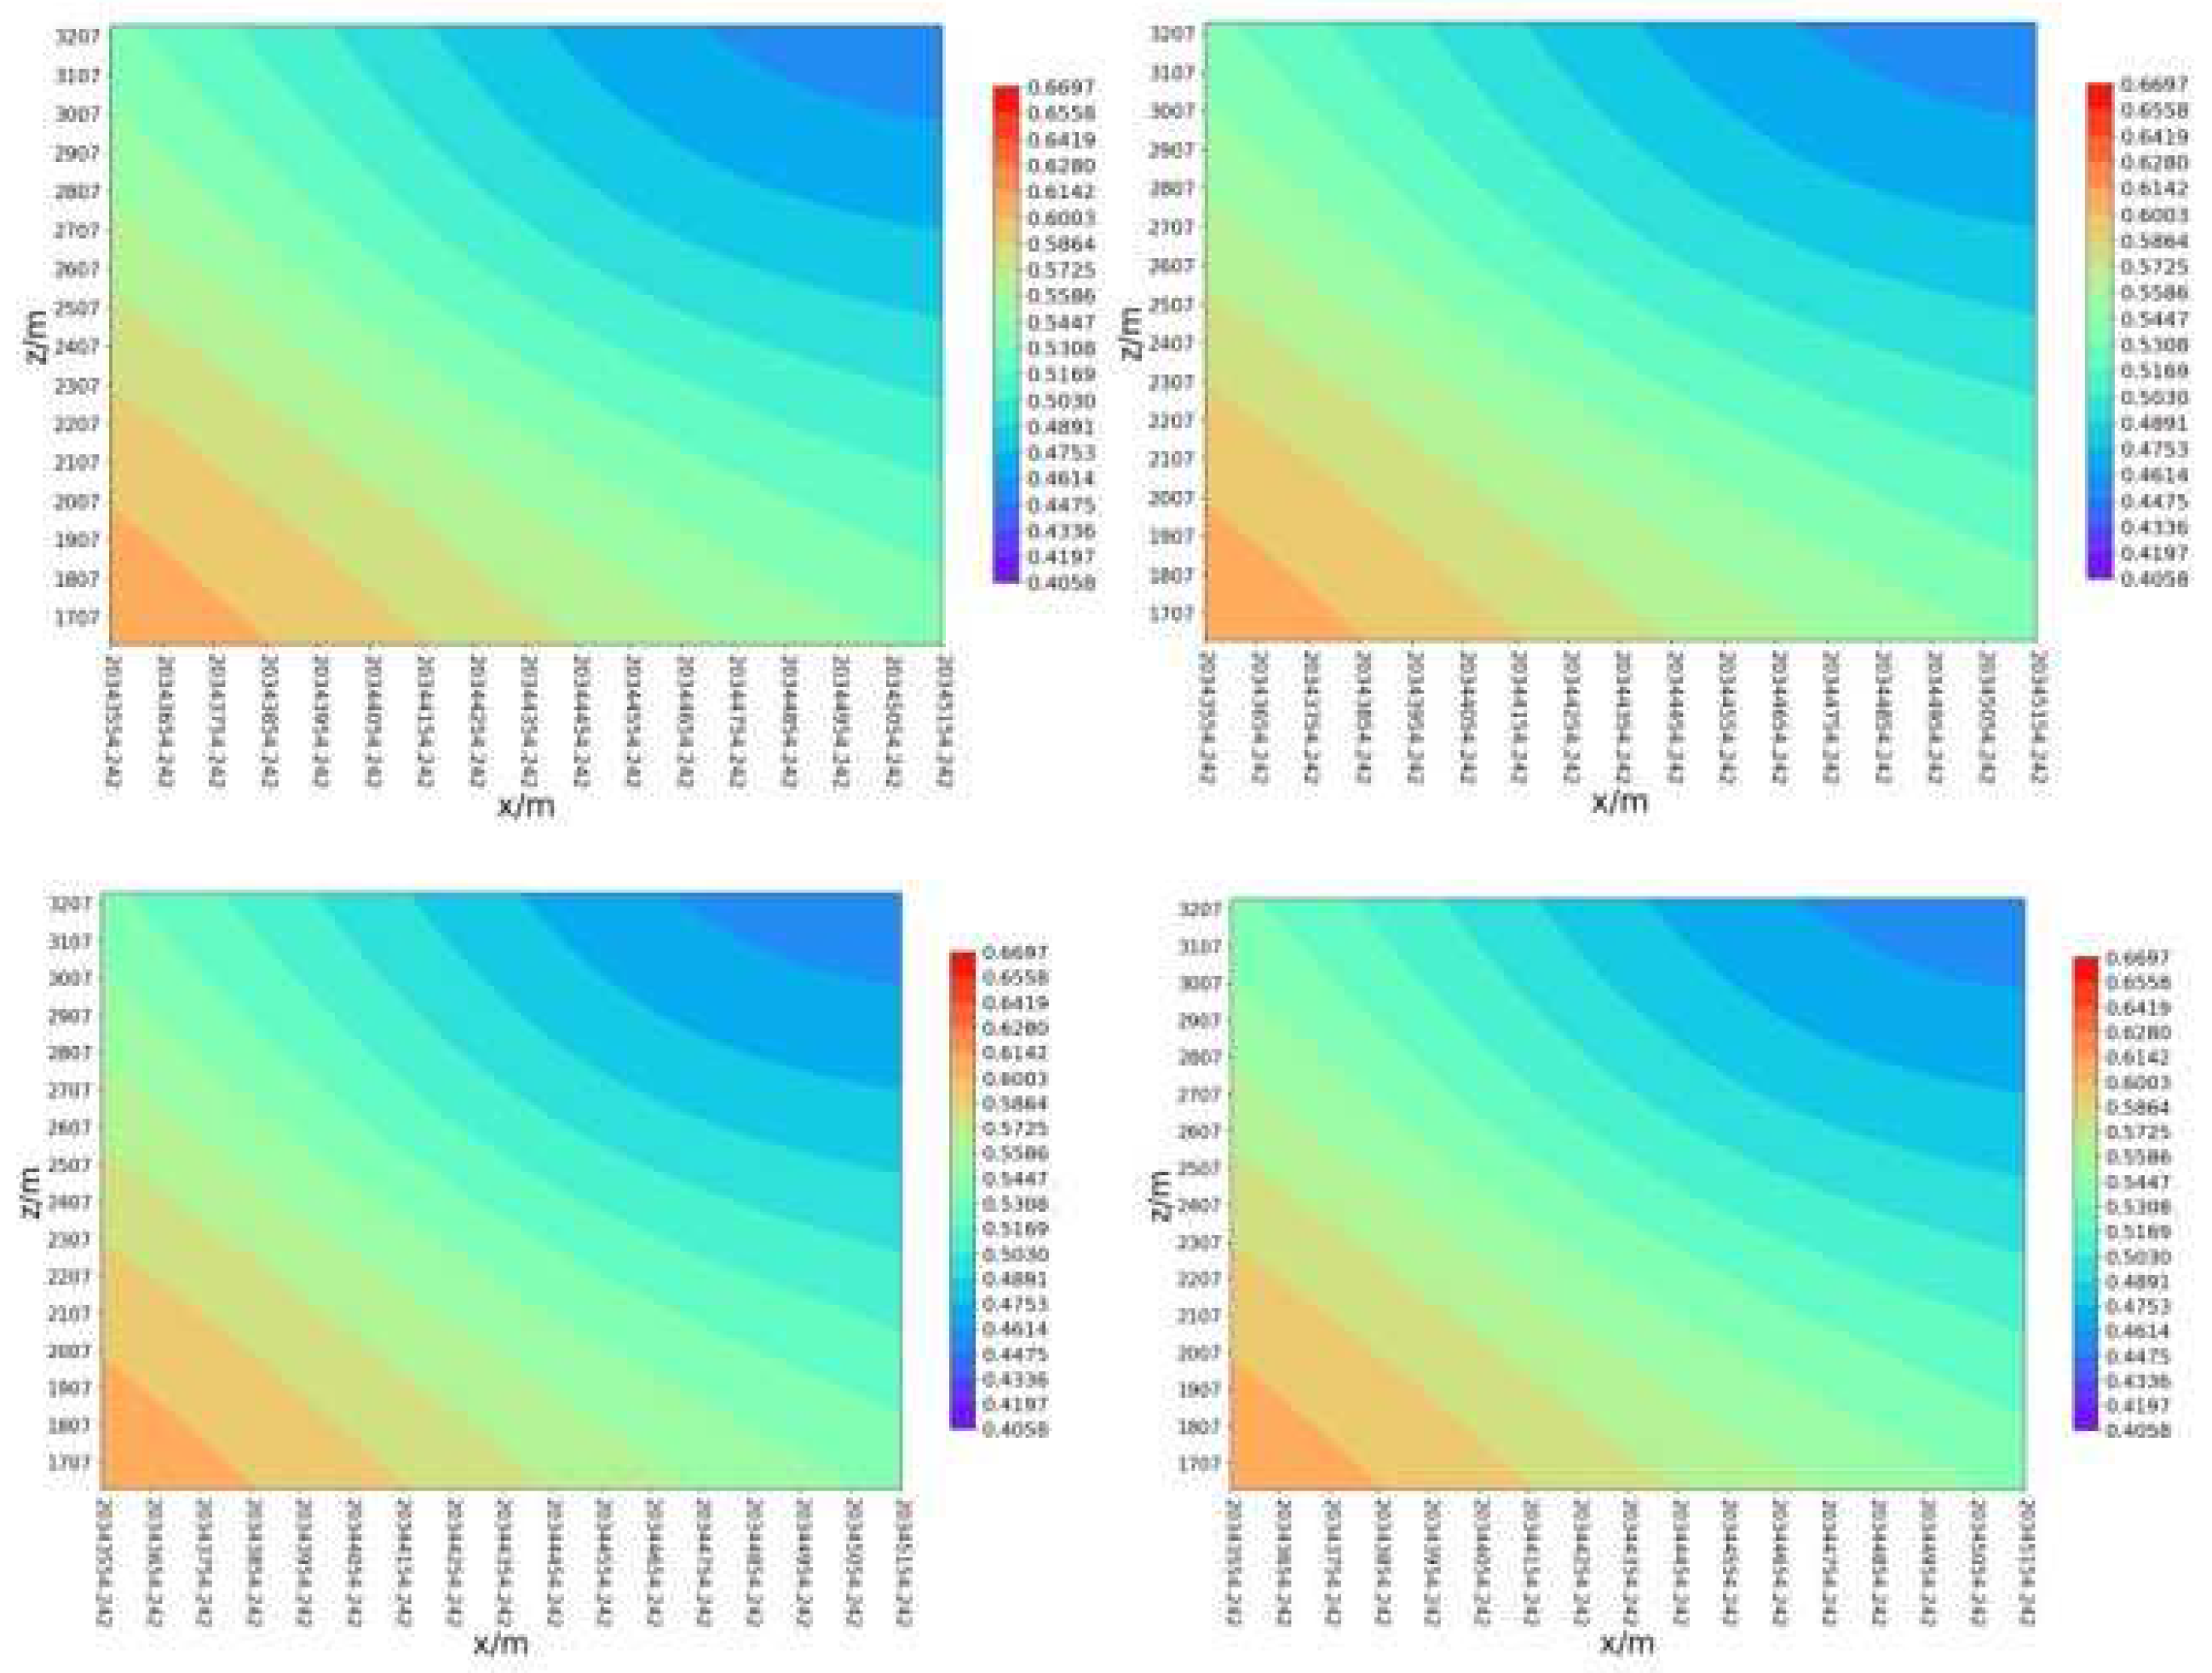
- By calculating the fracability coefficient under Kriging three-dimensional interpolation, it can be seen from the fracability contour map of the reservoir in the X, Y, and Z directions that fracability is uniform in the XZ plane, but non-uniform in the XY and YZ planes. As the X and Z values increase, fracability decreases.
- (4)
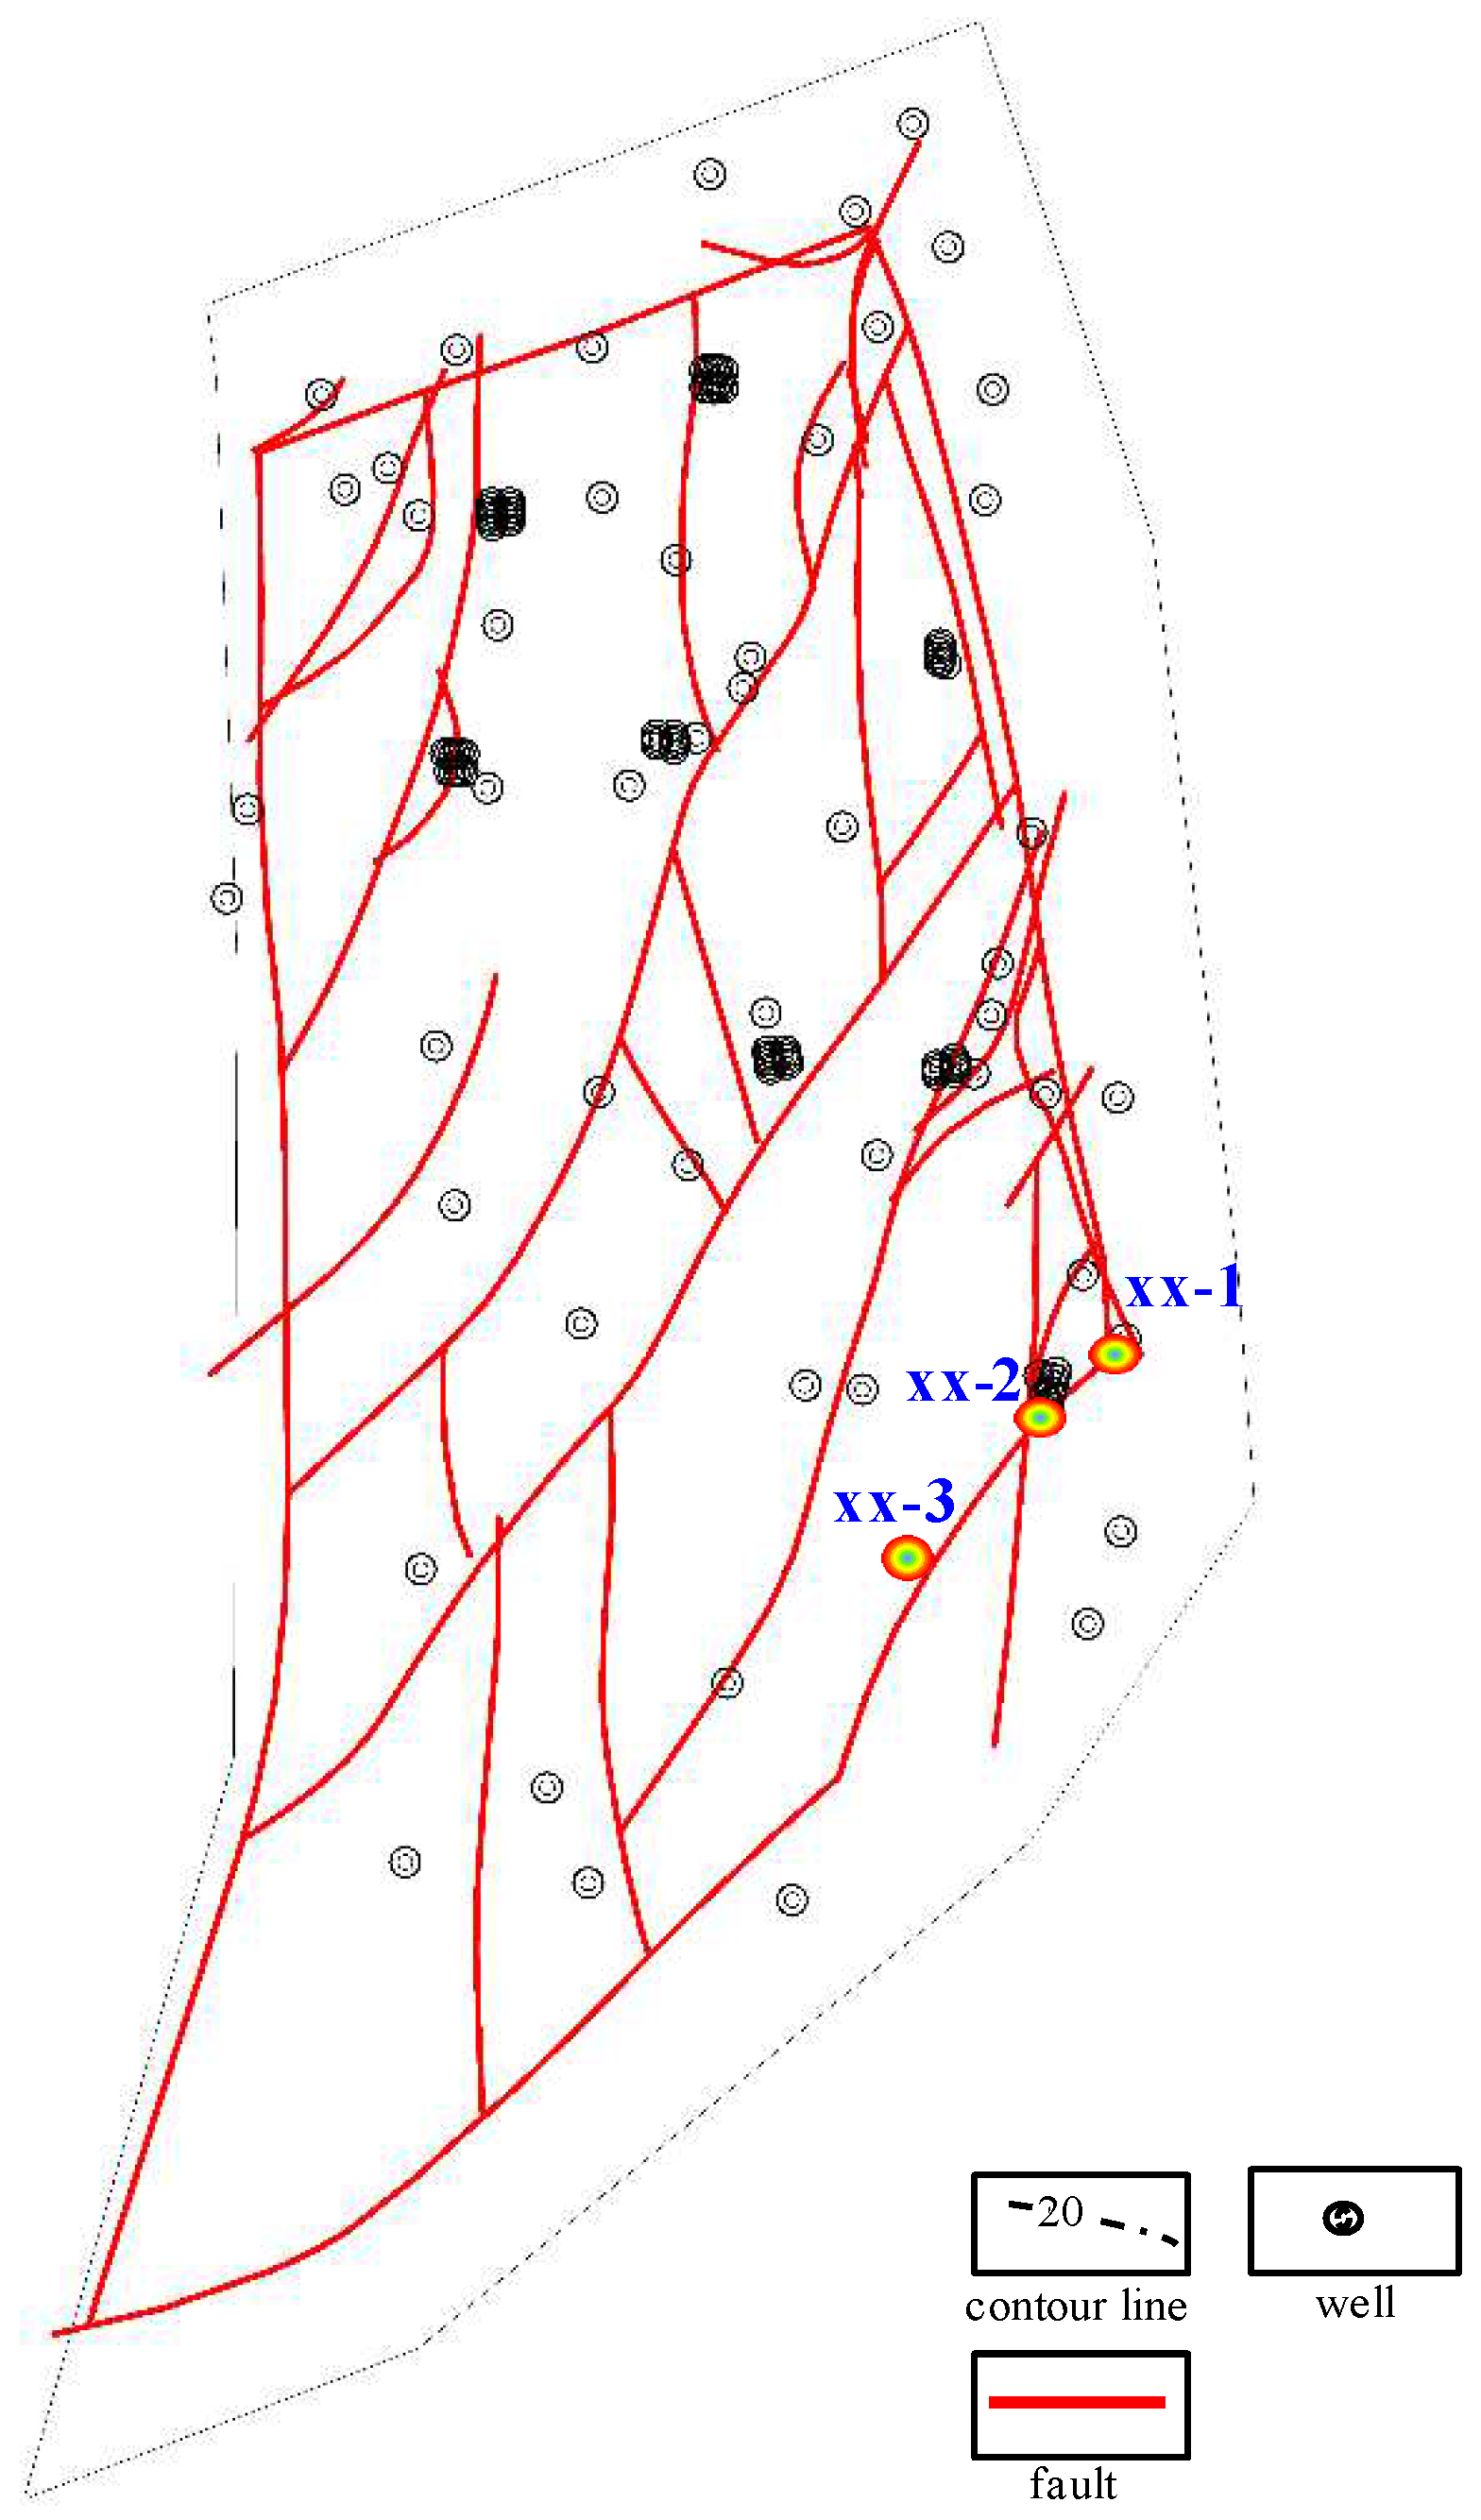
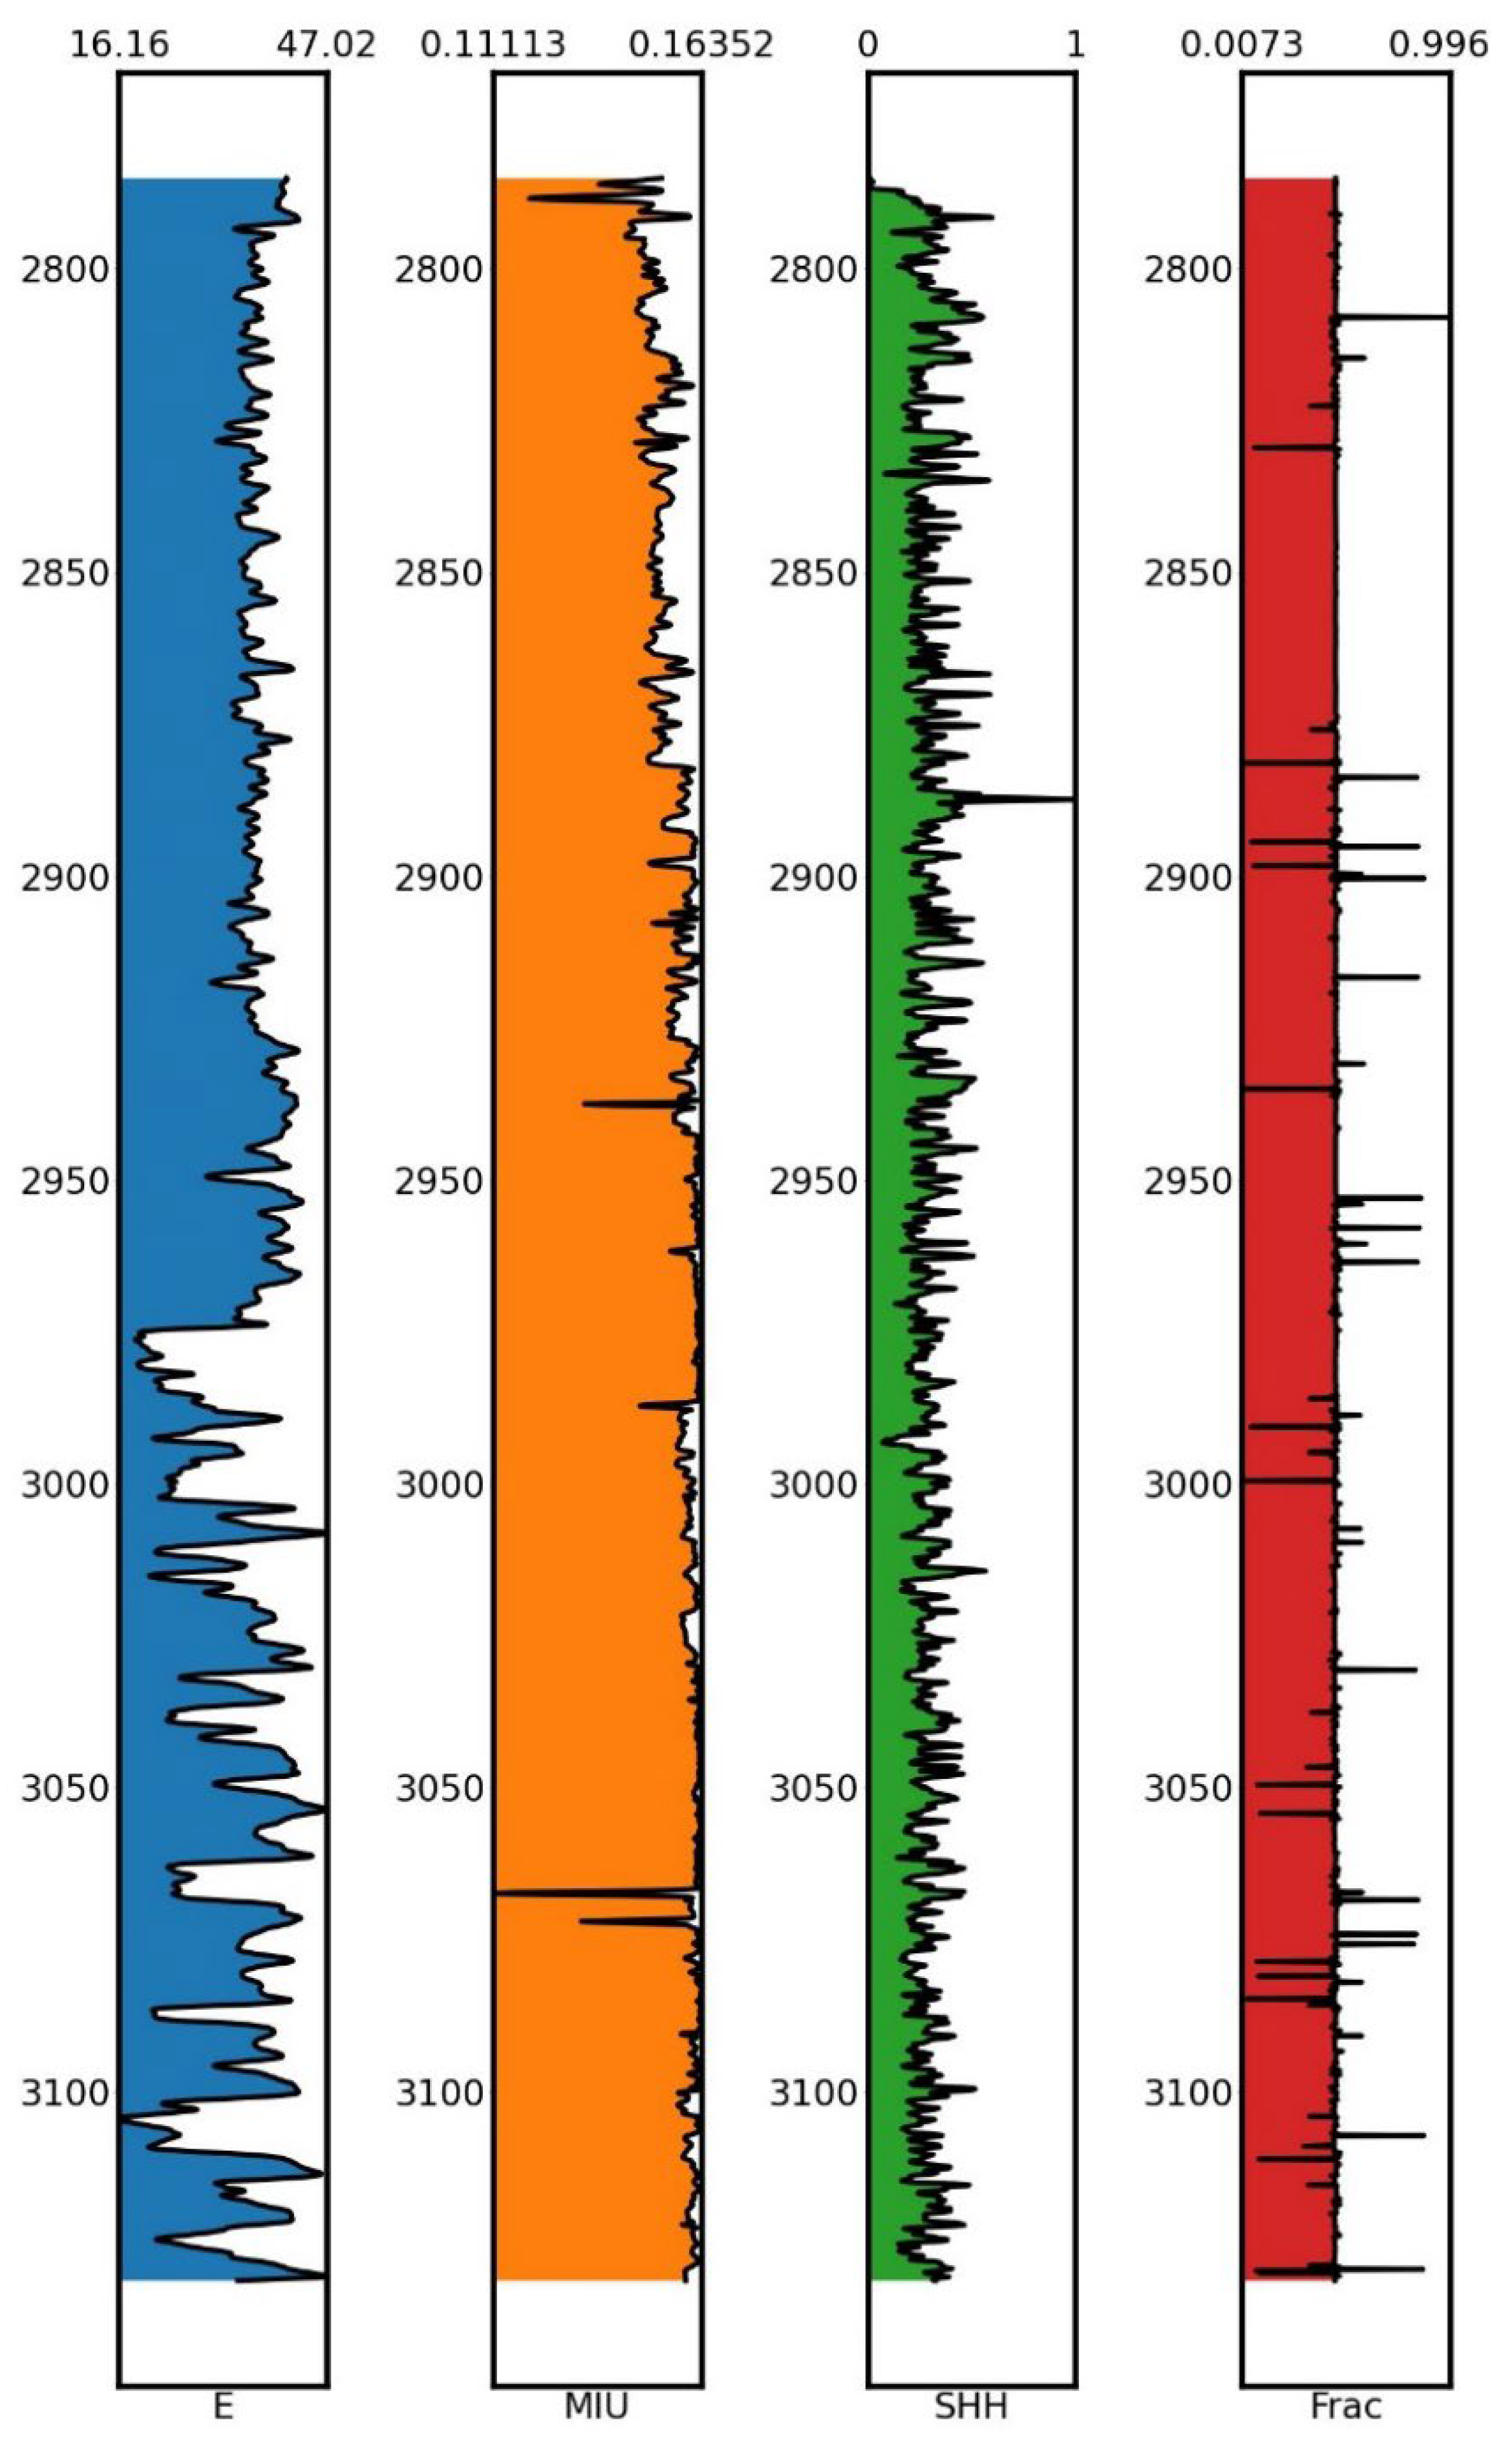
- Based on logging data and calculation of rock physical parameters related to the XX-2 well reservoir, it can be concluded that its elastic modulus is mainly distributed between 16.16 and 47.02, the Poisson's ratio is mainly concentrated between 0.11113 and 0.16325, the mud content is mainly concentrated between 0.01809 and 0.32435, and the fracability index is mainly distributed around 0.45.
References
- Grieser, W.; Bray J. Identification of production potential in unconventional reservoirs. SPE 106623, 2007. [CrossRef]
- Rickman R.; Mullen M.; Petre, E.; Grieser, B.; Kundertet, D. A practical use of shale petrophysics for stimulation design optimization:all shale plays are not clones of the Barnett Shale. SPE 115258, 2008. [CrossRef]
- Alassi, H.; Holt, R.; Nes, O,; Pradhan, S. Realistic geomechanica l modeling of hydraulic fracturing in fractured reservoir rock. SPE 149375, 2011. [CrossRef]
- Kias, E.; Maharidge, R.; Hurt, R.; Pollastro, R. Mechanical versus mineralogical brittleness indices across various shale plays. SPE 174781, 2015.
- Jarvie, D.; HillR, J.; Ruble, T.; Pollastro, R. Unconventional shale-gassystems: The Mississippian Barnett Shale of north-centralTexasasone model for thermogenic shale-gas assessment. AAPG Bullet in, 2007, 91(4): 475-499. [CrossRef]
- Rickman, R.; Mullen, M.; Petre, J.; Grieser, B.; Kundert, D. Apractical use of shale petrophysics for stimulation design opti-mization: all shale plays are not clones of the Barnett Shale//SPE Technical Conference and Exhibition. Society of Petroleum Engineers, Colorado, USA, 2008, SPE 115258.
- Luan, X.; Di, B.; Wei, J.; Li, X.; Qian, K.; Xie, J.; Ding, P. Laboratory Measurements of brittleness anisotropy in synthetic shale with different cementation. In: Proceedings of the 2014 SEG Annual Meeting. Denver, Society of Exploration Geophysicists, 2014, 3005-3009.
- Hucka, V.; Das, B. Brittleness determination of rocks by different methods. Inte rnational Journal of Rock Me-chanics and Mining Sciences and Geomechanics Ab-stracts, 1974, 11(10): 389-392. [CrossRef]
- Altindag, R. The evaluation of rock brittleness concept onrotaryblasthole drills. Journal of South African Institute of Mining and Metallurgy, 2002, 102(1): 61-66.
- Altindag, R. Correlation of specific energy with rock brittleness concepts on rock cutting. Journal of the South African Institute of Mining and Metallurgy, 2003,103(3): 163-171.
- Gong, Q.; Zhao, J. Influence of rock brittleness on TBM penetration rate inSingapore Granite. Tunnel-lingand Underground SpaceTechnology, 2007, 22(3): 317-324. [CrossRef]
- Bishop, A. Progressive failure with special reference to the mechanism causing it. OslorProceedings of the Geotechnical Conference, 1967, 142-150.
- Hajiabdolmajid, V.; Kaiser, P.; Martin, C. Modelling brittle failure of rock. International Journal of Rock Mechanics and Mining Sciences, 2002, 39(6): 731-741.
- Hajiabdolmajid, V.; Kaiser, P. Brittleness of rock and stability assessment in hard rock tunneling. Tunneling and Underground Space Technology, 2003, 18(1): 35-48. [CrossRef]
- Hajiabdolmajid, V. Mobilization of Strength in Brittle Failure of Rock. Department of Mining Engineering, Queens University, Kingston, Canada, 200l.
- Kornev, V.; Zinov’ev, A. Quasi-brittle rock fracture model. International Journal Of Rock Mechanics And Mining Sciences, 2013, 49 (4), 576-582. [CrossRef]
- Huang, K.; Shimada, T.; Ozaki, N.; Hagiwara, Y.; Sumigawa, T.; Guo, L.; Kitamura, T. A unified and universal griffith-based criterion for brittle fracture. International Journal of Solids and Structures, 2017, 128: 67-72. [CrossRef]
- Xu, N.; Gao, C. Study on the special rules of surface subsidence affected by normal faults. Journal of Mining and Strata Control Engineering, 2020, 2 (1): 011007.
- Chen, G.; Li, T.; Yang, L.; Zhang, G.; Li, J.; Dong, H. Mechanical properties and failure mechanism of combined bodies with different coal-rock ratios and combinations. Journal of Mining and Strata Control Engineering, 2021, 3(2): 023522.
- Mullen, M.; Enderlin, M. Fracability index-more than just calculating rock properties. SPE 159755,2012. [CrossRef]
- Jin, X.; Shan, S.; Roegiers, J.; Zhang, B. An integrated petrophysics and geomechanics approach for fracability evaluation in shale reservoirs. SPE Journal,2015, 20(3): 518-526. [CrossRef]
- Mao, S.; Zhang, Z.; Chun, T.; Wu K. Field-Scale Numerical Investigation of Proppant Transport among Multicluster Hydraulic Fractures. SPE Journal, 2021,26(1): 307-323. [CrossRef]
- Tang, J.; Wang, X.; Du, X.; Ma, B.; Zhang, F. Optimization of Integrated Geological-engineering Design of Volume Fracturing with Fan-shaped Well Pattern. Petroleum Exploration and Development. 2023, 50(4): 1-8. [CrossRef]
- Tang, J.; Wu, K.; Zuo, L.; Xiao, L.; Sun, S.; Ehlig–Economides, C. Investigation of Rupture and Slip Mechanisms of Hydraulic Fracture in Multiple-layered Formation. SPE Journal. 2019, 24(05): 2292-2307. [CrossRef]
- Meng, S.; Li, D.; Liu, X.; Zhang, Z.; Tao, J.; Yang, L.; Rui, Z. Study on dynamic fracture growth mechanism of continental shale under compression failure. Gas Science and Engineering, 2023, 114: 204983. [CrossRef]
- Li, Y., Li, Z., Shao, L., Tian, F.; Tang, J. A new physics-informed method for the fracability evaluation of shale oil reservoirs. Coal Geology & Exploration. 2023, 51(10): 1-15. [CrossRef]
- Zhao, X., Jin, F., Liu, X., et al. 2022. Numerical study of fracture dynamics in different shale fabric facies by integrating machine learning and 3-D lattice method: A case from Cangdong Sag, Bohai Bay basin, China. Journal of Petroleum Science and Engineering. 218: 110861. [CrossRef]
- Lemaitre, J. A Continuous Damage Mechanics Model for Ductile Fracture. Journal of Engineering Materials and Technology, 1985, 107(1): 83-89. [CrossRef]
- Lemaitre, J. How to use damage mechanics. Nuclear Engineering and Design,1984, 80(2): 233-245. [CrossRef]


Disclaimer/Publisher’s Note: The statements, opinions and data contained in all publications are solely those of the individual author(s) and contributor(s) and not of MDPI and/or the editor(s). MDPI and/or the editor(s) disclaim responsibility for any injury to people or property resulting from any ideas, methods, instructions or products referred to in the content. |
© 2023 by the authors. Licensee MDPI, Basel, Switzerland. This article is an open access article distributed under the terms and conditions of the Creative Commons Attribution (CC BY) license (http://creativecommons.org/licenses/by/4.0/).


