1. Introduction
Synthetic Aperture Radar (SAR), an active sensor renowned for its all-day and all-weather capabilities, plays a pivotal role in the realm of remote sensing [
1]. Its applications span various domains, including topographic mapping, geological surveys, marine monitoring, agricultural and forestry assessments, disaster evaluation, and military reconnaissance. Sparse SAR imaging is a new theory for SAR imaging, which introduces the sparse signal processing into SAR imaging, effectively improving the image quality and system performance [
2,
3,
4,
5]. Sparse SAR imaging is based on the sparse inverse problem to break through the bottleneck of system complexity in traditional SAR imaging. The theory has been effectively applied to various modes of SAR imaging, including stripmap SAR, ScanSAR, spotlight SAR and TOPS SAR [
6,
7,
8,
9].
Regularization plays a crucial role in the success of sparse SAR imaging by improving the quality and stability of the reconstructed images, i.e. incorporating prior knowledge or constraints into the SAR image reconstruction process. There are several types of regularization techniques used in CS-SAR, as follows. Tikhonov regularization adds a penalty term to the reconstruction problem that encourages a smooth solution, reducing the impact of measurement noise and other distortions [
10]. Total Variation (TV) regularization promotes piecewise constant or piecewise smooth solutions, preserving edges and sharp transitions in the reconstructed image [
11]. Sparsity-promoting regularization encourages solutions that are sparse in some domain, such as the wavelet or Fourier domain. Bayesian regularization incorporates a Bayesian prior into the reconstruction problem, encoding prior knowledge or constraints about the desired solution [
12]. The choice of regularization method depends on the specific requirements of the application and the characteristics of the measurement data.
Deep neural networks, a current research hotspot, are also emerging as an effective regularization choice for solving sparse inverse problems, and are now emerging for applications in SAR imaging. Deep Neural Network (DNN) regularization uses a pre-trained DNN as a regularization term, leveraging the deep learning framework to learn the mapping between the under-sampled measurement data and the desired high-resolution image [
13,
14]. By incorporating DNNs as regularization terms, CS-SAR can achieve improved imaging performance and robustness, and can be applied to a wider range of imaging scenarios. DNNs commonly used in sparse SAR include [
15]. However, the performance of DNN based SAR imaging is heavily dependent on training data. A high-quality and diverse set of training data is crucial for ensuring accurate and robust performance of the DNN in this imaging scenario. Poor quality training data can result in incorrect mappings and reduced performance of the DNN. A lack of training data can result in under-fitting, where the DNN is unable to learn the complex relationships, or over-fitting, where the DNN memorizes the training data but does not generalize well to new data.
Deep Image Prior Powered by RED(DeepRED) is a regularization model for solving sparse inverse problems, that has attracted much attention in image processing [
16]. DeepRED regularization merges the concepts of Deep Image Prior (DIP) and Regularization by Denoising (RED). In this framework, DIP leverages the inherent structure of a deep network as a regularizer for inverse problems, while RED employs an explicit, image-adaptive, Laplacian-based regularization function. This fusion results in an overall objective function that is more transparent and well-defined. The key advantage of DeepRED is that it combines the strengths of DIP and RED, providing a flexible and powerful approach for image restoration and reconstruction. The deep neural network serves as a powerful prior, and the denoising algorithm provides effective regularization, resulting in robust and accurate image restoration results. DeepRED does not require explicit prior knowledge or training data specific to the task or imaging scenario. Instead, the method leverages the generic and rich prior knowledge learned from the large datasets of natural images to achieve robust and accurate image restoration results. DeepRED is a effective method for image restoration and reconstruction, and has been applied to a wide range of tasks, including image deblurring, denoising, and super-resolution.
In this article, we combine DeepRED with sparse SAR imaging, using DeepRED as a regularisation term to improve SAR imaging performance. This method does not require any training data and maintains the imaging performance as a supervised deep learning approach. We first present a sparse SAR imaging model based on DeepRED, then we present a solution to this imaging model based on the ADMM algorithm, and finally we use simulation and real data experiments to illustrate the effectiveness of the algorithm.The application of DeepRED in SAR is different from that in applications such as MRI, where the phase of the SAR image is highly random. This leads to direct application of DeepRED not working, and DeepRED constraints can only be added to the amplitude of the image.
We have innovatively applied the DeepRED algorithm to SAR imaging, breaking through the traditional confines of processing only amplitude images [
16]. The crux of our innovation lies in the extension of the algorithm to concurrently handle both amplitude and phase information in SAR imaging, both of which are critical for the accuracy and completeness of SAR images. By iteratively updating the amplitude and phase of the image, our method not only significantly enhances the overall quality of SAR images but also achieves greater precision in capturing ground details and features. This research paves a new path in SAR imaging technology, propelling the field forward with fresh perspectives and methodologies.
The remaining content of this article is organized as follows.
Section 2 describes the SAR echo signal model and the proposed DeepRED based sparse SAR imaging method.
Section 3 gives the simulation experimental results and the real data processing results.
Section 4 gives the conclusions.
2. Materials and Methods
2.1. Signal Model
In SAR imaging, the complex-valued reflectivity matrix of the monitored area is given by , and the collected 2-D echo data is symbolized by . We introduce , where , and , where . The vectorization operation, , is used to stack the matrix columns in sequence. Both two-dimensional variables X and Y and one-dimensional variables x and y are introduced to account for the prior information associated with the two-dimensional image variables. The complex reflectivity matrix x can be expressed as the product of its magnitude component and its phase component . In a single SAR image, the magnitude and phase components exhibit distinct properties. The phase of each pixel is typically randomized unless there’s some coherence or consistent scattering mechanism at play. This randomness is due to the mixture of scattered signals returning to the radar sensor from various structures within each resolution cell. On the other hand, the magnitude component of a SAR image is not only influenced by speckle noise but also showcases a piecewise smooth nature. This allows for the incorporation of prior knowledge about the magnitude component of the image.
In SAR imaging, represented as a linear system in matrix form, the correlation between SAR echo data and the scene’s reflectivity is captured by the equation:
with
signifying the additive noise and
as the system’s measurement matrix.
The primary objective in SAR imaging is the recovery of x from y and . Matched filtering-based SAR imaging is formulated as , where represents the conjugate transpose of . Adherence to the Nyquist sampling theorem in both azimuth and range directions ensures (the identity matrix), while deviation leads to pronounced sidelobes in output. Inversions like are often ill-posed, particularly with poorly conditioned system matrices , making even minor errors in y potentially significant in the estimated x. To mitigate this, regularization techniques are applied, introducing constraints or prior knowledge into the solution process.
To achieve rapid imaging techniques, we utilize the echo simulation operator instead of the compressive sensing-based SAR measurement matrix. In this paper, we adopt a forward operator based on the Range-Doppler Algorithm (RDA), denoted as:
where
denotes the reconstructed SAR image matrix,
y represents the echo data matrix, and
signifies the RDA operation:
Herein,
symbolizes the range compression operator,
designates the range migration correction operator, and
denotes the azimuth compression operator. The linearity of these three operators has been established in [
17]. The inverse process of the forward operator based on the RDA is referred to as the echo simulation operator
:
The echo simulation operator serves as an approximation to the observation matrix. In other words, the relationship
can be approximately represented as:
The regularization base SAR imaging can be denoted as,
This formula consists of two parts: the first term is the data fidelity term that quantifies the difference between the observed echo data
y and the estimated model
, and the second term is the regularization term
, influenced by the parameter
, which introduces a priori knowledge or constraints on the desired solution
x.
In sparse SAR imaging, the regularization technique is applied to promote sparsity in the solution. Total Variation (TV) regularization is also often used for preserving edges in the reconstructed image. When addressing SAR imaging within the wavelet domain, it’s common to transform the image (or its data) into this domain, leveraging the inherent sparsity or compressibility of SAR images. In this setting, the regularization technique is specifically tailored to the wavelet domain.
2.2. DeepRED Regularization
The DeepRED is known as the combination of the DIP with RED. The idea is to synergistically blend the strengths of both techniques for improved image reconstruction. The DeepRED is described as follows.
DIP leverages the architecture of deep neural networks as a form of implicit regularization. Unlike traditional deep learning techniques, DIP does not require training on a large dataset. Instead, it trains a network on a single image, aiming to fit the image as closely as possible. The idea is that the network’s structure inherently prevents it from fitting the noise, acting as a form of regularization
where
c represents the denoised image,
is the given noisy image, and
is a deep neural network parameterized by
. The term
is the data term; its role is to quantify the degree of agreement between the reconstructed image and the observed data by measuring the discrepancy between the network’s output and the given image.
The network is initialized with random weights and is then trained to generate an image that closely resembles w. Due to the high capacity of deep networks, it’s possible for to overfit to w. However, before overfitting to the noise or the corruptions in w, the network converges to a "natural" image, leveraging the prior implicitly encoded in its architecture. The main insight of DIP is that during the early stages of this training process, before the network starts to fit the noise, it captures the main structures and features of the image, essentially acting as a denoiser or reconstructor.
RED is an image reconstruction framework that integrates external denoising methods into the reconstruction process. [
18] The primary concept behind RED is to utilize the capabilities of off-the-shelf denoising algorithms as a regularization term, aiding in solving inverse problems in imaging. RED suggests the use of the following expression as the regularization term,
where
is a denoiser. Within the RED framework, various denoising algorithms such as NLM [
19] and BM3D [
20] can be utilized, which are capable of achieving good denoising effects while ensuring computational speed. By utilizing external denoisers, RED can easily incorporate the latest advancements in the field of denoising without significant alterations to the reconstruction algorithm. With the right choice of a denoiser, RED is capable of achieving high-quality reconstructions that surpass the performance of traditional regularization methods.
DeepRED is applied to SAR image denoising and is given as follows,
where
w is the magnitude of complex SAR image,
z is auxiliary variable,
c is denoised SAR image.
The above problem can be solved by ADMM. To apply ADMM, we’ll start by forming the Augmented Lagrangian for the problem [
21].
The Augmented Lagrangian for this problem is:
In this formula, the vector
u represents the Lagrange multipliers associated with the equality constraints, while
is a selectable free parameter.
The above solution process is denoted as
. The reference [
16] provides an implementation method for solving using the ADMM:
Firstly, we generate a
close to
using the optimization method of DIP
When
and
u are fixed, in order to obtain
c, the solution to the following equation can be found using a fixed-point strategy:
This means that for the iterative process described by the following equation, iterate J times:
Finally, update
u using
c and
:
Iterate following the above steps until convergence criteria are met.
2.3. DeepRED based the SAR imaging model
This section delineates the application of the DeepRED regularization technique within the SAR imaging, emphasizing the imaging model and algorithmic implementation. The imaging model under consideration integrates the DeepRED technique as a pivotal component to mitigate this noise while preserving the intrinsic details of the SAR imagery. We applied the optimization solution method from [
22] to solve the model, subsequently obtaining the SAR imaging results.
Overall, for our SAR imaging problem,
y represents the measured echo data, and
x represents the imaging result; both are complex matrices. We introduce a regularization prior to the amplitude of the SAR image. Therefore, the objective function for imaging in this work can be expressed as follows:
where
and
denote the amplitude and phase of
x respectively.
ADMM is an iterative algorithm that gradually converges to the optimal solution by alternately updating variables, auxiliary variables, and dual variables. The pseudo-code of this algorithm is detailed in Algorithm 1, which includes both the initialization step and the iterative updating process:
|
Algorithm 1 ADMM |
Initialize , parameter , number of iterations T
for k = 1 to T do
end for
|
Here, we define the approximate operator as:
To reconstruct the complex-valued
x, we need to estimate both the magnitude
and the phase
of
x. Initially, the value of
is computed based on
, where
denotes the phase of
x. This means that
x can be expressed as
, where ∘ denotes the Hadamard Product. Thus, it should satisfy the constraint that
equals 1. Thus, in the ADMM iterative process, the solution for
and
is achieved through the following steps:
The solution method of ADMM has a modular characteristic, where each iterative step has an independent meaning. Equation (
17) can be viewed as an inversion of the forward model
, while (
20) can be regarded as a denoising step based on prior information. We consider
as a noisy image. This iterative step can be described as a denoising process with a prior in the following form:
In our work, we replace equation (
20) with DeepRED, and this step becomes:
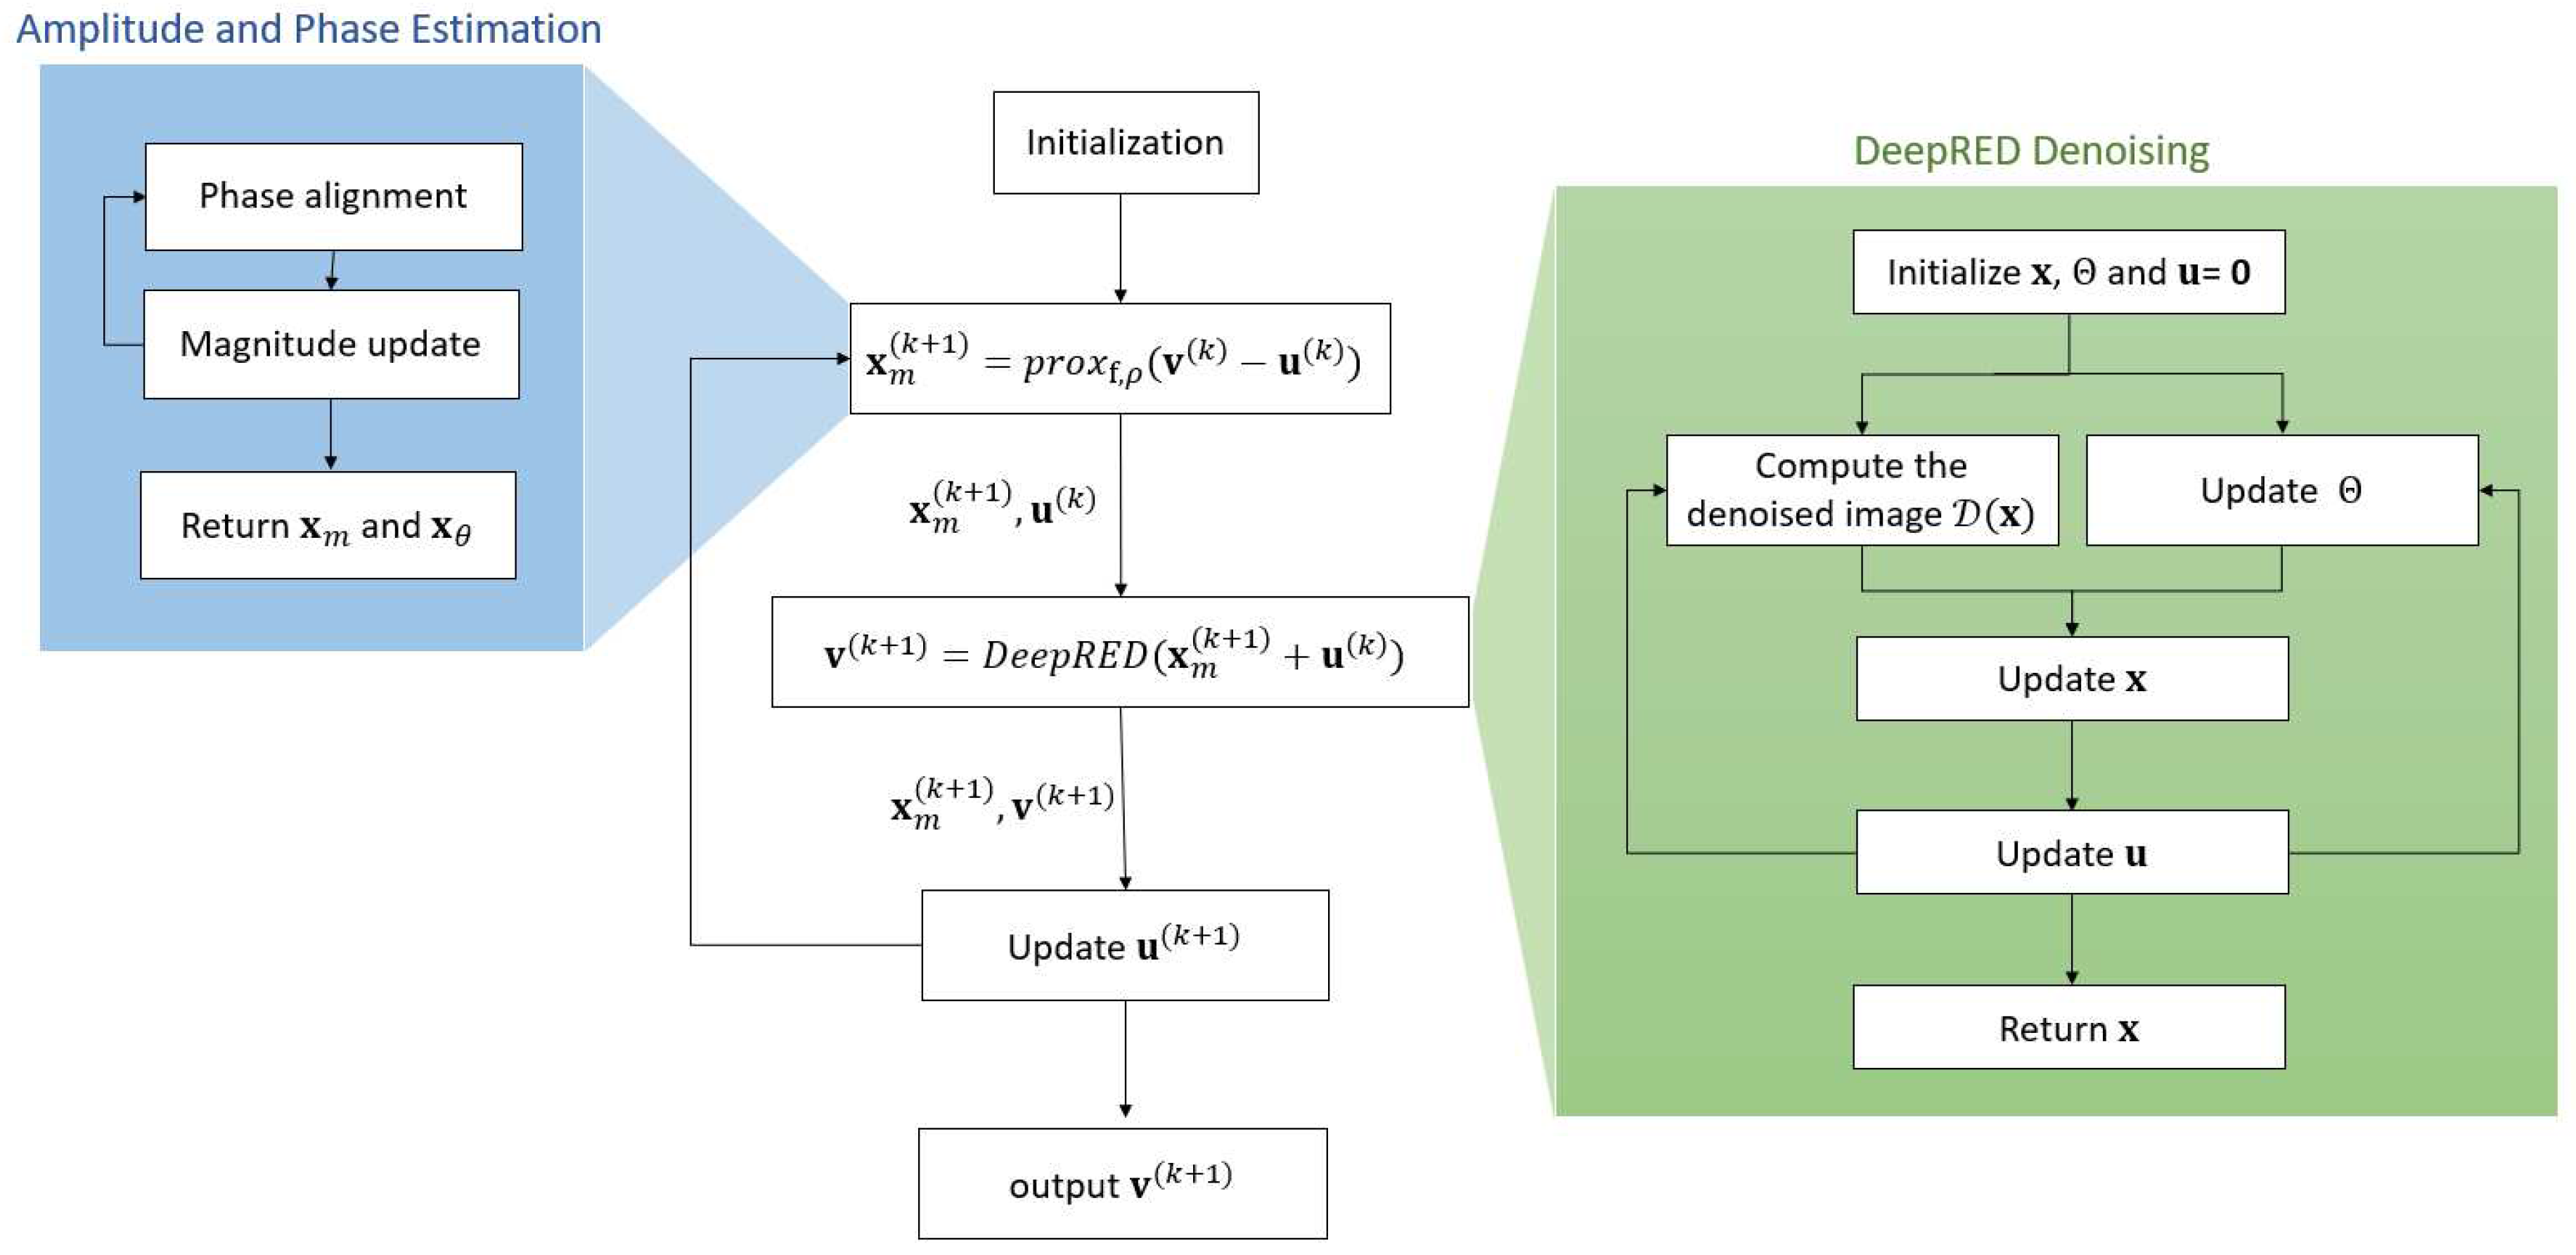
After the aforementioned improvements, the sparse SAR imaging framework based on DeepRED is illustrated in
Figure 1 as follows:
2.4. Evaluation Metrics
In this analysis, we evaluate the image quality of azimuth-range decouple-operators-based sparse SAR imaging by examining radiometric accuracy, radiometric resolution, and spatial resolution.
Radiometric Resolution: The reconstruction quality of distributed targets is assessed using equivalent number of looks (ENL) and radiometric resolution (RR). Higher ENL and RR values correspond to better reconstruction quality. The amplitude-averaging-based ENL is given by [
23]:
The RR is defined as [
24]:
Average Edge Strength (AES): In the process of suppressing speckle noise, there can be a negative effect of edge blurring. To assess the clarity of edges in our method, we utilized the Average Edge Strength metric. Within the context of using the Sobel operator for edge detection, the calculation formula for AES (Average Edge Strength) is expressed as follows:
Here,
represents the intensity (gray level) of the image at pixel position
,
is the binary edge image obtained after processing with the Sobel operator, where edge pixels are marked as 1 and non-edge pixels as 0.
and
are the gradients calculated by the Sobel operator in the horizontal and vertical directions, respectively, and
is the total number of edge pixels. This formula calculates AES by averaging the gradient strength across all edge pixels. The Sobel operator is employed to detect edges in the image and to compute the gradient strength at these edges, with AES measuring the average strength of these edges.
Spatial Resolution: In sparse SAR imaging, the width of the main lobe widths(MLW) serves as a key metric for evaluating spatial resolution. A smaller MLW value typically indicates enhanced spatial resolution. Given that the system’s impulse response to an ideal point target approximates a function in this imaging technique, MLW becomes an effective tool for gauging spatial resolution.
By evaluating the performance of sparse SAR imaging based on DeepRED in terms of ENL, RR, AES, and Spatial Resolution, we can better understand the advantages of this imaging technique in comparison to other methods.
3. Results
In this section, we evaluate the effectiveness of the proposed method using both simulated and real data. Our approach is compared with several methods, including the RDA method,
regularization method,
&TV regularization method, and a pre-trained CNN regularization method using the DnCNN model. The efficacy of the DnCNN model as a prior has been previously validated [
25], which we refer to as the CNN method for convenience. Additionally, the method proposed in this paper is termed the DeepRED method. Specifically, in our simulation experiments, we demonstrate imaging results for distributed targets under various SNR settings to prove the superiority of our proposed method. In real-world imaging experiments, we use RADARSAT data from regions with distinct characteristics for validation. Initially, we assess the imaging performance for sparse point targets in maritime ship areas, comparing the resolution advantages of our method under different sampling rates. Subsequent tests in plain regions provide comparisons between the equivalent number of looks and radiometric resolution, verifying enhancements in imaging quality and smoothness achieved by our approach. Finally, in mountainous regions, we conduct imaging experiments, comparing the AES of the imaging results of each method, validating the clarity of our approach in complex scenarios.
3.1. Simulation
Initially, a series of simulation experiments were devised to assess the reconstruction efficacy of our proposed method across varying SNRs. The constructed scenario spans
pixels, featuring a distributed target covering an area of
pixels at its core. In line with Oliver and Quegan’s research [
26], an equivalent phase center was assigned to every pixel within the target area. The amplitude of each pixel adheres to a Rayleigh distribution that is independent and identically distributed (with a mean
and a variance
, where
is the backscattering coefficient). Simultaneously, the phase of each pixel is uniformly distributed within the range
.
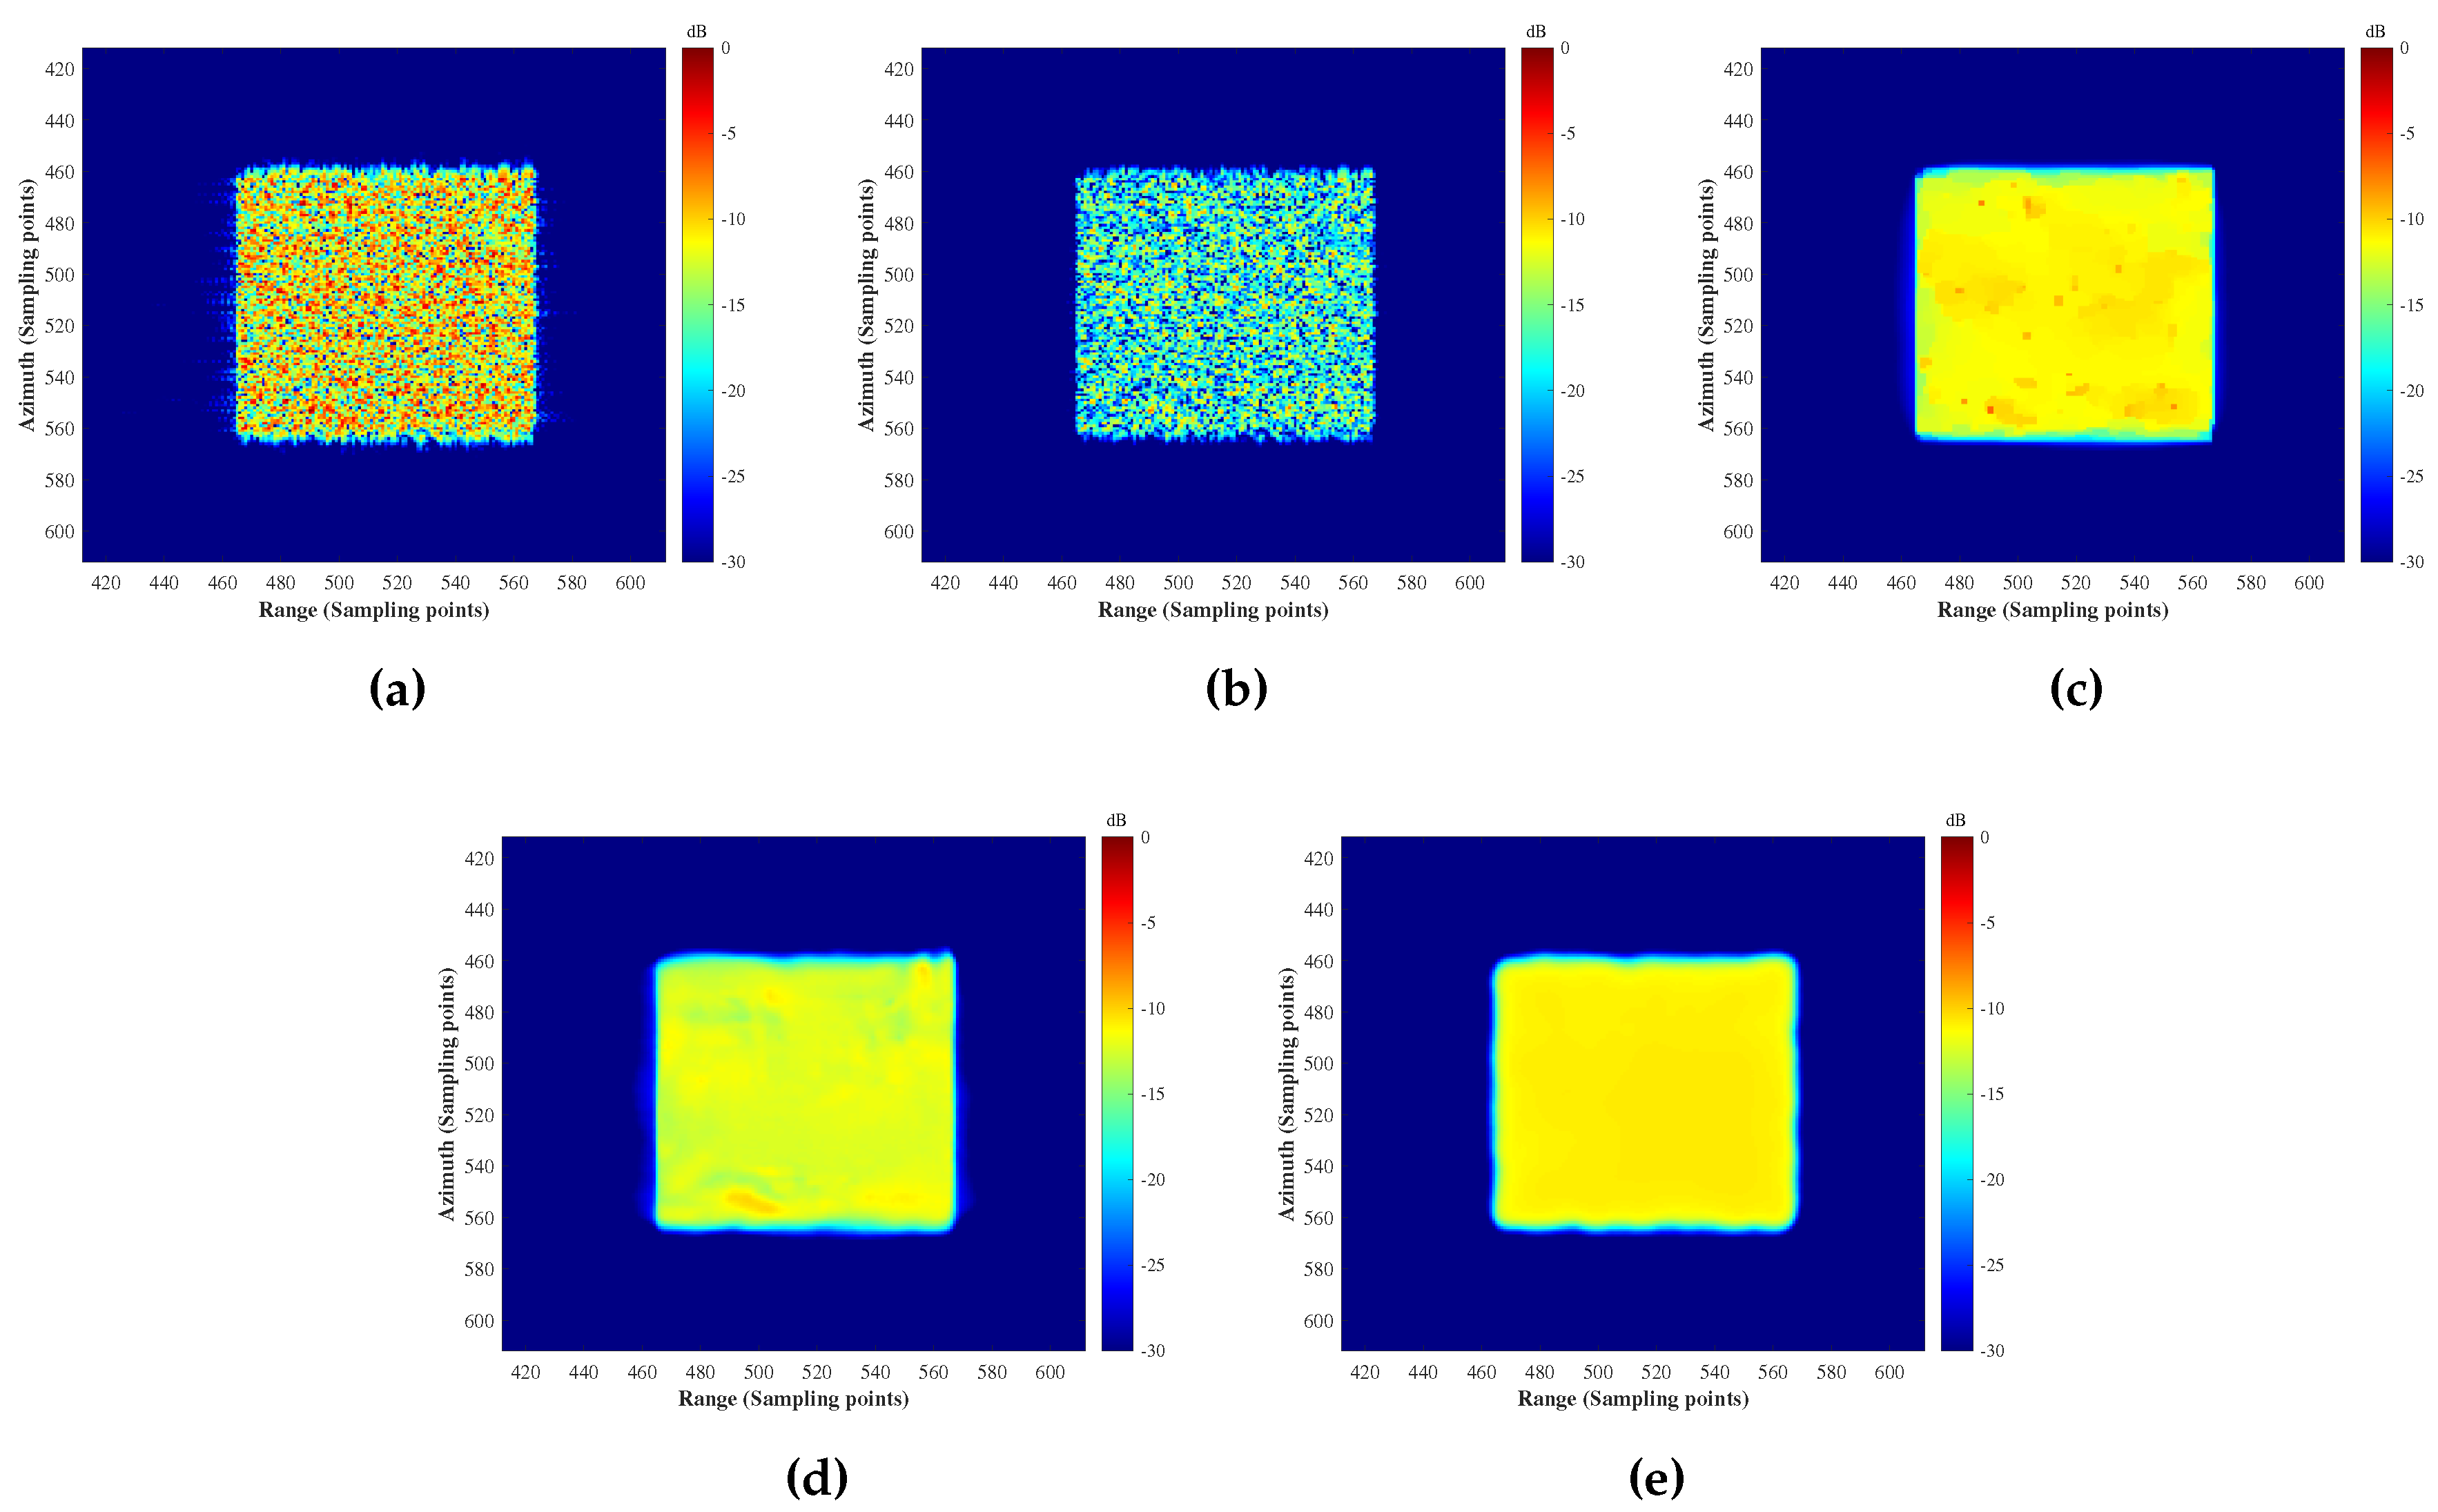
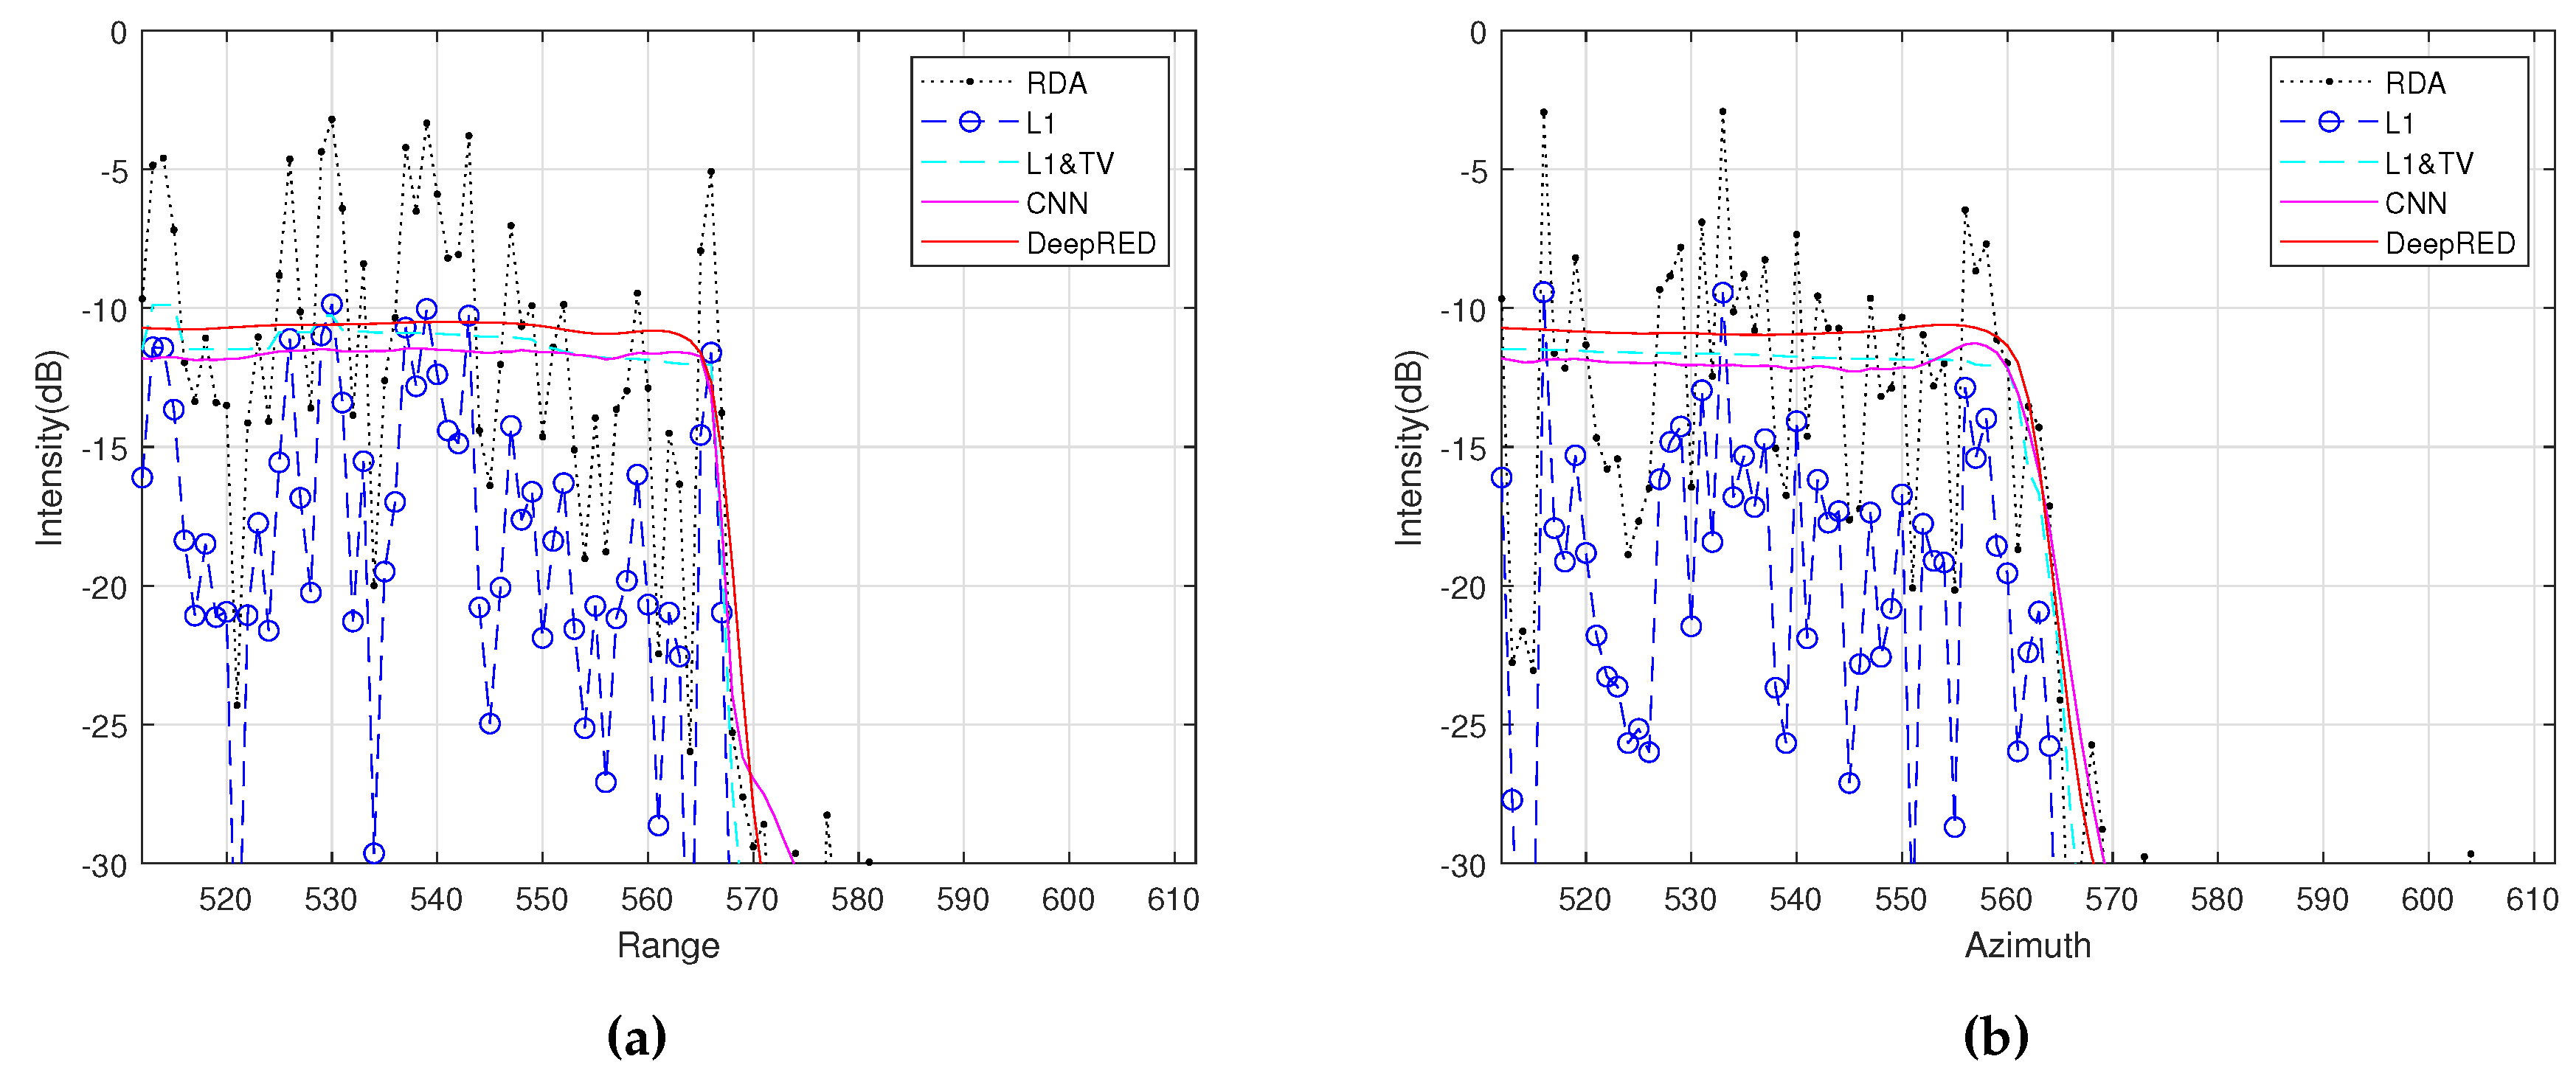
In the first experiment, with an SNR of 30 dB, we reconstruct the target scene using the RDA,
regularization,
&TV regularization, CNN, and the proposed DeepRED methods. The imaging results are shown in
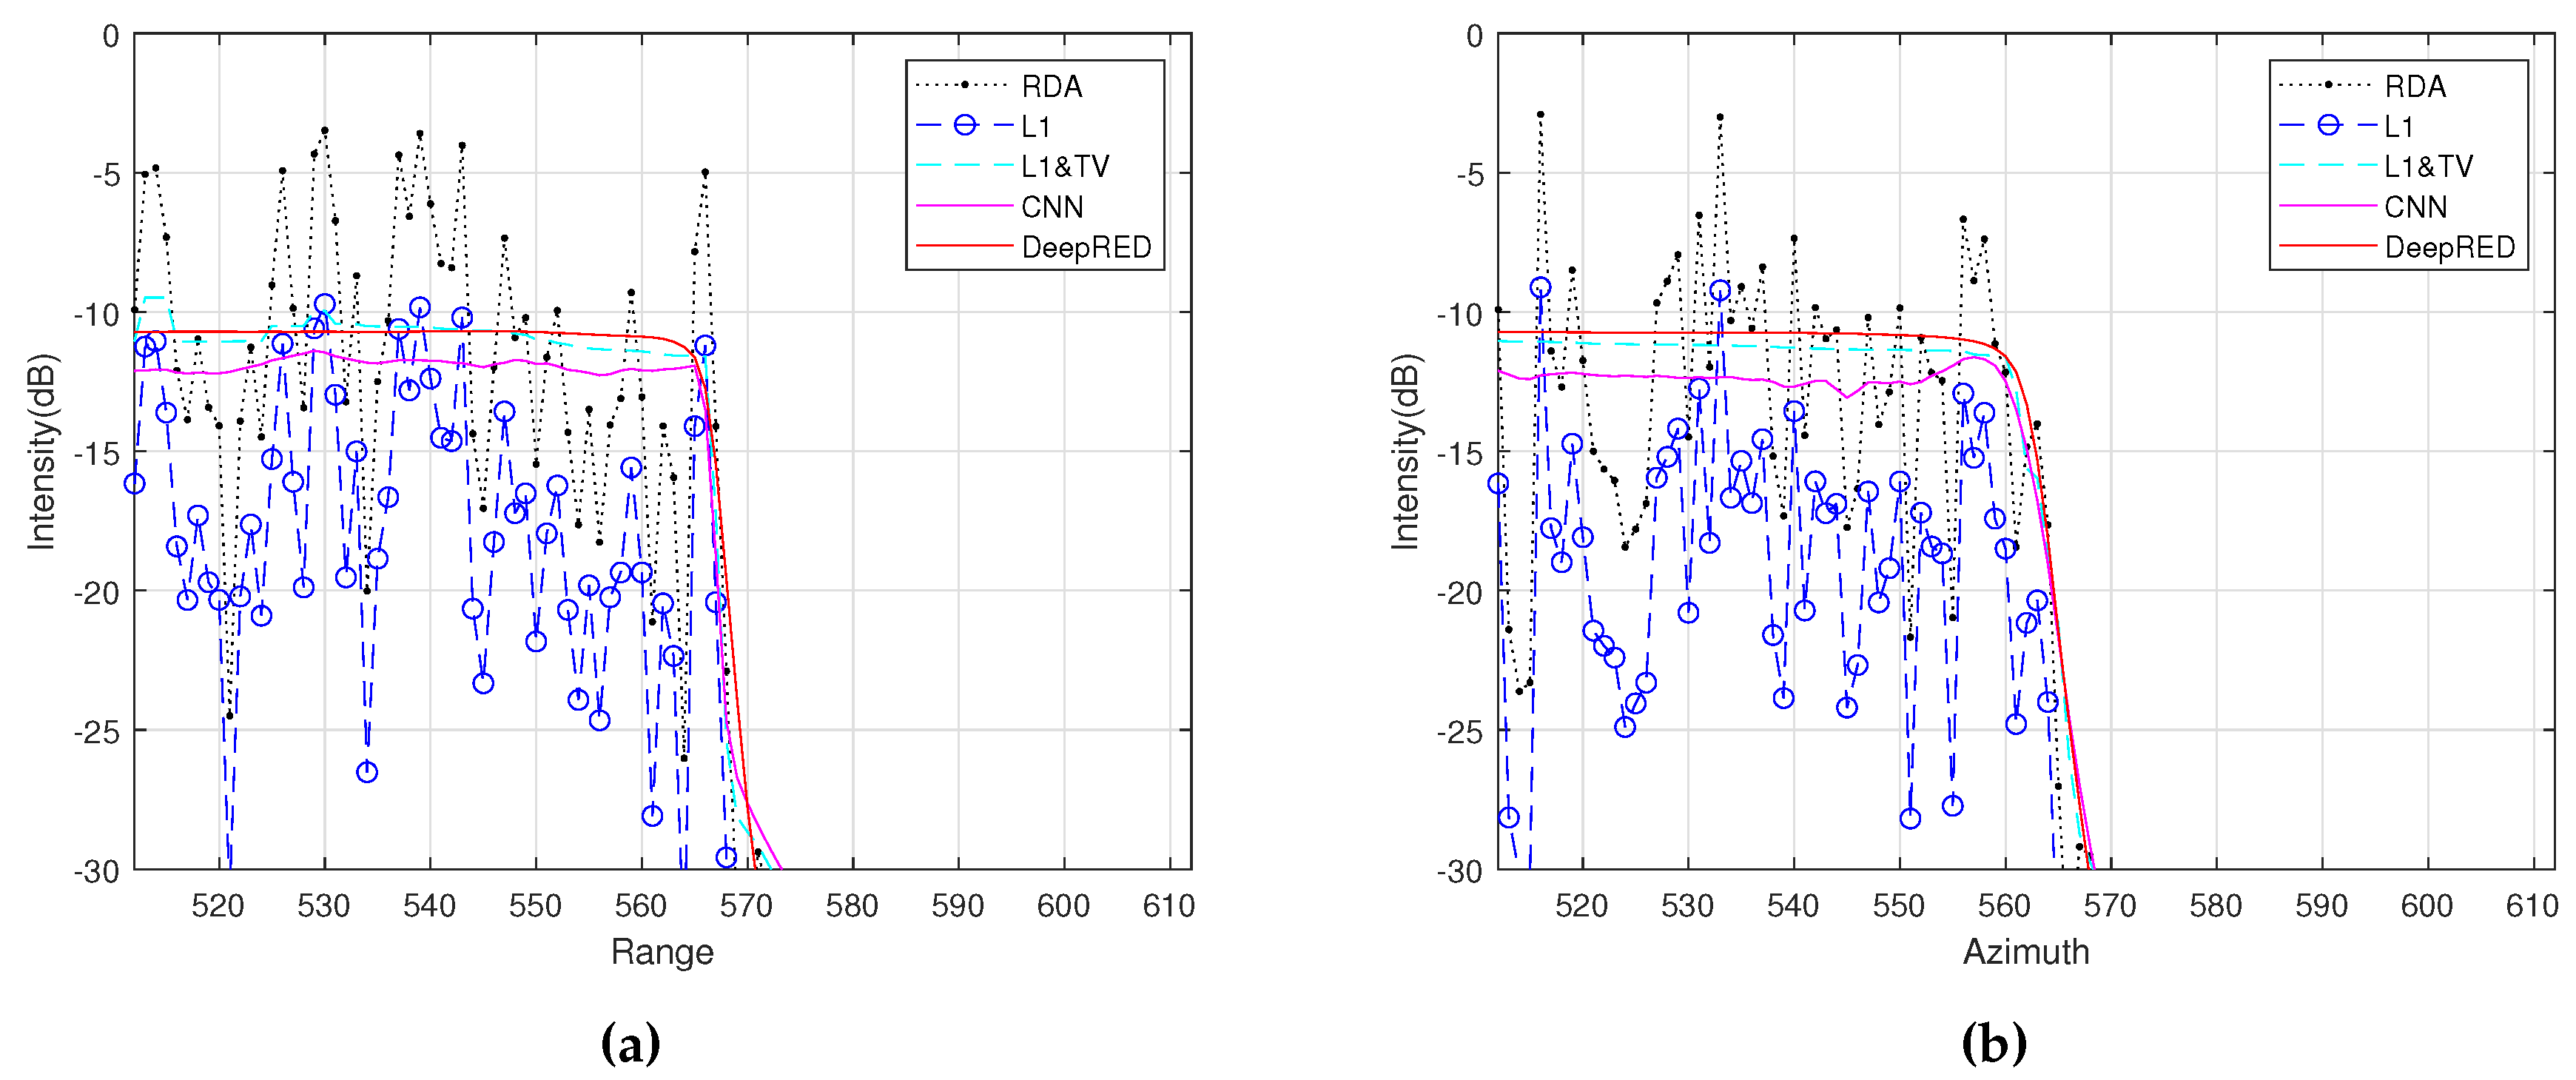
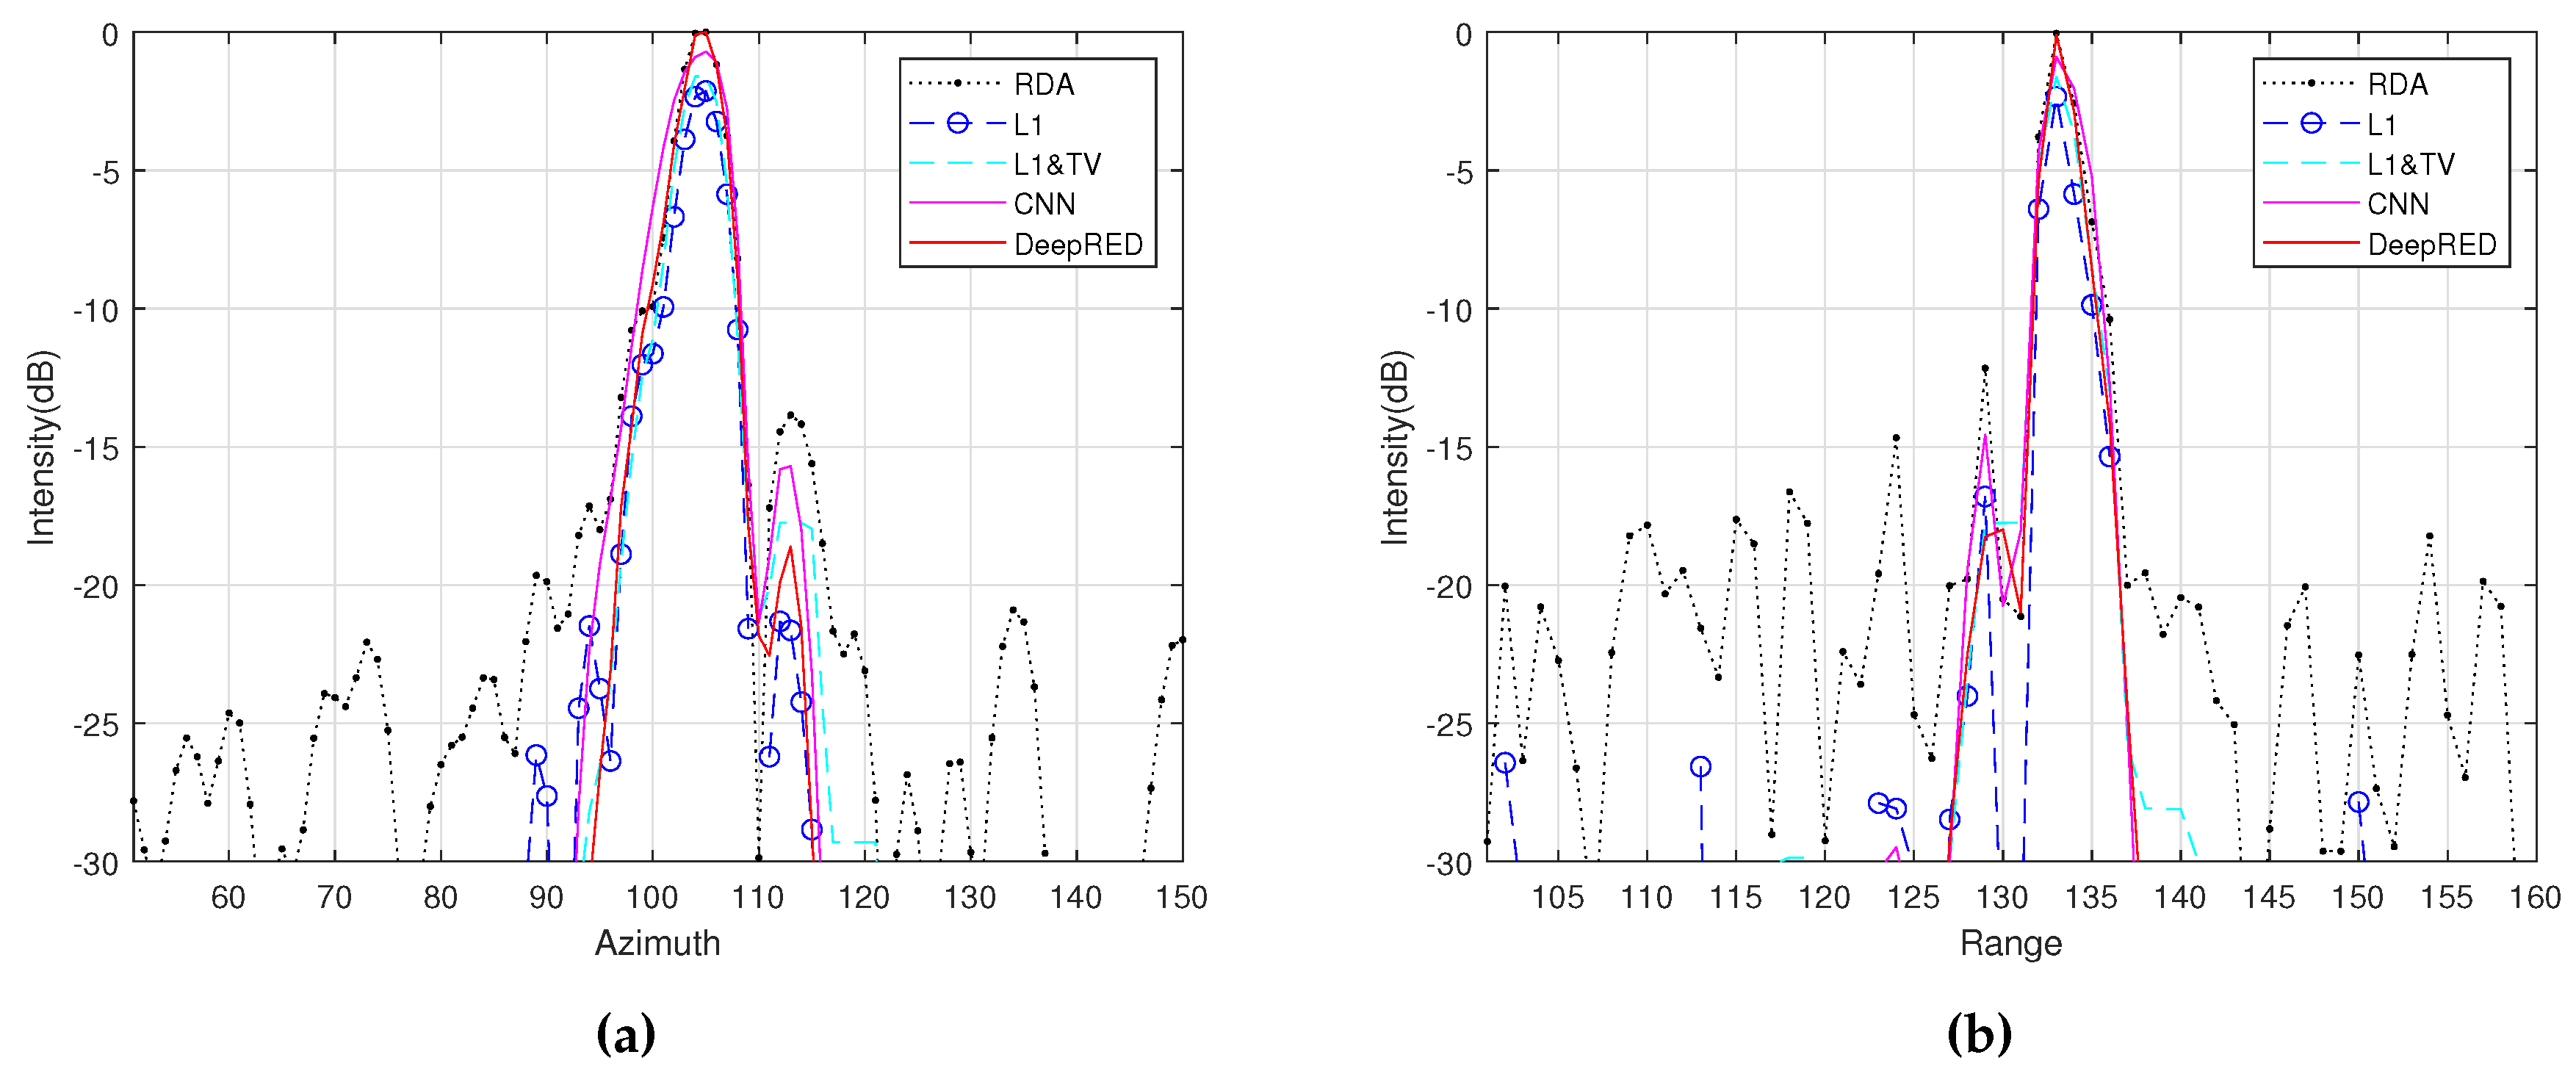
Figure 2. Then, we present the range and azimuth slices in
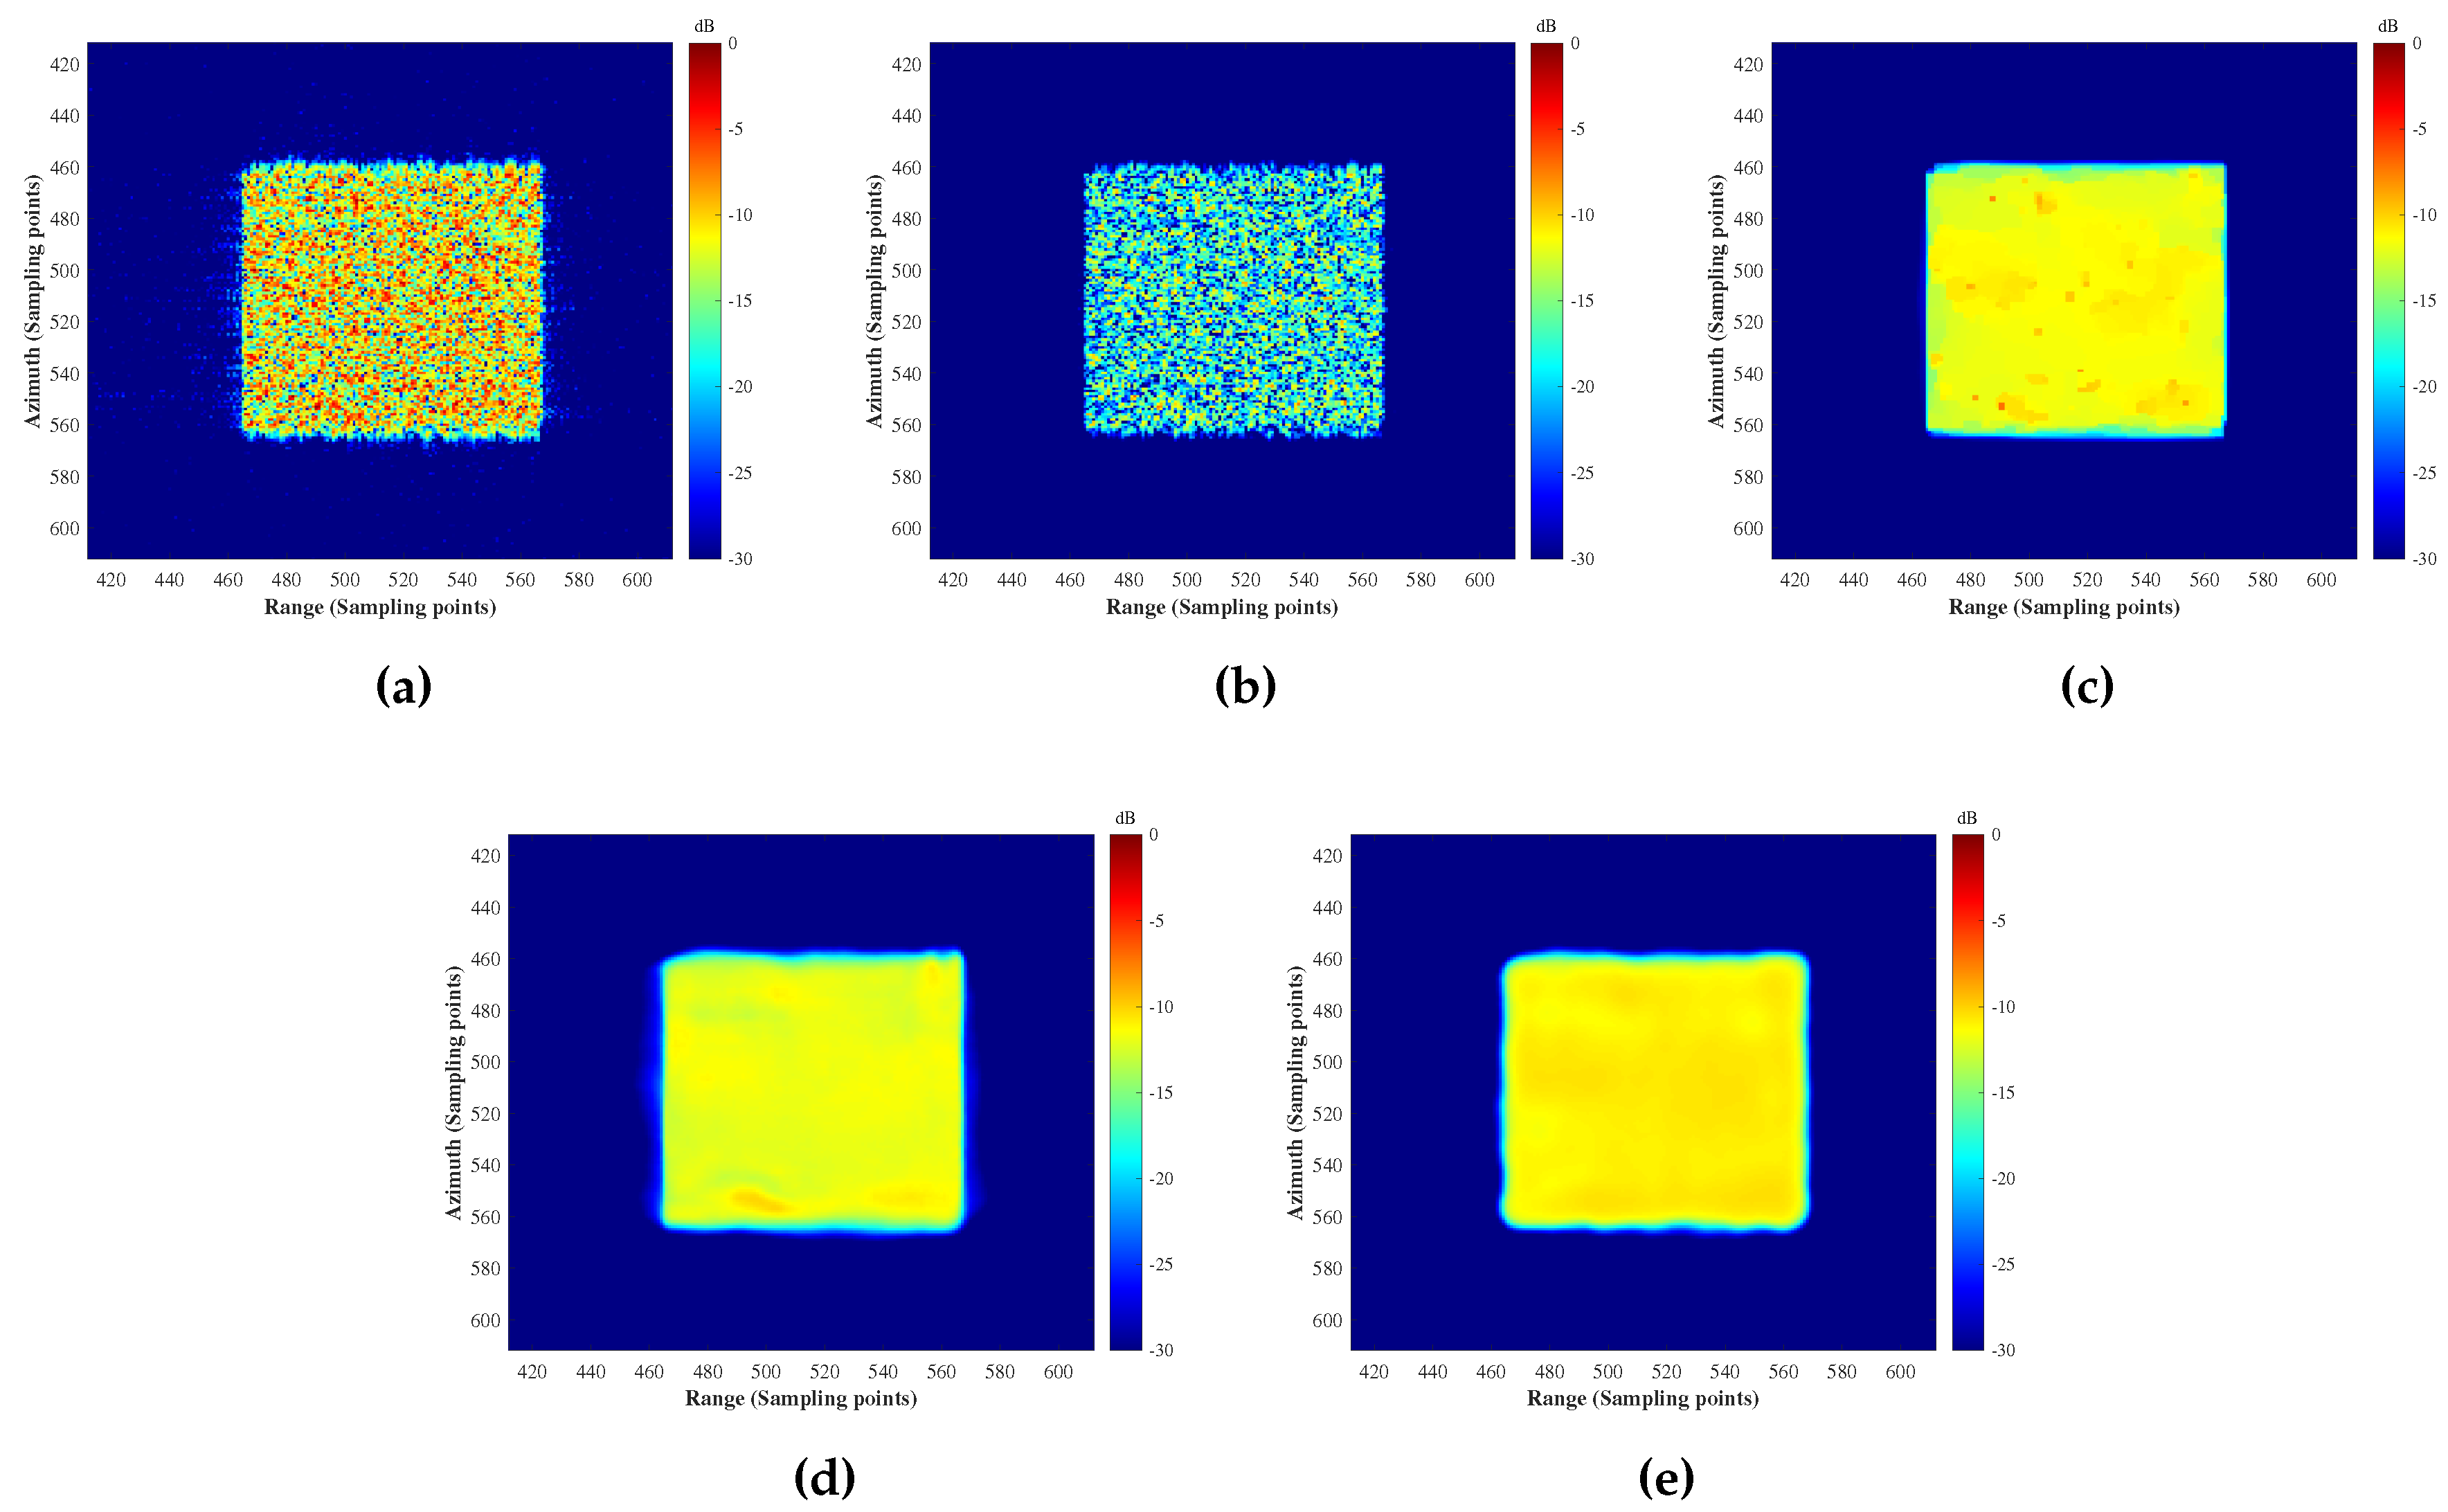
Figure 3. In the second experiment, with an SNR of 5 dB, we reconstruct the target scene using the six methods and display the imaging results in
Figure 4. The range and azimuth slices are shown in
Figure 5.
From the experimental results, we can observe that, except for RDA and regularization, the other methods can maintain the uniformity and continuity of the reflectivity of the distributed targets. Among the last two methods, they improve the reconstruction accuracy compared to &TV regularization. The proposed method demonstrates better clutter suppression and edge-preserving capabilities.
3.2. Real Data Experiments
In our quantitative analysis, we first selected maritime ships as point targets and compared the MLW and clutter intensity of imaging results from various methods. We then chose a plain area as a distributed target and calculated the ENL and RR for imaging results from different methods. Finally, we conducted imaging experiments in mountainous regions and compared the AES of the imaging results. Through these three sets of real-scene experimental setups, we further validated the performance advantages of our proposed DeepRED denoising regularization imaging method. Overall, our method demonstrates substantial improvements in multiple aspects. Specifically, a narrower MLW indicates better reconstruction accuracy in our proposed method, higher ENL and RR signify that our algorithm significantly enhances the smoothness, spatial resolution, and noise resistance capabilities, and a higher AES indicates clearer imaging results from our method. Our algorithm maintains excellent performance even when faced with various downsampling ratios and noise levels, underscoring its robustness. This implies that our method can generate high-quality reconstruction results even under challenging conditions of sparse data and high noise levels.
3.2.1. Experiment 1
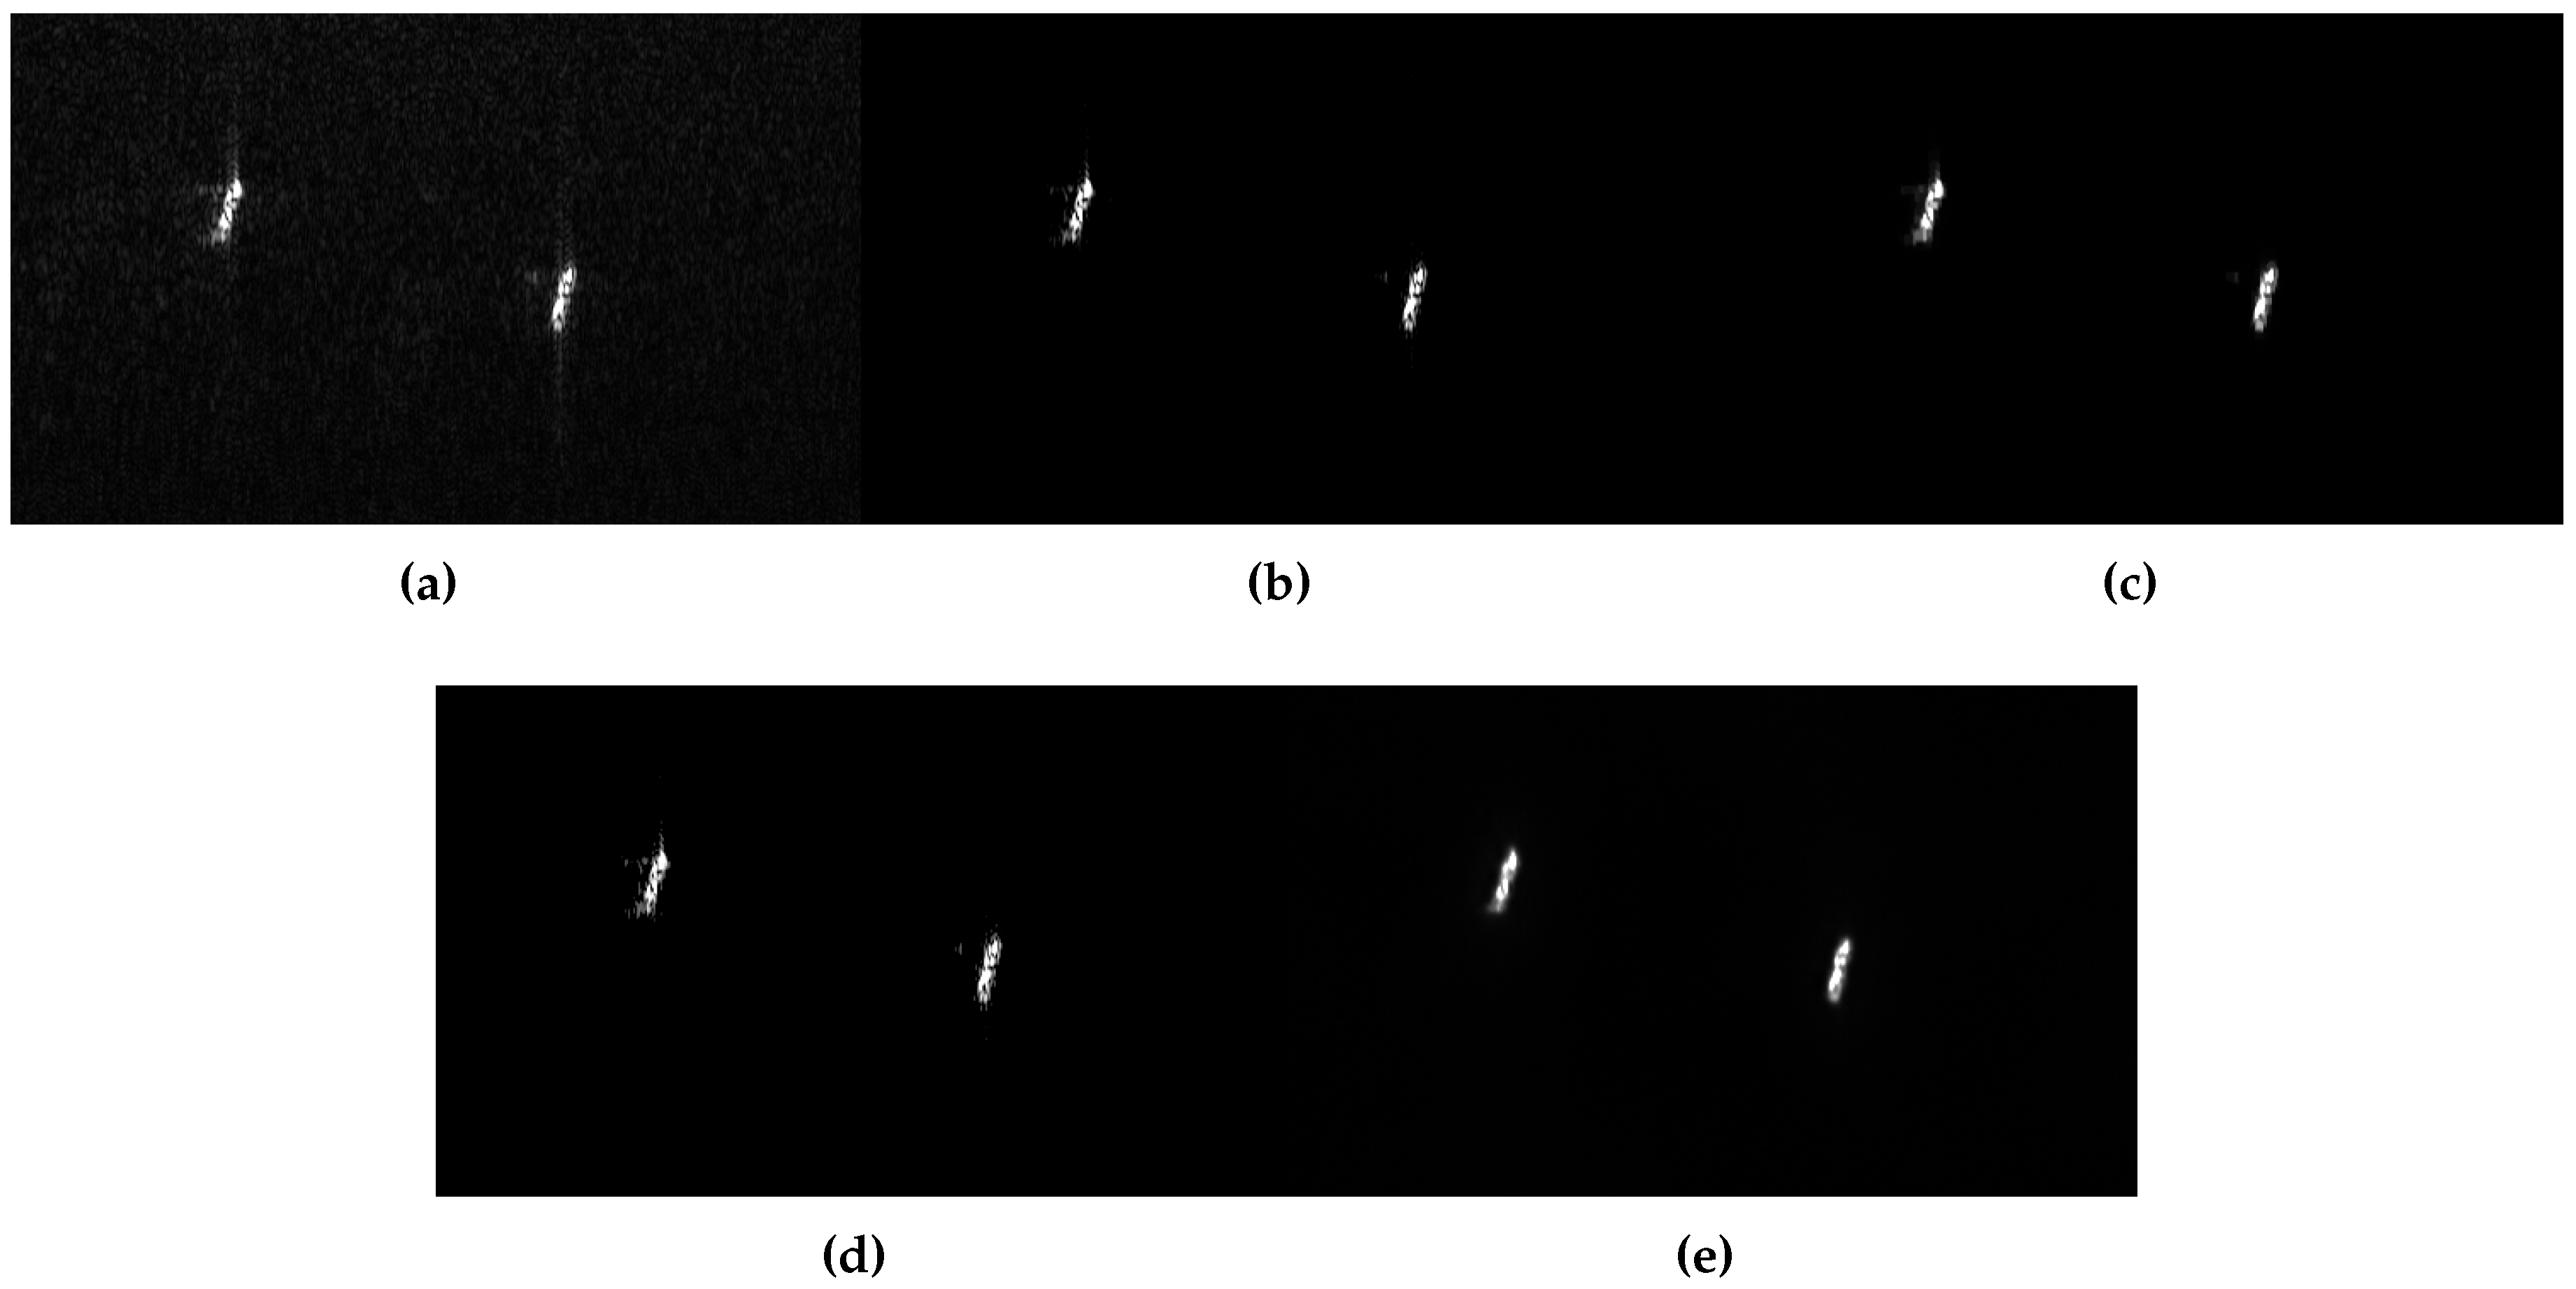
In the first experiment, our focus is on evaluating the accuracy of point target reconstruction. For this purpose, two points with strong scattering characteristics were selected. Under full sampling conditions, several methods were utilized for scene reconstruction, including the RDA,
regularization,
&TV regularization, CNN, and our proposed DeepRED technique. The reconstruction results are displayed in
Figure 6, where we can observe that the subsequent images in
Figure 6 exhibit less noise and clutter compared to
Figure 6 (
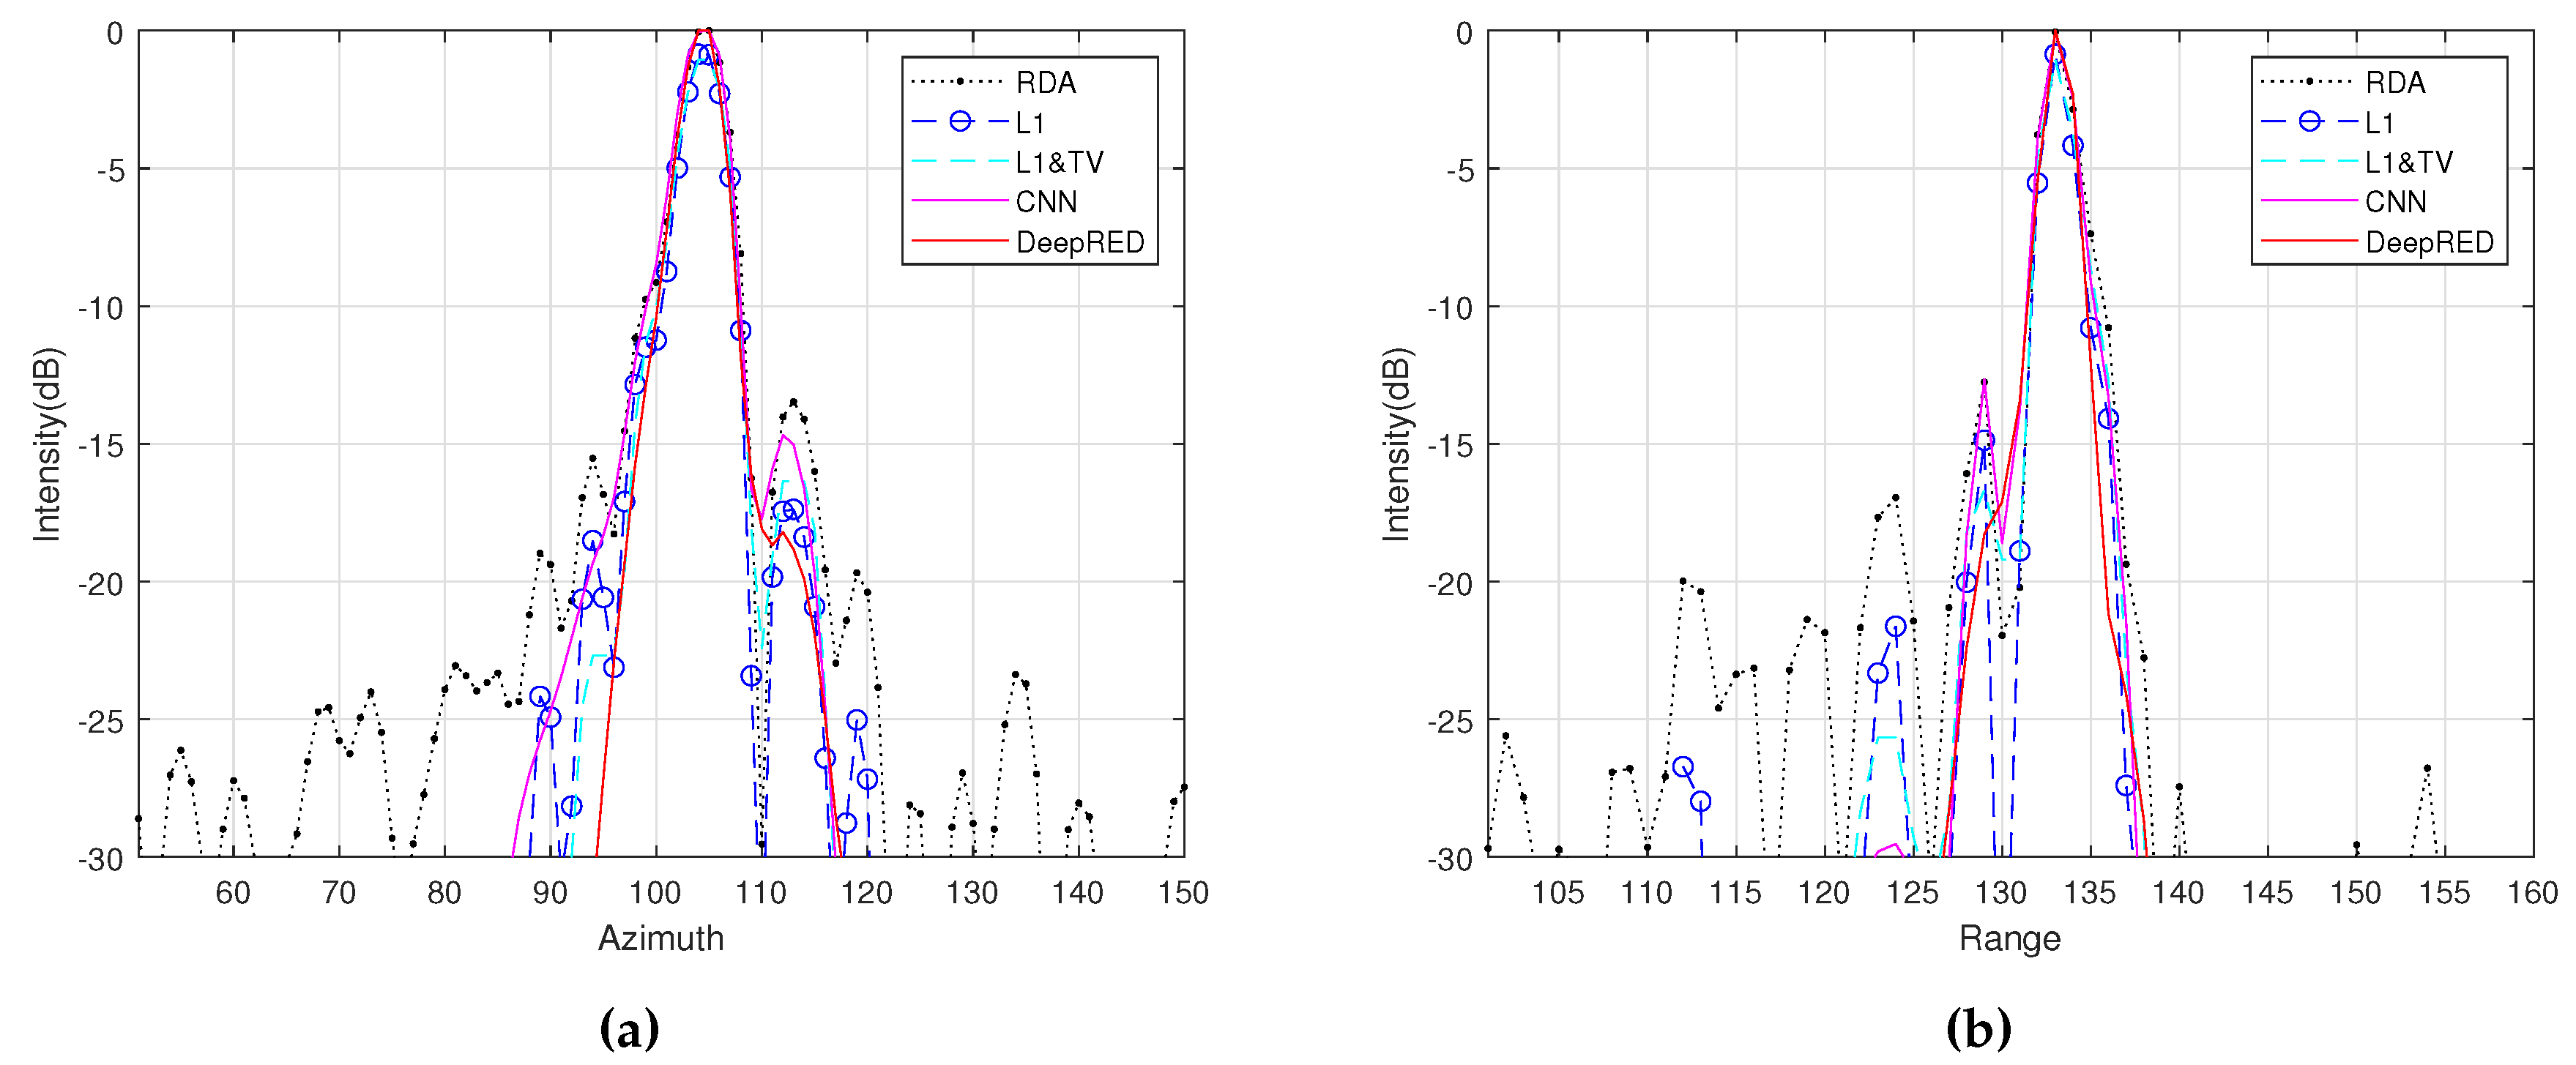
a). Following this, we perform a slice on the target indicated in
Figure 6 (
a) along the range and azimuth directions in the imaging results of the RDA,
regularization,
&TV regularization, CNN, and the DeepRED method proposed in this paper. As shown in
Figure 7, compared to the reconstruction result of the chirp scaling algorithm, all other algorithms demonstrate an effect of clutter and noise suppression. Among them, the DeepRED method reconstructs the target’s reflectivity most accurately, exhibiting the least noise and the smallest MLW.
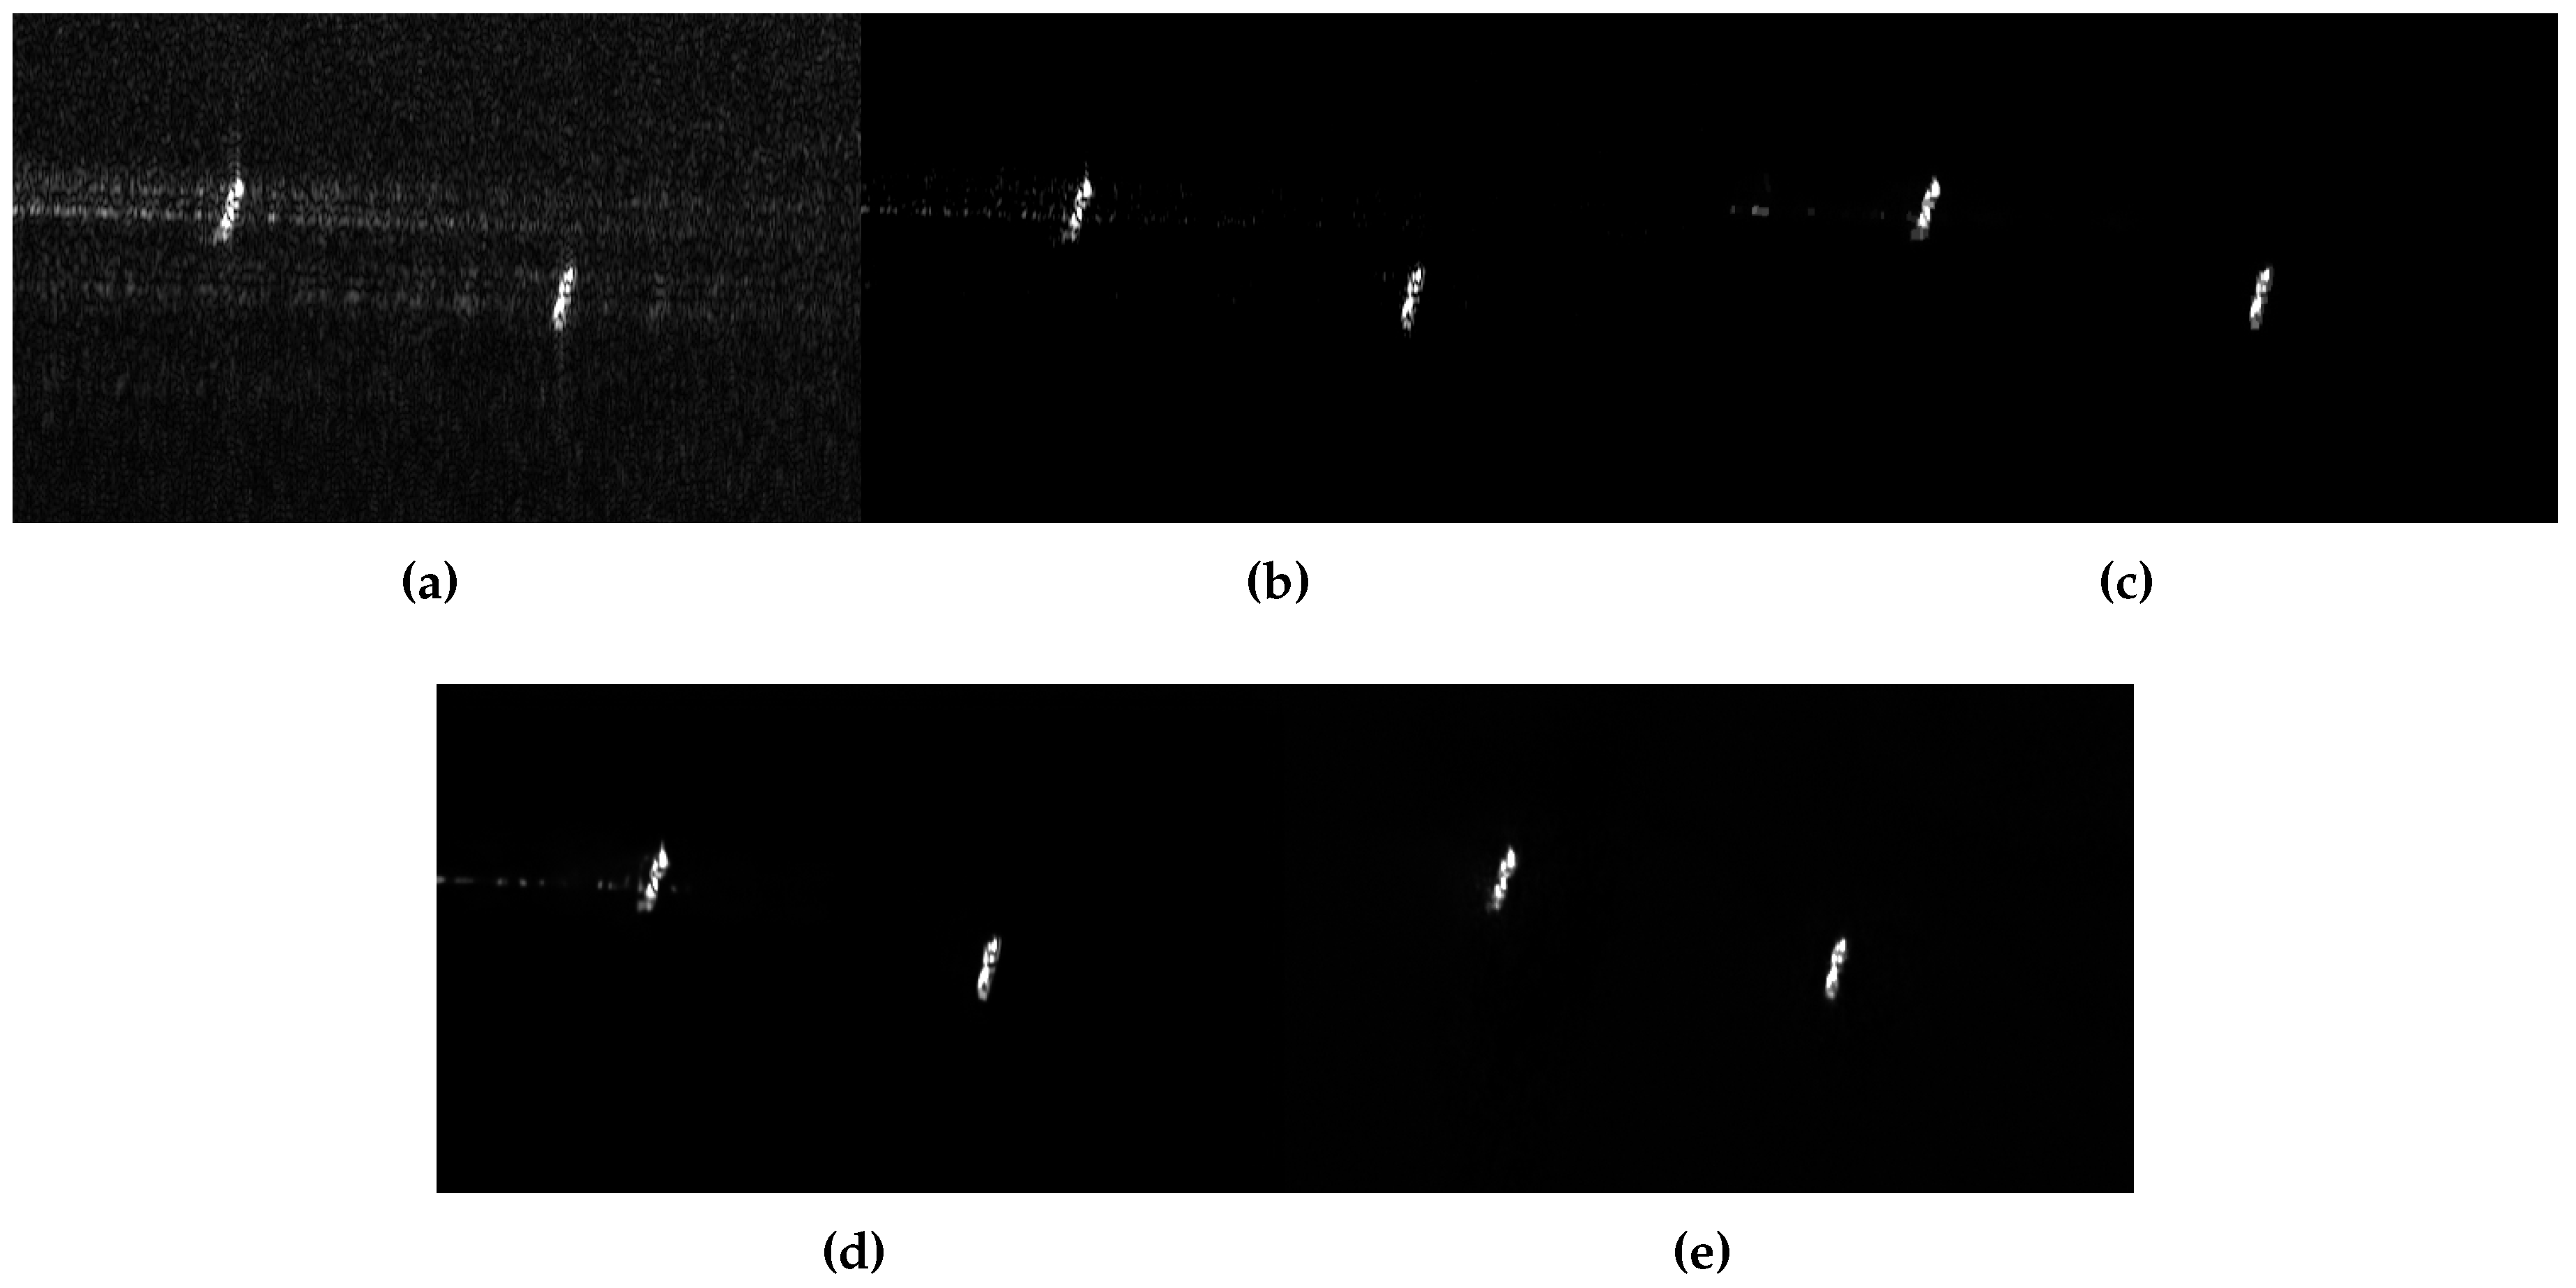
In the final phase, point target experiments were conducted with a 60% undersampling ratio to assess the impact of data undersampling. To simulate the undersampling, we randomly selected subsets from the fully sampled dataset, as no directly undersampled data was available. For reconstructing the scene, the same six techniques as used previously were applied. The results, depicted in
Figure 8 (
a), indicate that the RDA’s reconstruction under undersampling conditions leads to blurring, particularly in the azimuth direction. However, the other methods, including our proposed one, demonstrated varying degrees of success in reducing azimuth blurring, with ours showing the most notable enhancement. Additional slice analysis on Target 1 reinforced the effectiveness of our approach.
3.2.2. Experiment 2
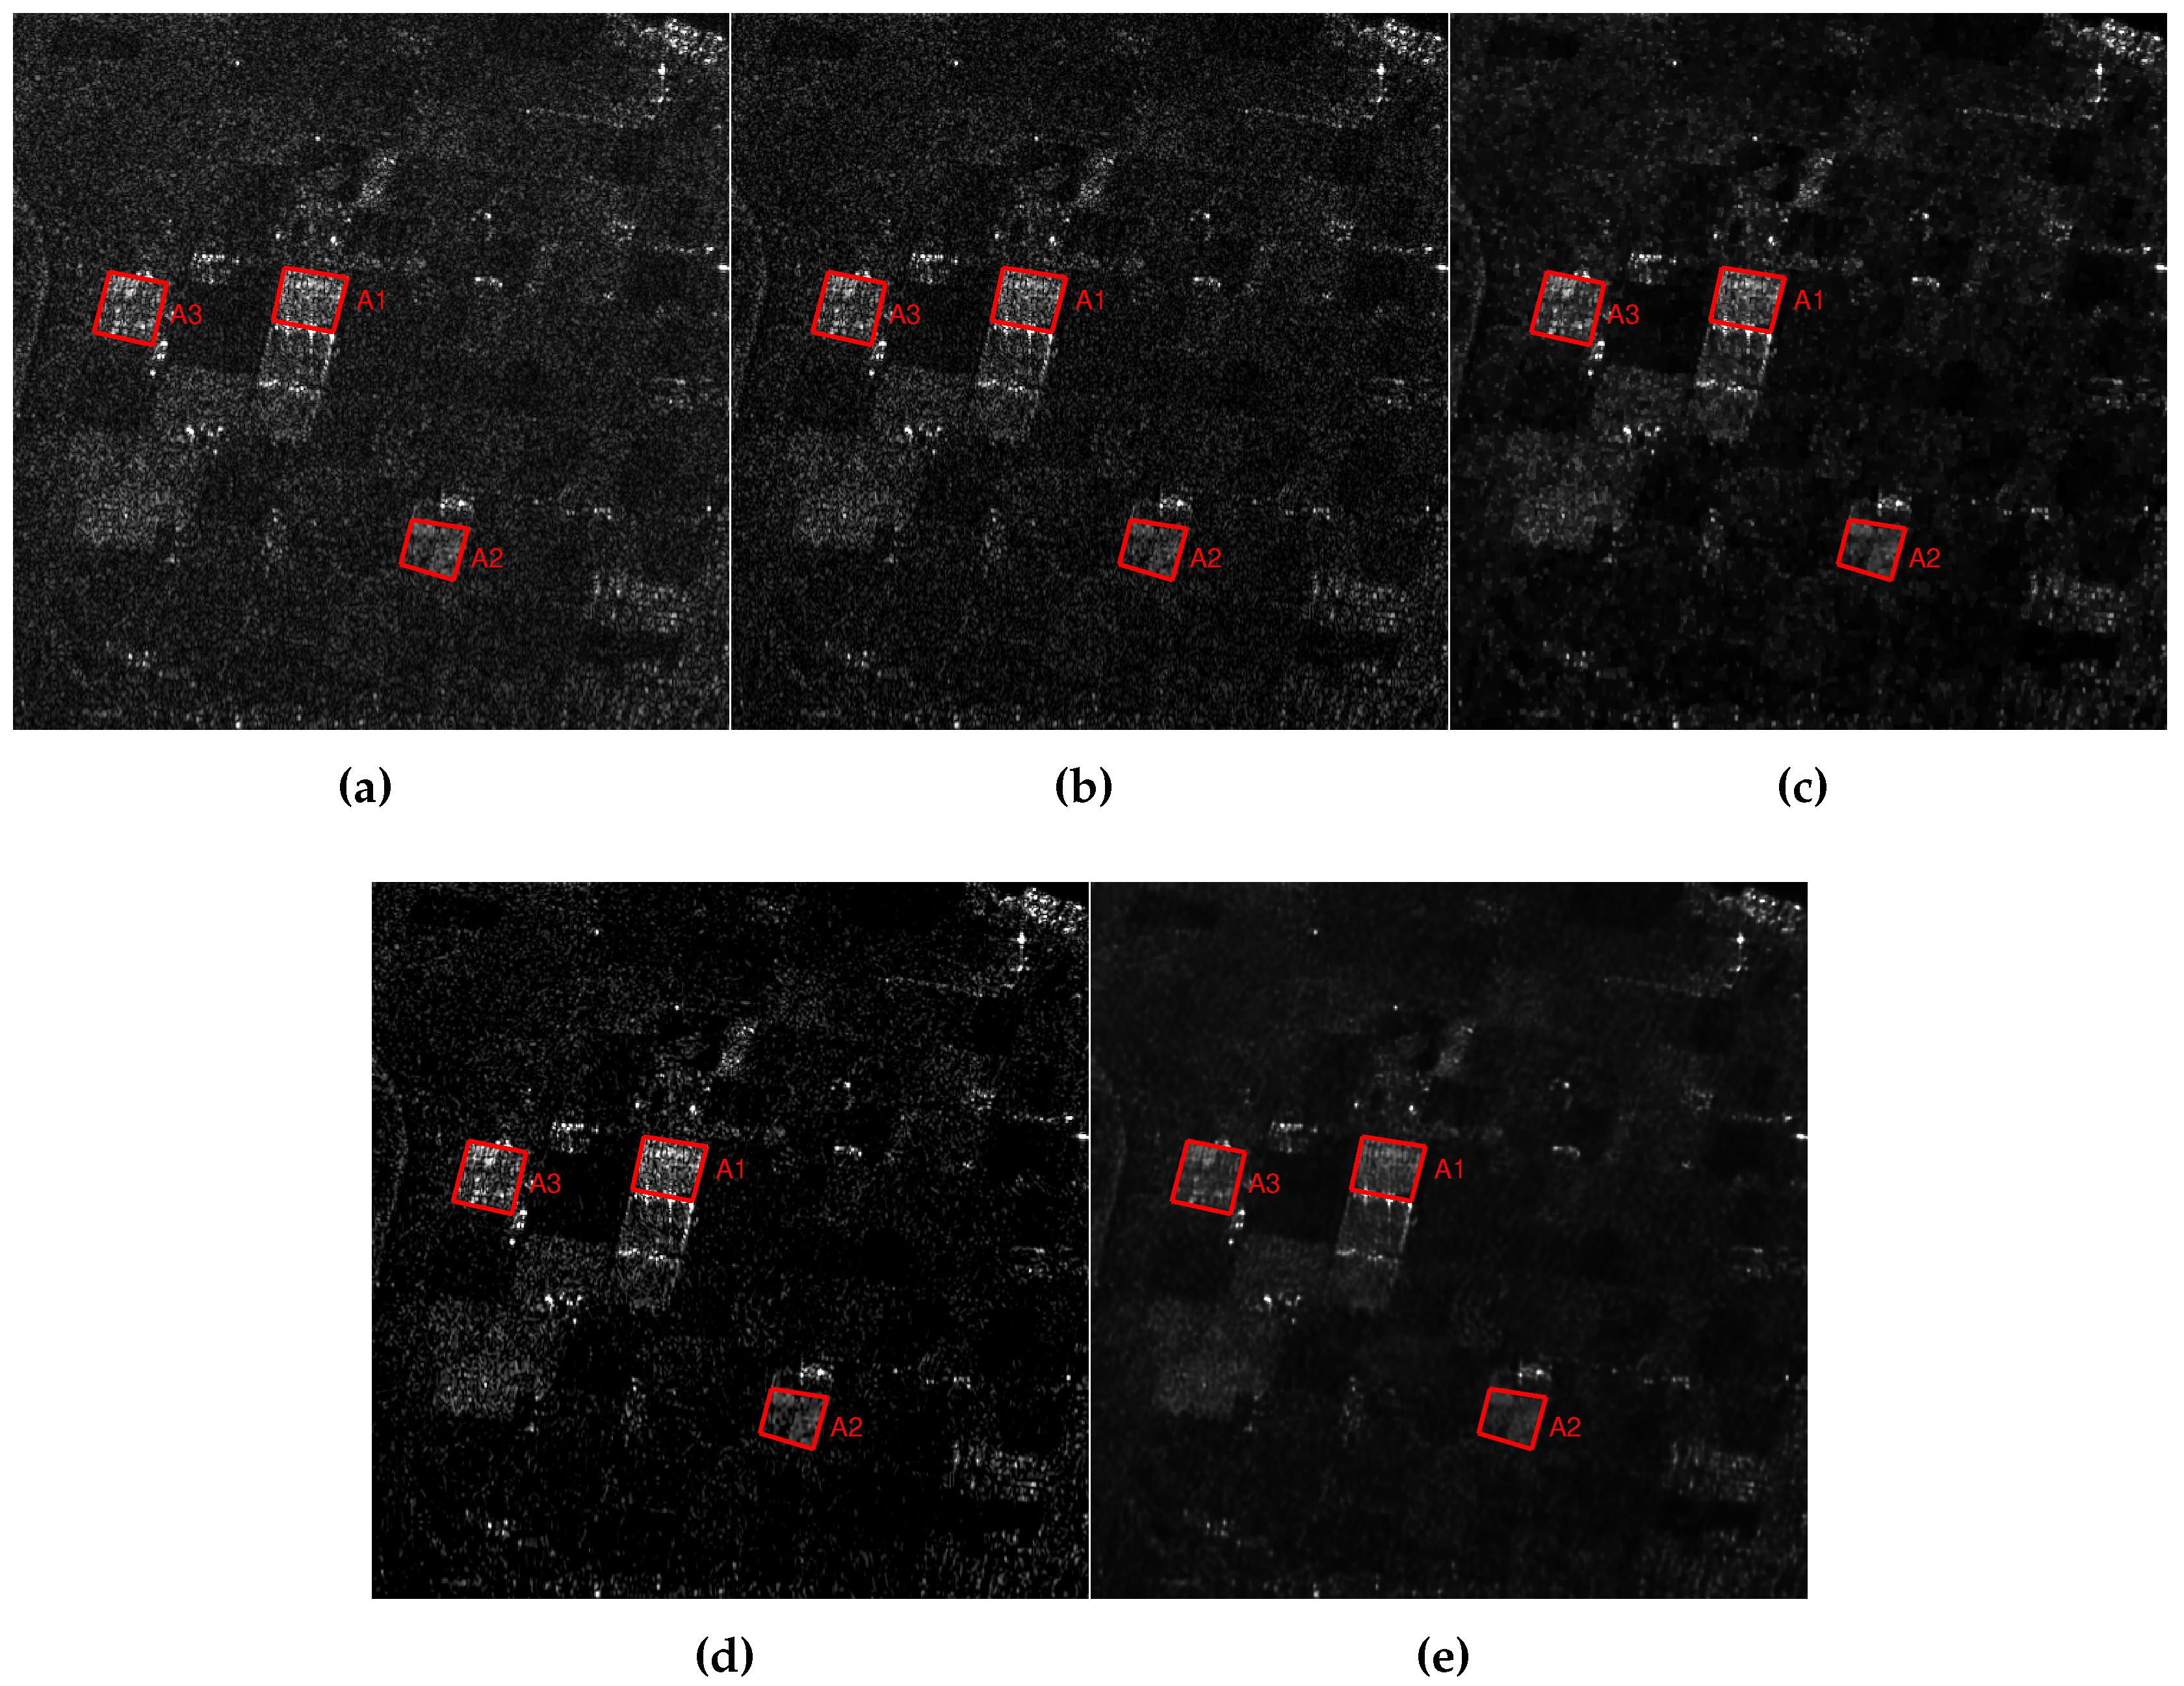
In the subsequent section, our focus shifts to evaluating the distributed target’s reconstruction accuracy and uniformity. For this purpose, a relatively flat terrain within the entire scene has been chosen as the subject of study. Each target zone within this area is marked with a red rectangular outline.
Initially, the RDA was employed to reconstruct the target scene. As depicted in
Figure 10(
a), numerous speckles are evident in the image, disrupting the continuity and uniformity of the ground surface. The
regularization method, introducing sparsity via soft threshold, resulted in an image where speckle noise was only mildly suppressed. Subsequently, we adopted an iterative approach incorporating both
and TV regularization to further reconstruct the scene, as illustrated in
Figure 10(
b). Comparing
Figure 10(
a) and
Figure 10(
b), it is evident that the outcome in
Figure 10(
c) exhibits enhanced uniformity and continuity. Following this, experiments were conducted using the CNN method, which, as shown in
Figure 10(
e), achieved superior speckle noise reduction and rendered the image smoother. Finally, imaging was executed using the DeepRED technique, with results suggesting that it offers the best denoising and smoothing effects, as displayed in
Figure 10(
e). Quantitative analyses were subsequently carried out to further substantiate these findings. To conduct a more detailed quantitative assessment of bias and uniformity, three ground areas encircled by red rectangles were chosen. For each of these areas, calculations of the ENL and RR were performed, utilizing the imaging results obtained previously. The corresponding numerical findings are summarized in
Table 1.
Analyzing the imaging outcomes depicted in
Figure 10 and the statistical data in
Table 1, it becomes evident that the DeepRED regularization method, as proposed in our study, not only mitigates noise and clutter but also lowers the variance of the reconstruction results, thereby enhancing the uniformity and continuity of the distributed target compared to the traditional RDA.
For a precise evaluation of reconstruction accuracy, we identified three specific areas, labeled A1/A2/A3, as experimental distributed targets in
Figure 10 (
a-e), each demarcated by a red rectangle. The mean and variance were calculated for these areas, and the ENL and RR were determined using Equation (
23). A lower
value correlates with improved radiometric resolution.
While both regularization and &TV regularization methods enhance radiometric resolution over the RDA method, the latter shows a more pronounced improvement. However, the bias induced by regularization somewhat negatively affects radiometric resolution. The CNN imaging method shows improvements in ENL and radiometric resolution. Notably, the DeepRED method, as proposed in this paper, attains the optimal ENL and radiometric resolution.
3.2.3. Experiment 3
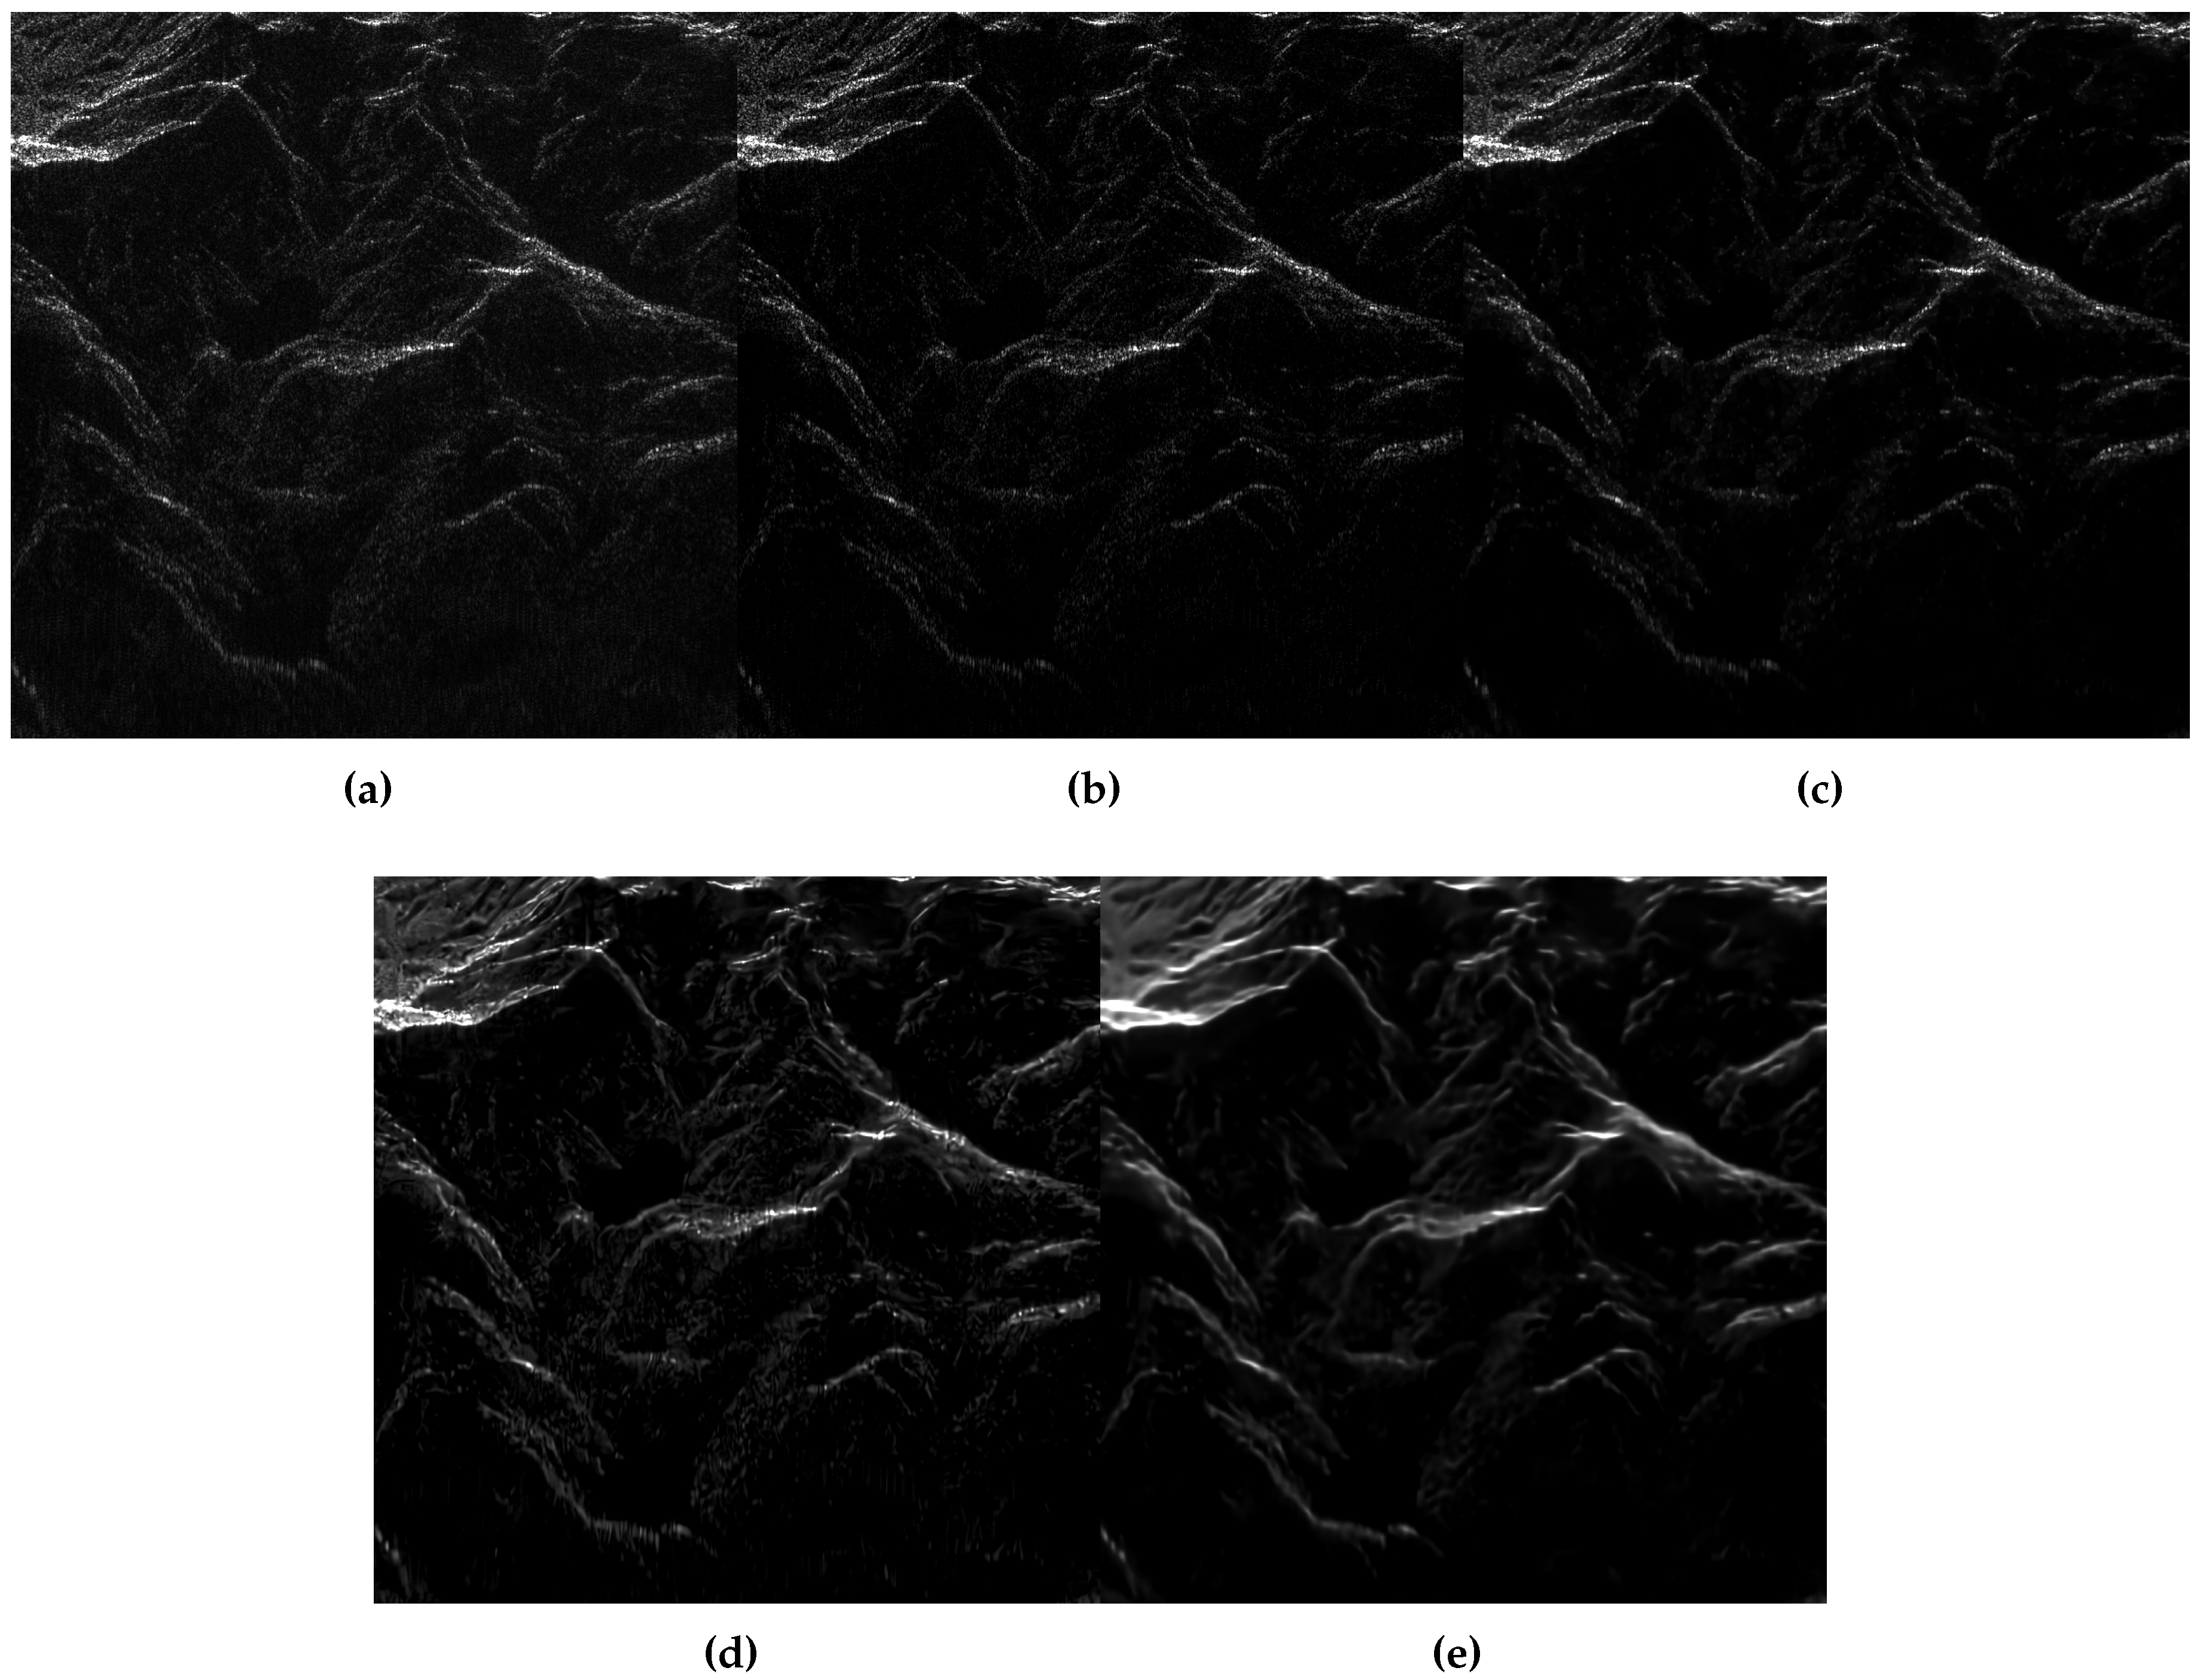
In Experiment 3, we conducted imaging experiments on the mountainous part of RADASAT data. Here, we selected a mountainous area as our subject within the complete scene. Different regularization terms lead to varying degrees of sparsity, influencing the continuity and integrity of the mountain imaging.
Initially, we employed the RDA to reconstruct the target scene. As illustrated in the figure, the image contains numerous speckles, causing discontinuities in the mountains. Following this, we reconstructed the target scene using the regularization method. Although it reduced speckle noise, the image remained discontinuous. Due to the soft-thresholding effect, some target features were lost. We then utilized the &TV regularization method for imaging. This somewhat improved the image’s continuity, but at the expense of making the texture blurred and less detailed. Subsequently, we applied CNN for imaging. While this approach significantly suppressed speckle noise and provided clear and detailed imaging, it still exhibited discontinuities and missed certain target details. Finally, we employed the DeepRED for imaging, which resulted in clear images, notable speckle noise suppression, and the most complete preservation of the target.
In addition, we conducted a quantitative analysis of the AES for mountainous regions, with the results presented in
Table 2. It is evident that the method proposed in this paper yields the highest AES, indicating that our imaging results have clear edges. While effectively suppressing speckle noise, our method does not excessively cause edge blurring. In contrast, the RDA leads to image blurring due to speckle noise, and both the
and
&TV regularization algorithms result in varying degrees of image unclarity, influenced by the selection of threshold values and the effects of regularization.
4. Discussion
In this study, we have introduced an innovative unsupervised approach to SAR imaging, leveraging the DeepRED regularization method. This approach diverges from traditional methods by employing a RDA-based echo simulation operator instead of the conventional observation matrix, alongside the ADMM framework for decoupling. Our method’s efficacy was rigorously tested through a series of simulation experiments and applied to RADARSAT data, benchmarked against methods like RDA, L1 regularization, L1&TV regularization, and CNN-based imaging.
The results of our experiments were revealing. For distributed targets, our technique showed a remarkable proficiency in suppressing speckle noise, leading to smoother imaging areas. This was particularly evident in point target imaging within RADARSAT data’s ship regions, where our method excelled in delineating clear edges and internal structures, even amid the lowest noise levels. Furthermore, our approach outperformed others in imaging of plain areas and mountainous terrains, displaying superior number of looks, radiometric resolution, and maintaining clarity without sacrificing target details. This demonstrates not just the method’s effectiveness in noise suppression and edge preservation, but also its versatility across different imaging scenarios.
5. Conclusion
The development and validation of the DeepRED-based sparse SAR imaging method represent a significant step forward in SAR imaging technology. This method has shown a unique capability to handle various imaging challenges, from speckle noise reduction to edge clarity and target integrity preservation. Its adaptability to different environments and noise levels underscores its potential as a robust tool for advanced SAR imaging applications. As SAR imaging continues to evolve, methodologies like ours will play a pivotal role in enhancing the clarity and accuracy of the images captured, thereby contributing significantly to fields like remote sensing and earth observation.
Author Contributions
Conceptualization, Y.Z., Z.Z. and H.T.; methodology, Y.Z. and Z.Z.; software, H.T., Q.L.; writing—original draft preparation, Y.Z. and Q.L.; writing—review and editing, B.W.-K.L. and Y.Z.; supervision, Y.Z., B.W.-K.L. and Z.Z.; funding acquisition, Y.Z. All authors have read and agreed to the published version of the manuscript.
Funding
This research was funded by the Natural Science Foundation of Guangdong Province under Grant 2021A1515012009.
Data Availability Statement
The data utilized in this study was sourced from the RADARSAT dataset, which is openly accessible at the following URL: http//us.artechhouse.com/Assets/downloads/Cumming_058-3.zip. The methodology employed for data processing is based on the techniques outlined in the reference textbook, "Digital Processing of Synthetic Aperture Radar Data," available for reference at https://us.artechhouse.com/Digital-Processing-of-Synthetic-Aperture-Radar-Data-P1549.aspx. This dataset and the associated processing methods were instrumental in the analysis and findings presented in this study.
Conflicts of Interest
The authors declare no conflict of interest.
References
- Curlander, J.C.; Mcdonough, R.N. Synthetic Aperture Radar: Systems and Signal Processing. 1991.
- Herman, M.A.; Strohmer, T. High-resolution radar via compressed sensing. IEEE transactions on signal processing 2009, 57, 2275–2284. [Google Scholar] [CrossRef]
- Onhon, N.Ö.; Cetin, M. A sparsity-driven approach for joint SAR imaging and phase error correction. IEEE Transactions on Image Processing 2011, 21, 2075–2088. [Google Scholar] [CrossRef] [PubMed]
- Zhang, B.; Hong, W.; Wu, Y. Sparse microwave imaging: Principles and applications. Science China Information Sciences 2012, 55, 1722–1754. [Google Scholar] [CrossRef]
- Xu, G.; Zhang, B.; Yu, H.; Chen, J.; Xing, M.; Hong, W. Sparse Synthetic Aperture Radar Imaging From Compressed Sensing and Machine Learning: Theories, applications, and trends. IEEE Geoscience and Remote Sensing Magazine 2022, 10, 32–69. [Google Scholar] [CrossRef]
- Zhang, J.; Lu, X.; Song, Y.; Yu, D.; Bi, H. Sparse Stripmap SAR Autofocusing Imaging Combining Phase Error Estimation and L1-Norm Regularization Reconstruction. IEEE Transactions on Geoscience and Remote Sensing 2023, 61, 1–12. [Google Scholar] [CrossRef]
- Bi, H.; Zhang, B.; Zhu, X.; Hong, W. Azimuth-range decouple-based L1 regularization method for wide ScanSAR imaging via extended chirp scaling. Journal of Applied Remote Sensing 2017, 11, 015007–015007. [Google Scholar] [CrossRef]
- Xu, Z.; Wei, Z.; Wu, C.; Zhang, B. Multichannel Sliding Spotlight SAR Imaging Based on Sparse Signal Processing. IGARSS 2018 - 2018 IEEE International Geoscience and Remote Sensing Symposium, 2018, pp. 3703–3706. [CrossRef]
- Bi, H.; Zhang, B.; Zhu, X.X.; Jiang, C.; Wei, Z.; Hong, W. Lq Regularization Method for Spaceborne SCANSAR and TOPS SAR Imaging. Proceedings of EUSAR 2016: 11th European Conference on Synthetic Aperture Radar, 2016, pp. 1–4.
- Kang, M.S.; Kim, K.T. Compressive sensing based SAR imaging and autofocus using improved Tikhonov regularization. IEEE Sensors Journal 2019, 19, 5529–5540. [Google Scholar] [CrossRef]
- Rodríguez, P. Total variation regularization algorithms for images corrupted with different noise models: a review. Journal of Electrical and Computer Engineering 2013, 2013, 10–10. [Google Scholar] [CrossRef]
- Autieri, R.; Ferraiuolo, G.; Pascazio, V. Bayesian Regularization in Nonlinear Imaging: Reconstructions From Experimental Data in Nonlinearized Microwave Tomography. IEEE Transactions on Geoscience and Remote Sensing 2011, 49, 801–813. [Google Scholar] [CrossRef]
- Ongie, G.; Jalal, A.; Metzler, C.A.; Baraniuk, R.G.; Dimakis, A.G.; Willett, R. Deep Learning Techniques for Inverse Problems in Imaging. IEEE Journal on Selected Areas in Information Theory 2020, 1, 39–56. [Google Scholar] [CrossRef]
- Kamilov, U.S.; Bouman, C.A.; Buzzard, G.T.; Wohlberg, B. Plug-and-Play Methods for Integrating Physical and Learned Models in Computational Imaging: Theory, algorithms, and applications. IEEE Signal Processing Magazine 2023, 40, 85–97. [Google Scholar] [CrossRef]
- Zhao, S.; Ni, J.; Liang, J.; Xiong, S.; Luo, Y. End-to-End SAR Deep Learning Imaging Method Based on Sparse Optimization. Remote Sensing 2021, 13. [Google Scholar] [CrossRef]
- Mataev, G.; Milanfar, P.; Elad, M. DeepRED: Deep image prior powered by RED. Proceedings of the IEEE/CVF International Conference on Computer Vision Workshops, 2019, pp. 0–0.
- Fang, J.; Xu, Z.; Zhang, B.; Hong, W.; Wu, Y. Fast Compressed Sensing SAR Imaging Based on Approximated Observation. IEEE Journal of Selected Topics in Applied Earth Observations and Remote Sensing 2014, 7, 352–363. [Google Scholar] [CrossRef]
- Romano, Y.; Elad, M.; Milanfar, P. The little engine that could: Regularization by denoising (RED). SIAM Journal on Imaging Sciences 2017, 10, 1804–1844. [Google Scholar] [CrossRef]
- Buades, A.; Coll, B.; Morel, J.M. A non-local algorithm for image denoising. 2005 IEEE computer society conference on computer vision and pattern recognition (CVPR’05). Ieee, 2005, Vol. 2, pp. 60–65.
- Dabov, K.; Foi, A.; Katkovnik, V.; Egiazarian, K. Image denoising by sparse 3-D transform-domain collaborative filtering. IEEE Transactions on image processing 2007, 16, 2080–2095. [Google Scholar] [CrossRef] [PubMed]
- Afonso, M.V.; Bioucas-Dias, J.M.; Figueiredo, M.A.T. Fast Image Recovery Using Variable Splitting and Constrained Optimization. IEEE Transactions on Image Processing 2010, 19, 2345–2356. [Google Scholar] [CrossRef] [PubMed]
- Alver, M.B.; Saleem, A.; Çetin, M. Plug-and-Play Synthetic Aperture Radar Image Formation Using Deep Priors. IEEE Transactions on Computational Imaging 2021, 7, 43–57. [Google Scholar] [CrossRef]
- Lee, J.S.; Jurkevich, L.; Dewaele, P.; Wambacq, P.; Oosterlinck, A. Speckle filtering of synthetic aperture radar images: A review. Remote sensing reviews 1994, 8, 313–340. [Google Scholar] [CrossRef]
- Chen, Q.; Li, Z.; Zhang, P.; Tao, H.; Zeng, J. A preliminary evaluation of the GaoFen-3 SAR radiation characteristics in land surface and compared with Radarsat-2 and Sentinel-1A. IEEE Geoscience and Remote Sensing Letters 2018, 15, 1040–1044. [Google Scholar] [CrossRef]
- Ryu, E.; Liu, J.; Wang, S.; Chen, X.; Wang, Z.; Yin, W. Plug-and-play methods provably converge with properly trained denoisers. International Conference on Machine Learning. PMLR, 2019, pp. 5546–5557.
- Oliver, C.; Quegan, S. Understanding synthetic aperture radar images; SciTech Publishing, 2004.
|
Disclaimer/Publisher’s Note: The statements, opinions and data contained in all publications are solely those of the individual author(s) and contributor(s) and not of MDPI and/or the editor(s). MDPI and/or the editor(s) disclaim responsibility for any injury to people or property resulting from any ideas, methods, instructions or products referred to in the content. |
© 2023 by the authors. Licensee MDPI, Basel, Switzerland. This article is an open access article distributed under the terms and conditions of the Creative Commons Attribution (CC BY) license (http://creativecommons.org/licenses/by/4.0/).
