Submitted:
29 November 2023
Posted:
29 November 2023
You are already at the latest version
Abstract
Keywords:
1. Introduction
2. Materials and Methods
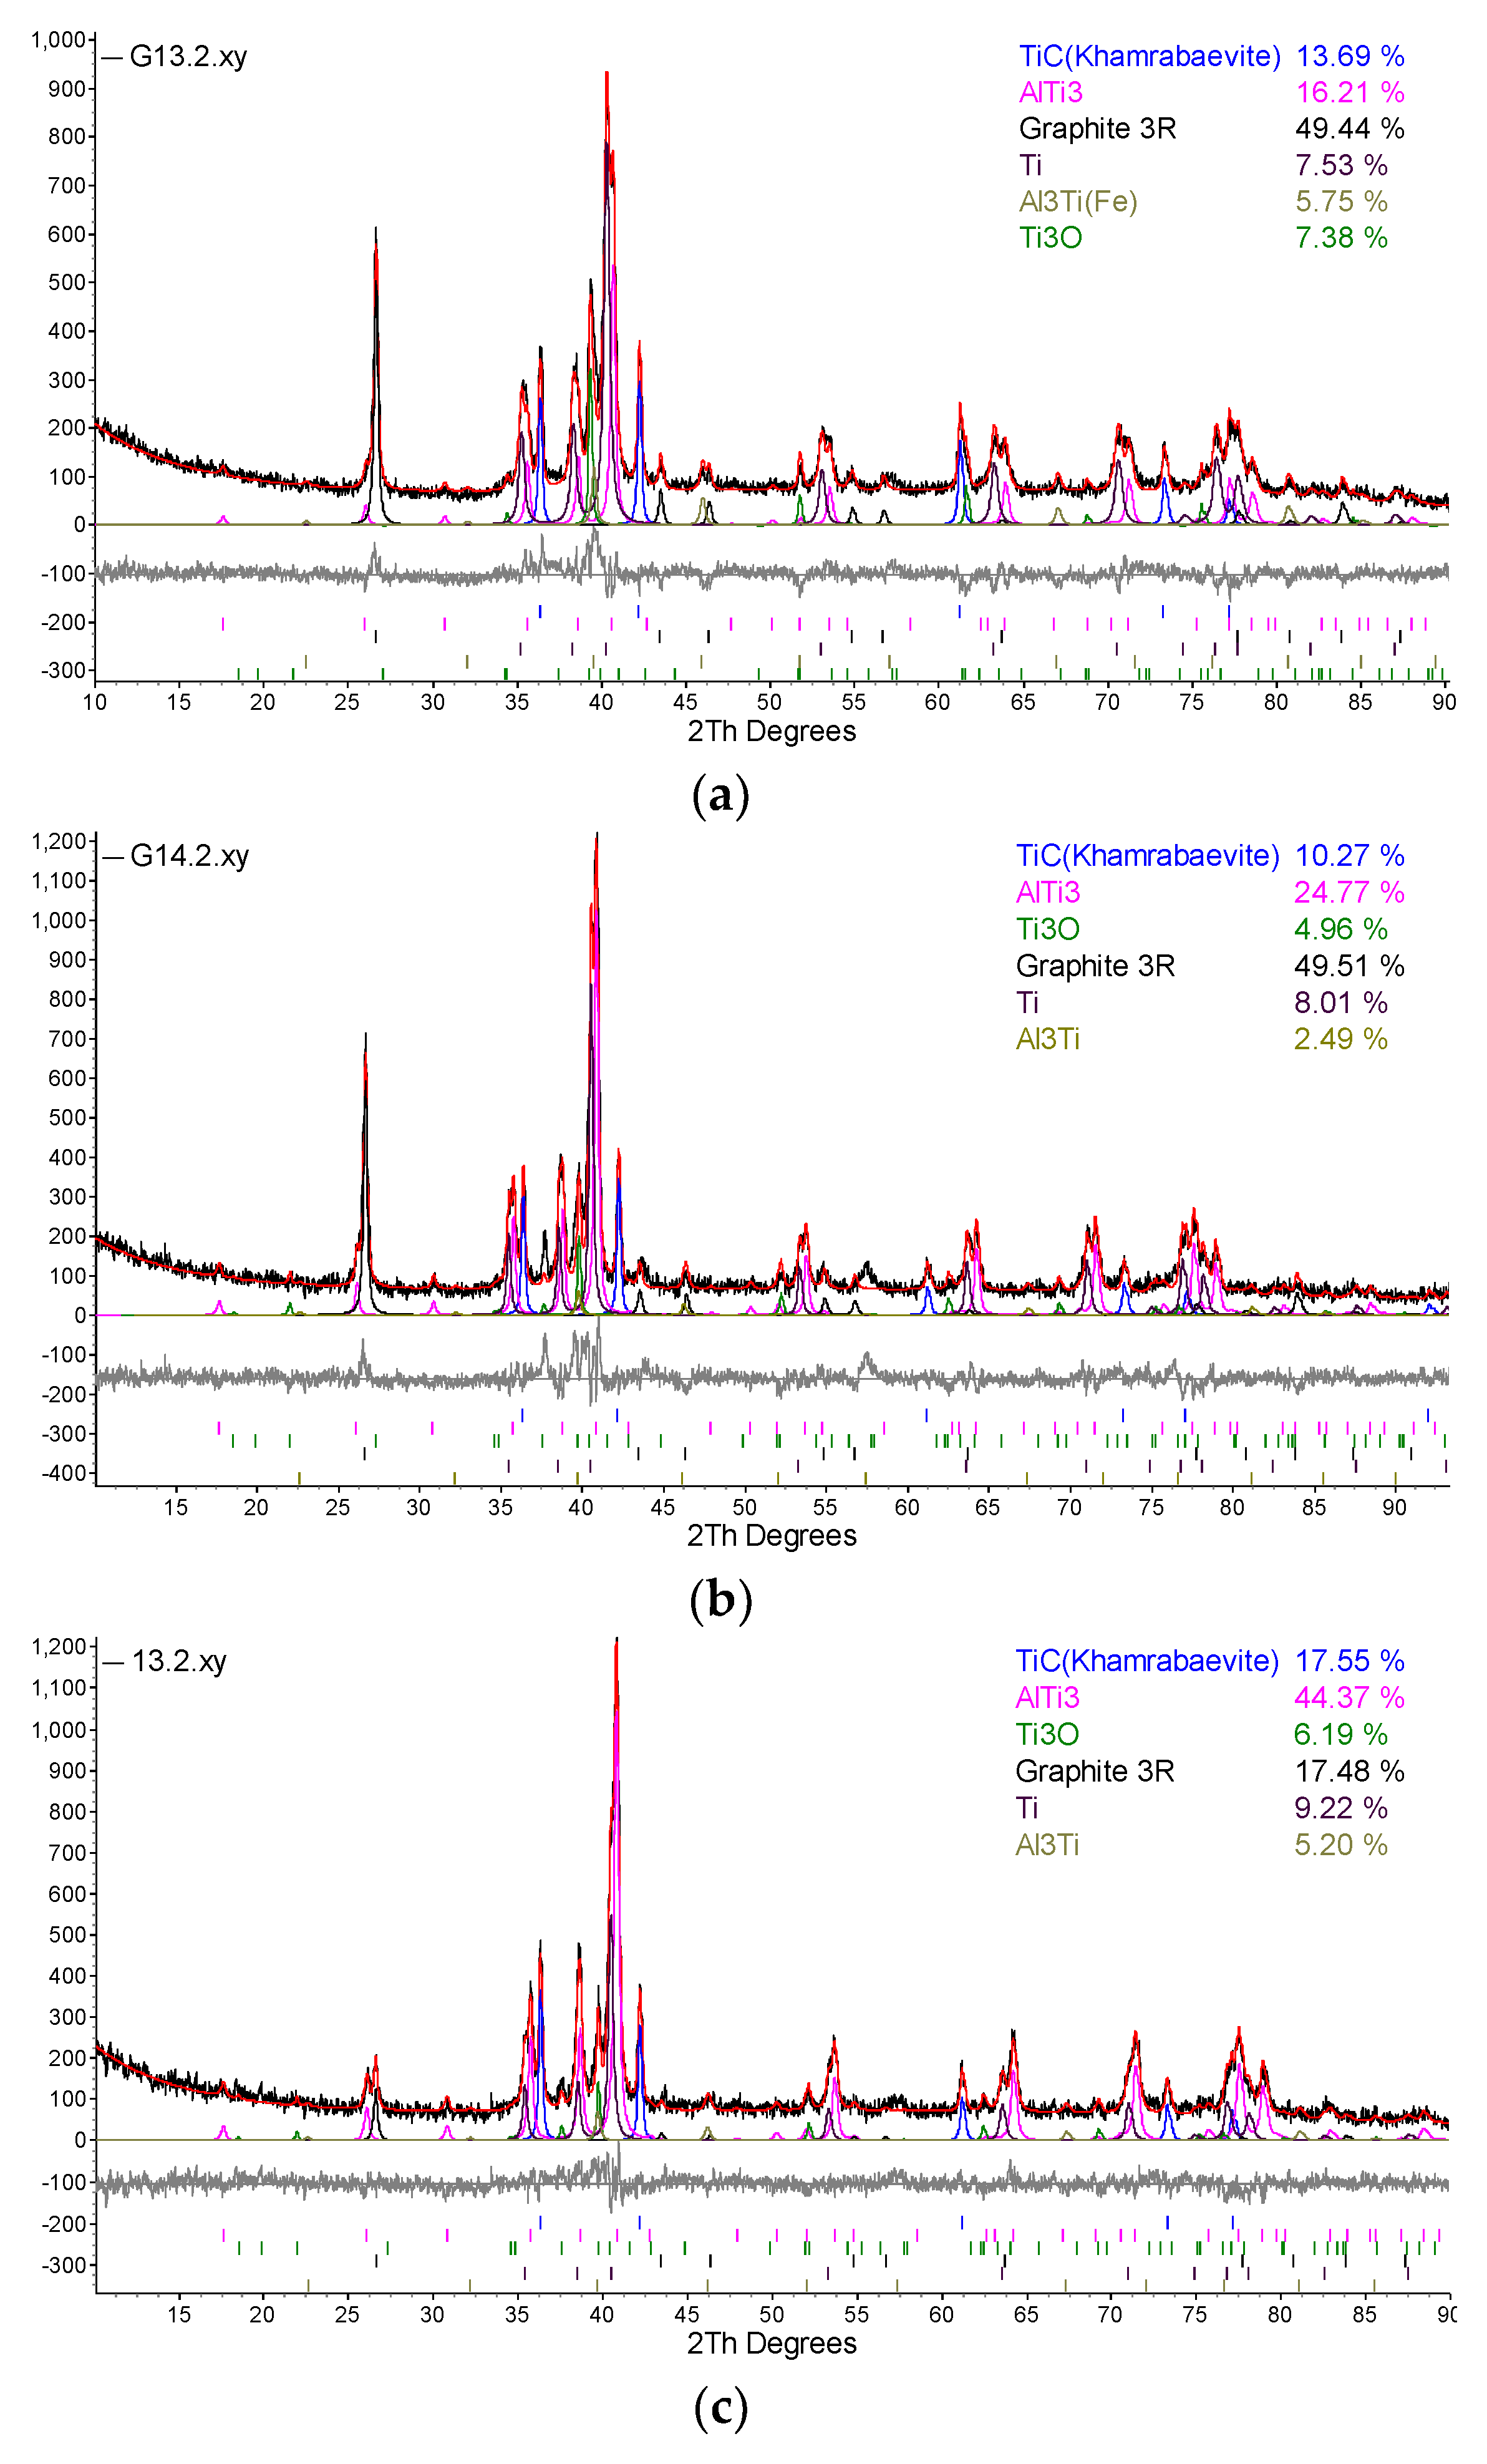
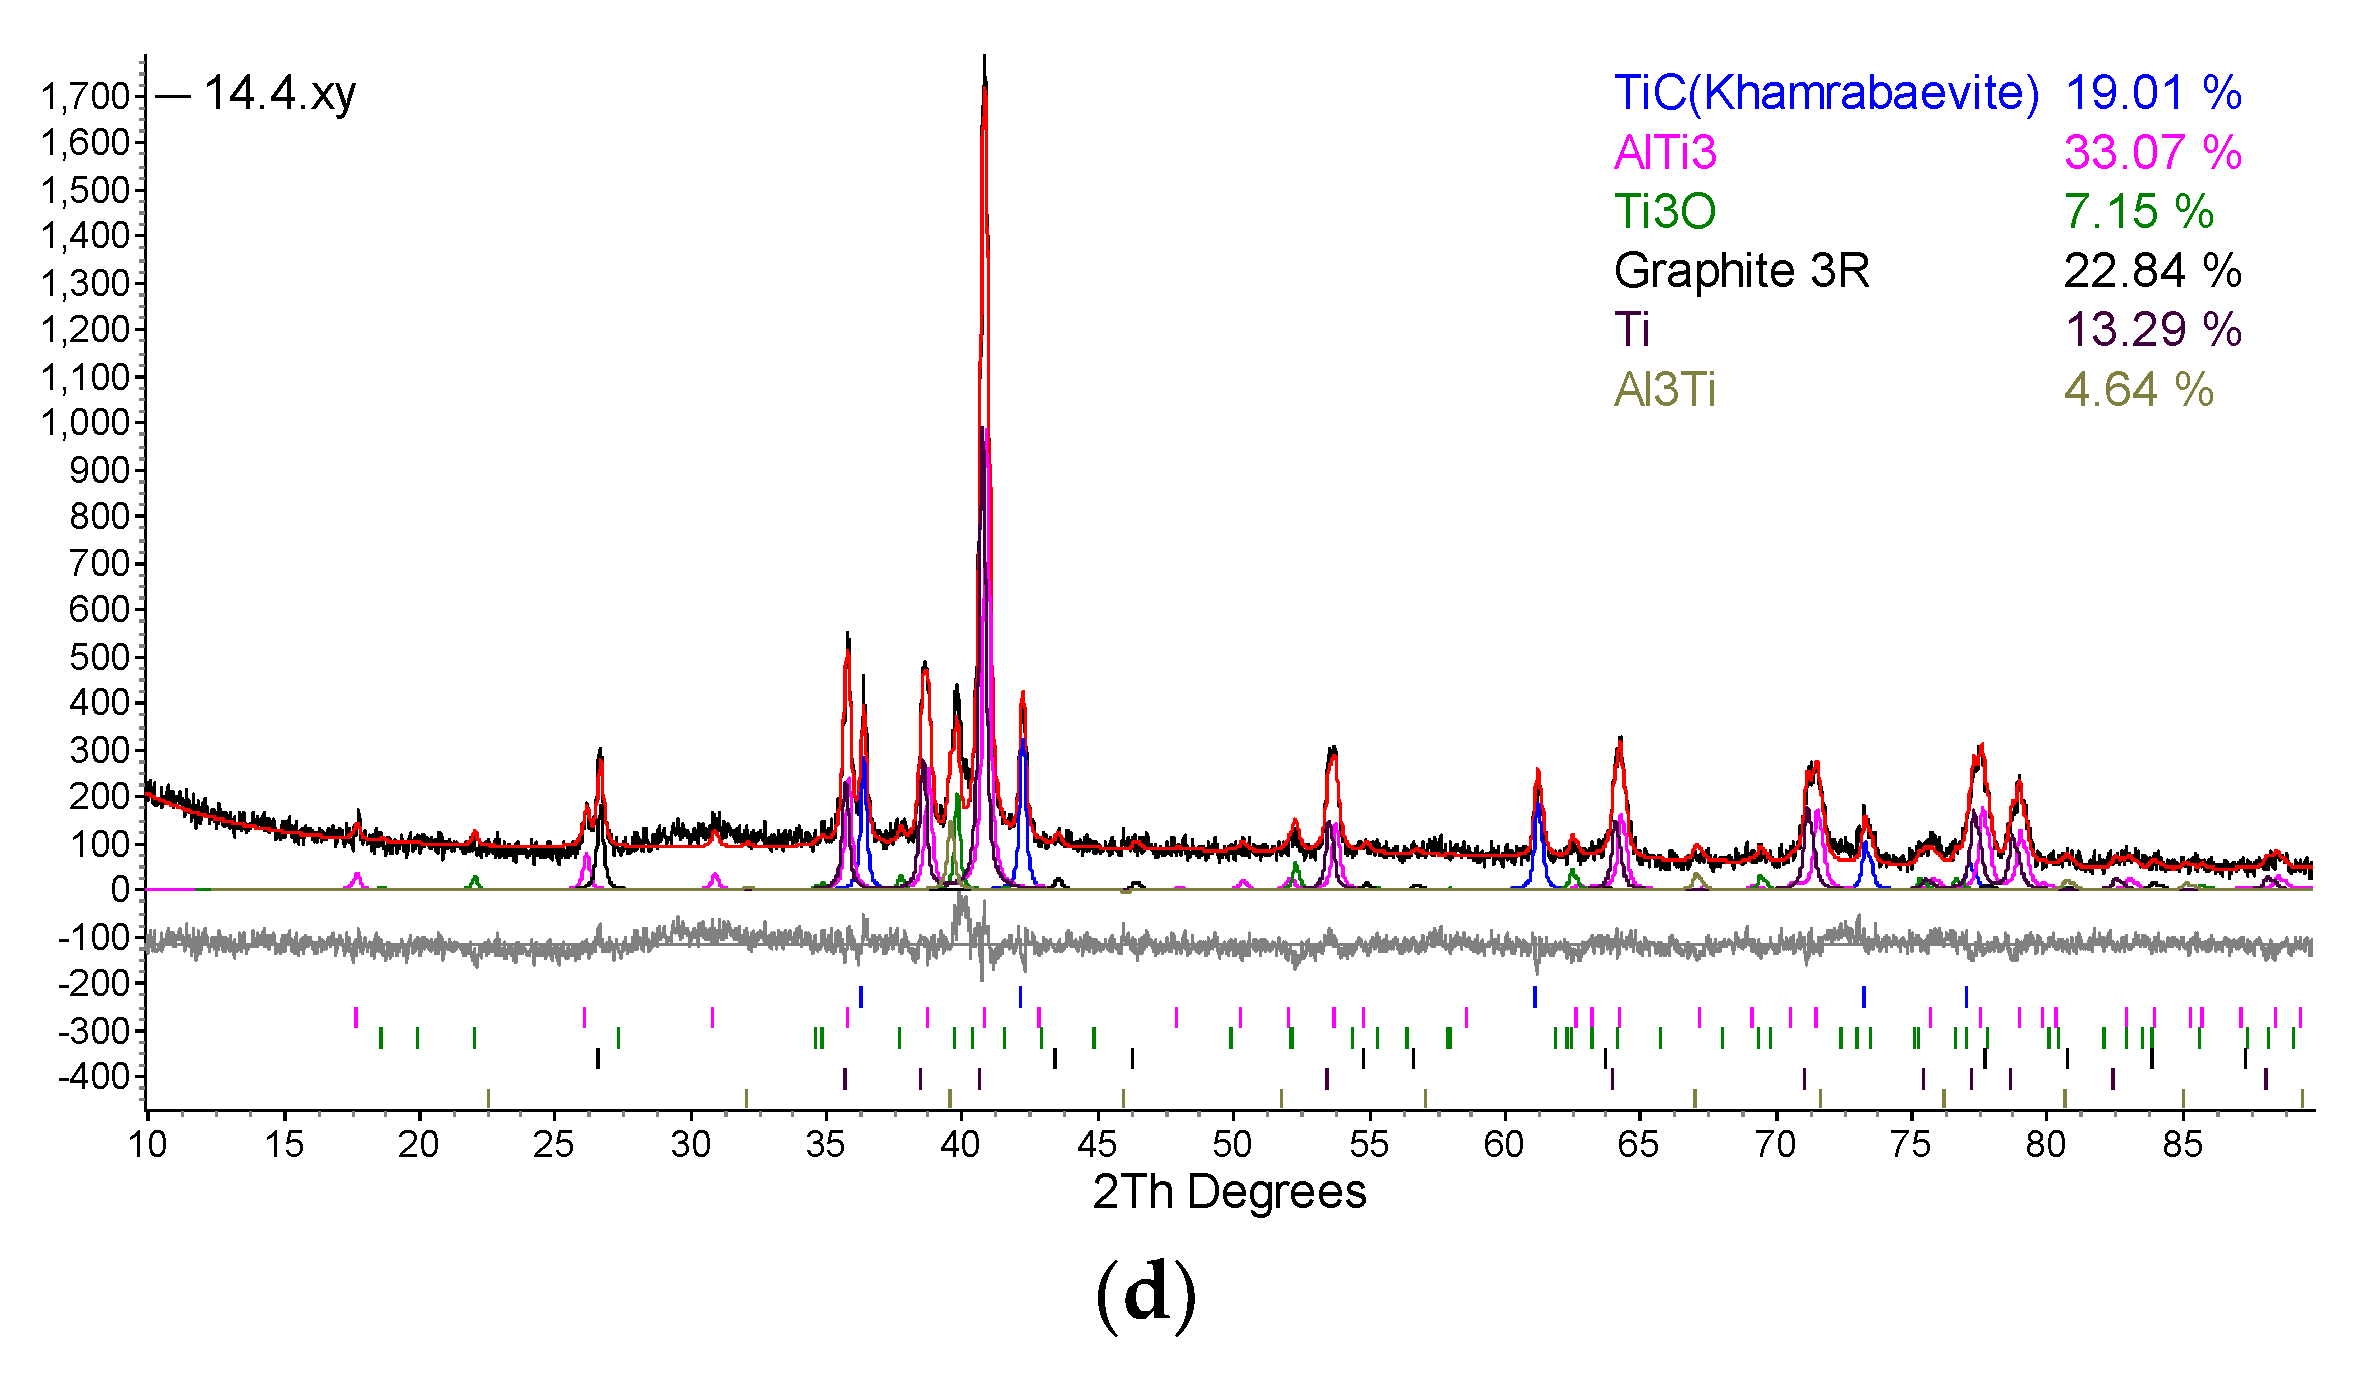
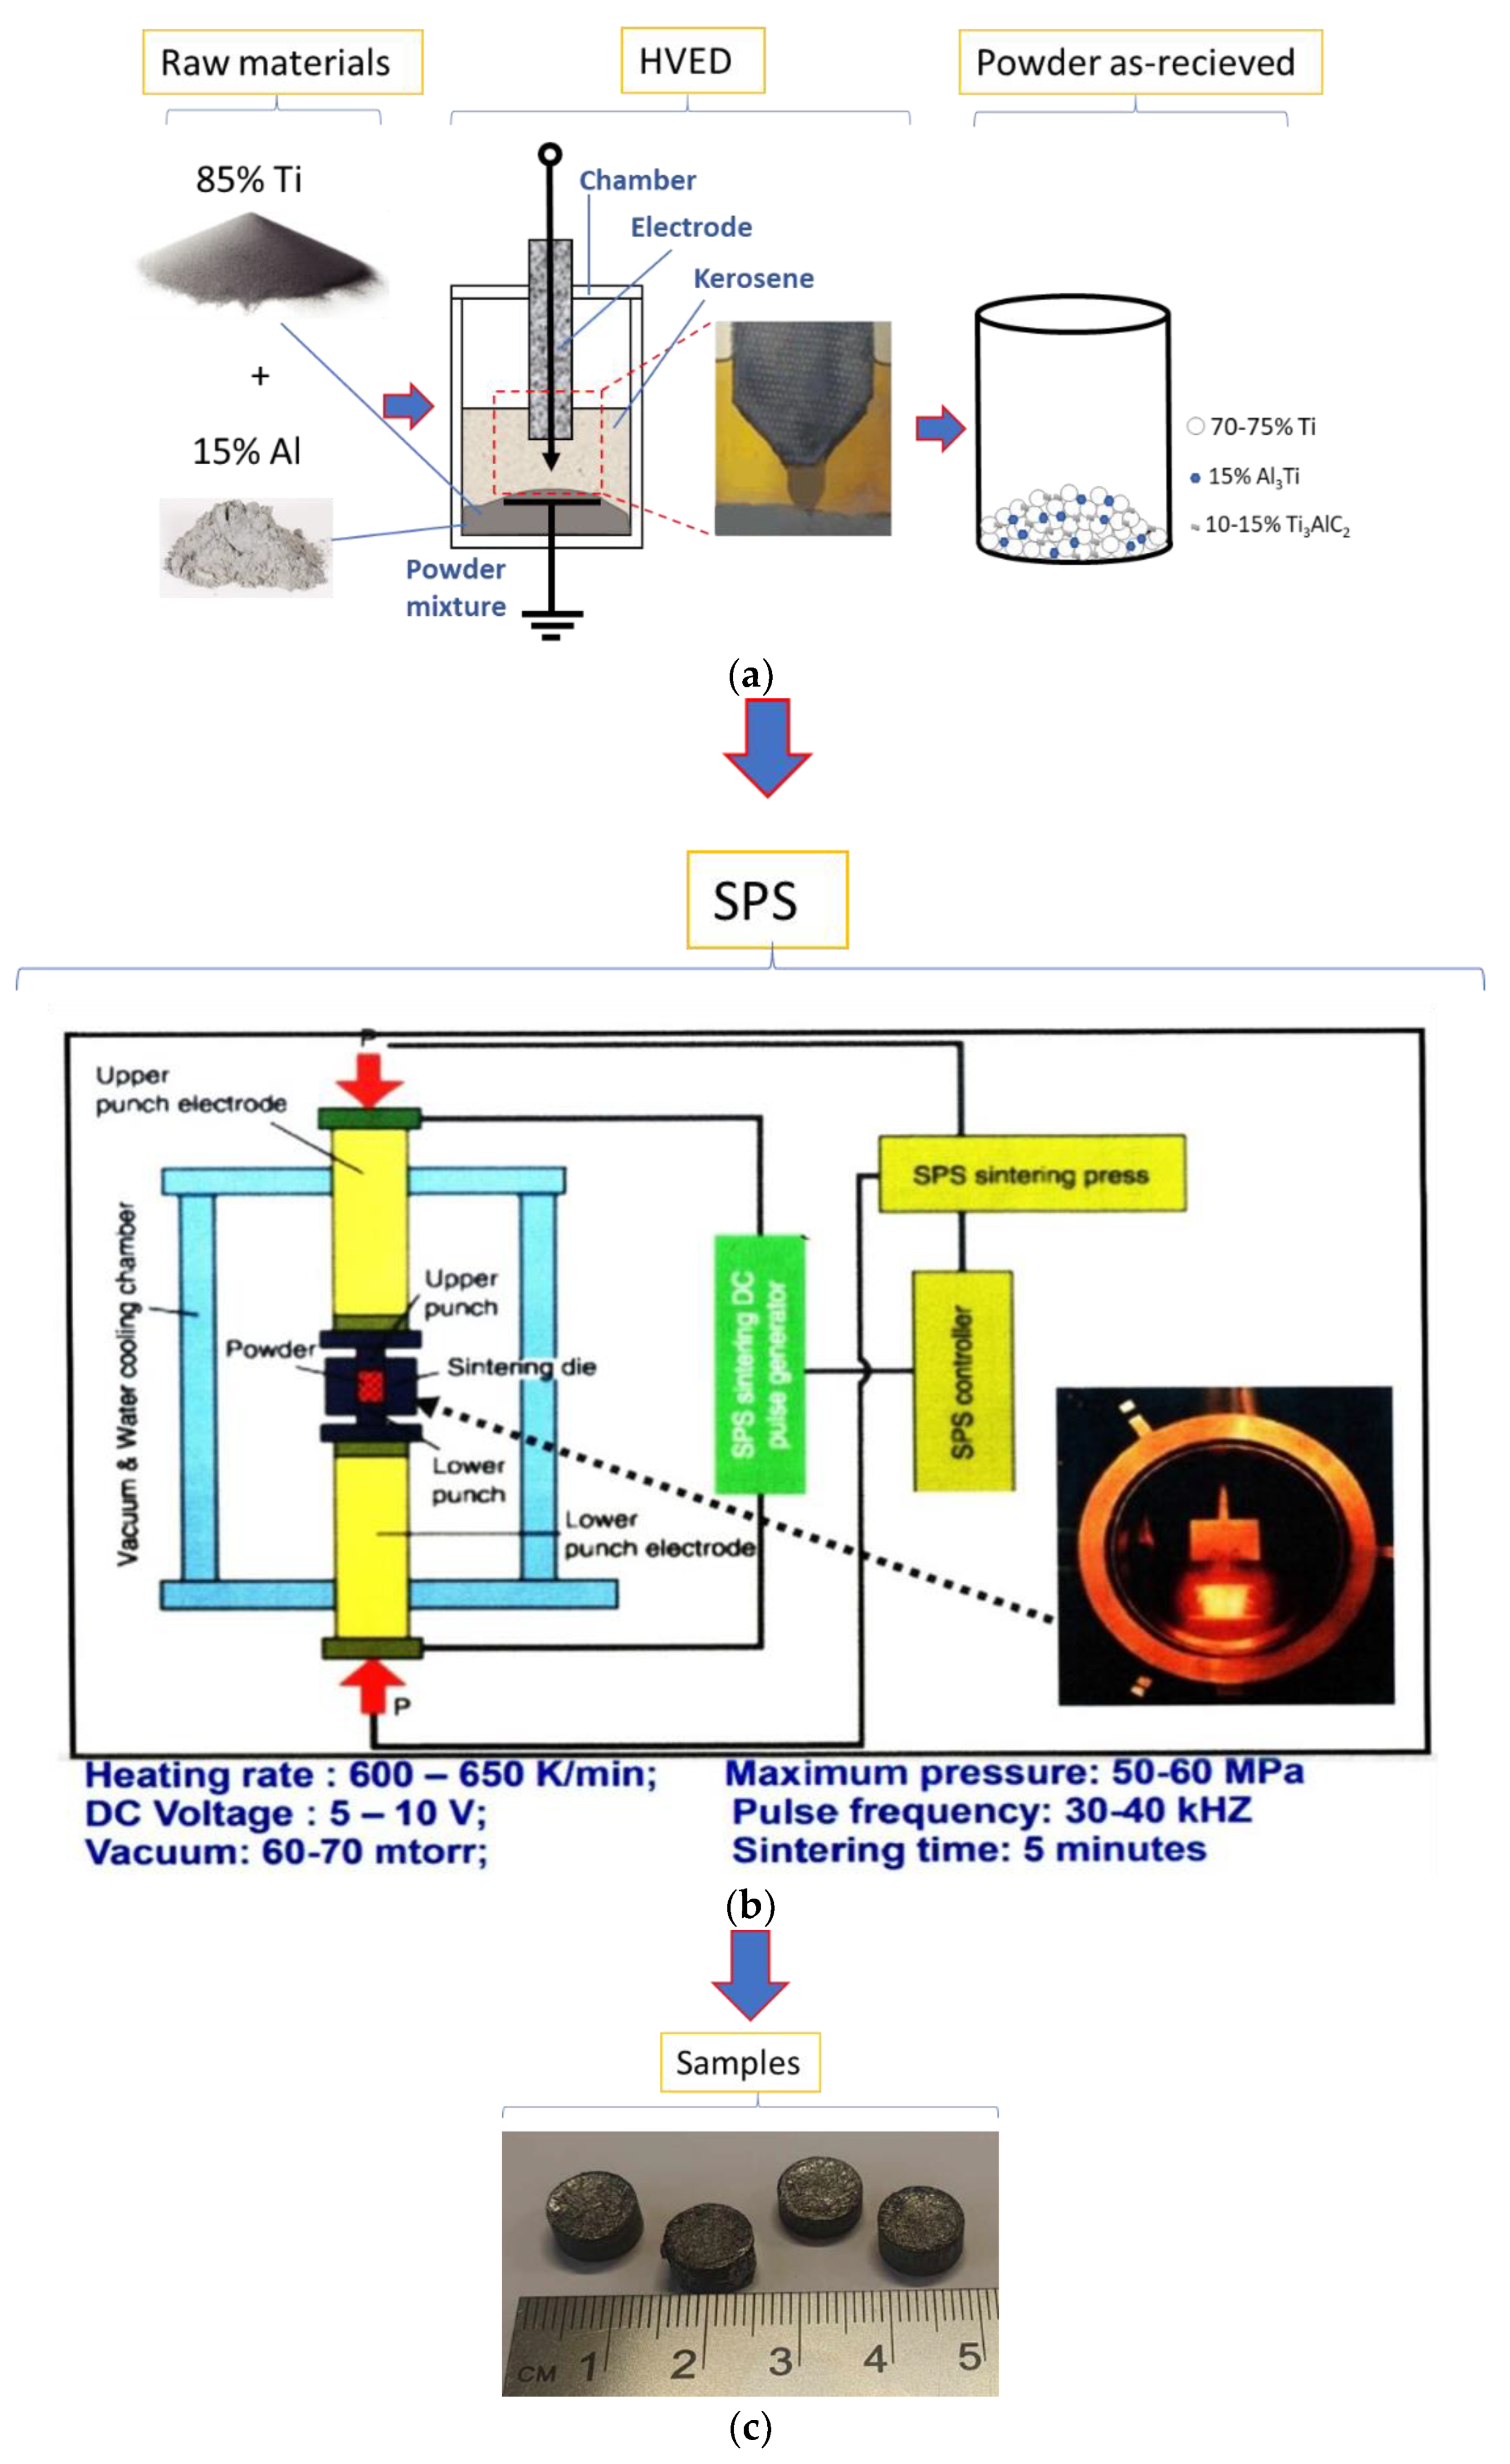
| Designation of specimens | Parameters of SPS | Composition of the powder after HVED treatment | ||
|---|---|---|---|---|
| T, °C | I, A | t, min | ||
| G13 | 950 | 840 | 5 | 75% Ti, 15% Al3Ti, 10% Ti3AlC2 |
| G14 | 960 | 770 | 5 | 70% Ti, 15% Al3Ti, 15% Ti3AlC2 |
| 13 | 985 | 995 | 5 | 75% Ti, 15% Al3Ti, 10% Ti3AlC2 |
| 14 | 1020 | 915 | 5 | 70% Ti, 15% Al3Ti, 15% Ti3AlC2 |
- -
- 532 nm wavelength.
- -
- Laser power at the sample surface - 3.5 mW.
- -
- Integration time - 10 s.
- -
- Signal was accumulated 10 times.
- -
- The tube voltage of 40 kV.
- -
- The tube current of 40 mA.
- -
- The X-ray beam was filtered with Ni 0.02 mm filter to select the CuKα wavelength (λ = 1.5406 Ǻ).
- -
- Diffraction patterns were recorded using a fast-counting detector Bruker LynxEye based on silicon strip technology.
- -
- Scanning over the range 2θ = 20–90° at a scanning speed of 6°/min using a coupled two theta/theta scan type.
3. Results and Discussion

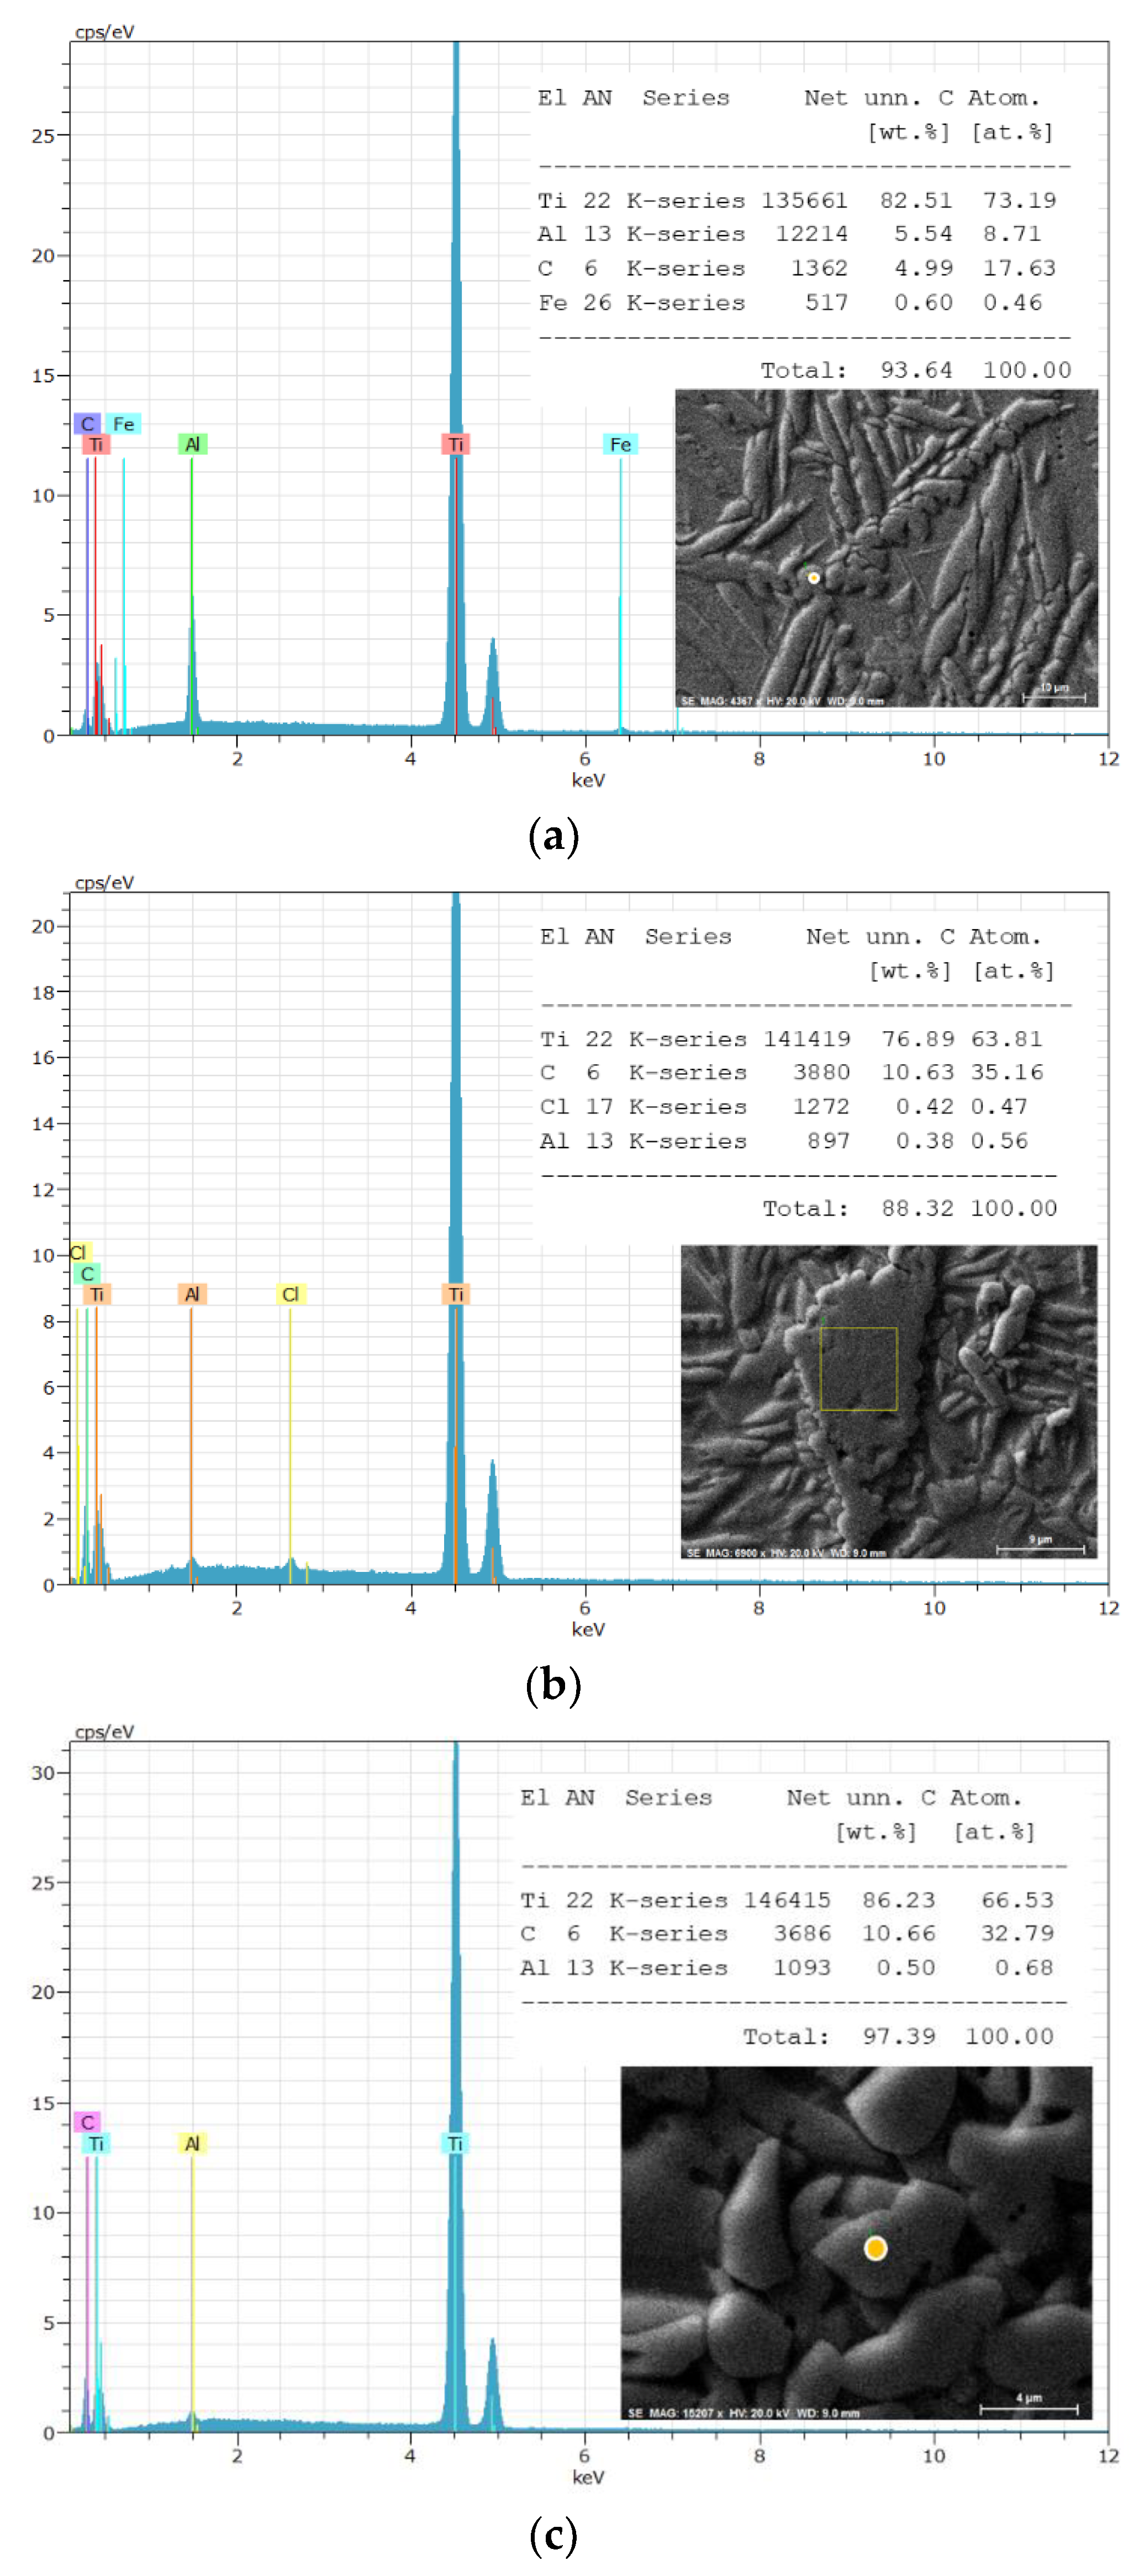
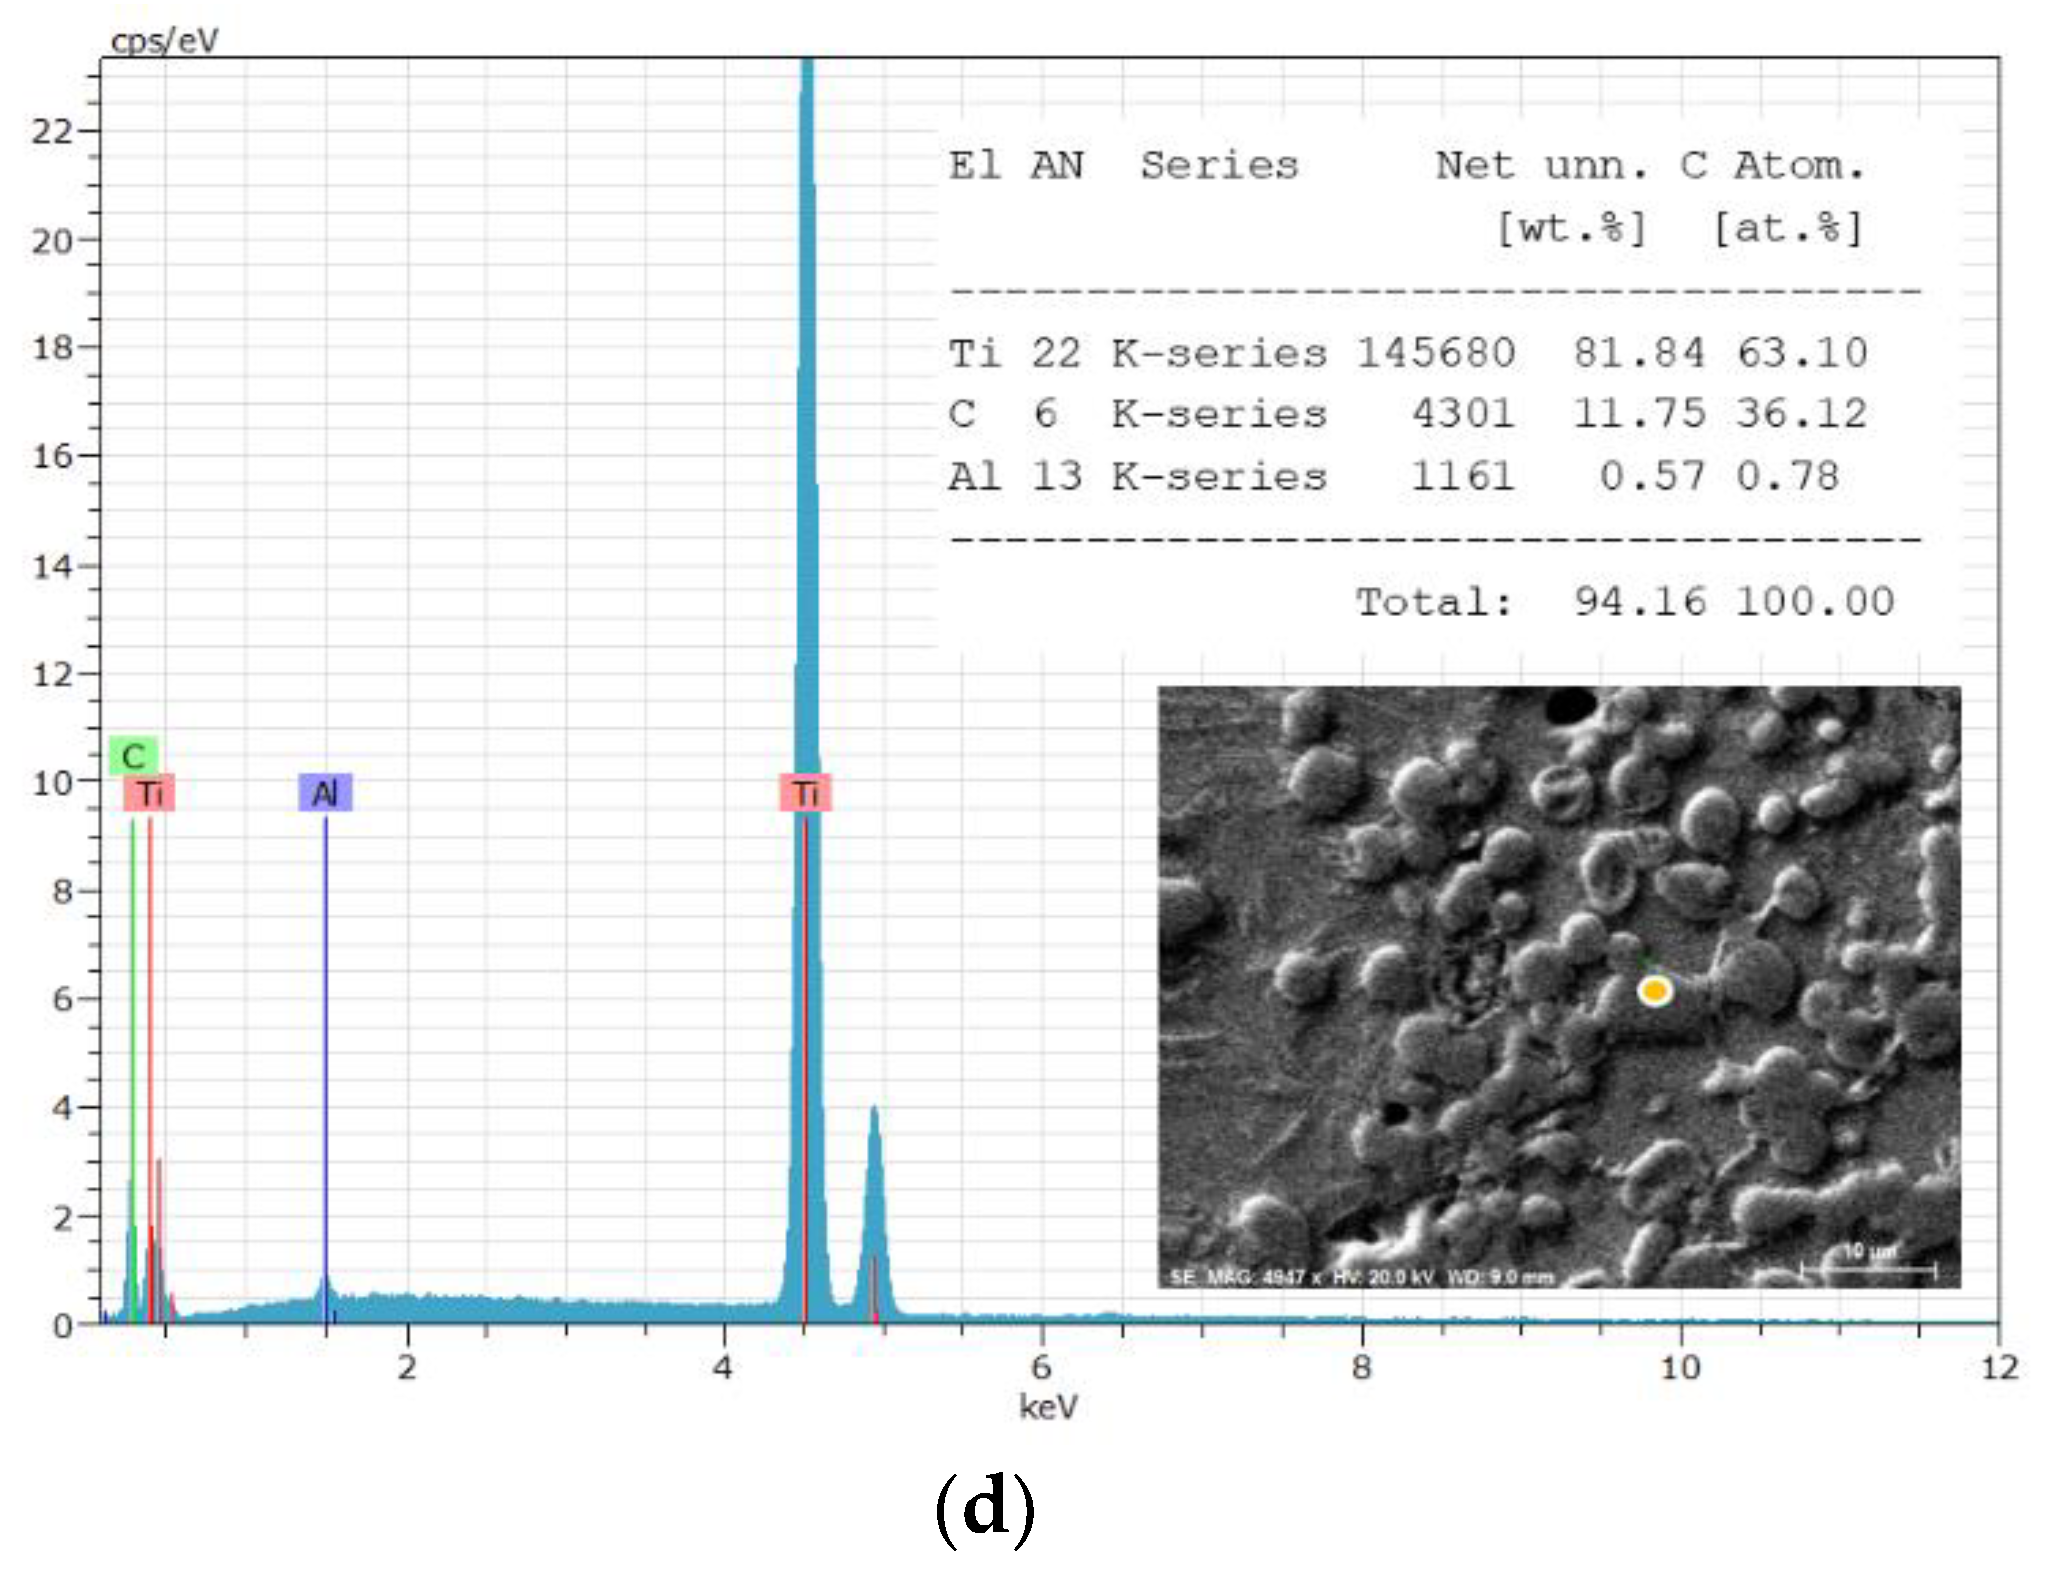
| The position of the peak or the group of the peaks, cm-1 | The identification of the peak | The references | |
|---|---|---|---|
| 125 | Ti3AlC2 | [23] | |
| 1 | 148-154 | Al-C alloy | [24], [25], [26] |
| 150 | Ti2AlC | [23] | |
| 183, 201 | Ti3AlC2 | [23] | |
| 2 | 208-213 | Al(Ti)-C alloy | [24], [25], [26] |
| 3 | 256-267 | Al(Ti)-C alloy | [24], [25], [26] |
| 262, 268 | Ti2AlC | [23] | |
| 4 | 271-273 | C60 | [27] |
| 270 | Ti3AlC2 | [23] | |
| 365 | Ti2AlC | [23] | |
| 5 | 415-431 | Al(Ti)-C alloy | [24], [25], [26], [27] |
| 6 | 488-497 | C70 | [27], [28] |
| 7 | 608-613 | Al(Ti)-C alloy | [24], [25], [26], [29] |
| 623 | Ti3AlC2 | [23] | |
| 8 | 632-633 | Ti3AlC2 | [22] |
| 663 | Ti3AlC2 | [23] | |
| 9 | 771-773 | C60 | [27], [30] |
| 10 | 820-840 | Al4C3 | [24] |
| 11 | 1234-1252 | C60 | [27], [30] |
| 12 | 1331 | Graphene (D band) | [31] |
| 13 | 1340 | Graphene (D band) | [30] |
| 14 | 1350 | Graphene (D band) | [32], [33], [34] |
| 15 | 1355-1360 | C60 | [26] |
| 16 | 1419-1422 | C60 | [27] |
| 17 | 1462-1469 | C60 | [27], [28] |
| 18 | 1555 | Graphene (G band) | [31] |
| 19 | 1575-1576 | Graphene (G band) | [30], [28] |
| 20 | 1580-1583 | Crystalline graphite | [27], [35] |
| 21 | 1580-1600 | Graphene (G band) | [32], [34] |
| 22 | 1584-1590 | C70 | [29], [33] |
| 23 | 2700-2720 | The overtone of the line at 1355 cm-1 | [36], [34] |
| 24 | 2930-2950 | Ti-C alloy | [36] |
| 25 | 2320 | Ti-C alloy | [36] |
| 26 | 2690-2700 | Graphene (2D band) | [30], [32], [35] |
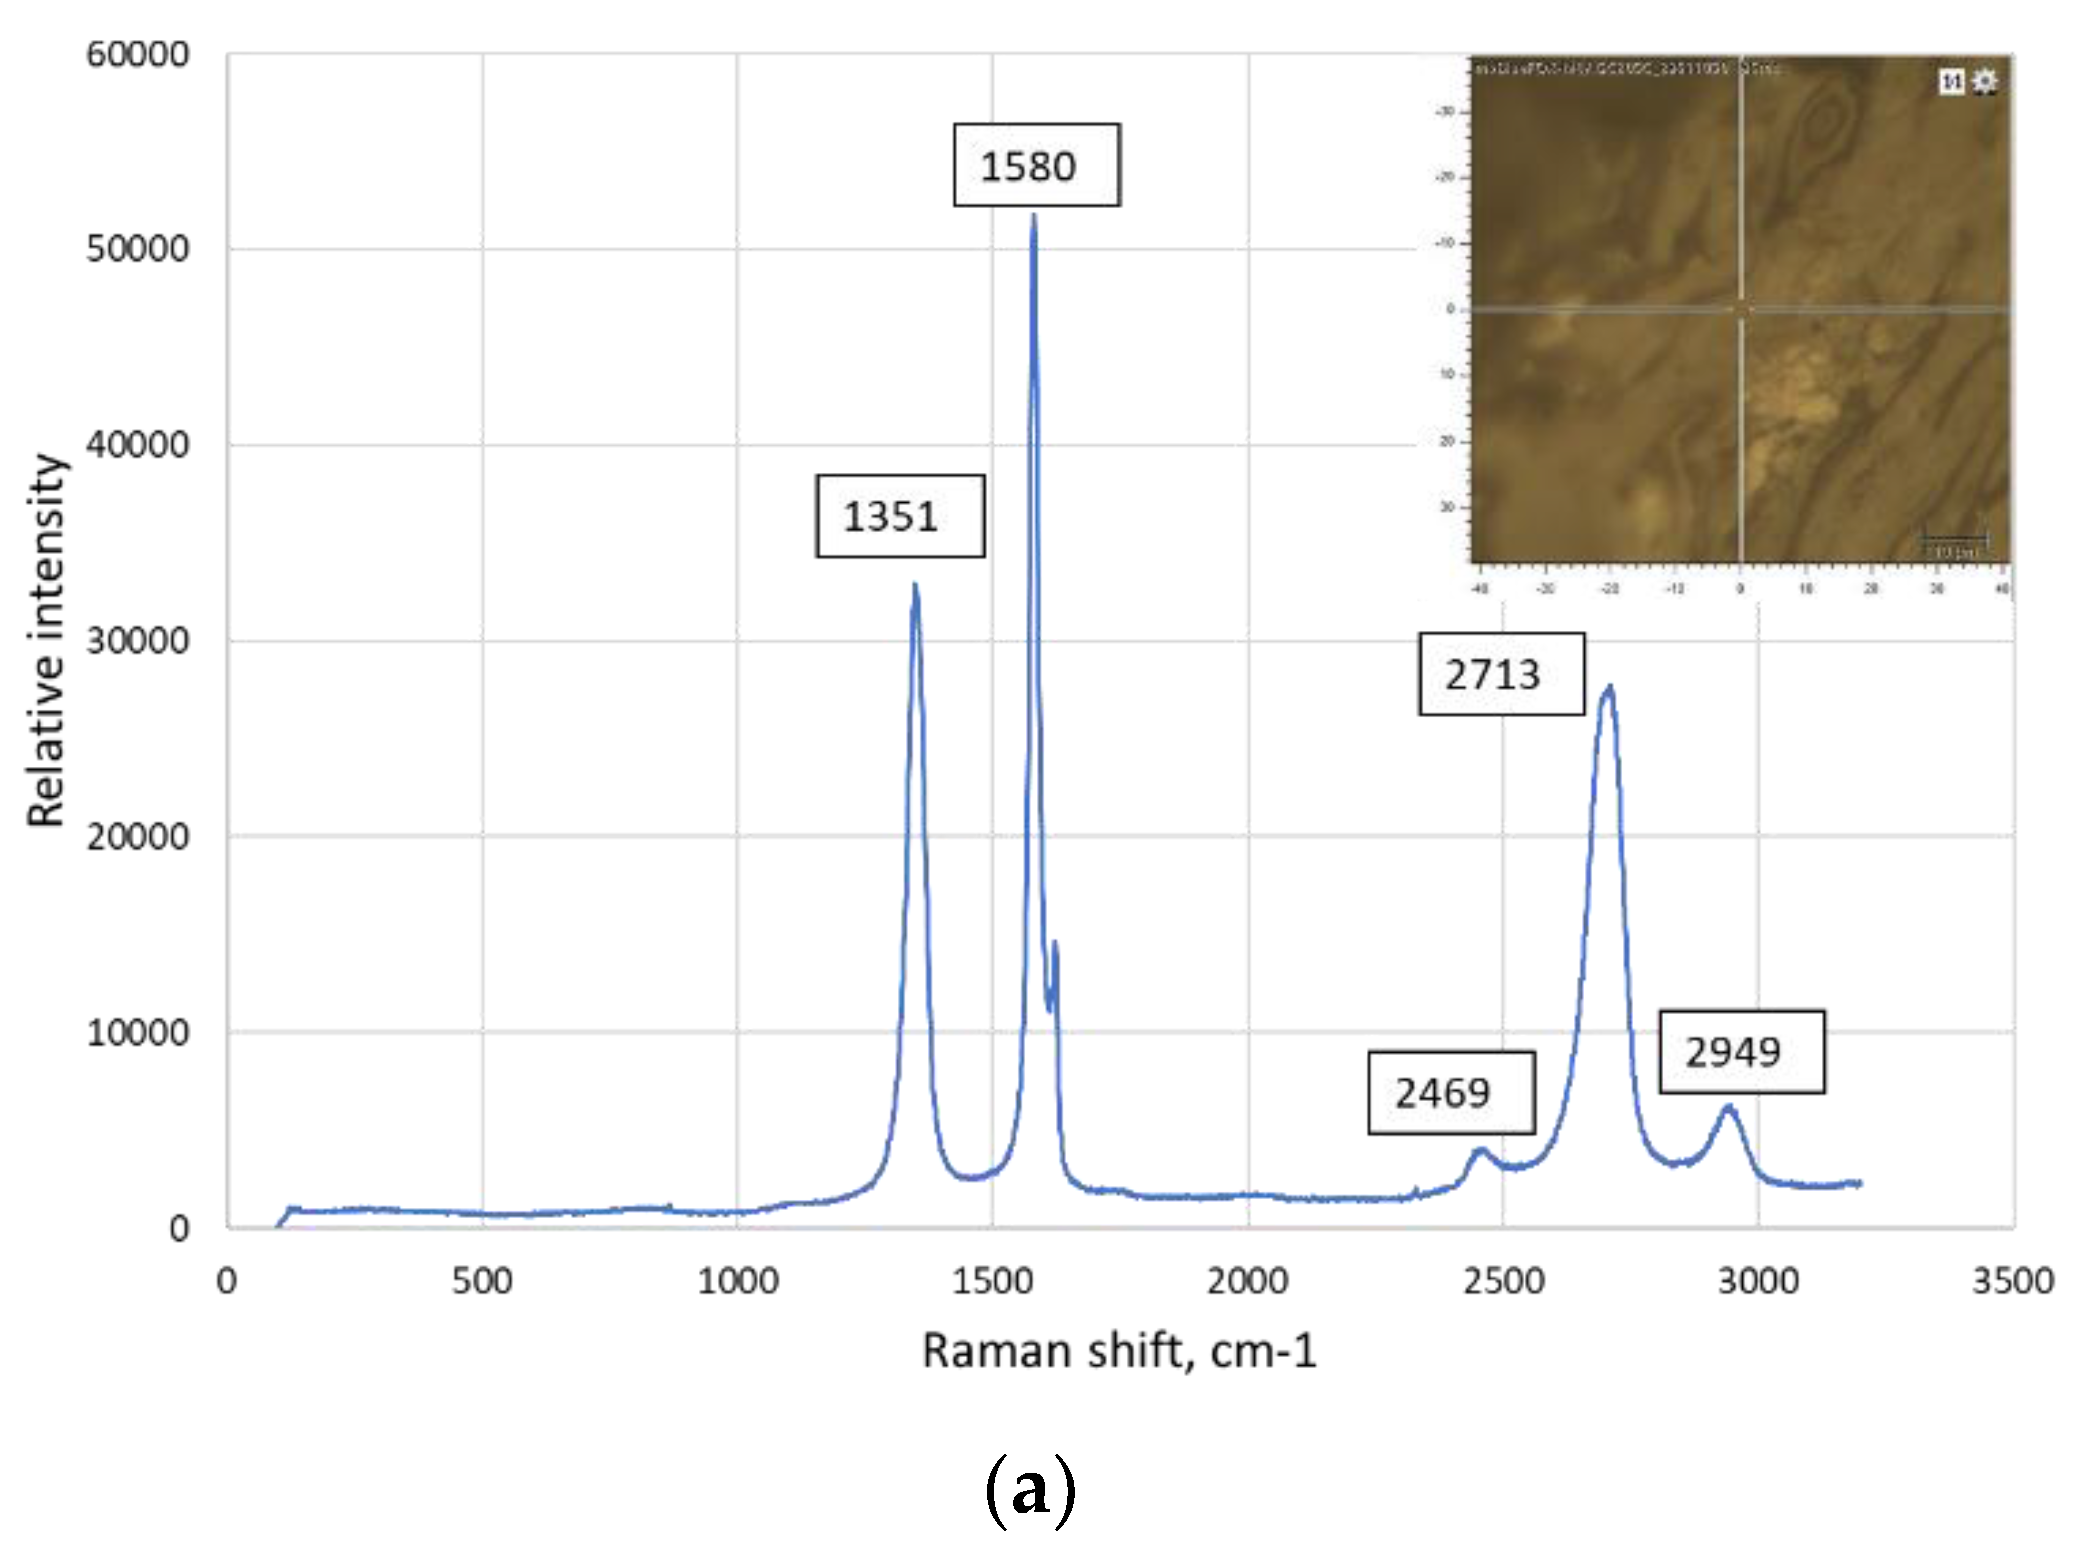
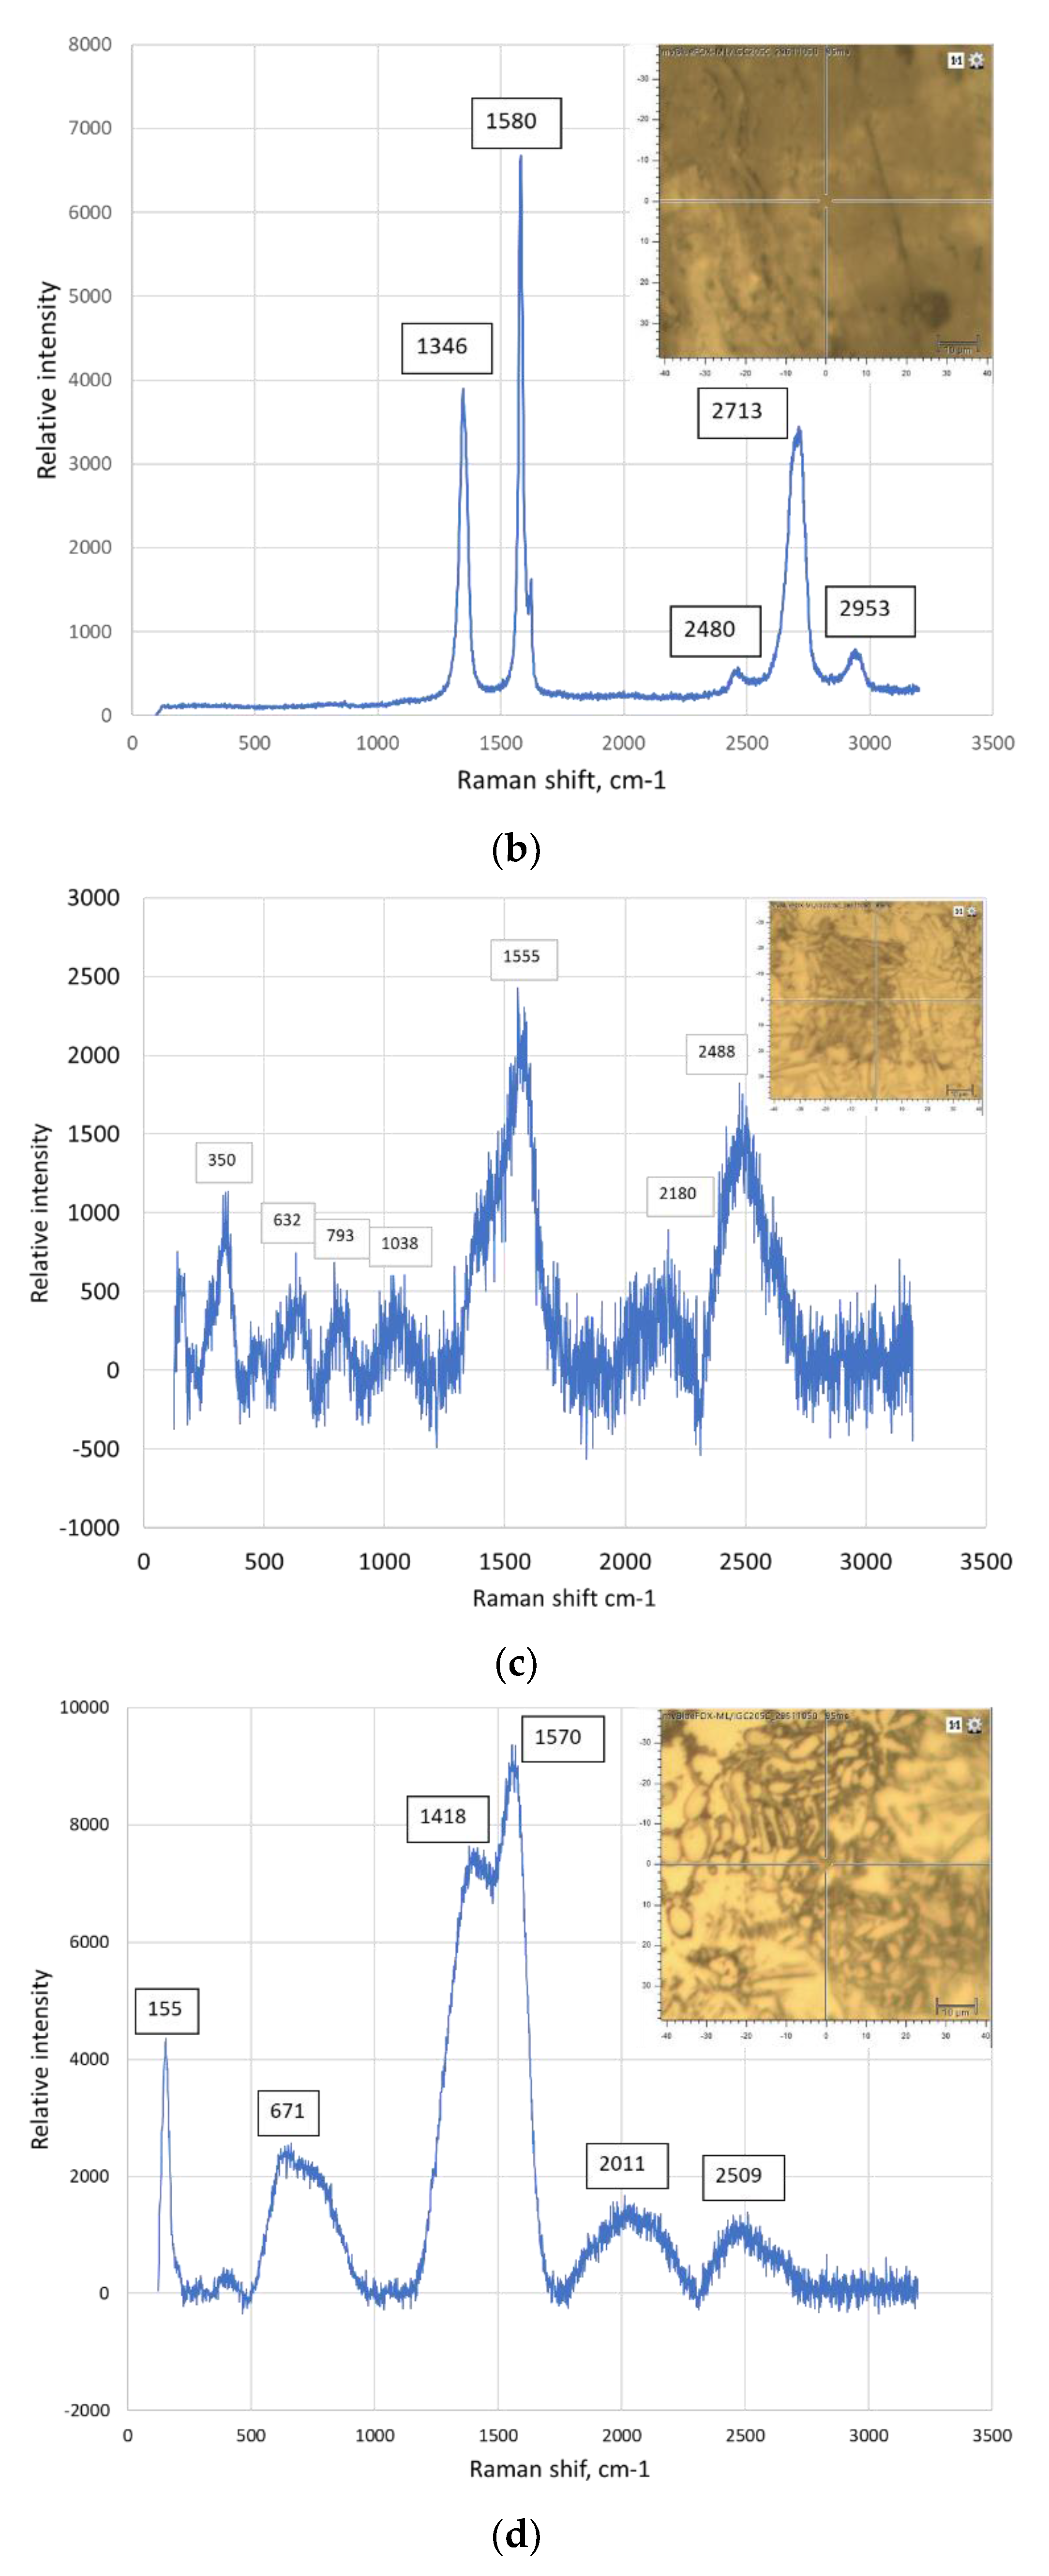
5. Conclusions
Author Contributions
Funding
Acknowledgments
Conflicts of Interest
References
- Welsch, G.; Boyer, R.; Collings, E. Materials Properties Handbook: Titanium Alloys; ASM international, 1993. [Google Scholar]
- Leyens, C.; Peters, M. Titanium and Titanium Alloys: Fundamentals and Applications Weinheim: Chichester: Weinheim: Wiley-VCH; Chichester: John Wiley distributor c2003.
- Bin, Z.; Faming, Z.; Farhad, S.; Caiyun, S. Graphene-TiC hybrid reinforced titanium matrix composites with 3D network architecture: Fabrication, microstructure and mechanical properties. Journal of Alloys and Compounds 2021, 859, 157777. [Google Scholar] [CrossRef]
- Bakshi, S.R.; Agarwal, A. An analysis of the factors affecting strengthening in carbon nanotube reinforced aluminum composites. Carbon 2011, 49, 533–544. [Google Scholar] [CrossRef]
- Singerman, S.; Jackson, J. Superalloys 1996, eds. R.D. Kissenger, D.J. Deye, D.L. Anton, A.D. Cetel, M.V. Nathal, T.M. Pollock, and D.A. Woodford. Warrendale, PA: TMS. p. 579.
- Priyaranjan, S.; Pandu, R.V.; Meher, A.; Manas, M.M. Recent progress in aluminum metal matrix composites: A review on processing, mechanical and wear properties. Journal of Manufacturing Processes, 2020, 59, 131–152. [Google Scholar] [CrossRef]
- Bhoi, N.K.; Singh, H.; Pratap, S. Developments in the aluminum metal matrix composites reinforced by micro/nano particles – a review. JComposMater, 2020, 54, 813–833. [Google Scholar] [CrossRef]
- Metal matrix composites for automotive applications; Anthony, M., Schultz, B.F., Rohatgi, P.K., Gupta, N. E. A., Eds.; John Wiley & Sons, 2014. [Google Scholar] [CrossRef]
- Krishan, K. C. Carbon Fiber/Carbon Matrix Composites. Composite Materials 2019. [Google Scholar]
- Yuan, Q.; Li, X.; Xu, H.; Song, P.; Lu, J. Microstructure and fracture toughness of in-situ nanocomposite coating by thermal spraying of Ti3AlC2/Cu powder. Ceram. Int. 2019, 45, 13119–13126. [Google Scholar]
- Yu, W.B.; Zhao, H.B.; Hu, X.S. Anisotropic mechanical and physical properties in textured Ti2AlC reinforced AZ91D magnesium composite. J. Alloy. Compd. 2018, 732, 894–901. [Google Scholar] [CrossRef]
- Yu, W.B.; Wang, X.J.; Zhao, H.B.; Ding, C.; Huang, Z.; Zhai, H.; Guo, Z.; Xiong, S. Microstructure, mechanical properties and fracture mechanism of Ti2AlC reinforced AZ91D composites fabricated by stir casting. J. Alloy. Compd. 2017, 702, 199–208. [Google Scholar] [CrossRef]
- Liu, A.; Yang, Q.; Ren, X.; Meng, F.; Wu, G. Energy- and cost-efficient NaCl-assisted synthesis of MAX-phase Ti3AlC2 at lower temperature. Ceram. Int. 2019, 46, 6934–6939. [Google Scholar] [CrossRef]
- Galvin, T.; Hyatt, N.C.; Rainforth, W.M.; Reaney, I.M; Shepherd, D. Molten salt synthesis of MAX phases in the Ti-Al-C system. Journal of the European Ceramic Society 2018, 38, 4585–4589. [Google Scholar] [CrossRef]
- Xiaochen, H.; Yi, F.; Gang, Q.; Hao, Z.; Jingcheng, Z.; Xuebin, Z. Physical, mechanical, and ablation properties of Cu–Ti3AlC2 composites with various Ti3AlC2 contents. Materials Science and Technology 2018, 34, 757–762. [Google Scholar] [CrossRef]
- Kaczmar, J.W.; Pietrzak, K.; Włosiński, W. The production and application of metal matrix composite materials. J Mater Process Technol. 2000, 106, 58–67. [Google Scholar] [CrossRef]
- Magnus, C.; Cooper, D.; Sharp, J.; Rainforth, W.M. Microstructural evolution and wear mechanism of Ti3AlC2 – Ti2AlC dual MAX phase composite consolidated by spark plasma sintering (SPS). Wear, 2019, 438–439, 203013. [Google Scholar] [CrossRef]
- Kandrotaitė Janutienė, R.; Mažeika, D.; Dlouhy, J.; Syzonenko, O.; Torpakov, A.; Lipian, E.; Baltušnikas, A. Investigation of the microstructure of sintered Ti-Al-C composite powder materials under high-voltage electrical discharge. Materials 2023, 16, 5894. [Google Scholar] [CrossRef]
- Bruker AXS, TOPAS V4: General Profile and Structure Analysis Software for Powder Diffraction Data. Users Manual, Bruker AXS, Karlsruhe, Germany, 2008.
- Cheary, R.W.; Coelho, A.A.; Cline, J.P. Fundamental Parameters Line Profile Fitting in Laboratory Diffractometers. Physics Journal of Research of the National Institute of Standards and Technology 2004, 109, 1–25. [Google Scholar] [CrossRef]
- Shang, C.; Zhang, F.; Wang, J.; Chen, F. Interface configuration effect on mechanical and tribological properties of three-dimension network architectural titanium alloy matrix nanocomposites. Composites Part A 2022, 158, 106981. [Google Scholar] [CrossRef]
- Loupias, L.; Morais, C.; Morisset, S.; Canaff, C.; Li, Z.; Brette, F.; Chartier, P.; Giugnard, N.; Maziere, L.; Mauchamp, V.; Cabioc’h, T.; Habrioux, A.; Celerier, S. Guideline for synthesis and surface chemistry characterization of 2D Mo/Ti solid solutions based MXene. Application to hydrogen evolution reaction in alkaline media. Preprint.
- Torres, C.; Quispe, R.; Calderon, N.Z.; Eggert, L.; Hopfeld, M.; Rojas, C.; Camargo, M.K.; Bund, A.; Schaaf, P.; Grieseler, R. Development of the phase composition and the properties of Ti2AlC and Ti3AlC2 MAX-phase thin films – A multilayer approach towards high phase purity. Applied Surface Science 2021, 537, 147864. [Google Scholar] [CrossRef]
- Yolshina, L.A.; Muradymov, R.V.; Korsun, I.V.; Yakovlev, G.A.; Smirnov, S.V. Novel aluminum-graphene and aluminum-graphite metallic composite materials: Synthesis and properties. Journal of Alloys and Compounds 2016, 663, 449–459. [Google Scholar] [CrossRef]
- Choi, H.J.; Shin, J.H.; Bae, D.H. The effect of milling conditions on microstructures and mechanical properties of Al/MWCNT composites. Composites Part A 2012, 43, 1061–1072. [Google Scholar] [CrossRef]
- Choi, K.; Seo, J.; Bae, D.; Choi, H. Mechanical properties of aluminum-based nanocomposite reinforced with fullerenes. Transactions of Nonferrous Metals Society of China 2014, 24, s47–s52. [Google Scholar] [CrossRef]
- Luo, Z.; Loo, B.H.; Yao, J. Uniformly-assembled metal nanoparticles on anodic aluminum oxide (AAO) applied in surface-enhanced Raman spectroscopy. Mater. Res. Soc. Symp. Proc 2011, 1351. [Google Scholar] [CrossRef]
- Brett Kimbrell, J.; Crittenden, C.M.; Steward, W.J.; Khan, F.A.; Gaquere-Parker, A.C.; Stuart, D.A. Analysis of mixtures of C60 and C70 by Raman spectroscopy. Nanoscience Methods 2014, 3, 40–46. [Google Scholar] [CrossRef]
- Chernogorova, O.; Potapova, I.; Drozdova, E.; Sirotinkin, V.; Soldatov, A.V.; Vasiliev, A.; Ekimov, E. Structure and physical properties of nanoclustered graphene synthesized from C60 fullerene under high pressure and high temperature. Appl.Phys.Lett 2014, 104, 043110. [Google Scholar] [CrossRef]
- Mahmood, S.; ud Din, R.; Khan, M.; Shahzad, M.; Fayas Khan, M.; Akhtar, S.; Mateen, A.; Wadood, A. Microstructure, consolidation, electrochemical, and mechanical performance of titanium (Ti) composites reinforced by graphene nanoplatelets (GNPs) via mechanical alloying. Materials Chemistry and Physics 2022, 285, 126142. [Google Scholar] [CrossRef]
- Bezerra, I.; Freire, P.T.C.; Oliveira, N.C.; Cruz Viana, B. Throwing light on an uncommon preservation of Blattodea from the Crato Formation (Araripe Basin, Cretaceous). Revista Brasileira de Palentologia 2018. [CrossRef]
- Wang, H.; Zhang, H.; Cheng, X.; Mu, X.; Chang, S.; Feng, K.; Zhang, J. Microstructure evolution and mechanical properties of graphene reinforced Ti-6Al-4V matrix composites: Defective vs high-quality graphene. Journal of Alloys and Compounds 2023, 969, 172346. [Google Scholar] [CrossRef]
- Sizonenko, O.; Prokhorenko, S.; Torpakov, A.; Žak, D.; Lypian, Y.; Wojnarowska-Nowak, R.; Polit, J.; Sheregii, E.M. The metal-matrix composites reinforced by the fullerenes. AIP Advances 2018, 8, 085317. [Google Scholar] [CrossRef]
- Wang, H.; Zhang, H.M.; Cheng, X.W.; Chang, S.; Mu, X.N. Effect of ball milling time on microstructure and mechanical properties of graphene nanoplates and TiBw reinforced Ti-6Al-4V alloy composites. Materials Science and Engineering A 2022, 861, 144240. [Google Scholar] [CrossRef]
- Mallik, A.K.; Das, M.; Ghosh, S.; Chakravarty, D. Spark plasma sintering of Ti-diamond composites. Ceramics International 2019, 45, 11281–11286. [Google Scholar] [CrossRef]
- Cai, K.J.; Zheng, Y.; Shen, P.; Chen, S.Y. TiCx-Ti2C nanocrystals epitaxial graphene-based lamellae by pulsed laser abliation of bulk TiC in vacuum. CrystEngComm 2014, 16, 5466. [Google Scholar] [CrossRef]
- Chi, F.; Hou, J.; Cui, G.; Zhong, B.; Chen, W. Effects of mixing methods on the interface and microstructure evolution of graphene platelets/Ti-6Al-4V powder composites fabricated by powder metallurgy and extrusion. Surfaces and Interfaces 2023, 36, 102553. [Google Scholar] [CrossRef]
- Editorial. All in the graphene family – A recommended nomenclature for two-dimensional carbon materials. Carbon 2013, 65, 1–6. [CrossRef]
- Gutierrez, K.; Rodriguez, J.; Array, Y.; Luiggi, N. Topological study of charge density in AlTi, AlTi3 and Al3Ti intermetallics. Journal of Computational Methods in Sciences and Engineering 2012, 12, 361–370. [Google Scholar] [CrossRef]
Disclaimer/Publisher’s Note: The statements, opinions and data contained in all publications are solely those of the individual author(s) and contributor(s) and not of MDPI and/or the editor(s). MDPI and/or the editor(s) disclaim responsibility for any injury to people or property resulting from any ideas, methods, instructions or products referred to in the content. |
© 2023 by the authors. Licensee MDPI, Basel, Switzerland. This article is an open access article distributed under the terms and conditions of the Creative Commons Attribution (CC BY) license (http://creativecommons.org/licenses/by/4.0/).


