Preprint
Article

The Effect of the Temperature on the Surface Energetic Properties of Carbon Fibers by Inverse Gas Chromatography

Altmetrics

Downloads

75

Views

22

Comments

0

A peer-reviewed article of this preprint also exists.

This version is not peer-reviewed

Submitted:

28 November 2023

Posted:

29 November 2023

You are already at the latest version

Alerts
Abstract
This paper constitutes an original and new methodology for the determination of the surface properties of carbon fibers in the two oxidized and untreated forms by inverse gas chromatography technique at infinite dilution based on the effect of the temperature on the surface area of the various organic molecules adsorbed on the carbon fibers. The studied thermal effect proved a large deviation of the classical methods or models relative to the new determination of the surface properties of carbon fibers, such as the dispersive component of their surface energy, the free surface energy, the free specific energy, the enthalpy and entropy of adsorption of molecules on the carbon fibers. The obtained specific enthalpy and entropy of adsorption for the polar solvents led to the determination of the Lewis’s acid-base constants of carbon fibers. Different molecular models and chromatographic methods were used to quantify the surface thermodynamic properties of carbon fibers and compared to the thermal model. The obtained results proved that the oxidized carbon fibers gave more specific interaction energy and greater acid-base constants than that of the untreated carbon fibers and thus highlighting the important role of the oxidization on the acid-base of fibers. The determination of the specific acid-base surface energy of the two carbon fibers showed greater values of the oxidized carbon fibers relative to the untreated carbon fibers. An important basic character was highlighted for the two studied carbon fibers, larger than the acidic character. It was observed that the Lewis’s acid-base constants of the oxidized carbon fibers are larger than that of the untreated fibers with more accentuated basic charterer. This result was confirmed by all molecular models and chromatographic methods.
Keywords: 
Subject: Chemistry and Materials Science  -   Materials Science and Technology

1. Introduction

The carbon fibers exhibit excellent physicochemical and mechanical properties and they are used as alternative to conventional metals for various applications, and especially, for decreasing the weight of the conventional product. The technical progress of carbon fibers led to the enhanced elastic modulus by incrementing the crystal size and arranging them along the fiber axis [1].
Carbon fibers are chemically inert materials and are not influenced by air, humidity, weak acids, alkalis, and solvents at ambient temperature. Nevertheless, they suffer oxidation at higher temperatures [5]. The carbon fibers are mostly composed of carbon atoms (from 92% to 99% in carbon). They are extremely stiff, possess high tensile strength, low weight and exhibit excellent resistance to chemical corrosion. Their low thermal expansion is an excellent advantageous in the different applications requiring a good stability [1]. The science and technology of carbon fiber production has been well developed in literature [2–5].
These interesting properties have made carbon fibers very popular in aerospace, civil engineering, military, and motorsports, along with other competition sports. However, they are relatively expensive when compared with similar fibers, such as carbon fibers or plastic fibers. The exceptional mechanical properties of carbon fibers are advantageously used in composite applications where their low weight is an excellent factor in some industrial applications such as, aerospace sectors, military, turbine blades, construction, light weight cylinders and pressure vessels, off-shore tethers and drilling risers, medical, automobile, sporting goods, etc.
In recent years, the carbon fiber industry has been growing steadily to meet the demand from different industries such as aerospace (aircraft and space systems), military, turbine blades, construction (non-structural and structural systems), light weight cylinders and pressure vessels, off-shore tethers and drilling risers, medical, automobile, sporting goods, etc. [6–12]. For the automotive industry, fiber reinforced polymeric composites offer reduced weight and superior styling. Carbon fibers can find applications in body parts (doors, hoods, deck lids, front end, bumpers, etc.), chassis and suspension systems (e.g., leaf springs), drive shafts and so on.[12].
The large specific surface area, controllable chemical compositions, excellent electrical conductivity, and rich composite forms of carbon fibers promise for future application in energy conversion technologies and new challenges and prospects of fiber materials in electrocatalysis applications [13].
PROS AND CONS OF CARBON FIBER
By: Mansi P. Rajyaguru
Carbon fiber, also known as Graphite Fiber, is composed of long strands of
carbon fibers that are interwoven together to form a fabric like structure.
The properties of a carbon fiber part are nearby to that of steel and the
weight is nearby to that of plastic. Thus the ratio of strength to weight (as
well as stiffness to weight ratio) of a carbon fiber part is much higher than
either steel or plastic. Carbon fiber is extremely strong.
Carbon fiber, also known as Graphite Fiber, is composed of long strands of
carbon fibers that are interwoven together to form a fabric like structure.
The properties of a carbon fiber part are nearby to that of steel and the
weight is nearby to that of plastic. Thus the ratio of strength to weight (as
well as stiffness to weight ratio) of a carbon fiber part is much higher than
either steel or plastic. Carbon fiber is extremely stron
Many authors were previously interested to the characterization of the dispersive and specific interactions of carbon fibers by inverse gas chromatography (IGC) at infinite dilution and more particularly by determining the surface physicochemical properties of carbon fibers such as their dispersive component of the surface energy, free energy of adsorption and their specific enthalpy and entropy of adsorption of some model organic molecules on the carbon fibers [14–16]. However, the values of the different surface thermodynamic parameters previously obtained by some authors used classic chromatographic methods were recently criticized in literature [17–23].
Because of the extreme importance of the physicochemical properties of carbon fibers in many different industrial applications, we were interested in this paper to the correction of the various surface parameters of the carbon fibers in the two untreated and oxidized forms by taking into account the recent progress in the inverse gas chromatography technique

2. IGC methods and models

2.1. Classical methods

Many papers were devoted to the determination of the surface physicochemical properties and the Lewis’s acid-base parameters of solid surfaces in both powder and fiber forms, by using the IGC technique at infinite dilution [24–33]. Their studies were concentrated on the determination of the dispersive surface energy and the specific energy, enthalpy and entropy of adsorption on n-alkanes and polar molecules on oxides, metals or polymers. To do that, several methods were used. These various methods were based on the found linear relations between the free energy of adsorption G a T or RTlnVn (at various values of temperature T) as a function of certain reference thermodynamic parameters, where R is the ideal gas constant and Vn the net retention volume of the injected probes into a chromatographic column containing the solid substrate. In IGC technique, polar or non-polar organic solvents were used. The non-polar used molecules are the n-alkanes (from n-pentane C5 to n-decane C10) describing the dispersive properties of the solid surfaces. The polar solvents are in general the following: acetone, ethyl acetate, ethyl oxide, toluene, benzene, acetonitrile, ethanol, propanol, carbon tetrachloride, chloroform and dichloromethane.
Different reference thermodynamic parameters were used:
-
the boiling point T B . P . of the solvents [24]
-
the vapor pressure P 0 of the probes at a fixed temperature [25,26]
-
the dispersive component γ l d of the surface energy of the solvent [14]
-
the deformation polarizability α 0 [27]
-
the standard enthalpy of vaporization H v a p . 0 (supposed constant) of organic molecules [28,29]
-
the topological index χ T of the solvents [30,31].
New molecular models and IGC methods [17–19] were proposed based on the linear dependency of R T l n V n obtained from IGC measurements, with respect of any thermodynamic parameters X j of organic molecules.
By varying the temperature of the column, one can obtain the values of the specific free energy G a s p ( T ) of polar molecules adsorbed on solid surfaces by calculating the distance relating the representative point of R T l n V n of a polar molecule to its hypothetic point located on the n-alkane straight-line. The specific enthalpy H a s p and entropy S a s p of the adsorbed polar molecule are then deduced from the relation (1):
G a s p T = H a s p T   S a s p
And consequently, one obtained the acid-base constants KA and KD of the solids from the following relation [25,26]:
H S p A N =   D N A N K A + K D
Where AN and DN respectively represent the electron donor and acceptor numbers of the polar molecule given by Gutmann [32] and corrected by Fowkes.
On the other hand, we can determine the dispersive component γ s d of the surface energy of the solid surface by using the method of Dorris-Gray [33] based on Fowkes’s relation [34]. The obtained relation giving γ s d ( T ) is the following:
γ s d = R T l n V n C n + 1 H 2 ( n + 2 ) V n C n H 2 ( n + 1 ) 2 4 N 2   a C H 2 2 γ C H 2
Where C n H 2 ( n + 1 ) and C n H 2 ( n + 1 ) are consecutive n-alkanes, , a C H 2 , the surface area of methylene group with a C H 2 = 6 Å , independent from the temperature, and the surface energy γ C H 2 of equal to: γ C H 2 i n   m J / m 2 = 52.603 0.058 T   T   i n   K
Another equivalent method was proposed in literature [14] and also allowed to determine γ s d of solid surfaces by using the following relation:
R T l n V n = 2 N a   γ l d γ s d 1 / 2 + α ( T )
Where a is the surface area of an adsorbed molecule (previously supposed constant), N the Avogadro number and α ( T ) a constant only depending on the temperature and the solid substrate.

2.2. Recent progress

Molecular models

The values of the dispersive surface energy γ s d of solid substrates proposed by relations (3) and (4) were obtained by supposing the surface area of methylene group and the organic molecules as constant independent from the temperature. It was also supposed that γ l d is constant. In previous works [21–23,35–37], one proposed different molecular models allowing the determination of the surface areas of molecules:
-
Kiselev results
-
Two-dimensional Van der Waals (VDW) equation
-
Two-dimensional Redlich-Kwong (R-K) equation
-
geometric model based on the real form of molecules
-
cylindrical model based on cylindrical form of molecules
-
spherical model based on spherical form of molecules.
Table S1 gave the surface areas of n-alkanes for the different molecular models. Furthermore, the dispersive component of the surface tension of the solvents was proved as dependent on the temperature.

Hamieh thermal model

In recent studies, one proved that the surface area of molecules extremely depends on the temperature [17–19]. Consequently, the new results will correct the values of γ s d , G a s p and the Lewis’s acid-base constants. Indeed, new expressions of the surface area a T of organic molecules and n-alkanes were proposed as a function of the temperature. It was also proved that the surface area of methylene group a C H 2 T also depends on the temperature [17–19]. One also showed that γ l d linearly depends on the temperature.
These new findings allowed us to determine the surface thermodynamic properties of the carbon fibers by using all classical IGC methods and the molecular models of the surface areas of molecules. The values of the surface parameters obtained by the classical methods were corrected by our new thermal model taking into account the variations of the surface areas and γ l d ( T ) of organic molecules as a function of the temperature. On Table S2, we gave the expressions of γ l d ( T ) of n-alkanes.

3. Experimental

3.1. Materials and solvents

All used n-alkanes (hexane, heptane, octane, nonane) and polar solvents, at highly pure grade (99%), were purchased from Fisher Scientific. The used polar molecules were in Lewis terms acidic such as carbon tetrachloride (CCl4), chloroform (CHCl3) and dichloromethane (CH2Cl2), amphoteric such as acetone, basic such as ethyl acetate, diethyl ether and tetrahydrofuran (THF), and weak amphoteric such as benzene. Two carbon fibers were analyzed: untreated fibers and oxidized fibers. The corrected acceptor number and normalized donor number of electrons of polar solvents were given in Table S3.

3.2. GC Conditions

The experimental measurements were performed on a commercial Focus GC gas chromatograph equipped with a flame ionization detector. The carbon fibers were filled into a stainless-steel column of a 2 mm inner diameter and a length of 20 cm. The temperature range varied from 40°C to 100°C. The different experimental conditions are typically the same as that given in previous published papers. The column was packed with 1 g of carbon fibers of a diameter of 10 mm and a length of 50 cm. The standard deviation on the obtained retention time, tR, was less than 1% in all measurements.

3.3. Results

3.3.1. Dispersive component of surface energy of carbon fibers

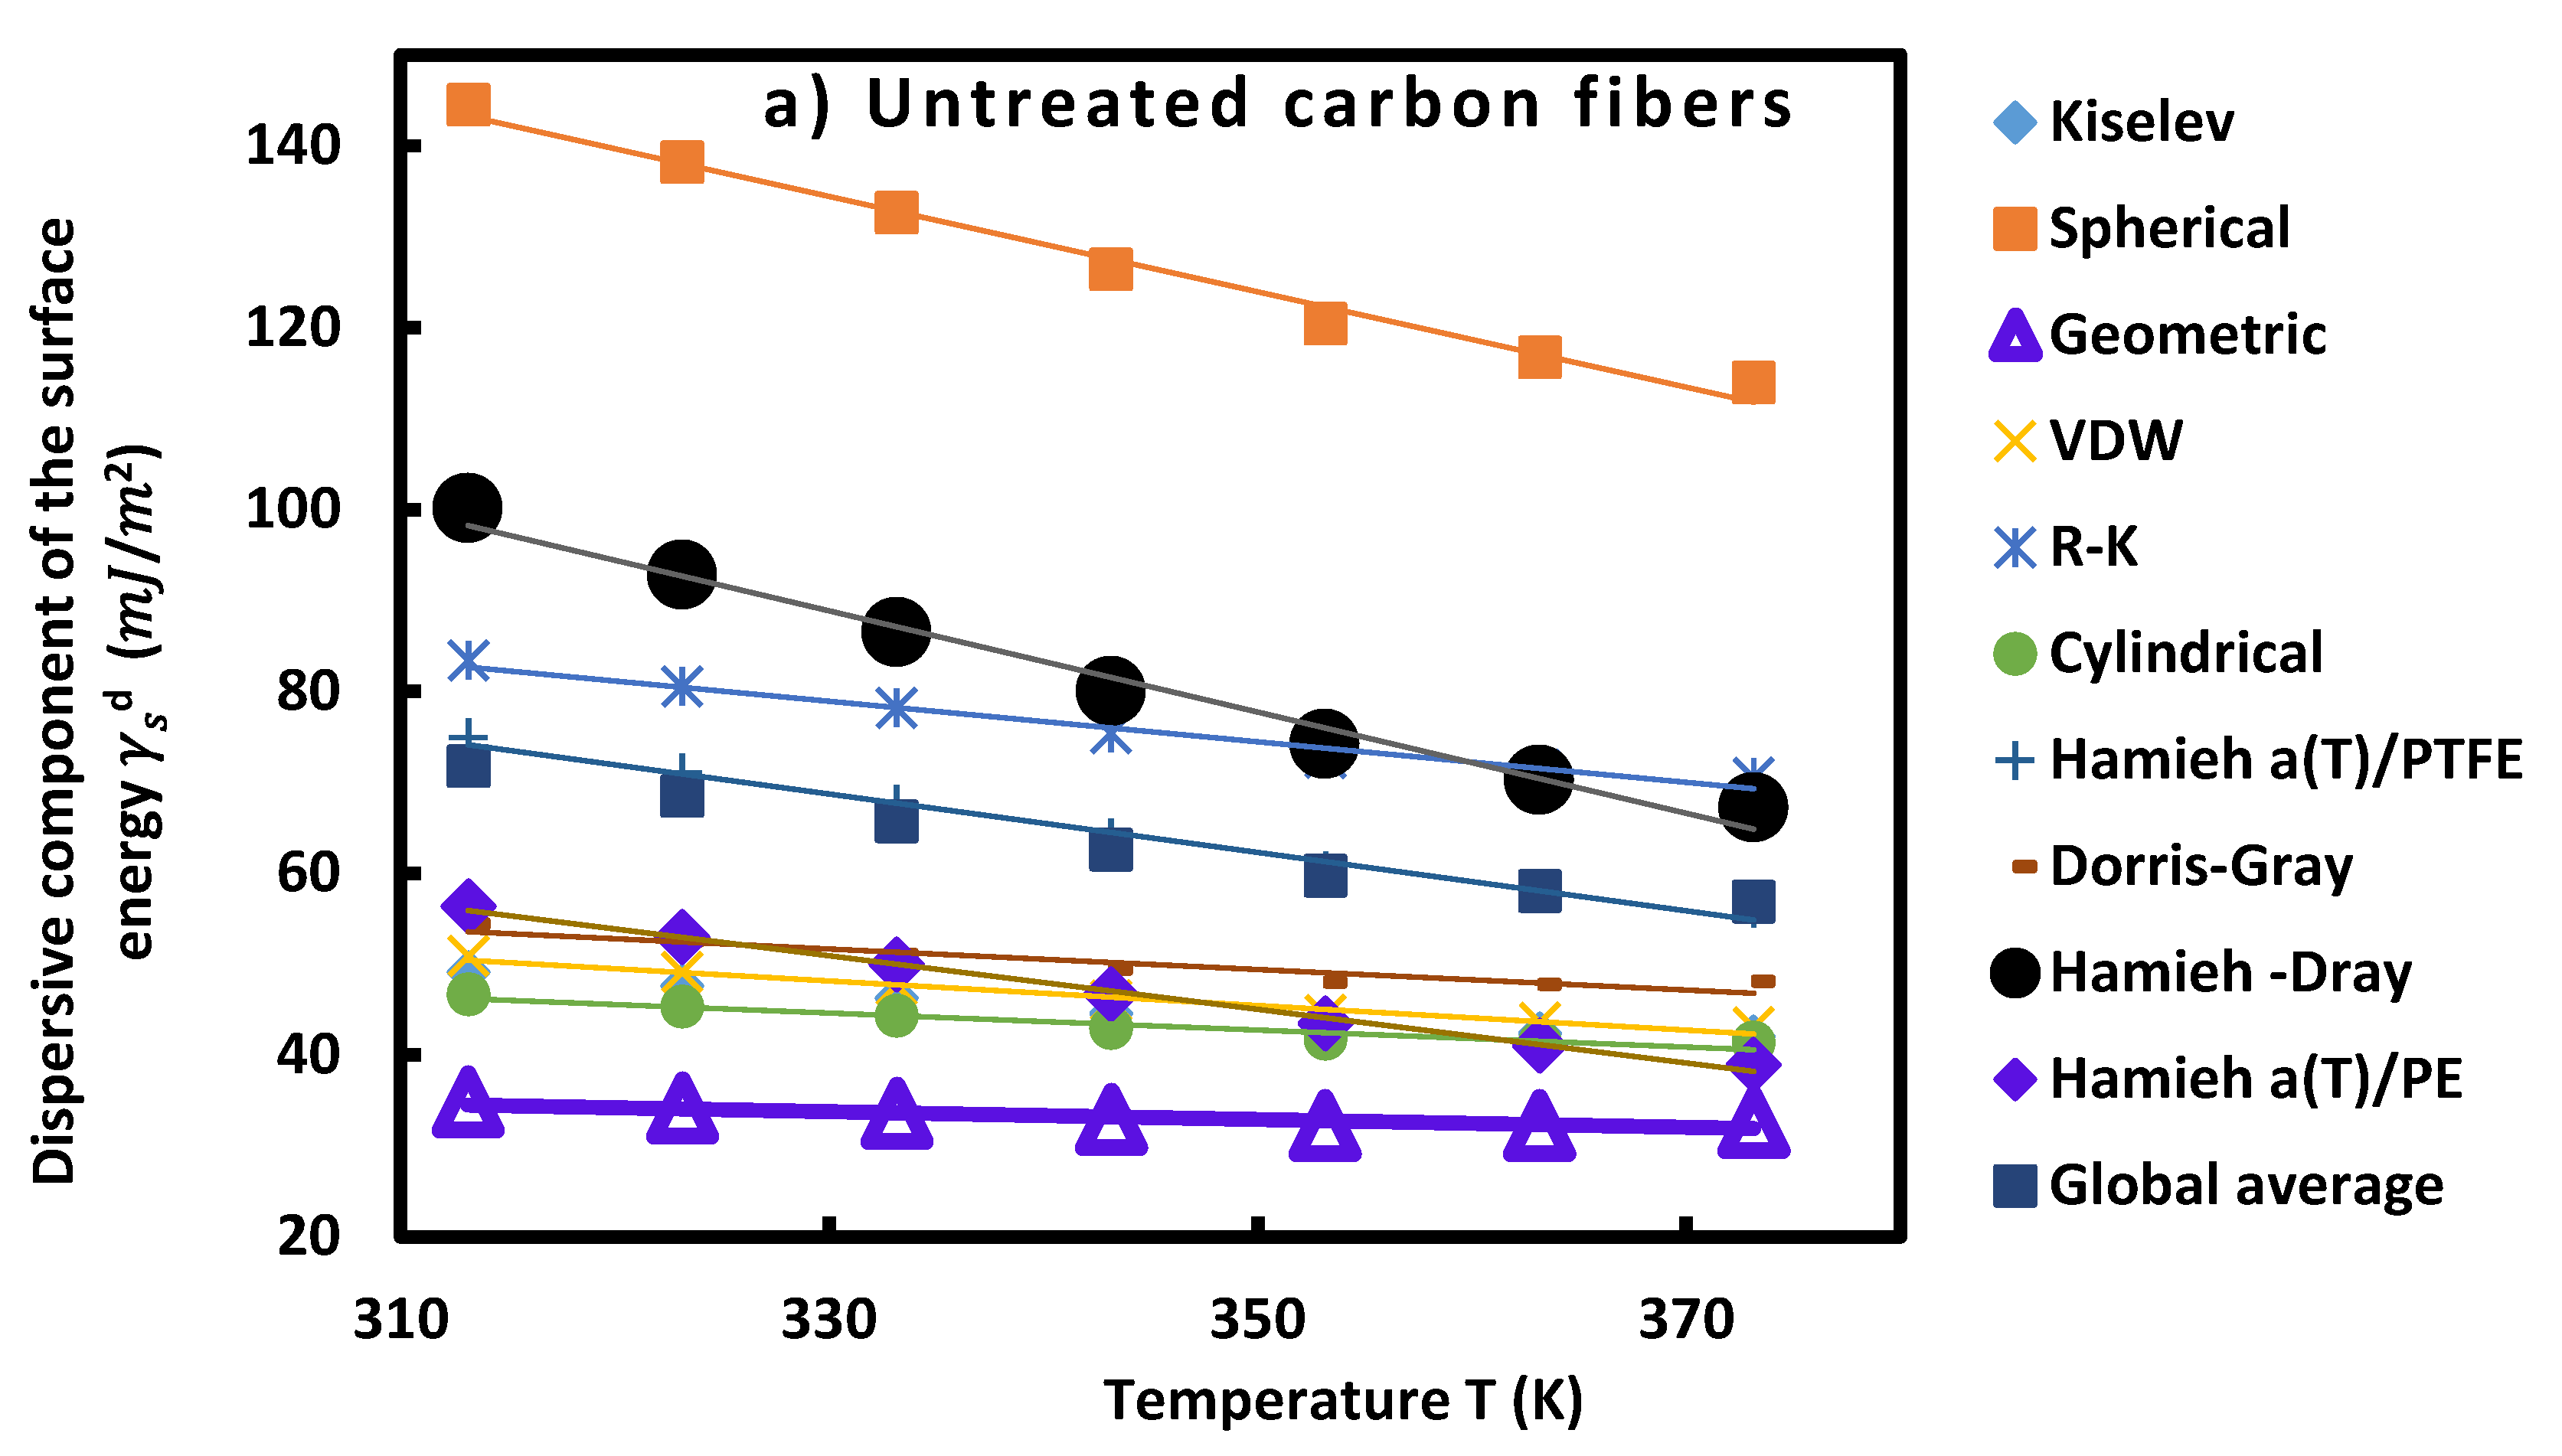
All previous various molecular models and Dorris-Gray method were used to determine the dispersive component of the surface energy of the carbon fibers (untreated and oxidized). The results were compared to that obtained by the thermal model [17–19] (Figure 1). The variations of γ s d   ( T ) of the carbon fibers as a function of the temperature satisfied excellent linear variations. Figure 1 showed large deviations between the values of γ s d   ( T ) calculating by the different models that can reach 300% in in the case of the spherical model. The application of Dorris-Gray relation gave large values of γ s d   ( T ) in the case of the thermal model. The more accurate results were obtained by the thermal model [17–19]. One observed that the results of the thermal model (by using the results on PE) is very close to that of cylindrical, Kiselev, Dorris-Gray and VDW models; whereas, the average values gave similar results to that of the thermal model (on PTFE). Furthermore, the comparison between the dispersive surface energy of the carbon fiber types showed small difference not exceeding 10% in all used molecular models. One found a weaker decrease of γ s d   ( T ) in the case of oxidized carbon fiber.
One gave on Table 2 the various equations of γ s d ( T ) relative to the carbon fibers for all used molecular models. Other new surface parameters were deduced and presented below:
-
the dispersive surface entropy ε s d , given by ε s d = d γ s d / d T
-
the extrapolated values γ s d ( T = 0 K ) at 0 K
-
and the maximum temperature T M a x defined by: T M a x = γ s d ( T = 0 K ) ε s d .
Table 2. Equations γ s d ( T ) of carbon fibers: untreated (a) and oxidized (b) for the different molecular models of n-alkanes, ε s d , γ s d ( T = 0 K ) and T M a x .
Untreated carbon fibers (a)
Molecular model γ s d ( T )
(mJ/m2)
ε s d = d γ s d / d T
(mJ m-2 K-1)
γ s d ( T = 0 K )
(mJ/m2)
T M a x
(K)
Kiselev γ s d ( T ) = -0.13T + 88.0 -0.13 88.0 702
Cylindrical γ s d ( T ) = -0.53T + 307.5 -0.52 307.5 586
VDW γ s d T   = -0.07T + 55.3 -0.07 55.3 848
Geometric γ s d ( T ) = -0.14T + 92.7 -0.14 92.7 686
Redlich-Kwong γ s d ( T ) = -0.22T + 152.5 -0.22 152.5 684
Spherical γ s d ( T ) = -0.11T + 80.6 -0.11 80.6 739
Hamieh a(T)/PTFE γ s d ( T ) = -0.32T + 174.7 -0.32 174.7 544
Dorris-Gray γ s d ( T ) = -0.16T + 104.0 -0.16 104.0 655
Hamieh-Gray γ s d ( T ) = -0.56T + 272.5 -0.56 272.5 490
Hamieh a(T)/PE γ s d ( T ) = -0.29T + 148.2 -0.29 148.2 503
Global average γ s d ( T ) = -0.26T + 151.2 -0.26 151.2 590
Oxidized carbon fibers (b)
Molecular model γ s d ( T )  (mJ/m2) ε s d = d γ s d / d T  (mJ m-2 K-1) γ s d ( T = 0 K ) (mJ/m2) T M a x (K)
Kiselev γ s d ( T ) = -0.24T + 123.7 -0.24 123.7 517
Cylindrical γ s d ( T ) = -0.52T + 307.5 -0.52 307.5 586
VDW γ s d ( T ) = -0.13T + 75.8 -0.13 75.8 576
Geometric γ s d ( T ) = -0.26T + 132.9 -0.26 132.9 505
Redlich-Kwong γ s d ( T ) = -0.43T + 218.0 -0.43 218.0 504
Spherical γ s d ( T ) = -0.21T + 111.3 -0.21 111.3 536
Hamieh a(T)/PTFE γ s d ( T ) = -0.48T + 223.5 -0.48 223.5 468
Dorris-Gray γ s d ( T ) = -0.16T + 102.7 -0.16 102.7 641
Hamieh-Gray γ s d ( T ) = -0.61T + 287.6 -0.61 287.6 470
Hamieh a(T)/PE γ s d ( T ) = -0.41T + 183.6 -0.41 183.6 449
Global average γ s d ( T ) = -0.36T + 182.5 -0.36 182.5 511
Table 2 showed that the dispersive surface entropy ε s d representing the slop of the straight line of γ s d T negatively increased in the case of oxidized carbon fibers about 30% for all molecular models proving a stronger decrease of γ s d ( T ) of treated fibers when the temperature increased but characterized by smaller maximum temperature T M a x .
By applying the new thermal model, one confirmed a difference between the values of the maximum temperature T M a x of the two carbon fibers (a) and (b) approaching 50K.

3.3.2. Specific variables of adsorption and Lewis’s acid-base constants

Experimental chromatographic results allowed to determine the retention time and retention volume of the n-alkanes and polar solvents adsorbed on the two carbon fibers (a) and (b). On Table S4 and S5, one gave the values of RTlnVn of the different solvents as a function of the temperature and the evolution was represented on Figures S1 and S2. The results shown on Tables S4 and S5; and Figures S1 and S2 clearly proved that the oxidized carbon fibers (b) gave greater values of RTlnVn and therefore larger interaction relative to that obtained with the untreated carbon fibers (a). One also observed an excellent linearity of the curves representing RTlnVn versus the temperature for the different n-alkanes and polar solvents.
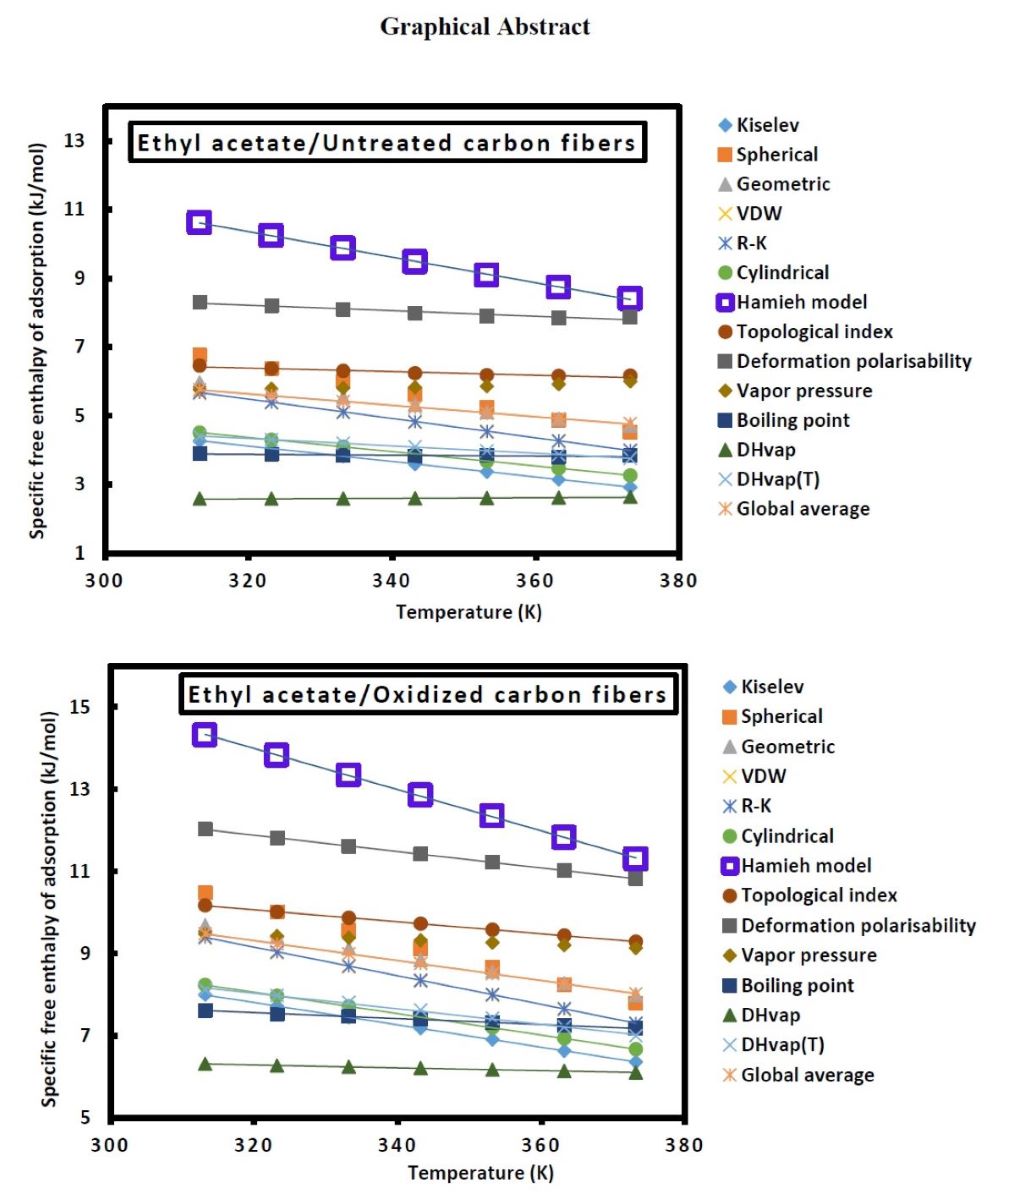
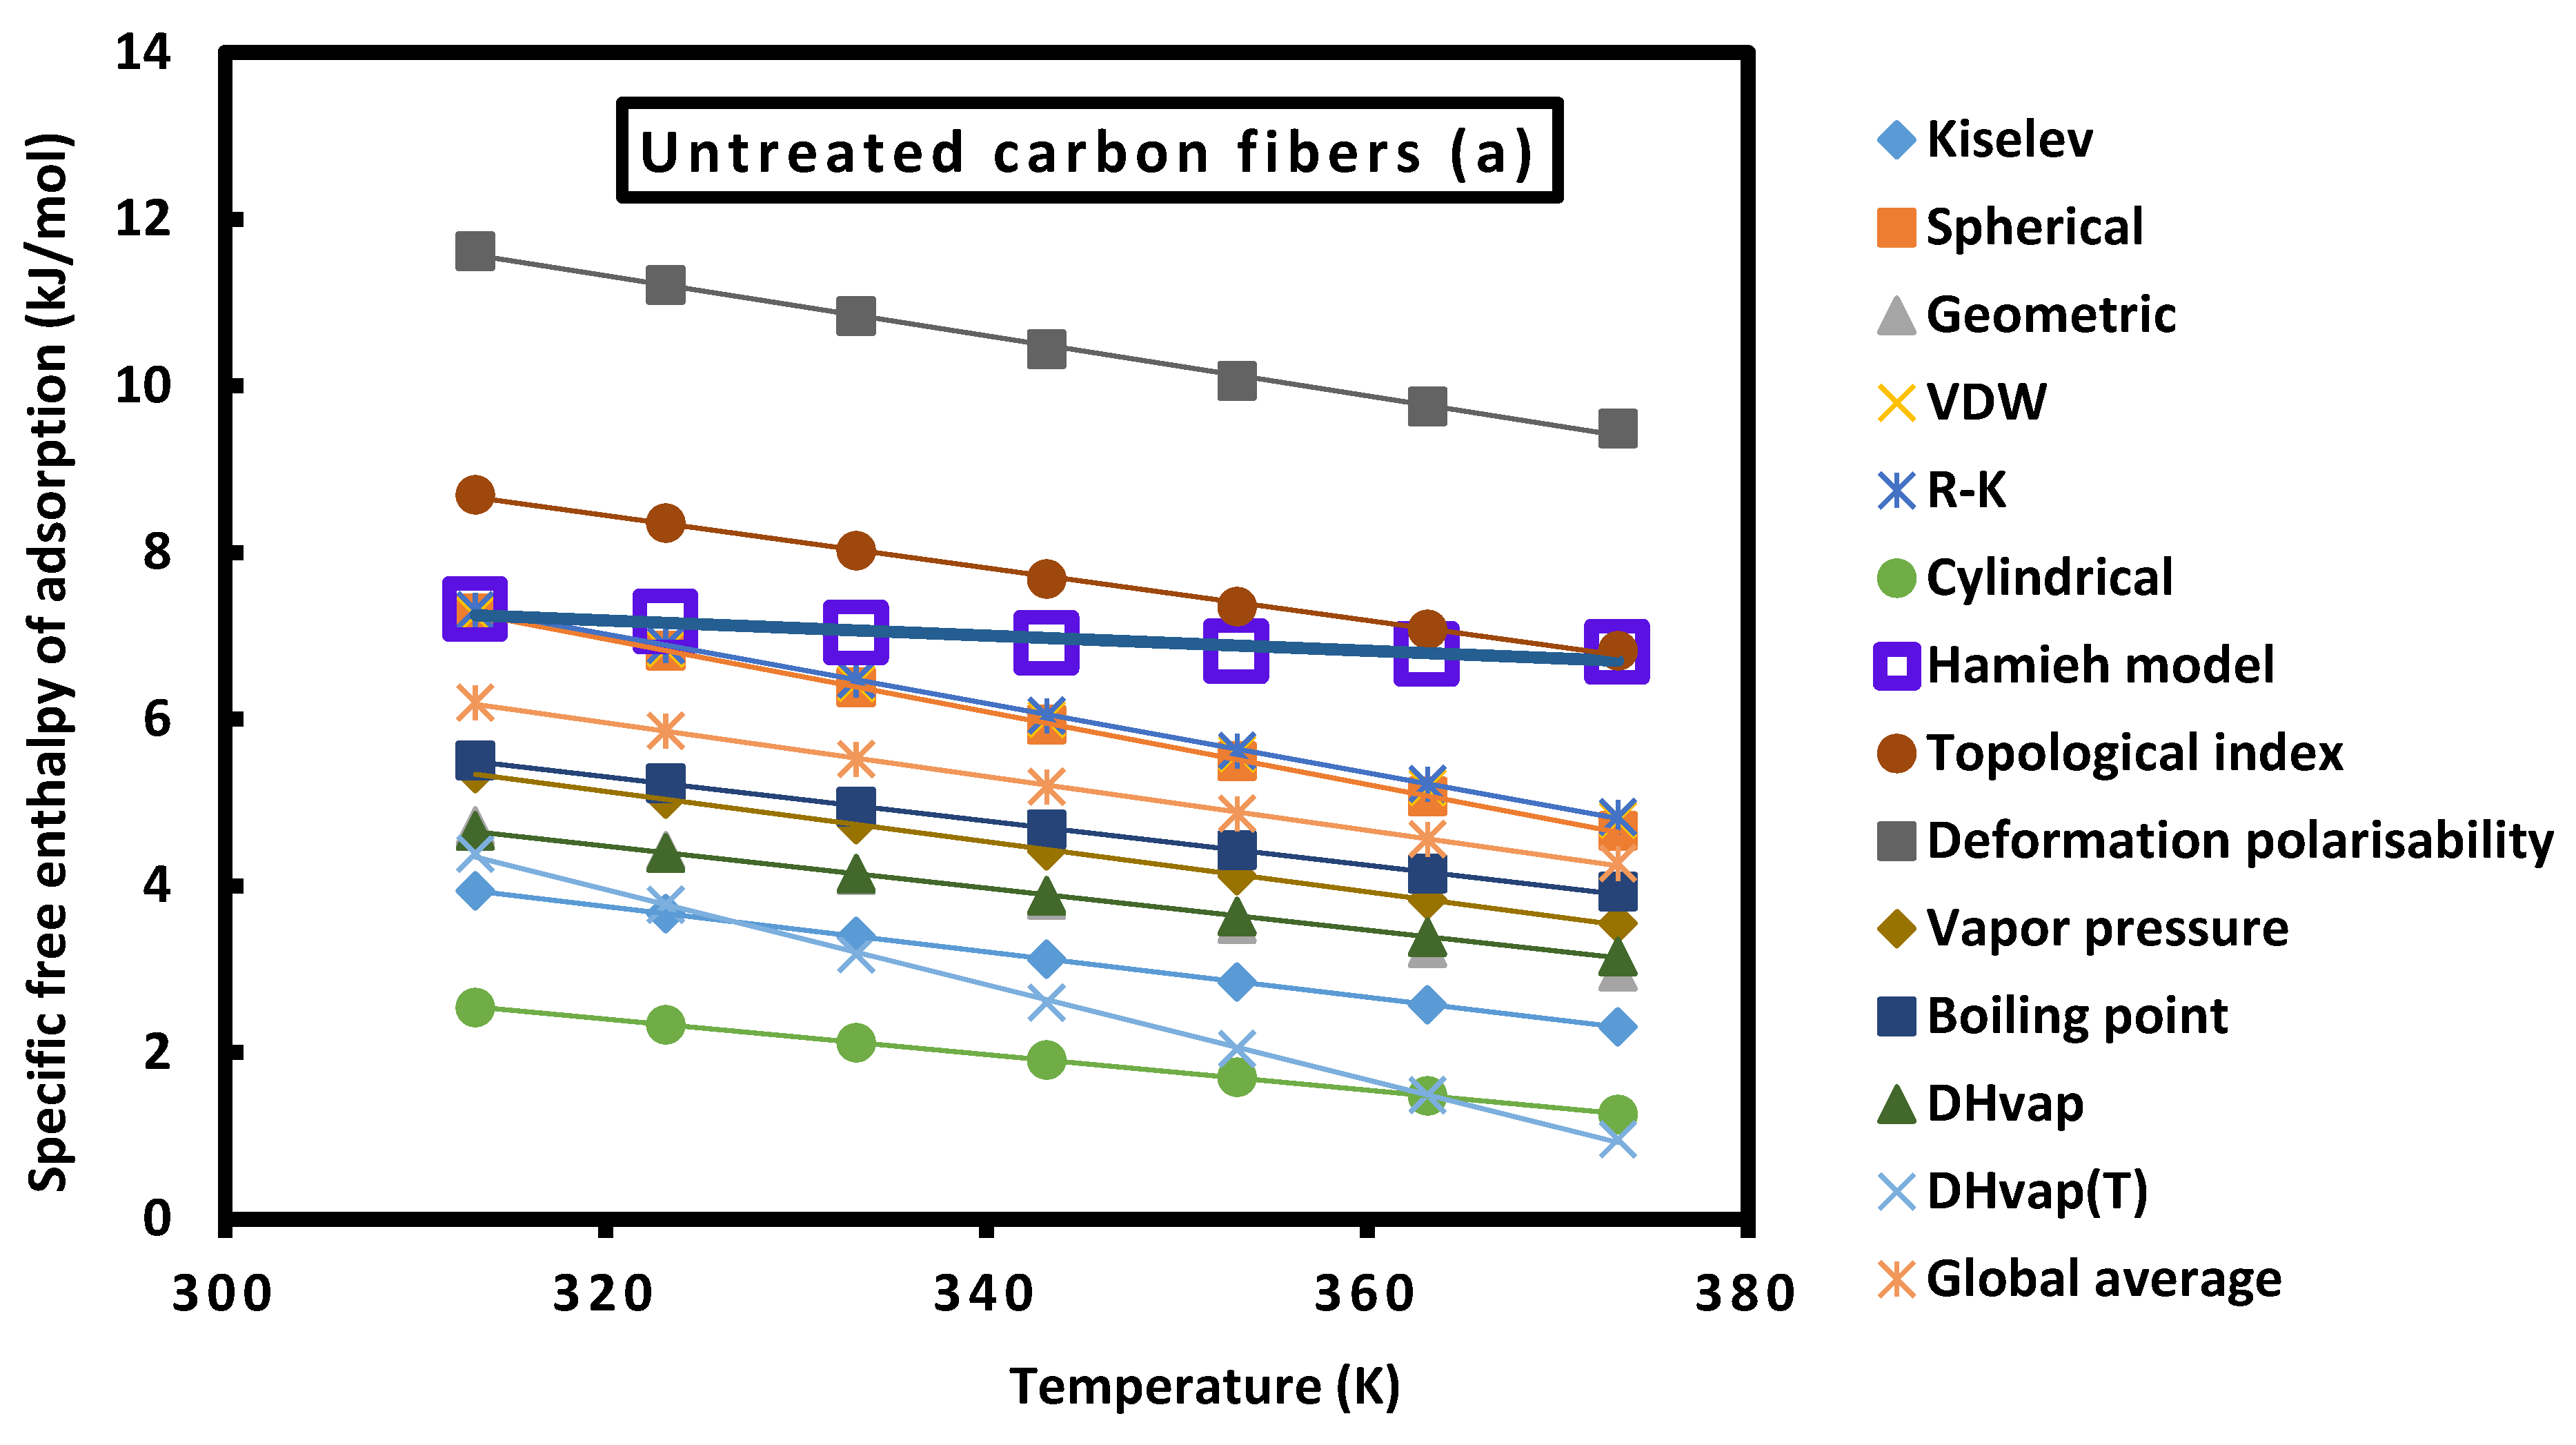
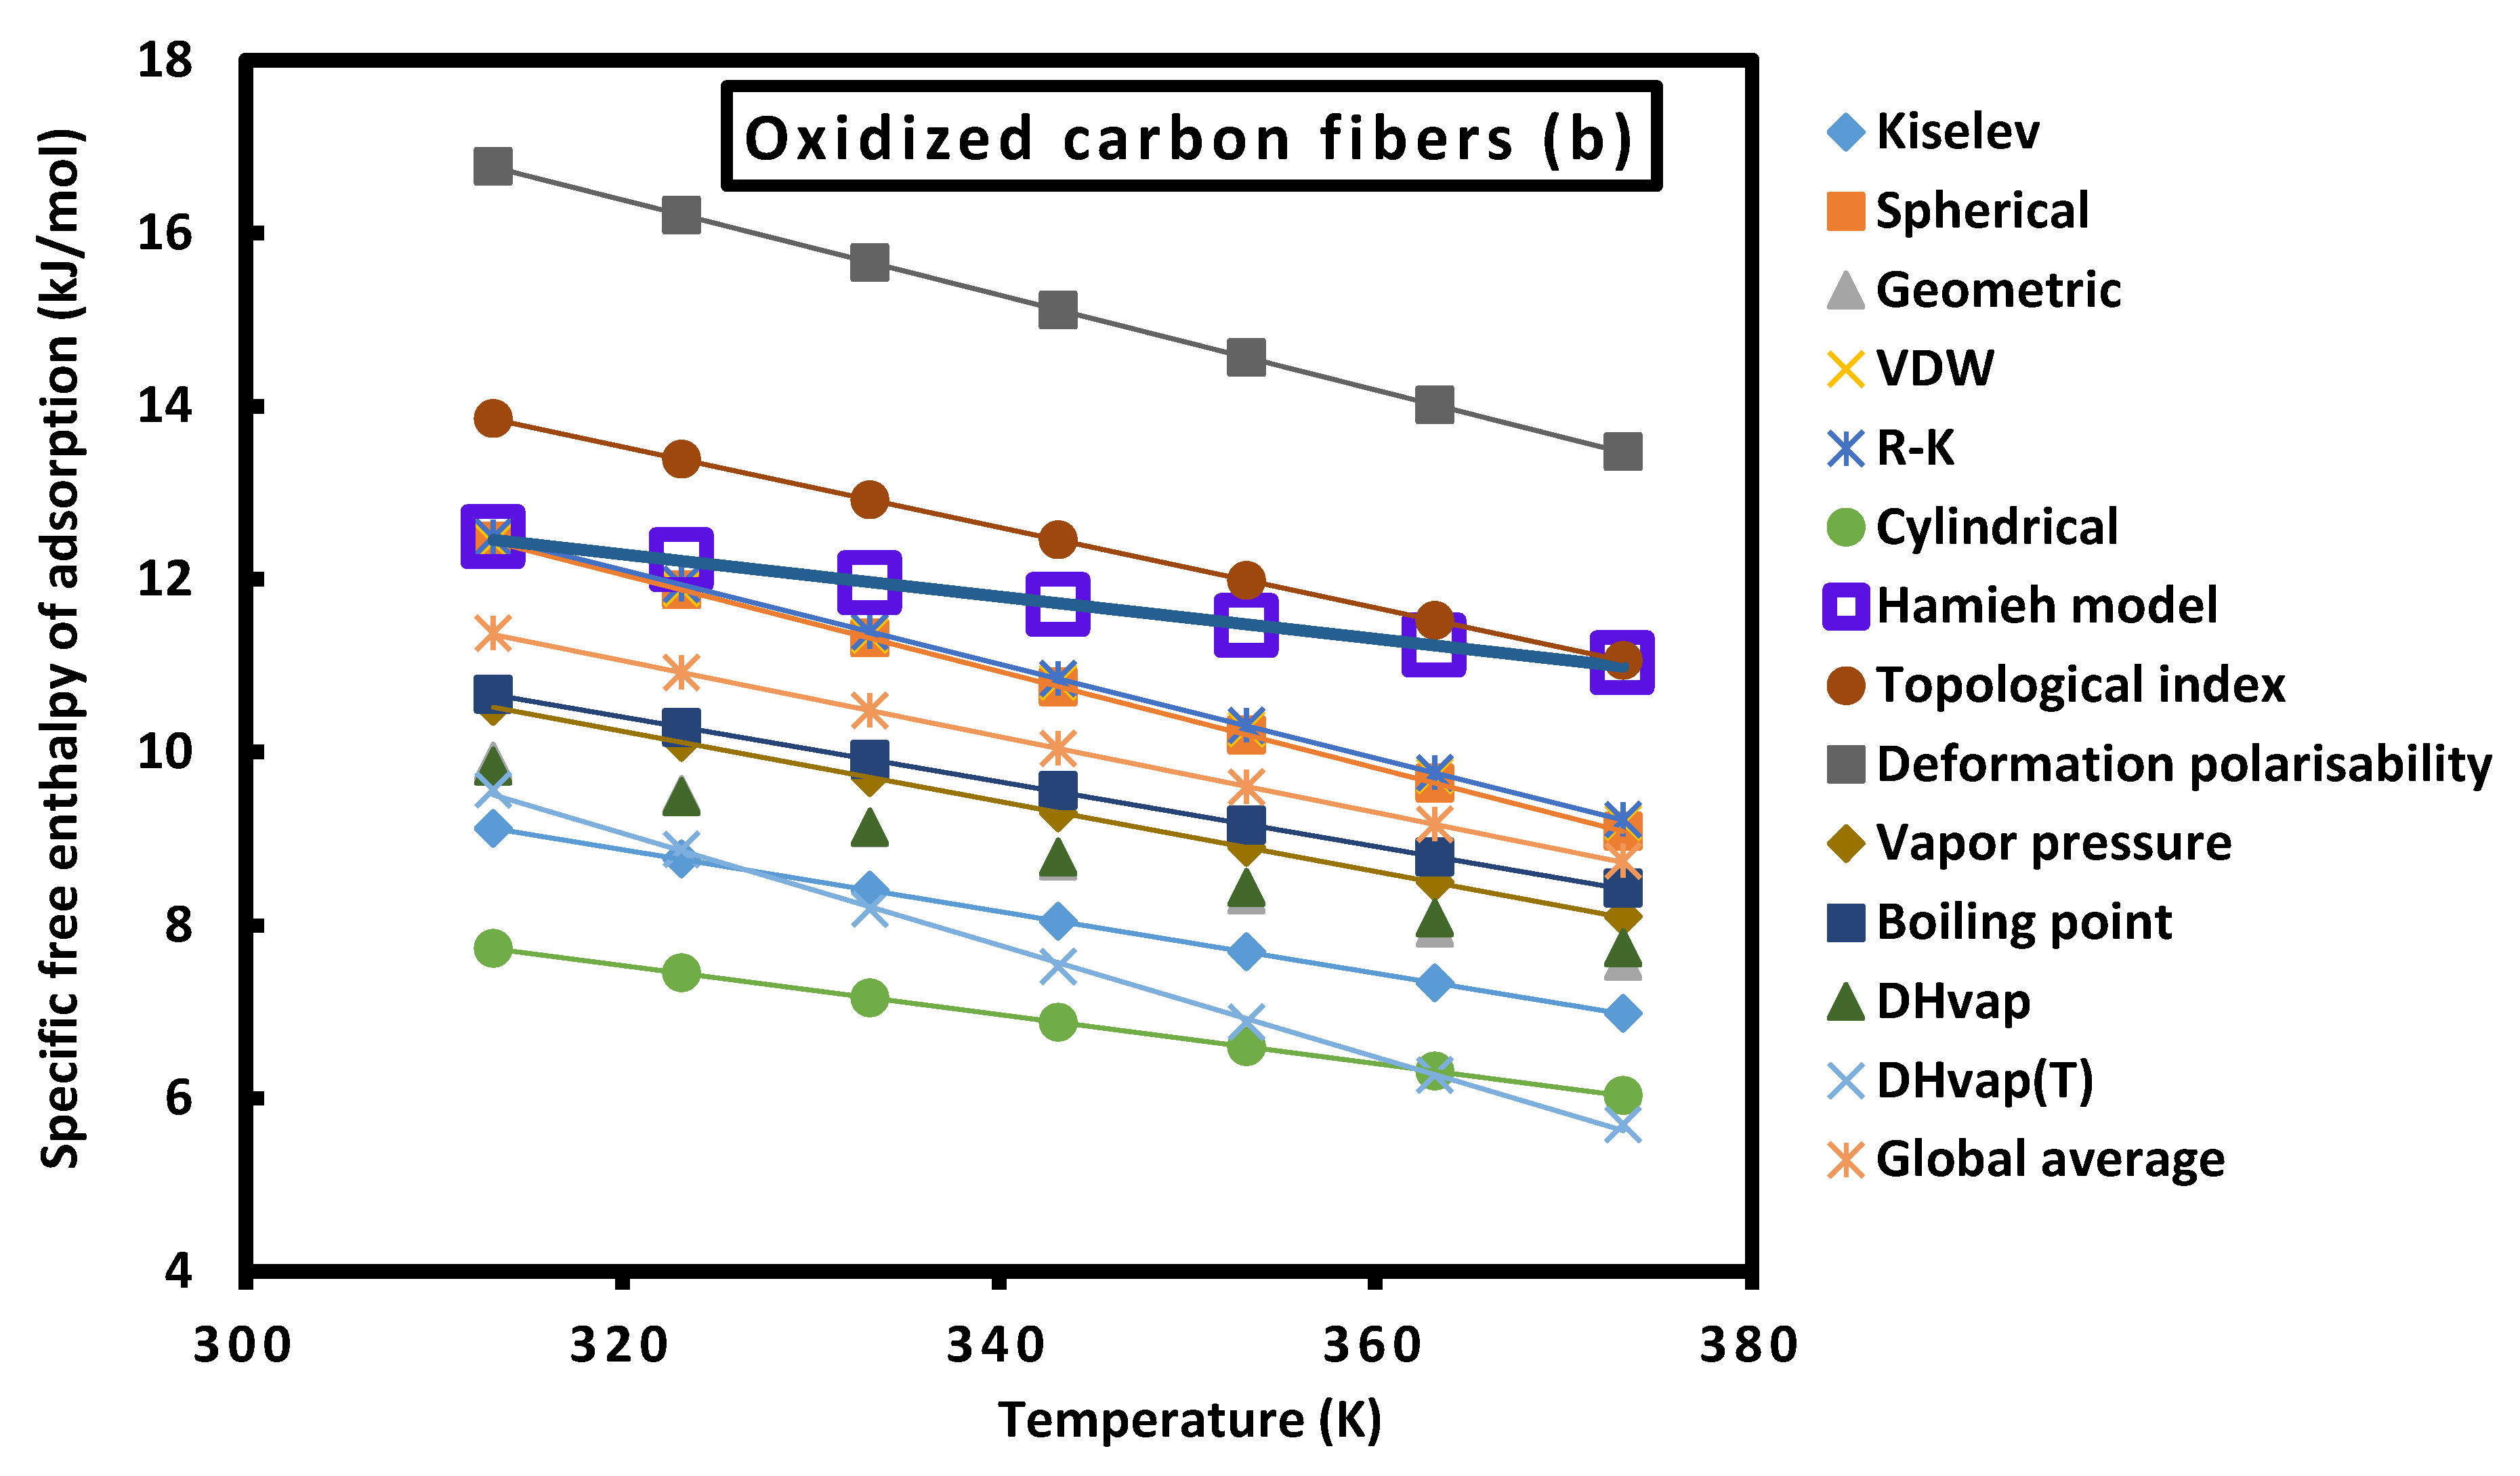
In order to quantify the specific interactions of the two fibers, one determined the values of the specific free energy ( G a s p T ) of polar solvents adsorbed on the fibers as a function of the temperature (Tables S6 and S7) showing linear variations of ( G a s p T ) and dispersed values depending on the chromatographic methods and molecular models. On Figure 2, one gave two examples of the results obtained with the diethyl ether showing the large difference of ( G a s p T obtained by the different molecular models and IGC methods in the two studied cases of carbon fibers.
This large difference between the results from the different molecular models and IGC methods can be clearly shown on Figure 2 for the adsorption of diethyl ether on two carbon fibers (a) and (b) (the other cases of adsorbed polar molecules were shown on Figure S4). However, the results on Tables S6 and S7, and Figures 2 and S4 showed that the oxidized carbon fibers gave larger specific free enthalpy of adsorption of all used polar molecules proving the higher Lewis’s acid-base and amphoteric characters of the oxidized carbon fiber.
The previous results presented on Figures 2 and S4 as well as that given on Tables S6 and S6 showed that the oxidized carbon fibers exhibited greater specific interactions for all the adsorbed polar solvents. This is due to the oxidization of the surface groups of the carbon fibers that increased the acidic and basic surface sites of the carbon fibers and therefore conducted to larger specific free enthalpy of adsorption on the oxidized carbon fibers compared to the untreated carbon fibers.
The curves of Figures 2 and S4 giving G a s p T versus the temperature for the various polar molecules adsorbed on the carbon fibers following the different models and IGC methods led to the determination of the specific enthalpy and entropy of the adsorption of the polar solvents adsorbed on the carbon fibers. The obtained results were presented on the next section.

Enthalpic and entropic acid base constants

The variations of G a s p T allowed to obtain the values of specific enthalpy ( H a s p ) and entropy ( S a s p ) of adsorption of polar molecules on the carbon fibers (a) and (b) for the various models and chromatographic methods. On gave the determined values of ( H a s p ) on Table 4 and ( S a s p ) on Table S8. The determined values of the specific variables varied from one molecular model to other with a large deviation. One can consider that the thermal model gave more accurate results because it took into consideration the thermal effect on the surface area of organic molecules that was neglected in the other molecular models (Tables 4 and S8).
One also confirmed the larger specific enthalpy of adsorption for all polar molecules in the case of the oxidized carbon fibers thus proving the higher acid-base character.
Table 3. Variations of ( H a s p   i n   k J   m o l 1 ) as a function of the used models or methods of polar molecules adsorbed on carbon fibers (a) and (b).
Untreated carbon fibers (a)
Probes CCl4 CH2Cl2 CHCl3 Benzene Ether THF EA Acetone
Kiselev 1.075 1.200 6.011 0.765 12.135 12.456 11.321 16.459
Spherical 4.020 6.751 11.991 12.195 9.371 20.915 18.464 22.925
Geometric 9.512 14.044 41.587 6.642 5.827 13.830 12.562 10.470
VDW 2.523 4.995 19.769 12.685 8.460 20.658 14.704 18.342
R-K 2.601 5.081 19.691 12.494 8.370 20.331 14.483 18.015
Cylindrical 1.541 16.596 38.802 -3.287 4.682 9.464 11.266 9.969
Hamieh model 1.475 1.900 6.011 1.100 13.852 13.093 18.923 13.540
Topological index 7.292 17.167 54.714 5.528 9.132 18.524 9.042 13.164
Deformation polarizability 9.504 0.707 47.722 9.133 11.308 22.853 10.797 15.845
Vapor pressure -3.789 2.297 44.039 4.700 6.777 14.770 4.576 2.082
Boiling point -4.167 0.110 41.913 4.990 9.162 13.796 4.262 4.487
DHvap -3.839 2.382 42.347 4.584 7.495 12.540 2.302 2.438
DHvap(T) 4.069 7.408 53.671 9.034 20.773 22.216 7.813 -4.978
Average values 2.447 6.203 32.944 6.197 9.796 16.573 10.809 10.981
Oxidized carbon fibers (b)
Probes CCl4 CH2Cl2 CHCl3 Benzene Ether THF EA Acetone
Kiselev 4.200 6.958 -18.895 3.170 16.203 20.300 16.512 28.623
Spherical 7.350 13.845 -11.197 16.232 13.477 29.914 24.441 35.723
Geometric 14.586 20.524 15.981 10.199 8.598 21.950 18.548 22.065
VDW 6.045 11.728 -5.159 17.185 12.309 29.983 20.583 31.148
R-K 6.053 11.843 -4.140 16.892 12.292 29.521 20.294 30.633
Cylindrical 4.982 23.658 12.922 -1.537 7.551 16.915 16.682 21.332
Hamieh model 4.782 2.937 11.416 2.931 17.063 20.099 30.039 24.811
Topological index 13.884 25.326 29.357 9.583 12.066 28.413 14.729 27.207
Deformation polarizability 16.481 4.283 20.425 14.201 14.861 33.962 18.262 31.156
Vapor pressure -0.393 6.459 16.558 8.635 9.739 23.202 11.251 13.724
Boiling point -0.789 11.799 12.989 8.864 12.220 22.385 9.874 16.157
DHvap -0.338 6.433 13.555 8.384 9.992 20.772 7.396 13.503
DHvap(T) 7.717 11.939 24.057 13.722 22.735 29.753 14.091 6.858
Average values 6.505 12.133 9.067 9.882 13.008 25.167 17.131 23.303
The Lewis’s acid-base constants of the two carbon fibers were determined by using the relation (3). The variations of H a s p A N and S a s p A N as a function of D N A N were respectively plotted on Figures S5 and S6 for the different IGC methods and models. Figures S5 and S6 showed that the linearity of the various curves is not realized all models and chromatographic models excepted for Hamieh and Kiselev models. On gave on Tables 4 and 5 the various values of the enthalpic K A , K D and entropic ω A and ω D acid-base constants of carbon fibers (a) and (b) and also the linear regression coefficient R2. The accurate results obtained by using the thermal model showed an important difference in the acid-base constants with that obtained by the other models and methods. The smaller values of R2 (<0.500) obtained with the other models led to suppose that these various models cannot be supposed as accurate. The only interesting result that can be deduced from Tables 4 and 5 is that confirming once again the important and greater acid-base constants of the oxidized carbon fibers (b) for the different chromatographic methods and models.
Table S4. Values of the acid base constants K A , K D , ω A , ω D   and of the untreated carbon fibers (a) with the different acid base ratios.
Models or methods KA KD KD/KA 10-3ωA 10-3ωD ωD/ωA
Kiselev 0.14 0.29 2.2 0.9705 0.31 0.41 1.3 0.9876
Spherical 0.10 2.53 25.3 0.0475 0.26 4.40 17.0 0.0893
Geometric 0.05 1.99 43.7 0.0366 0.17 2.94 17.7 0.1959
Van der Waals 0.09 2.49 26.7 0.0375 0.27 4.36 16.4 0.0847
Redlich-Kwong 0.09 2.46 27.0 0.0371 0.24 4.04 16.5 0.0844
Cylindrical 0.12 -0.16 -1.4 0.3736 0.30 -0.47 -1.6 0.4863
Hamieh model 0.14 0.44 3.1 0.9252 0.17 0.75 4.5 0.9309
Topological index 0.11 1.66 15.1 0.2264 0.28 1.09 3.8 0.6131
Deformation polarizability 0.13 2.21 17.3 0.1226 0.30 1.69 5.6 0.4612
Vapor pressure 0.12 0.69 5.9 0.2498 0.24 1.15 4.7 0.4934
Boiling point 0.11 0.76 7.1 0.2089 0.29 0.06 0.2 0.5289
DHvap 0.09 0.70 7.5 0.1873 0.27 0.09 0.3 0.5091
DHvap(T) 0.14 1.89 13.4 0.1419 0.50 2.43 4.8 0.4308
Average values 0.14 1.28 8.9 0.3193 0.30 1.64 5.5 0.5303
Table S5. Values of the acid base constants K A , K D , ω A , ω D   and of the oxidized carbon fibers (b) with the different acid base ratios.
Models or methods KA KD KD/KA 10-3ωA 10-3ωD ωDA
Kiselev 0.20 0.78 3.9 0.7242 0.34 1.40 4.1 0.8568
Spherical 0.16 3.34 21.2 0.0643 0.30 5.97 20.1 0.0689
Geometric 0.09 2.78 29.7 0.06 0.20 4.01 20.1 0.1061
Van der Waals 0.15 3.37 22.5 0.0515 0.33 5.77 17.5 0.0671
Redlich-Kwong 0.15 0.15 1.0 0.0516 0.30 5.33 17.6 0.0673
Cylindrical 0.18 0.22 1.2 0.7422 0.38 -0.73 -1.9 0.5582
Hamieh model 0.19 1.06 5.4 0.98 0.20 2.52 12.6 0.9244
Topological index 0.17 2.60 15.5 0.1805 0.35 2.68 7.8 0.3816
Deformation polarizability 0.19 3.31 17.4 0.1127 0.38 3.75 9.9 0.2279
Vapor pressure 0.17 1.43 8.3 0.2066 0.37 0.69 1.9 0.4483
Boiling point 0.16 1.54 9.5 0.1829 0.34 1.06 3.2 0.3909
DHvap 0.15 1.40 9.5 0.1691 0.31 0.86 2.7 0.3832
DHvap(T) 0.18 2.79 15.8 0.106 0.46 4.52 9.8 0.2163
Average values 0.20 2.00 10.2 0.2506 0.35 2.70 7.8 0.3182
To compare between the acid-base constants of the untreated and oxidized carbon fibers, one gave on Table 6 the corresponding acid-base parameters obtained from the thermal model. The results on Table 6 showed that the two fiber types are amphoteric with an important basic character. The ratio KD/KA is equal to 3.1 (about three times more basic than acidic) for the untreated fibers and 5.4 (more than 5 times more basic than acidic) for the oxidized fibers.
One observed that oxidized fibers are 1.4 times more acidic and 2.4 more basic than that of the untreated fibers thus proving the important role of the oxidation of the carbon fibers in increasing the acid-base properties. The amphoteric character of the oxidized fibers is about 1.7 more important than that of the untreated fibers.
Table 6. Values of K A , K D , ω A and ω D   of the two carbon fibers I and II with the acid base ratios by using Hamieh thermal model.
Solid surface KA KD KD/KA 10-3ωA 10-3ωD ωDA
Untreated carbon fibers (a) 0.14 0.44 3.1 0.17 0.75 4.5
Oxidized carbon fibers (b) 0.19 1.06 5.4 0.20 2.52 12.6
Ratio fibers (b)/fibers (a) 1.36 2.41 1.74 1.18 3.36 2.80

Specific and total surface energies of carbon fibers

To determine the specific or acid-base surface energy of the studied carbon fibers, one applied the relation of Van Oss et al. [65] given the specific enthalpy of adsorption as a function of the Lewis acid surface energy of the solid surface γ s + and the solvent γ l + ; and the corresponding Lewis base surface energy ( γ s for the surface and γ l for the solvent):
G a s p T = 2 N a   γ l γ s + + γ l + γ s
In the scale of Van Oss et al. [65,72], two monopolar solvents such as ethyl acetate (EA) and dichloromethane were used and characterized by:
γ C H 2 C l 2 + = 5.2   m J / m 2   ,   γ C H 2 C l 2 = 0 γ E A + = 0   ,                         γ E A = 19.2   m J / m 2
By combining the two relations (5) and (6), on can determine the Lewis’s acid and base surface energies of the solid surface γ s + and γ s by the following relations:
γ s + = G a s p T   E A 2 4 N 2 a E A 2 γ E A                               γ s = G a s p T   ( C H 2 C l 2 ) 2 4 N 2 a C H 2 C l 2 2 γ C H 2 C l 2 +  
By using the experimental results given by the thermal model for the dichloromethane and the ethyl acetate applying on the two carbon fibers, one gave on Table 7 the corresponding values of G a s p T at different temperatures.
The values on Table 7 and relations (6) and (7) allowed to obtain the Lewis’s acid and base surface energies of the solid surface γ s + and γ s as well as the specific surface energy γ s A B of the carbon fibers (a) and (b) by using relation (8):
γ s A B = 2 γ s + γ s
The application of relation (8) allowed to determine the values of γ s A B of the carbon fibers at different temperatures. On Table 8, one gave the different values of γ s + , γ s and γ s A B of untreated and oxidized carbon fibers
The obtained values of the specific surface energy γ s A B given on Table 8 showed that γ s A B of the oxidized fibers is obviously larger (about 1.5 times) than the untreated fibers. The total surface energy γ s t o t . of the fibers can be then obtained by using relation (9):
γ s t o t . = γ s d + γ s A B
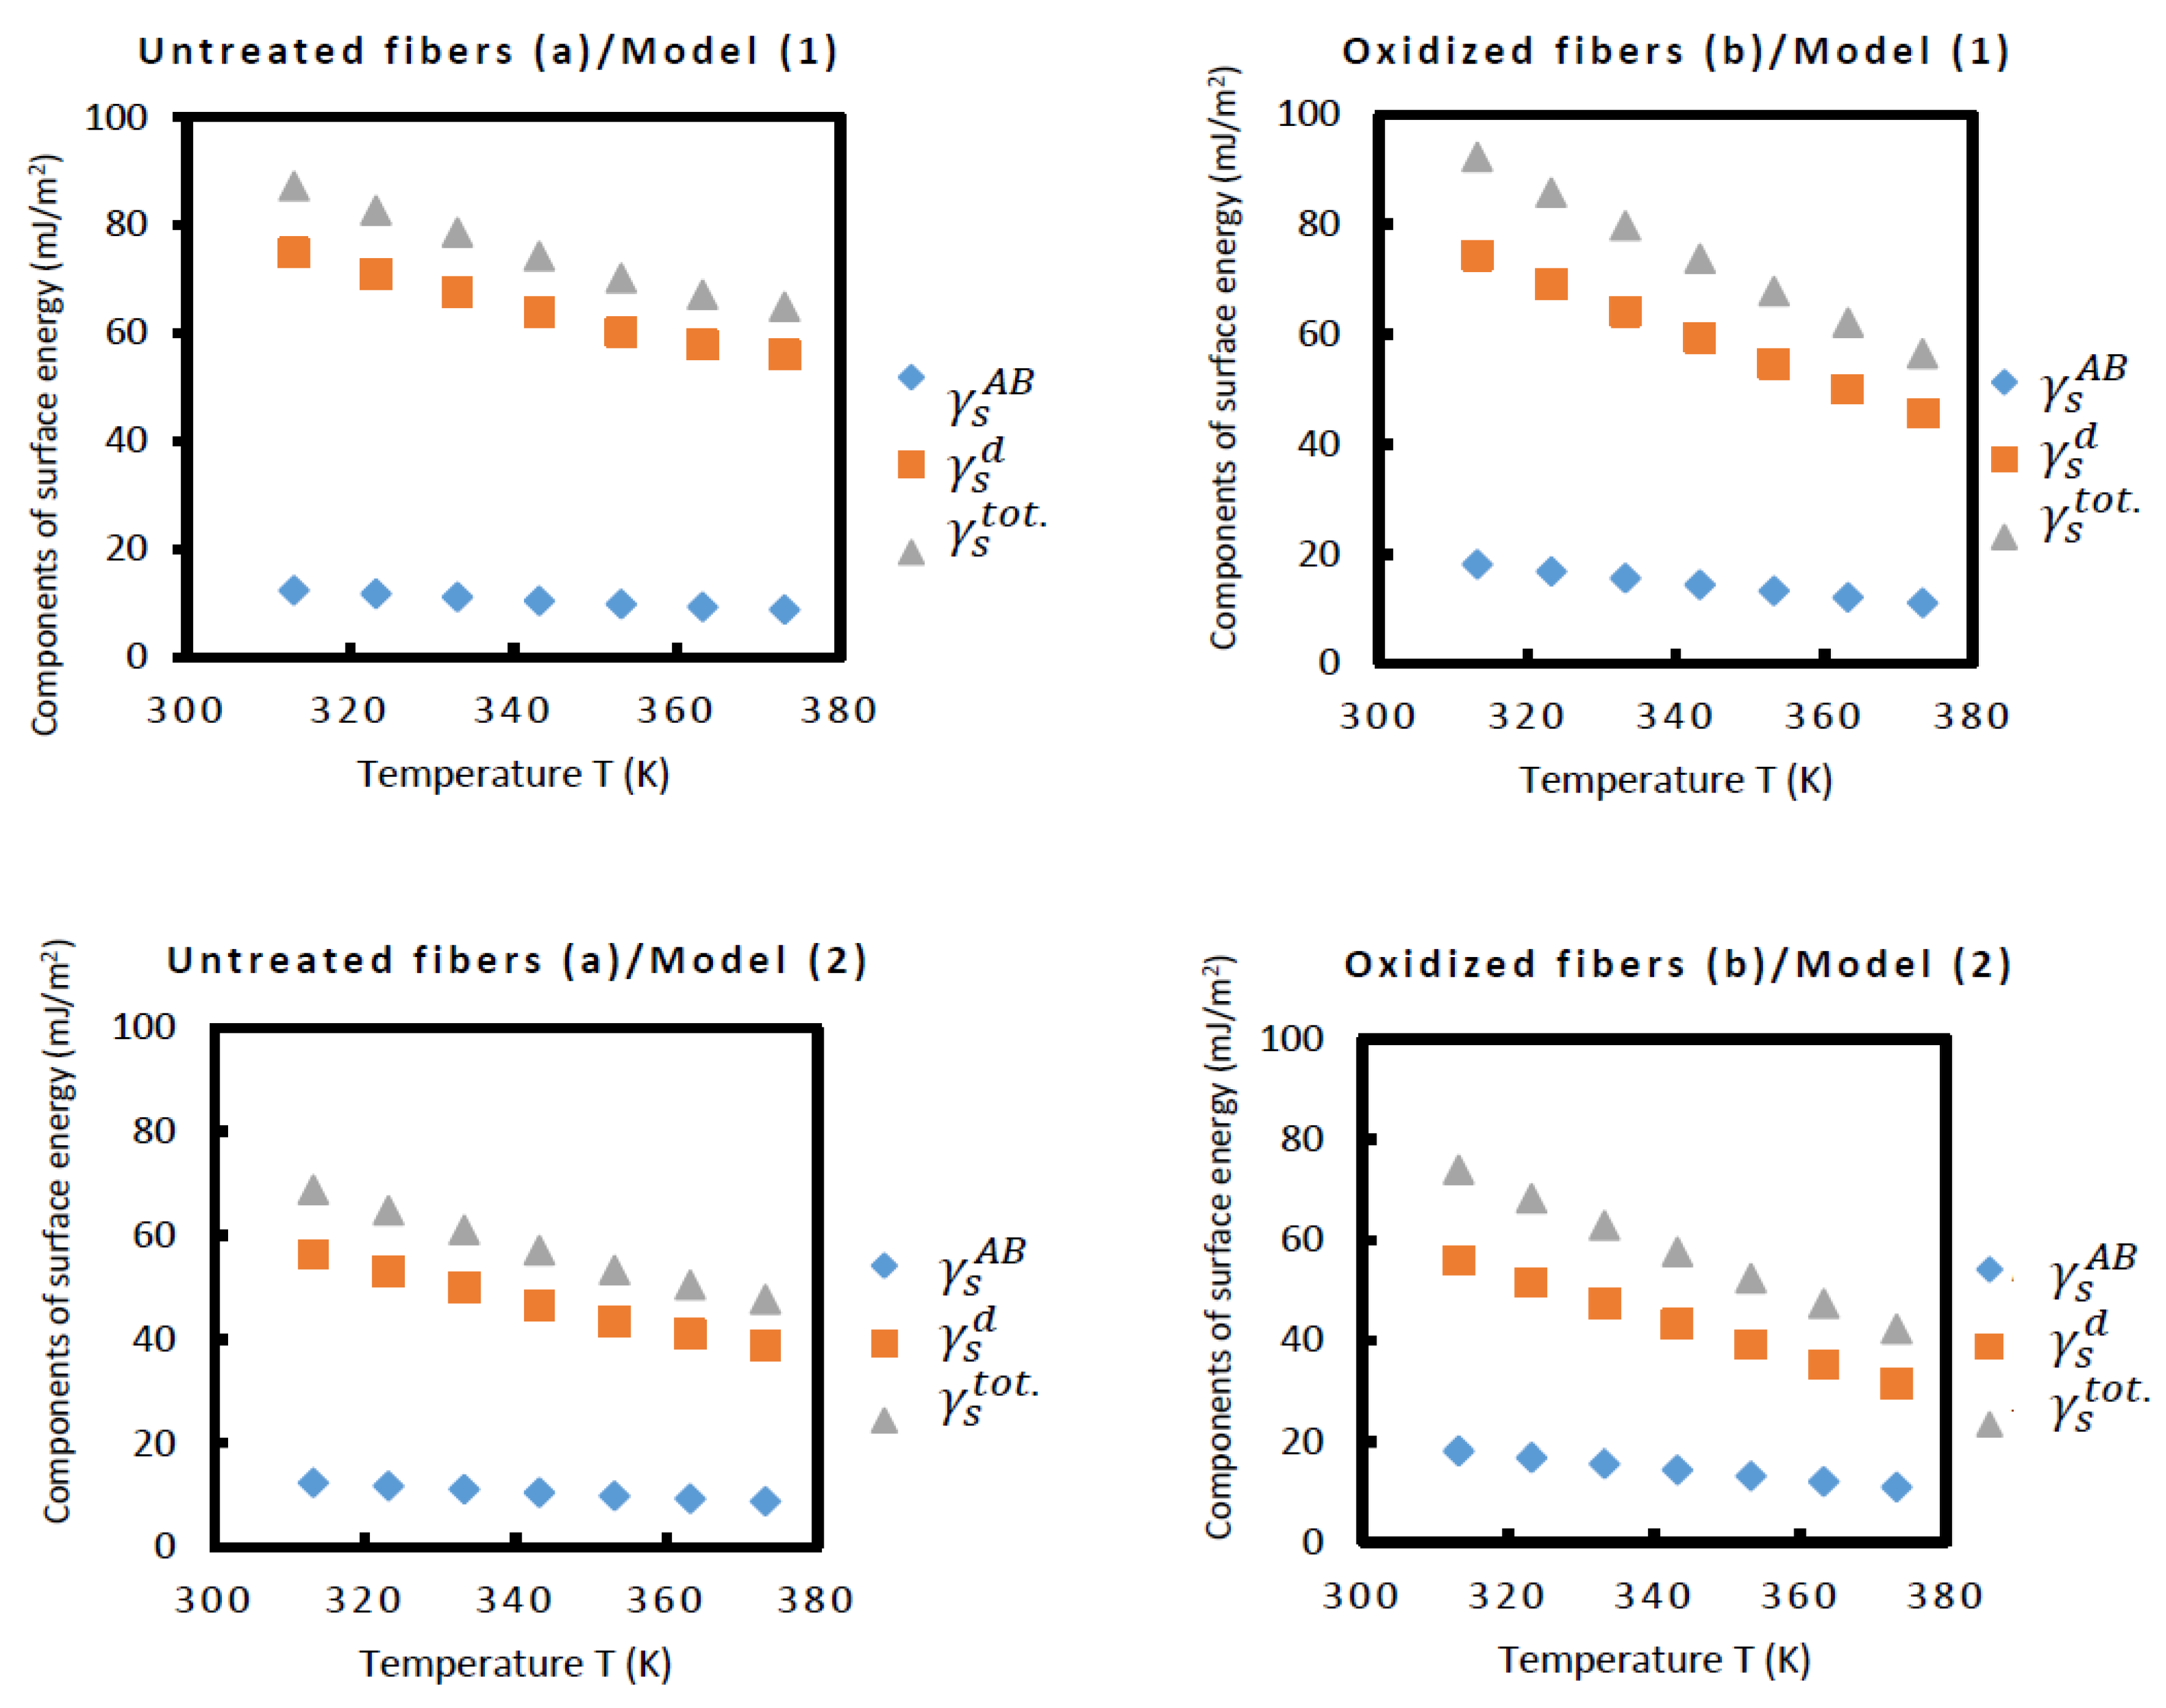
The above results of the specific acid-base surface energies of the carbon fibers allowed to obtain the total surface energy of the fibers by summing the specific surface energy and the dispersive surface energy of carbon fibers by using the results obtained with the thermal model of the two cases of the calculation of the surface areas of molecules by using the PTFE substrate as a model solid (thermal model 1) or PE surface (thermal model 2). The results were given on Table 9.
The results on Table 9 showed the two thermal models conducted to the same conclusion of greater total surface energy of the oxidized carbon fiber (b) about 10% more larger than that of the untreated carbon fibers, certainly due to the important difference in the values of the specific surface energy between the two fibers because of the increase of acid-base site numbers in the oxidized fibers. On the other hand, when comparing between the magnitudes of the specific acid-base surface energy and the dispersive surface energy of the fibers, one observed that the ratio of γ s A B / γ s d varies between 14% and 20% for the untreated fibers and between 25% and 30 % for the oxidized fibers (Figure 3).

Conclusion

In this study, we were interested in the determination of the surface physicochemical of the untreated and oxidized carbon fibers by using the inverse gas chromatography technique at infinite dilution. Experimental measurements allowed to obtain the retention volume of n-alkanes and polar solvents adsorbed on the carbon fibers. The variations of RTlnVn of the adsorbed organic molecules as a function of the temperature led to the determination of the dispersive component of the surface energy of the two carbon fibers and the specific and Lewis’s acid-base interactions. The results showed comparable values of γ s d for the two studied carbon fibers. The specific free energy G a s p T of adsorption of polar molecules was determined and showed larger values in the case of oxidized carbon fibers. The variations of G a s p T versus the temperature allowed to obtain the values of specific enthalpy ( H a s p ) and entropy ( S a s p ) of adsorption of polar molecules on the carbon fibers (a) and (b) for the various models and chromatographic methods. The larger values of ( H a s p ) of the different polar solvents for the oxidized fibers showed the greater acid-base site number relative to that of untreated fibers, due to the oxidization of the surface groups of the carbon fibers.
The determination of the Lewis’s acid-base constants has proved that the oxidized fibers are 1.4 times more acidic and 2.4 more basic than that of the untreated fibers thus proving the important role of the oxidation of the carbon fibers by increasing the acid-base properties. The amphoteric character of the oxidized fibers was proved to be 1.7 more important than that of the untreated fibers.
One determined the Lewis’s acid and base surface energies of the solid surface γ s + and γ s and therefore the values of the specific acid-base surface energy γ s A B of the carbon fibers at different temperatures. One proved that the specific surface energy γ s A B of the oxidized fibers was larger (about 1.5 times) than the untreated fibers confirming the results previously obtained on the strong acid-base interactions of the oxidized carbon fibers with the various polar molecules.

Funding

This research did not receive any specific grant.

Conflicts of Interest

Author declares that there is no conflict of interest.

References

  1. Collins, M.N.; Culebras, M.; Ren, G. Chapter 8 - The use of lignin as a precursor for carbon fiber–reinforced composites, Editor(s): D. Puglia, C. Santulli, F. Sarasini, Micro and Nanolignin in Aqueous Dispersions and Polymers, Elsevier, 2022, Pages 237-250, ISBN 9780128237021. [CrossRef]
  2. Morgan, P. Carbon Fibers and Their Composites, CRC Press, 2005 May 20. 1200 pages, eBook ISBN: 9780429116827. [CrossRef]
  3. Park, S.J. Carbon Fibers, Springer, Dordrecht, The Netherlands, 2015. Publisher: Springer Dordrecht, Springer Series in Materials Science (SSMATERIALS, volume 210), 330 pages. [CrossRef]
  4. Frank, E.; Steudle, L.M.; Ingildeev, D.; Spörl, J.M.; Buchmeiser, M.R. Carbon fibers: Precursor systems, processing, structure, and properties. Angew Chem Int Ed Engl. 2014, 53, 5262–5298. [Google Scholar] [CrossRef]
  5. Peijs, T.; Kirschbaum, R.; Jan Lemstra, P. Chapter 5: A critical review of carbon fiber and related products from an industrial perspective. Advanced Industrial and Engineering Polymer Research 2022, 5, 90–106. [Google Scholar] [CrossRef]
  6. Roberts, T. The Carbon Fiber Industry: Global Strategic Market Evaluation 2006–2010; Materials Technology Publications: Watford, UK, 2006. [Google Scholar]
  7. Red, C. Aerospace will continue to lead advanced composites market in 2006. Composites Manuf. 2006, 7, 24–33. [Google Scholar]
  8. Papirer, E.; Brendlé, E.; Ozil, F.; Balard, H. Comparison of the surface properties of graphite, carbon black and fullerene samples, measured by inverse gas chromatography. Carbon 1999, 37, 1265–1274. [Google Scholar] [CrossRef]
  9. Chung, D.L. Carbon Fiber Composites; Butterworth-Heinemann: Boston, MA, USA, 1994; pp. 3–65. [Google Scholar]
  10. Donnet, J.B.; Bansal, R.C. Carbon Fibers, 2nd ed.; Marcel Dekker: New York, NY, USA, 1990; pp. 1–145. [Google Scholar]
  11. Friedlander, H.N.; Peebles, L.H. Jr.; Brandrup, J.; Kirby, J.R. On the chromophore of polyacrylonitrile. VI. Mechanism of color formation in polyacrylonitrile. Macromolecules. 1968, 1, 79–86. [Google Scholar] [CrossRef]
  12. Huang, X. Fabrication and Properties of Carbon Fibers. Materials (Basel). 2009, 2, 2369–2403. [Google Scholar] [CrossRef]
  13. Qiao, Z.; Ding, C. Recent progress in carbon fibers for boosting electrocatalytic energy conversion. Ionics 2022, 28, 5259–5273. [Google Scholar] [CrossRef]
  14. Schultz, J.; Lavielle, L.; Martin, C. The role of the interface in carbon fibre-epoxy composites. J. Adhes. 1987, 23, 45–60. [Google Scholar] [CrossRef]
  15. Schultz, J.; Lavielle, L.; Martin, C. Propriétés de surface des fibres de carbone déterminées par chromatographie gazeuse inverse. J. Chim. Phys. 1987, 84, 231. [Google Scholar] [CrossRef]
  16. Hamieh, T. Surface acid-base properties of carbon fibres. Advanced powder Technol. 1997, 8, 279–289. [Google Scholar] [CrossRef]
  17. Hamieh, T. Study of the temperature effect on the surface area of model organic molecules, the dispersive surface energy and the surface properties of solids by inverse gas chromatography. J. Chromatogr. A 2020, 1627, 461372. [Google Scholar] [CrossRef] [PubMed]
  18. Hamieh, T.; Ahmad, A.A.; Roques-Carmes, T.; Toufaily, J. New approach to determine the surface and interface thermodynamic properties of H-β-zeolite/rhodium catalysts by inverse gas chromatography at infinite dilution. Scientific Reports 2020, 10, 1–27. [Google Scholar] [CrossRef] [PubMed]
  19. Hamieh, T. New methodology to study the dispersive component of the surface energy and acid–base properties of silica particles by inverse gas chromatography at infinite dilution. Journal of Chromatographic Science 2022, 60, 126–142. [Google Scholar] [CrossRef]
  20. Hamieh, T. New Physicochemical Methodology for the Determination of the Surface Thermodynamic Properties of Solid Particles. AppliedChem 2023, 3, 229–255. [Google Scholar] [CrossRef]
  21. Hamieh, T.; Schultz, J. New approach to characterise physicochemical properties of solid substrates by inverse gas chromatography at infinite dilution. I. Some new methods to determine the surface areas of some molecules adsorbed on solid surfaces, J. Chromatogr. A 2002, 969, 17–26. [Google Scholar] [CrossRef]
  22. Hamieh, T.; Schultz, J. «New approach to characterise physicochemical properties of solid substrates by inverse gas chromatography at infinite dilution. II. Study of the transition temperatures of poly(methyl methacrylate) at various tacticities and of poly(methyl methacrylate) adsorbed on alumina and silica». Journal of Chromatography A 2002, 969, 27–36. [Google Scholar]
  23. Hamieh, T.; Fadlallah, M.-B.; Schultz, J. New approach to characterise physicochemical properties of solid substrates by inverse gas chromatography at infinite dilution. III. Determination of the acid-base properties of some solid substrates (polymers, oxides and carbon fibres): A new model. J. Chromatogr. A. 2002, 969, 37–47. [Google Scholar] [CrossRef]
  24. Sawyer, D.T.; Brookman, D.J. Thermodynamically based gas chromatographic retention index for organic molecules using salt-modified aluminas and porous silica beads. Anal. Chem. 1968, 40, 1847–1850. [Google Scholar] [CrossRef]
  25. Saint-Flour, C.; Papirer, E. Gas-solid chromatography. A method of measuring surface free energy characteristics of short carbon fibers. 1. Through adsorption isotherms. Ind. Eng. Chem. Prod. Res. Dev. 1982, 21, 337–341. [Google Scholar] [CrossRef]
  26. Saint-Flour, C.; Papirer, E. Gas-solid chromatography: Method of measuring surface free energy characteristics of short fibers. 2. Through retention volumes measured near zero surface coverage, Ind. Eng. Chem. Prod. Res. Dev. 1982, 21, 666–669. [Google Scholar] [CrossRef]
  27. Donnet, J.-B.; Park, S.; Balard, H. Evaluation of specific interactions of solid surfaces by inverse gas chromatography. Chromatographia 1991, 31, 434–440. [Google Scholar] [CrossRef]
  28. Chehimi, M.M.; Abel, M.-L.; Perruchot, C.; Delamar, M.; Lascelles, S.F.; Armes, S.P. The determination of the surface energy of conducting polymers by inverse gas chromatography at infinite dilution. Synth Met 1999, 104, 51–59. [Google Scholar] [CrossRef]
  29. Chehimi, M.M.; Pigois-Landureau, E. Determination of acid–base properties of solid materials by inverse gas chromatography at infinite dilution. A novel empirical method based on the dispersive contribution to the heat of vaporization of probes. J. Mater. Chem. 1994, 4, 741–745. [Google Scholar] [CrossRef]
  30. Brendlé, E.; Papirer, E. A new topological index for molecular probes used in inverse gas chromatography for the surface nanorugosity evaluation, 2. Application for the Evaluation of the Solid Surface Specific Interaction Potential. J. Colloid Interface Sci. 1997, 194, 217–2224. [Google Scholar] [CrossRef] [PubMed]
  31. Brendlé, E.; Papirer, E. A new topological index for molecular probes used in inverse gas chromatography for the surface nanorugosity evaluation, 1. Method of Evaluation. J. Colloid Interface Sci. 1997, 194, 207–216. [Google Scholar] [CrossRef] [PubMed]
  32. Gutmann, V. The Donor-acceptor Approach to Molecular Interactions, Plenum. New York, 1978.
  33. Dorris, G.M.; Gray, D.G. Adsorption of n-alkanes at zero surface coverage on cellulose paper and wood fibers. J. Colloid Interface Sci. 1980, 77, 353–362. [Google Scholar] [CrossRef]
  34. Fowkes, F.M. in: Surface and interfacial aspects of biomedical polymers, Vol. I, pp. 337–372, Ed: J. D. Andrade, Plenum Press, New York (1985).
  35. Hamieh, T.; Schultz, J. Etude par chromatographie gazeuse inverse de l’influence de la température sur l’aire de molécules adsorbées. J. Chim. Phys. 1996, 93, 1292–1331. [Google Scholar] [CrossRef]
  36. Hamieh, T.; Schultz, J. Study of the adsorption of n-alkanes on polyethylene surface - State equations, molecule areas and covered surface fraction. Comptes Rendus de l’Académie des Sciences, Série IIb 1996, 323, 281–289. [Google Scholar]
  37. Hamieh, T.; Schultz, J. A new method of calculation of polar molecule area adsorbed on MgO and ZnO by inverse gas chromatography. Comptes Rendus de l’Académie des Sciences, Série IIb 1996, 322, 627–633. [Google Scholar]
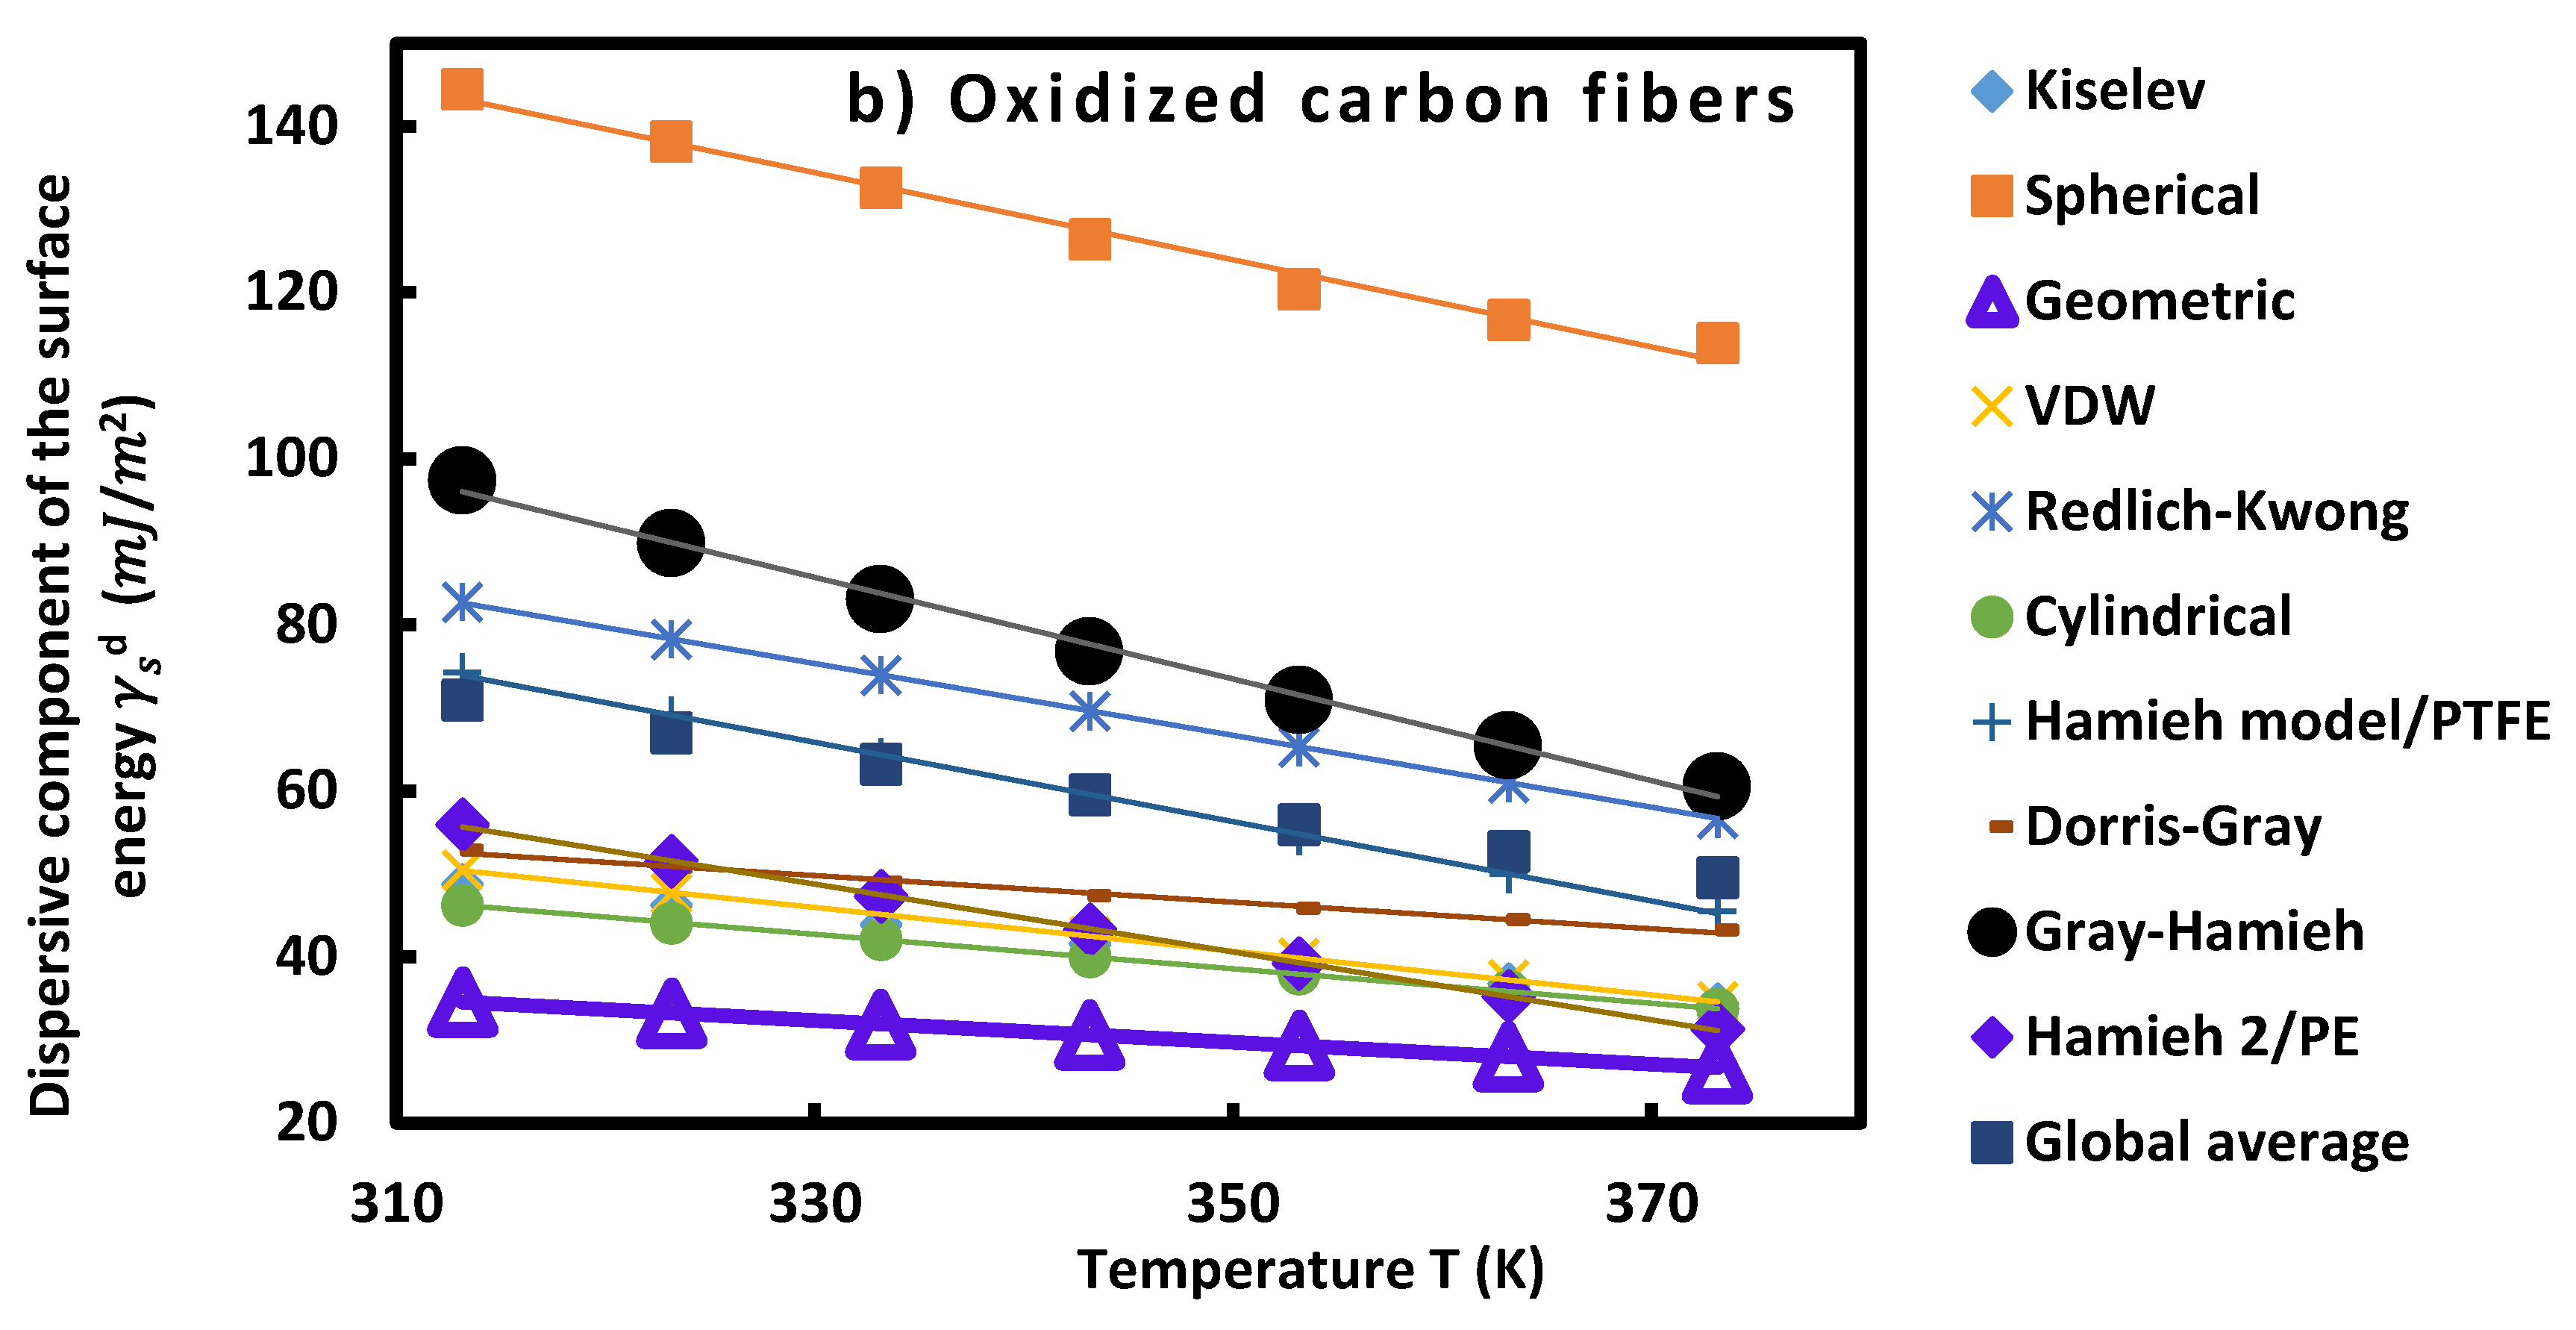
Figure 1. Evolution of γ s d   ( m J / m 2 ) of carbon fibers: untreated (a) and oxidized (b), as a function of the temperature T (K) for the various molecular models.
Preprints 91741 g001aPreprints 91741 g001b
Figure 2. Variations of G a s p of diethyl ether adsorbed on carbon fibers (a) and (b) as a function of the temperature for the different models and chromatographic methods.
Preprints 91741 g002aPreprints 91741 g002b
Figure 3. Evolution of the different components of the surface energy of the two carbon fibers as a function of the temperature.
Preprints 91741 g003
Table 7. Values of ( G a s p T   i n   k J / m o l ) of the dichloromethane and the ethyl acetate adsorbed on carbon fibers (a) and (b) at various temperatures.
( G a s p T ) Untreated carbon fibers Oxidized carbon fibers
T(K) CH2Cl2 Ethyl acetate CH2Cl2 Ethyl acetate
313.15 1.274 10.622 1.274 10.622
323.15 1.254 10.246 1.254 10.246
333.15 1.234 9.881 1.234 9.881
343.15 1.214 9.489 1.214 9.489
353.15 1.194 9.094 1.194 9.094
363.15 1.174 8.746 1.174 8.746
373.15 1.154 8.411 1.154 8.411
Table 8. Values of the specific acid and base surface energy contributions γ s + , γ s and γ s A B (in mJ/m2) of untreated and oxidized carbon fibers.
In mJ/m2 Untreated carbon fibers Oxidized carbon fibers
T(K) γ s γ s + γ s A B γ s γ s + γ s A B
313.15 0.88 43.88 12.45 1.02 79.70 18.06
323.15 0.85 40.75 11.79 0.95 74.19 16.77
333.15 0.82 37.82 11.17 0.88 68.96 15.54
343.15 0.80 34.81 10.53 0.81 63.83 14.35
353.15 0.77 31.91 9.91 0.74 58.79 13.20
363.15 0.74 29.45 9.35 0.68 53.86 12.08
373.15 0.72 27.19 8.82 0.62 49.06 11.00
Table 9. Values of the dispersive γ s d and total γ s t o t . surface energies (in mJ/m2) of untreated and oxidized carbon fibers by using the two thermal models.
In mJ/m2 Thermal model 1
T(K) γ s d ( F i b e r   a ) γ s t o t . ( F i b e r   a ) γ s d ( F i b e r   b ) γ s t o t . ( F i b e r   b )
313.15 74.9 87.3 74.3 92.3
323.15 71.0 82.8 69.1 85.8
333.15 67.6 78.7 64.1 79.7
343.15 63.8 74.3 59.3 73.7
353.15 60.2 70.2 54.6 67.8
363.15 57.9 67.2 50.0 62.1
373.15 56.1 64.9 45.5 56.5
In mJ/m2 Thermal model 2
T(K) γ s d ( F i b e r   a ) γ s t o t . ( F i b e r   a ) γ s d ( F i b e r   b ) γ s t o t . ( F i b e r   b )
313.15 56.3 68.8 55.9 74.0
323.15 53.0 64.8 51.5 68.3
333.15 49.9 61.1 47.4 62.9
343.15 46.6 57.2 43.3 57.6
353.15 43.5 53.4 39.2 52.4
363.15 41.1 50.4 35.2 47.3
373.15 38.9 47.7 31.3 42.3
Disclaimer/Publisher’s Note: The statements, opinions and data contained in all publications are solely those of the individual author(s) and contributor(s) and not of MDPI and/or the editor(s). MDPI and/or the editor(s) disclaim responsibility for any injury to people or property resulting from any ideas, methods, instructions or products referred to in the content.
Copyright: This open access article is published under a Creative Commons CC BY 4.0 license, which permit the free download, distribution, and reuse, provided that the author and preprint are cited in any reuse.
Prerpints.org logo

Preprints.org is a free preprint server supported by MDPI in Basel, Switzerland.

Subscribe

© 2024 MDPI (Basel, Switzerland) unless otherwise stated