Submitted:
12 December 2023
Posted:
13 December 2023
You are already at the latest version
Abstract

Keywords:
1. Introduction
2. Materials and Methods
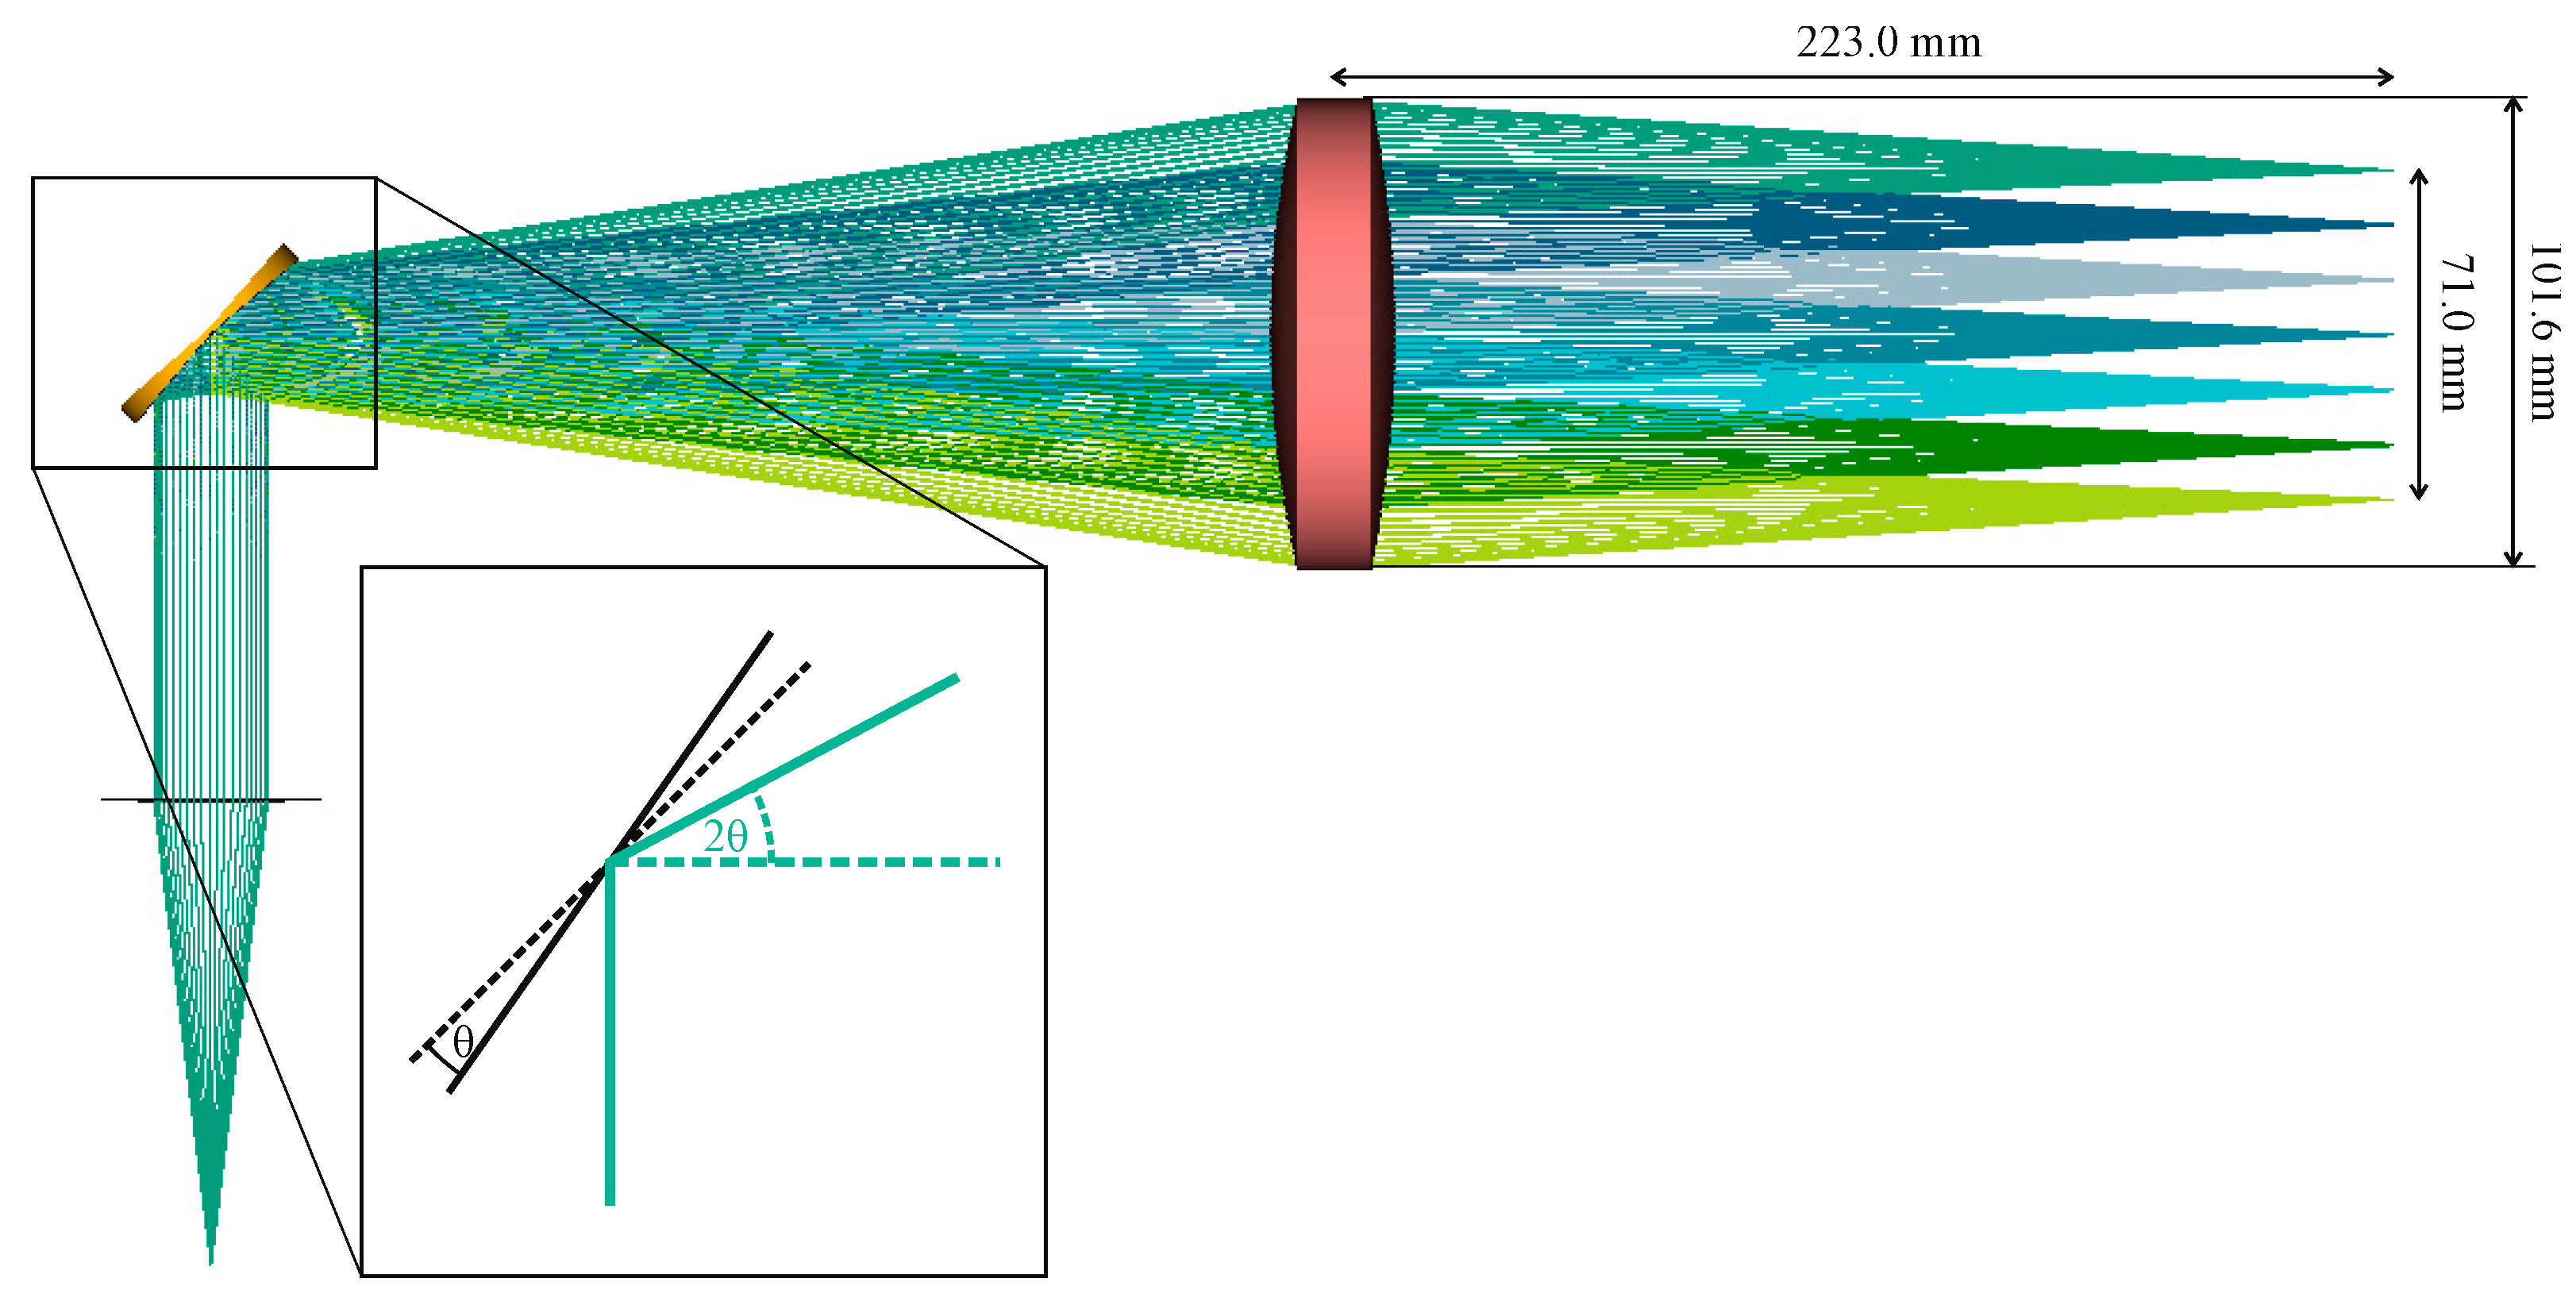
2.1. Design of the f-θ optics
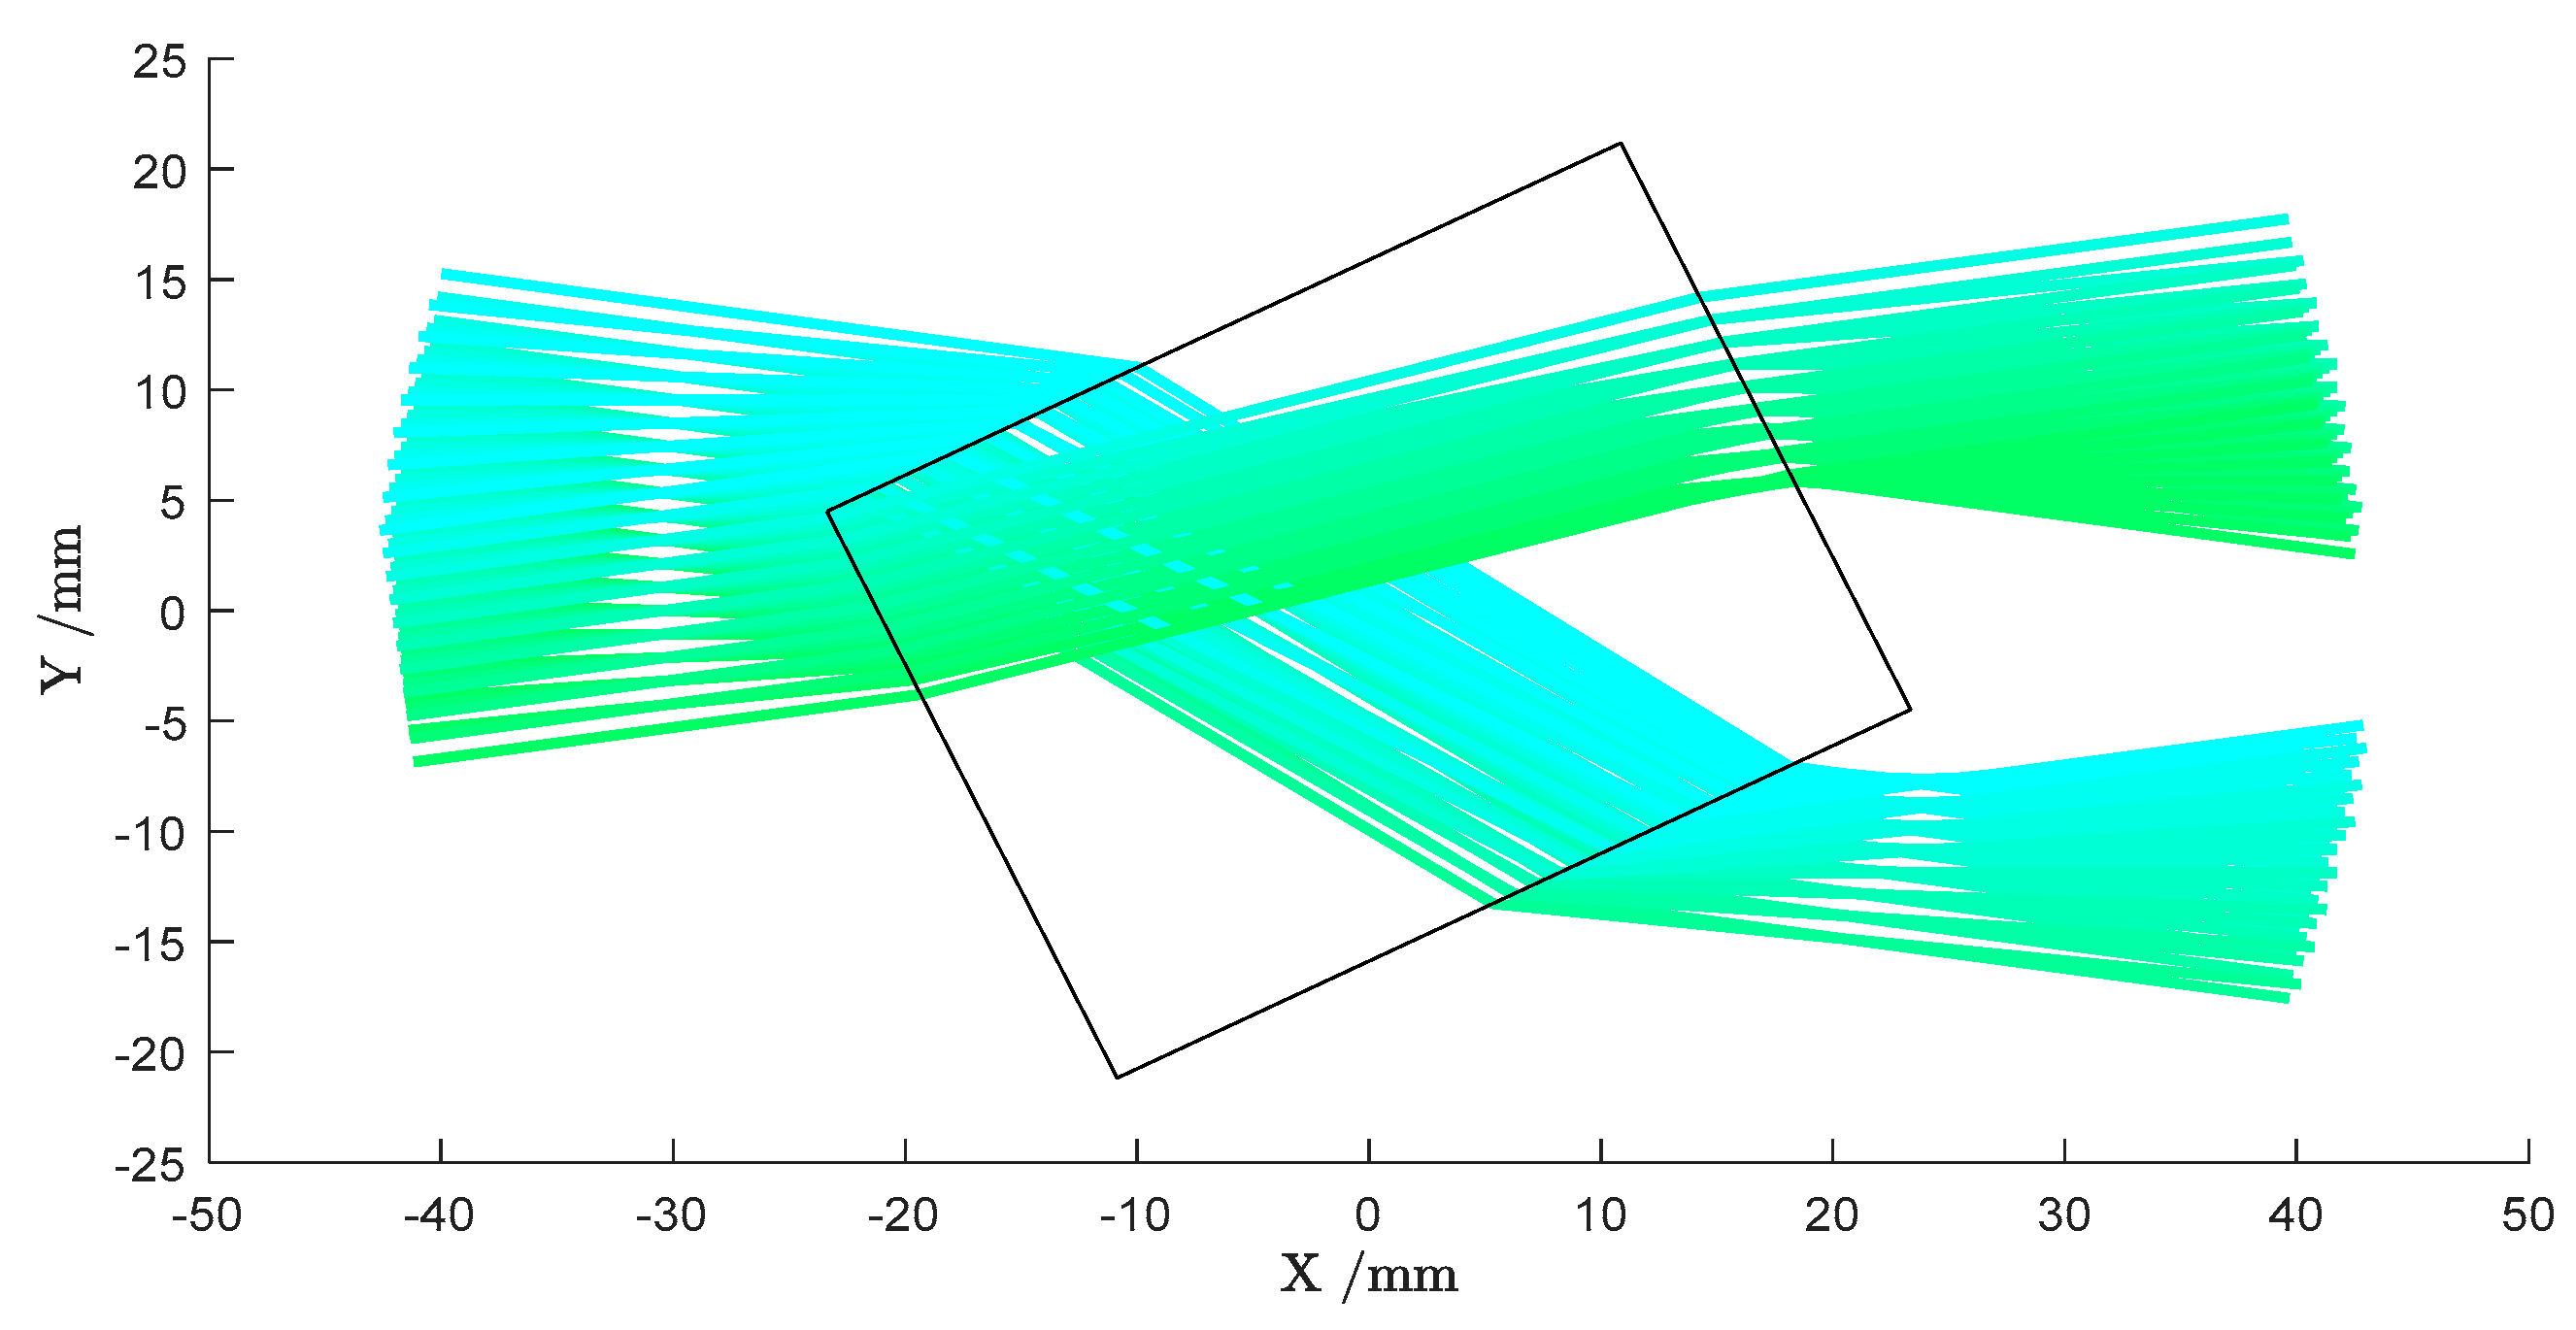
- Creating a flat focal plane with telecentricity in the image plane, which guarantees a normal incidence of the focused beam onto the sample.
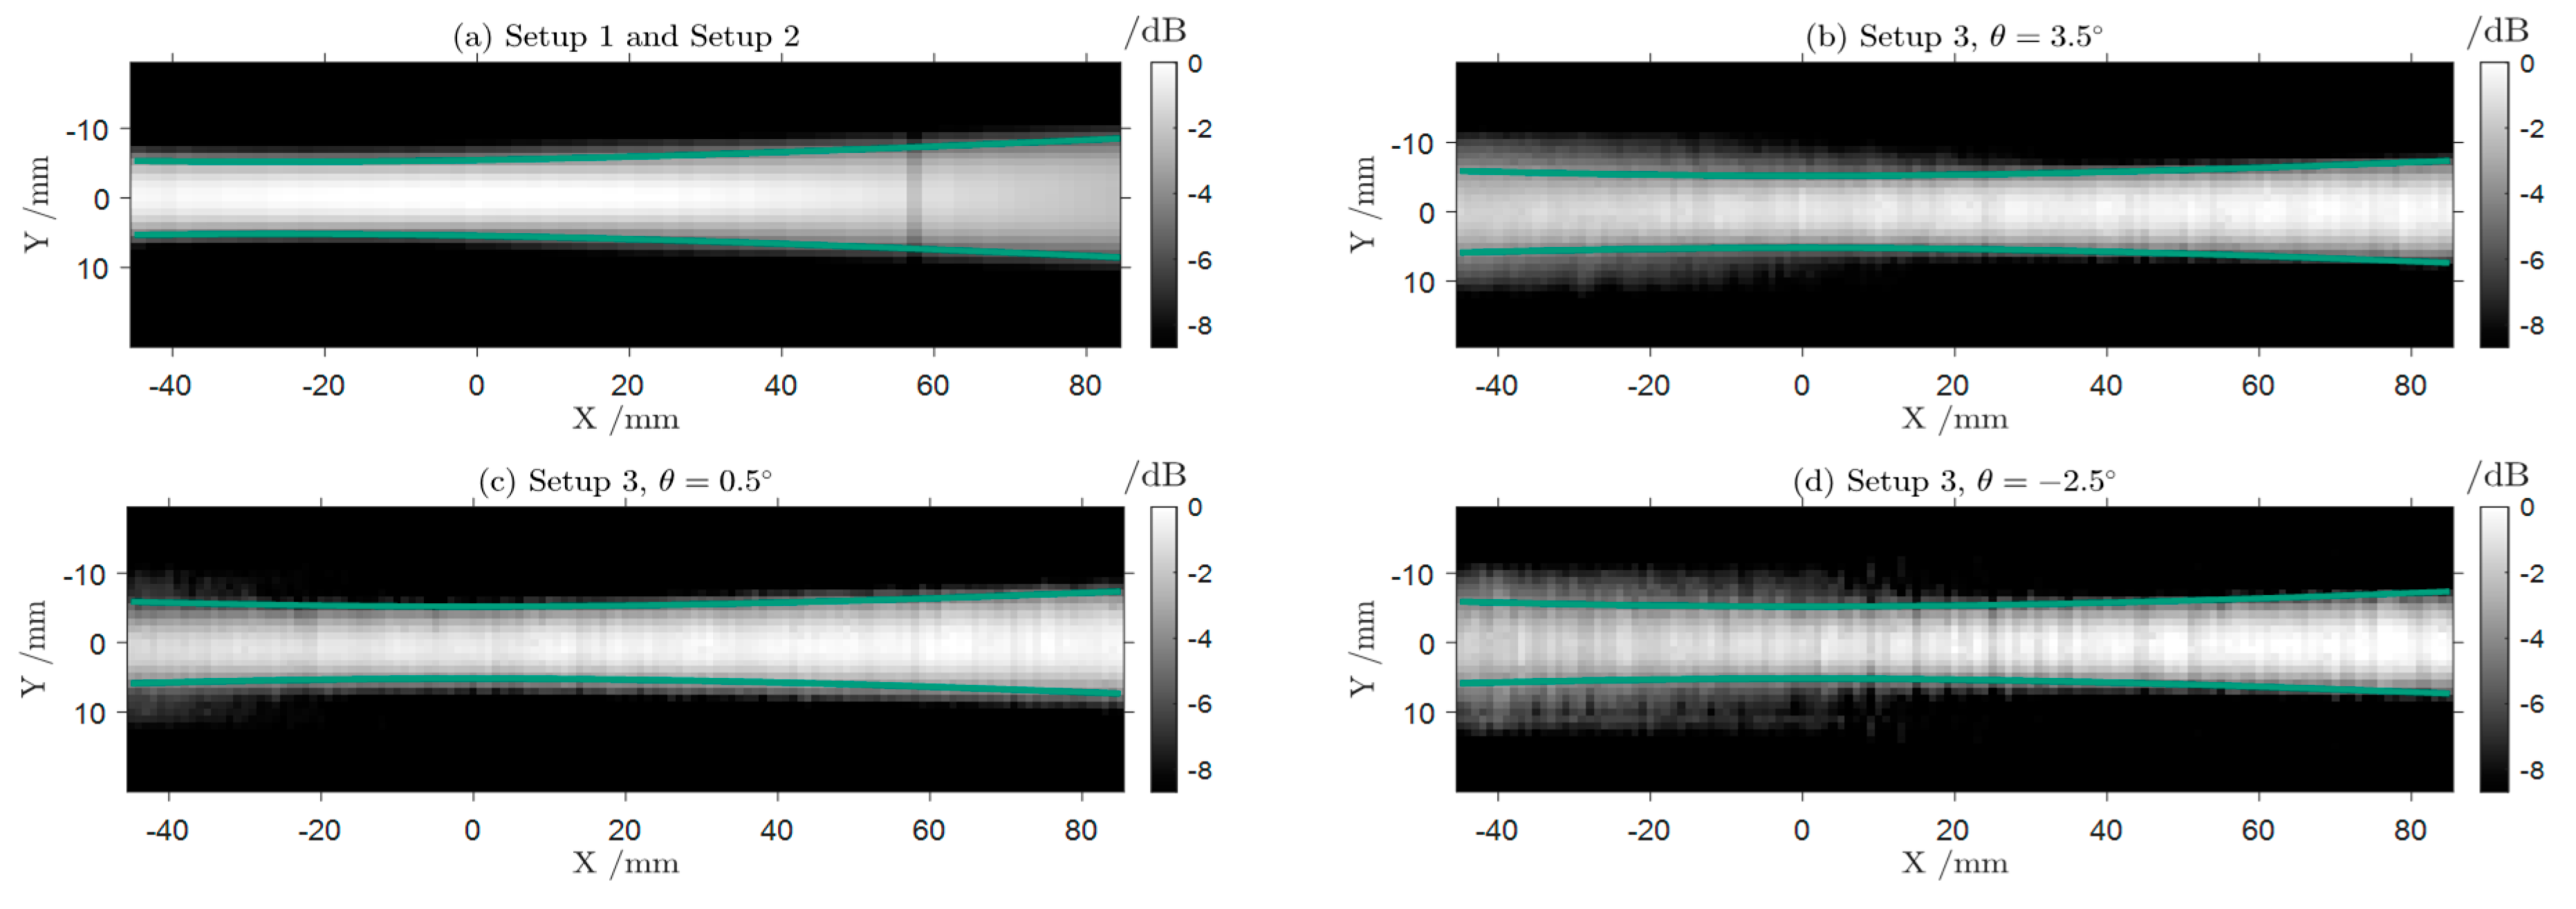
- Ensuring that the focus at each measurement point is as small as possible, ideally only limited by diffraction, and for the beam shape to be consistent throughout the mirror angles θ.
3. Results
4. Discussion and Outlook
5. Conclusions
Author Contributions
Funding
Institutional Review Board Statement
Informed Consent Statement
Data Availability Statement
Conflicts of Interest
References
- Nüßler, D.; Jonuscheit, J. Terahertz Based Non-Destructive Testing (NDT): Making the Invisible Visible. tm - Technisches Messen 2021, 88, 199–210. [Google Scholar] [CrossRef]
- Amenabar, I.; Lopez, F.; Mendikute, A. In Introductory Review to THz Non-Destructive Testing of Composite Mater. J Infrared Milli Terahz Waves 2013, 34, 152–169. [Google Scholar] [CrossRef]
- Wang, Q.; Xie, L.; Ying, Y. Overview of Imaging Methods Based on Terahertz Time-Domain Spectroscopy. Applied Spectroscopy Reviews 2021, 1–16. [Google Scholar] [CrossRef]
- Barowski, J.; Zimmermanns, M.; Rolfes, I. Millimeter-Wave Characterization of Dielectric Materials Using Calibrated FMCW Transceivers. IEEE Trans. Microwave Theory Techn. 2018, 66, 3683–3689. [Google Scholar] [CrossRef]
- O’Hara, J. F.; Withayachumnankul, W.; Al-Naib, I. A Review on Thin-Film Sensing with Terahertz Waves. J Infrared Milli Terahz Waves 2012, 33, 245–291. [Google Scholar] [CrossRef]
- Federici, J. F. Review of Moisture and Liquid Detection and Mapping Using Terahertz Imaging. J Infrared Milli Terahz Waves 2012, 33, 97–126. [Google Scholar] [CrossRef]
- Naftaly; Vieweg; Deninger. Industrial Applications of Terahertz Sensing: State of Play. Sensors 2019, 19, 4203. [Google Scholar] [CrossRef] [PubMed]
- Ellrich, F.; Bauer, M.; Schreiner, N.; Keil, A.; Pfeiffer, T.; Klier, J.; Weber, S.; Jonuscheit, J.; Friederich, F.; Molter, D. Terahertz Quality Inspection for Automotive and Aviation Industries. J Infrared Milli Terahz Waves 2020, 41, 470–489. [Google Scholar] [CrossRef]
- Perraud, J. B.; Obaton, A. F.; Bou-Sleiman, J.; Recur, B.; Balacey, H.; Darracq, F.; Guillet, J. P.; Mounaix, P. Terahertz Imaging and Tomography as Efficient Instruments for Testing Polymer Additive Manufacturing Objects. Appl. Opt. 2016, 55, 3462. [Google Scholar] [CrossRef]
- Fosodeder, P.; Hubmer, S.; Ploier, A.; Ramlau, R.; van Frank, S.; Rankl, C. Phase-Contrast THz-CT for Non-Destructive Testing. Opt. Express 2021, 29, 15711. [Google Scholar] [CrossRef]
- Wang, S.; Zhang, X.-C. Pulsed Terahertz Tomography. J. Phys. D: Appl. Phys. 2004, 37, R1–R36. [Google Scholar] [CrossRef]
- Guillet, J. P.; Recur, B.; Frederique, L.; Bousquet, B.; Canioni, L.; Manek-Hönninger, I.; Desbarats, P.; Mounaix, P. Review of Terahertz Tomography Techniques. J Infrared Milli Terahz Waves 2014, 35, 382–411. [Google Scholar] [CrossRef]
- Brahm, A.; Bauer, M.; Hoyer, T.; Quast, H.; Loeffler, T.; Riehemann, S.; Notni, G.; Tunnermann, A. All-Electronic 3D Computed THz Tomography. In 2011 International Conference on Infrared, Millimeter, and Terahertz Waves; IEEE: Houston, TX, USA, 2011; pp. 1–2. [Google Scholar] [CrossRef]
- May, K. H.; Keil, A.; Von Freymann, G.; Friederich, F. The Conjugate Gradient Least Square Algorithm in Terahertz Tomography. IEEE Access 2021, 9, 142168–142178. [Google Scholar] [CrossRef]
- May, K. H.; Keil, A.; Von Freymann, G.; Friederich, F. A Priori Information and Off-Axis Measurements in Terahertz Tomography. IEEE Access 2023, 11, 18311–18325. [Google Scholar] [CrossRef]
- Wang, D.; Li, B.; Rong, L.; Xu, Z.; Zhao, Y.; Zhao, J.; Wang, Y.; Zhai, C. Extended Depth of Field in Continuous-Wave Terahertz Computed Tomography Based on Bessel Beam. Optics Communications 2019, 432, 20–26. [Google Scholar] [CrossRef]
- Busch, S. F.; Town, G. E.; Scheller, M.; Koch, M. Focus Free Terahertz Reflection Imaging and Tomography with Bessel Beams. J Infrared Milli Terahz Waves 2015, 36, 318–326. [Google Scholar] [CrossRef]
- May, K. H.; Keil, A.; Freymann, G. V.; Friederich, F. A.; Freymann, G. V.; Friederich, F. A Multi-Channel Terahertz Tomography Setup. In 2023 48th International Conference on Infrared, Millimeter, and Terahertz Waves (IRMMW-THz); IEEE: Montreal, QC, Canada, 2023; pp. 1–2. [Google Scholar] [CrossRef]
- Björck, Å. Numerical Methods for Least Squares Problems; SIAM Soc. for Industrial and Applied Mathematics: Philadelphia, Pa, 1996. [Google Scholar]
- Araki, T.; Hirai, T.; Kyotani, T. Development of F-Theta Lens for UV Lasers. SEI Tech. Rev. 2009, 69, 59–65. [Google Scholar]
- McKenna, J. Notable Advances in Photonics: The JOPT Highlights of 2016. J. Opt. 2017, 19, 040401. [Google Scholar] [CrossRef]
- Mohammadzadeh, S.; Keil, A.; Leuchs, S.; Krebs, C.; NuBler, D.; Seewig, J.; Friederich, F. Hand-Guided Mobile Terahertz 3D Imaging Platform with Aspherical Telecentric f-θ Optics. In 2021 18th European Radar Conference (EuRAD); IEEE: London, United Kingdom, 2022; pp. 377–380. [Google Scholar] [CrossRef]
- Jansen, C.; Wietzke, S.; Peters, O.; Scheller, M.; Vieweg, N.; Salhi, M.; Krumbholz, N.; Jördens, C.; Hochrein, T.; Koch, M. Terahertz Imaging: Applications and Perspectives. Appl. Opt. 2010, 49, E48. [Google Scholar] [CrossRef]
- Mohammadzadeh, S.; Friederich, F. Design of a Quasioptical Scanning System for a Fast Mobile FMCW Terahertz Imaging System. J. Phys.: Conf. Ser. 2020, 1537, 012017. [Google Scholar] [CrossRef]
- Mohammadzadeh, S.; Klier, J.; Seewig, J.; Freymann, G. V.; Friederich, F. Ultra-Wideband Terahertz 3D Imaging with Aspherical Telecentric f-θ Optics. In 2023 48th International Conference on Infrared, Millimeter, and Terahertz Waves (IRMMW-THz); IEEE: Montreal, QC, Canada, 2023; pp. 1–2. [Google Scholar] [CrossRef]
- Harris, Z. B.; Khani, M. E.; Arbab, M. H. Terahertz Portable Handheld Spectral Reflection (PHASR) Scanner. IEEE Access 2020, 8, 228024–228031. [Google Scholar] [CrossRef] [PubMed]
- Nüßler, D.; Friederich, F. Terahertz Imaging Arrays for Industrial Inline Measurements. In 2022 52nd European Microwave Conference (EuMC); IEEE: Milan, Italy, 2022; pp. 36–39. [Google Scholar] [CrossRef]
- Hussung, R.; Keil, A.; Friederich, F. Handheld Millimeter Wave Imaging System Based on a Two-Dimensional Multistatic Sparse Array. In 2020 45th International Conference on Infrared, Millimeter, and Terahertz Waves (IRMMW-THz); IEEE: Buffalo, NY, USA, 2020; pp. 1–2. [Google Scholar] [CrossRef]
- Hussung, R.; Mohammadzadeh, S.; Cibiraite-Lukenskiene, D.; Keil, A.; Friederich, F. Handheld Millimeter-Wave Imaging at Video Rates and Its Applications. In 2022 International Workshop on Antenna Technology (iWAT); IEEE: Dublin, Ireland, 2022; pp. 79–81. [Google Scholar] [CrossRef]
- Ntouni, G. D.; Merkle, T.; Loghis, E. K.; Tzeranis, G.; Koratzinos, V.; Skentos, N. D.; Kritharidis, D. Real-Time Experimental Wireless Testbed with Digital Beamforming at 300 GHz. In 2020 European Conference on Networks and Communications (EuCNC); IEEE: Dubrovnik, Croatia, 2020; pp. 271–275. [Google Scholar] [CrossRef]
- Lu, Y.; Jiang, B.; Lü, S.; Liu, Y.; Li, S.; Cao, Z.; Qi, X. Arrays of Gaussian Vortex, Bessel and Airy Beams by Computer-Generated Hologram. Optics Communications 2016, 363, 85–90. [Google Scholar] [CrossRef]
- Ntouni, G. D.; Merkle, T.; Loghis, E. K.; Tzeranis, G.; Koratzinos, V.; Skentos, N. D.; Kritharidis, D. Real-Time Experimental Wireless Testbed with Digital Beamforming at 300 GHz. In 2020 European Conference on Networks and Communications (EuCNC); IEEE: Dubrovnik, Croatia, 2020; pp. 271–275. [Google Scholar] [CrossRef]
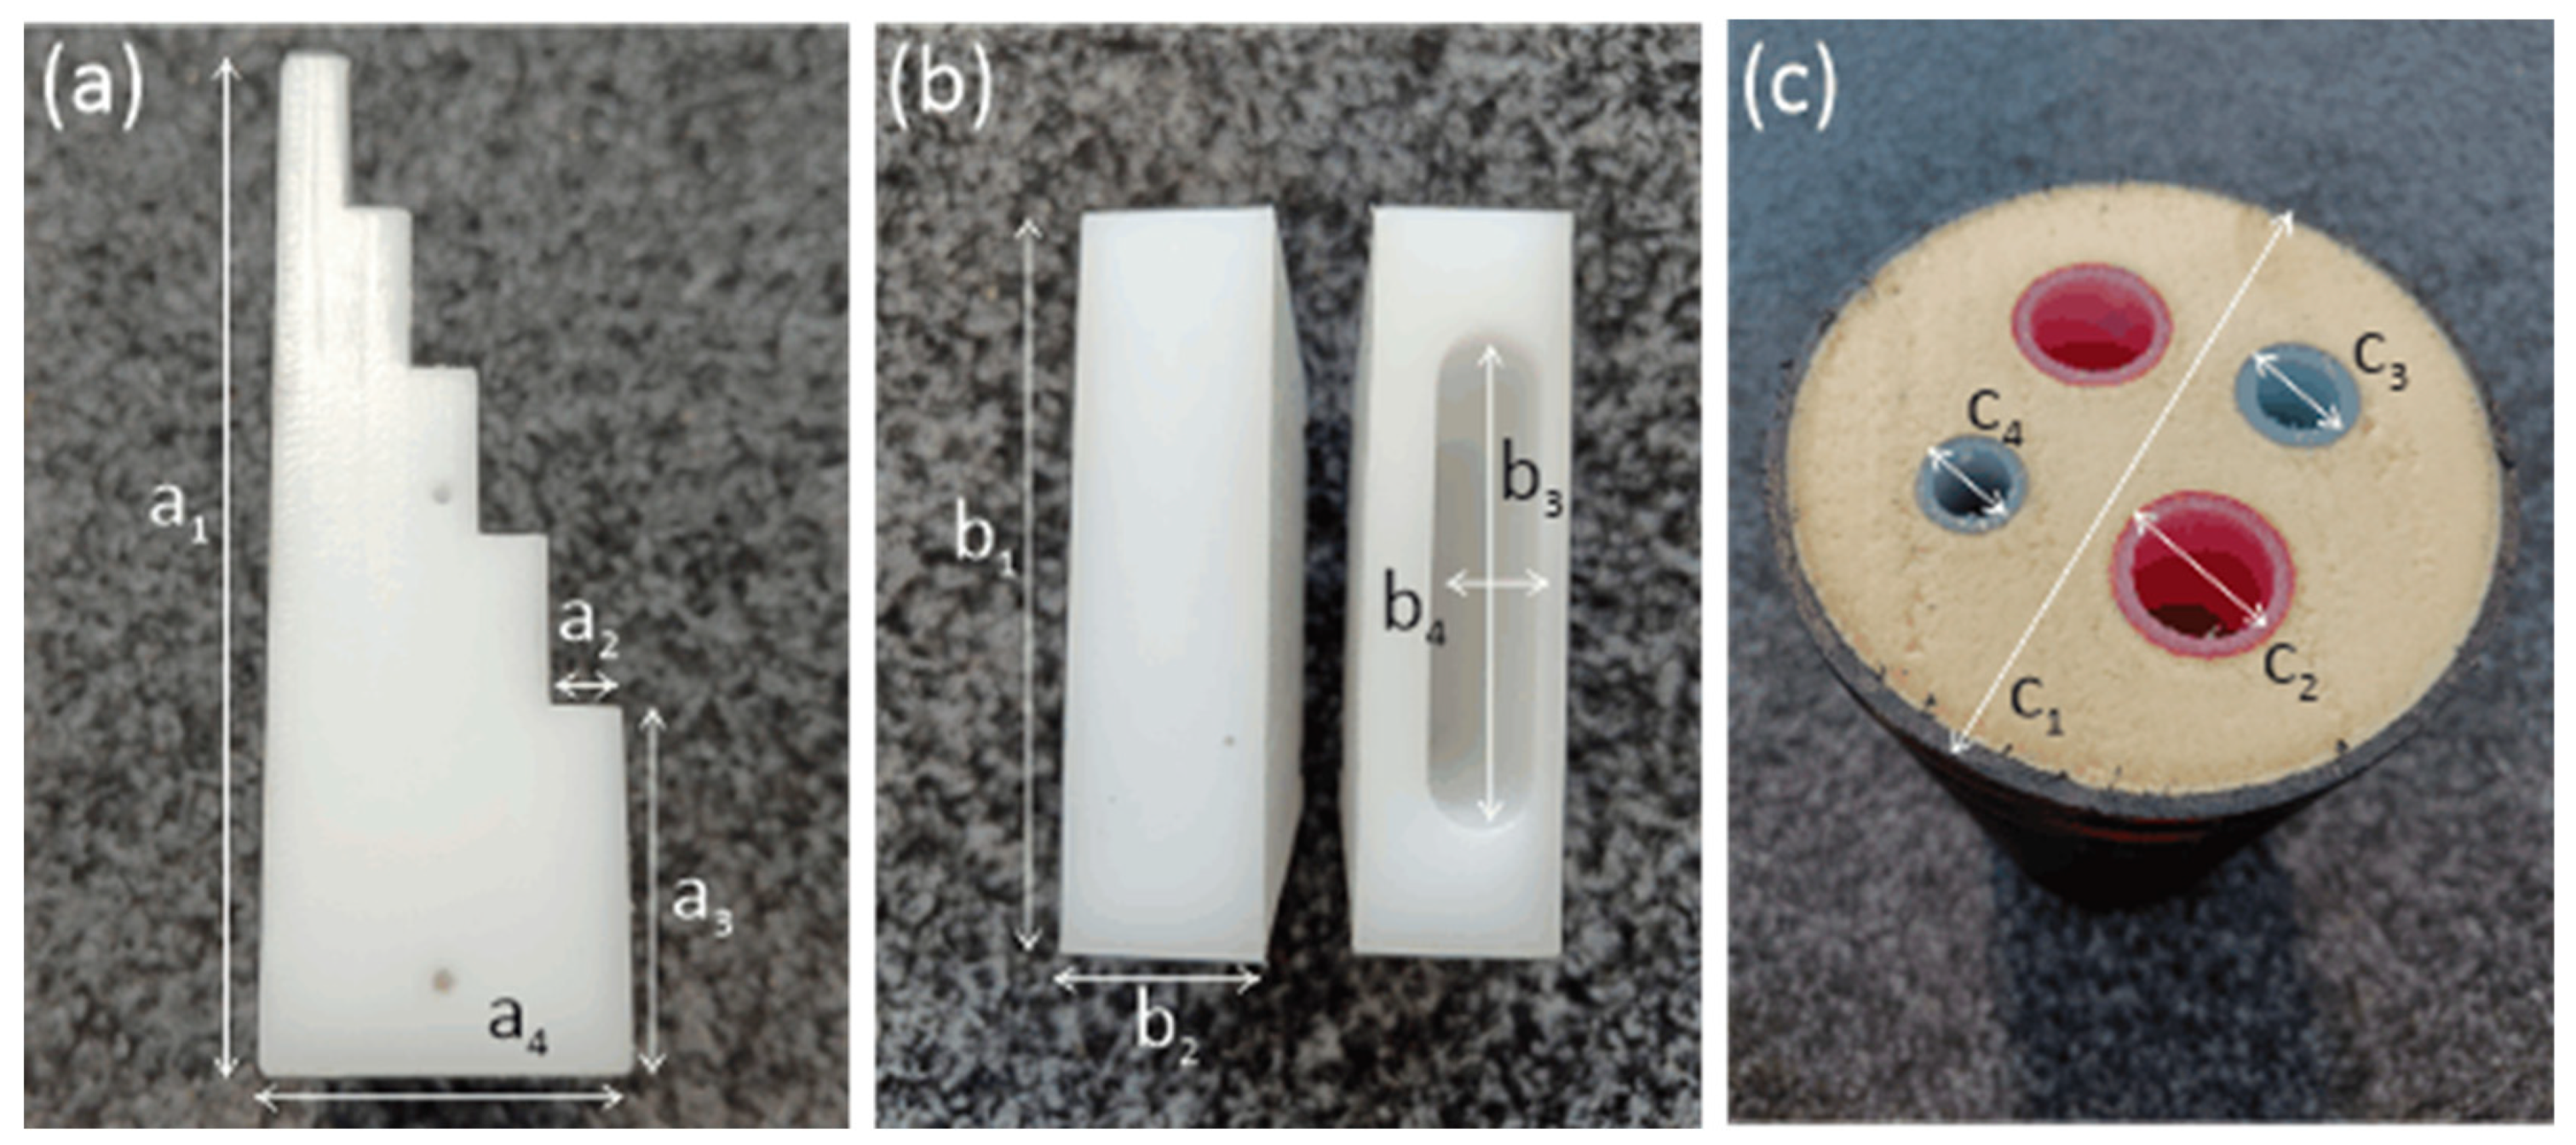

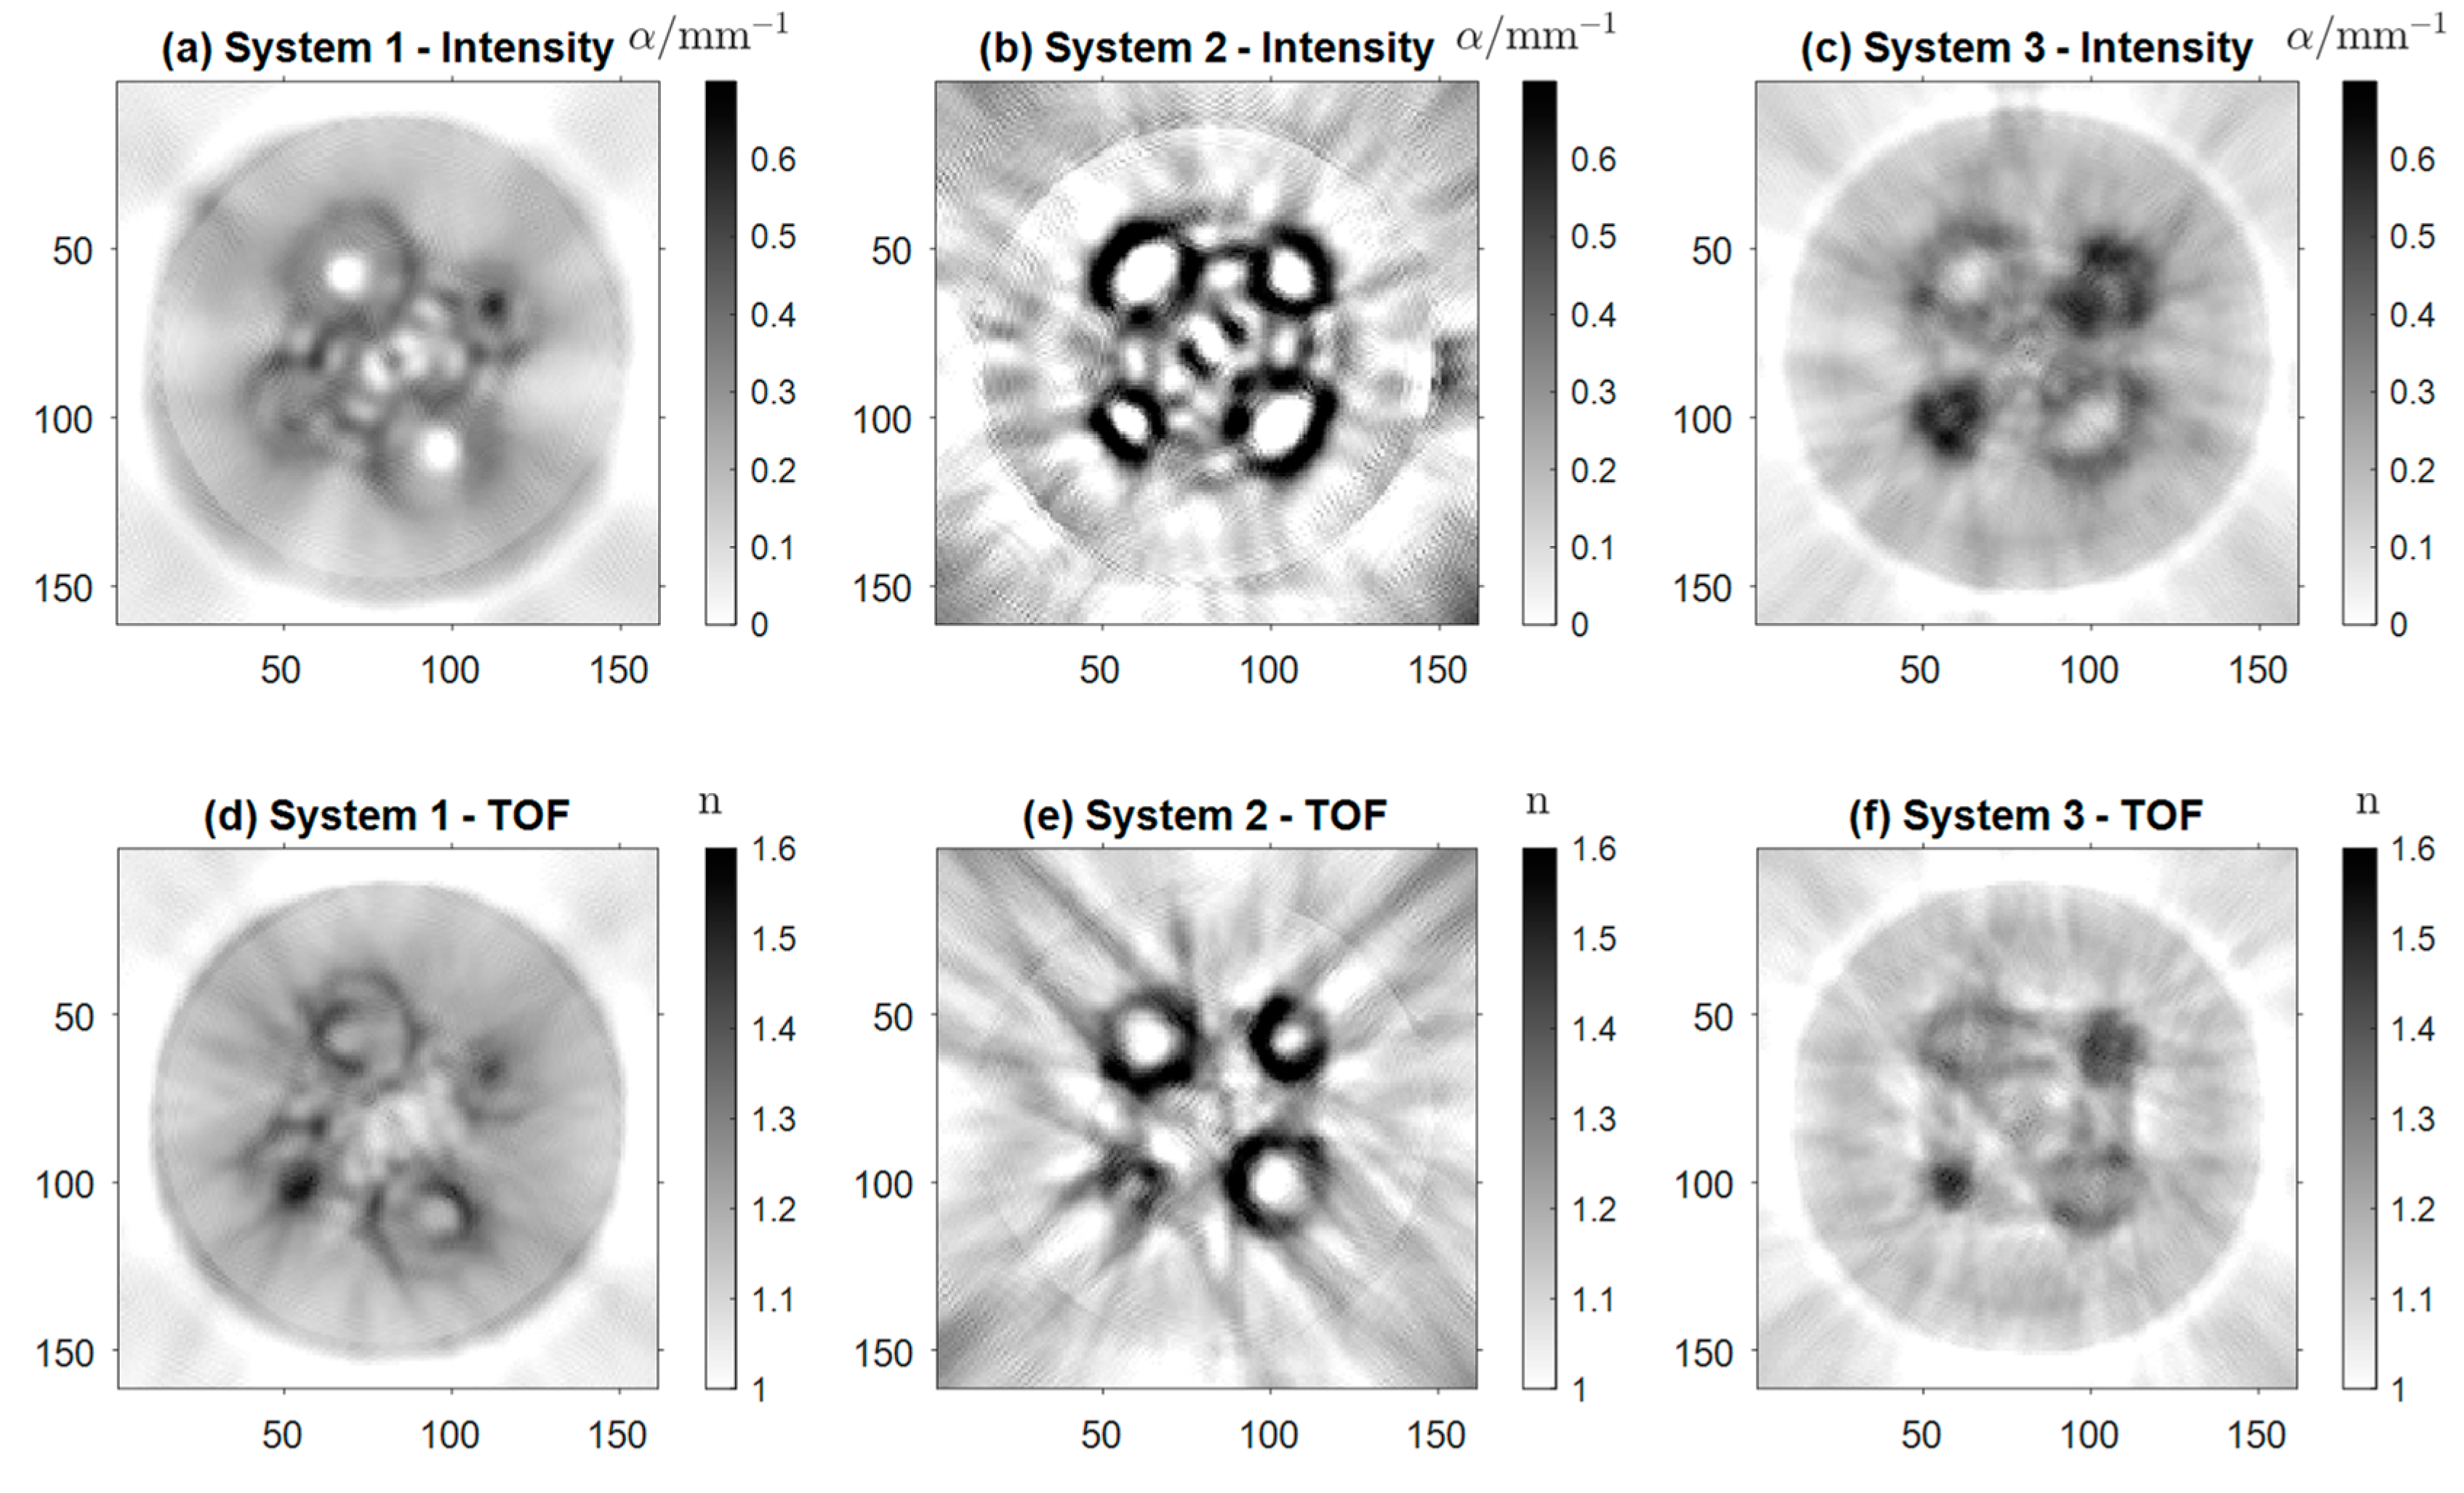
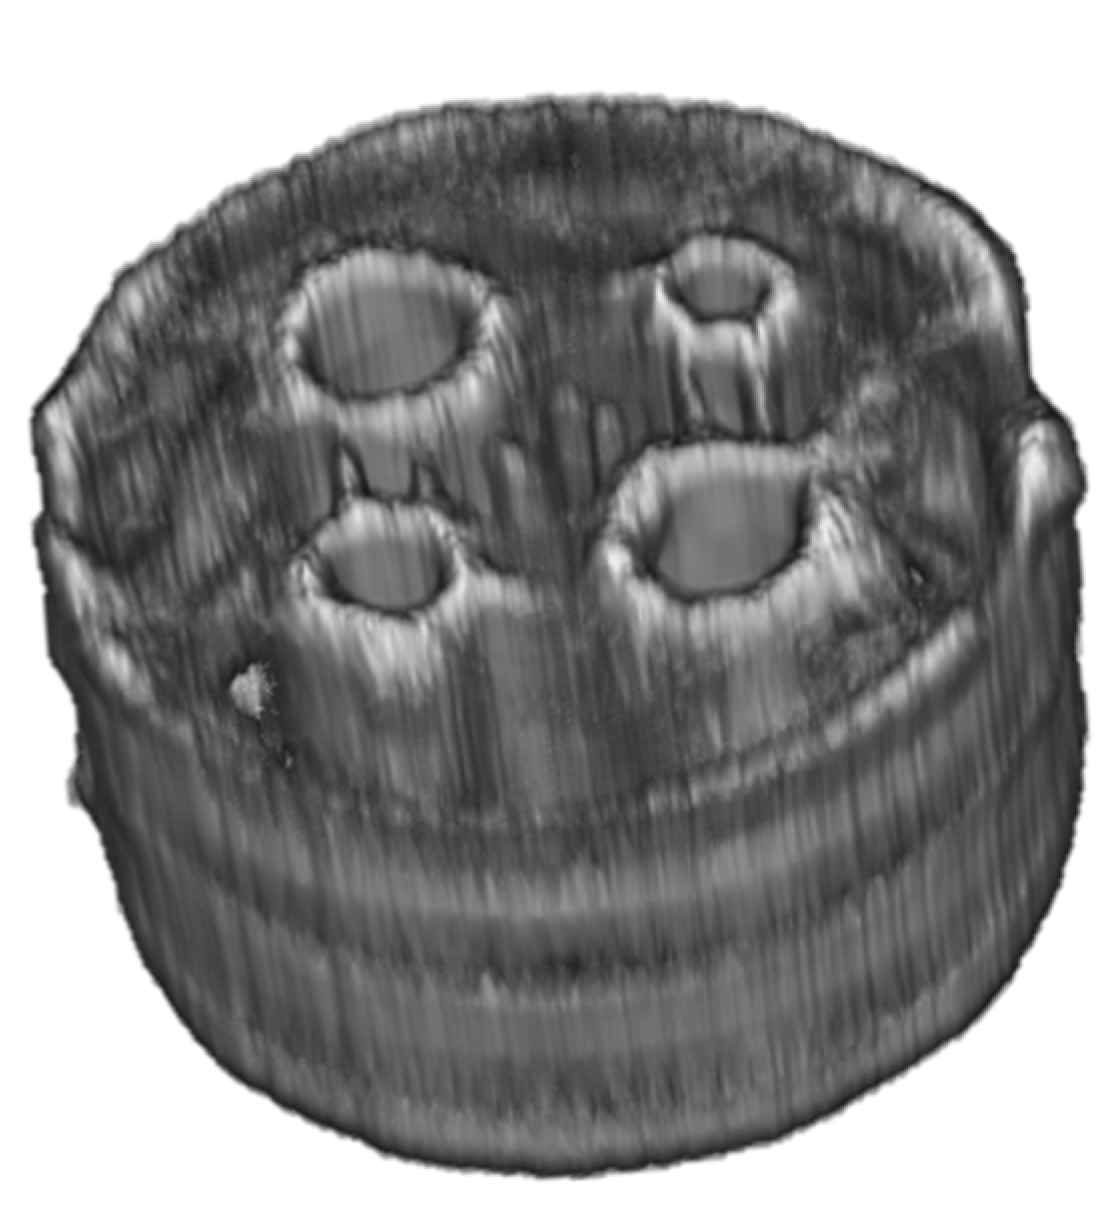
| Sample | Dimension 1 | Dimension 2 | Dimension 3 | Dimension 4 |
|---|---|---|---|---|
| 1 | ||||
| 2 & 3 | ||||
| 4 |
Disclaimer/Publisher’s Note: The statements, opinions and data contained in all publications are solely those of the individual author(s) and contributor(s) and not of MDPI and/or the editor(s). MDPI and/or the editor(s) disclaim responsibility for any injury to people or property resulting from any ideas, methods, instructions or products referred to in the content. |
© 2023 by the authors. Licensee MDPI, Basel, Switzerland. This article is an open access article distributed under the terms and conditions of the Creative Commons Attribution (CC BY) license (http://creativecommons.org/licenses/by/4.0/).


