Preprint
Article

Proposal of a New Framework to Assess the Bitumen Fatigue Cracking Performance of Diverse Types of Asphalt Binders under Different Temperatures and Aging Conditions

Altmetrics

Downloads

93

Views

77

Comments

0

A peer-reviewed article of this preprint also exists.

Submitted:

29 November 2023

Posted:

30 November 2023

You are already at the latest version

Alerts
Abstract
At present, failure definition and damage characteristic curve (DCC) analysis included in the framework to assess bitumen fatigue cracking performance have an inconsistency in ranking bitumen fatigue behaviour. This study utilized two types of self-healing polymers (STP and IPA1w) to modify the neat asphalt (NA), and research four different types of bitumens: NA, STP-modified bitumen, IPA1w-modified bitumen, and styrene-butadiene-styrene modified bitumen (SBSB), to evaluate the above-mentioned framework. All bitumens were subjected to short-term and long-term aging and tested utilizing the Linear amplitude sweep (LAS) test and simplified viscoelastic-continuum-damage (S-VECD) model. The results showed that the SBSB exhibited the highest numbers of loading cycles (in long-term aging analysis) to reach failure points at 25°C, 28°C, and 31°C which were 2290, 2340, and 2510, respectively. However, this bitumen failed to exhibit the best performance in terms of DCC assessment under the same conditions, confirming the above-mentioned inconsistency. Besides, the current failure criterion could not accurately predict bitumen fatigue behaviour under certain test conditions because two R2 values were below 0.1. As a result, this study proposed a new failure definition and failure criterion to overcome these issues. The proposed failure definition agreed with the DCC analysis to rank bitumen fatigue performance, and the proposed failure criterion showed R2 values higher than 0.9. The new framework presented the modified bitumen containing 0.5% of STP as the asphalt binder with the best fatigue cracking performance, according to the selected test conditions.
Keywords: 
Subject: Engineering  -   Civil Engineering

1. Introduction

The introduction should briefly place the study in a broad context and highlight why it is important. It should define the purpose of the work and its significance. The current state of the research field should be carefully reviewed and key publications cited. Please highlight controversial and diverging hypotheses when necessary. Finally, briefly mention the main aim of the work and highlight the principal conclusions. As far as possible, please keep the introduction comprehensible to scientists outside your particular field of research. References should be numbered in order of appearance and indicated by a numeral or numerals in square brackets—e.g., [1] or [2,3], or [4,5,6]. See the end of the document for further details on references.
One of the principal distresses in asphalt mixtures and bituminous pavements is fatigue cracking and this phenomenon is mainly caused by repeated traffic loading [1]. Bitumen fatigue cracking resistance is an important property that has a substantial effect on flexible pavement fatigue performance [2]. Fatigue cracking occurrence in asphalt concrete mostly initiates and proliferates through asphalt binder, hence this fact confirms that bitumen fatigue behaviour is a key property to ensure a superior fatigue performance of asphalt pavement [3,4,5].
Failure definition and failure criterion are essential concepts to assess the fatigue cracking performance of asphalt binders. At present, the Linear Amplitude Sweep (LAS) procedure and Simplified Viscoelastic Continuum Damage (S-VECD) model are utilized to define these two parameters. LAS test is an efficient and quick process which is explained in AASHTO TP 101-14 [6,7] and this procedure has shown high efficiency to illustrate bitumen fatigue behavior [8,9]. After conducting the LAS test, its experimental results should be interpreted by utilizing the S-VECD theory, because this model has proven a high-efficiency processing LAS data, besides to evaluate and predict bitumen fatigue performance [10,11,12]. Afterward, with the application of the S-VECD model, the damage characteristic curve (DCC) can be obtained. This special curve represents the correlation between material integrity (C) (also named pseudo-stiffness and normalized dynamic shear modulus) and damage intensity (S), which is an internal state variable resulting from considering the damage evolution of Schapery’s work potential theory, which formulation is shown in equation 1 [13,14]:
d S d ϑ = W R S α ,
where ϑ and W R are reduced time and pseudo-strain energy, respectively.

1.1. Failure definition of bitumen

The failure definition of bitumen defines its failure occurrence and establishes its fatigue life ( N f ) , which is the number of loading cycles to reach the failure point. This parameter should be meticulously selected considering experimental data, proper theories, scientifically proven frameworks, and analytical parameters [15]. Identifying and predicting the fatigue life (or failure definition) of the bitumen contained in asphalt mixture and pavement constitute a challenge for researchers, as well as to completely understand the fatigue cracking propagation of asphalt binder [16,17]. As a result, numerous studies have been conducted to address this topic.
Hicks et al. [18] and Kim et al. [19] proposed and utilized a simple failure definition for asphalt materials, which consists of a 50% reduction of its stiffness and/or pseudo-stiffness. However, this criterion was disapproved by researchers because it was based on an illogical definition, without scientific confirmation and experimental justification [9]. Bonnetti et al. [20] utilized the dissipated energy ratio (DER) concept and the initial dissipated energy per cycle variable to propose a unified failure definition for the time sweep test in both stress-controlled and strain-controlled modes. Furthermore, this study used styrene-butadiene-styrene (SBS), crumb rubber (CR), and ethylene-vinyl-acetate (EVA) modified bitumens. The proposal identified the bitumen failure point as the number of loading cycles at which the DER deviates 20% from the non-damage straight line in a DER vs number of cycle (N) graph. Researchers arbitrarily chose the 20% deviation and then evaluated its effectiveness. As a result, this percentage lacks scientific and practical foundation. Besides, the time sweep test is a time-consuming procedure [8], which is why the LAS test was developed [21]. Safaei et al. [22] proved that the peak of phase angle (δ) (in δ vs N graph) was not a suitable failure definition for neat asphalt binders (NA) and warm-mix asphalt (WMA) binders, because the trend of this parameter was unclear. Although, this criterion has been commonly used in asphalt mixtures [23,24,25]. Consequently, this research team proposed as a failure definition the peak value of C multiplied by N (peak of C x N) vs N. This proposal was possible because the researchers exhaustively analyzed numerous DCC, δ, and dynamic shear modulus (G*).
Wang et al. [9] comprehensively analyzed δ, shear stress (τ), shear strain, pseudo-strain, and total, stored and released pseudo-strain energy (PSE) to propose a failure definition at the τ x N peak. This research work utilized CR and SBS-modified asphalt binders and NA. The researchers proved that the stored PSE vs N graph exhibits high efficiency in defining the bitumen failure point related to the LAS test. Besides, the researchers confirmed that τ x N peak and maximum stored PSE were equivalent. As a result, the maximum stored PSE could be considered a suitable failure definition for asphalt binder, which includes energy in the failure point finding process [10]. Zhou et al. [26] found that sometimes asphalt binders with higher levels of aging exhibit greater N f values than other unaged bitumens or with lower levels of aging, when analyzing the LAS results, after testing NA and rejuvenated bitumens. Accordingly, this study proposed the fatigue resistance energy index (FREI) to define and analyze the failure occurrence of asphalt binders. Even though this parameter showed acceptable results, it was based on the peak of shear stress, which is not a suitable parameter to identify the failure definition. Cao and Wang [15] identified inadequacies in previously proposed failure definitions: the peak of C x N and the peak of τ x N. This study used NA and SBS-modified bitumens. Researchers found that in some cases long-term and short-term aged bitumens exhibited superior fatigue performance than unaged asphalt binder, which is inconsistent with the real engineering experience. Consequently, the scholars proposed C2 x N x (1-C) peak as a new failure definition, and then the inconsistency was solved.
Zhang et al. [27] identified inconsistencies in bitumen fatigue performance ranking considering the aging conditions and N f . This research work evaluated polyphosphoric acid (PPA) and SBS-modified bitumens and NA. The researchers proposed a new parameter to address this issue: average reduction in integrity (pseudo-stiffness) up to the failure point. This parameter was based on the peak of shear stress to identify the failure occurrence, (which is not convenient), and previous to this study the peak of PSE was defined as a convenient failure definition. Yan et al. [28] proved that the failure definition criteria of 35% reduction of G* x sinδ and the peak of shear stress could not illustrate the real fatigue performance of rubber-SBS modified bitumen, polymer-modified bitumens (PMBs), and NA. In contrast, the peak of stored PSE exhibited high effectiveness in identifying bitumen failure points. These findings should be because dissipated energy approaches provide higher efficiency in defining the bitumen failure stage [9]. Furthermore, the findings in this study conflicted with Zhou et al. [26] and Zhang et al. [27].
Lv et al. [29] found that the peak of stored PSE and the peak of τ x N were efficient in identifying the failure point of long-term aged NA and self-healing polymer-modified bitumens (SPMBs). However, the bitumen with higher N f , in the stored PSE vs N graph, failed to show greater fatigue performance in the C vs S graph. In other words, the asphalt binder that was subjected to a greater number of loading cycles to reach the failure point could not exhibit the DCC with better fatigue performance. The processes to define the N f and DCC for a specific asphalt binder involved different parameters. On the one hand, the former one included stored PSE – N, and N f was identified at the peak of stored PSE. On the other hand, the latter one included C – S and the bitumen with superior fatigue performance showed greater C values regardless of S values. Hence, the agreement between N f and DCC concerning to ranking the asphalt binders in terms of fatigue behaviour can be questionable because those concepts utilize different parameters and procedures in the ranking process. Moreover, this research team proved that the proposed failure definitions at the peak of C2 x N x (1-C) and C x N failed to be useful for all types of asphalt binders because these concepts located the failure point extremely far (at the left side) from the peak of the stored PSE curve, which is not a logical position for the failure stage. One of the main reasons for these findings is that the formula to calculate C values has changed. Previously, C was determined by utilizing τ [9], but recently it was proposed the use of G* [15]. These findings conflict with Cao and Wang [15] and Safaei et al. [22].

1.2. Failure criterion of bitumen

In the case of failure criterion, this concept establishes a relationship between two variables: the first one linked with material response and the second one connected with loading input [15]. A good failure criterion is a tool with high usefulness because can predict the failure occurrence at different conditions from those set in the original model characterization test [30]. Zhang [31] and Zhang et al. [32] proposed the original concept of failure criterion (GR), which was related to asphalt mixture and it was as follows: ‘The stable rate of the released pseudo-strain energy during the fatigue test until the macro-cracking localization within the material’. Afterward, Sabouri and Kim [25] enhanced the GR concept by changing the term “stable rate” to “averaged rate”. Then, Wang et al. [9] applied the new GR concept to characterize the asphalt binder fatigue behaviour. This research team reached the same conclusion as previous studies with asphalt mixtures: there was a unique correlation between GR and N f for each bitumen and this relationship was independent of loading history and temperature. This group of researchers applied the GR concept in bitumens as the average rate of released PSE considering the total released PSE ( W r , s u m R ) as the sum of all released PSE ( W r R ) up to the failure point.
Safaei and Castorena [30] confirmed that temperature in the LAS test should be carefully selected to avoid the bitumen flow effects or adhesion loss. This study utilized PMBs and NA. The researchers ought to choose a temperature that allows the linear dynamic shear modulus of bitumen to fall within the 12-60 MPa range. As a result, the temperature variable was included in the LAS test and S-VECD theory to analyze and predict the asphalt binder fatigue performance. This research work also proved that the GR - N f relationship was independent of temperature and loading history. Safaei et al. [4] utilized PMB and NA to demonstrate that the framework including the LAS test, S-VECD model, and GR was able not only to properly accommodate the bitumen fatigue performance but also to predict the contribution of asphalt binder to asphalt mixture and pavement fatigue performances. This fact proved the efficiency of the mentioned framework in analyzing bitumen fatigue performance. Want et al. [10] discovered that temperature has an influence on DCC and GR fatigue failure criterion after testing CR-SBS, SBS, and terpolymer (TP) modified bitumens, and NA. Hence, researchers proposed the introduction of the time-temperature superposition principle (TTSP) in the bitumen fatigue failure analysis, to eliminate the DCC and GR temperature dependencies. In the process of removing these dependencies, the TTSP shift factor was obtained considering bitumen linear viscoelastic range behaviour. The findings in this study conflicted with the findings from previous studies for instance: [9,30]. Including TTSP in the bitumen fatigue performance framework represented a step forward in this type of analysis. Furthermore, the researchers found inconsistency in the bitumen fatigue performance ranking between the N f defined by the peak of stored PSE and the fatigue behaviour illustrated by DCC.
Cao and Wang [15] proved that under certain conditions although there was a strong relationship between GR and N f , there was a poor correlation between W r , s u m R and N f . This fact can disguise the actual understanding of the GR failure criterion. Consequently, this study proposed a new failure criterion which was a power law function between the sum of stored PSE ( W s u m R ) and a variable defined as Straining Effort (SE). SE identified the required mechanical effort to damage and deform the asphalt binder up to the failure occurrence. Researchers in this study found a robust correlation between W s u m R and SE, but the usefulness of this proposal should be further confirmed with more experimental tests. Wang et al. [33] proposed a new conceptualization of the GR failure criterion to improve the accuracy of bitumen fatigue analysis and prediction. This study used SBS and high viscosity additive (HVA) modified bitumens and NA. The new proposal determined the GR failure criterion, assuming the total released pseudo-strain energy (TRPSE) as the area under the released PSE curve up to the failure point. Besides, a new parameter was introduced in this procedure: averaged released pseudo-strain energy per cycle ( W r R ¯ ). Accordingly, this new concept of GR failure criterion represents an improvement with respect to the previous one and researchers found a strong correlation between GR and N f .
Chen et al. [34] proved that TTSP was not always applicable to DCC, after testing NA and PMB, because the shift factor in some cases was not able to eliminate the temperature effect on the shifted DCC. Consequently, this research team proposed a simplified procedure to determine the coefficients C1 and C2 related to the C-S power law function. Moreover, this new proposal helped to estimate N f at different temperatures, which can be considered an alternative to the GR failure criterion. However, this study defined N f according to the peak of shear stress, which is not convenient and is in conflict with Yan et al. [28]. Lv et al. [29] evaluated the usefulness of previously proposed bitumen failure criteria. For instance: the power law function between W s u m R and SE [15], and GR in both terms of the sum of all released PSE [9] and based on the area under the released PSE curve [33]. The research team concluded that only GR based on the area under the released PSE curve was capable of properly accommodating the bitumen fatigue behaviour. This fact confirmed the superiority of this failure criterion concerning the other two.

1.3. Summary and objectives

In summary, only the peak of stored PSE as failure definition and GR failure criterion based on the area under the released PSE curve were effective to accommodate the bitumen fatigue behaviour. But current failure definition to identify N f and fatigue performance from DCC (C vs S graph) failed to be consistent in ranking a group of bitumens in terms of fatigue behaviour [10,29]. This inadequacy could define a key point in selecting the most convenient asphalt binder for a specific project.
Bitumen fatigue characterization by utilizing the S-VECD model is composed of three elements based on linear viscoelastic (LVE) responses, DCC properties, and failure criterion determination. Hence, the asphalt binder fatigue performance analysis should include these mentioned elements to reach the final conclusion [10]. Consequently, the S-VECD model elements should be consistent in the analysis of bitumen fatigue performance, but at present is hard to always match this requirement with the current framework. From this situation, the need to find a new framework that can observe the previous requirement arises. Moreover, the new framework proposal should be as flexible as possible and be able to accommodate the fatigue behaviour of NA and any type of PMBs. Although the PMB is a case of SPMB because recently this technology has been catching the attention of scholars and researchers [35,36]. According to the previous comments, the objectives of this study are as follows:
  • Propose a new framework to address the ranking inconsistency between the failure definition and DCC analysis.
  • Verify the usefulness of the proposal of a new framework to evaluate bitumen fatigue cracking performance.
  • Test in this study NA and PMBs, including SPMB to test the capability of the proposal to accommodate the performance of any types of asphalt binders.

2. Materials and Methods

2.1. Materials.

2.1.1. Neat asphalt binder (NA)

This research work used the 70# NA from China Petroleum & Chemical Corporation (SINOPEC) Jinling Branch (Jiangsu Province). This NA grade has proved highly efficiency to withstand the traffic loading cycle [37], hence it is expected that this study can be successfully carried out utilizing the selected NA. Table 1 shows the physical properties of NA and the chosen bitumen matches the required values. The standard tests in Table 1 are Chinese specifications mainly based on AASHTO and ASTM specifications.

2.1.2. SBS modified bitumen (SBSB)

SBS can improve the rutting performance, cohesion, adhesion, and elasticity properties of NA [38,39,40]. As a result, SBSB has become the global mainstream of modified bitumen including China [41]. Consequently, this research team decided to incorporate the SBSB in this research work. Table 2 shows the physical properties of the utilized SBSB.

2.1.3. Self-healing elastomers

Self-healing thermoplastic polyurethane

This study is the continuation of previous research work (Lv et al. [29]) where was identified that the peak of stored PSE as failure definition and DCC failed to be consistent to rank the bitumen fatigue performance. The research work of Lv et al. [29] used a self-healing elastomer which was a room-temperature (25 °C) self-reinforcing self-healing thermoplastic polyurethane (STP). Hence, STP was included in this study, and it was received from Nanjing University. This material has some novelties for instance: it has a strain-induced crystallization that guarantees a retarded but reversible self-reinforcing effect [42], and also it promotes self-healing behaviour without extra stimulus (microwave and heat), which is a convenient property for road surfaces. Table 3 shows the physical properties of STP. For more information about STP, for example, its synthesis procedure and the materials used in this process, it is possible to consult Li et al. [42] and Lv et al. [29].

Self-healing IPA1w (IPA1w)

This research team included a 2nd self-healing elastomer in this study, to comprehensibly evaluate the capacity of the current framework to properly accommodate the fatigue performance of any type of PMB, although it is a case of SPMB. IPA1w was received from Nanjing University, and it is a polymer in the designing stage. Besides, IPA1w is a room-temperature (25 °C) self-healing polymer, which stimulates the self-healing activity without extra stimulus (microwave and heat) and this behaviour could be suitable for road surfaces.
Material components used in the synthesis of IPA1w: Bis(3-aminopropyl) terminated PDMS (Mn = 10000 g mol-1, noted as A1w) was purchased from Gelest. Isophorone diisocyanate (IPDI) was obtained from Sigma-Aldrich. Tetrahydrofuran (THF) was distilled for further use.
Synthesis of IPA1w: A1w (4.00 g, 0.4 mmol) was dissolved in redistilled THF (100 mL) and was continuously stirred in the ice bath for 30 min. Then, the solution of IPDI (91.13 mg, 0.41 mmol) in 30 ml THF was slowly added into the mixture using a constant pressure funnel. The reaction mixture was stirred under a N2 atmosphere for 24 h at room temperature and then concentrated into sticky mucus. The product was purified through repeated dissolution-precipitation-decantation procedures. Finally, the concentrated solution was decanted into the customized polytetrafluoroethylene molds and dried at 85 °C for 24 hours. The resulting transparent IPA1w polymer film was then peeled off for further testing.
Table 4 shows the physical properties of IPA1w. For more detailed information about IPA1w, it is possible to consult Wang et al. [43].

2.2. Methods

2.2.1. Preparation of STP modified bitumen (STPB)

This study represents a continuation of the research work in Lv et al. [29], as a result, the mixing conditions and procedure in this study were followed to obtain the STPBs. Moreover, 0.5, 1.0, and 1.5 wt% of STP were the amount of polymer added into the NA to obtain the STPB0.5, STPB1.0, and STPB1.5, respectively. These percentages of STP were selected according to the experience from the previous study by Lv et al. [29].

2.2.2. Preparation of IPA1w modified bitumen (IPAB)

After numerous trial and error tests in the laboratory, this research team decided that the mixing conditions and procedure used to mix STP and NA must be the same for mixing IPA1w and NA. Besides, 0.5, 1.0, and 1.5 were the amount of polymer added into the NA to obtain IPAB0.5, IPAB1.0, and IPAB1.5, respectively. These percentages of IPA1w were selected according to the experience of Yang et al. [44] and also considering the percentages of STP.

2.2.3. Aging procedure.

The Rolling Thin Film Oven (RTFO) test described in the AASHTO T240 and the Pressurized Aging Vessel (PAV) test explained in the AASHTO R28-12 were utilized to conduct the short-term and long-term aging procedures, respectively. NA, SBSB, STPB0.5, STPB1.0, STPB1.5, IPAB0.5, IPAB1.0, and IPAB1.5 were subjected to short-term and long-term aging procedures. Then, the unaged, RTFO-aged, and PAV-aged specimens of the bitumens in this study were tested according to the LAS test.

2.2.4. Performance Grade (PG) characterization.

Flash point temperature test (AASHTO T48-06) and rotational viscosity test (AASHTO T316) were conducted on unaged asphalt binders. Rutting index (AASHTO T315-20) was obtained on unaged and RTFO-aged bitumens. Fatigue cracking index (AASHTO T315-20) and bending beam rheometer test (AASHTO T313-12) were carried out on RTFO + PAV aged bitumens. These experiments were undertaken to determine the PG of NA, SBSB, STPB0.5, STPB1.0, STPB1.5, IPAB0.5, IPAB1.0, and IPAB1.5. The AASHTO M320-10 was used to define the PG of all mentioned bitumens. The obtained PGs are as follows: NA (PG 64 – 16), SBSB (PG 76 – 22), STPB0.5 (PG 64 – 22), STPB1.0 (PG 64 – 22), STPB1.5 (PG 64 – 16), IPAB0.5 (PG 64 – 22), IPAB1.0 (PG 64 – 16), and IPAB1.5 (PG 64 – 10).

2.2.5. LAS test

LAS test is composed of frequency sweep test and continuous LAS test. The former test was conducted at a frequency range of 0.1rad/s – 100 rad/s and a stain level equal to 0.1%, at different temperatures (T) (20 °C, 25 °C, 30 °C, 35 °C, 40 °C), to determine the master curve and the damage evolution rate “α”. The latter test was carried out at a frequency of 10 Hz and linear strain amplitude ramping from 0.1% to 30%, for 3100 cycles. For more details about these tests, it is possible to consult Lv et al. [29]. All bitumens in this study at different aging stages (unaged [U], RTFO aged [R], and RTFO + PAV aged [RP]) were subjected to the above-mentioned tests. In this study, the cyclic strain rate (CSR) ranged from 0.006 to 0.030. CSR represents the quotient between the highest strain (always 30%) and the number of cycles, for instance: the standard CSR is 30% / 3100 ≈ 0.010 %/cycle. The temperature to carry out the continuous LAS test was set as follows: determine the average of low and high PG temperatures of each asphalt binder and then add 4 °C [45]. As a result, the temperature was set to be 25 °C, 28 °C, and 31 °C. Table 5 and Table 6 show the fatigue test matrix, including CSRs and test temperatures associated with the “validation of failure definition” (VFD) and “validation of failure criterion” (VFC), respectively. Those conditions were decided according to previous studies [9,15] and previous experience of this research team [29].

2.2.6. S-VECD

The S-VECD model was used to process the LAS test results. This model effectively determines the C and S values, and the relationship between these two parameters related to each asphalt binder is independently correlated to loading history. As a result, it is possible to determine numerous bitumen fatigue responses at any decided conditions with few experimental data [9,30,46]. The DCC can be built by utilizing the S-VECD and this special curve represents the correlation between C and S (see Equation 2) [9]. In this study, C and ΔS (damage increment) were determined using equations 3 and 4, respectively [15].
C = 1 C 1 ( S C 2 ) ,
C = G * G * L V E D M R ,
S i = 1 2 D M R γ i R 2 C i 1 C i α 1 + α Q     w i t h   Q s i n ω r ϑ 2 α d ϑ 1 1 + α ,
Where C 1 and C 2 are regression constants in Equation 2. In the case of Equation 3, G * , G * L V E , D M R represent dynamic shear modulus (damaged), undamaged dynamic shear modulus (linear viscoelastic range), and dynamic modulus ratio, respectively. Moreover, γ i R , ω r , ϑ , and i -th in Equation 4 correspond to pseudo-strain amplitude, reduced angular frequency, reduced time, and the cycle of interest, respectively. Equations 5 and 6 illustrate how to determine W R (stored PSE) and γ i R , respectively [15].
W R = 1 2 D M R C S γ R 2 ,
γ i R ϑ = γ i G * L V E s i n ω r ϑ ,
Where γ i represents the shear strain amplitude in Equation 6.
The peak of the stored PSE was the failure definition used in this study to evaluate bitumen fatigue performance according to the proposal of Wang et al. [9] and the previous experience of this research team Lv et al. [29], see Figure 1.
Moreover, the failure criterion which introduced the average rate of released PSE, based on the total released PSE (TRPSE) in terms of the area under the released PSE curve up to the failure point (see Figure 1) was used in this study according to the proposal from Wang et al. [33] and previous experience of this research team Lv et al. [29]. The equations are as follows:
G R = β N f ,
W r R = 1 2 D M R 1 C i γ i R 2 ,
G R = W r R ¯ N f = T R P S E / N f N f = T R P S E N f 2 ,
Where β and are regression constants (in Equation 7). For more detailed information about the failure definition and failure criterion in this study, it is possible to consult Lv et al. [29].

2.2.7. Proposal of new framework to determine failure definition and criterion

As mentioned before, the current failure definition (peak of stored PSE) to identify N f and DCC failed to be consistent in ranking a group of bitumens in terms of fatigue behaviour [10,29]. Bitumen fatigue characterization by utilizing the S-VECD model is composed of three elements based on linear viscoelastic (LVE) responses, DCC properties, and failure criterion determination. As a result, the final conclusion on bitumen fatigue performance must include all these elements and not only two of them [10]. Accordingly, this research team proposes the following framework.
Theoretical framework:
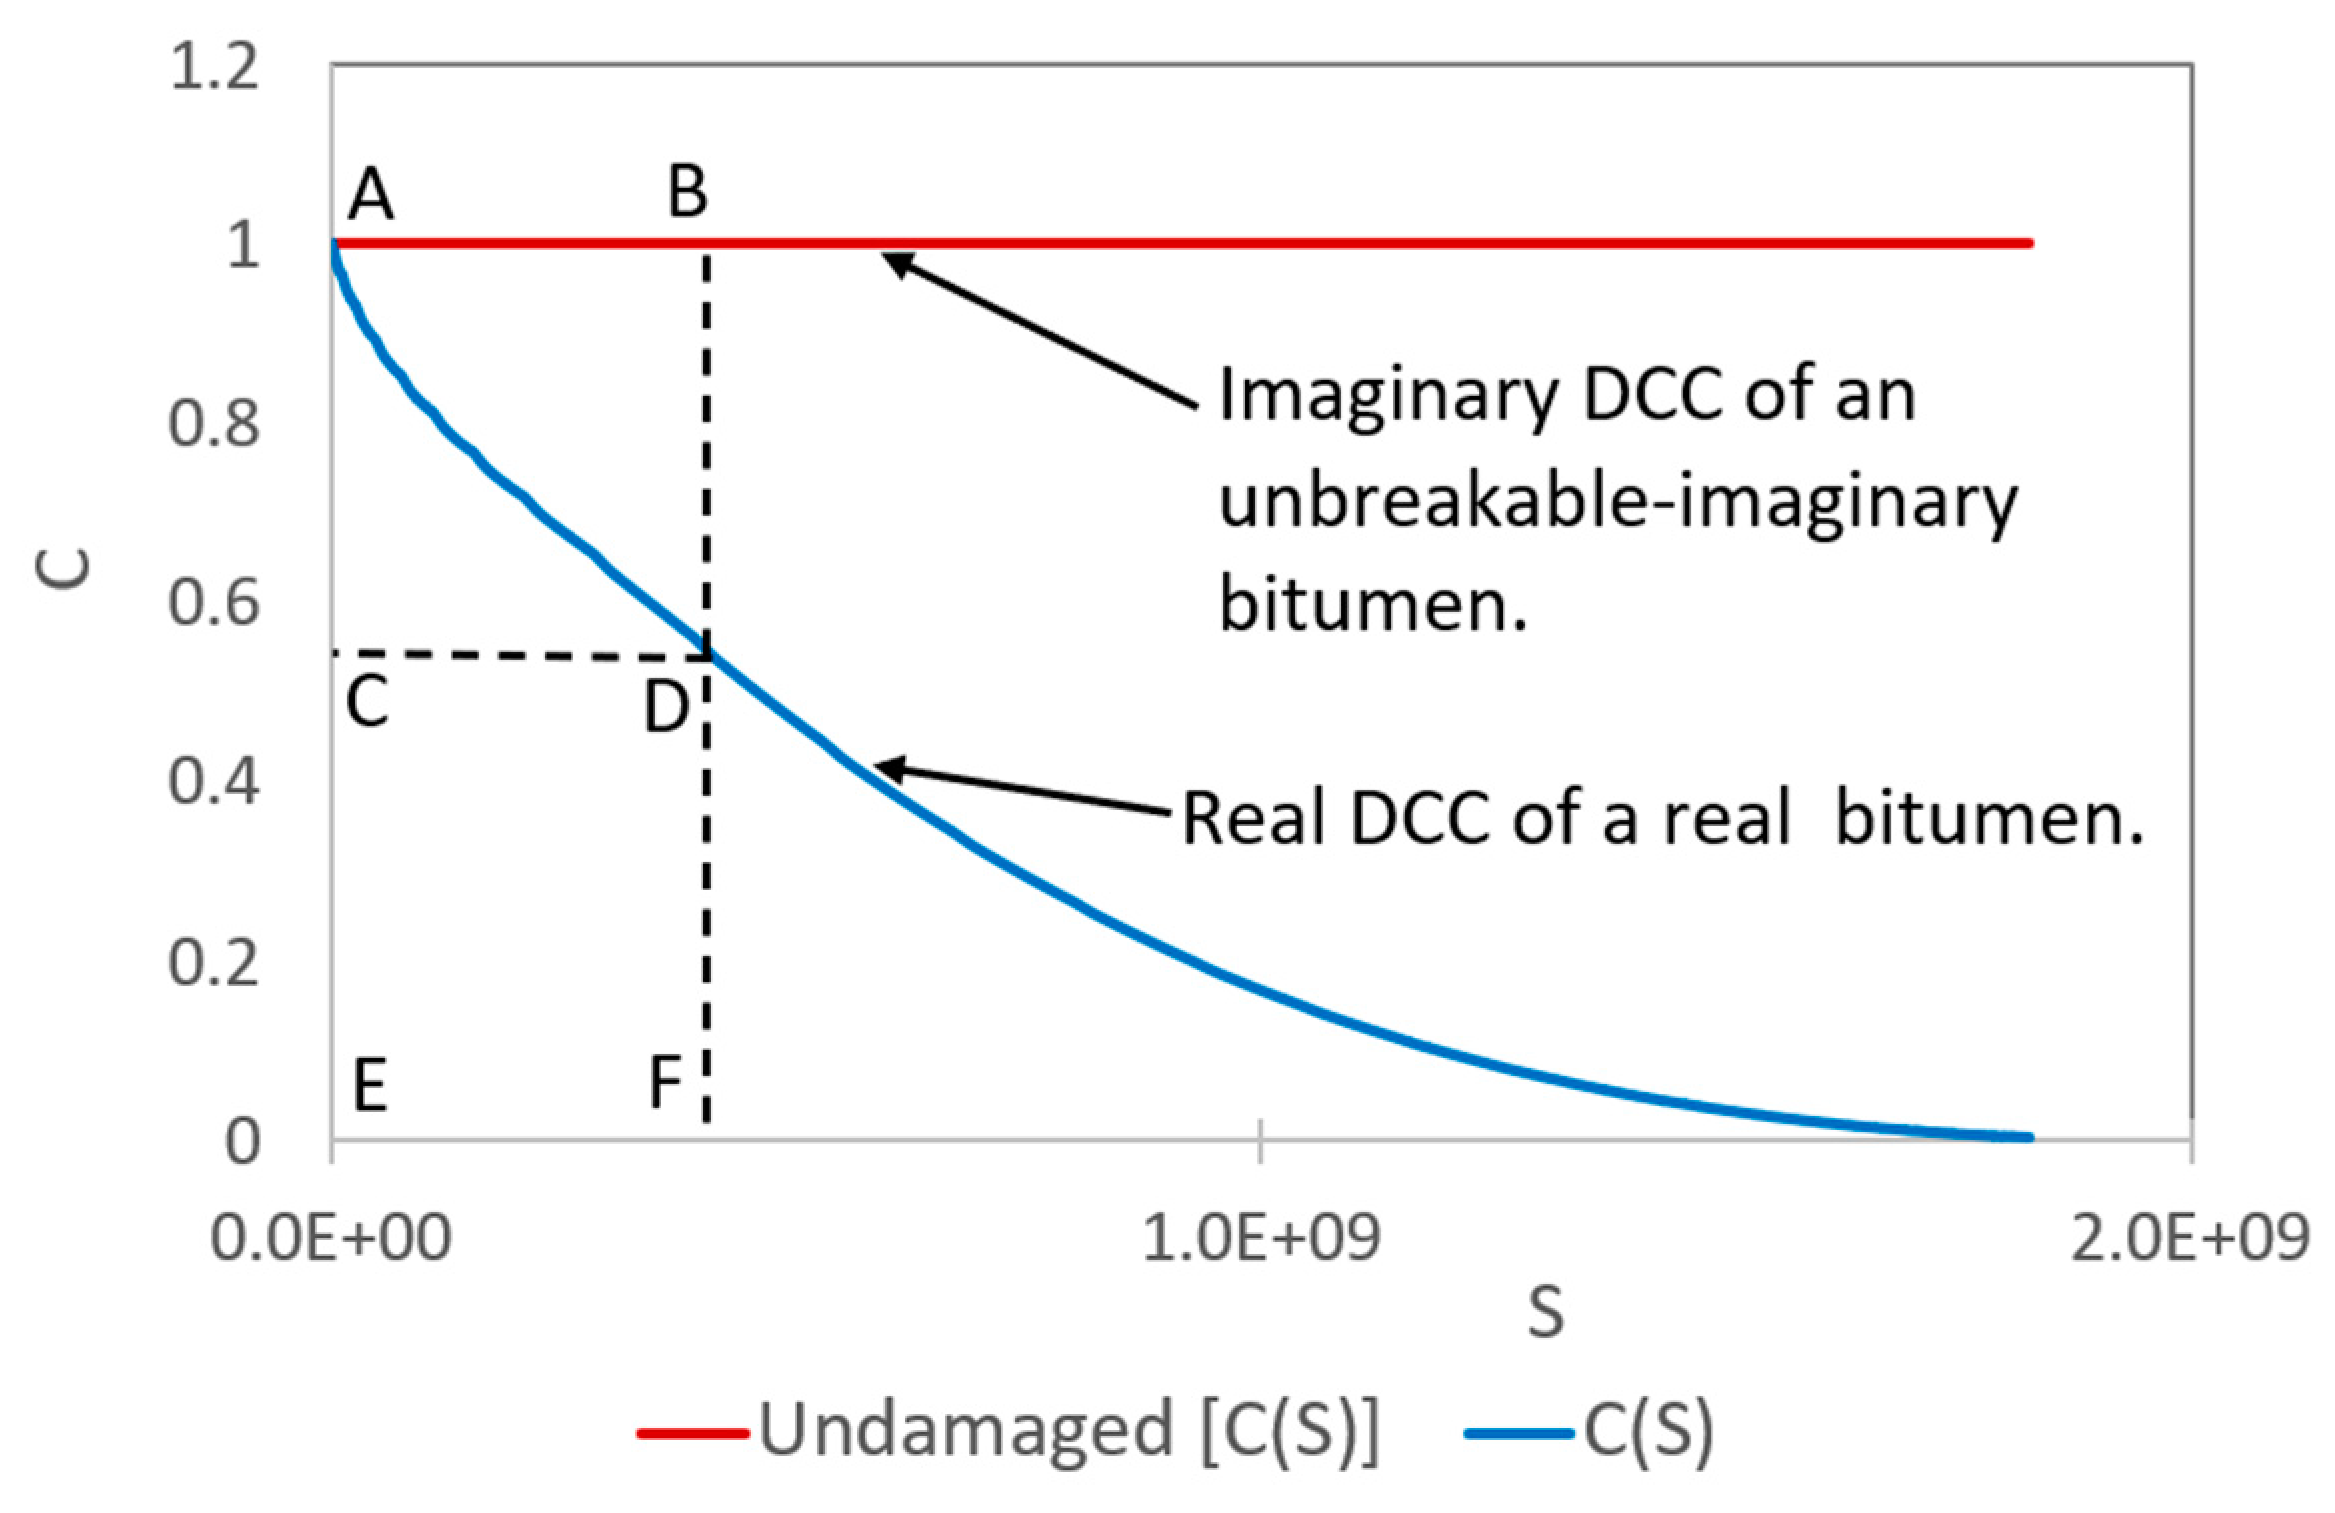
Total potential cohesion (TPC): It is a parameter that measures bitumen imaginary strength capacity at each loading cycle to maintain its C values equal to 1 when conducting the continue LAS test, although damage has occurred. It is an imaginary rectangular area which is defined by A, B, F, and E in Figure. 2, and it can be obtained from any bitumen to represent its imaginary fatigue stage at any loading cycle. The AB side of the imaginary rectangular area represents a segment of the imaginary damage characteristic curve (I-DCC), which is obtained when the asphalt binder is subjected to the continue LAS test, keeping C values equal to 1, even if damage has occurred. The TPC can be determined in each loading cycle, and the Equation is as follows:
T P C i = S i C 0   w h e r e   C 0 = 1 ,
Where T P C i , S i , and C 0 are the total potential cohesion at the i -th cycle, the S value at the i -th cycle, and the constant material integrity equal to 1, respectively.
Stored potential cohesion (SPC): It is a parameter that measures bitumen strength capacity at each loading cycle to maintain its C values as high as possible when conducting the continue LAS test, although damage has occurred. It is the rectangular area that is defined by C, D, F, and E in Figure 2, and it can be obtained from any bitumen to represent its fatigue stage at any loading cycle. The SPC is determined by the product of C value (ordinate axis) and S value (abscissa axis) linked with any loading cycle on the real DCC (DCC), which represents the real fatigue performance of the asphalt binder, and its equation is as follows:
S P C i = S i C i ,
Where S P C i and C i are stored potential cohesion and C value at the i -th cycle, respectively.
Released potential cohesion (RPC): It is a parameter that measures the dissipated bitumen strength capacity at each loading cycle to maintain C values as high as possible when conducting the continue LAS test. It is the rectangular area that is defined by A, B, D, and C in Figure 2, and it can be obtained from any bitumen. RPC equation is as follows:
R P C i = T P C i S P C i ,
Where R P C i is the released potential cohesion at the i -th cycle.
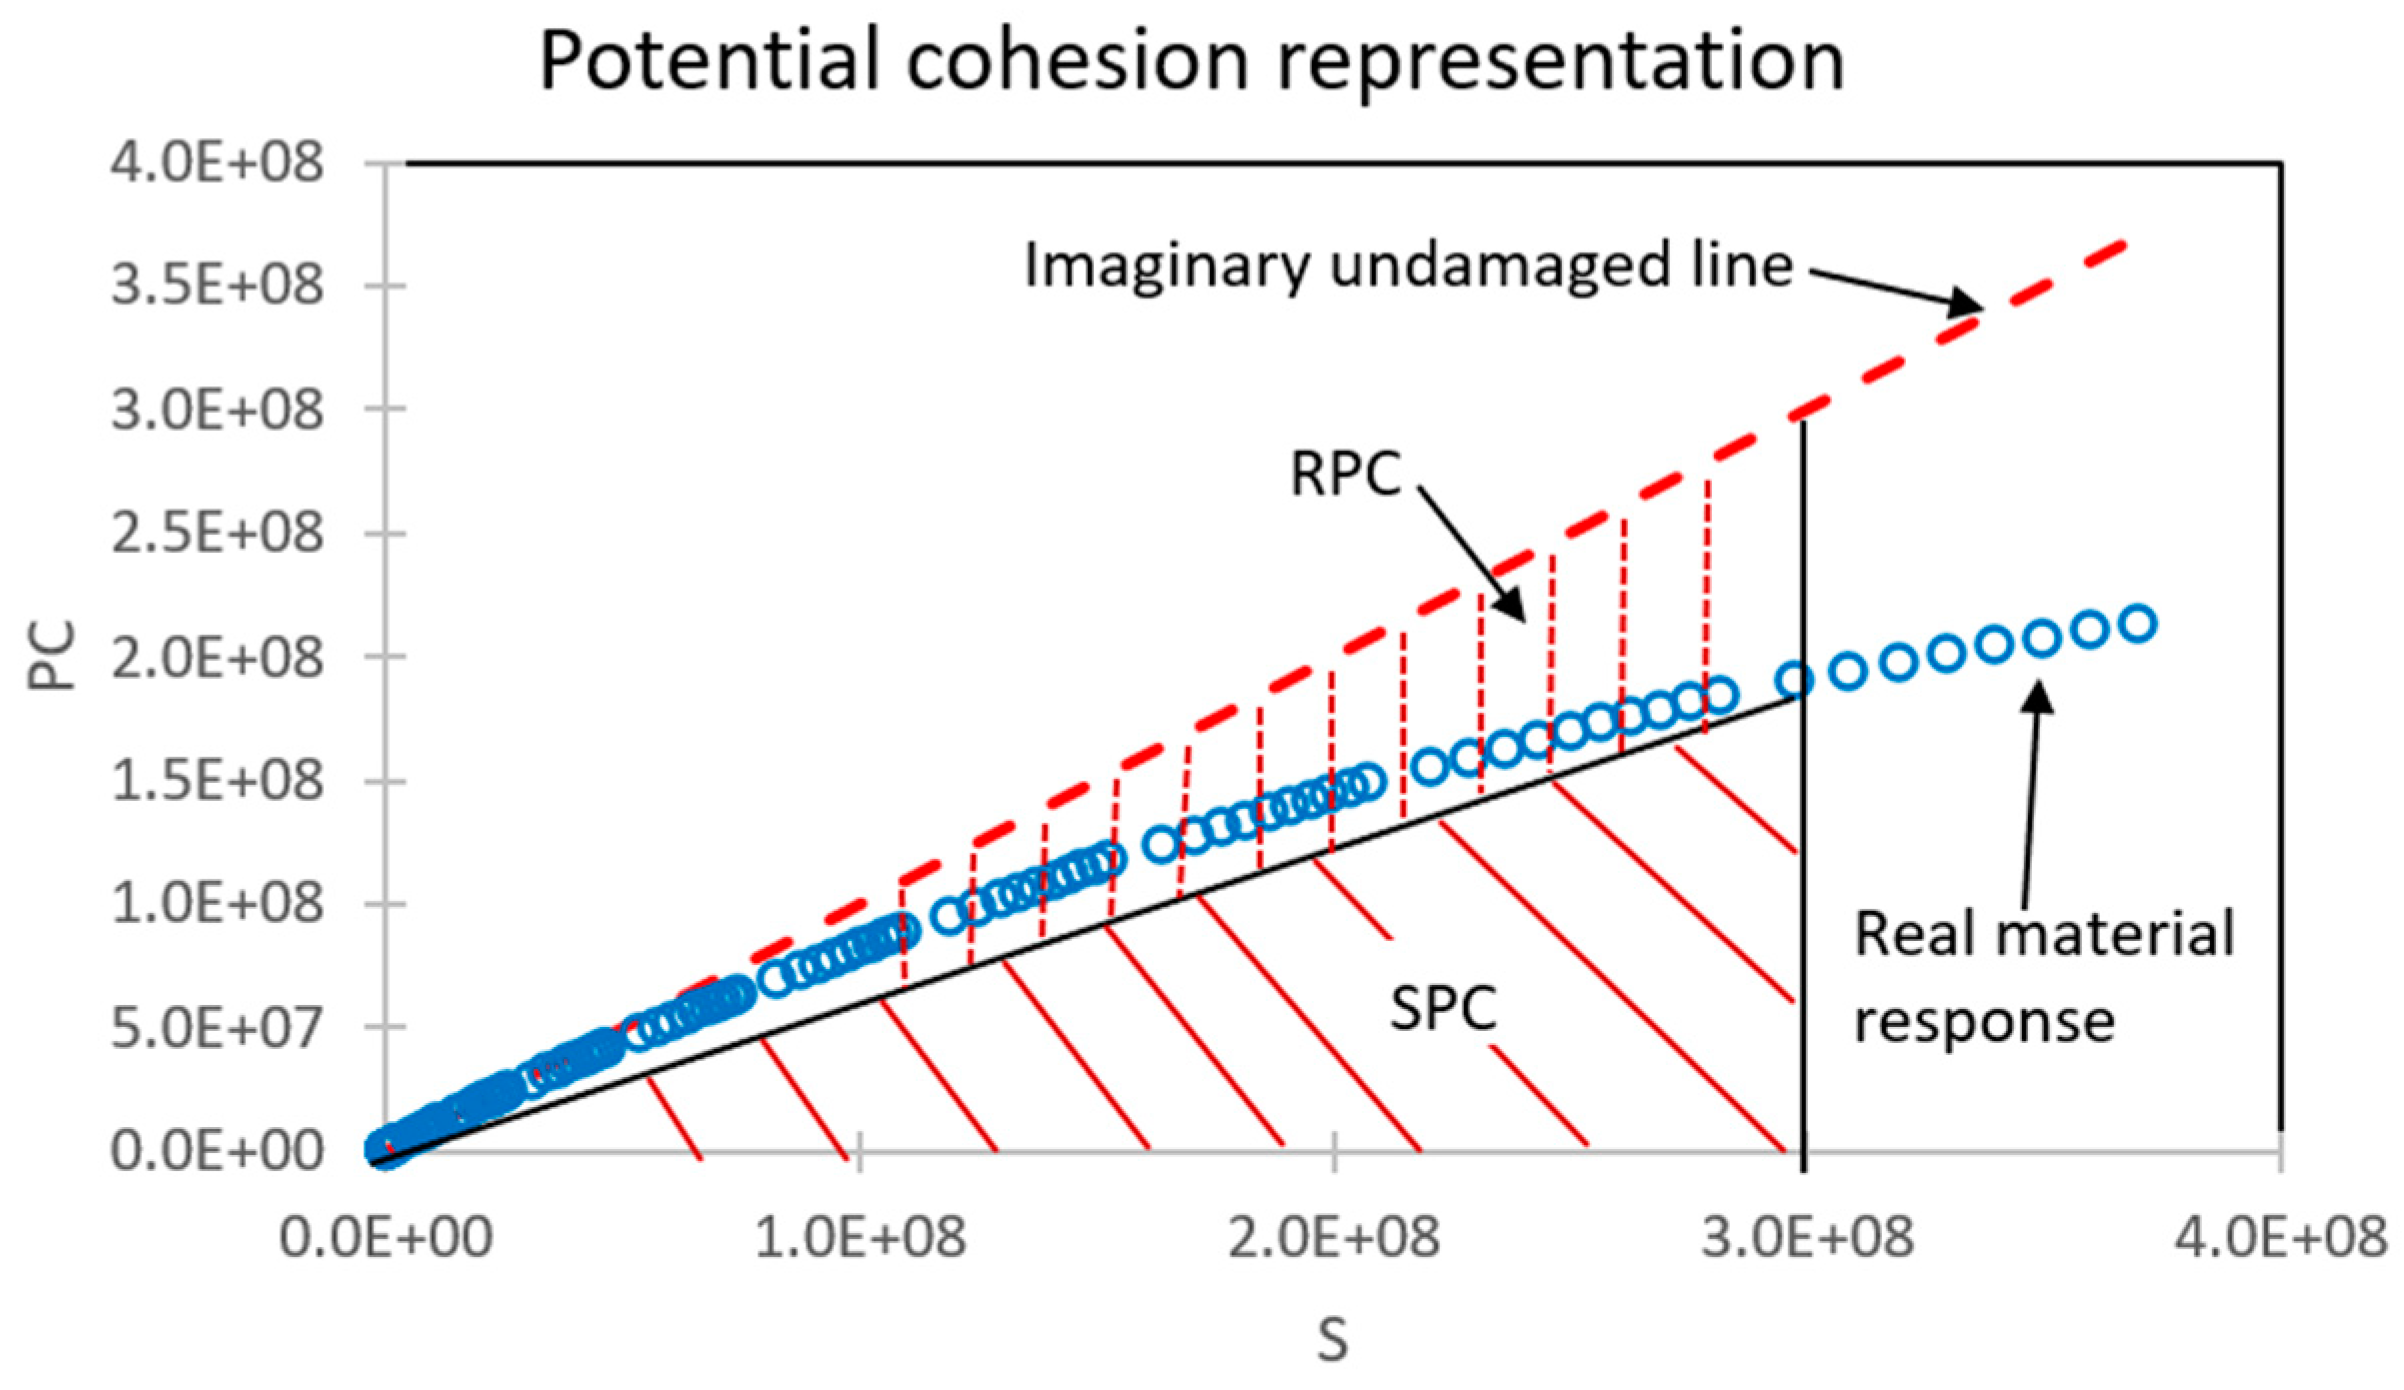
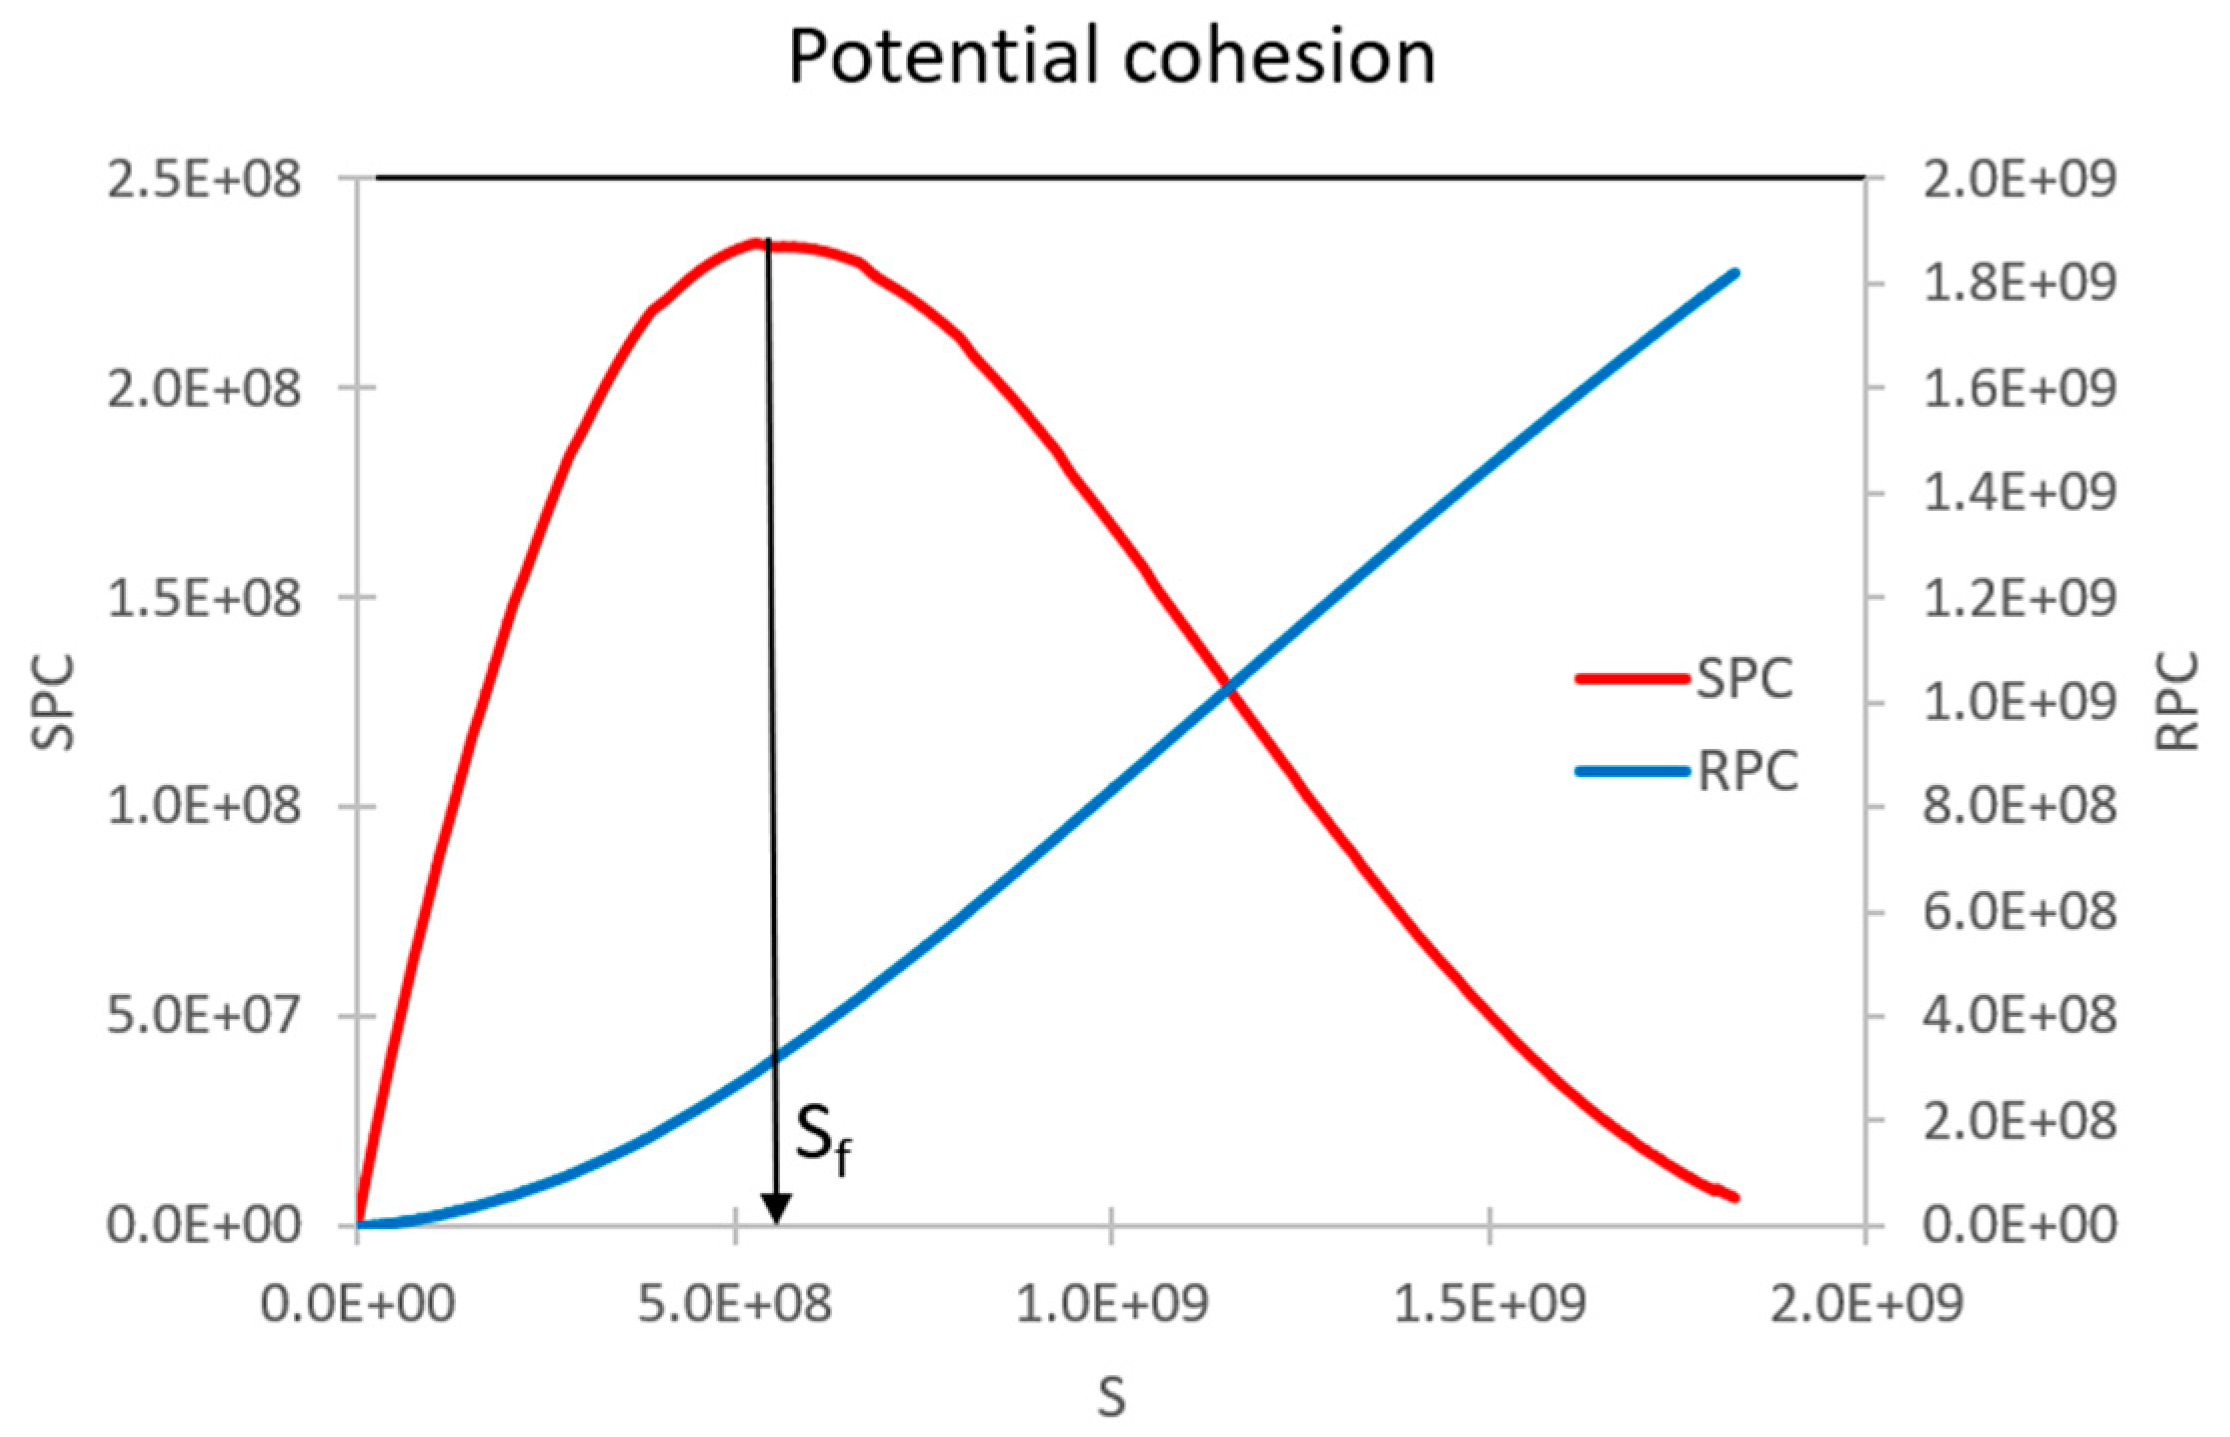
Figure 3 illustrates the potential cohesion (PC) and the damage evolution in the continue LAS test. The imaginary undamaged line represents the imaginary material response if its integrity is equal to 1 although the damage increases and the area below this line shows the sum of each TPC related to each loading cycle. The real material response deviates from the imaginary undamaged line. The area below the real material response represents the sum of each SPC linked with each loading cycle and the area between the real material response and the imaginary undamaged line shows the sum of each RPC associated with each loading cycle. Figure 4 depicts the SPC and RPC graphs. When the SPC increases indicates that bitumen still has the strength capacity to store additional damage when conducting the continue LAS test (loading amplitude/energy input increases). However, if SPC decreases means that the asphalt binder is no longer able to store additional damage in the continue LAS test, hence the bitumen failure has occurred. As a result, the peak of SPC is proposed as a failure definition and S f defines the damage intensity at which the failure occurs. Furthermore, greater SPC values represent superior fatigue performance at the selected loading cycle. The RPC continuously increases from the beginning of the test (material loses strength capacity from the starting point).
The average rate of released potential cohesion during the continue LAS test up to the macro-cracking localization within the material is defined as CR and its equation is as follows:
C R = C R P S f 2 ,
Where C R P is the sum of all RPC values up to the failure point defined by S f and its equation is as follows:
C R P = i = 1 S f R P C i ,
Accordingly, this research team proposes as failure criterion the following relationship:
C R = k * S f d ,
This research team proposes the following concept: cohesion work (CW). This parameter shows a general assessment of bitumen fatigue performance up to the point where the CW is obtained. The CW can be calculated as the area below the DCC (CWDCC) or as the area below the SPC curve (CWSPC). CWDCC and CWSPC can be determined before, after, and at the failure point of any bitumen. The Equation related to both parameters are as follows:
C W D C C = 0 S m 1 C 1 S C 2 + C 3 ,
C W S P C = 0 S m a S 3 + b S 2 + c S + d ,
Where C 1 , C 2 , C 3 , a , b , c , and d are regression coefficients and S m is the damage intensity at the point at which the calculation will be conducted. Higher values of CWDCC and CWSPC mean superior fatigue performance in terms of DCC and SPC curve assessment to withstand the damage intensity.
The equation 16 was selected according to the previous experience in the research work Lv et al. [29], to obtain a superior fitting with the DCC. Equation 17 was selected after numerous trial and error tests. To obtain fitting equation than can precisely accommodate the DCC SPC curve is convenient to obtain high quality results. This research team used the “solver” option in excel.

3. Results

3.1. Failure definition evaluation

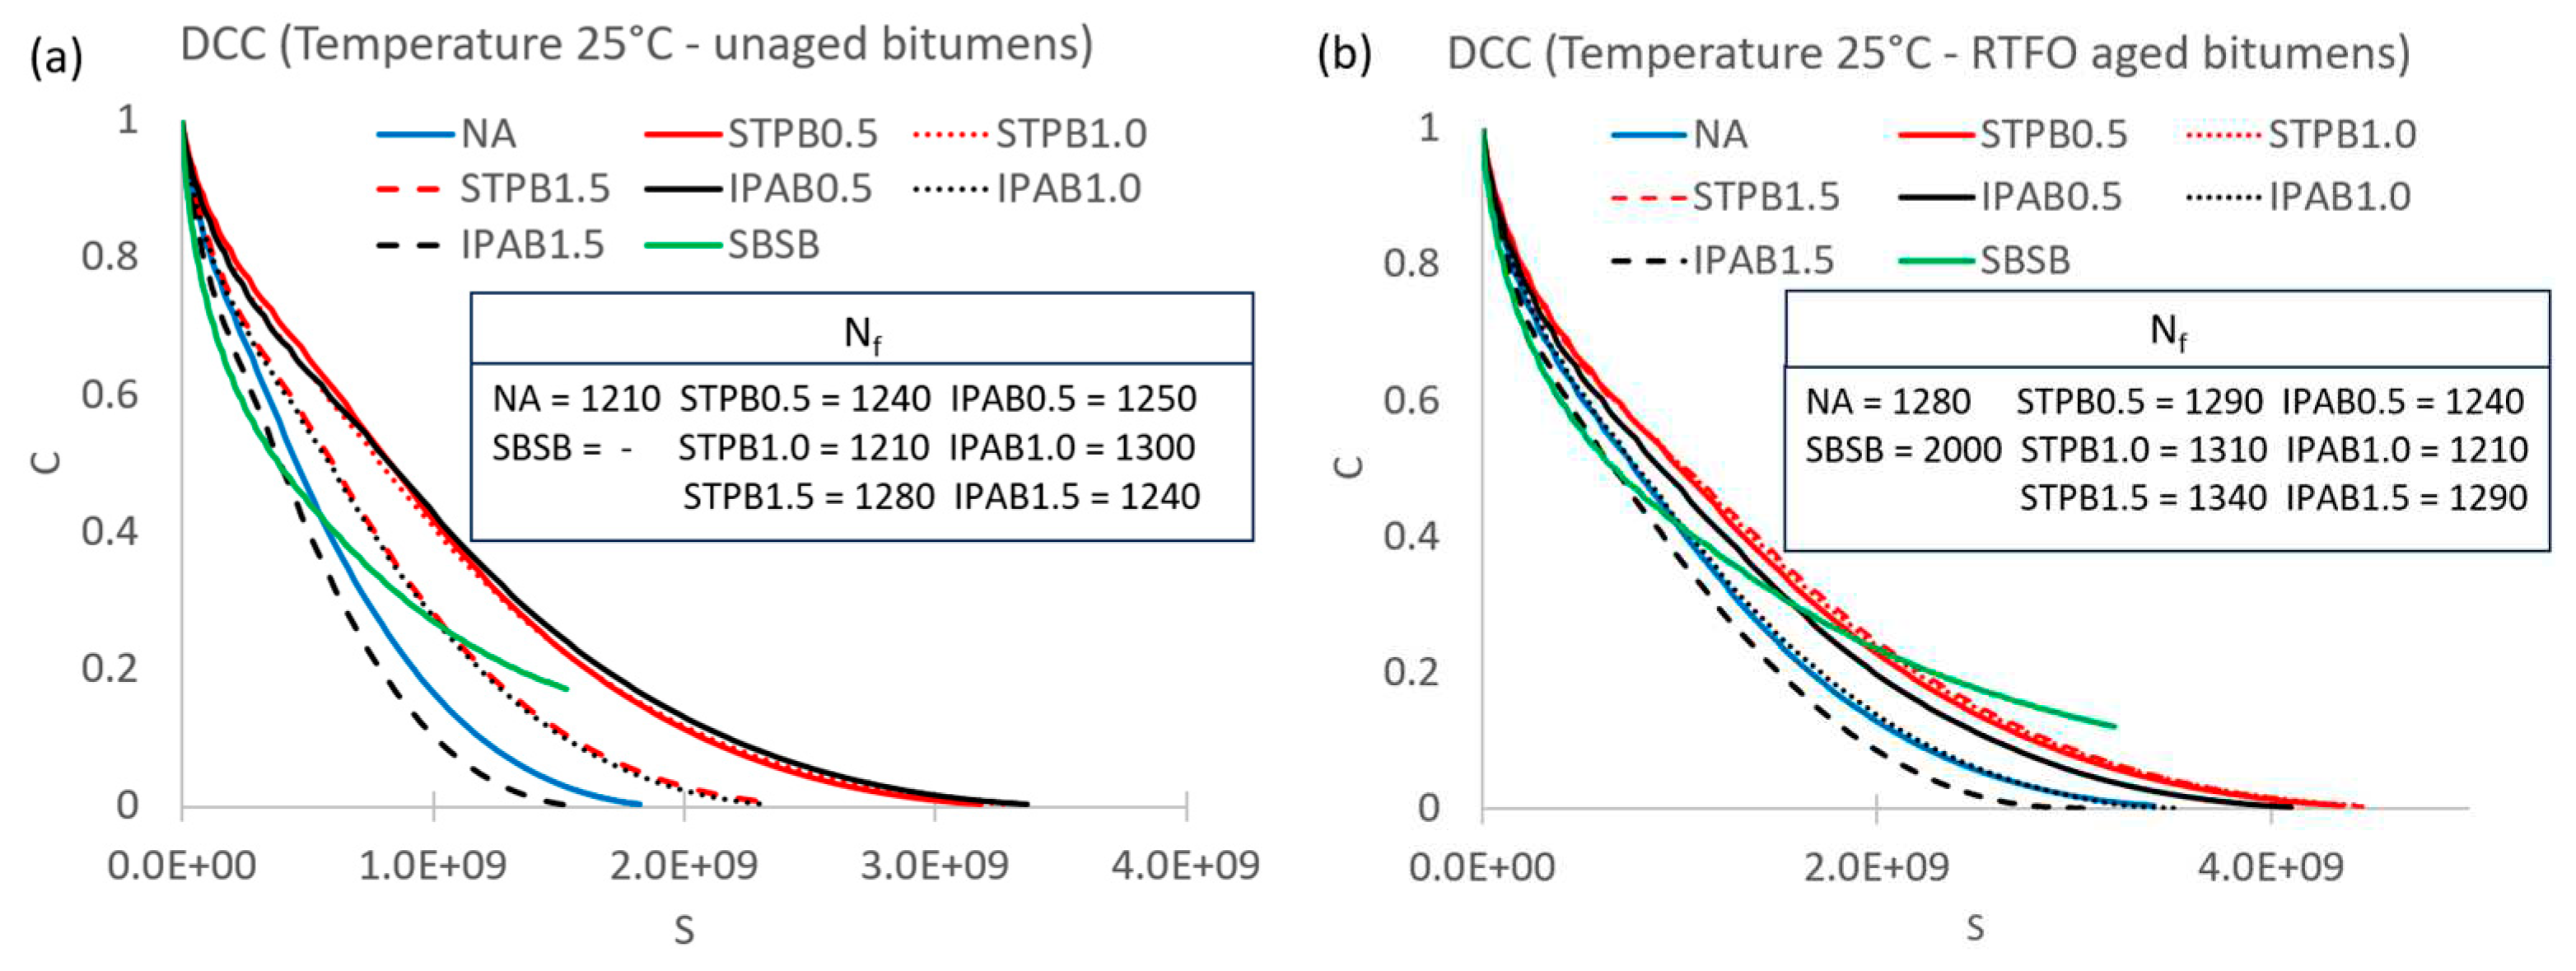
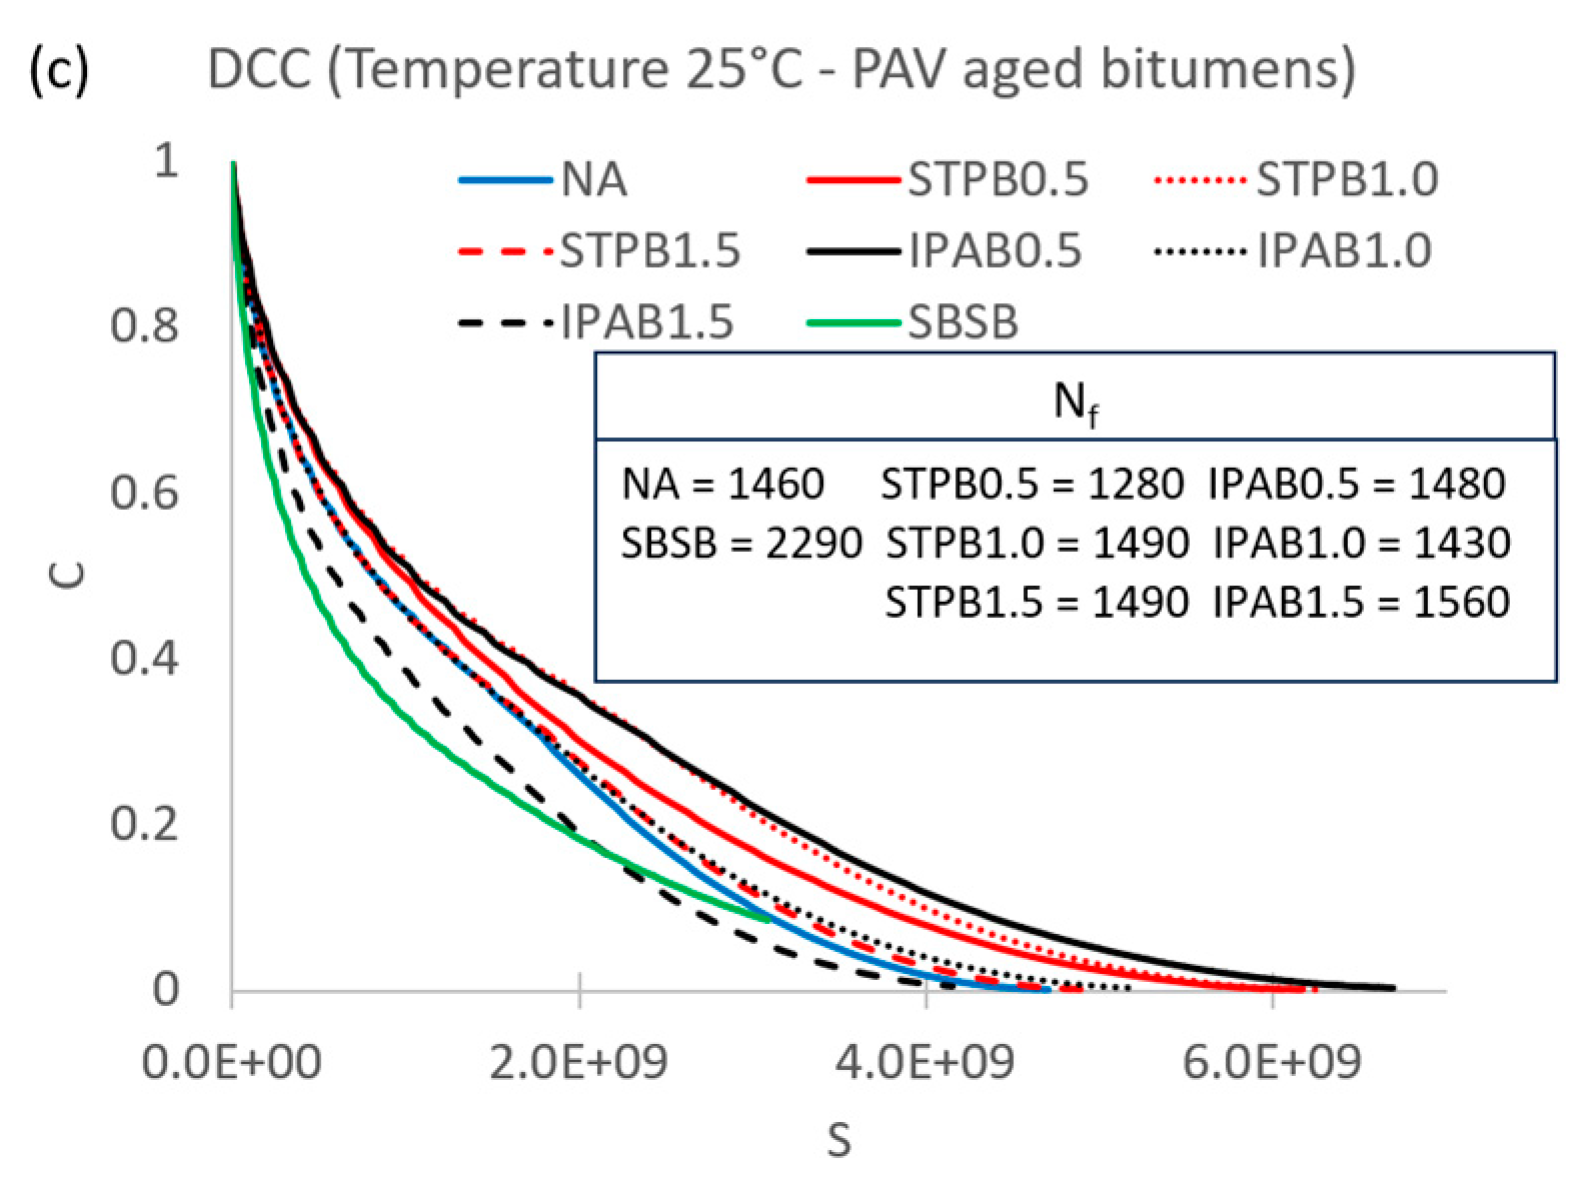
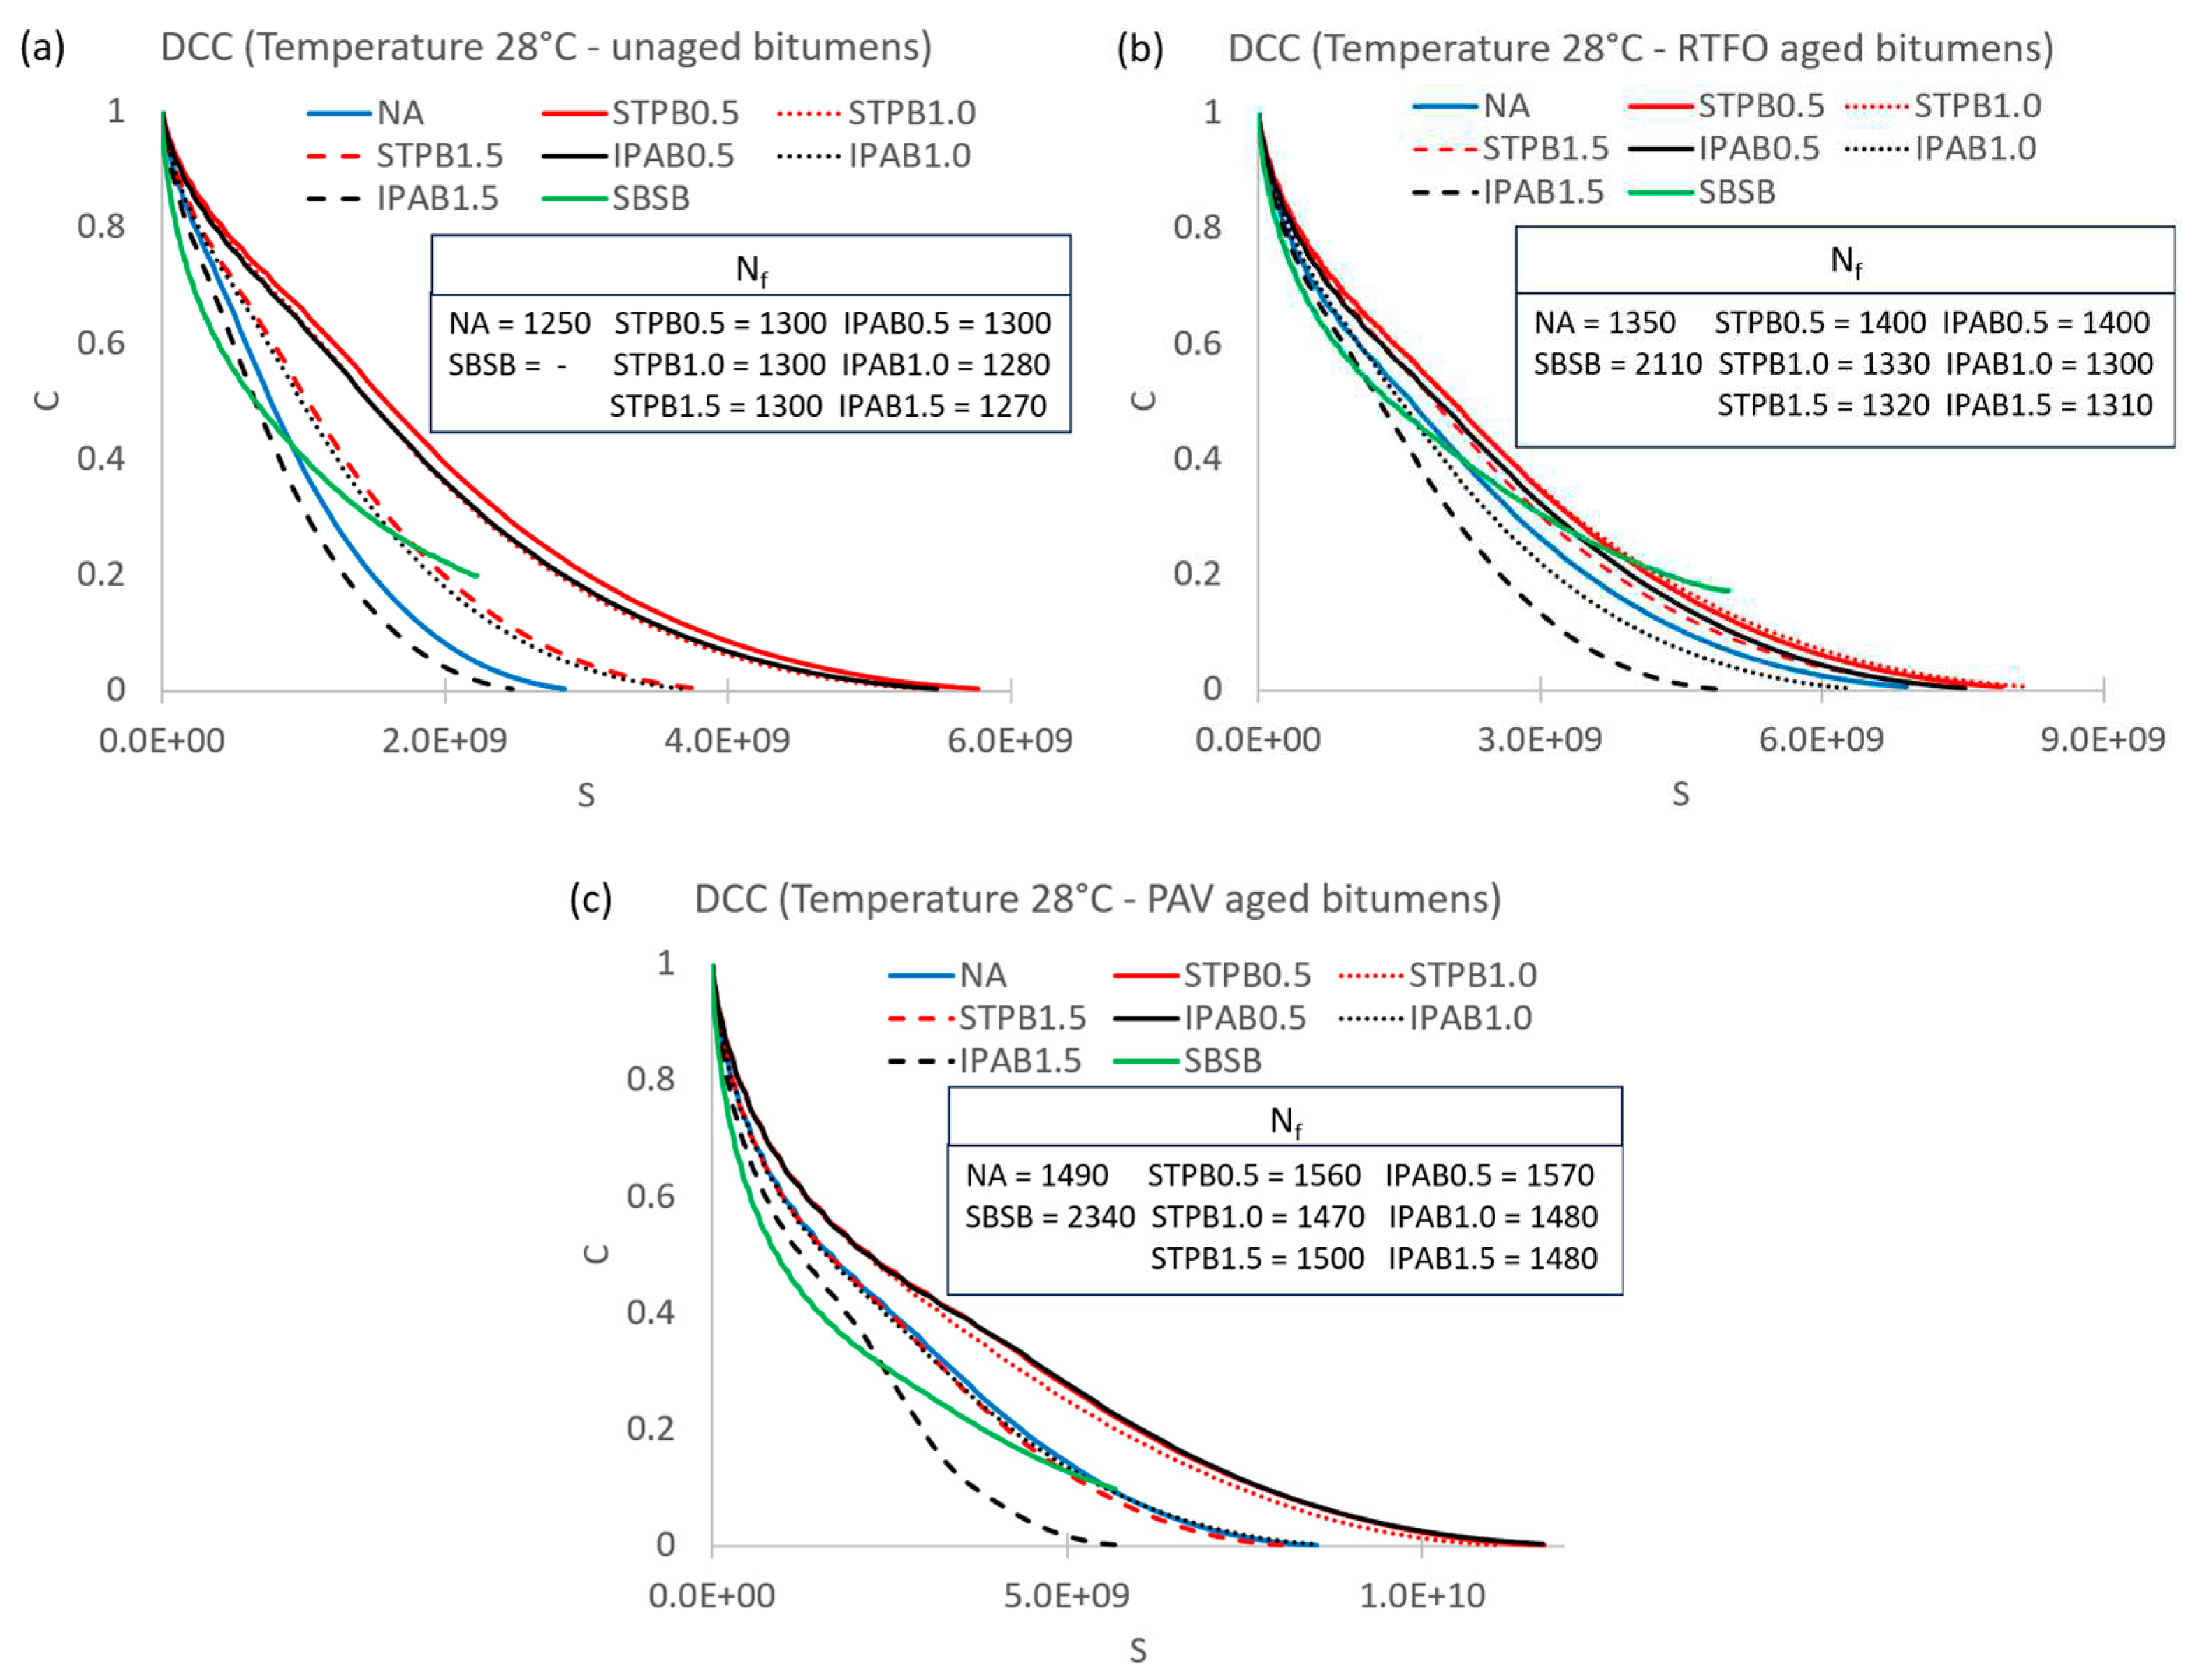
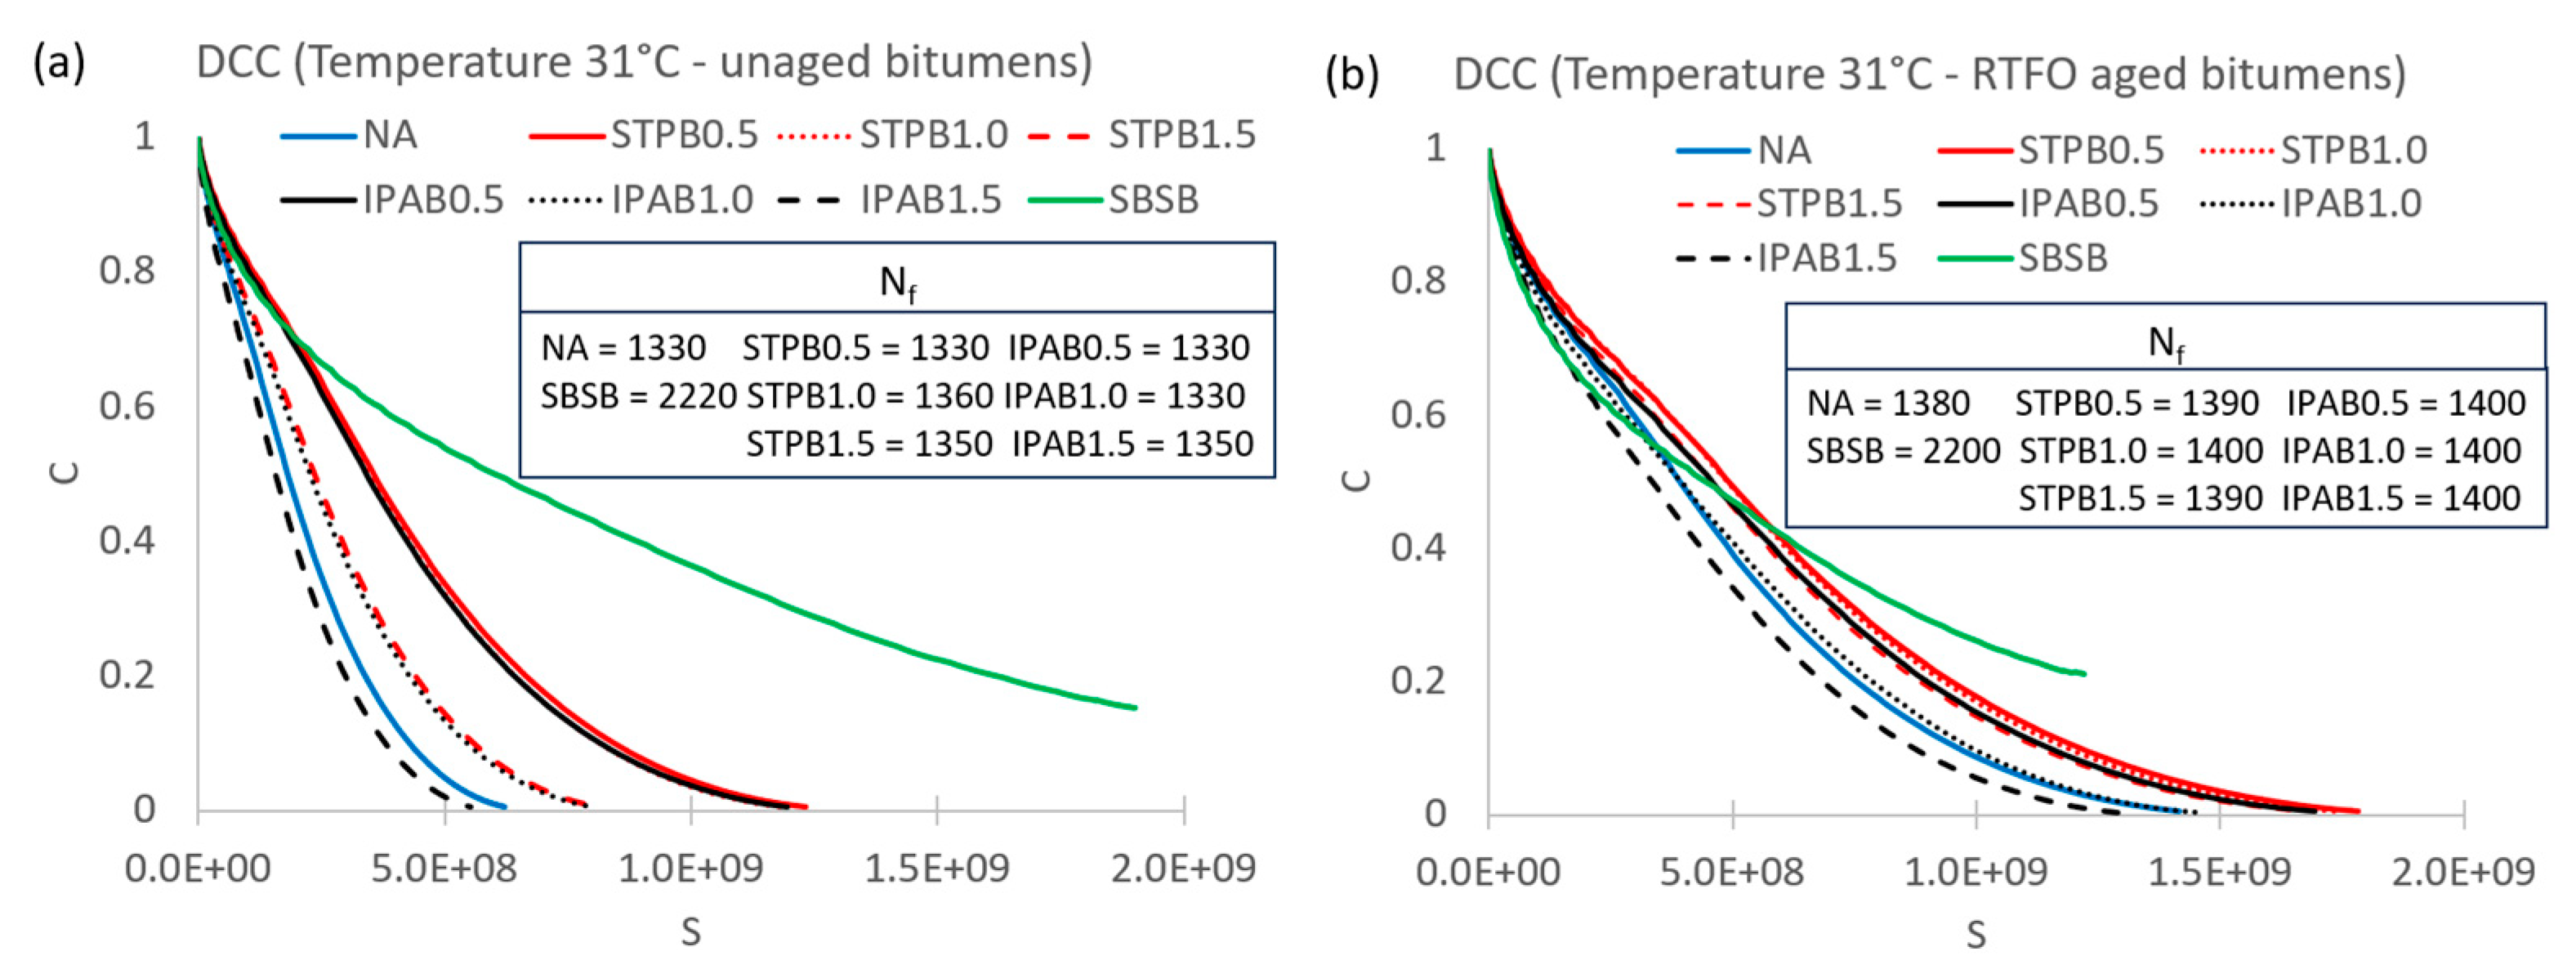
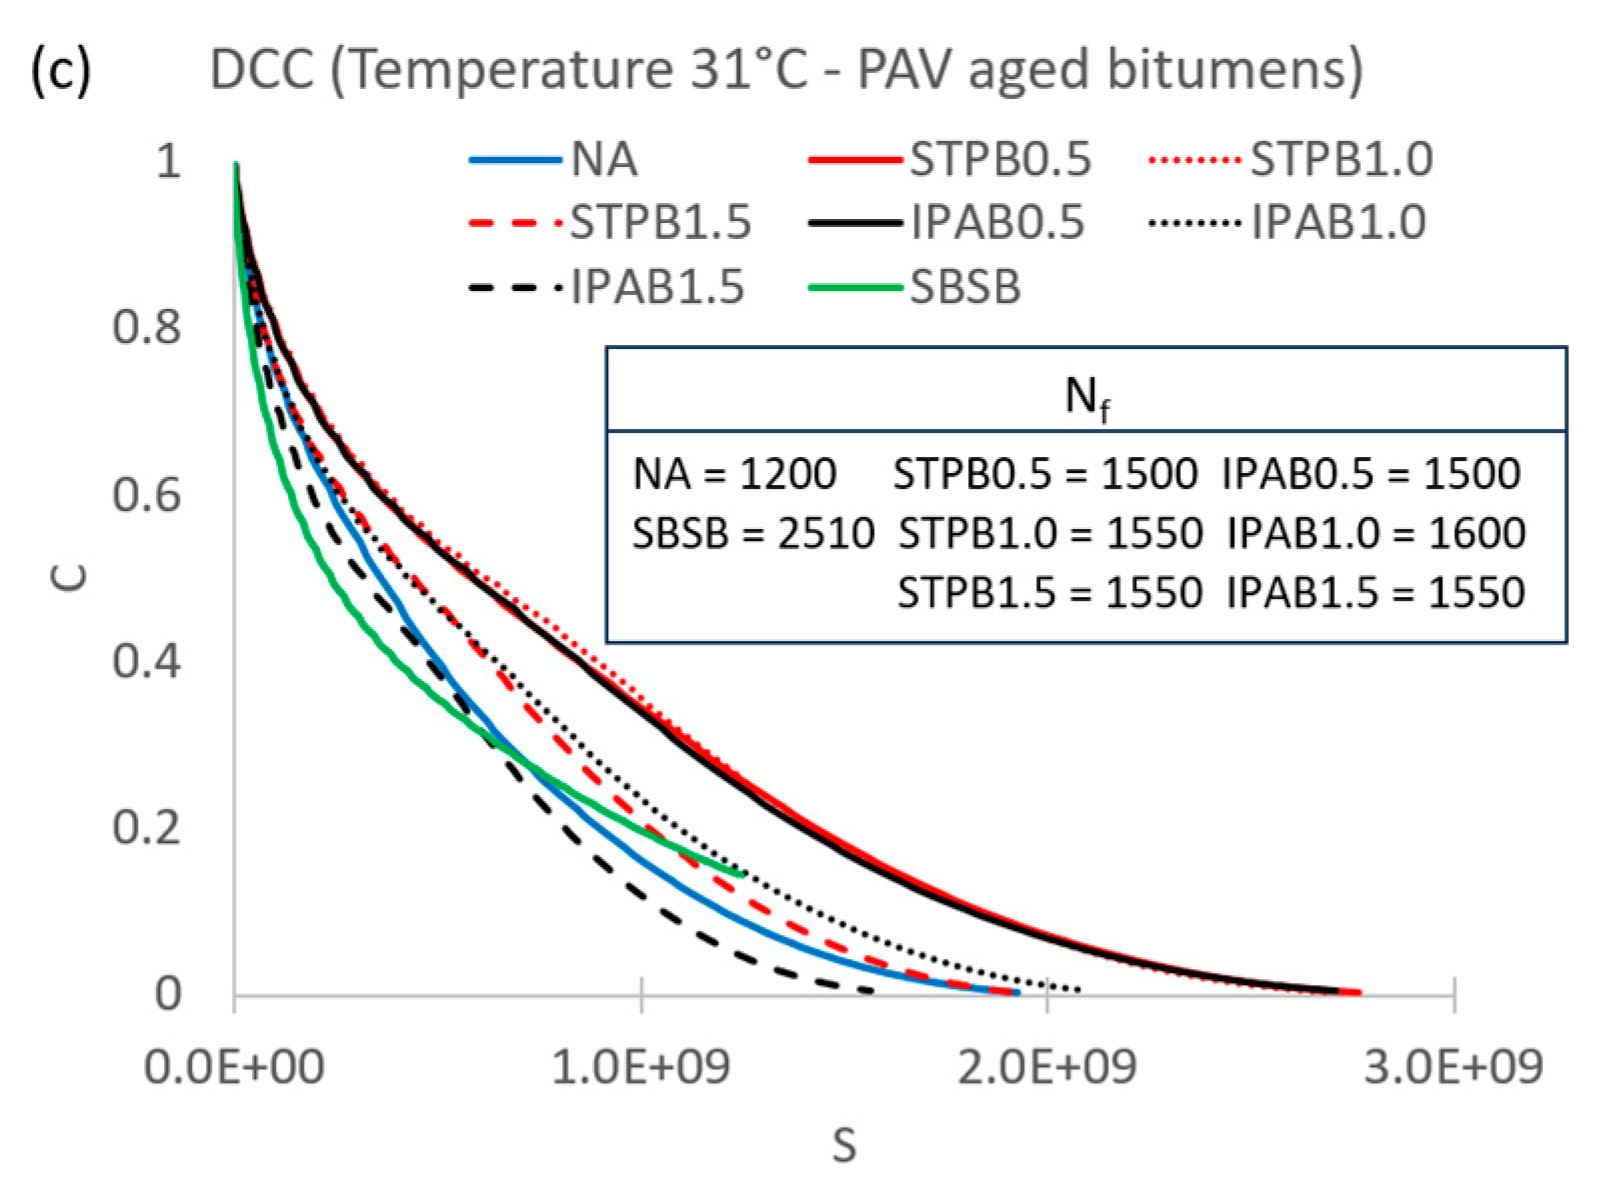
Figure 5, Figure 6 and Figure 7 illustrate the DCCs of all bitumens related to test sets 1a, 1b, and 1c, respectively. These figures demonstrate that IPAB0.5, STPB0.5, and STPB1.0 generally exhibit greater fatigue performance than the other bitumens in this study, because their C values are higher than those related to other bitumens, regardless of S values. This fact means that IPAB0.5, STPB0.5, and STPB1.0 can withstand the same damage intensity with superior material integrity. In the case of long-term aging [Figure 5c, 6c and 7c)], IPAB0.5 and STPB1.0 mainly show a superior fatigue performance concerning the other bitumens, which means these asphalt binders must provide a longer service life, in terms of damage intensity, if both are used in road construction.
Figure 5, Figure 6 and Figure 7 also display the N f linked with all bitumens at different aging stages at 25 °C, 28 °C, and 31 °C, respectively. These figures prove that SBSB, STPB1.5, and STPB1.0 commonly exhibit N f values within the top 3 highest values associated with each section in each figure. This fact means that these bitumens must usually be subjected to a higher number of loading cycles to reach the failure point, regardless of the temperature and aging condition. The SBSB exhibits the higher N f in long-term aging analysis 2290, 2340, and 2510 at 25 °C, 28 °C, and 31 °C, respectively. The N f values were obtained by utilizing the failure definition: the peak of the stored PSE. See “Supplementary materials” in Figure S1, which shows the stored PSE curves of bitumens at different temperatures and aging conditions. It is easy to realize that bitumens with superior fatigue behaviour according to DCC interpretation are different from asphalt binders that exhibit greater fatigue performance in terms of the N f values, except in one case (STPB1.0). This finding agrees with previous studies [10,29] and proves again the ranking inconsistency between the peak of stored PSE(failure definition - N f ) and the fatigue performance conforming to DCC analysis.
Moreover, it can be seen in Figure 5, Figure 6 and Figure 7 that SBSB regularly shows lower C values than the other bitumens, regardless of the S values, which means SBSB exhibits lower fatigue performance than the other bitumens, according to DCC interpretation. These figures illustrate the same phenomenon which occurred in previous research works for instance: Safaei et al. [4], Wang et al. [9], and Wang et al. [10]. But respect with N f , (see Figure 5, Figure 6 and Figure 7 and S1) SBSB always exhibits the highest values except in the case of Figure S1a) [or Figure 5a)] and Figure S1d) [or Figure 6a)]. This fact means that the SBSB must usually be subjected to the highest number of loading cycles to reach the failure point. As a result, this conclusion confirms again the inconsistency mentioned above.
In Figure S1a,d the N f linked with SBSB cannot be identified because its stored PSE curve failed to have a peak to identify this value. Hence, it is not possible to determine the fatigue performance of SBSB in terms of the number of loading cycles to reach the failure point. As a result, stored PSE fails to be a useful parameter to assess the bitumen fatigue performance under any type of conditions. To analyze the reason for this phenomenon (no peak in the stored PSE curve), it is needed to analyze the stored PSE equation (see Equation 5), and this formula mainly depends on C and γ i R values. After a comprehensive analysis of both parameter values, this research team can conclude that γ i R values increase at a high rate and C keeps its values high enough to maintain the stored PSE curve increasing (without defining a peak) while undertaking the continue LAS test. Accordingly, it is not possible to determine N f under this condition.
Figures S2–S9 (see “Supplementary materials”) illustrate the DCCs of NA, STPB0.5, STPB1.0, STPB1.5, IPAB0.5, IPAB1.0, IPAB1.5, and SBSB at different temperatures and aging conditions, respectively. It is interesting to notice that all bitumens show their highest, middle, and lowest fatigue performance in terms of DCC interpretation at 28°C, 25°C, and 31°C, respectively, regardless of the aging condition. Only except in Figure S9a, where the SBSB exhibits its greatest, middle, and lowest fatigue performance at 31°C, 28°C, and 25°C, respectively. This finding leads to infer that there must be a specific temperature (different for each bitumen) to reach the utmost bitumen fatigue performance in terms of DCC evaluation (higher C values, regardless of S values). The DCC positions in the above-mentioned C vs S graphs are in conflict with the finding in the previous study Wang et al. [10]. This previous research work proposed the application of TTSP considering that temperature causes the proportion location of DCC inside C vs S graphs, but the findings from Figures S2–S9 disagree with that statement. Hence, under certain conditions, the TTSP is not applicable to the DCC proportion location, and this conclusion agrees with the previous study by Chen et al. [34].
Besides, Figures S2–S8 generally depict the PAV-aged, RTFO-aged, and unaged bitumens as the number one, two, and three, respectively, in terms of fatigue performance, according to DCC assessment, regardless of the temperature. This finding is not correlated with the actual engineering experience, because PAV-aged asphalt binder must exhibit the worst fatigue behaviour and RTFO-aged bitumen should show less performance than unaged bitumen. The conclusion from those figures agrees with previous research works, for instance: Chen and Bahia [47], Cao and Wang [15], and Zhou et al. [26]. In the case of Figure S9d,e, unaged asphalt binder exhibits the worst behaviour and RTFO-aged bitumens show better performance than PAV-aged bitumens. Only, Figure S9f illustrates the fatigue performance in the order as it is expected in the actual road engineering experience, which is unaged asphalt binder, RTFO-aged bitumen, and PAV-aged bitumen show the number one, two, and three performances, respectively, in terms of fatigue behaviour according to DCC placement in C vs S graph.

3.2. Failure criterion evaluation

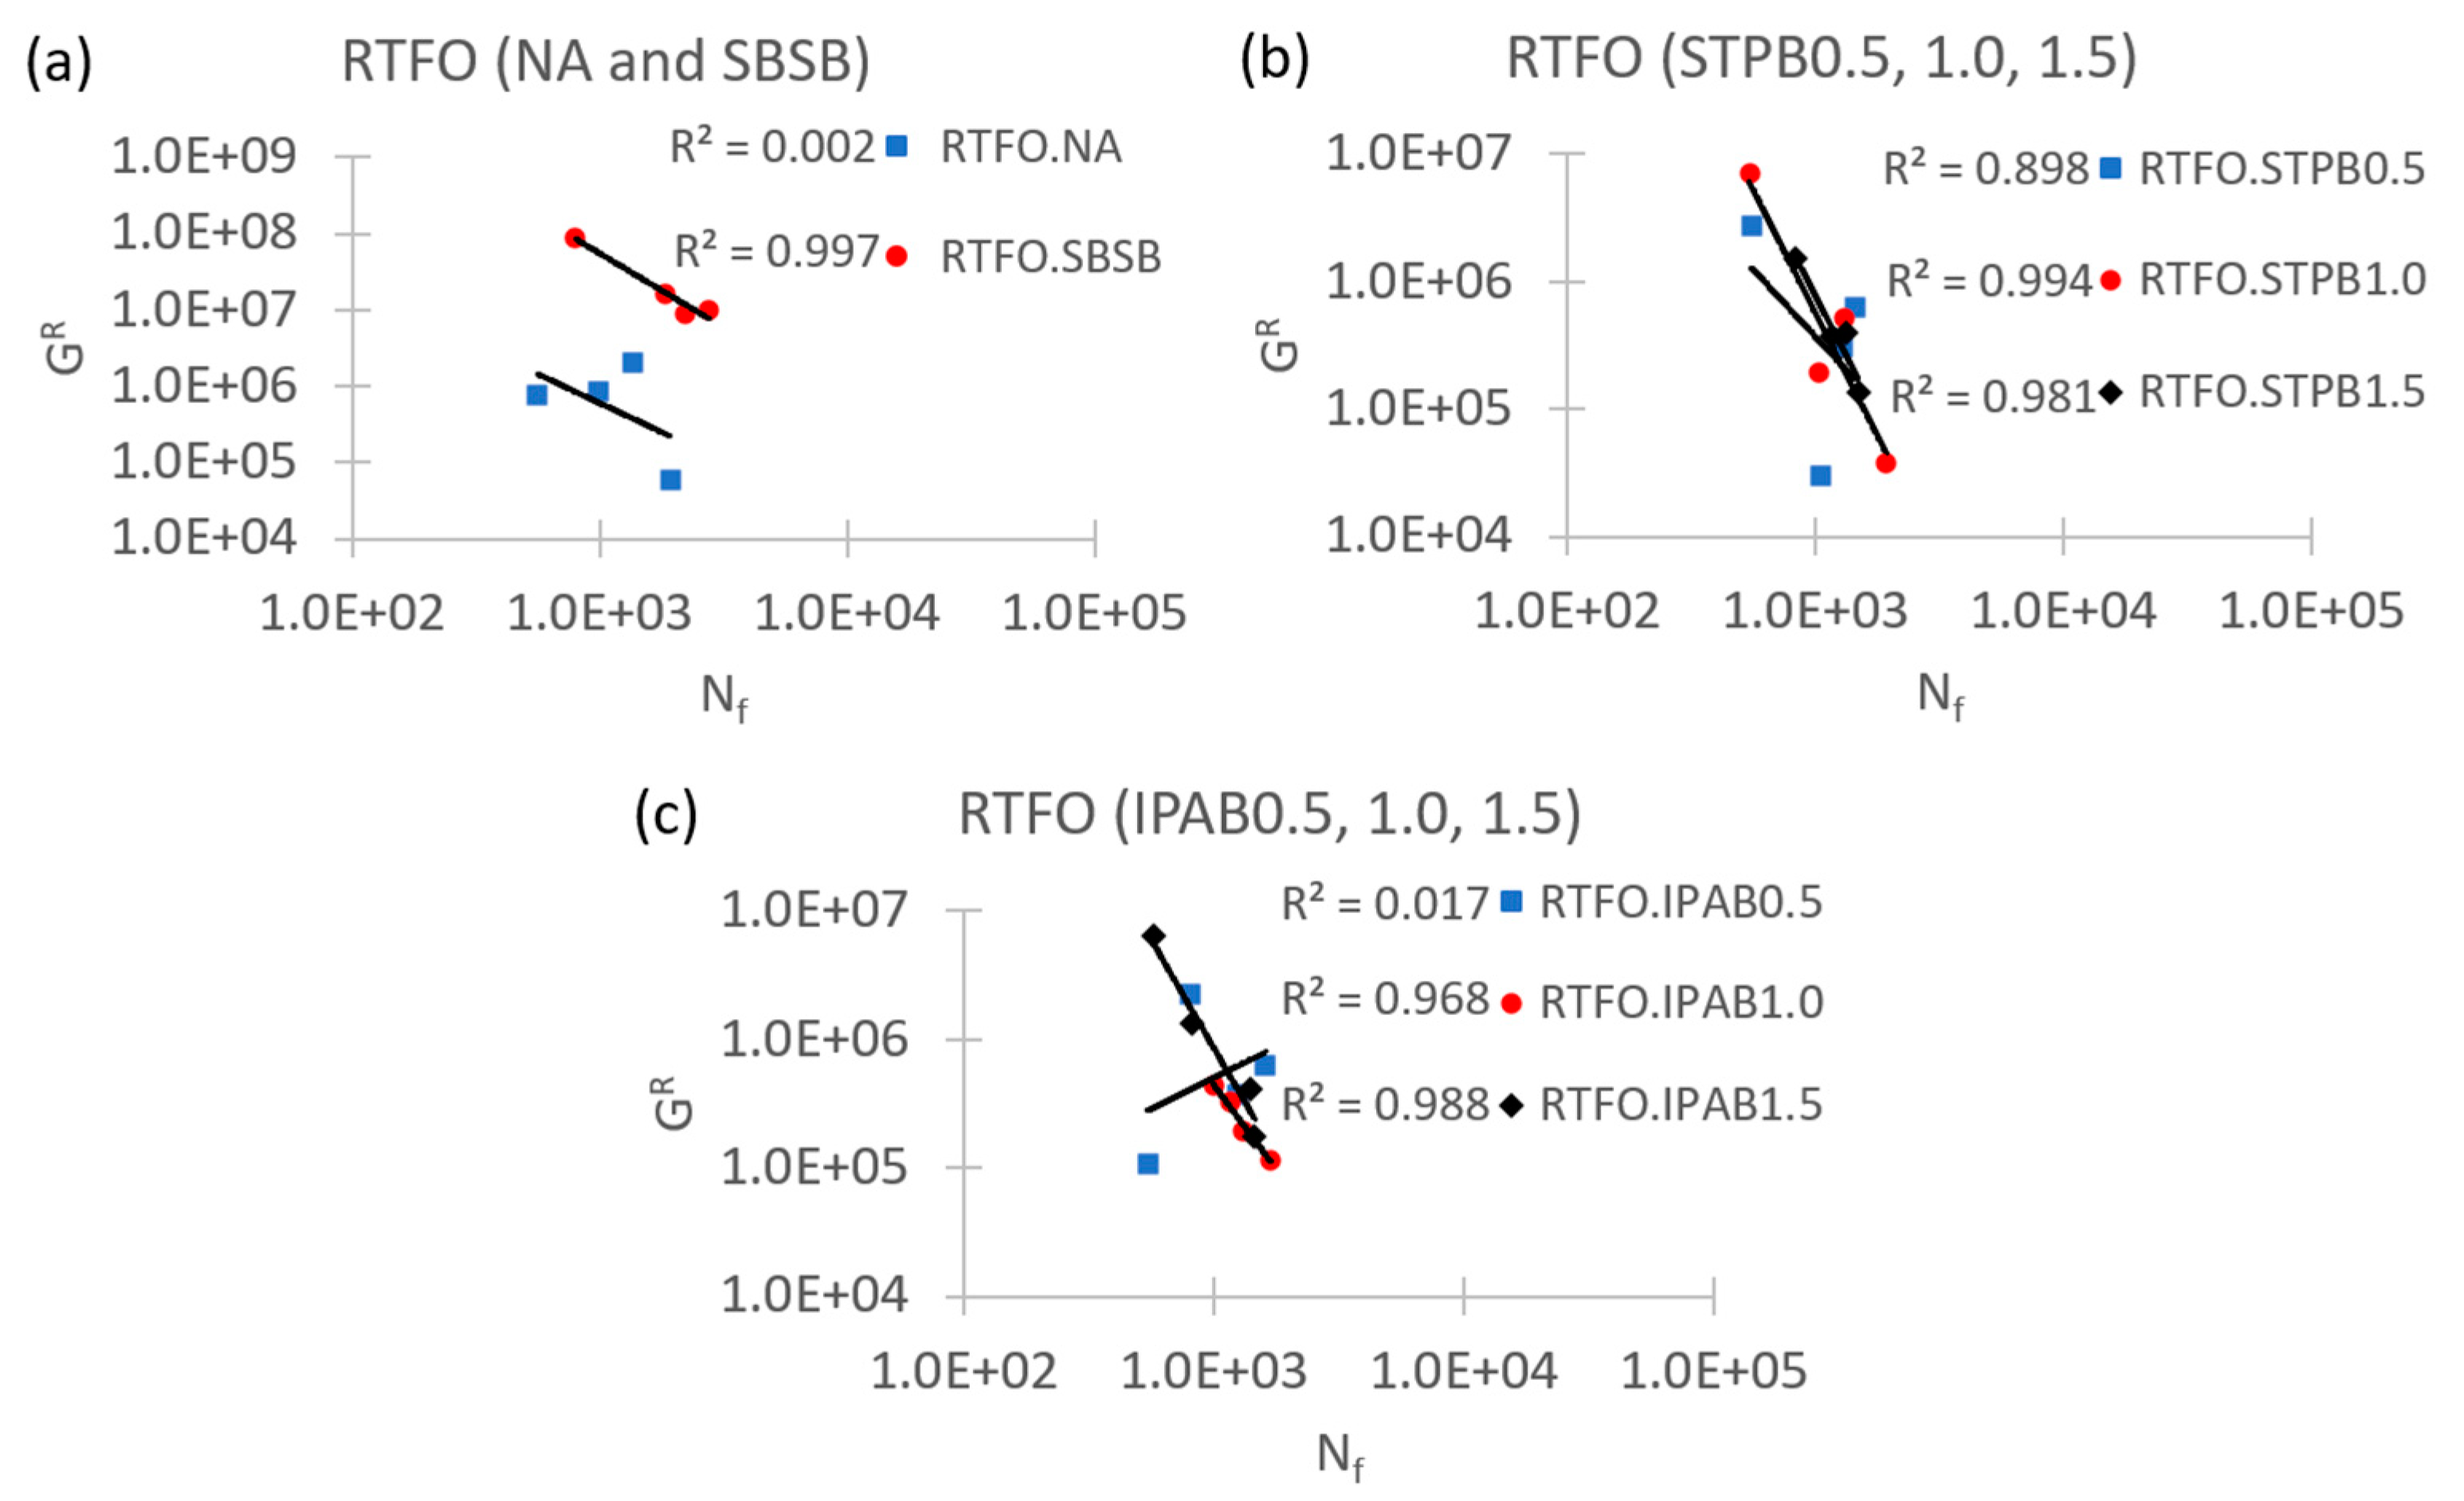
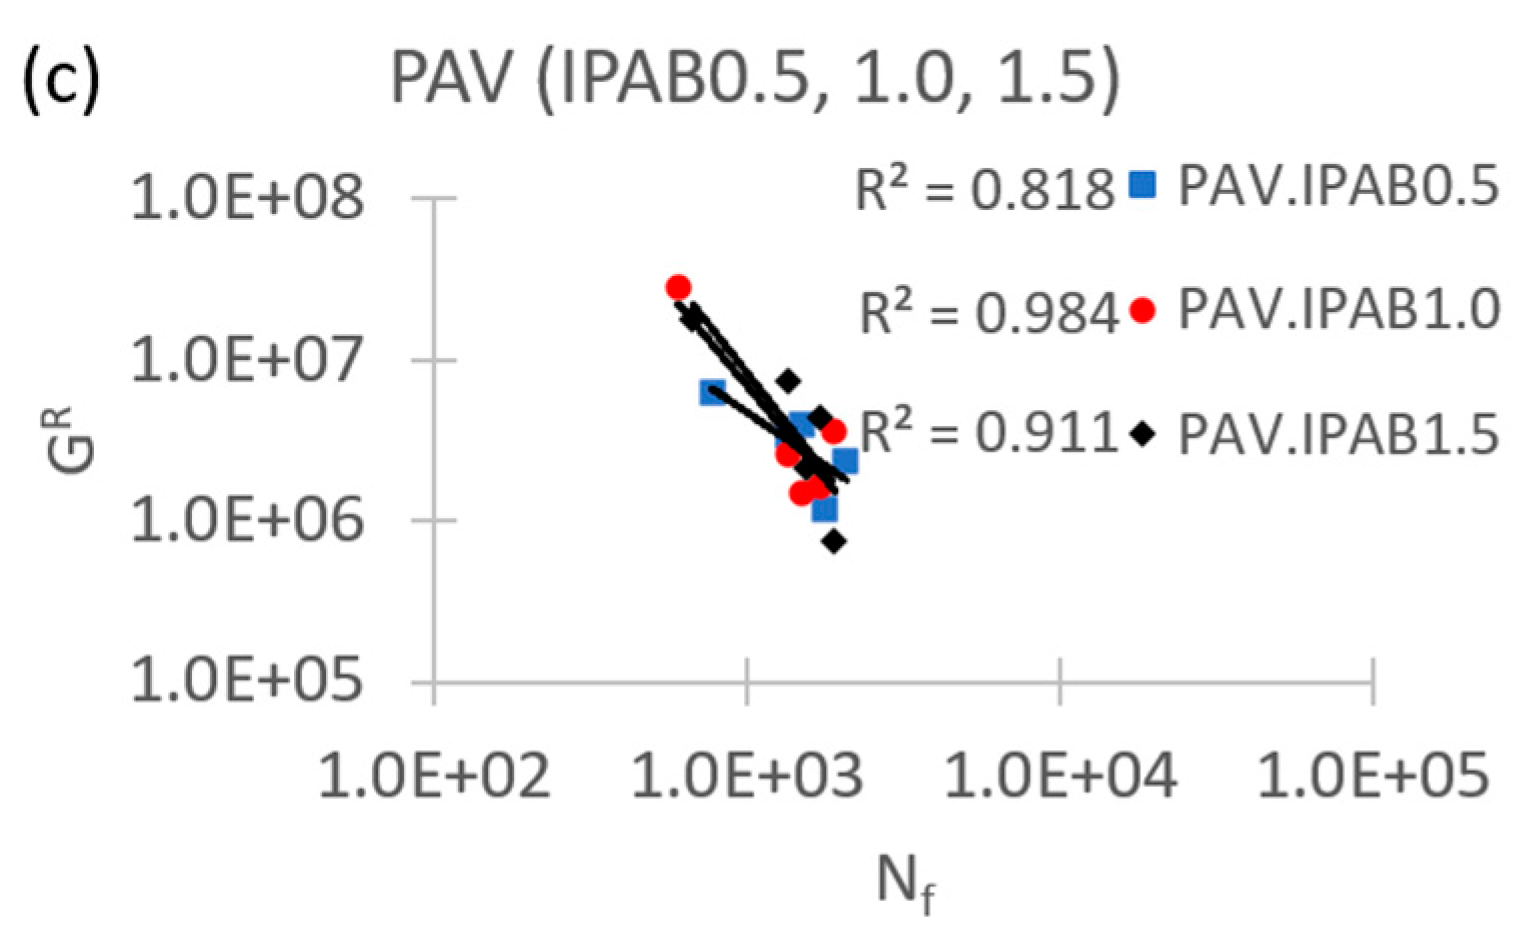
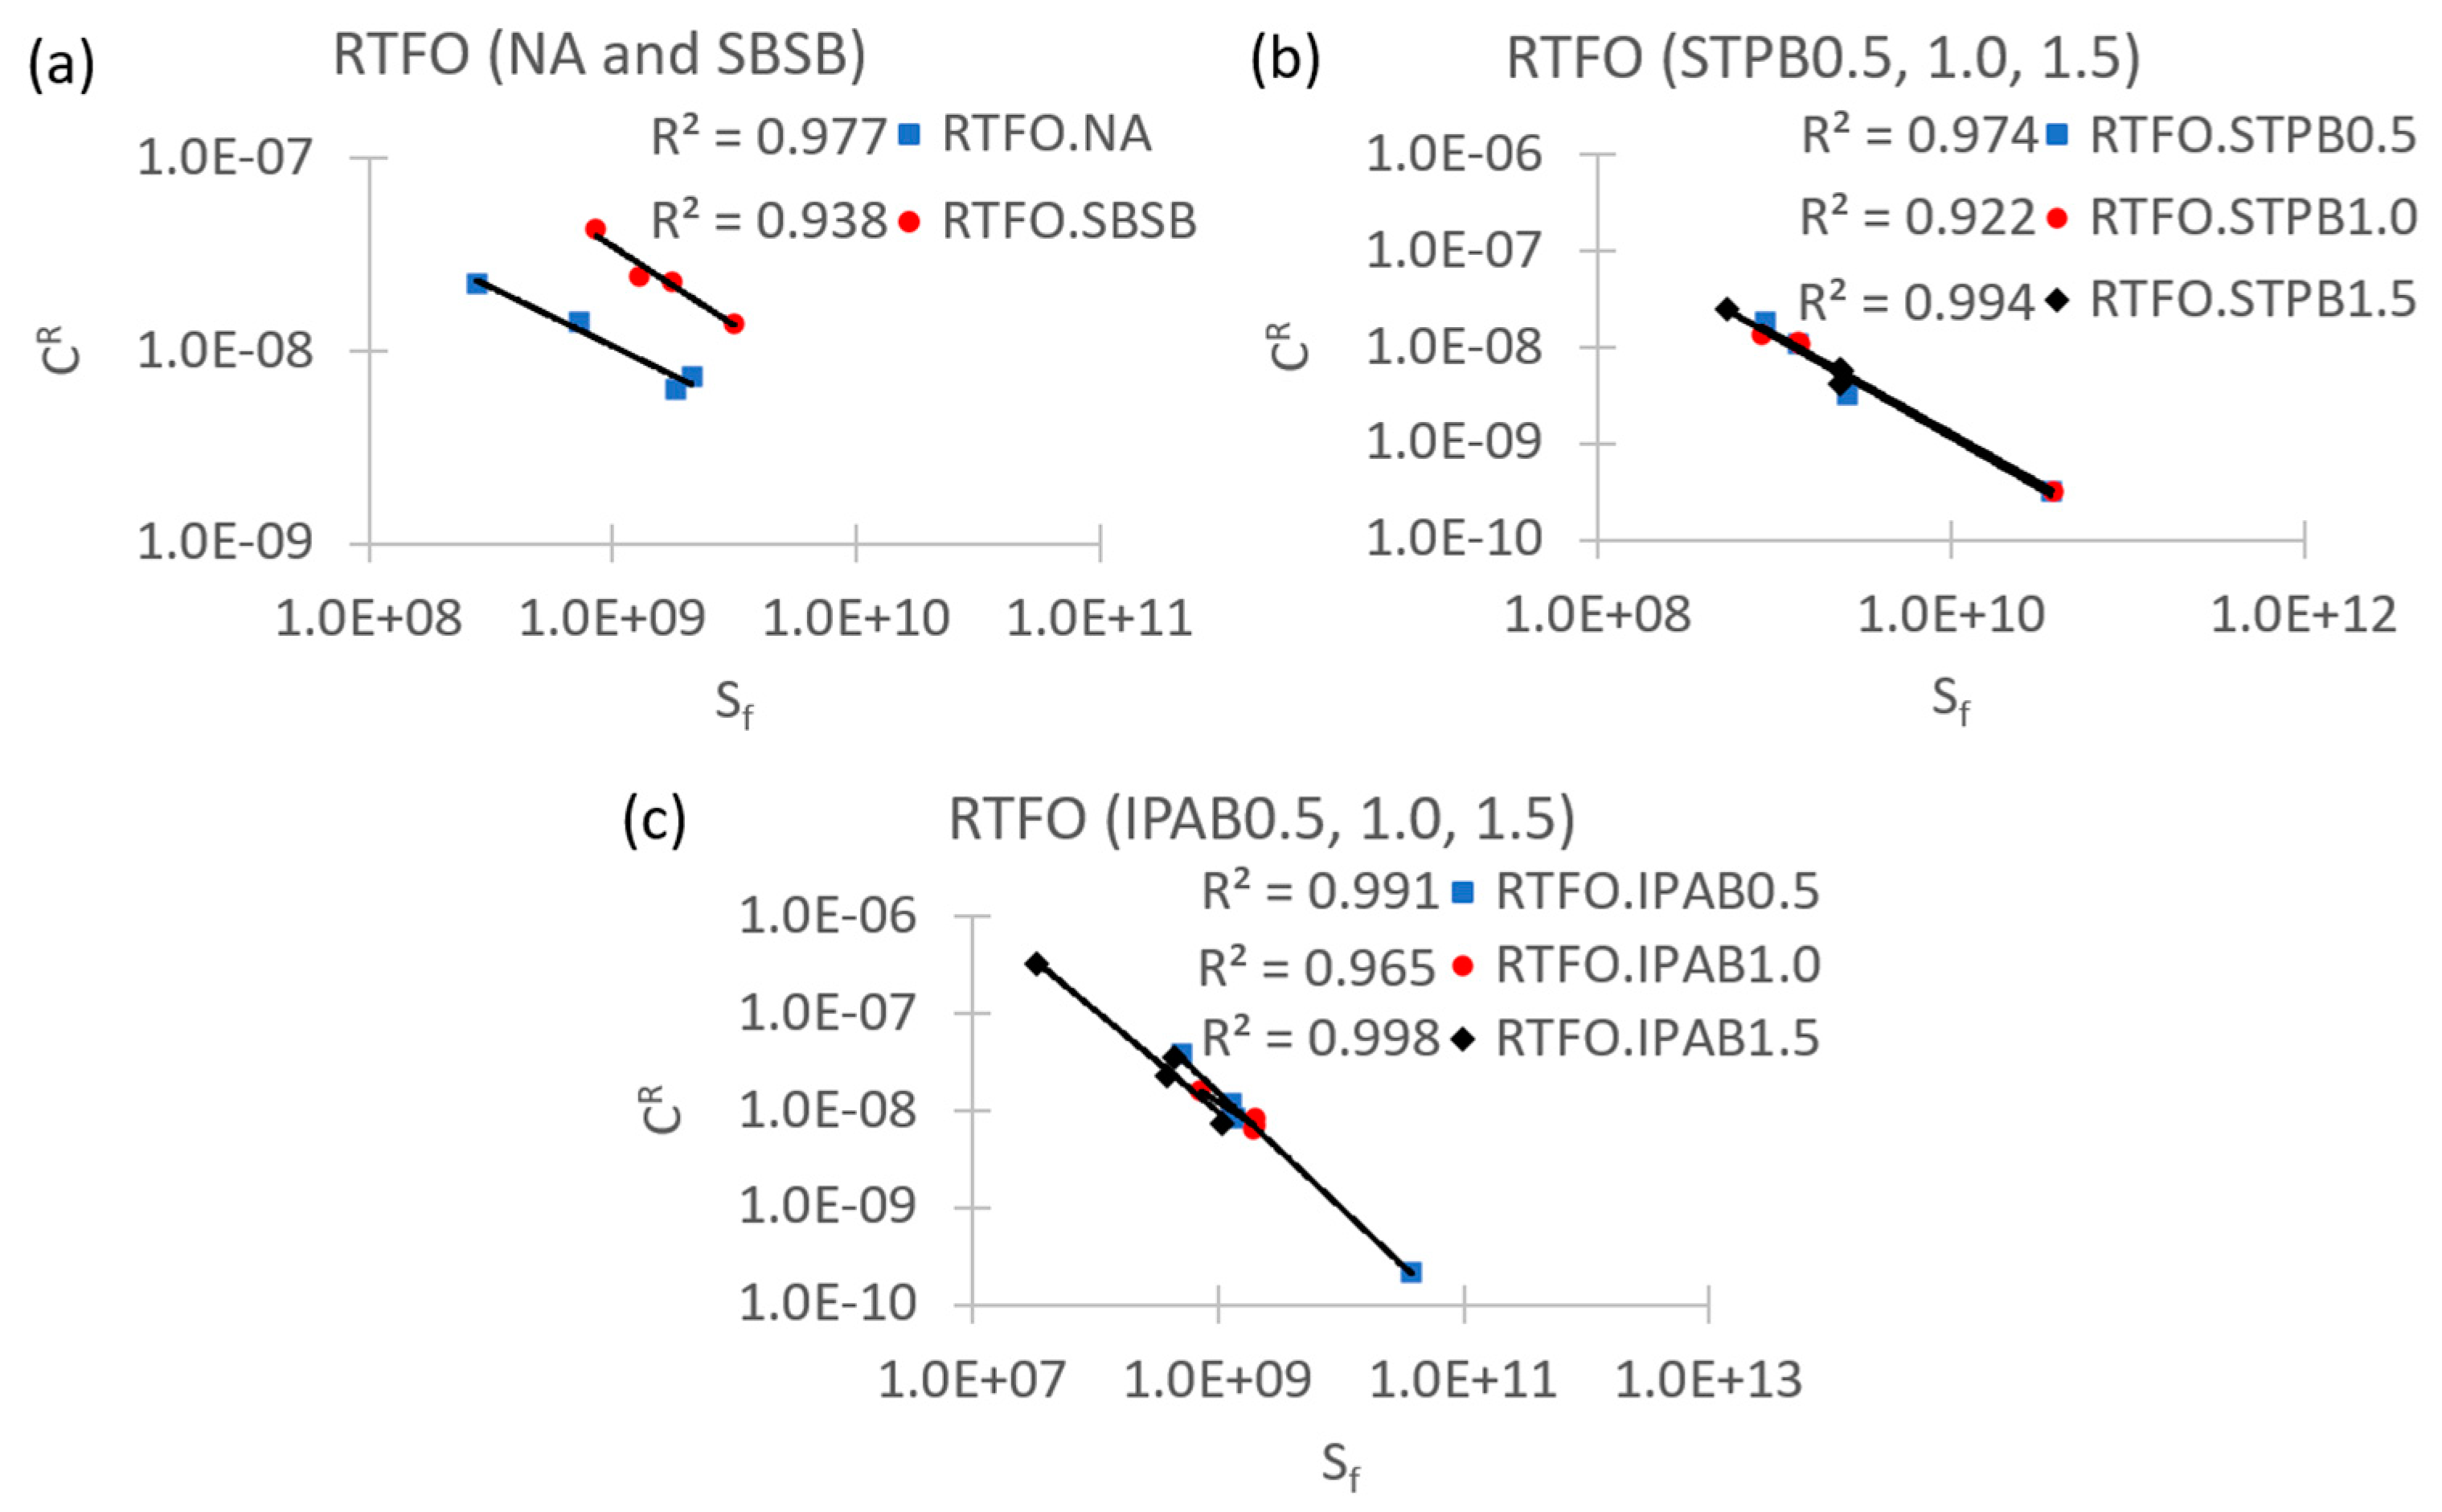
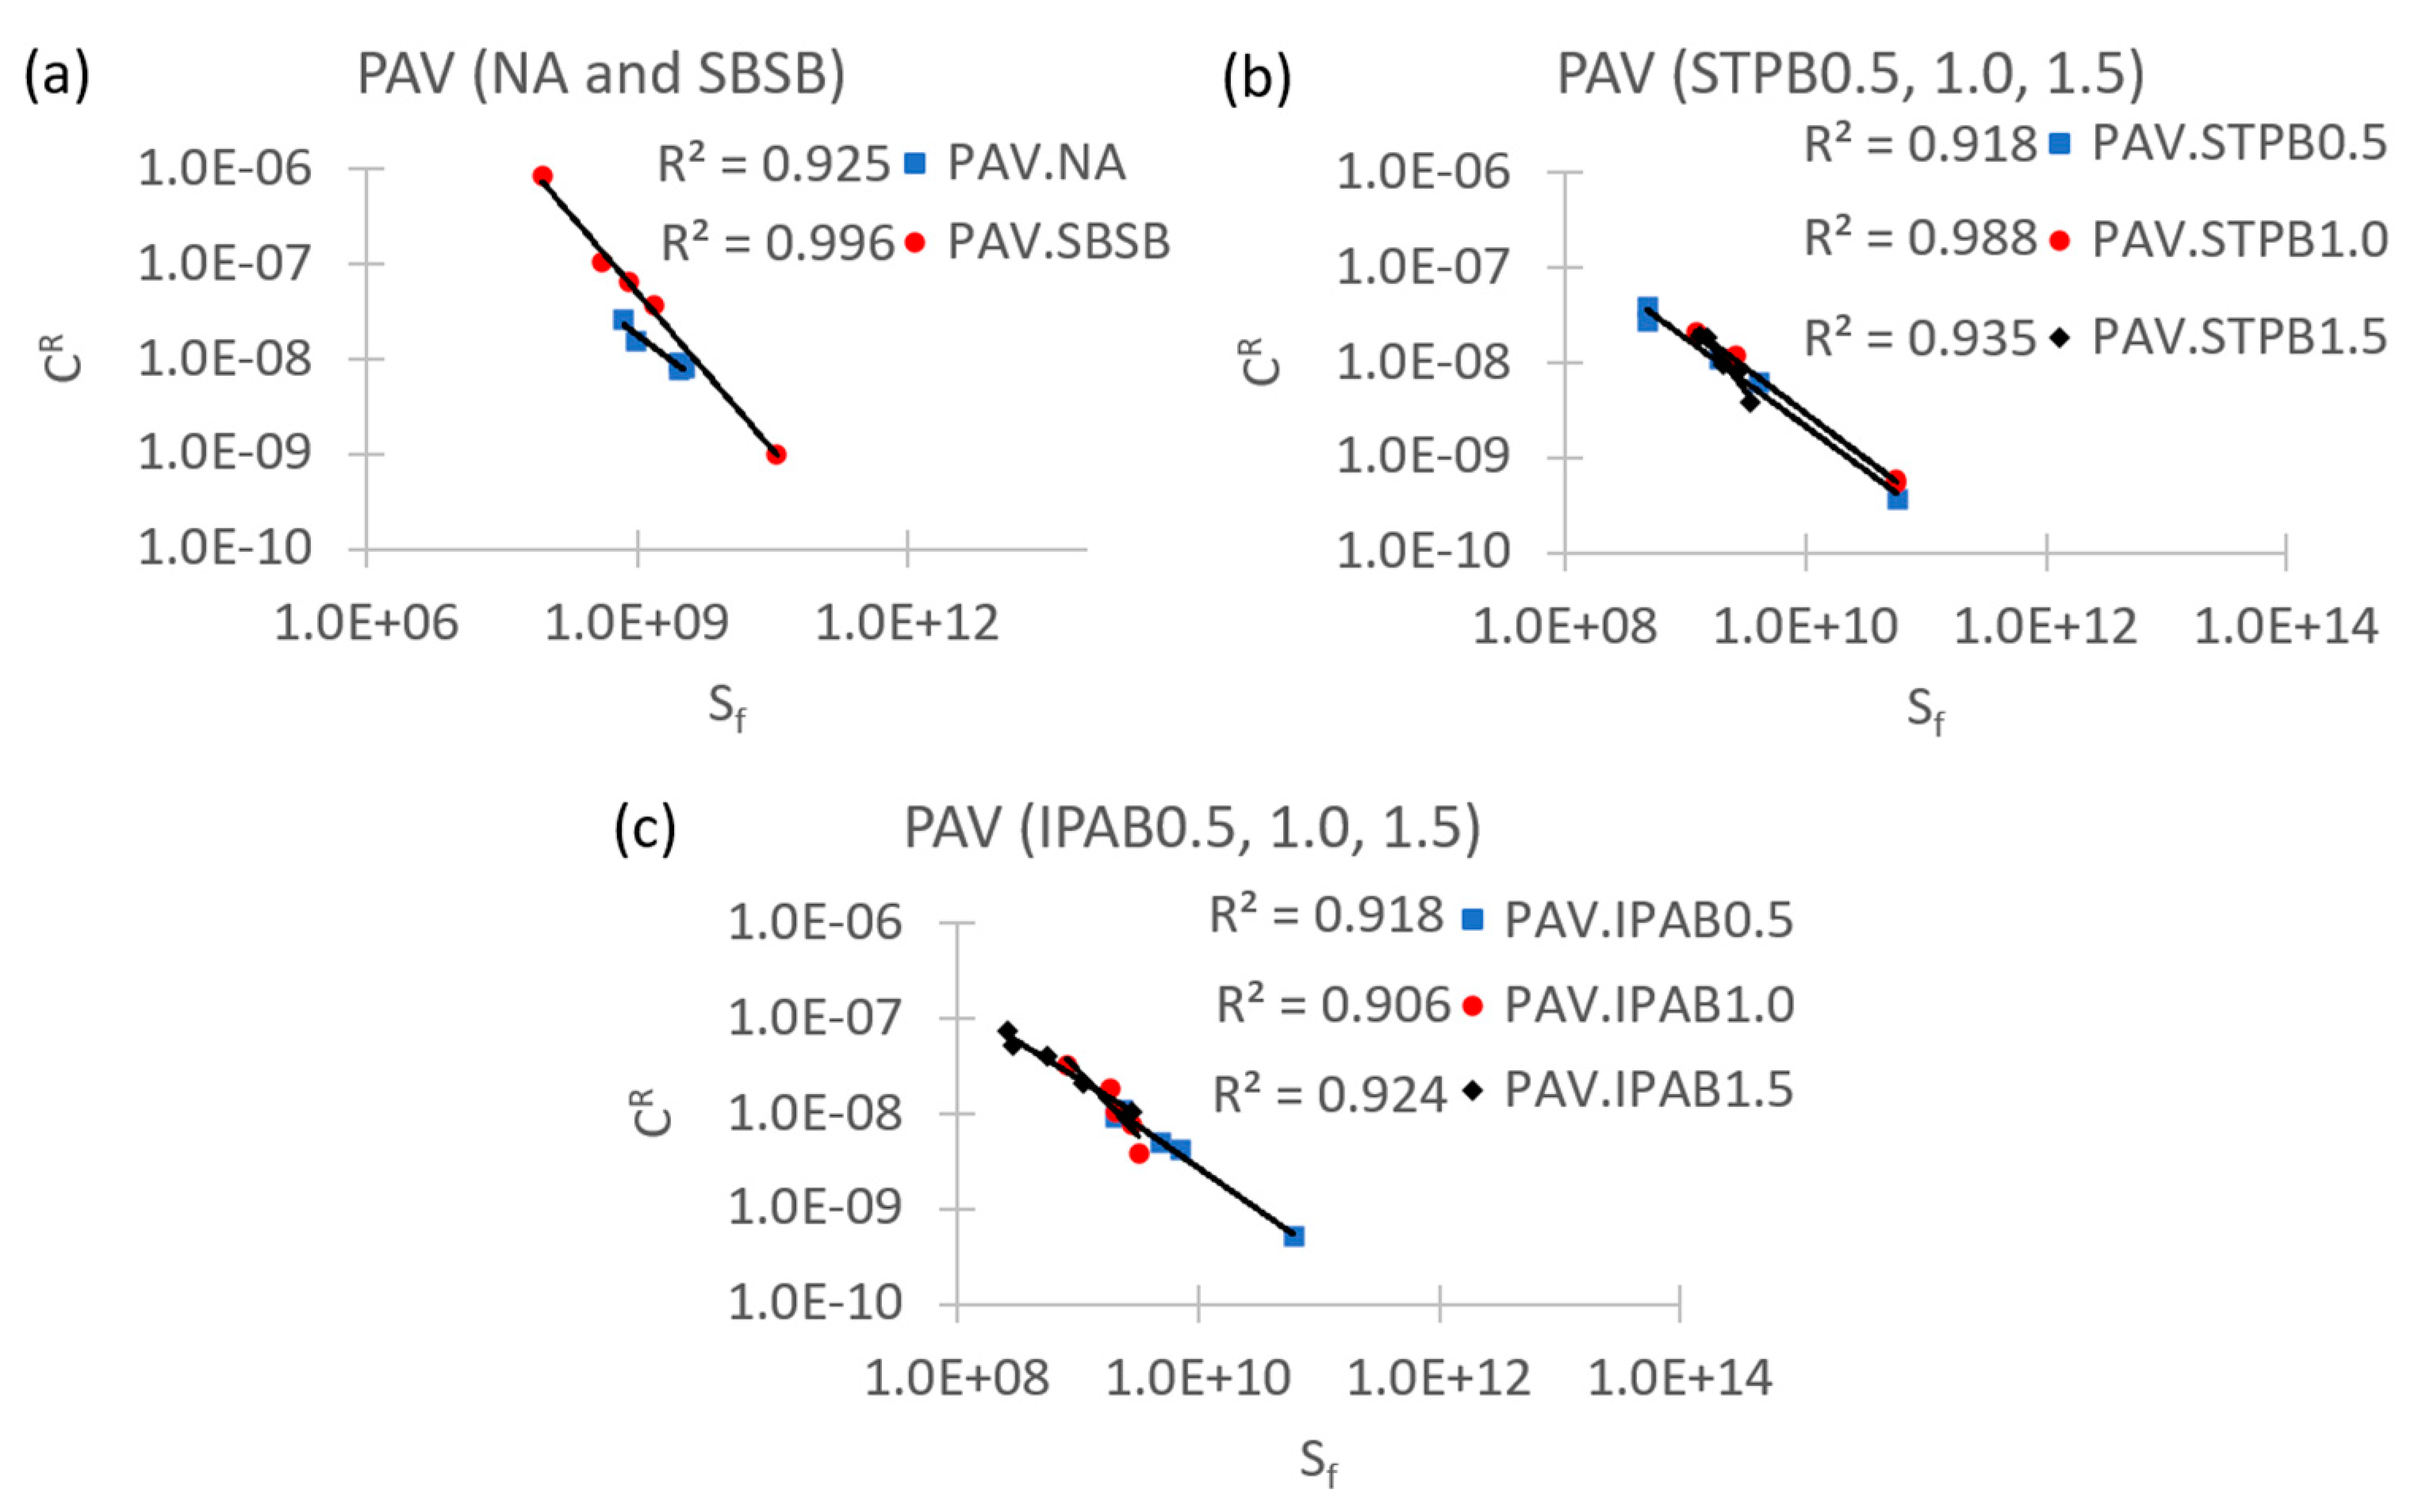
Figure 8 and Figure 9 illustrate the failure criterion related to RTFO-aged and PAV-aged bitumens, respectively. Figure 8 is related to the test sets: 2a, 3a, 4a, 5a, 6a, 7a, 8a, and 9a, and Figure 9 is linked with the test sets: 2b, 3b, 4b, 5b, 6b, 7b, 8b, and 9b. Figure 8 and Figure 9 generally exhibit the existence of a strong relationship between G R and N f , regardless of the bitumens and experimental conditions, because R2 values commonly are greater than 0.90. As a result, it is possible to confirm that the failure criterion based on the area below the stored PSE curve usually can predict the fatigue performance of asphalt binders under different test conditions, at least for those selected in this study. Nevertheless, the mentioned failure criterion fails to be useful to predict the NA and IPAB0.5 fatigue performances under the selected test conditions linked with set 2a [Figure 8a)] (former bitumen), and sets 6a [Figure 8c)] and 6b [Figure 9c)] (latter bitumen), because R2 values are low. In the case of R2 values related to sets 2a and 6a are extremely low. Hence, the failure criterion fails to be a robust tool to predict bitumen fatigue behaviour under all types of test conditions. This conclusion conflicts with the previous study Wang et al. [33].
Besides, the slopes of the fitting graphs in Figure 8 and Figure 9 are generally quite different, which means that the failure criterion based on the TRPSE in terms of the area under the released PSE curve up to the failure point identifies different tendencies of how changes the average rate of released PSE while conducting the continue LAS test. Moreover, this fact proves that bitumen aging condition and the type of asphalt binder modifier have a high influence on how changes G R values, at least for the selected test conditions, bitumens, and asphalt modifiers, according to the above-mentioned failure criterion.

3.3. Failure definition evaluation (new proposal)

Figure S10 (see Supplementary materials) shows the failure definition points identified by the peak of W R ( N f ) and the peak of SPC ( S f ) on the W R curves at different temperatures and aging conditions. This figure proves that N f and S f are closely located on the W R curves regardless of the bitumens, temperatures, and aging conditions, which evidences both concepts are compatible in terms of determining the failure point although these failure definitions have different basements. This fact demonstrates the efficacy of the new proposal of failure definition (peak of SPC) at least for the bitumens, temperatures, and aging conditions in this study. This research team realizes that S f is almost always at the right side of the N f on the W R curves regardless of the bitumens, temperatures, and aging conditions, which means that the new proposal of failure definition identifies slightly longer service life for the bitumens in this study. The only case where the S f is placed at the left side of the N f on the W R curve is in Figure S10i for the SBSB.
Moreover, Figure S10 illustrates that N f and S f are closer when determining the failure point linked with PAV-aged bitumens than in the case of RTFO-aged and unaged asphalt binders, regardless of the bitumens and temperatures. This fact proves the failure concepts have a higher agreement in terms of identifying failure points of bitumens with a long time of service, at least for the selected test conditions and bitumens in this study. The new proposal of failure definition solves the ineffectiveness of the traditional failure concept (peak of W R ) to determine N f under certain conditions [see Figure S1a,d associated with SBSB]. As a result, Figure S10 [a) and d)] depicts the failure point on the W R curve related to SBSB.
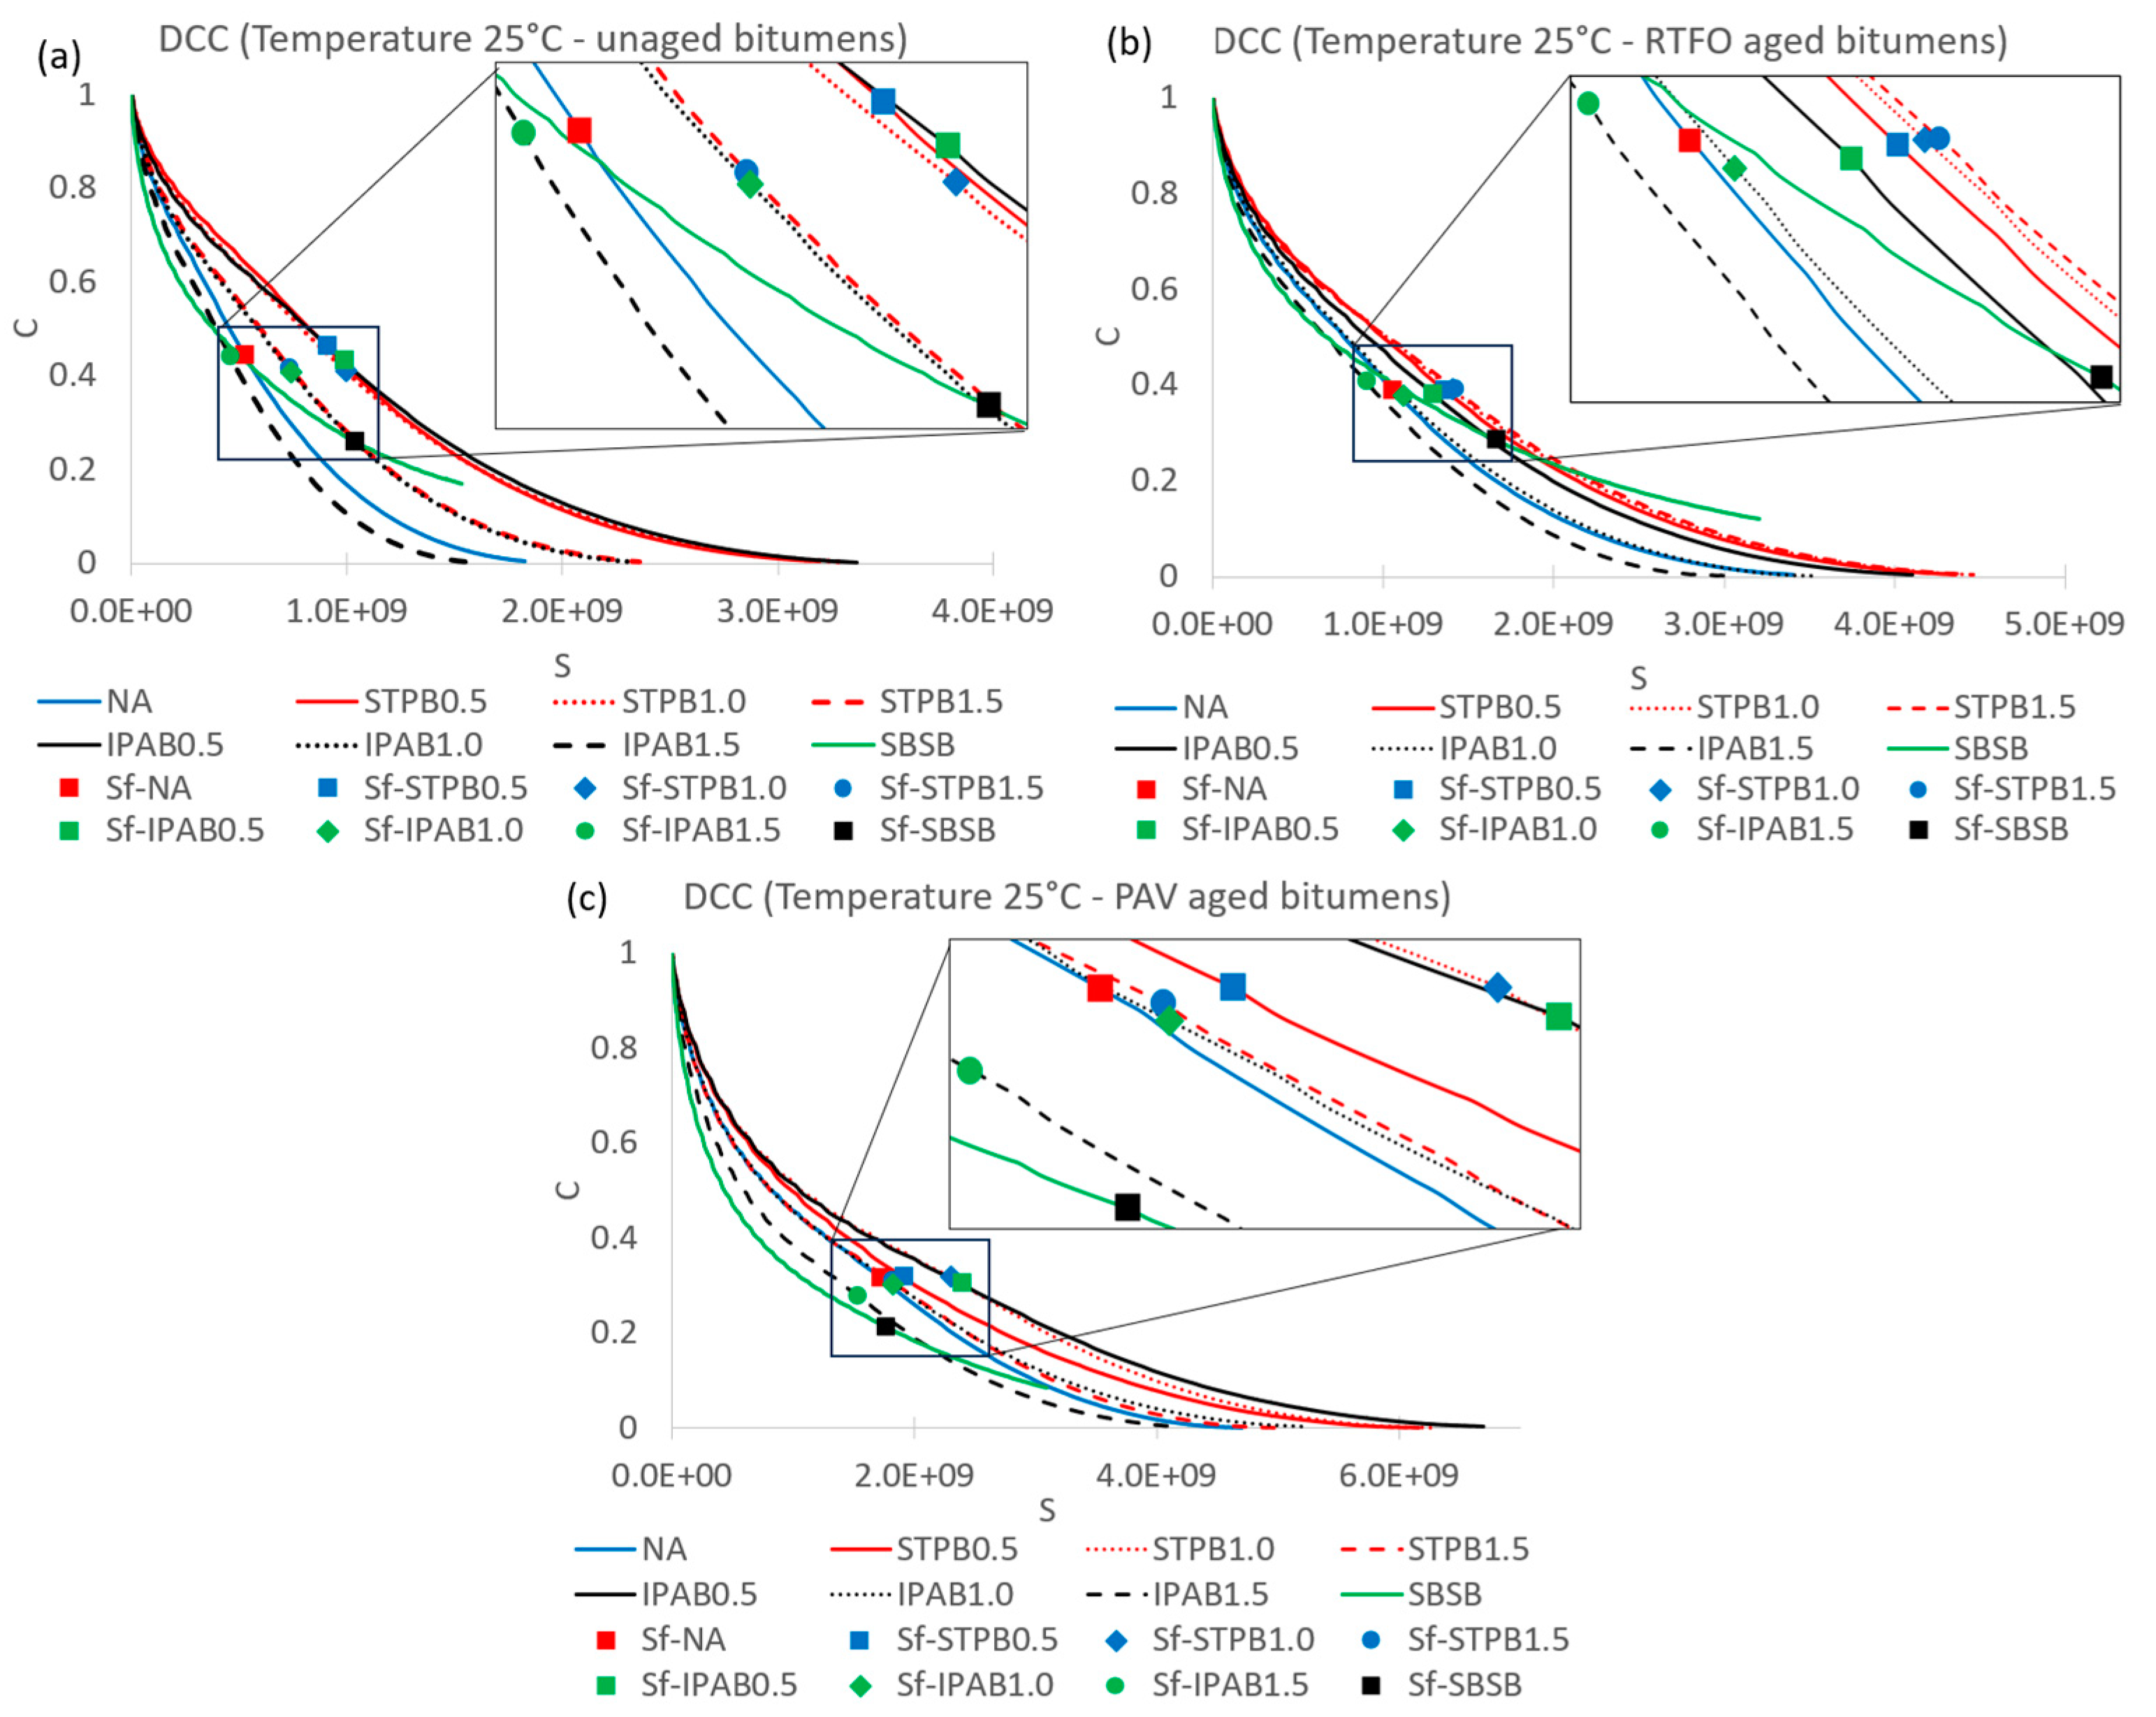
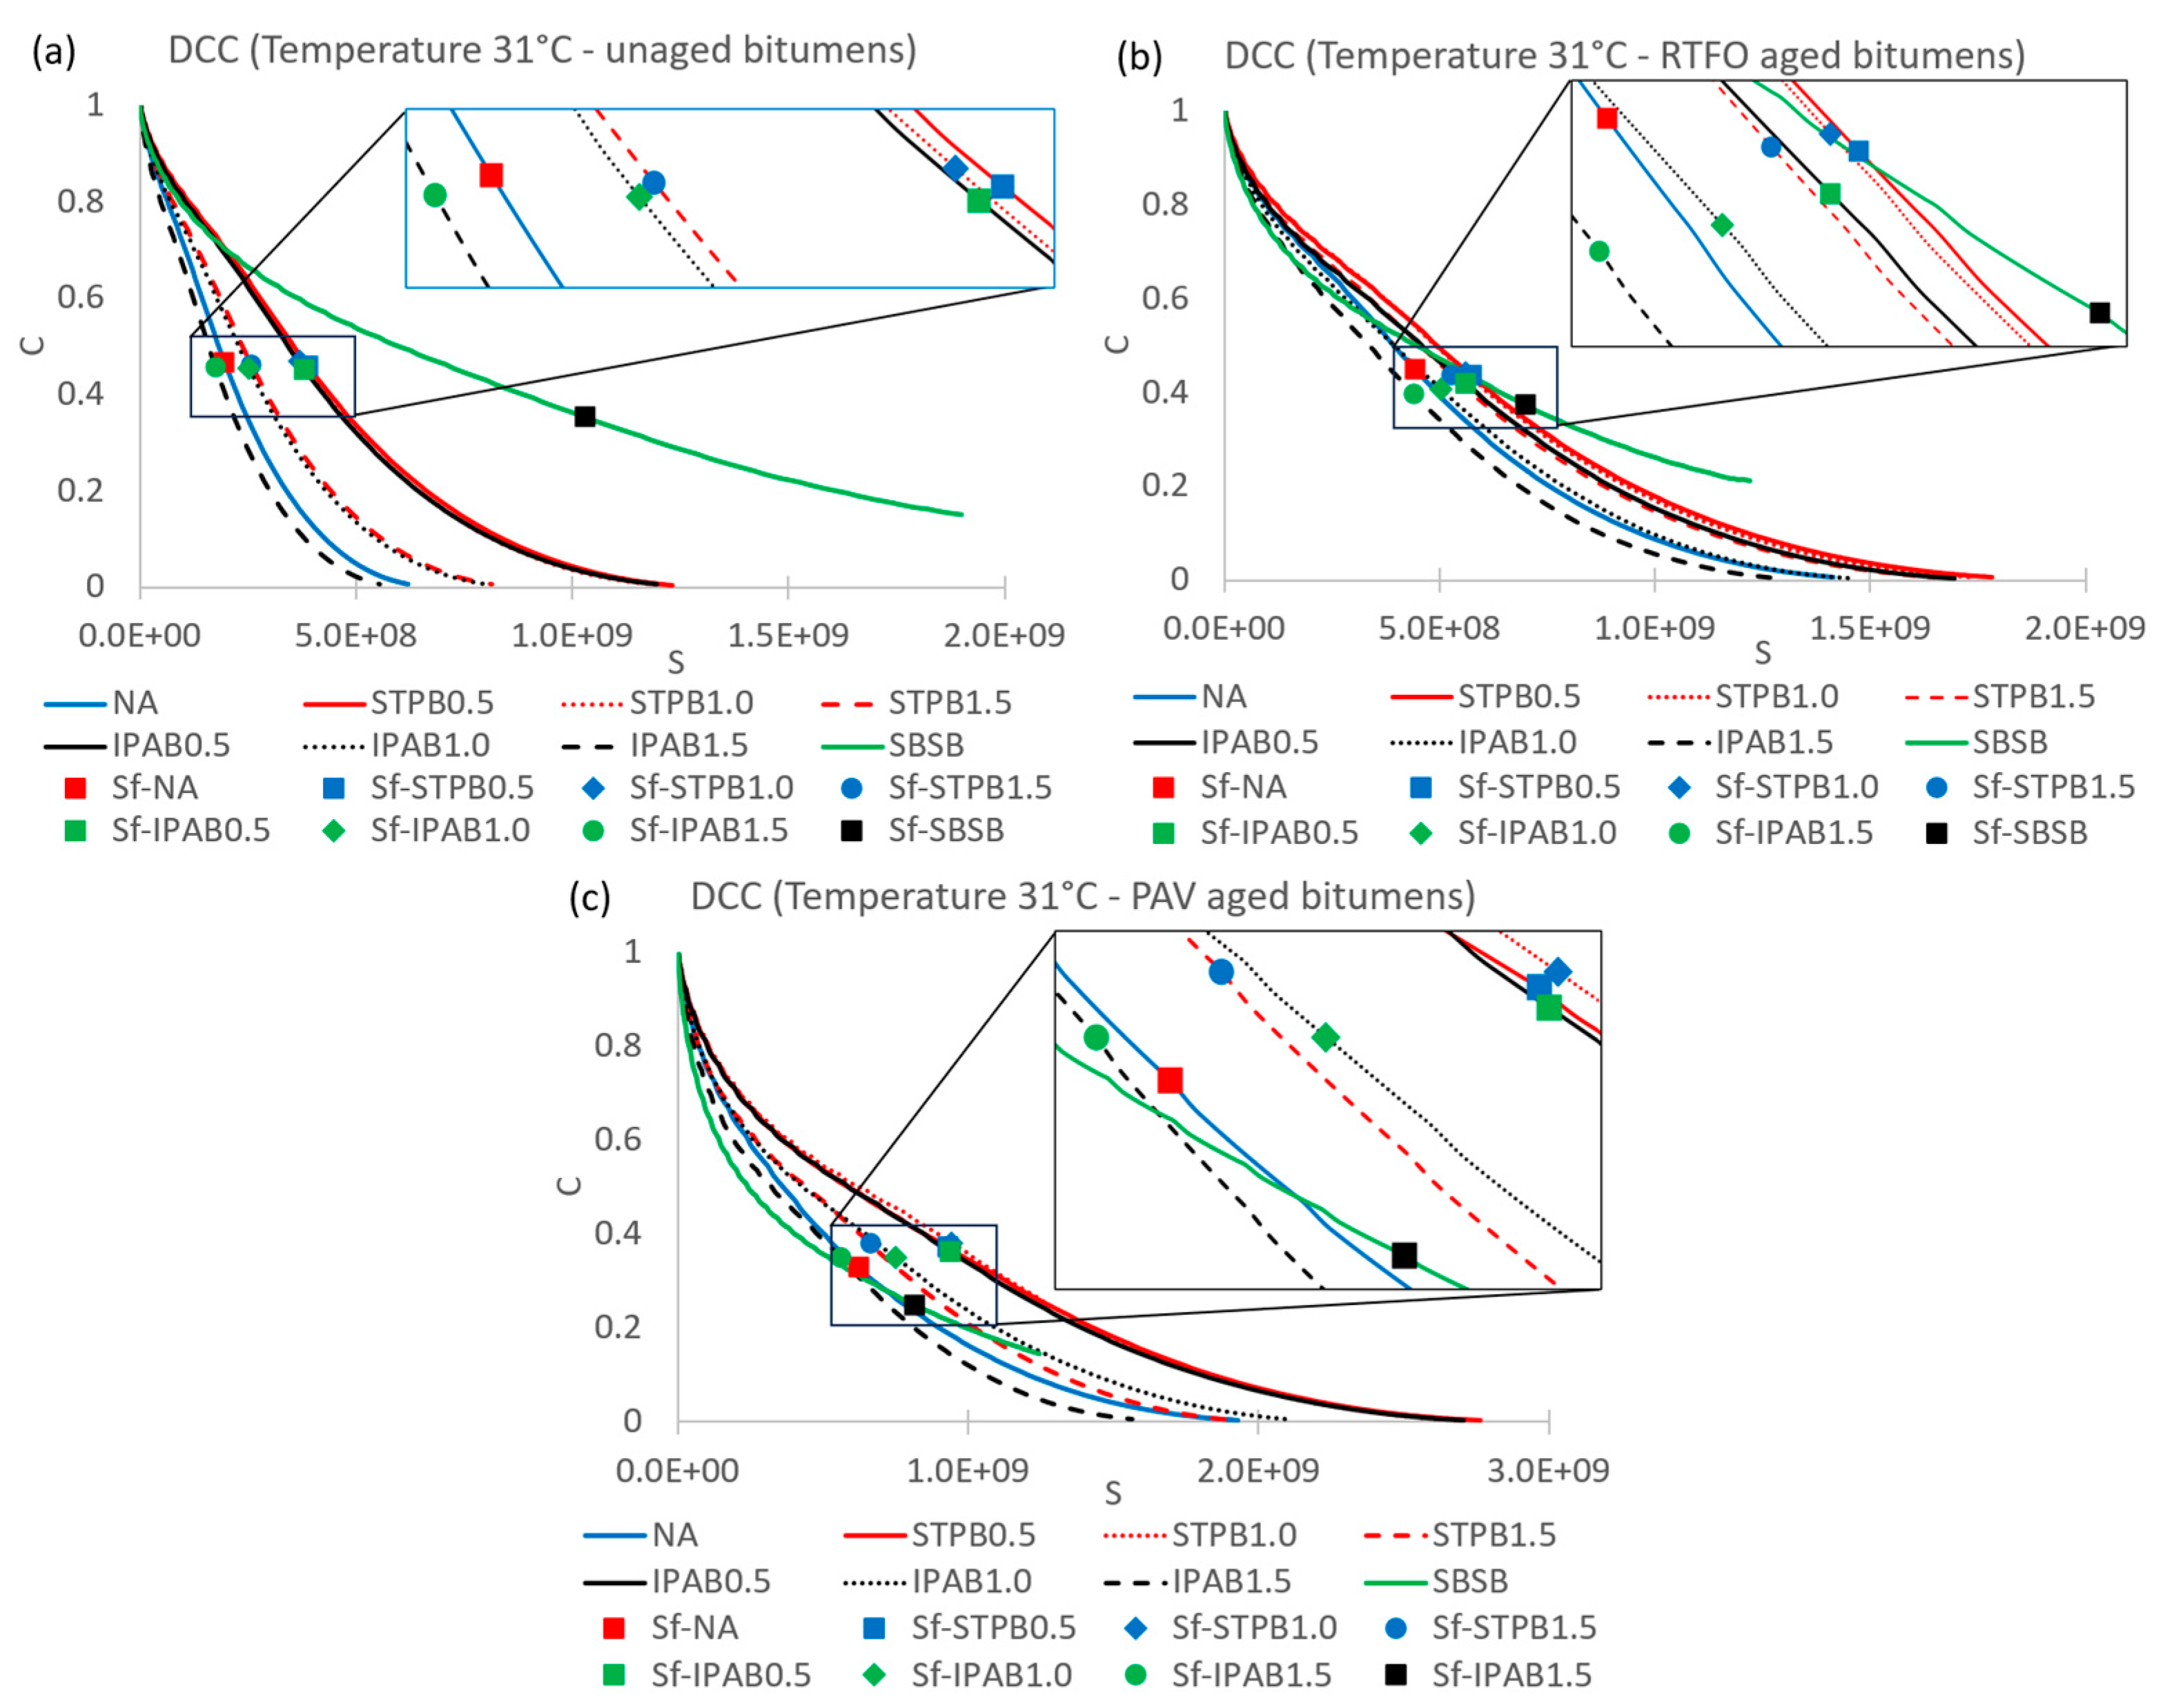
Figure 10, Figure 11 and Figure 12 illustrate DCCs with failure points ( S f ) identified by the peak of SPC at 25 °C, 28 °C, and 31 °C, respectively. Moreover, these figures are linked with test sets 1a, 1b, and 1c, respectively. Figure 10 and Figure 11 demonstrate that the bitumen that reaches the failure point at higher S f does not show greater fatigue performance in terms of DCC interpretation. For instance, Figure 10 sections a) and b), and Figure 11b exhibit SBSB with higher S f than the other asphalt binders in this study, but this bitumen fails to show superior fatigue performance concerning STPB0.5, STPB1.0, and IPAB0.5 [in Figures 10a and 11b], and compared with STPB0.5, STPB1.0, and STPB1.5 [in Figure 10 b)], in terms of DCC evaluation. Because the DCC linked with SBSB is always below the DCCs related to these bitumens in the mentioned figure sections.
Figure S11 depicts the SPC and RPC curves associated with all asphalt binders at different temperatures and aging conditions. Figure S11 sections a), b), and e) illustrate the SPC and RPC curves linked with DCCs in Figure 10 sections a) and b), and Figure 11b, respectively. Figure S11 sections a) and e) exhibit that SPC curves related to STPB0.5, STPB1.0, and IPAB0.5, even at the failure stage (after their corresponding peaks) are above the SPC curve linked with SBSB before and at its corresponding peak. This fact means that even STPB0.5, STPB1.0, and IPAB0.5 are in the failure stage can show superior fatigue performance than SBSB without reaching its failure point, according to SPC curve interpretation. Figure S11b illustrates that SPC curves related to STPB0.5, STPB1.0, and STPB1.5, although at the failure stage (at the right side of corresponding peaks) are above the SPC curve associated with SBSB before and at its corresponding peak. Hence, even STPB0.5, STPB1.0, and STPB1.5 are in the failure stage exhibit better fatigue performance than SBSB without achieving its failure point, in terms of SPC curve evaluation.
Figure 12 sections a) and b) show the SBSB with higher S f than the other bitumens. In the case of Figure 12a, SBSB exhibits greater fatigue performance in terms of C values regardless of the S values, because its corresponding DCC is generally over the other DCCs in the above-mentioned figure section. Hence, in Figure 12a the bitumen with higher S f , also exhibits the best fatigue behaviour. However, in Figure 12b even though the SBSB displays the DCC with greater S f than the other asphalt binders in this figure section, it is not clear if SBSB shows superior fatigue performance concerning the other bitumens, in terms of C values regardless of S values. Because the DCC linked with SBSB is usually below the DCCs related to STPB0.5 and STPB1.0 up to the SBSB failure point.
Figure S11 sections g) and h) depict the SPC and RPC curves associated with Figure 12 sections a) and b), respectively. In the case of Figure S11g), SBSB exhibits the SPC curve with higher S f and fatigue performance than the other bitumens in this study, because its SPC curve has its peak at the right side of the other SPC curve peaks and is mainly above the other curves related to the other asphalt binders. In Figure S11h) the SPC curve associated with SBSB shows the greatest S f because its SPC curve peak is located at the right side concerning the other SPC curve peaks. Nevertheless, in this figure section, the SPC curve linked with SBSB is generally below the SPC curves associated with STPB0.5 and STPB1.0 up to the peak of the SPC curve linked with SBSB. As a result, it is not clear whether SBSB shows superior fatigue performance or not. The findings from Figure 12 sections a) and b), and Figure S11 sections g) and h) are aligned, respectively. Hence, it is possible to conclude that bitumen with higher S f does not always exhibit greater fatigue performance.
To clarify whether SBSB exhibits superior fatigue performance or not in the above-mentioned cases, the CW concept is used. Tables S1, S5, S9, S13, S17, S21, S25, S29, and S33 (see Supplementary materials) show the CWDCC values at different temperatures and aging conditions. Tables S2, S6, S10, S14, S18, S22, S26, S30, and S34 (see Supplementary materials) show the CWSPC values at different temperatures and aging conditions. Tables S3, S7, S11, S15, S19, S23, S27, S31, and S35 (see Supplementary materials) show the ranking related to the CWDCC values at different temperatures and aging conditions, respecting each failure point. Tables S4, S8, S12, S16, S20, S24, S28, S32, and S36 (see Supplementary materials) show the ranking related to the CWSPC values at different temperatures and aging conditions, respecting each failure point. CWDCC and CWSPC are parameters proposed in this study to precisely assess the bitumen fatigue performance considering the C-S values and SPC-S values.
After comprehensively analyzing all values from the above-mentioned tables, Figure 10, Figure 11 and Figure 12 and S11, it is possible to conclude that CWDCC and CWSPC can accurately evaluate the asphalt binder fatigue performance in C vs S and SPC vs S graphs, respectively. Moreover, CWDCC and CWSPC can establish a strong correlation between C vs S and SPC vs S graphs because the rankings of bitumen fatigue performances in the former graph are the same as the rankings related to asphalt binder fatigue behaviour in the latter graph. As a result, the inconsistency between the failure definition and the fatigue performance related to DCC to rank a group of bitumens in terms of fatigue behaviour has been solved, at least for the asphalt binders and test conditions selected in this study.

3.4. Failure criterion evaluation (proposal)

Figure 13 and Figure 14 represent the new proposal of failure criterion related to RTFO-aged and PAV-aged bitumens, respectively. Figure 13 is associated with the test sets: 2a, 3a, 4a, 5a, 6a, 7a, 8a, and 9a. In the case of Figure 14 is linked with the test sets: 2b, 3b, 4b, 5b, 6b, 7b, 8b, and 9b. Figure 13 and Figure 14 exhibit strong relationships between C R and S f , regardless of bitumens and experimental conditions, because R2 values are always greater than 0.90. Hence, it is possible to confirm that the failure criterion based on the sum of all RPC values up to the failure point defined by S f can accurately predict the fatigue performance of asphalt binders under different test conditions, at least for those selected in this study. Besides, the slopes of the fitting graphs in Figure 13 and Figure 14 are generally quite similar, which means that the new proposal of failure criterion identifies a similar tendency how change the average rate of released potential cohesion during the continue LAS test. Moreover, this fact proves that the bitumen aging condition has a low influence on how changes C R values, at least for the bitumens selected in this study. In conclusion in this section, it is possible to confirm that the new proposal for the failure criterion has solved the inadequacy identified in the previous failure criterion.

4. Discussion

Section “3.1 Failure definition evaluation” confirms that asphalt binders a with greater number of loading cycles to reach the failure point ( N f ) do not always exhibit superior fatigue performance in terms of DCC evaluation. This finding is aligned with previous research works, for instance, Wang et al. [10] and Lv et al. [29]. This fact demonstrates the ranking inconsistency between the traditional failure definition (peak of stored PSE) and the fatigue behaviour according to DCC interpretation. As a result, a new failure definition has been proposed in this study to fit the above-mentioned inadequacy. After conducting a comprehensive analysis of previous failure definitions, this research team realized that most of them include the parameter “C” because material integrity has a high influence on bitumen fatigue response.
Furthermore, previous failure definitions are mainly based on the number of loading cycles, however, each loading cycle has a different effect on bitumen fatigue behaviour, which can be one of the reasons for introducing uncertainties (as above-mentioned) into the failure definition under certain conditions. One of the ways to know the effect of each loading cycle on the fatigue behaviour of asphalt binders is by analyzing the damage intensity at each loading cycle. As a result, this research team proposes the use of the parameter “S” instead of “N” in the failure definition, to better assess the bitumen fatigue performance. Hence, the new proposal of failure definition solved the ranking inconsistency of fatigue performance between the failure definition and DCC evaluation.
SBSB generally shows a lower fatigue behaviour than the other bitumens in this study, according to the DCC assessment. This phenomenon also occurred in previous studies for instance: Safaei et al. [4], Wang et al. [9], and Wang et al. [10], however, these results are not aligned with the practical use of SBSB in road construction. Besides, the PAV-aged bitumens generally exhibit superior fatigue performance than RTFO-aged asphalt binders and unaged bitumens, in terms of DCC evaluation. This finding conflicts with the actual engineering experience, but agrees with previous studies for instance: Chen and Bahia [47], Cao and Wang [15], and Zhou et al. [26]. Although this study has found these issues in the framework of the bitumen fatigue performance, their solutions are beyond the focus of this research work. The main objective of this study is to solve the ranking inconsistency between failure definition and DCC analysis. This scenario leads to this research team expecting in the near future some modifications in the S-VECD model formulation to determine C and S values. However, the newly proposed failure definition should continue to be effective in identifying the failure point, because it is based on the calculated C and S values, not on the equation to determine those parameters. Another problem solved by the newly proposed failure definition is that in some cases the previous failure definition could not identify the failure point because the stored PSE curve lacks a peak. (always increases).
It is interesting to comment that almost all bitumens in this study exhibit their best fatigue performance at 28°C in terms of DCC evaluation, regardless of the aging condition. This phenomenon leads this research team to infer that there might be a temperature at which each asphalt binder shows its best fatigue performance in terms of DCC interpretation. This finding conflicts with the previous research work Wang et al. [10] and is aligned with Chen et al. [34], in terms of TTSP. After a comprehensive analysis, this research team considers that both studies may be right because the TTSP should be applicable at a temperature range lower or higher than the specific temperature which causes the best bitumen fatigue performance in terms of DCC assessment. Because this specific temperature should change the movement tendency of DCCs when increasing or decreasing the test temperature. However, more experimental tests are needed to prove this theory.
Previous failure criterion based on the TRPSE in terms of the area under the released PSE curve up to the failure point failed to be a useful tool to predict the bitumen fatigue performance under any type of conditions because in some cases R2 values were low. Although, the stored PSE is a suitable tool to evaluate bitumen capacity to store more energy in the form of loading amplitude (energy input), while conducting the continue LAS, under certain conditions fails to identify the bitumen failure point, as mentioned before. This fact should introduce some uncertainties in the above-mentioned failure criterion, which causes low R2 values in some specific cases. The newly proposed failure criterion solved this problem because considers a failure definition that was able to identify the failure points where the previous failure definition could not. As a result, the new proposal of failure criterion based on the sum of all RPC values up to the failure point defined by S f can accurately predict the fatigue performance of asphalt binders under different test conditions, at least for those selected in this study.
As mentioned before, bitumen fatigue characterization by utilizing the S-VECD model is composed of three elements based on linear viscoelastic (LVE) responses, DCC properties, and failure criterion determination. Hence, the fatigue behaviour assessment of bituminous materials should include these mentioned elements to reach the final conclusion [10]. The new framework (new failure definition and failure criterion) proposed in this study included all elements defined by Wang et al. [10]. Tables S11, S23, and S35 show the ranking of CWDCC of PAV-aged bitumens concerning each failure point at 25 °C, 28 °C, and 31 °C, respectively, and consistent with Tables S12, S24, and S36 show the ranking of CWSPC of PAV-aged bitumens respect to each failure point at 25 °C, 28 °C, and 31 °C, respectively. STPB0.5, STPB1.0 and IPAB0.5 are always the top three asphalt binders in the ranking. This fact means that these asphalt binders exhibit the three best fatigue performances if the temperature ranges from 25 °C to 31 °C, in terms of SPC curve and DCC analysis.
Figure S12 shows the new proposal for failure criterion related to all PAV-aged bitumens. The slopes of the fitting graphs in Figure S12 are generally alike, which means that the new proposal of failure criterion identifies comparable tendencies of how changes the average rate of RPC while conducting the continue LAS test. In the case of the fitting graphs related to STPB1.0, IPAB0.5, and STPB0.5 are mostly similar, nonetheless the former and the latter exhibit the higher and the lower average rate of RPC (inside this small group of bitumens), respectively. This fact means that STPB1.0, and STPB0.5 lose more rapidly and slower the bitumen capacity to keep its integrity, respectively. Table 7 shows the sum of rankings of PAV-aged bitumens (STPB0.5, STPB1.0, and IPAB0.5) related to failure definition (based on the CWDCC and CWSPC) and failure criterion. To obtain a balance between both parameters and decide which bitumens is the best according to the selected test conditions. Bitumens with the lower and higher sum of rankings exhibit greater and poorer fatigue performance according to both parameters at the same time, respectively. From Table 7 is possible to notice that PAV-STPB0.5 and PAV-IPAB0.5 exhibit lower and higher sum of rankings, respectively. This fact means that the former shows the greater and the latter the poorer fatigue performance among the above three mentioned bitumens, respectively. Hence the best bitumen in this study, according to failure definition, failure criterion and test conditions is STPB0.5.
Future research works will focus on addressing the above-mentioned inconsistency between SBSB fatigue cracking performance in terms of DCC analysis and the practical engineering use of SBSB in road construction. Another focus of future studies will be on addressing the inadequacy between the fatigue cracking performance of PAV-aged bitumens and the behaviour of asphalt binders with less level of aging. Because the former group of bitumens showed superior fatigue performance than the latter group in terms of DCC assessment, which is not aligned with the practical experience in road construction. In addition, future research work-line will investigate the existence of a specific temperature (different from one asphalt binder to another) that ensures the best fatigue cracking performance of each bitumen in terms of DCC analysis, considering the findings in this study. Besides, the capacity of the proposed new framework in this study to assess the self-restoration performance of different types of asphalt binders will be assessed.

Supplementary Materials

The following supporting information can be downloaded at: www.mdpi.com/xxx/s1, Figure S1: Stored PSE curves of bitumens at different temperatures and aging conditions: a) T25°C – unaged, b) T25°C – RTFO aged, c) T25°C – PAV aged, d) T28°C – unaged, e) T28°C – RTFO aged, f) T28°C – PAV aged, g) T31°C – unaged, h) T31°C – RTFO aged, i) T31°C – PAV aged. Figure S2: DCCs of NA at different temperatures and aging conditions: a) unaged NA – T25, T28, T31 b) RTFO-aged NA – T25, T28, T31 c) PAV-aged NA – T25, T28, T31 d) T25 – unaged NA, RTFO-aged NA, PAV-aged NA e) T28 – unaged NA, RTFO-aged NA, PAV-aged NA f) T31 – unaged NA, RTFO-aged NA, PAV-aged NA. Figure S3: DCCs of STPB0.5 at different temperatures and aging conditions: a) unaged STPB0.5 – T25, T28, T31 b) RTFO-aged STPB0.5 – T25, T28, T31 c) PAV-aged STPB0.5 – T25, T28, T31 d) T25 – unaged STPB0.5, RTFO-aged STPB0.5, PAV-aged STPB0.5 e) T28 – unaged STPB0.5, RTFO-aged STPB0.5, PAV-aged STPB0.5 f) T31 – unaged STPB0.5, RTFO-aged STPB0.5, PAV-aged STPB0.5. Figure S4: DCCs of STPB1.0 at different temperatures and aging conditions: a) unaged STPB1.0 – T25, T28, T31 b) RTFO-aged STPB1.0 – T25, T28, T31 c) PAV-aged STPB1.0 – T25, T28, T31 d) T25 – unaged STPB1.0, RTFO-aged STPB1.0, PAV-aged STPB1.0 e) T28 – unaged STPB1.0, RTFO-aged STPB1.0, PAV-aged STPB1.0 f) T31 – unaged STPB1.0, RTFO-aged STPB1.0, PAV-aged STPB1.0. Figure S5: DCCs of STPB1.5 at different temperatures and aging conditions: a) unaged STPB1.5 – T25, T28, T31 b) RTFO-aged STPB1.5 – T25, T28, T31 c) PAV-aged STPB1.5 – T25, T28, T31 d) T25 – unaged STPB1.5, RTFO-aged STPB1.5, PAV-aged STPB1.5 e) T28 – unaged STPB1.5, RTFO-aged STPB1.5, PAV-aged STPB1.5 f) T31 – unaged STPB1.5, RTFO-aged STPB1.5, PAV-aged STPB1.5. Figure S6: DCCs of IPAB0.5 at different temperatures and aging conditions: a) unaged IPAB0.5 – T25, T28, T31 b) RTFO-aged IPAB0.5 – T25, T28, T31 c) PAV-aged IPAB0.5 – T25, T28, T31 d) T25 – unaged IPAB0.5, RTFO-aged IPAB0.5, PAV-aged IPAB0.5 e) T28 – unaged IPAB0.5, RTFO-aged IPAB0.5, PAV-aged IPAB0.5 f) T31 – unaged IPAB0.5, RTFO-aged IPAB0.5, PAV-aged IPAB0.5. Figure S7: DCCs of IPAB1.0 at different temperatures and aging conditions: a) unaged IPAB1.0 – T25, T28, T31 b) RTFO-aged IPAB1.0 – T25, T28, T31 c) PAV-aged IPAB1.0 – T25, T28, T31 d) T25 – unaged IPAB1.0, RTFO-aged IPAB1.0, PAV-aged IPAB1.0 e) T28 – unaged IPAB1.0, RTFO-aged IPAB1.0, PAV-aged IPAB1.0 f) T31 – unaged IPAB1.0, RTFO-aged IPAB1.0, PAV-aged IPAB1.0. Figure S8: DCCs of IPAB1.5 at different temperatures and aging conditions: a) unaged IPAB1.5 – T25, T28, T31 b) RTFO-aged IPAB1.5 – T25, T28, T31 c) PAV-aged IPAB1.5 – T25, T28, T31 d) T25 – unaged IPAB1.5, RTFO-aged IPAB1.5, PAV-aged IPAB1.5 e) T28 – unaged IPAB1.5, RTFO-aged IPAB1.5, PAV-aged IPAB1.5 f) T31 – unaged IPAB1.5, RTFO-aged IPAB1.5, PAV-aged IPAB1.5. Figure S9: DCCs of SBSB at different temperatures and aging conditions: a) unaged SBSB – T25, T28, T31 b) RTFO-aged SBSB – T25, T28, T31 c) PAV-aged SBSB – T25, T28, T31 d) T25 – unaged SBSB, RTFO-aged SBSB, PAV-aged SBSB e) T28 – unaged SBSB, RTFO-aged SBSB, PAV-aged SBSB f) T31 – unaged SBSB, RTFO-aged SBSB, PAV-aged SBSB. Figure S10: Failure definition points identified by the peak of WR (Nf) and the peak of SPC (Sf) on WR curve: a) T 25°C - unaged bitumens, a-1) zoom [peaks of PSE curves in a)], b) T 25°C – RTFO aged bitumens, b-1) zoom [peaks of PSE curves in b)], c) T 25°C – PAV aged bitumens, c-1) zoom [peaks of PSE curves in c)], d) T 28°C - unaged bitumens, d-1) zoom [peaks of PSE curves in d)], e) T 28°C – RTFO aged bitumens, e-1) zoom [peaks of PSE curves in e)], f) T 28°C – PAV aged bitumens, f-1) zoom [peaks of PSE curves in f)], g) T 31°C - unaged bitumens, g-1) zoom [peaks of PSE curves in g)], h) T 31°C – RTFO aged bitumens, h-1) zoom [peaks of PSE curves in h)], i) T 31°C – PAV aged bitumens, i-1) zoom [peaks of PSE curves in i)]. Figure S11: SPC and RPC curves of bitumens: a) T 25°C - unaged bitumens, b) T 25°C – RTFO aged bitumens, c) T 25°C – PAV aged bitumens, d) T 28°C - unaged bitumens, e) T 28°C – RTFO aged bitumens, f) T 28°C – PAV aged bitumens, g) T 31°C - unaged bitumens, h) T 31°C – RTFO aged bitumens, i) T 31°C – PAV aged bitumens. Figure S12: CR vs Sf graph of all PAV aged bitumens. Table S1: CWDCC of unaged bitumens at each failure point (25 °C). Table S2: CWSPC of unaged bitumens at each failure point (25 °C). Table S3: Ranking of CWDCC of unaged bitumens respect to each failure point (25 °C). Table S4: Ranking of CWSPC of unaged bitumens respect to each failure point (25 °C). Table S5: CWDCC of RTFO aged bitumens at each failure point (25 °C). Table S6: CWSPC of RTFO aged bitumens at each failure point (25 °C). Table S7: Ranking of CWDCC of RTFO aged bitumens respect to each failure point (25 °C). Table S8: Ranking of CWSPC of RTFO aged bitumens respect to each failure point (25 °C). Table S9: CWDCC of PAV aged bitumens at each failure point (25 °C). Table S10: CWSPC of PAV aged bitumens at each failure point (25 °C). Table S11: Ranking of CWDCC of PAV aged bitumens respect to each failure point (25 °C). Table S12: Ranking of CWSPC of PAV aged bitumens respect to each failure point (25 °C). Table S13: CWDCC of unaged bitumens at each failure point (28 °C). Table S14: CWSPC of unaged bitumens at each failure point (28 °C). Table S15: Ranking of CWDCC of unaged bitumens respect to each failure point (28 °C). Table S16: Ranking of CWSPC of unaged bitumens respect to each failure point (28 °C). Table S17: CWDCC of RTFO aged bitumens at each failure point (28 °C). Table S18: CWSPC of RTFO aged bitumens at each failure point (28 °C). Table S19: Ranking of CWDCC of RTFO aged bitumens respect to each failure point (28 °C). Table S20: Ranking of CWSPC of RTFO aged bitumens respect to each failure point (28 °C). Table S21: CWDCC of PAV aged bitumens at each failure point (28 °C). Table S22: CWSPC of PAV aged bitumens at each failure point (28 °C). Table S23: Ranking of CWDCC of PAV aged bitumens respect to each failure point (28 °C). Table S24: Ranking of CWSPC of PAV aged bitumens respect to each failure point (28 °C). Table S25: CWDCC of unaged bitumens at each failure point (31 °C). Table S26: CWSPC of unaged bitumens at each failure point (31 °C). Table S27: Ranking of CWDCC of unaged bitumens respect to each failure point (31 °C). Table S28: Ranking of CWSPC of unaged bitumens respect to each failure point (31 °C). Table S29: CWDCC of RTFO aged bitumens at each failure point (31 °C). Table S30: CWSPC of RTFO aged bitumens at each failure point (31 °C). Table S31: Ranking of CWDCC of RTFO aged bitumens respect to each failure point (31 °C). Table S32: Ranking of CWSPC of RTFO aged bitumens respect to each failure point (31 °C). Table S33: CWDCC of PAV aged bitumens at each failure point (31 °C). Table S34: CWSPC of PAV aged bitumens at each failure point (31 °C). Table S35: Ranking of CWDCC of PAV aged bitumens respect to each failure point (31 °C). Table S36: Ranking of CWSPC of PAV aged bitumens respect to each failure point (31 °C).

Author Contributions

Conceptualization, S.L., D.G. and M.B.C.; methodology, M.B.C.; software, M.B.C., validation, M.B.C., formal analysis, M.B.C.; investigation, S.C., D.L. and W.Z.; resources, S.L., D.G., C.L and M.B.C.; data curation, M.B.C.; writing—original draft preparation, M.B.C. and C.L; writing—review and editing, M.B.C. and C.L; visualization, S.L., D.G. and M.B.C.; supervision, S.L., D.G. and M.B.C.; project administration, S.L., D.G. and M.B.C.; funding acquisition, S.L., D.G., C.L and M.B.C. All authors have read and agreed to the published version of the manuscript.

Funding

This research was funded by Key Laboratory of Road Structure and Material of Ministry of Transport (Changsha), Changsha University of Science & Technology, grant number kfj220305.

Data Availability Statement

Not applicable.

Conflicts of Interest

The authors declare no conflict of interest.

References

  1. Wen, H.; Kim, Y.R. Simple performance test for fatigue cracking and validation with WesTrack mixtures. Transp. Res. Rec. 2002, 1789, 66–72. [Google Scholar] [CrossRef]
  2. Zeiada, W.A.; Souliman, M.I.; Kaloush, K.E.; Mamlouk, M.; Underwood, B.S. Comparison of fatigue damage, healing, and endurance limit with beam and uniaxial fatigue tests. Transp. Res. Rec. 2014, 2447, 32–41. [Google Scholar] [CrossRef]
  3. Motamed, A.; Bhasin, A.; Izadi, A. Evaluating Fatigue-Cracking Resistance of Asphalt Binders in a Standardized Composite Using Continuum Damage Theory. J. Mater. Civ. Eng. 2013, 25, 1209–1219. [Google Scholar] [CrossRef]
  4. Safaei, F.; Castorena, C.; Kim, Y.R. Linking asphalt binder fatigue to asphalt mixture fatigue performance using viscoelastic continuum damage modeling. Mech. Time-Depend. Mater. 2016, 20, 299–323. [Google Scholar] [CrossRef]
  5. Zhang, Z.; Oeser, M. Energy dissipation and rheological property degradation of asphalt binder under repeated shearing with different oscillation amplitudes. Int. J. Fatigue 2021, 152, 106417. [Google Scholar] [CrossRef]
  6. AASHTO, TP 101-14. Estimating Damage Tolerance of Asphalt Binders Using the Linear Amplitude Sweep. Washington, DC, 2014.
  7. Hintz, C.; Bahia, H. Simplification of Linear Amplitude Sweep Test and Specification Parameter. Transp. Res. Rec. 2013, 2370, 10–16. [Google Scholar] [CrossRef]
  8. Hintz, C.; Velasquez, R.; Johnson, C.; Bahia, H. Modification and validation of linear amplitude sweep test for binder fatigue specification. Transp. Res. Rec. 2011, 2207, 99–106. [Google Scholar] [CrossRef]
  9. Wang, C.; Castorena, C.; Zhang, J.; Kim, Y.R. Unified failure criterion for asphalt binder under cyclic fatigue loading. Road Mater. Pavement Des. 2015, 16, 1–25. [Google Scholar] [CrossRef]
  10. Wang, C.; Castrorena, C.; Zhang, J.; Kim, Y.R. Application of Time-Temperature Superposition Principle on Fatigue Failure Analysis of Asphalt Binder. J. Mater. Civ. Eng. 2017, 29, 1–9. [Google Scholar] [CrossRef]
  11. Ameri, M.; Mansourkhaki, A.; Daryaee, D. Evaluation of fatigue behavior of asphalt binders containing reclaimed asphalt binder using simplified viscoelastic continuum damage approach. Constr. Build. Mater. 2019, 202, 374–386. [Google Scholar] [CrossRef]
  12. Roque, R.; Yan, Y.; Lopp, G. Cracking Performance Evaluation of Asphalt Binders At Intermediate Temperature. University of Florida and Florida Department of Transportation. Contract No. BDV31-977-83. Final Report., 2020.
  13. Schapery, R.A. Correspondence principles and a generalized J integral for large deformation and fracture analysis of viscoelastic media. Int. J. Fract. 1984, 25, 195–223. [Google Scholar] [CrossRef]
  14. Park, S.W.; Kim, Y.R.; Schapery, R.A. A viscoelastic continuum damage model and its application to uniaxial behavior of asphalt concrete. Mech. Mater. 1996, 24, 241–255. [Google Scholar] [CrossRef]
  15. Cao, W.; Wang, C. A new comprehensive analysis framework for fatigue characterization of asphalt binder using the Linear Amplitude Sweep test. Constr. Build. Mater. 2018, 171, 1–12. [Google Scholar] [CrossRef]
  16. Moreno-Navarro, F.; Ayar, P.; Sol-Sánchez, M.; Rubio-Gámez, M.C. Exploring the recovery of fatigue damage in bituminous mixtures at macro-crack level: the influence of temperature, time, and external loads. Road Mater. Pavement Des. 2017, 18, 293–303. [Google Scholar] [CrossRef]
  17. Babadopulos, L.F.d.A.L.; Orozco, G.; Sauzéat, C.; Di Benedetto, H. Reversible phenomena and fatigue damage during cyclic loading and rest periods on bitumen. Int. J. Fatigue 2019, 124, 303–314. [Google Scholar] [CrossRef]
  18. Hicks, R.G.; Finn, F.N.; Monismith, C.L.; Leahy, R.B. Validation of SHRP binder specification through mix testing. J. Assoc. Asph. Paving Technol. 1993, 62, 565–614. [Google Scholar]
  19. Kim, Y.R.; Lee, H.J.; Little, D.N. Fatigue characterization of asphalt concrete using viscoelasticity and continuum damage theory. J. Assoc. Asph. Paving Technol. 1997, 66, 520–569. [Google Scholar]
  20. Bonnetti, K.S.; Nam, K.; Bahia, H.U. Measuring and defining fatigue behavior of asphalt binders. Transp. Res. Rec. 2002, 1810, 33–43. [Google Scholar] [CrossRef]
  21. Johnson, C.M. Estimating Asphalt Binder Fatigue Resistance Using an Accelerated Test Method. Ph.D. Dissertation, University of Wisconsin—Madison, Madison, WI, USA, 2010. [Google Scholar]
  22. Safaei, F.; Lee, J.; Nascimento, L.A.H.D.; Hintz, C.; Kim, Y.R. Implications of Warm-Mix asphalt on long term oxidative aging and fatigue performance of asphalt binders and mixtures. Road Mater. Pavement Des. 2014, 15, 45–61. [Google Scholar] [CrossRef]
  23. Reese, R. Properties of aged asphalt binder related to asphalt concrete fatigue life. J. Assoc. Asph. Paving Technol. 1997, 66, 604–632. [Google Scholar]
  24. Masad, E.; Castelo Branco, V.T.F.; Little, D.N.; Lytton, R. A unified method for the analysis of controlled-strain and controlled-stress fatigue testing. Int. J. Pavement Eng. 2008, 9, 233–246. [Google Scholar] [CrossRef]
  25. Sabouri, M.; Kim, Y.R. Development of a failure criterion for asphalt mixtures under different modes of fatigue loading. Transp. Res. Rec. 2014, 2447, 117–125. [Google Scholar] [CrossRef]
  26. Zhou, F.; Karki, P.; Im, S. Development of a Simple Fatigue Cracking Test for Asphalt Binders. Transp. Res. Rec. 2017, 2632, 79–87. [Google Scholar] [CrossRef]
  27. Zhang, R.; Sias, J.E.; Dave, E.V. Development of new performance indices to evaluate the fatigue properties of asphalt binders with ageing. Road Mater. Pavement Des. 2020, 23, 377–396. [Google Scholar] [CrossRef]
  28. Yan, Y.; Hernando, D.; Park, B.; Allen, C.; Roque, R. Understanding asphalt binder cracking characterization at intermediate temperatures: Review and evaluation of two approaches. Constr. Build. Mater. 2021, 312. [Google Scholar] [CrossRef]
  29. Cabrera, M.B.; Lv, S.; Ge, D.; Wang, Z.; Wang, J.; Liu, J.; Ju, Z.; Peng, X.; Fan, X.; Cao, S.; et al. Performance Assessment of Self-Healing Polymer-Modified Bitumens by Evaluating the Suitability of Current Failure Definition, Failure Criterion, and Fatigue-Restoration Criteria. Materials 2023, 16, 2488. [Google Scholar] [CrossRef] [PubMed]
  30. Safaei, F.; Castorena, C. Temperature effects of linear amplitude sweep testing and analysis. Transp. Res. Rec. 2016, 2574, 92–100. [Google Scholar] [CrossRef]
  31. Zhang, J. Development of Failure Criteria for Asphalt Concrete Mixtures under Fatigue Loading. Master’s Thesis, North Carolina State University, Raleigh, NC, USA, 2012. [Google Scholar]
  32. Zhang, J.; Sabouri, M.; Guddati, M.N.; Kim, Y.R. Development of a failure criterion for asphalt mixtures under fatigue loading. J. Assoc. Asph. Paving Technol. 2013, 82, 1–22. [Google Scholar] [CrossRef]
  33. Wang, C.; Xie, W.; Chen, Y.; Diab, A.; You, Z. Refining the Calculation Method for Fatigue Failure Criterion of Asphalt Binder from Linear Amplitude Sweep Test. J. Mater. Civ. Eng. 2018, 30, 1–11. [Google Scholar] [CrossRef]
  34. Chen, H.; Zhang, Y.; Bahia, H.U. Estimating asphalt binder fatigue at multiple temperatures using a simplified pseudo-strain energy analysis approach in the LAS test. Constr. Build. Mater. 2021, 266. [Google Scholar] [CrossRef]
  35. Sun, G.; Ma, J.; Sun, D.; Li, B.; Ling, S.; Lu, T. Influence of thermal oxidative aging on temperature induced self-healing transition of polymer modified bitumens Mater. Design 2020, 192. [Google Scholar] [CrossRef]
  36. Zhang, T.; Gao, S.; Yu, J.; He, Y.; Han, X.; Zhuang, R. Preparation and performance of self-healing SBS modified bitumen based on dynamic disulfide bonds. Constr. Build. Mater. 2023, 397. [Google Scholar] [CrossRef]
  37. Yousif, R.A.; Tayh, S.A.; Al-Saadi, I.F.; Jasim, A.F. Physical and Rheological Properties of Asphalt Binder Modified with Recycled Fibers. Adv. Civ. Eng. 2022, 2022. [Google Scholar] [CrossRef]
  38. Kök, B.V.; Çolak, H. Laboratory comparison of the crumb-rubber and SBS modified bitumen and hot mix asphalt. Constr. Build. Mater. 2011, 25, 3204–3212. [Google Scholar] [CrossRef]
  39. Sun, P.; Zhang, K.; Xiao, Y.; Liang, Z. Analysis of Pavement Performance for Nano-CaCO3/SBS Modified Asphalt Mixture. J. Phys. Conf. Ser. 2022, 2329. [Google Scholar] [CrossRef]
  40. Li, X.; Guo, D.; Xu, M.; Guo, C.; Wang, D. REOB/SBS Composite-Modified Bitumen Preparation and Modification Mechanism Analysis. Buildings 2023, 13, 1601. [Google Scholar] [CrossRef]
  41. Zhang, W.; Zou, L.; Chen, F.; Yang, C.; Li, Y.; Yan, X.; Zang, J.; Liu, J. Evaluation method of storage stability of SBS modified bitumen based on dynamic rheological properties. Constr. Build. Mater. 2022, 323. [Google Scholar] [CrossRef]
  42. Li, Y.; Li, W.; Sun, A.; Jing, M.; Liu, X.; Wei, L.; Wu, K.; Fu, Q. A self-reinforcing and self-healing elastomer with high strength, unprecedented toughness and room-temperature reparability. Mater. Horiz. 2020, 8, 267–275. [Google Scholar] [CrossRef]
  43. Wang, D.P.; Zhao, Z.H.; Li, C.H. Universal Self-Healing Poly(dimethylsiloxane) Polymer Crosslinked Predominantly by Physical Entanglements. ACS Appl. Mater. Interfaces 2021, 13, 31129–31139. [Google Scholar] [CrossRef]
  44. Yang, S.; Ji, J.; Tao, H.; Muhammad, Y.; Huang, J.; Wang, S.; Wei, Y.; Li, J. Fabrication of urea formaldehyde–epoxy resin microcapsules for the preparation of high self-healing ability containing SBS modified asphalt. Polym. Compos. 2021, 42, 4128–4137. [Google Scholar] [CrossRef]
  45. Aurilio, R.M.; Aurilio, M.; Baaj, H. The effect of a chemical warm mix additive on the self-healing capability of bitumen. J. Test. Eval. 2022, 50. [Google Scholar] [CrossRef]
  46. Xie, W.; Castorena, C.; Wang, C.; Kim, Y.R. A framework to characterize the healing potential of asphalt binder using the linear amplitude sweep test. Constr. Build. Mater. 2017, 154, 771–779. [Google Scholar] [CrossRef]
  47. Chen, H.; Bahia, H.U. Modelling effects of aging on asphalt binder fatigue using complex modulus and the LAS test. Int. J. Fatigue 2021, 146. [Google Scholar] [CrossRef]
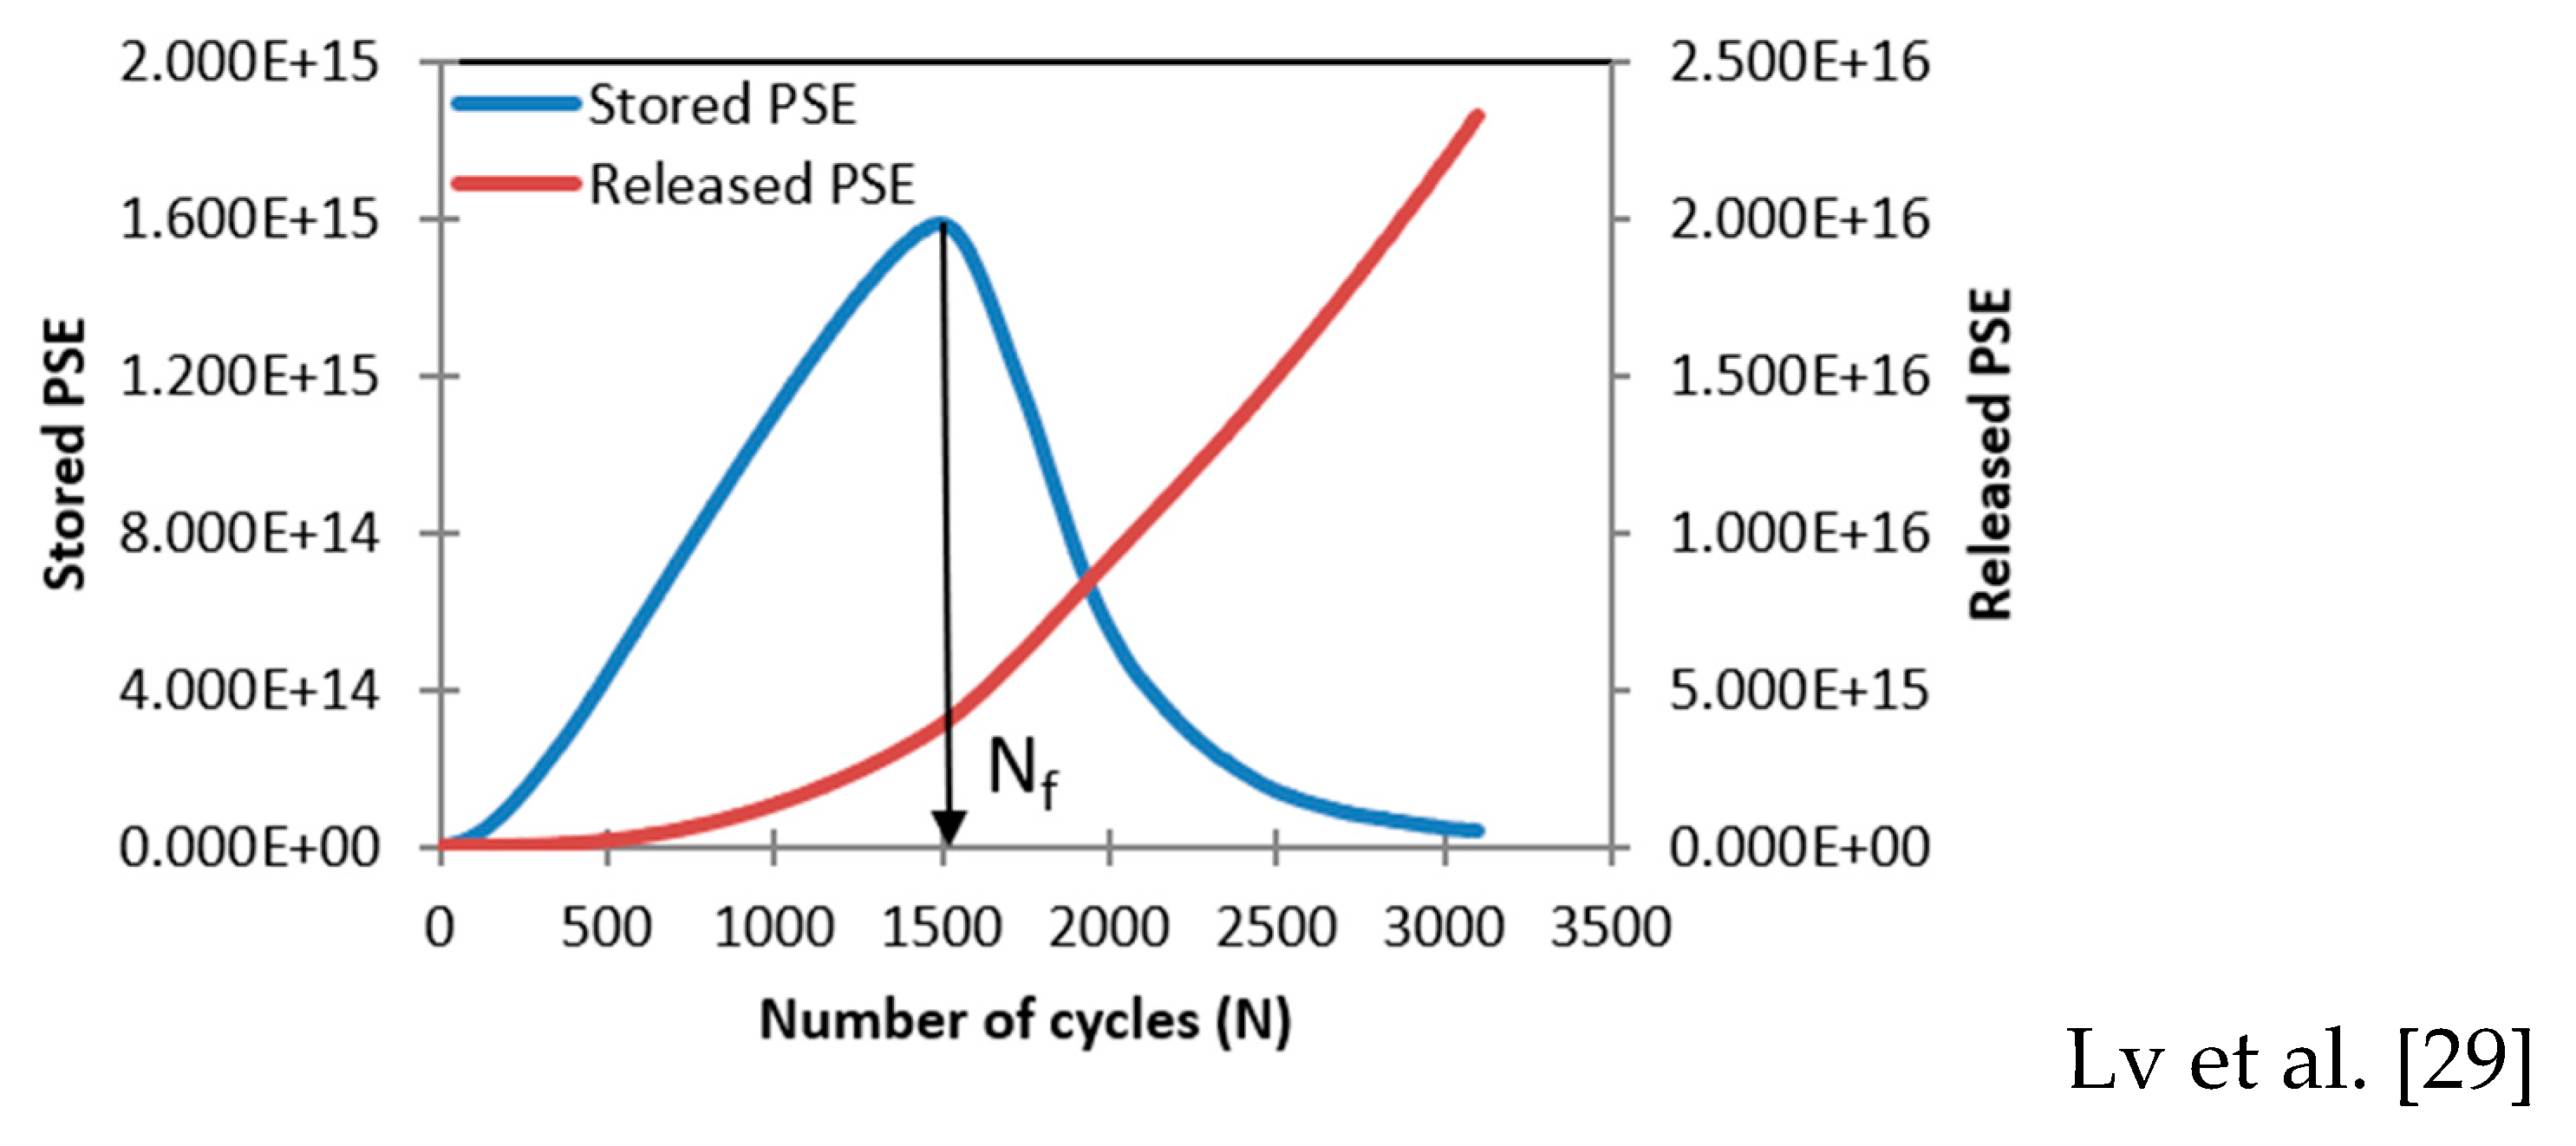
Figure 1. PSE-based failure definition.
Preprints 91765 g001
Figure 2. Representation of imaginary and real DCC.
Preprints 91765 g002
Figure 3. Potential cohesion representation.
Preprints 91765 g003
Figure 4. Stored and released potential cohesion graphs.
Preprints 91765 g004
Figure 5. DCCs of bitumens related to 25 °C at different aging conditions: (a) Unaged bitumens, (b) RTFO aged bitumens, (c) PAV aged bitumens.
Preprints 91765 g005aPreprints 91765 g005b
Figure 6. DCCs of bitumens related to 28 °C at different aging conditions: (a) Unaged bitumens, (b) RTFO aged bitumens, (c) PAV aged bitumens.
Preprints 91765 g006
Figure 7. DCCs of bitumens related to 31 °C at different aging conditions: (a) Unaged bitumens, (b) RTFO aged bitumens, (c) PAV aged bitumens.
Preprints 91765 g007aPreprints 91765 g007b
Figure 8. GR vs Nf graph of RTFO aged bitumens: (a) NA and SBSB, (b) STPB 0.5-1.0-1.5, (c) IPAB 0.5-1.0-1.5.
Preprints 91765 g008
Figure 9. GR vs Nf graph of PAV aged bitumens: (a) NA and SBSB, (b) STPB 0.5-1.0-1.5, (c) IPAB 0.5-1.0-1.5.
Preprints 91765 g009aPreprints 91765 g009b
Figure 10. DCCs with failure points identified by the peak of SPC at 25°C: (a) Unaged bitumens, (b) RTFO aged bitumens, (c) PAV aged bitumens.
Preprints 91765 g010
Figure 11. DCCs with failure points identified by the peak of SPC at 28°C: (a) Unaged bitumens, (b) RTFO aged bitumens, (c) PAV aged bitumens.
Preprints 91765 g011
Figure 12. DCCs with failure points identified by the peak of SPC at 31°C: (a) Unaged bitumens, (b) RTFO aged bitumens, (c) PAV aged bitumens.
Preprints 91765 g012
Figure 13. CR vs Sf graph of RTFO aged bitumens: (a) NA and SBSB, (b) STPB 0.5-1.0-1.5, (c) IPAB 0.5-1.0-1.5.
Preprints 91765 g013
Figure 14. CR vs Sf graph of PAV aged bitumens: (a) NA and SBSB, (b) STPB 0.5-1.0-1.5, (c) IPAB 0.5-1.0-1.5.
Preprints 91765 g014
Table 1. Physical properties of NA.
Test Standard value Measured value Standard test
Penetration (25°C, 5s, 100g) (0.1mm) 60 ~ 80 64.0 T0604
PI -1.5 ~ 1.0 -1.2 T0604
Softening point (°C) ≥ 46 48.5 T0606
Viscosity (60°C) (Pa*s) ≥ 180 237 T0620
Ductility (10°C) ≥ 15 25 T0605
Ductility (15°C) ≥ 100 >150 T0605
Wax content (%) ≤ 2.2 1.8 T0615
Flash point (°C) ≥ 260 >300 T0611
Solubility (%) ≥99.5 99.91 T0607
Density (15°C) (g/cm3) - 1.040 T0603
After the RTFO:
Mass change
Residual penetration ratio (%)
Residual ductility (10°C) (cm)

≤ ±0.8
≥ 61
≥ 6

-0.034
63.6
6.3

T0609
T0604
T0605
Table 2. Physical properties of SBSB.
Test Standard value Measured value Standard test
Penetration (25°C, 5s, 100g) (0.1mm) 30 ~ 60 52.0 T0604
PI ≥ 0 0.15 T0604
Softening point (°C) ≥ 76 83.2 T0606
Viscosity (135°C) (Pa*s) ≤ 3 2.45 T0625
Ductility (5°C) ≥ 25 35 T0605
Flash point (°C) ≥ 230 310 T0611
Solubility (%) ≥99.0 99.78 T0607
After the RTFO:
Mass change
Residual penetration ratio (%)
Residual ductility (10°C) (cm)

≤ ±1.0
≥ 65
≥ 20

-0.04
78
22

T0610
T0604
T0605
Table 3. Physical properties of STP.
Parameters STP Values
Tensile strength (MPa) 13.5±2.2
Elongation [dried state] (%) 1460±87
Density (g/cm3) 1.07
Melting point (°C) 120 a
a = obtained from temperature sweeping of rheological test.
Table 4. Physical properties of IPA1w.
Parameters STP Values
Tensile strength (MPa) 1.61±0.15
Elongation [dried state] (%) 1700
Young’s modulus (MPa) 0.59±0.02
Toughness (MJ m-3) 17.89±0.18
Table 5. Fatigue test matrix to validate the failure definition.
Set Material name (MN) PG Aging condition (AC) CSR (%/cycle) T (°C) Note
1a NA, STPB1.5, IPAB1.0 64-16 U, R, RP 0.010 25 VFD
STPB0.5, STPB1.0, IPAB0.5 64-22 U, R, RP 0.010 25 VFD
IPAB1.5 64-10 U, R, RP 0.010 25 VFD
SBSB 76-22 U, R, RP 0.010 25 VFD
1b NA, STPB1.5, IPAB1.0 64-16 U, R, RP 0.010 28 VFD
STPB0.5, STPB1.0, IPAB0.5 64-22 U, R, RP 0.010 28 VFD
IPAB1.5 64-10 U, R, RP 0.010 28 VFD
SBSB 76-22 U, R, RP 0.010 28 VFD
1c NA, STPB1.5, IPAB1.0 64-16 U, R, RP 0.010 31 VFD
STPB0.5, STPB1.0, IPAB0.5 64-22 U, R, RP 0.010 31 VFD
IPAB1.5 64-10 U, R, RP 0.010 31 VFD
SBSB 76-22 U, R, RP 0.010 31 VFD
Table 6. Fatigue test matrix to validate the fatigue criterion.
Set MN PG AC CSR (%/cycle) T (°C) Note
2a NA 64-16 R 0.0101, 0.0302, 0.0153, 0.0064 281, 322, 263, 304 VFC
2b NA 64-16 RP 0.0101, 0.00852, 0.00753, 0.0204, 0.0125 281, 2, 3, 244, 315 VFC
3a STPB0.5 64-22 R 0.0101, 0.0302, 0.00853, 0.0154 251, 262, 243, 274 VFC
3b STPB0.5 64-22 RP 0.0101, 0.0302, 0.00753, 0.0154, 0.00855 251, 222, 3, 274, 285 VFC
4a STPB1.0 64-22 R 0.0101, 0.0152, 0.0063, 0.0304 251, 272, 293, 244 VFC
4b STPB1.0 64-22 RP 0.0101, 0.00852, 0.00753, 0.00664, 0.0125 251, 2, 273, 4, 235 VFC
5a STPB1.5 64-16 R 0.0101, 0.0202, 0.0123, 0.00854 281, 2, 263, 314 VFC
5b STPB1.5 64-16 RP 0.0101, 0.00662, 0.00853, 0.0304, 0.0155 281, 252, 3, 284, 305 VFC
6a IPAB0.5 64-22 R 0.0101, 0.0202, 0.00663, 0.0304 251, 2, 233, 274 VFC
6b IPAB0.5 64-22 RP 0.0101, 0.0202, 0.00853, 0.0124, 0.0065 251, 2, 273, 284, 235 VFC
7a IPAB1.0 64-16 R 0.0101, 0.0122, 0.00663, 0.0154 281, 3, 302, 264 VFC
7b IPAB1.0 64-16 RP 0.0101, 0.0122, 0.00853, 0.0304, 0.00665 281, 302, 313, 264, 255 VFC
8a IPAB1.5 64-10 R 0.0101, 0.0302, 0.0203, 0.00854 311, 3, 292, 344 VFC
8b IPAB1.5 64-10 RP 0.0101, 0.0302, 0.0123, 0.00854, 0.00755 311, 332, 293, 284, 345 VFC
9a SBSB 76-22 R 0.0101, 0.0122, 0.00663, 0.0304 311, 302, 283, 334 VFC
9b SBSB 76-22 RP 0.0101, 0.00662, 0.00853, 0.0154, 0.0205 311, 342, 293, 324, 275 VFC
Note: CSR and T values with the same superscript are included in the same test conditions inside the corresponding set. Note: T values with two or more superscripts mean that T will be the same for the corresponding CSR with the same superscript.
Table 7. Sum of rankings of the PAV-aged bitumens (STPB0.5, STPB1.0, IPAB0.5).
Bitumen Ranking of CWDCC and CWSPC Ranking   of   C R Sum of Rankings
T (25 °C) T (28 °C) T (31 °C)
PAV-STPB1.0 1 3 1 3 8
PAV-STPB0.5 3 1 2 1 7
PAV-IPAB0.5 2 2 3 2 9
Disclaimer/Publisher’s Note: The statements, opinions and data contained in all publications are solely those of the individual author(s) and contributor(s) and not of MDPI and/or the editor(s). MDPI and/or the editor(s) disclaim responsibility for any injury to people or property resulting from any ideas, methods, instructions or products referred to in the content.
Copyright: This open access article is published under a Creative Commons CC BY 4.0 license, which permit the free download, distribution, and reuse, provided that the author and preprint are cited in any reuse.
Prerpints.org logo

Preprints.org is a free preprint server supported by MDPI in Basel, Switzerland.

Subscribe

© 2024 MDPI (Basel, Switzerland) unless otherwise stated